


Abstract
Construction and demolition waste management increasingly requires decision-support approaches that can connect circular economy objectives with practical operator-allocation decisions. This study develops EcoRanker, a web-based decision-support model for circular construction waste allocation. The model integrates stakeholder-derived requirements, fuzzy analytic hierarchy process weighting, GIS-supported spatial logistics indicators, and TOPSIS-based operator ranking to support transparent and reviewable allocation decisions. Rather than treating transport emissions as a complete carbon footprint assessment, the proposed framework uses road-network distance to derive bounded transport and fuel-use indicators alongside economic, recovery-quality, and governance-related decision inputs within a triple-bottom-line perspective. The model was demonstrated through 10 researcher-defined operator scenarios for 100 t of concrete-dominant waste in Central Thailand; the scenarios are not measured company profiles. In these synthetic scenarios, the ranking reflects the assigned service charges and recovery categories as well as the modelled transport indicators and expert weights. EcoRanker contributes a practical decision architecture for circular construction management by linking waste generators, recovery operators, spatial logistics, and intended circular outcomes in a single DSS workflow. The framework can make allocation assumptions and trade-offs reviewable; whether it improves resource efficiency or circular outcomes requires field and life-cycle validation.
1. Introduction
The construction sector is one of the world’s largest consumers of raw materials and a major generator of solid waste [1]. Construction and demolition activities generate substantial quantities of concrete, masonry, metals, timber, and other materials, many of which retain potential for reuse, recycling, and value recovery. Nevertheless, considerable quantities of construction and demolition waste (CDW) continue to be landfilled or processed into low-value applications rather than reintegrated into higher-value material loops [2]. This persistent loss of recoverable resources reflects interacting economic, logistical, regulatory, technical, and market barriers, including processing and transportation costs, inconsistent regulatory support, and limited demand for secondary construction materials [3]. CDW management is therefore a systems problem linking waste generation, separation, collection, transport, treatment, output quality, and secondary-material demand; improving only one isolated process may shift burdens elsewhere in the system.
This challenge is particularly relevant in rapidly urbanizing developing countries. In Thailand, construction-waste statistics remain fragmented and are not continuously updated. Earlier studies using data from the early-to-mid 2000s estimated approximately 1.1 million tonnes per year and reported construction waste as about 7.7% of waste disposed in landfills and open dumpsites; these values are historical estimates rather than a current national inventory [4]. Comparable data and implementation constraints across Southeast Asia are reviewed by Hoang et al. [5]. Recycling and reuse remain limited, while landfilling and inappropriate disposal continue to occur. These conditions reflect a predominantly linear pattern in which materials are extracted, used, discarded, and replaced by virgin resources rather than retained within productive circulation.
The circular economy (CE) offers an alternative to the linear “take–make–dispose” model by preventing waste generation, extending product and material utility, and recirculating recovered resources while reducing reliance on virgin inputs [2]. In construction, these principles can be applied across the building lifecycle through design for disassembly, component reuse, life extension and retrofitting, selective demolition, material recovery, and the production of recycled aggregates and other secondary construction materials [6,7,8,9]. Consistent with the waste hierarchy, prevention and direct reuse should be prioritized where feasible, followed by recycling and other recovery processes, while disposal should remain the least preferred option [3]. CDW should therefore be viewed not merely as an end-of-pipe burden, but as a stock of secondary resources whose utility and value should be retained within productive material loops [10]. Dynamic stock-flow analysis can quantify building materials as urban resource stocks and future flows [11]. Its circular value, however, depends on allocation to recovery pathways that preserve technical utility, retain material value, and enable recovered materials to re-enter productive use [12].
The quality of recovered output is central to this transition. Experimental evidence on recycled concrete aggregates shows that verified physical and mechanical properties determine their suitability for construction applications [13]. Material-recovery outcomes also depend on identifying uses that preserve utility, as illustrated by repurposing and refurbishing demolition-derived aluminum composite panels [14]. Selecting a suitable waste-management operator therefore affects not only treatment efficiency but also the quality, usability, marketability, and circular value of recovered outputs.
Circular recovery is not automatically sustainable under all project conditions. A facility with advanced recovery capability may be farther from the waste-generation site, while the lowest-cost or nearest option may produce lower-value outputs. The allocation problem therefore concerns the combined environmental, economic, social, and circular consequences of a destination rather than transport emissions alone. Transport remains relevant because construction waste is bulky and heavy, but it is treated here as one bounded decision component within a wider circular-management model [15,16,17].
EcoRanker structures this problem through the triple bottom line. The economic dimension concerns operational cost and capacity-related feasibility; the environmental dimension captures project logistics through transport-related indicators; and the social dimension represents employment and social acceptance and assurance. Recovery-quality potential and technical feasibility act as circular-enabling conditions because a low-cost, nearby, or socially accepted destination cannot create circular value if it cannot produce a usable secondary output. This decision boundary is narrower than life-cycle assessment: processing, avoided disposal, virgin-material substitution, use, and end-of-life effects remain outside the model [18,19,20,21].
Construction-waste allocation also involves multiple stakeholders whose priorities may differ. Stakeholder-associated factors span regulatory oversight, market conditions, technology, knowledge, behavior, and project-specific constraints [22]. Construction waste also creates economic, environmental, public-health, and safety consequences that extend beyond the immediate generator–operator relationship [23]. Operator selection is therefore a multi-stakeholder waste-to-operator allocation decision rather than a simple choice based on treatment cost or geographic proximity.
Multi-criteria decision analysis (MCDA) has consequently been applied to construction-waste management to structure competing considerations and make trade-offs explicit. Previous studies have applied FAHP, ELECTRE, AHP, TOPSIS, weighted-sum, and weighted-product methods to compare treatment alternatives, waste-management strategies, and facility options [24,25,26]. These studies demonstrate the value of structured evaluation, but they also show that decision quality depends on how criteria are selected, whose preferences determine their relative importance, and whether the input data represent actual spatial and environmental conditions.
Despite advances in circular construction and multi-criteria waste assessment, four limitations remain. First, the criteria used in many decision models are derived primarily from the literature or researcher judgment, with limited traceability from stakeholder needs to system requirements. Moreover, the relationship between those requirements and separately structured decision criteria is not always made explicit.
Second, spatial assessment is frequently disconnected from economic, environmental, and circular-value evaluation. Distance may be treated as an independent ranking criterion, while fuel use, emissions, time, and logistics cost are derived from the same route. A coherent decision architecture should instead treat road distance as an intermediate input and disclose how route conditions influence distinct management outcomes without unexamined double counting.
Third, existing studies often terminate at a conceptual model, spreadsheet calculation, or location-specific comparison. Although web-based and model-based systems demonstrate the value of digital support, relatively few operationalize the full sequence from stakeholder requirements and triple-bottom-line criteria to spatial analysis, operator ranking, explanation, and a reviewable decision record [27,28,29].
Fourth, the literature remains fragmented across circular strategy, stakeholder participation, economic feasibility, social legitimacy, spatial logistics, environmental indicators, operator ranking, and digital implementation. Reviews of information and communication technologies for circular construction identify a need for integrated functions that connect information, analysis, and decisions [30,31]. This gap limits transparency, reproducibility, and managerial accountability because requirements, evidence, costs, assumptions, weights, and recommendations are not consistently linked within one workflow.
To address these limitations, this study develops EcoRanker as an operational digital model for allocating already-generated, recoverable construction waste to eligible operators. QFD links stakeholder needs to system design; FAHP derives context-specific priorities; GIS supplies project-specific road-network information; and TOPSIS compares alternatives across economic, environmental, social, circular, and technical evidence. Transport emissions remain visible to prevent logistics burden shifting, but the central contribution is the integrated circular construction-management workflow rather than the carbon calculation itself.
Rather than identifying a universally best operator, the framework identifies the alternative that provides the most defensible project-specific compromise. It connects the waste generator, transport activity, treatment capability, recovered-output quality, service cost, regulators, communities, and prospective secondary-material users. Where technically and economically feasible, this allocation can support landfill avoidance, reduced virgin-material demand, local employment, and recirculation of recovered material [32]; these outcomes remain conditional on actual processing, quality assurance, market acceptance, contracting, and subsequent use.
The objective is to develop and evaluate an integrated digital decision-support model for circular construction-waste allocation using a triple-bottom-line lens and explicit circular-value and technical conditions. Four questions guide the study: which stakeholder requirements and performance criteria matter (RQ1); how can these requirements be translated into a transparent digital workflow (RQ2); how does the model balance economic, environmental, social, recovery-quality, and technical performance when ranking eligible operators (RQ3); and is the implemented workflow computationally reliable, robust, and usable (RQ4)?
The contribution is fourfold. First, the study provides a requirements-to-software design trace through QFD and a separate expert-weighted hierarchy for operator selection, integrated in one reviewable workflow. Second, it operationalizes QFD-FAHP-GIS-TOPSIS as one web-based decision process rather than a set of disconnected calculations. Third, it supports procurement and management by exposing service cost, active weights, route assumptions, operator evidence, and ranking consequences in a reviewable record. Fourth, it prevents circularity from being judged independently of logistics impacts while avoiding claims of full carbon-footprint or life-cycle performance. The novelty lies in functional integration and decision governance, not in a new MCDA algorithm. Figure 1 summarizes the allocation logic and intended secondary-resource-use endpoint; verified loop closure remains conditional on quality, markets, substitution, and downstream use.
Figure 1.
Conceptual framework of EcoRanker linking circular construction-waste allocation, triple-bottom-line trade-offs, and transport-related low-carbon decision support.
2. Literature Review
This literature review positions construction-waste operator selection within circular-economy, stakeholder, spatial, multi-criteria, digital, and governance perspectives. The review is organized as a structured comparative synthesis rather than a systematic review.
2.1. Circular Value, Triple-Bottom-Line Performance, and Secondary-Resource Use
The circular economy has emerged as an alternative to the conventional linear model of resource extraction, production, consumption, and disposal. Rather than treating materials as having a predetermined end of life, circular-economy approaches seek to preserve utility and economic value through prevention, extended use, reuse, repair, refurbishment, remanufacturing, recycling, and recovery. This transition is particularly important in the construction sector because buildings and infrastructure contain large quantities of mineral, metallic, timber, glass, gypsum, and composite materials that may retain technical value after construction, renovation, or demolition. Construction and demolition waste should therefore be regarded not only as a residual stream requiring treatment, but also as a potential stock of secondary resources that can be returned to productive use [1,2,3].
Circular construction-waste management encompasses interventions across the building life cycle. At the design stage, waste can be prevented through accurate material planning, modular construction, design for adaptability, and design for disassembly. During construction and renovation, source separation, controlled storage, and material-efficient practices can preserve the recoverability of waste streams. At the end-of-use stage, selective demolition and deconstruction facilitate component reuse and the separation of materials for higher-quality recycling. Circularity therefore extends beyond end-of-pipe treatment and requires coordination among designers, project owners, contractors, transport providers, recovery operators, secondary-material producers, regulators, and users of recovered products [3,12].
The circular economy should not be equated with recycling alone. Recovery pathways differ in their capacity to retain the functional and economic value embedded in products and materials. Direct reuse generally preserves more value than crushing a component into aggregate, while high-quality closed-loop recycling may retain more value than low-grade applications such as filling or backfilling. Consequently, a high diversion or recovery rate does not necessarily indicate strong circular performance when recovered materials are consistently directed towards lower-value uses. Circular assessment should distinguish quantitative diversion from landfill from qualitative value retention and substitution of virgin resources [33,34]. Quality-classification procedures for recycled aggregates illustrate how construction and demolition waste evaluation can link recovered-material quality to higher-value construction applications and secondary-material markets [35].
The quality of recovered output is a central condition for closing construction-material loops. Construction waste is heterogeneous and may contain concrete, bricks, ceramics, metals, timber, plastics, gypsum, glass, soil, coatings, and hazardous or contaminating substances. Mixing, poor source separation, physical degradation, and uncertain material composition can reduce processing efficiency and restrict the applications of recycled outputs. Conversely, selective collection, appropriate processing technologies, quality control, and reliable material information can increase the likelihood that recovered products satisfy technical specifications and market requirements. Research on concrete recycling shows that material-footprint performance depends on the energy and material inputs of recycling and on the extent to which recycled aggregate displaces virgin material [36].
These considerations place waste-management operators in a decisive position within circular construction systems. Operator selection influences acceptance conditions, treatment reliability, output quality, capacity, price, and access to secondary-material markets. Evidence from recycling-center upgrading shows that contaminant removal, recovery efficiency, and marketable products can generate both circular and economic benefits [37]. Directing waste to an unsuitable facility can produce contamination, low-value recovery, storage, or disposal costs, whereas a suitable operator can create a secondary output with a plausible market use. Operator selection is therefore a circular-resource and value-allocation decision, not merely procurement of a disposal service.
Circular construction management requires an economic case as well as environmental intent. Relevant project-level considerations include gate or service fees, transport and handling costs, capacity availability, schedule risk, quality-assurance costs, and the potential value of recovered outputs. At a wider system level, avoided disposal expenditure, reduced virgin-material purchases, stable demand for secondary products, and investment in regional recovery capacity can affect feasibility [20,33,37,38]. The present model directly represents operational service cost and capacity-related eligibility; it does not claim to quantify all life-cycle costs, revenues, or market externalities.
Social performance also affects implementation. Construction-waste decisions can influence employment, traffic and nuisance exposure, community confidence, grievance handling, occupational and public safety, and trust in recycled products [23]. Municipal authorities, contractors, project owners, operators, consultants, workers, buyers, and communities may consequently assign different priorities to affordability, environmental protection, local value creation, technical feasibility, compliance, and accountability.
Overall, circular performance is relational and triple-bottom-line dependent. It depends on where waste is generated, the cost and environmental burden of moving it, the operator’s technical and social license to process it, the quality and marketability of the output, and whether a buyer ultimately uses that output. A decision-support model should therefore preserve distinct evidence for economic viability, environmental logistics, social legitimacy, and circular-value retention rather than reduce sustainable construction management to a single recycling or carbon indicator.
2.2. Circular Construction Management and Low-Carbon Transformation
Circular economy and low-carbon transformation are mutually reinforcing only when material recirculation preserves value without shifting disproportionate burdens to logistics, communities, or project economics. Construction-site methodologies can embed circular action across planning, procurement, sorting, recovery, and documentation [39], while alternative end-of-life strategies can produce different carbon and economic outcomes [18,20]. Mass diverted from landfill is therefore incomplete without evidence on recovered-output quality, feasible market use, cost, social acceptance, and the resources required to deliver it.
Transport is one environmental component of this wider management problem. Empirical studies quantify emissions from waste transport and construction activity [16,17], while life-cycle studies show that results depend on local treatment, energy, markets, and substitution [20,21]. EcoRanker consequently uses route-based indicators as screening and comparison inputs, not as a stand-alone carbon-footprint claim or the sole basis for operator selection.
Digital coordination can connect otherwise fragmented project, operator, spatial, cost, environmental, social, and recovery-quality information. Huang et al. [40] developed a BIM–WMS–API waste recycling facility selection system integrating waste supply and demand, transport costs, recovery prices, and route information, with transport-carbon comparison. Blockchain–MCDA frameworks have also supported the ranking and selection of used materials and products [41]. EcoRanker extends this decision-support stream by linking QFD-based requirements, FAHP-derived preferences, and TOPSIS comparison of eligible operators within a bounded project-allocation workflow.
Within this boundary, low-carbon transition means making logistics consequences visible within a circular decision; it does not mean that EcoRanker measures net economy-wide decarbonization. Likewise, the economic criterion reflects project service cost rather than a full cost-benefit or life-cycle-cost assessment. Verified substitution, avoided emissions, recovered-material revenue, disposal savings, and broader social value require additional transaction, market, quality, and life-cycle data.
2.3. Decision Support and Stakeholder-Based Recycling Allocation
Banias et al. [27] developed a web-based DSS that estimated 21 construction and demolition waste streams and used mathematical programming to identify end-of-life management alternatives according to economic and environmental considerations. The study demonstrated the operationalization of waste estimation and optimization through a web environment. Its focus, however, was treatment-option selection rather than stakeholder-driven ranking of competing operators under project-specific spatial conditions.
Building Information Modelling has extended decision support toward data-rich and visual environments. Han et al. [29] developed a BIM-based demolition-waste management planning system that linked building information, material quantities, recycling value, carbon assessment, and visualization. Such systems improve the accessibility of complex project data, but many remain focused on estimation, design-stage prevention, demolition planning, or scenario selection rather than allocation among external operators.
Web-based DSSs can reduce fragmentation by providing a common environment for data entry, model execution, storage, alternative comparison, and communication. Nevertheless, web access alone does not guarantee decision quality. A web system must still contain valid data, correctly implemented models, understandable criteria, suitable user controls, transparent assumptions, and clear reporting. Otherwise, digitization merely transfers an opaque calculation into an online interface.
For circular construction management, an effective DSS should integrate stakeholder priorities, project conditions, operator evidence, and economic, environmental, and social performance in one reviewable process. It should also distinguish mandatory eligibility from compensatory ranking and make the assumptions behind a recommendation understandable to procurement teams, regulators, operators, and affected communities.
Circular construction-waste management is a multi-actor problem because generation, separation, transport, processing, recovery, and secondary-material use involve organizations and individuals with different responsibilities, information, interests, and influence. Decisions cannot therefore be treated solely as technical optimization. Even when environmental performance is measurable, implementation depends on whether relevant actors consider a pathway technically feasible, economically acceptable, institutionally compliant, and socially legitimate.
The differing priorities of these groups create trade-offs that cannot be resolved through a single indicator. Stakeholder-related factors include regulatory, market, technological, behavioral, knowledge, and project-specific considerations [22]. Construction-waste management also creates economic, environmental, health, and safety consequences beyond the immediate contractual relationship between a waste generator and an operator [23].
Evidence from environmental governance indicates that participation can improve outcomes, although effects depend on process design, context, communication, and the degree of meaningful influence given to participants [42]. Participation should therefore have a defined analytical purpose rather than being included as a procedural formality.
Stakeholder involvement in criterion selection and stakeholder involvement in criterion weighting perform different functions. Criterion selection determines what the model considers relevant. Weighting determines the relative importance of criteria that have already been included. A model may therefore use stakeholder-derived weights while remaining weakly stakeholder-driven if the criteria and system functions were defined exclusively by researchers. Conversely, stakeholder requirements do not become operational unless they are translated into measurable characteristics and evaluation components.
A robust process should connect stakeholder concerns to system requirements, technical characteristics, measurable indicators, and preference weights. This connection is particularly important in DSS development, because users may describe needs in non-technical terms such as transparency, reliability, accessibility, environmental responsibility, or the ability to compare operators. These statements cannot be inserted directly into a ranking algorithm and must be translated into data requirements, interface functions, calculation models, and reporting mechanisms.
In the present framework, QFD translates stakeholder requirements into technical system characteristics, while the separate FAHP hierarchy records expert priorities for operator selection. These are two distinct evidence paths. The study does not document a CR–TC–criterion derivation for each C1–C7 indicator, and HoQ technical-importance values are not transferred into FAHP or TOPSIS weights. Their integration supports review of both software design and ranking assumptions without treating them as a continuous weighting pipeline.
2.4. Multi-Criteria and Spatial Assessment
Multi-Criteria Decision Analysis (MCDA) supports decisions involving multiple and potentially conflicting criteria. Unlike single-objective optimization, it does not assume that the preferred operator is defined solely by minimum cost, shortest distance, lowest emissions, maximum employment, or highest recovery quality. Its relevance to circular construction lies in making the triple-bottom-line and circular-enabling structure explicit: criteria, measurement, preference direction, weights, evidence, and aggregation can all be reviewed.
MCDA does not produce an objectively correct decision independently of assumptions. Results are conditional on criteria, measurement scales, weights, data quality, aggregation procedure, and the alternatives included. Its value lies in organizing and documenting judgment so that assumptions and trade-offs can be reviewed and tested. MCDA method selection should reflect the problem structure, uncertainty, number of alternatives, compensation among criteria, and required interpretability [43]. Comparative applications further show that different methods can produce different decision behavior under the same case assumptions [44].
Fuzzy AHP extends AHP by representing pairwise comparisons with fuzzy numbers. Triangular fuzzy numbers are commonly used because they express a lower value, a most plausible value, and an upper value. This allows part of the ambiguity in linguistic assessments to be retained while producing normalized weights for later analysis [45]. FAHP is especially relevant when preferences are obtained from heterogeneous stakeholder groups.
Fuzzy numbers do not automatically remove inconsistency or subjectivity. Weights can be influenced by the fuzzy scale, aggregation method, defuzzification, and treatment of inconsistent responses. Studies comparing AHP and FAHP demonstrate that stability may vary across computational procedures [46]. An FAHP study should therefore report the scale, aggregation method, weight derivation, normalization, and response screening used.
TOPSIS ranks alternatives according to their relative proximity to a positive ideal solution and distance from a negative ideal solution [47]. This logic suits operator selection because no operator is likely to dominate every criterion. One operator may provide high recovery quality but higher transport emissions, while another may have low cost but limited technical capacity. TOPSIS identifies the alternative providing the closest overall compromise after criterion weights are applied.
TOPSIS is compensatory: strong performance in one criterion can partially offset weak performance in another. This is useful when identifying a balanced compromise, but it is inappropriate for non-negotiable conditions such as permits, hazardous-waste restrictions, or minimum technical capacity. Such conditions should be applied as eligibility screening before ranking. TOPSIS can also be affected by normalization, weights, correlated criteria, and changes in the alternative set. A rank should therefore be interpreted as relative suitability under a defined project and scenario.
Criteria design is critical because several indicators can share the same underlying variable. Distance influences fuel use, emissions, time, and cost; weighting correlated derivatives can give logistics disproportionate influence. EcoRanker therefore treats road distance as an intermediate input, retains two related environmental outputs because they have different management meanings, and reports targeted diagnostics. C1 remains a separate economic input, with assigned service charges including haulage in the demonstration, so a lower transport burden is not automatically treated as a lower total economic burden.
Criteria that do not vary among alternatives also have no discriminatory power. Such values may be displayed for information but should be excluded from ranking when they are constant. Qualitative criteria should have operational definitions so that users apply scores consistently. Targeted diagnostics and criterion-exclusion tests should then be used when indicators share an underlying activity variable or may represent overlapping decision information.
Geographic Information Systems (GIS) provide a structured environment for capturing, managing, analyzing, and visualizing data associated with location. Dynamic stock-flow analysis can quantify urban building stocks and future resource flows [11]. GIS combined with open geospatial data can identify material hotspots for resource and waste-management planning [48]. These approaches map material stocks and potential flows, whereas EcoRanker applies project-specific road-network data to compare existing operators through transport impacts, recovery-quality evidence, and stakeholder-derived weights. GIS also provides a general framework for integrating spatial data and supporting environmental modelling [49]. Construction-waste collection and transport optimization is one established application [50,51], while GIS-MCDA has been used for facility-siting assessment [52].
Construction-waste management is inherently spatial because projects, storage areas, transfer stations, recovery plants, secondary-material markets, and disposal facilities occupy different locations within a transport network. Operator suitability depends partly on this spatial relationship. A facility may have advanced processing capability but impose substantial transport burdens, while a closer operator may provide limited recovery quality.
GIS is frequently combined with MCDA because suitability cannot be determined by proximity alone. Soto-Paz et al. [52], for example, integrated GIS, FAHP, TOPSIS, economic analysis, and Monte Carlo simulation to rank potential construction and demolition waste facility locations. This demonstrates the strength of GIS-MCDA integration, although facility siting differs from project-level comparison of existing operators.
Construction-waste transport also differs from routine municipal collection. Loaded vehicles often travel directly from a project to a facility able to accept the relevant waste type, and destinations may change by waste stream and project stage. Studies have examined construction-waste collection and transport optimization [50] and mathematical routing with facility assignment, vehicle scheduling, working-time constraints, and route sequencing [51].
A critical issue is how distance is represented. Euclidean distance is simple but does not account for roads, bridges, one-way links, access restrictions, or indirect connections. Road-network distance provides a more realistic basis for vehicle movement. Digital routing services can provide estimated route distance and duration and can be integrated directly within a web-based workflow.
Distance itself is not an environmental impact. Fuel use and emissions also depend on waste quantity, truck capacity, number of trips, loading ratio, vehicle type, fuel efficiency, return movement, road conditions, and emission factors. A longer route can have a lower impact when a larger or more efficient vehicle reduces the number of trips, while a short route can produce high emissions when vehicles are underloaded.
A GIS-supported DSS should follow a transparent chain from project and operator locations to road-network activity and then to the bounded logistics indicators used in decision-making. EcoRanker retains a full-load trip-based transport indicator (C2) and modelled fuel-use intensity (C3) as related but non-identical environmental indicators, while their association and ranking influence are disclosed. Detailed indicator equations are placed in Supplementary Section S3 so that the main manuscript can focus on the decision architecture and interpretation.
Spatial-data quality remains a limitation. Errors in addresses, coordinates, geocoding, route configuration, vehicle mode, or units can propagate into fuel and emission estimates and affect rankings. Routing networks and services can change over time. Reproducibility therefore requires retention of origin and destination coordinates, calculation date, routing mode, returned distance, units, vehicle assumptions, number of trips, fuel efficiency, and emission factors.
2.5. Digital Decision Support for Triple-Bottom-Line Circular Construction
Digital technologies, including BIM, GIS, digital twins, material passports, sensors, blockchain, marketplaces, and DSSs, can connect material, cost, transport, processing, quality, and market information [30,31,53]. Their value is managerial as well as technical: integrated data can support procurement comparison, evidence verification, coordination, contract monitoring, and market development for secondary materials. Technology supports circularity only when data, analytical rules, access, and decision responsibility are governed.
In this study, digital governance denotes five reviewable properties of an operator-allocation workflow. Transparency makes alternatives, criteria, directions, weights, assumptions, boundaries, and results intelligible. Decision traceability preserves the QFD requirements-to-software design record and, separately, the criterion, data, weight, calculation and ranking record; it is distinct from physical material chain-of-custody. Reproducibility enables recreation from documented inputs, parameters, algorithms, and software conditions. Auditability enables authorized review of that record, while stakeholder accountability assigns responsibility for data quality, model maintenance, interpretation, approval, and override.
Data governance underpins these properties through accuracy, completeness, timeliness, provenance, security, access control, and versioning. Consistent with FAIR-oriented data and software practices [54,55], EcoRanker retains project and operator data, criterion definitions, weight sets, rating anchors, route coordinates and dates, vehicle assumptions, emission factors, and algorithm versions. Controlled access may still be required for confidential data.
Accordingly, EcoRanker is described as governance-enabling rather than governance-guaranteeing: it improves the information and analytical record used for allocation but does not independently verify every operator claim, enforce regulation, or track recovered material through its subsequent life cycle.
A structured comparative review then examined four relevant streams: MCDA for treatment-strategy selection; spatial and logistics optimization; web-, BIM-, and digital-twin implementation; and circular-economy assessment. These streams provide strong individual methods but generally address strategy choice, facility siting, estimation, visualization, or marketplace coordination rather than end-to-end ranking of existing operators for a project-specific waste stream.
Stakeholder participation is analytically important because criterion selection and criterion weighting perform different functions. Selection determines which environmental, economic, social, technical, and recovery concerns enter the model; weighting determines their relative influence after inclusion. A framework can therefore use stakeholder-derived weights yet remain weakly traceable if the criteria and system functions were fixed without a documented translation from stakeholder needs.
Spatial integration also requires care. Road distance is operationally useful, but weighting it alongside fuel use, emissions, time, and cost derived from the same route can duplicate information. EcoRanker treats road-network distance as an intermediate activity input, keeps operational service cost separate, and tests the influence of the two related environmental logistics indicators rather than assuming independence.
Operational implementation is a further gap. A circular-management workflow must retain project data, operator evidence, service cost, route metadata, vehicle assumptions, criteria, active weights, calculations, and outputs in a form users can inspect. Evaluation must therefore address computational consistency, usability, and decision accountability as well as the analytical model.
Within the reviewed studies, no approach was identified that combined QFD-based requirement translation, expert-derived FAHP weights, GIS-supported logistics indicators, triple-bottom-line and circular-value criteria, TOPSIS ranking of existing operators, and web implementation within one traceable workflow. This bounded claim concerns the structured review rather than global priority. Table 1 positions EcoRanker against the principal decision-support streams.
Table 1.
Comparative positioning of construction-waste decision-support approaches.
The earlier study by Boonkanit and Suthiluck [57] addressed concrete-waste management-method selection through Delphi and FAHP implemented in Excel. The present study addresses a different decision unit: project-specific allocation among eligible operators, with QFD-based system requirements, API-derived logistics indicators, TOPSIS ranking, and web-system evaluation. The contribution is the integrated allocation workflow and its evaluation, rather than the introduction of Delphi or FAHP.
The review therefore identifies an integration gap rather than a missing individual algorithm. EcoRanker combines a QFD requirements-to-software design trace with separately derived FAHP priorities, project-specific prices, spatial inputs, logistics indicators, assigned social and output-quality categories, and a reviewable ranking record. The output is a conditional project-level compromise, not a universally superior operator.
This positioning defines novelty as functional integration and operationalization. QFD establishes a requirements-to-design trace, FAHP records preference structure, GIS supplies route activity data, bounded environmental indicators characterize logistics, TOPSIS compares eligible operators, and the web program preserves evidence and explanations for review. The program is the implementation of the decision model, not a claim that any constituent algorithm is new.
The resulting decision unit is relational rather than operator-intrinsic. A facility that is appropriate for one project may be less suitable for another because route, quantity, vehicle configuration, active competitors, evidence quality, and stakeholder priorities change. This project-level framing separates EcoRanker from facility-siting models and avoids presenting the output as a permanent certification or universal performance league table.
3. Materials and Methods
3.1. Research Design and Recycling-Allocation Boundary
This study adopted a design-science-oriented, sequential multi-phase design to develop and evaluate an operational digital decision-support artefact for circular construction management. Design science is appropriate when a study creates and evaluates an artefact for a relevant practical problem while preserving links among problem identification, requirements, development, demonstration, and evaluation [59,60]. The artefact comprised the integrated decision model and its implementation as the EcoRanker web-based program.
The decision unit was project-specific allocation of an already-generated, recoverable concrete-dominant waste stream to an eligible operator. The decision question was: which operator provides the most defensible compromise among economic viability, environmental logistics, social value and assurance, recovery-quality potential, and technical feasibility? EcoRanker was not designed to optimize building design, predict waste generation, select every end-of-life strategy, or perform complete carbon-footprint, cost-benefit, or life-cycle assessment.
The boundary follows the waste hierarchy and places EcoRanker within the recycling and industrial-synergy domains of circular economy. Prevention, design for disassembly, and direct reuse should be assessed before off-site recycling whenever technically feasible. EcoRanker begins only after waste generation, source characterization, eligibility screening, and an initial determination that the material is suitable for off-site recovery. Within this boundary, operator selection is a systems decision because the chosen destination couples collection and transport burdens with treatment capability and the likelihood that recovered output will return to productive use rather than move to low-value recovery or disposal.
C6 is an assigned output-quality category in this synthetic demonstration. Operational claims about material substitution or environmental benefit would require output specifications, testing, market acceptance and evidence of subsequent use.
3.2. Integrated Methodological Sequence
The study followed six phases: QFD-based requirements and system design; decision-criteria structuring and FAHP weighting; spatial logistics assessment; TOPSIS ranking; web implementation; and verification, sensitivity analysis and user evaluation (Figure 2). QFD informed software design, while separately derived FAHP weights and operator inputs informed ranking. The study did not derive C1–C7 weights from the HoQ technical-importance values.
Figure 2.
Six-phase EcoRanker methodology linking circular-allocation logic, stakeholder requirements, criterion weighting, spatial logistics, eligible-operator ranking, web-based decision outputs, and verification. The numbered arrows indicate methodological progression; weights and indicator data feed TOPSIS directly. The diagram retains conceptual criterion labels; the operational criterion definitions specify C2 as a full-load trip indicator, C3 under the common-efficiency assumption and C4–C7 as assigned categories in the synthetic demonstration.
3.3. Participants, Research Instruments, and Ethics
Purposive recruitment matched each research task [61]. Five IOC reviewers assessed content validity; 25 QFD stakeholders rated requirements; seven technical experts developed technical characteristics and HoQ relationships; a separate panel of 25 FAHP experts supplied pairwise judgments; and 12 experts assessed the system. The QFD stakeholders later evaluated the program as prospective users.
The QFD panel comprised five participants from each of five groups: municipal officials, waste-management operators, contractors, project developers or owners, and community representatives. They were recruited for experience relevant to construction-waste decisions and were distinct from the FAHP panel.
The stakeholder questionnaire drew on the literature, consultation and the intended DSS workflow. Five reviewers from waste management, environmental engineering, research methods, IT/DSS and local government assessed item–objective congruence [62]. Items were coded +1, 0 or −1 and retained or revised at IOC ≥ 0.50. Stakeholders rated requirement importance on a five-point scale; the separate FAHP panel completed pairwise comparisons. Definitions and rating anchors accompanied the instruments.
Data collection involving human participants was conducted from 10 January to 30 November 2025. The study was conducted in accordance with the Declaration of Helsinki and was approved by the Human Research Ethics Committee of Rajamangala University of Technology Tawan-ok, Thailand (COA No. 051; RMUTTO REC No. 056/2567; approved on 11 December 2024). Informed consent was obtained from all participants. Participant responses were analyzed in aggregate; the researcher-defined demonstration scenarios did not represent identifiable operators.
3.4. Phase 1: QFD-Based Stakeholder-Requirement Translation
3.4.1. Elicitation and Prioritization of Stakeholder Requirements
Quality Function Deployment (QFD) was used to preserve a visible relationship between stakeholder expectations and the design of the decision-support framework. QFD begins with the voice of the customer or stakeholder and translates qualitative needs into technical characteristics through a structured House of Quality [63,64]. In this study, the term customer requirement was retained in the QFD sense but represented the broader voice of stakeholders involved in circular construction-waste management.
Requirement elicitation integrated three sources: the structured literature review, stakeholder consultation concerning operational and governance needs, and content-validity review. The process produced 15 customer requirements (CRs) covering operational effectiveness, environmental accountability, usability, transparency, security, collaboration, and system governance. The inclusion of sustainability and circular-economy concerns is consistent with QFD applications that extend conventional customer-value analysis toward environmental and circular design requirements [65,66].
Each of the 25 stakeholders rated the 15 requirements using five categories coded from 1 to 5. The geometric mean was used as the study-specific rule for aggregating these positive codes, combining them on their logarithmic coding before normalization. This operational convention does not imply that the ordinal categories form a ratio scale or that geometric aggregation is uniquely required. To examine dependence on the rule, requirement priorities were also calculated using arithmetic means of the same ratings. The final expert-reviewed CR-TC relationship matrix was held fixed when comparing the resulting technical priorities:
where xik is the importance rating assigned to requirement i by stakeholder k, and K is the number of valid stakeholder responses.
The requirement priorities were then normalized so that their sum equaled one:
where pi is the normalized importance of requirement i and M = 15.
3.4.2. Development of Technical Characteristics
The literature, functional analysis of the DSS and the seven-member technical panel were used to translate 15 requirements into 12 system-oriented technical characteristics [67,68].
3.4.3. House of Quality Relationship Analysis
Seven technical experts initially coded each of the 180 CR–TC relationships in the House of Quality on the intended 0, 1, 3 or 9 scale [63,64]. Two initial responses for CR14–TC10 used code 2 outside the intended scale; these entries are retained in the audit. Initial relationships were aggregated by mode, then discussed and refined with the respondents for the final HoQ in Figure 3. Supplementary Section S9 documents the initial ratings audit.
Figure 3.
House of Quality linking 15 stakeholder requirements to 12 technical characteristics.
The unnormalized technical importance of characteristic j was calculated as
Technical priorities were then normalized:
where qj is the normalized priority of technical characteristic j and N = 12. The HoQ roof was reviewed qualitatively for reinforcing and conflicting relationships; the resulting priorities informed system design.
3.5. Phase 2: Decision-Criteria Structuring and FAHP Weighting
3.5.1. Decision Hierarchy, Eligibility, and Measurement
The operator-selection hierarchy contained four parent dimensions, each with two conceptual criteria. Economic performance included the service charge and investment cost; environmental performance included the transport indicator and modelled fuel-use intensity; social performance included job-creation potential and social acceptance and assurance; and the technical parent included assumed output quality and processing capability. The technical parent corresponds to the circular/technical enabling domain used elsewhere in the article. The goal was to rank eligible operators for a defined project, waste quantity, location and alternative set. The separate QFD process informed software requirements rather than deriving these criterion weights.
Before TOPSIS, operators were screened for legal eligibility, waste acceptance, minimum processing capability, capacity and required evidence. Capacity was an eligibility condition. The conceptual investment-cost item (IC), labelled investment/capacity in the original system, was constant across the scenarios and excluded from ranking. The retained global weights were then proportionally renormalized; Section 4.2 and Supplementary Section S1 report the weighting-policy comparison.
C4 is a researcher-assigned ordinal estimate of potential additional employment attributable to accepting and recovering the 100 t of waste in the demonstration project. The implemented codes 1, 3, 5, 7 and 9 represent ranges of assumed additional temporary or permanent positions (Supplementary Table S13). The DSS does not use the operator’s current workforce size or require an exact project headcount or employment duration. Existing employees reassigned without additional hiring are not counted as job creation. These categories describe scenario assumptions rather than observed hiring or realized employment effects; their boundary limitations are disclosed in Section S7.
C5 uses composite software categories combining public-acceptance descriptors and management-standard information. The scenario scores do not constitute independently measured community acceptance or verified certification status. C6 represents assumed final output quality, progressing from low-grade raw material through secondary raw material, standard-grade recycled material and industrial-grade recycled product to high-value or upcycled product. Certification is not a C6 scoring category; the scores do not replace material testing or establish environmental benefits.
C7 represents processing capability within the eligible off-site recovery pathways. The 10 scenarios use only basic stationary processing (code 3) and advanced off-site stationary recycling (code 5). Transfer-only (code 1) is not represented, and the on-site software options (codes 7 and 9) are excluded from the analytical boundary. Higher on-site codes are not interpreted as superior technical feasibility within this off-site comparison. C6 describes assumed output quality, whereas C7 describes the process used. The implemented categories and their case-study scope are documented in Supplementary Section S7.
3.5.2. Expert-Based FAHP Weighting
Default FAHP priorities were adopted from the doctoral thesis [69]. They summarize pairwise judgments from 25 experts representing five professional groups, each with more than 10 years of relevant experience. The purposive panel provided decision-relevant, context-specific preferences rather than population estimates or universal weights. No new weights were elicited for this revision.
Consistency was checked on each expert’s crisp 4 × 4 parent-dimension matrix before group aggregation, using CR < 0.10. Judgments requiring reassessment were returned to the experts after clarification. The four reciprocal 2 × 2 within-dimension matrices per expert are structurally consistent; conventional CR was not interpreted because RI = 0. The calculation procedure is specified in Supplementary Section S1.
Saaty’s 1–9 judgments were mapped to triangular fuzzy numbers. The study used aggregation of individual judgments (AIJ): equal-weight arithmetic means of the lower, modal and upper components preceded fuzzy row geometric-mean weighting, centroid defuzzification and crisp normalization [45]. The extreme-intensity code was bounded at (9, 9, 9); Supplementary Section S1 gives the full procedure.
Parent, local, reported global and active weights are distinguished in the analysis. The seven active weights were obtained by excluding constant IC and proportionally normalizing the thesis-reported four-decimal global weights [69]. The unrounded normalized values were used in TOPSIS.
3.6. Phase 3: Spatial Logistics Indicator Assessment
API-Derived Road-Network Distance as an Intermediate Input
Construction-waste allocation is location dependent because project sites and operator facilities occupy different positions within the transport network. Project and operator coordinates were submitted to a Google Maps Platform Routes API (v2) to obtain road-network route distance and estimated duration. The Routes API calculates distance and duration between specified origins and destinations according to the selected travel mode and request parameters [70]. The returned value is therefore described as API-derived road-network distance rather than actual travelled distance, which would require a recorded vehicle trajectory.
Route records retained coordinates, travel mode, query date, settings and returned distance. Distance was an intermediate input to C2 and C3, not an additional weighted criterion; C1 remained a separate assigned service charge.
EcoRanker uses route distance, project quantity, rated payload, ceiling-rounded trips and fixed factors to calculate the full-load trip-based C2 transport indicator (kgCO2e) and modelled C3 fuel-use intensity (L/t). The retained C2 formula applies rated payload to every outward trip; dispatched capacity may exceed the 100 t project mass when the final trip is partly loaded. A separate diagnostic applies the loaded factor to actual project mass while retaining every empty return (Supplementary Section S3, Equation (S25)). Neither calculation measures actual fleet emissions.
Table 2 summarizes the fixed vehicle inputs used in the demonstration. Rated payload determines ceiling-rounded trip counts. Vehicle-class loaded and empty-return emission factors are used for C2 [71]. C3 applies a common 6.369 km/L diesel pickup-truck reference to all vehicle classes [72]. Under this assumption, C3 is proportional to round-trip vehicle-kilometers per tonne, rather than verified class-specific fuel use. Factor provenance and loading conditions are detailed in Supplementary Section S3.
Table 2.
Vehicle and indicator inputs used to demonstrate the spatial logistics module.
Operational comparisons should document congestion, loading, backhaul, vehicle condition, fuel type and locally valid factors when these affect the indicators.
C2 and C3 retain distinct full-load transport and modelled fuel-use interpretations but share route inputs. Their correlation and ranking influence were therefore tested as described in Section 3.10.3.
3.7. Secondary-Resource Allocation Among Eligible Operators
After eligibility screening, seven active criteria were vector-normalized, weighted, compared with direction-specific positive and negative ideals, and converted to relative TOPSIS closeness [47]. Operators were ranked by closeness for the specified project and alternative set. Supplementary Section S2 gives the equations.
For comparison, two simple rules were applied to the same 10 eligible scenarios: minimum assigned C1 service charge including haulage and minimum one-way road-network distance. The selected alternatives were compared with the TOPSIS result using their original criterion profiles. An alternative was classified as dominating another if it was no worse on every active criterion and better on at least one, following the stated cost and benefit directions. This criterion-wise check was separate from TOPSIS. The comparisons assess behavior in the demonstration rather than predictive superiority across projects.
3.8. Digital Implementation of the Circular Construction Decision Model
EcoRanker implemented the decision model in a web program with data, model, knowledge and interface subsystems [27,28].
The data subsystem stores projects, operators, prices, routes, criteria and weights. The model subsystem calculates logistics indicators and TOPSIS ranks; the knowledge subsystem retains definitions and evidence anchors. The interface supports role-based entry, project mapping, comparison and ranked outputs.
Decision records link criterion definitions, evidence sources, active weights, route and factor metadata, intermediate outputs and ranks. These support reconstruction of a recommendation but do not constitute immutable audit logs or independent verification [54,55].
EcoRanker is a PHP/MySQL web application implemented with support from a contracted developer. It reuses and further develops the research team’s earlier DSS prototype [73]. Project and operator records are entered through web forms and stored in its database. TOPSIS runs in PHP using externally derived FAHP defaults and GIS-supported logistics indicators. The result screen automatically displays the current top three eligible records: new or revised bid records trigger recalculation and an updated shortlist. The present contribution concerns the extension and integration of the prototype for project-specific construction-waste operator allocation.
3.9. Analytical Demonstration of the Integrated Decision Model
The Central Thailand demonstration used 10 entirely researcher-defined operator scenarios (A–J). They vary in assigned price, social and technical categories, route and vehicle configuration; they are not observations of identifiable companies.
The common project concerned 100 t of source-separated, concrete-dominant waste suitable for off-site recovery. Its mass and potential recycled-aggregate applications make both transport and output quality relevant to the allocation decision.
Project quantity, C1 and C4–C7 were assigned scenario inputs; C4 represents assumed additional temporary or permanent hiring attributable to the 100 t project, excluding existing workers merely reassigned to it. C2 and C3 were calculated from API-derived routes and the stated vehicle and factor assumptions (Supplementary Section S3). Route outputs do not verify the hypothetical operator attributes.
C1 is an assigned all-inclusive waste-management service charge, including haulage from the common project site (THB/t). It is not an observed quotation, and no separate monetary transport or fuel charge is added. C2 and C3 are physical logistics indicators.
The scenarios were constructed to demonstrate the workflow and computational reproducibility, not to estimate operator performance or represent the regional market.
3.10. Verification, Evaluation, and Ranking Robustness
3.10.1. Computational Verification
For computational verification [73,74], the TOPSIS results for the 10 researcher-defined scenarios were independently recalculated using the decision matrix in Supplementary Table S10 and the global weights reported in [69]. Constant IC was excluded from the recalculation, and the seven retained weights were proportionally normalized. Intermediate results, closeness coefficients and the complete ranking were checked against the retained baseline calculations.
3.10.2. Expert Validation, Prospective-User Evaluation, and Technical Quality
The doctoral-research assessment involved 12 experts in construction-waste management, construction and information systems [69]. They rated 12 five-point items, three each for model accuracy, criterion appropriateness, decision reliability and practical applicability. English item wording appears in Supplementary Table S17. Model accuracy here denotes expert perception; computational verification is addressed in Section 3.10.1.
ISO/IEC 25010:2011 informed the system-quality discussion when the study was developed [75]; the four expert dimensions are not presented as a validated ISO scale. Future system-quality evaluations should consider the revised ISO/IEC 25010:2023 model [76].
The same 25 QFD stakeholders subsequently used EcoRanker and rated eight single-item domains: usability, information quality, learnability, reliability, efficiency, effectiveness, satisfaction with functions and overall satisfaction. The Satisfaction Index equals the grand mean across items divided by five and multiplied by 100. These are formative ratings by involved stakeholders. Expert ratings were analyzed descriptively without an internal-consistency estimate; a single item per user domain cannot yield within-domain reliability. Neither assessment compared rankings with observed procurement decisions.
Accessibility was assessed using WAVE, with interpretation informed by the Web Content Accessibility Guidelines 2.1 [77,78]. Desktop performance and best-practice indicators were assessed using Google PageSpeed Insights, whose laboratory diagnostics are generated through Lighthouse [79]. Automated tests were treated as complementary system-quality evidence rather than proof of complete accessibility, usability, or circular performance.
3.10.3. Ranking Diagnostics and Robustness
Zero-variance criteria were removed before ranking. The association between C2 and C3 was assessed descriptively across the 10 synthetic scenarios using Pearson and Spearman correlations; the common four-wheel group was checked separately. No population inference was intended. Each of the seven active criteria was removed in turn, and C2 and C3 were additionally removed jointly. Retained weights were proportionally normalized to unit sum, and vector-normalized TOPSIS was repeated for the same 10 alternatives. Each result was compared with the baseline using the complete rank order, Spearman rank correlation and maximum absolute rank shift [80].
Deterministic weight sensitivity comprised 14 tests. For criterion k, its baseline weight was multiplied by 0.8 or 1.2, and the other six weights were rescaled proportionally to keep the sum at one. Eight fuel-efficiency tests changed the common reference by −20% or +20% for one vehicle class at a time (5.0952 or 7.6428 km/L), recalculated C3 and repeated TOPSIS. Ten ordinal-coding tests replaced (1, 3, 5, 7, 9) with (1, 5, 7, 8, 9) or (1, 2, 3, 5, 9), separately for C4–C7 and jointly. These are specified discrete diagnostics, not tests of every continuous weight or coding combination.
Alternative-set sensitivity deleted each of the 10 alternatives in turn and recomputed vector normalization and both ideal solutions. Reversals were identified among surviving pairs relative to their baseline survivor order, separating reversals from automatic rank-number compression. A Monte Carlo weight sensitivity analysis was also performed using 10,000 simulated weight combinations. Operator inputs and factors were held fixed. Frequencies describe this analyst-selected weight scheme, not empirically estimated uncertainty or confidence levels.
These offline diagnostics used the disclosed matrix; Supplementary Sections S1, S3 and S4 provide their calculation details.
3.11. Methodological Boundaries and Reproducibility
The method applies to post-generation allocation among eligible off-site operators. Reproduction requires the decision matrix, criteria and anchors, weights, project and route metadata, vehicle and factor inputs, and program version. Supplementary Section S3 specifies the transport calculations; implications for field use are discussed in Section 4.10.
4. Results and Discussion
4.1. Stakeholder-Derived Circular Construction Requirements
4.1.1. Prioritization of Stakeholder Requirements
Among 15 requirements, data security and privacy (CR11) had the highest normalized priority (7.75%), followed by effectiveness and efficiency (CR1; 7.55%) and accessibility and standards (CR4; 7.41%). The instrument’s mean IOC was 0.88. These results show a broad requirements profile without one dominant item.
Recalculation from the 25 × 15 respondent-level ratings gave a CR Spearman correlation of 0.9973 between arithmetic-mean and geometric-mean priorities, using average ranks for ties. The complete TC priority order was unchanged (rho = 1.0000): TC1, TC2, TC6, TC5, TC12, TC4, TC9, TC8, TC11, TC7, TC10 and TC3. The reported technical order was therefore insensitive to this particular change in aggregation rule. This comparison does not establish ratio-scale measurement or general robustness to alternative numerical codings of the five categories. The diagnostic is summarized in Supplementary Section S8.
4.1.2. Translation into Technical Characteristics
The final HoQ prioritized user-interface and visualization design (TC1; 12.93%), methodology and algorithm documentation (TC2; 11.12%), and data-security protocols (TC6; 9.81%) (Figure 3). In the initial seven-expert audit, all 180 CR–TC pairs had unique modal codes (Supplementary Table S15). The figure contains the subsequently reviewed relationships, so the initial audit is not a cell-by-cell transcript of the displayed HoQ.
4.2. Triple-Bottom-Line and Circularity Criteria
Table 3 separates parent, local, reported global and active weights. The reported parent priorities were 0.202610 (Economic), 0.354221 (Environmental), 0.150748 (Social) and 0.292421 (Technical). C2 had a local environmental priority of 0.589100, a thesis-reported global priority of 0.2087 and an active weight of 0.228712 after IC exclusion [69]. In the initial consistency check, eight of 25 parent matrices exceeded CR = 0.10; all 25 final matrices were below 0.10 after reassessment (Supplementary Table S1).
Table 3.
Presents the parent, local, reported global and active weights alongside the criterion definitions.
The active C1–C7 weights are 0.126137, 0.228712, 0.159452, 0.071781, 0.093479, 0.180164 and 0.140274. Proportional normalization raises the environmental share to 0.388164 and reduces the economic share to 0.126137. In the separate within-economic allocation, C1 becomes 0.2026 and the original parent shares are preserved; C–A–D remains the top three, while E and G exchange ranks (rho = 0.9879; maximum shift one; Supplementary Table S2).
4.3. EcoRanker DSS Implementation and Decision Workflow
Figure 4 shows authentication and role-based access, Figure 5 presents GIS-based project-location entry, Figure 6 illustrates criterion data entry, and Figure 7 displays the ranked shortlist. These screenshots document the implemented workflow and illustrate the integration described in Section 3.8.
Figure 4.
EcoRanker implementation: Authentication and role-based access.
Figure 5.
EcoRanker implementation: GIS-based project location. Note: EcoRanker supports Thai and English. This screenshot includes Thai interface labels for its intended Thai users: “ไทย” means “Thai” (language selection); “ล็อคการใช้แผนที่” means “Lock map interaction”; “แผนที่พร้อมใช้งาน” means “Map ready”; “แผนที่” means “Map”; and “ดาวเทียม” means “Satellite.” Thai text within the map identifies local geographic features and addresses. Red asterisks (*) indicate required fields.
Figure 6.
EcoRanker implementation: Sustainability data entry screen based on assessment criteria for processing and ranking. Note: Red asterisks (*) indicate required fields.
Figure 7.
EcoRanker interface showing the comparison output and simulated workflow for the three highest-ranked operator scenarios. Status labels and dates are demonstration records retained from software development and do not represent actual operator responses or the research data-collection period. The displayed total distances are cumulative round-trip vehicle-kilometers, not one-way route distances.
Figure 6 retains the deployed interface terminology: “ISO Standards and Public Acceptance” corresponds to C5, “Final quality of waste management” to C6, and “Technical feasibility of waste management” to C7. In Figure 7, however, the legacy column headed “Final quality of waste management” displays a processing-pathway description corresponding to C7, not a numerical C6 output-quality score. Table 4 reports C6 and C7 separately.
Table 4.
Complete criterion profiles and TOPSIS results for the 10 synthetic operator scenarios.
The routing module uses project and operator coordinates to obtain a road-network route. Vehicle, payload and factor settings then feed the bounded logistics indicators; these do not amount to a life-cycle assessment.
Road-network distance is displayed as operational information but is not separately weighted. It feeds C2 and C3, while C1 remains an independent assigned price [50,51].
4.4. Demonstration of Operator Allocation Results
4.4.1. Demonstration Configuration
The demonstration used 100 t of recoverable concrete-dominant waste and 10 researcher-defined scenarios. One-way routes ranged from 16.84 to 100.00 km across four vehicle profiles, yielding four to 15 ceiling-rounded trips. The program recalculated C2 and C3 when vehicle, payload, route or waste quantity changed.
For C, fifteen 7 t trips provide 105 t of dispatched capacity. The retained full-load formula gives 328.58208 kgCO2e, whereas the 100 t mass-consistent formula gives 316.70146 kgCO2e with the same fixed factors. For E, seven 16 t trips provide 112 t; the corresponding formula values are 554.708 and 519.596 kgCO2e. Substituting the mass-consistent C2 values for all 10 alternatives retains C–A–D but exchanges E and G (rho = 0.9879; maximum shift one). The full comparison is in Supplementary Table S3. This diagnostic compares the two loading assumptions using the adopted baseline weights and does not validate its loading assumption.
4.4.2. Integrated Decision Outcomes
Table 4 gives all seven active criterion values, closeness coefficients and ranks; Figure 7 displays the leading three. C1–C3 are minimized, and C4–C7 maximized. Supplementary Table S10 retains input precision, and Section S6 documents the top-three profiles and simple-rule comparisons. The status labels and dates shown in Figure 7 are simulated workflow records retained from software development. They do not represent actual operator responses, procurement commitments or the research data-collection period.
C ranked first because it had the lowest C2 and C3, the highest assigned C5 and C6 codes, and joint-highest C4 and C7 codes. Compared with A, C had more favorable C2, C3, C5 and C6 values at an additional assigned charge of THB 10/t. C dominated D, F, H, I and J: it was no worse on any criterion and better on at least one. A, B, C and E were non-dominated. C’s favorable assigned profile contributes to its leading rank; it does not establish the superiority of an actual company. Table 5 compares TOPSIS with the minimum-charge and nearest-operator selection rules.
Table 5.
Comparison of TOPSIS with minimum-charge and nearest-operator selection rules.
The minimum-charge rule selected E, whereas both TOPSIS and the nearest-operator rule selected C. For the 100 t project, C’s assigned charge was THB 2000 higher than E’s, reflecting a modelled price–performance trade-off. Because the nearest-operator rule also selected C, this comparison does not establish that TOPSIS produced a better selection than the distance-only rule. The complete comparisons are presented in Supplementary Table S12.
4.4.3. Ranking Robustness and Decision Confidence
Across the 10 heterogeneous-vehicle scenarios, C2 and C3 had a Pearson correlation of 0.6529 and a Spearman correlation of 0.7818. Within the common four-wheel vehicle group (A, B, C, D, and G), the two indicators were effectively proportional (Pearson r approximately 1). Their combined active weight was 38.82%. These results indicate that the two criteria share transport-related information.
Removing C2, C3, or both criteria retained C and A as the first and second alternatives, although the wider ranking changed. Removing C2 gave a rank correlation of 0.6485 and a maximum rank shift of five, while removing C3 gave a rank correlation of 0.9152 and a maximum shift of two. When both criteria were removed, the rank correlation was 0.4061, and D moved from third to tenth. These results indicate that the wider ranking depended substantially on the transport indicators. The complete criterion-removal results are reported in Supplementary Table S4.
The 14 individual weight-change scenarios retained C–A–D as the top three. In the eight class-efficiency tests, C and A retained the first two positions, while H replaced D in two tests. The 10 order-preserving ordinal recoding tests also retained C and A as the first two alternatives, although one C6 recoding placed G third. These tests show that some positions depended on the assumed fuel efficiencies and category coding.
Deleting one alternative reversed at least one surviving pair in six of 10 tests. In 10,000 sampled weight combinations, C and A ranked first and second throughout, while D and G ranked third in 93.52% and 6.48% of draws. These frequencies depend on the specified weight scheme; Table 6 summarizes the diagnostics, and Supplementary Section S4 gives full results.
Table 6.
Consolidated diagnostics for the retained synthetic decision matrix.
4.5. DSS Verification, User Evaluation, and Practical Feasibility
4.5.1. Computational Verification Summary
The independent recalculation reproduced the retained baseline order: C–A–D–H–G–E–B–I–J–F. All 10 closeness coefficients agreed to the four decimal places shown in Table 4; the leading values were 0.9671, 0.7092 and 0.5223. The web interface displays the corresponding top-three shortlist, C–A–D (Figure 7). Supplementary Table S10 provides the decision-matrix inputs at the precision used in the recalculation.
This agreement verifies the calculations for the disclosed 10 scenarios; it does not validate the inputs or outcomes in actual allocation decisions.
4.5.2. System Validation and User Evaluation
The thesis-based assessment by 12 experts yielded mean ratings above 4.00 in all four dimensions [69]. Model accuracy received the highest dimension mean (4.39), followed by decision reliability (4.33), criterion appropriateness (4.31), and practical applicability (4.19). The reported overall mean was 4.31. Item-level means and standard deviations are presented in Supplementary Table S17. These results describe favorable expert perceptions of the assessed system; they do not establish predictive accuracy, the internal consistency of the instrument, or agreement with actual procurement outcomes.
The 25-person prospective-user evaluation yielded a grand mean of 4.35 across the eight recorded items and a Satisfaction Index of 87.00%. Efficiency received the highest mean (4.68), followed by satisfaction with functions (4.56) and effectiveness (4.52). Learnability (3.92) and perceived reliability (3.88) were lower, identifying priorities for user guidance and clearer explanations of the results. Item-level descriptive statistics are reported in Supplementary Table S16. As the users had participated in QFD, these findings represent formative feedback from involved stakeholders; independent-user acceptance and performance during actual procurement were not evaluated. The mean of the eight item-specific sample SDs was 0.56; it is not the SD of respondent composite scores. The separate Overall Satisfaction item had mean 4.48 and is distinct from the grand mean of 4.35.
Automated accessibility screening was conducted using WAVE, with interpretation informed by the Web Content Accessibility Guidelines 2.1 [76,77]. The assessment reported no automated accessibility errors and an AIM score of 10.00. This result indicates that the tested interface did not trigger the automated error conditions evaluated by WAVE; it should not be interpreted as a complete manual accessibility-conformance audit. This result indicates that the tested interface did not trigger the automated error conditions evaluated by WAVE; it should not be interpreted as a complete manual accessibility-conformance audit. Table 7 summarizes the computational verification, expert assessment, prospective-user evaluation, accessibility screening and practical web-performance evidence.
Table 7.
DSS verification, validation, and practical-evaluation evidence.
4.6. Triple-Bottom-Line Interpretation and Economic Implications
The assigned price difference between C and the lowest-charge scenario E illustrates a cost–criterion trade-off in the model. The same case selects C under the nearest-operator rule, so it does not demonstrate superiority over distance-only selection.
For procurement, the web record permits the service charge to be considered alongside modelled logistics and assigned social, recovery-quality and technical categories. Operational decisions would require verified quotations and supporting evidence of the intended recovery value.
C1 captures service charge including haulage, while capacity is an eligibility condition. Avoided disposal charges, recovered-material revenue, quality-control costs, schedule risk and other circular value were not monetized; the demonstration is therefore not a full economic assessment.
4.7. Environmental, Social, and Circular-Value Trade-Offs
D ranked third with a relatively short route and an assigned C6 code of 5, while some alternatives had higher assumed output-quality codes and larger modelled transport burdens. This illustrates a conditional trade-off, not observed circular performance [16,17,20,21]. Wider circular flows may shift risks across locations [81], beyond this case’s boundar.
Because criterion removal changed parts of the ranking, close alternatives require scrutiny of source evidence, active weights and scenario assumptions before an award decision.
C2 and C3 compare configured transport conditions; C6 is assigned output quality. Material substitution and net environmental benefit require independent evidence.
C4 permits assumed additional hiring attributable to the 100 t project to enter the comparison alongside C5 social acceptance and assurance. Neither code demonstrates observed employment, community acceptance or certification; operational scores need evidence and documented weighting.
4.8. Digital Decision Support for Circular Procurement and Market Governance
The program displays criteria, weights, routes, assigned evidence and ranks in one decision record. Traceability links stakeholder needs to system design and project/operator inputs to the ranking; retained metadata allow a reviewer to reconstruct the recommendation.
A consolidated record can reduce the effort of assembling quotations, permits, routes, recovery claims and quality evidence for procurement. Transaction-cost savings were not measured in this study.
Project teams can use the program for eligibility screening and comparison of price, recovery claims and assurance evidence, recording the basis for an award or override. Contractual and engineering review remains necessary.
For public buyers, standardized records of permits, accepted waste, capacity, prices, output specifications and destination markets could improve review of eligible operators. Such field evidence was not gathered for the synthetic case.
Full chain-of-custody, automated claim verification, contract-performance monitoring and formal approval histories remain future implementation needs.
4.9. Policy Implications for Circular Construction Markets
Policy application would require source separation, quality standards, transparent operator data, sustainable procurement and demand for verified secondary products alongside logistics planning. This case did not measure market creation or regional emission reduction.
Disposal pricing, procurement preferences, performance-based contracts and support for product testing are possible instruments, but their financial effects were not evaluated here.
Governance application should disclose the active weights, evidence sources, price basis, factor versions, overrides, and approving decision-maker. Digital decision support is most valuable when it improves accountable professional judgment and fair comparison rather than presenting a relative rank as an unquestionable algorithmic answer.
4.10. Limitations
The analytical demonstration covered one 100 t concrete-dominant waste stream and 10 researcher-defined scenarios in Central Thailand. It establishes program feasibility under specified conditions, not statistical representativeness, verified company performance, market-wide economic benefit or geographic generalizability. C’s favorable assigned profile contributes to its leading rank, and the nearest-operator rule also selects C. The comparison therefore does not establish selection superiority over that rule or realized economic and circular benefits.
The logistics indicators used assigned vehicle profiles, whole dispatched trips and fixed factors. The retained C2 formula applies rated payload to every outward trip, so dispatched capacity can exceed actual project mass; computational reproduction does not validate that loading assumption. The mass-consistent diagnostic assumes linear scaling of the loaded component with mass and is not a measured partial-load fleet model. C3 applies one 6.369 km/L pickup reference across heterogeneous classes and omits class-specific fuel use per kilometer and loaded/empty efficiency differences. Larger payloads can therefore receive favorable C3 values through fewer trips without reflecting different fuel consumption per kilometer. Verified matching vehicle-class or fleet data remain unavailable in the study records and are needed for operational conclusions. C2 and C3 share transport information and receive 38.82% of active weight; joint removal substantially changes the wider order.
C4–C7 are assigned ordinal categories represented numerically for TOPSIS. Equal category-code differences are not established as equal preference or performance intervals. C4 represents assumed additional hiring attributable to the 100 t project rather than existing staff reassigned to it; no hiring or employment duration was observed; C5 combines public-perception and standards information, and C6 does not establish tested output quality. The implemented C4 boundaries overlap at some permanent-job counts and omit an explicit category for exactly five temporary jobs. On-site C7 software options lie outside the comparison boundary. Order-preserving recoding tests expose shortlist sensitivity but do not establish interval-scale validity or independently verified operator attributes.
The geometric aggregation of five-category requirement codes is a specified convention rather than established ratio-scale measurement. The arithmetic-mean diagnostic tests one alternative aggregation rule with the final HoQ held fixed; it does not establish validity under other codings or aggregation models.
The evaluation provides descriptive expert assessments and formative feedback from stakeholders involved in QFD. Their prior participation may favor positive ratings and limits transferability to unfamiliar users. Internal consistency was not assessed for the three-item expert dimensions, while the single-item user domains do not permit within-domain reliability estimation. No independent-user study or comparison with observed procurement decisions was conducted. The model-accuracy ratings reflect expert perceptions, and computational agreement in the ten-scenario verification does not establish field validity. Further evaluation should involve independent users undertaking actual allocation tasks, appropriate assessment of the instruments, and comparison of recommendations with observed decisions and outcomes. The earlier prototype reports the same overall user-evaluation figures [73]; matching aggregates do not establish a newly conducted independent-user study.
C1 captures the assigned service charge including haulage rather than full life-cycle economic value. Investment/capacity was constant and excluded from ranking. Avoided disposal cost, secondary-material revenue, quality-assurance cost, market demand and longer-term value require additional reliable data. TOPSIS remains compensatory and relative to the included alternatives; six of 10 alternative-deletion tests produced survivor-pair reversals. The sampled weights follow an analyst-selected distribution, not an empirical uncertainty model. Alternative addition/duplication and broader input-data or model-form uncertainty remain untested. Longitudinal field evaluation, transactions, quality tests, chain-of-custody records and life-cycle evidence are needed before claims of verified circular, economic or carbon outcomes.
5. Conclusions and Future Research
This study developed EcoRanker as an operational decision-support model for circular construction management. Its contribution is a QFD-informed software design integrated with a separately weighted FAHP–GIS–TOPSIS operator-selection workflow that connects triple-bottom-line performance with circular recovery and technical feasibility in a reviewable web program. The model supports project-level operator allocation without reducing sustainability to minimum cost, maximum recycling, or minimum transport emissions.
In the synthetic Central Thailand demonstration, the baseline leading order was C–A–D. Recalculation reproduced the reported ranking. C and A retained the first two positions in the criterion-removal tests, while third place and the wider order changed, especially when both transport indicators were removed. Survivor-pair reversals in six of 10 alternative-deletion tests further limit general stability claims. The nearest-operator rule also selected C. The expert assessment (4.31/5.00) and formative prospective-user evaluation (87.00%) support perceived feasibility under the defined conditions; they do not establish independent-user validity, verified operator performance or improved procurement outcomes.
EcoRanker contributes to sustainable development by making assigned service charges, modelled environmental logistics, social considerations, assumed recovery quality, and technical capability visible within one circular allocation decision. The program can support transparent procurement, value-based operator comparison, and prevention of logistics burden shifting. It complements prevention, reuse, statutory compliance, engineering judgment, market analysis, product verification, cost–benefit assessment, life-cycle assessment, and physical traceability.
Future research should validate EcoRanker with actual projects, operators, contracts, fleet data, recovered-material tests, destination markets, and longitudinal outcomes. The economic module should be expanded to life-cycle cost, avoided-disposal expenditure, secondary-material revenue, procurement savings, carbon-price exposure, and regional investment analysis without double counting. Artificial intelligence could support evidence extraction from permits and test reports, anomaly detection, demand and price forecasting, adaptive scenario generation, and natural-language explanations of ranking changes. These functions should remain human-supervised, explainable, auditable, and separated from final approval. Integration with material passports, chain-of-custody records, and regionalized life-cycle assessment would then test whether preferred allocations deliver verified circular, economic, social, and net environmental value.
Supplementary Materials
The following supporting information can be downloaded at: https://www.mdpi.com/article/10.3390/su182111415/s1, Section S1, FAHP procedure, initial/final consistency values and weighting-policy diagnostic [82]; Section S2, TOPSIS formulation; Section S3, spatial logistics and mass-consistent C2 diagnostic [83]; Section S4, complete sensitivity and alternative-set analyses; Section S5, baseline matrix; Section S6, leading alternatives and simple rules; Section S7, implemented ordinal categories; Section S8, requirement-aggregation diagnostic; Section S9, initial HoQ modal-frequency audit; and Section S10, user and expert evaluation items. Tables S1–S17 support these materials. Reference numbers correspond to the main text.
Author Contributions
Conceptualization, P.B. and K.S.; methodology, P.B. and K.S.; software, K.S.; validation, P.B.; formal analysis, K.S.; investigation, K.S.; data curation, K.S.; writing—original draft preparation, K.S.; writing—review and editing, P.B. and K.S.; visualization, K.S.; supervision, P.B. All authors have read and agreed to the published version of the manuscript.
Funding
This research received no external funding.
Institutional Review Board Statement
The study was conducted in accordance with the Declaration of Helsinki and approved by the Human Research Ethics Committee of Rajamangala University of Technology Tawan-ok, Thailand (COA No. 051; RMUTTO REC No. 056/2567; approved on 11 December 2024).
Informed Consent Statement
Informed consent was obtained from all participants involved in the study.
Data Availability Statement
The original contributions presented in this study are included in the article and supplementary materials. Further inquiries can be directed to the corresponding author. The synthetic decision matrix and reported aggregate results are included in the article and Supplementary Materials. Participant-level data are not publicly available due to participant confidentiality and research-ethics restrictions.
Acknowledgments
The authors thank the stakeholders, experts, and prospective users who participated in the study. They acknowledge Rajamangala University of Technology Phra Nakhon for academic and institutional support and the contracted developer for implementation support for the web application.
Conflicts of Interest
The authors declare no conflicts of interest.
References
- Akhtar, A.; Sarmah, A.K. Construction and demolition waste generation and properties of recycled aggregate concrete: A global perspective. J. Clean. Prod. 2018, 186, 262–281. [Google Scholar] [CrossRef] [Scilit]
- Ginga, C.P.; Ongpeng, J.M.C.; Daly, M.K.M. Circular economy on construction and demolition waste: A literature review on material recovery and production. Materials 2020, 13, 2970. [Google Scholar] [CrossRef] [Scilit] [PubMed]
- Purchase, C.K.; Al Zulayq, D.M.; O’Brien, B.T.; Kowalewski, M.J.; Berenjian, A.; Tarighaleslami, A.H.; Seifan, M. Circular economy of construction and demolition waste: A literature review on lessons, challenges, and benefits. Materials 2022, 15, 76. [Google Scholar] [CrossRef] [Scilit] [PubMed]
- Kofoworola, O.F.; Gheewala, S.H. Estimation of construction waste generation and management in Thailand. Waste Manag. 2009, 29, 731–738. [Google Scholar] [CrossRef] [Scilit] [PubMed]
- Hoang, N.H.; Ishigaki, T.; Kubota, R.; Yamada, M.; Kawamoto, K. A review of construction and demolition waste management in Southeast Asia. J. Mater. Cycles Waste Manag. 2020, 22, 315–325. [Google Scholar] [CrossRef] [Scilit]
- López Ruiz, L.A.; Roca Ramón, X.; Gassó Domingo, S. The circular economy in the construction and demolition waste sector-A review and an integrative model approach. J. Clean. Prod. 2020, 248, 119238. [Google Scholar] [CrossRef] [Scilit]
- She, Y.; Udawatta, N.; Liu, C.; Tokede, O. Circular economy-related strategies to minimise construction and demolition waste generation in Australian construction projects. Buildings 2024, 14, 2487. [Google Scholar] [CrossRef] [Scilit]
- Papastamoulis, V.; London, K.; Feng, Y.; Zhang, P.; Crocker, R.; Patias, P. Conceptualising the circular economy potential of construction and demolition waste: An integrative literature review. Recycling 2021, 6, 61. [Google Scholar] [CrossRef] [Scilit]
- Gherman, I.-E.; Lakatos, E.-S.; Clinci, S.D.; Lungu, F.; Constandoiu, V.V.; Cioca, L.I.; Rada, E.C. Circularity outlines in the construction and demolition waste management: A literature review. Recycling 2023, 8, 69. [Google Scholar] [CrossRef] [Scilit]
- Khajuria, A.; Atienza, V.A.; Chavanich, S.; Wilts, H.; Islam, I.; Kral, U.; Liu, M.; Liu, X.; Murthy, I.K.; Oyedotun, T.D.T.; et al. Accelerating circular economy solutions to achieve the 2030 agenda for sustainable development goals. Circ. Econ. 2022, 1, 100001. [Google Scholar] [CrossRef] [Scilit]
- Long, Y.; Li, Z.; Song, Q.; Cai, K.; Tan, Q.; Yang, G. The dynamic stock-flow and driving force analysis of the building metal and non-metal resources at a city scale: An empirical study in Macao. Circ. Econ. 2022, 1, 100004. [Google Scholar] [CrossRef] [Scilit]
- Papamichael, I.; Voukkali, I.; Loizia, P.; Zorpas, A.A. Construction and demolition waste framework of circular economy: A mini review. Waste Manag. Res. 2023, 41, 1728–1740. [Google Scholar] [CrossRef] [Scilit] [PubMed]
- Kryeziu, D.; Selmani, F.; Mujaj, A.; Kondi, I. Recycled concrete aggregates: A promising and sustainable option for the construction industry. J. Hum. Earth Future 2023, 4, 166–180. [Google Scholar] [CrossRef] [Scilit]
- Sereewatthanawut, I.; Ajayi, B.; Emmanuel, B.; Bunphot, A.; Chayutthanabun, A.; Niyomukiza, J.; Chinda, T. Sustainable material recovery from demolition waste: Knowledge management and insights from a public sector building renovation. Buildings 2025, 15, 3167. [Google Scholar] [CrossRef] [Scilit]
- de Sousa, I.C.F.; Pereira, C.H.d.A.F.; Fraga, Y.S.B. Life cycle assessment of recycled aggregate production in the Federal District, Brazil. Recycling 2026, 11, 94. [Google Scholar] [CrossRef] [Scilit]
- Maués, L.M.; Beltrão, N.; Silva, I. GHG emissions assessment of civil construction waste disposal and transportation process in the Eastern Amazon. Sustainability 2021, 13, 5666. [Google Scholar] [CrossRef] [Scilit]
- Weigert, M.; Melnyk, O.; Winkler, L.; Raab, J. Carbon emissions of construction processes on urban construction sites. Sustainability 2022, 14, 12947. [Google Scholar] [CrossRef] [Scilit]
- Lei, B.; Yang, W.; Yan, Y.; Tang, Z.; Dong, W. Carbon emission reduction evaluation of end-of-life buildings based on multiple recycling strategies. Sustainability 2023, 15, 15711. [Google Scholar] [CrossRef] [Scilit]
- Wang, S.; Wu, Q.; Yu, J. BIM-based assessment of the environmental effects of various end-of-life scenarios for buildings. Sustainability 2024, 16, 2980. [Google Scholar] [CrossRef] [Scilit]
- Wang, Y.; Mu, X.; Hu, G.; Wang, L.; Zhu, X. Life cycle assessment-based analysis of environmental and economic benefits in construction solid waste recycling. Sustainability 2025, 17, 3872. [Google Scholar] [CrossRef] [Scilit]
- Chen, Y.; Qian, B.; Xue, J. Decarbonising and advancing the sustainability of construction and demolition waste management in Australia: A regionalised life cycle assessment across states. Sustainability 2026, 18, 902. [Google Scholar] [CrossRef] [Scilit]
- Zhao, X. Stakeholder-associated factors influencing construction and demolition waste management: A systematic review. Buildings 2021, 11, 149. [Google Scholar] [CrossRef] [Scilit]
- Tafesse, S.; Girma, Y.E.; Dessalegn, E. Analysis of the socio-economic and environmental impacts of construction waste and management practices. Heliyon 2022, 8, e09169. [Google Scholar] [CrossRef] [Scilit] [PubMed]
- Past, V.; Yaghmaeian, K.; Naderi, M.; Naderi, N. Management of the construction and demolition waste (CDW) and determination of the best disposal alternative by FAHP (Fuzzy Analytic Hierarchy Process): A case study of Tehran, Iran. J. Air Waste Manag. Assoc. 2023, 73, 271–284. [Google Scholar] [CrossRef] [Scilit] [PubMed]
- Rayhan, D.S.A.; Bhuiyan, I.U. A framework for evaluation of construction and demolition waste management alternatives using MCDA techniques in the context of Dhaka City. Int. J. Constr. Manag. 2025, 25, 481–493. [Google Scholar] [CrossRef] [Scilit]
- Weerakoon, T.G.; Zvirgzdins, J.; Lapuke, S.; Wimalasena, S.; Drukis, P. Integrating circular economy (CE) principles into construction waste management (CWM) through multiple criteria decision-making (MCDM). Sustainability 2025, 17, 7770. [Google Scholar] [CrossRef] [Scilit]
- Banias, G.; Achillas, C.; Vlachokostas, C.; Moussiopoulos, N.; Papaioannou, I. A web-based decision support system for the optimal management of construction and demolition waste. Waste Manag. 2011, 31, 2497–2502. [Google Scholar] [CrossRef] [Scilit] [PubMed]
- van den Berg, M.; Hulsbeek, L.; Voordijk, H. Decision-support for selecting demolition waste management strategies. Build. Cities 2023, 4, 883–901. [Google Scholar] [CrossRef] [Scilit]
- Han, D.; Kalantari, M.; Rajabifard, A. The development of an integrated BIM-based visual demolition waste management planning system for sustainability-oriented decision-making. J. Environ. Manag. 2024, 351, 119856. [Google Scholar] [CrossRef] [Scilit] [PubMed]
- Yu, Y.; Yazan, D.M.; Junjan, V.; Iacob, M.-E. Circular economy in the construction industry: A review of decision support tools based on information & communication technologies. J. Clean. Prod. 2022, 349, 131335. [Google Scholar] [CrossRef] [Scilit]
- Long, W.; Ng, S.T.; Lu, W.; Mora, L.; Bao, Z. Deciphering how digital functions enable circular economy practices in construction: A critical review of recent progress and future outlook. Environ. Impact Assess. Rev. 2025, 113, 107889. [Google Scholar] [CrossRef] [Scilit]
- Zhang, C.; Hu, M.; Di Maio, F.; Sprecher, B.; Yang, X.; Tukker, A. An overview of the waste hierarchy framework for analyzing the circularity in construction and demolition waste management in Europe. Sci. Total Environ. 2022, 803, 149892. [Google Scholar] [CrossRef] [Scilit] [PubMed]
- Caro, D.; Lodato, C.; Damgaard, A.; Cristóbal, J.; Foster, G.; Flachenecker, F.; Tonini, D. Environmental and socio-economic effects of construction and demolition waste recycling in the European Union. Sci. Total Environ. 2024, 908, 168295. [Google Scholar] [CrossRef] [Scilit] [PubMed]
- Martin, H.; Chebrolu, D.; Chadee, A.; Brooks, T. Too good to waste: Examining circular economy opportunities, barriers, and indicators for sustainable construction and demolition waste management. Sustain. Prod. Consum. 2024, 48, 460–480. [Google Scholar] [CrossRef] [Scilit]
- Ferriz-Papi, J.A.; Weekes, E.; Whitehead, N.; Lee, A. A cost-effective recycled aggregates classification procedure for construction and demolition waste evaluation. Constr. Build. Mater. 2022, 324, 126642. [Google Scholar] [CrossRef] [Scilit]
- Zhang, C.; Hu, M.; van der Meide, M.; Di Maio, F.; Yang, X.; Gao, X.; Li, K.; Zhao, H.; Li, C. Life cycle assessment of material footprint in recycling: A case of concrete recycling. Waste Manag. 2023, 155, 311–319. [Google Scholar] [CrossRef] [Scilit] [PubMed]
- Karaca, F.; Tleuken, A. Reforming construction waste management for circular economy in Kazakhstan: A cost-benefit analysis of upgrading construction and demolition waste recycling centres. Recycling 2024, 9, 2. [Google Scholar] [CrossRef] [Scilit]
- Shooshtarian, S.; Caldera, S.; Maqsood, T.; Ryley, T. Using recycled construction and demolition waste products: A review of stakeholders’ perceptions, decisions, and motivations. Recycling 2020, 5, 31. [Google Scholar] [CrossRef] [Scilit]
- Fagone, C.; Santamicone, M.; Villa, V. Architecture engineering and construction industrial framework for circular economy: Development of a circular construction site methodology. Sustainability 2023, 15, 1813. [Google Scholar] [CrossRef] [Scilit]
- Huang, Y.; Pan, L.; He, Y.; Xie, Z.; Zheng, X. A BIM–WMS management tool for the reverse logistics supply chain of demolition waste. Sustainability 2022, 14, 16053. [Google Scholar] [CrossRef] [Scilit]
- Movaffaghi, H.; Yitmen, I. Framework for dynamic circular economy in the building industry: Integration of blockchain technology and multi-criteria decision-making approach. Sustainability 2023, 15, 15914. [Google Scholar] [CrossRef] [Scilit]
- Newig, J.; Jager, N.W.; Challies, E.; Kochskämper, E. Does stakeholder participation improve environmental governance? Evidence from a meta-analysis of 305 case studies. Glob. Environ. Change 2023, 82, 102705. [Google Scholar] [CrossRef] [Scilit] [PubMed]
- Cinelli, M.; Kadziński, M.; Gonzalez, M.; Słowiński, R. How to support the application of multiple criteria decision analysis? Let us start with a comprehensive taxonomy. Omega 2020, 96, 102261. [Google Scholar] [CrossRef] [Scilit] [PubMed]
- Zlaugotne, B.; Zihare, L.; Balode, L.; Kalnbalkite, A.; Khabdullin, A.; Blumberga, D. Multi-criteria decision analysis methods comparison. Environ. Clim. Technol. 2020, 24, 454–471. [Google Scholar] [CrossRef] [Scilit]
- Buckley, J.J. Fuzzy hierarchical analysis. Fuzzy Sets Syst. 1985, 17, 233–247. [Google Scholar] [CrossRef] [Scilit]
- Vinogradova-Zinkevič, I.; Podvezko, V.; Zavadskas, E.K. Comparative assessment of the stability of AHP and FAHP methods. Symmetry 2021, 13, 479. [Google Scholar] [CrossRef] [Scilit]
- Hwang, C.-L.; Yoon, K. Multiple Attribute Decision Making: Methods and Applications: A State-of-the-Art Survey; Springer: Berlin/Heidelberg, Germany, 1981. [Google Scholar] [CrossRef] [Scilit]
- Shkirman, K.; Stoppato, A.; Giussani, F.; Pezzutto, S. Investigating circularity in the construction and demolition sector through remote sensing: A case study of Bolzano/Bozen, Italy. Circ. Econ. 2025, 4, 100156. [Google Scholar] [CrossRef] [Scilit]
- Burrough, P.A. GIS and geostatistics: Essential partners for spatial analysis. Environ. Ecol. Stat. 2001, 8, 361–377. [Google Scholar] [CrossRef] [Scilit]
- Bi, W.; Lu, W.; Zhao, Z.; Webster, C.J. Combinatorial optimization of construction waste collection and transportation: A case study of Hong Kong. Resour. Conserv. Recycl. 2022, 179, 106043. [Google Scholar] [CrossRef] [Scilit]
- Wang, H.; Yi, W.; Liu, Y. Optimal route design for construction waste transportation systems: Mathematical models and solution algorithms. Mathematics 2022, 10, 4340. [Google Scholar] [CrossRef] [Scilit]
- Soto-Paz, J.; Hernandez, A.; Mejia-Parada, C.A.; Mora-Ruiz, V.; Hernandez, W.; Luna-Guevara, F.; Casallas-Ojeda, M.; Parra-Orobio, B.A. A hybrid decision tool for site selection of construction and demolition waste (CDW) facilities in developing countries. Environ. Process. 2023, 10, 35. [Google Scholar] [CrossRef] [Scilit]
- Banihashemi, S.; Meskin, S.; Sheikhkhoshkar, M.; Mohandes, S.R.; Hajirasouli, A.; LeNguyen, K. Circular economy in construction: The digital transformation perspective. Clean. Eng. Technol. 2024, 18, 100715. [Google Scholar] [CrossRef] [Scilit]
- Barker, M.; Chue Hong, N.P.; Katz, D.S.; Lamprecht, A.-L.; Martinez-Ortiz, C.; Psomopoulos, F.; Harrow, J.; Castro, L.J.; Gruenpeter, M.; Martinez, P.A.; et al. Introducing the FAIR principles for research software. Sci. Data 2022, 9, 622. [Google Scholar] [CrossRef] [Scilit] [PubMed]
- Wilkinson, M.D.; Dumontier, M.; Aalbersberg, I.J.; Appleton, G.; Axton, M.; Baak, A.; Blomberg, N.; Boiten, J.-W.; da Silva Santos, L.B.; Bourne, P.E.; et al. The FAIR guiding principles for scientific data management and stewardship. Sci. Data 2016, 3, 160018. [Google Scholar] [CrossRef] [Scilit] [PubMed]
- Roussat, N.; Dujet, C.; Mehu, J. Choosing a sustainable demolition waste management strategy using multicriteria decision analysis. Waste Manag. 2009, 29, 12–20. [Google Scholar] [CrossRef] [Scilit] [PubMed]
- Boonkanit, P.; Suthiluck, K. Developing a decision-making support system for a smart construction and demolition waste transition to a circular economy. Sustainability 2023, 15, 9672. [Google Scholar] [CrossRef] [Scilit]
- Su, S.; Yu, C.; Jiang, Y.; Kang, K.; Zhong, R.Y. Trading building demolition waste via digital twins. Autom. Constr. 2023, 156, 105105. [Google Scholar] [CrossRef] [Scilit]
- Hevner, A.R.; March, S.T.; Park, J.; Ram, S. Design science in information systems research. MIS Q. 2004, 28, 75–105. [Google Scholar] [CrossRef] [Scilit]
- Peffers, K.; Tuunanen, T.; Rothenberger, M.A.; Chatterjee, S. A design science research methodology for information systems research. J. Manag. Inf. Syst. 2007, 24, 45–77. [Google Scholar] [CrossRef] [Scilit]
- Palinkas, L.A.; Horwitz, S.M.; Green, C.A.; Wisdom, J.P.; Duan, N.; Hoagwood, K. Purposeful sampling for qualitative data collection and analysis in mixed method implementation research. Adm. Policy Ment. Health 2015, 42, 533–544. [Google Scholar] [CrossRef] [Scilit] [PubMed]
- Turner, R.C.; Carlson, L. Indexes of item-objective congruence for multidimensional items. Int. J. Test. 2003, 3, 163–171. [Google Scholar] [CrossRef] [Scilit] [PubMed]
- Akao, Y. Quality Function Deployment: Integrating Customer Requirements into Product Design; Productivity Press: Cambridge, MA, USA, 1990; ISBN 978-0-915299-41-6. [Google Scholar]
- Hauser, J.R.; Clausing, D. The house of quality. Harv. Bus. Rev. 1988, 66, 63–73. Available online: https://hbr.org/1988/05/the-house-of-quality (accessed on 22 July 2026). [CrossRef] [Scilit]
- Ocampo, L.A.; Labrador, J.J.T.; Jumao-as, A.M.B.; Rama, A.M.O. Integrated multiphase sustainable product design with a hybrid quality function deployment-multi-attribute decision-making (QFD-MADM) framework. Sustain. Prod. Consum. 2020, 24, 62–78. [Google Scholar] [CrossRef] [Scilit]
- Siwiec, D.; Pacana, A.; Gazda, A. A new QFD-CE method for considering the concept of sustainable development and circular economy. Energies 2023, 16, 2474. [Google Scholar] [CrossRef] [Scilit]
- Kamara, J.M.; Anumba, C.J.; Evbuomwan, N.F.O. Computer-based application for the processing of clients’ requirements. J. Comput. Civ. Eng. 2000, 14, 264–271. [Google Scholar] [CrossRef] [Scilit]
- Yang, Y.Q.; Wang, S.Q.; Dulaimi, M.; Low, S.P. A fuzzy quality function deployment system for buildable design decision-makings. Autom. Constr. 2003, 12, 381–393. [Google Scholar] [CrossRef] [Scilit]
- Suthiluck, K. Development of a Web-Based Decision Support System for Construction Waste Management Based upon the Concept of a Circular Economy: A Case Study of Central Region of Thailand. Doctoral Thesis, Rajamangala University of Technology Phra Nakhon, Bangkok, Thailand, 2025. Available online: https://dk.rmutp.ac.th/upload/stu/file/fullfile/056380410504-4ฉบับสมบูรณ์.pdf (accessed on 29 October 2026).
- Google Maps Platform. Get a Route Matrix: Routes API. 2026. Available online: https://developers.google.com/maps/documentation/routes/compute_route_matrix (accessed on 22 July 2026).
- Thailand Greenhouse Gas Management Organization (Public Organization). Emission Factor (CFP): July 2022 Factor Table and Online Transport-Factor Database. Thai Carbon Label. July 2022 Table. 2022; 2026. Available online: https://thaicarbonlabel.tgo.or.th/index.php?lang=TH&mod=Y0hKdlpIVmpkSE5mWlcxcGMzTnBiMjQ9 (accessed on 12 October 2026).
- Thailand Greenhouse Gas Management Organization (Public Organization). Requirements for the Calculation and Reporting of Carbon Footprint for Organizations, 8th Printing, 6th Revision, July 2022. Thailand Greenhouse Gas Management Organization, Bangkok, Thailand (in Thai). 2022. Available online: https://thaicarbonlabel.tgo.or.th/tools/files.php?files=TkRFPQ&mod=YjNKbllXNXBlbUYwYVc5dVgyUnZkMjVzYjJGaw&type=WDBaSlRFVlQ (accessed on 12 October 2026).
- Boonkanit, P.; Suthiluck, K. QFD-guided design of a Web-Based DSS Prototype for Sustainable Waste Management in Thailand. J. Ind. Technol. 2026, 22, 84–99. [Google Scholar] [CrossRef]
- Sargent, R.G. Verification and validation of simulation models. J. Simul. 2013, 7, 12–24. [Google Scholar] [CrossRef] [Scilit]
- ISO/IEC 25010:2011; Systems and Software Engineering—Systems and Software Quality Requirements and Evaluation (SQuaRE)—System and Software Quality Models. International Organization for Standardization: Geneva, Switzerland, 2011. Available online: https://www.iso.org/obp/ui/#iso:std:iso-iec:25010:ed-1:v1:en (accessed on 22 July 2026).
- ISO/IEC 25010:2023; Systems and Software Engineering—Systems and Software Quality Requirements and Evaluation (SQuaRE)—Product Quality Model. International Organization for Standardization: Geneva, Switzerland, 2023. Available online: https://www.iso.org/standard/78176.html (accessed on 11 September 2026).
- W3C. Web Content Accessibility Guidelines (WCAG) 2.1. W3C Recommendation; 2018. Available online: https://www.w3.org/TR/2018/REC-WCAG21-20180605/ (accessed on 22 July 2026).
- WebAIM. WAVE Web Accessibility Evaluation Tools. 2026. Available online: https://wave.webaim.org/ (accessed on 22 July 2026).
- Google. About PageSpeed Insights. Google for Developers. 2026. Available online: https://developers.google.com/speed/docs/insights/v5/about (accessed on 22 July 2026).
- Spearman, C. The proof and measurement of association between two things. Am. J. Psychol. 1904, 15, 72–101. [Google Scholar] [CrossRef] [Scilit] [PubMed]
- Zeng, X.; Ogunseitan, O.A.; Nakamura, S.; Suh, S.; Kral, U.; Li, J.; Geng, Y. Reshaping global policies for circular economy. Circ. Econ. 2022, 1, 100003. [Google Scholar] [CrossRef] [Scilit]
- Saaty, T.L. The Analytic Hierarchy Process: Planning, Priority Setting, Resource Allocation; McGraw-Hill: New York, NY, USA, 1980; ISBN 978-0-07-054371-3. [Google Scholar]
- IPCC. 2006 IPCC Guidelines for National Greenhouse Gas Inventories; Energy, Chapter 3: Mobile Combustion; Institute for Global Environmental Strategies: Hayama, Japan, 2006; Volume 2, Available online: https://www.ipcc-nggip.iges.or.jp/public/2006gl/vol2.html (accessed on 22 July 2026).
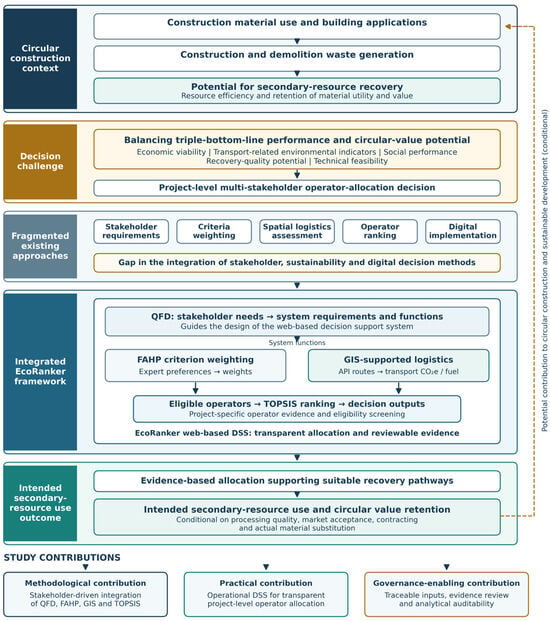
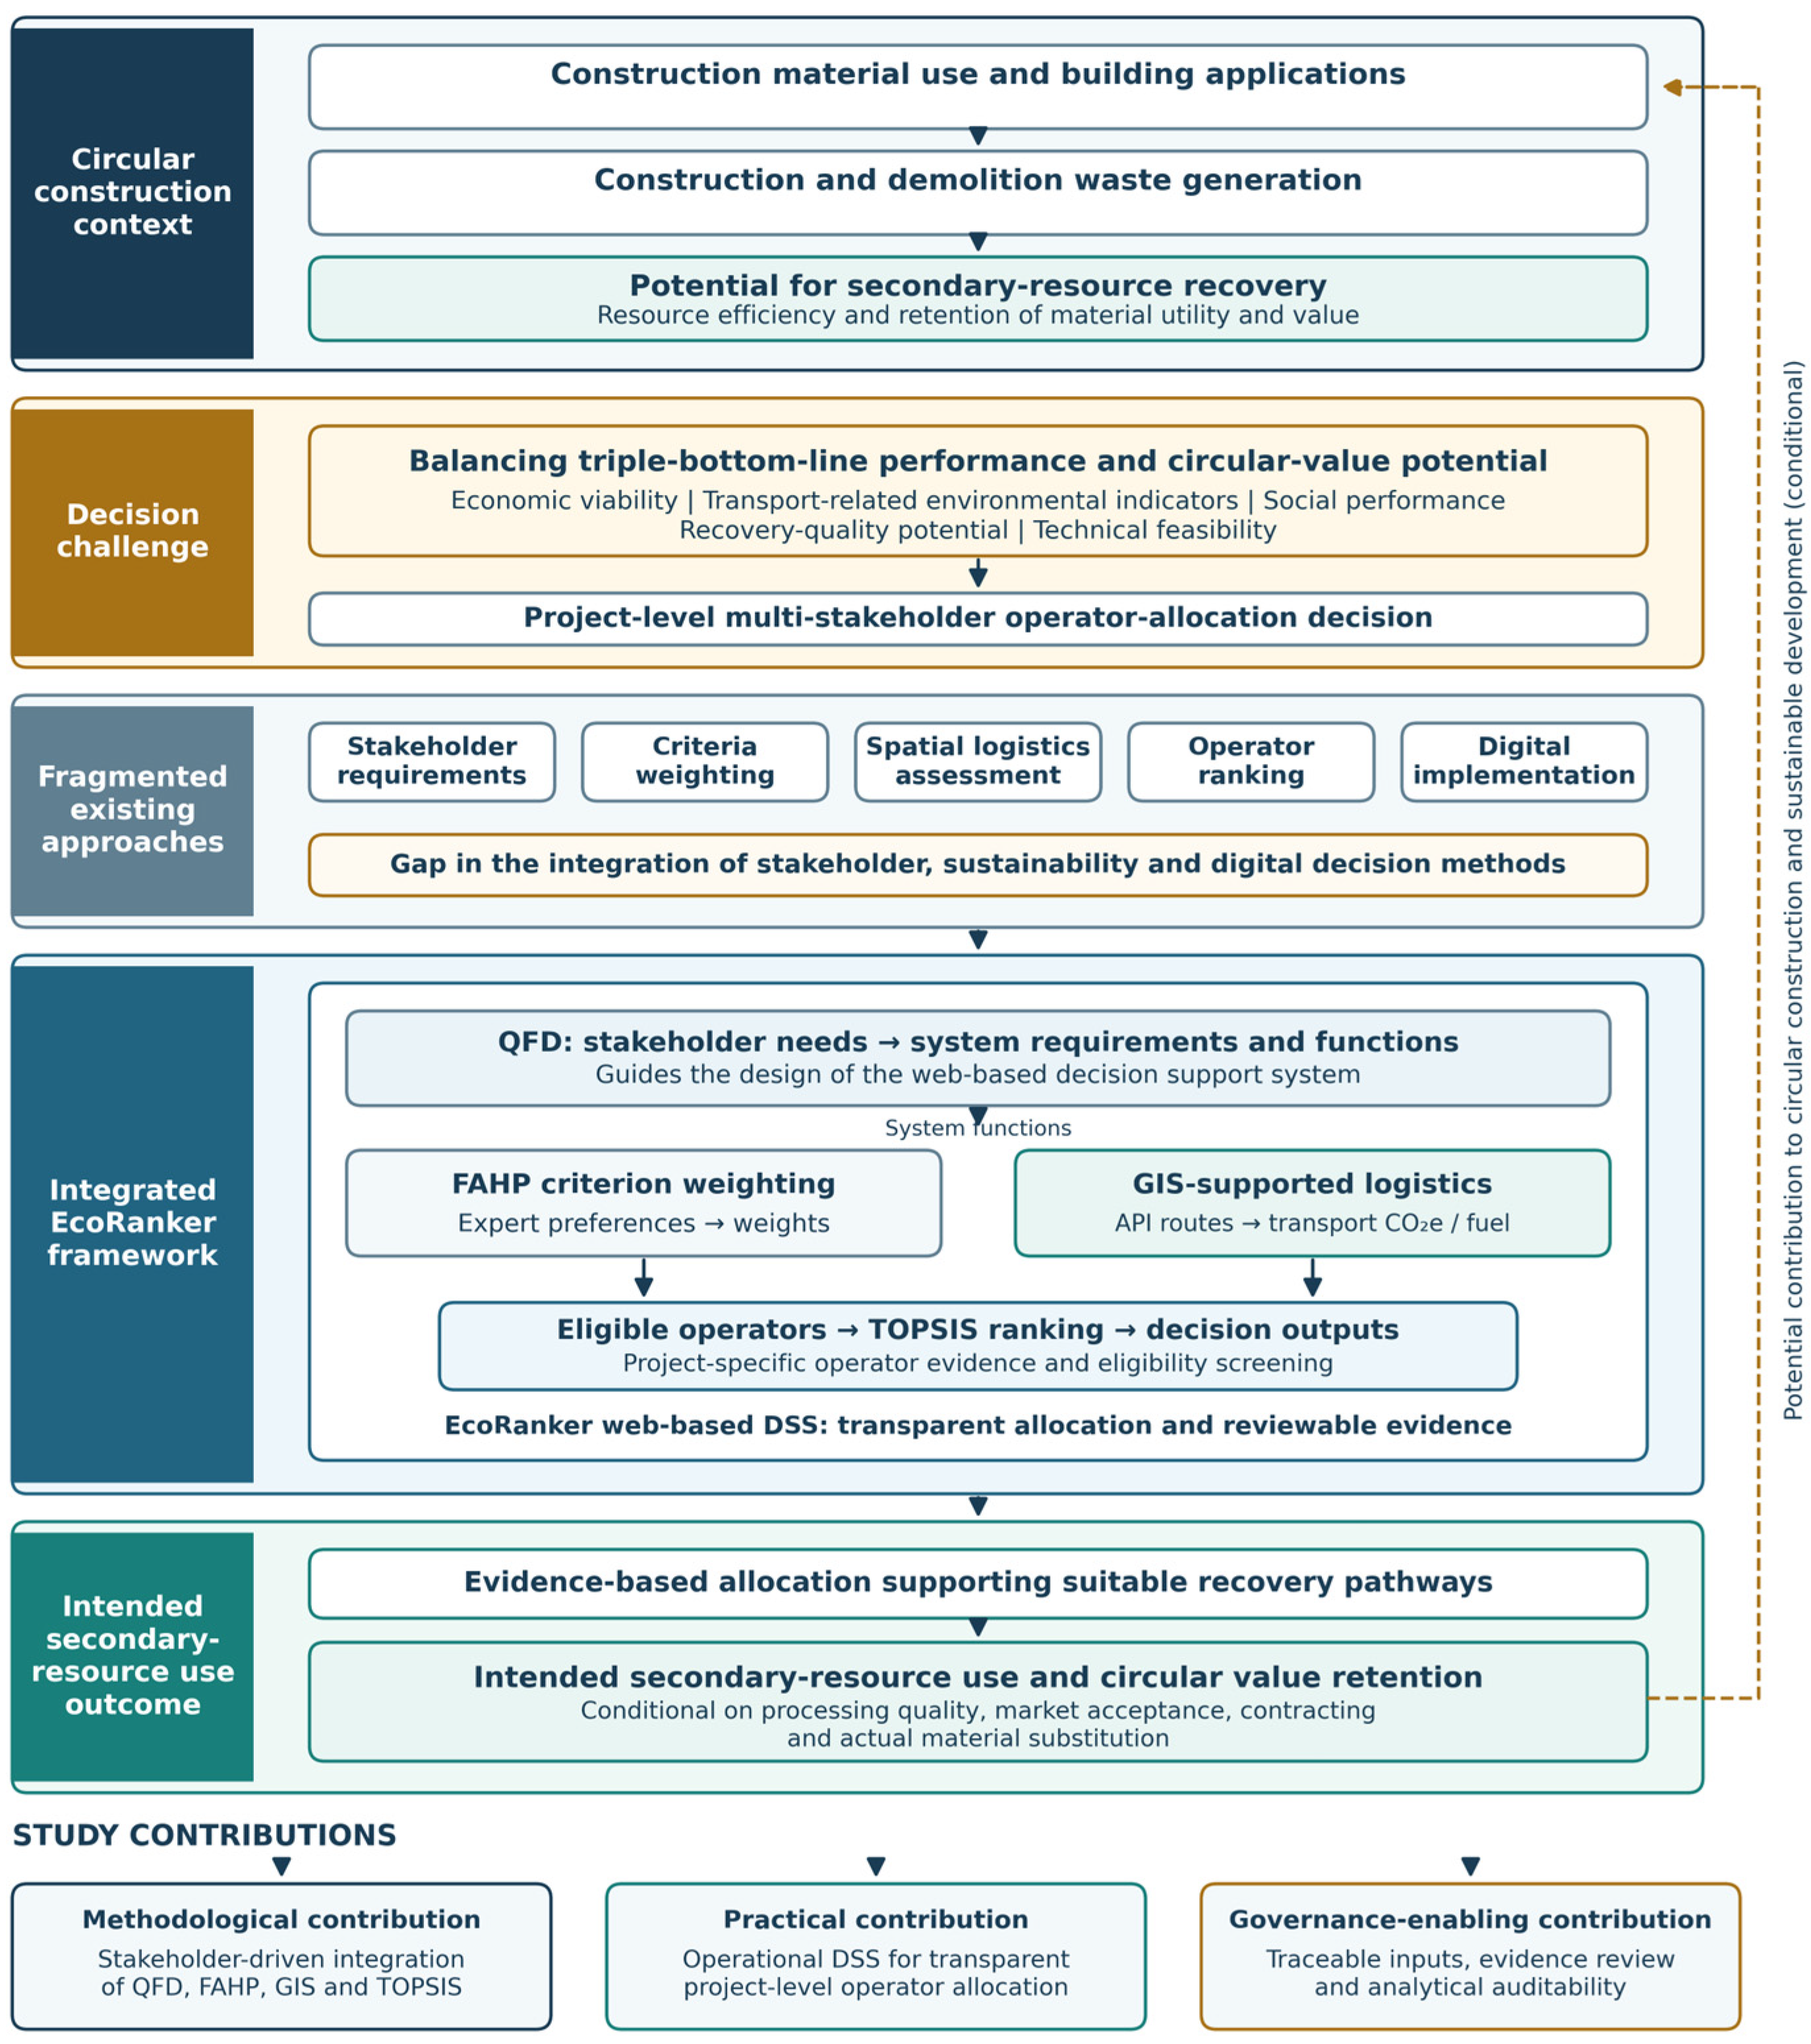
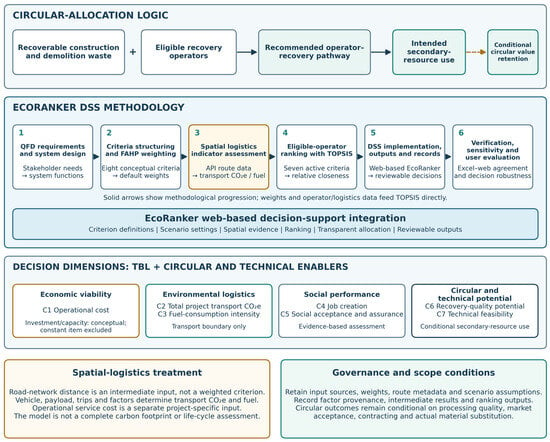
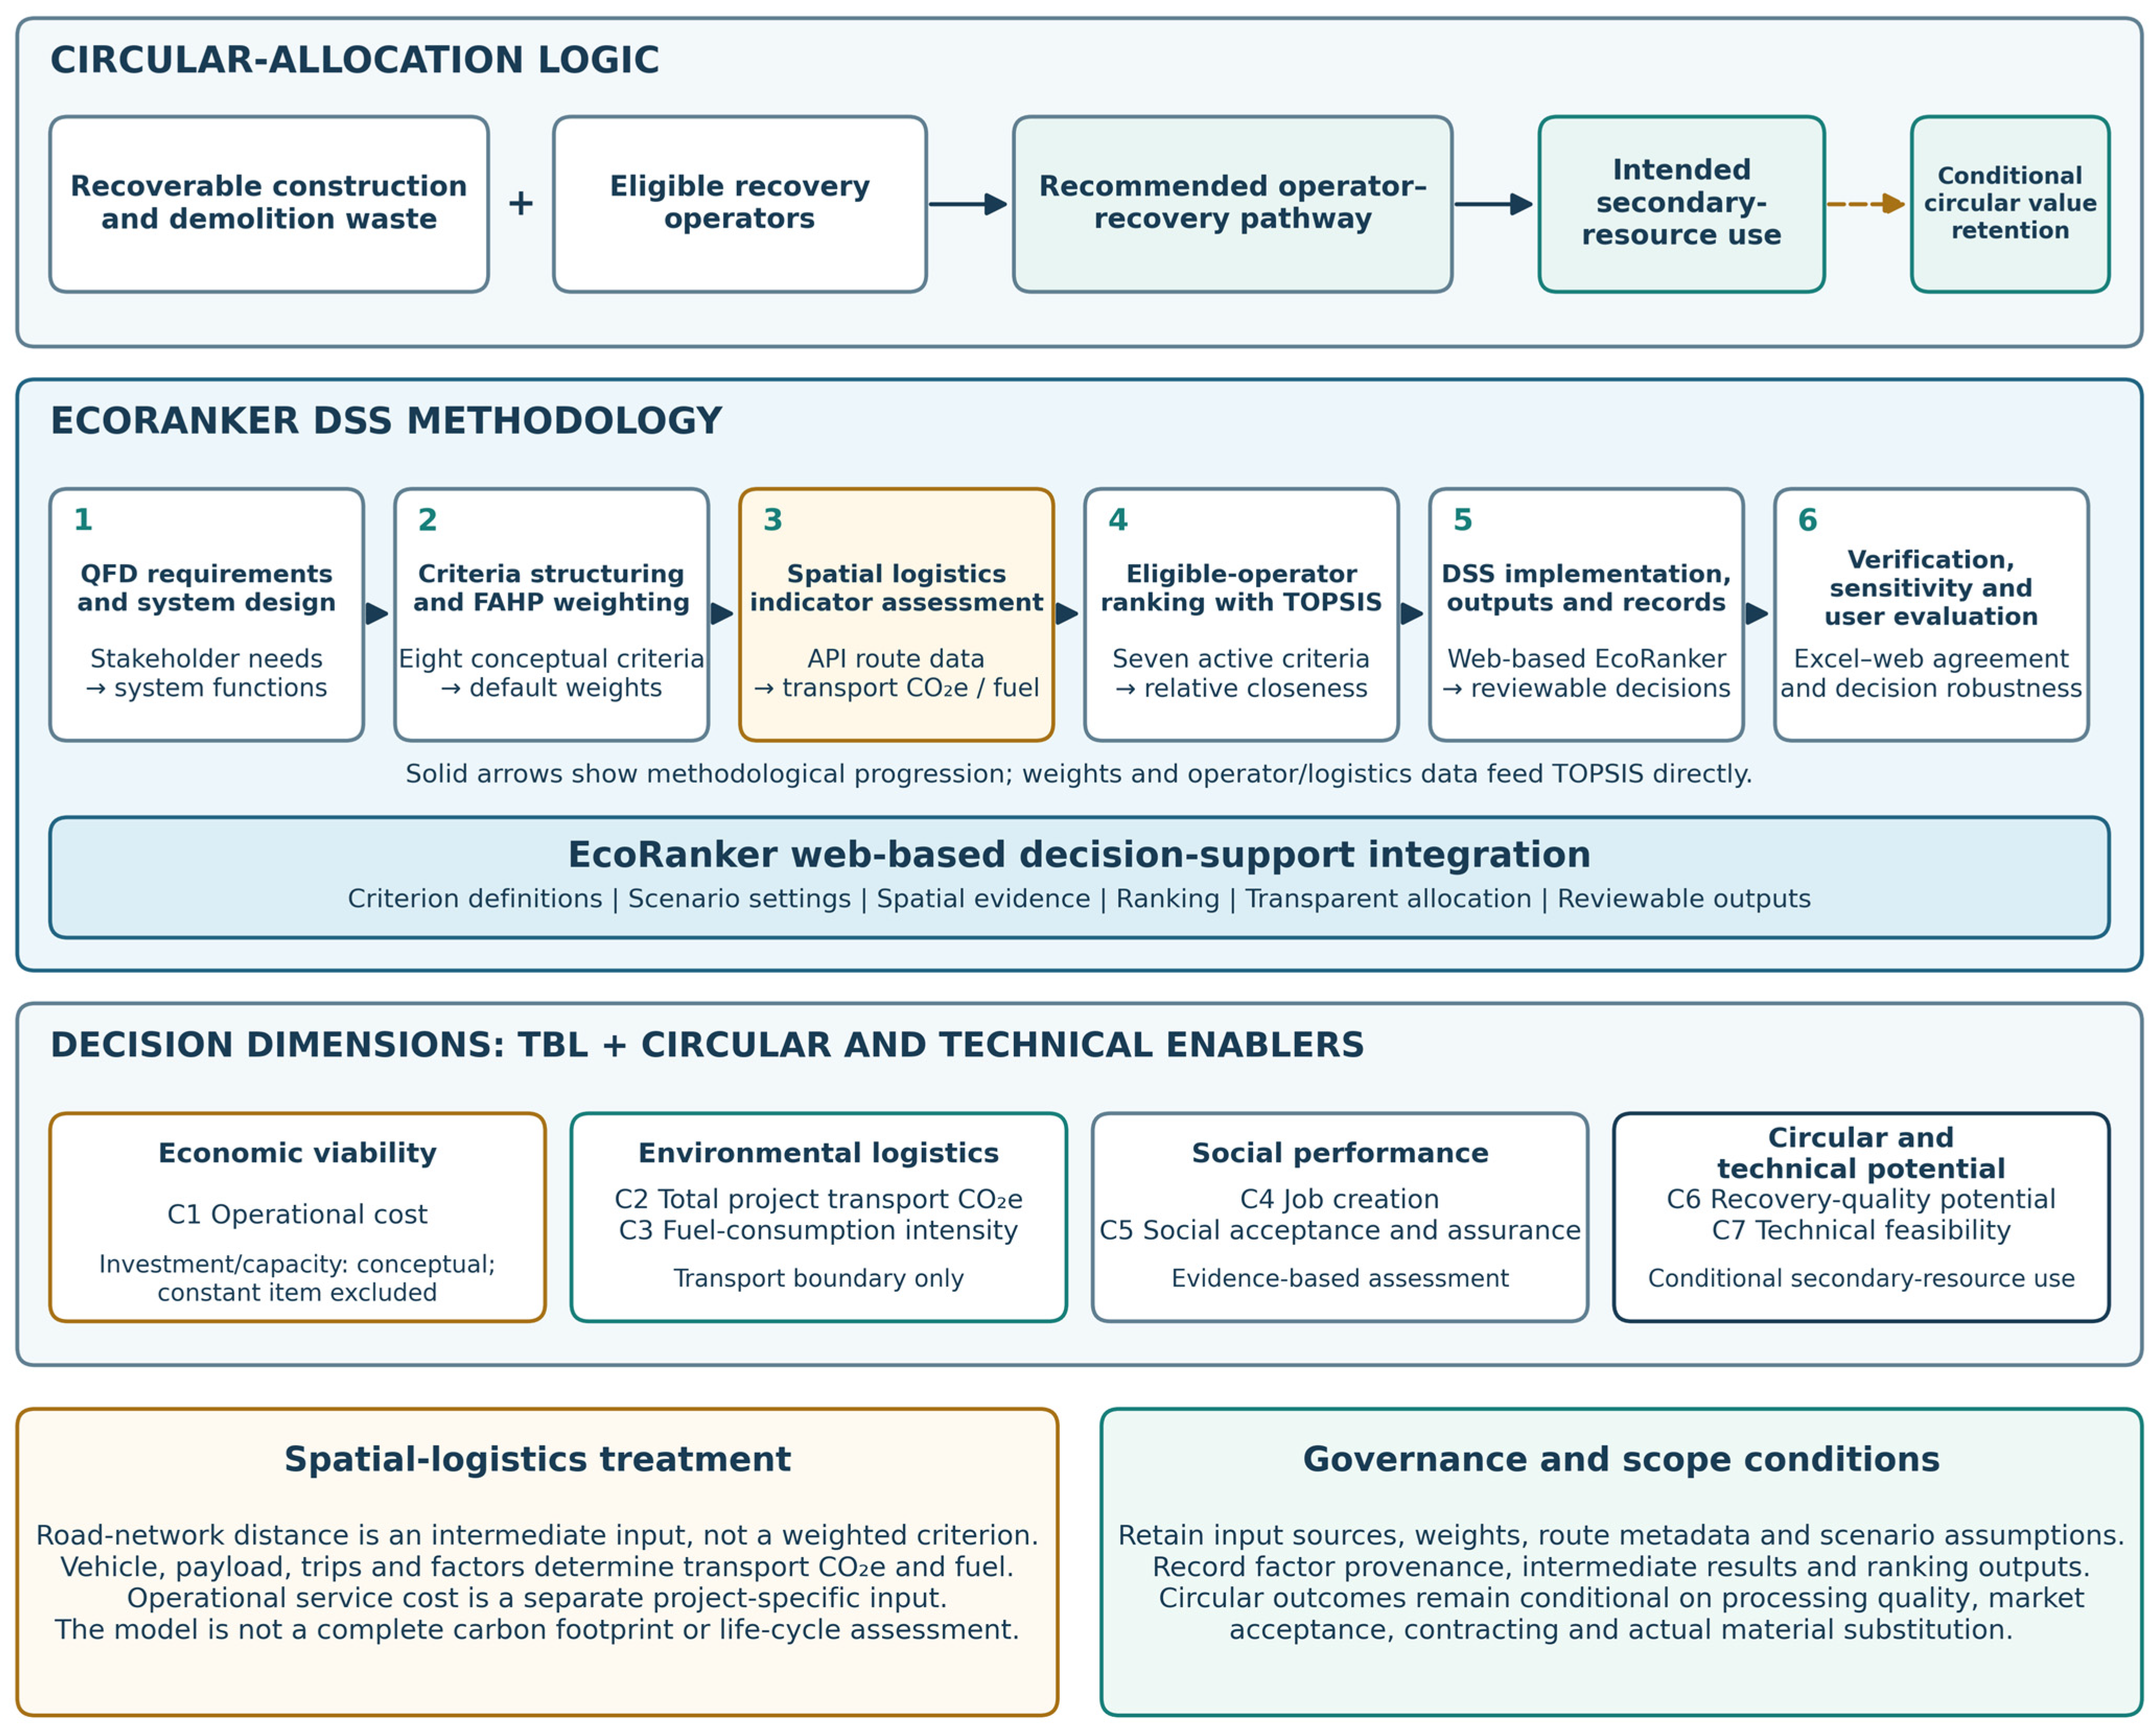
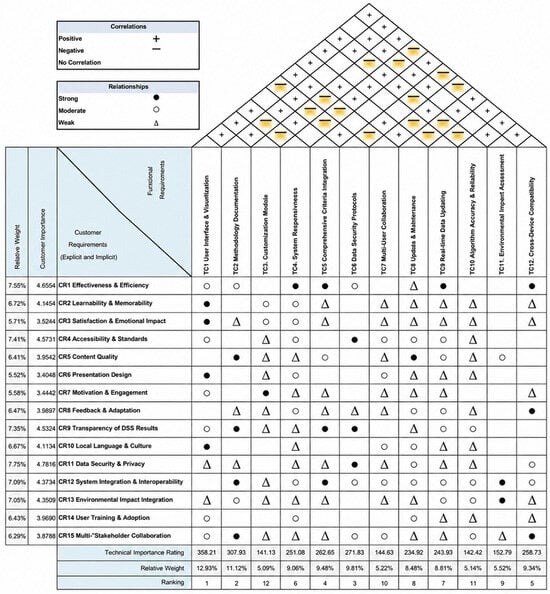
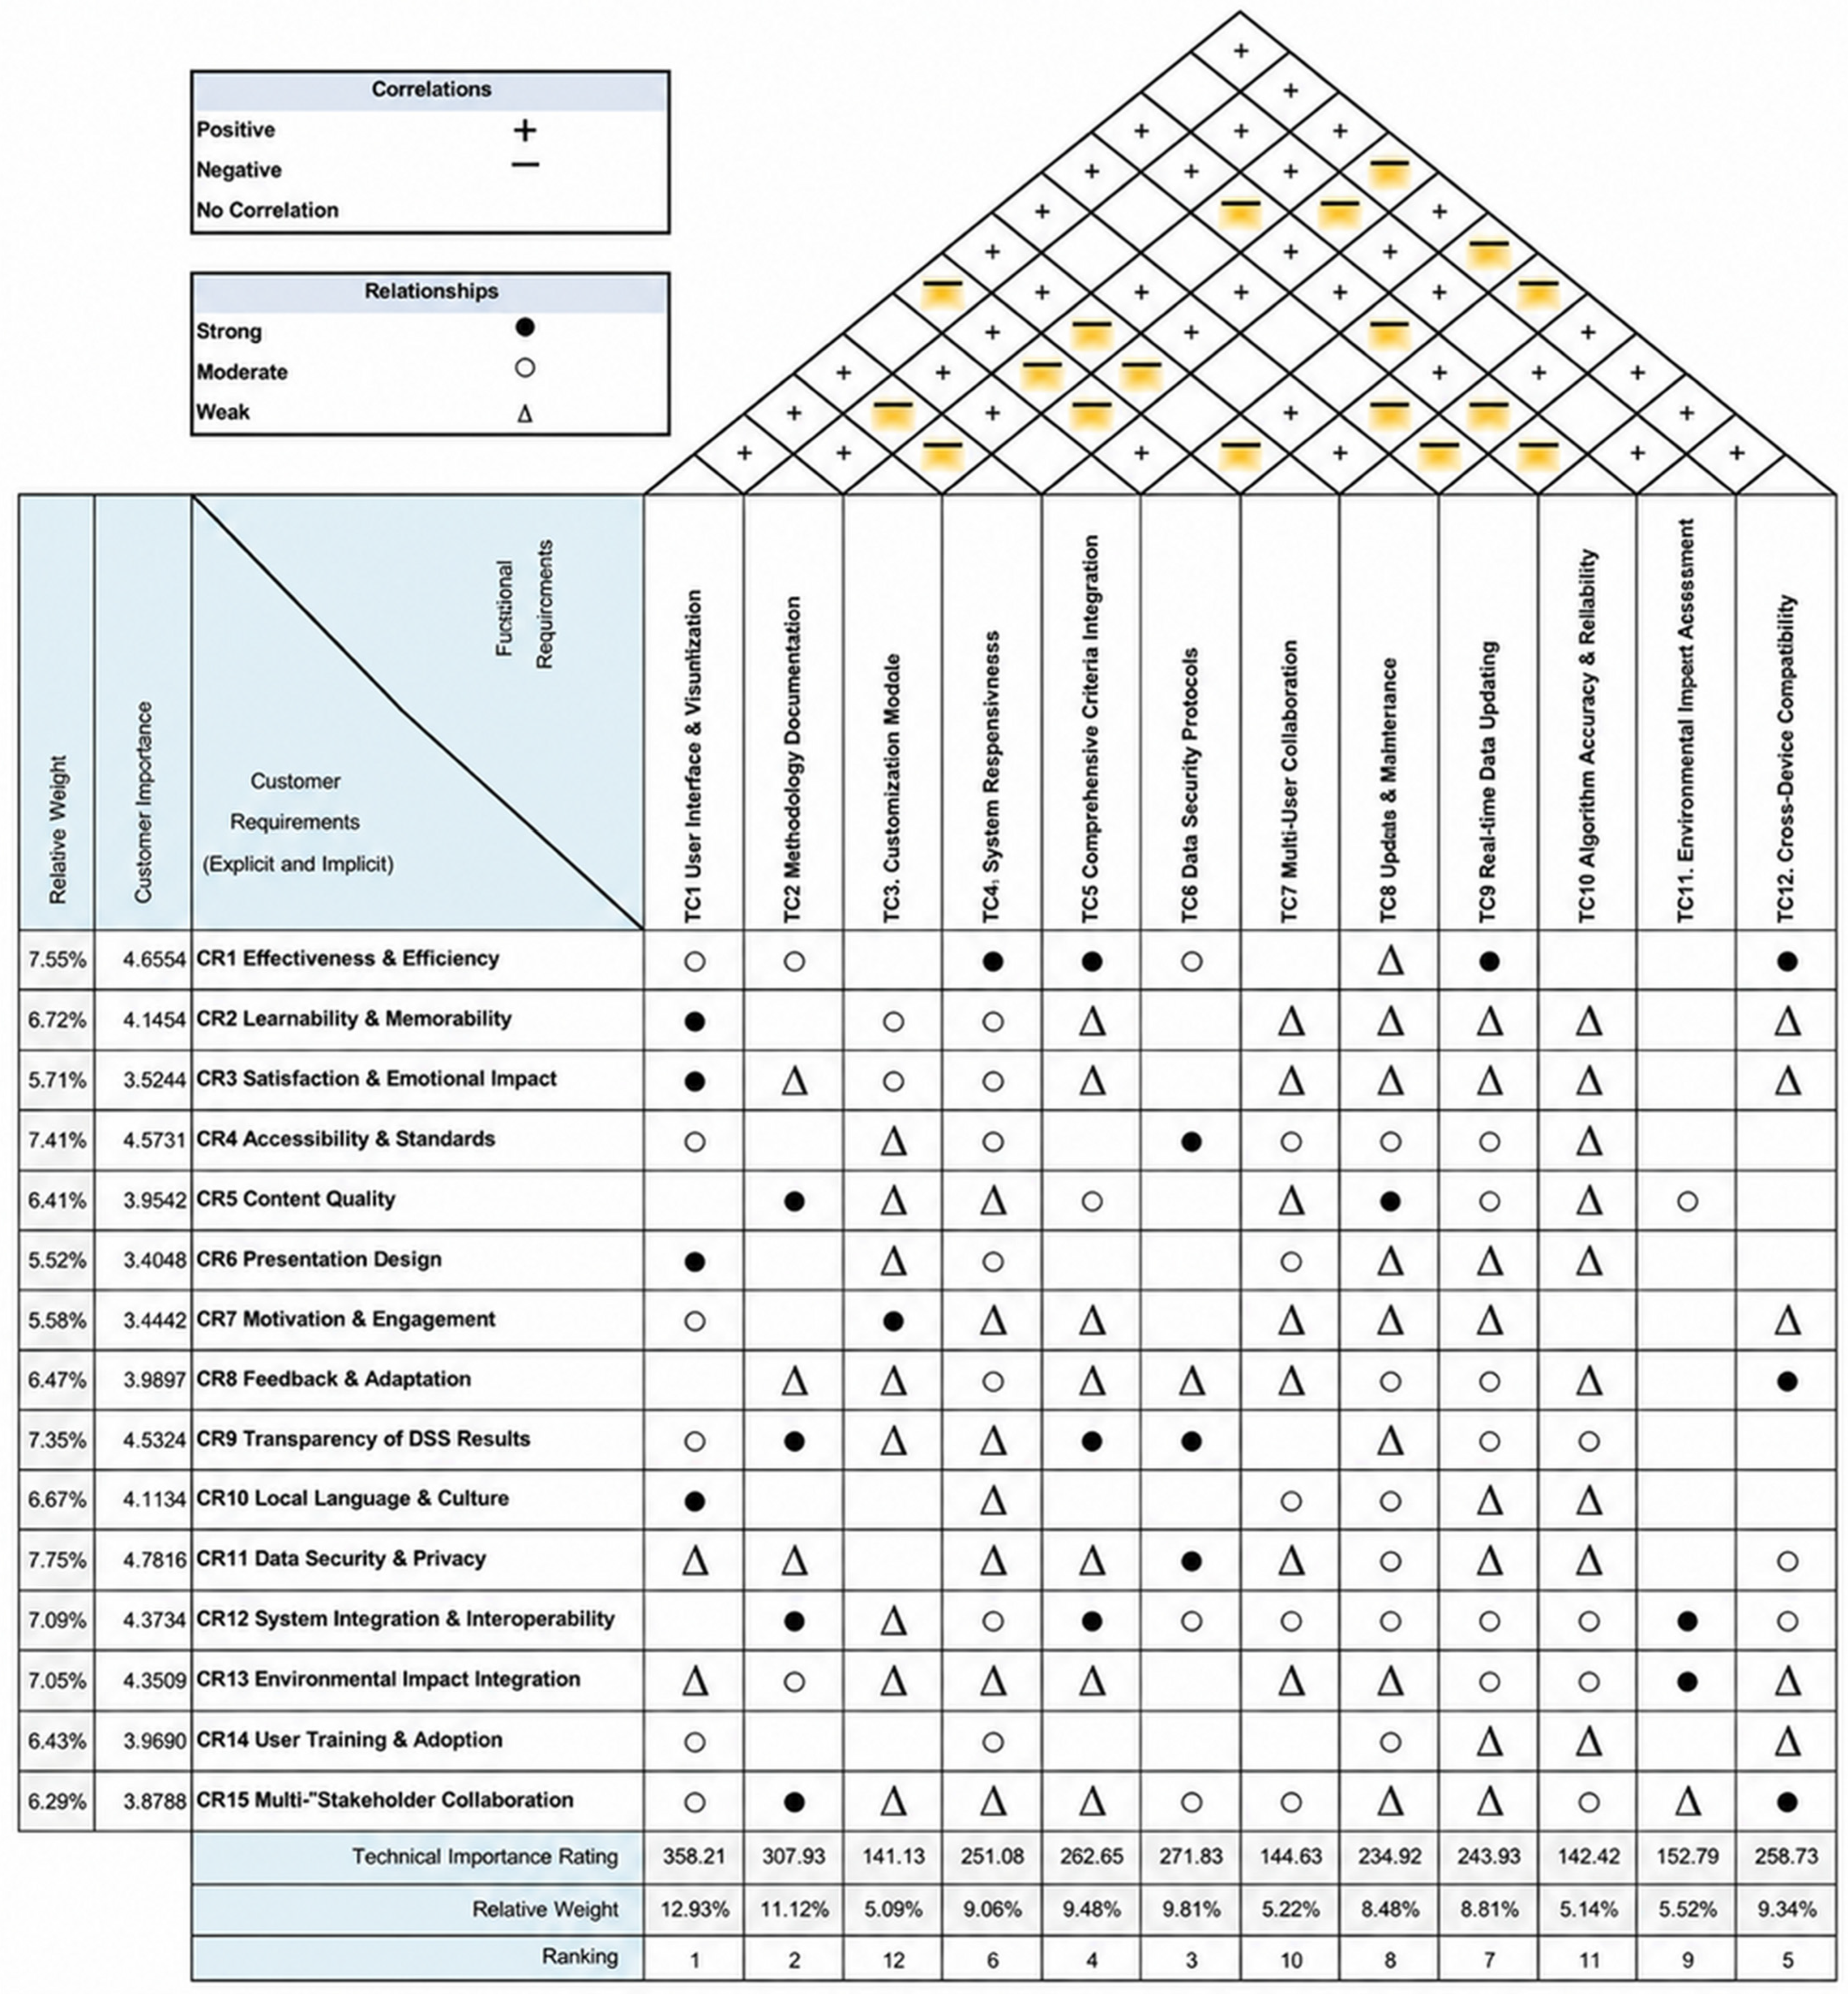
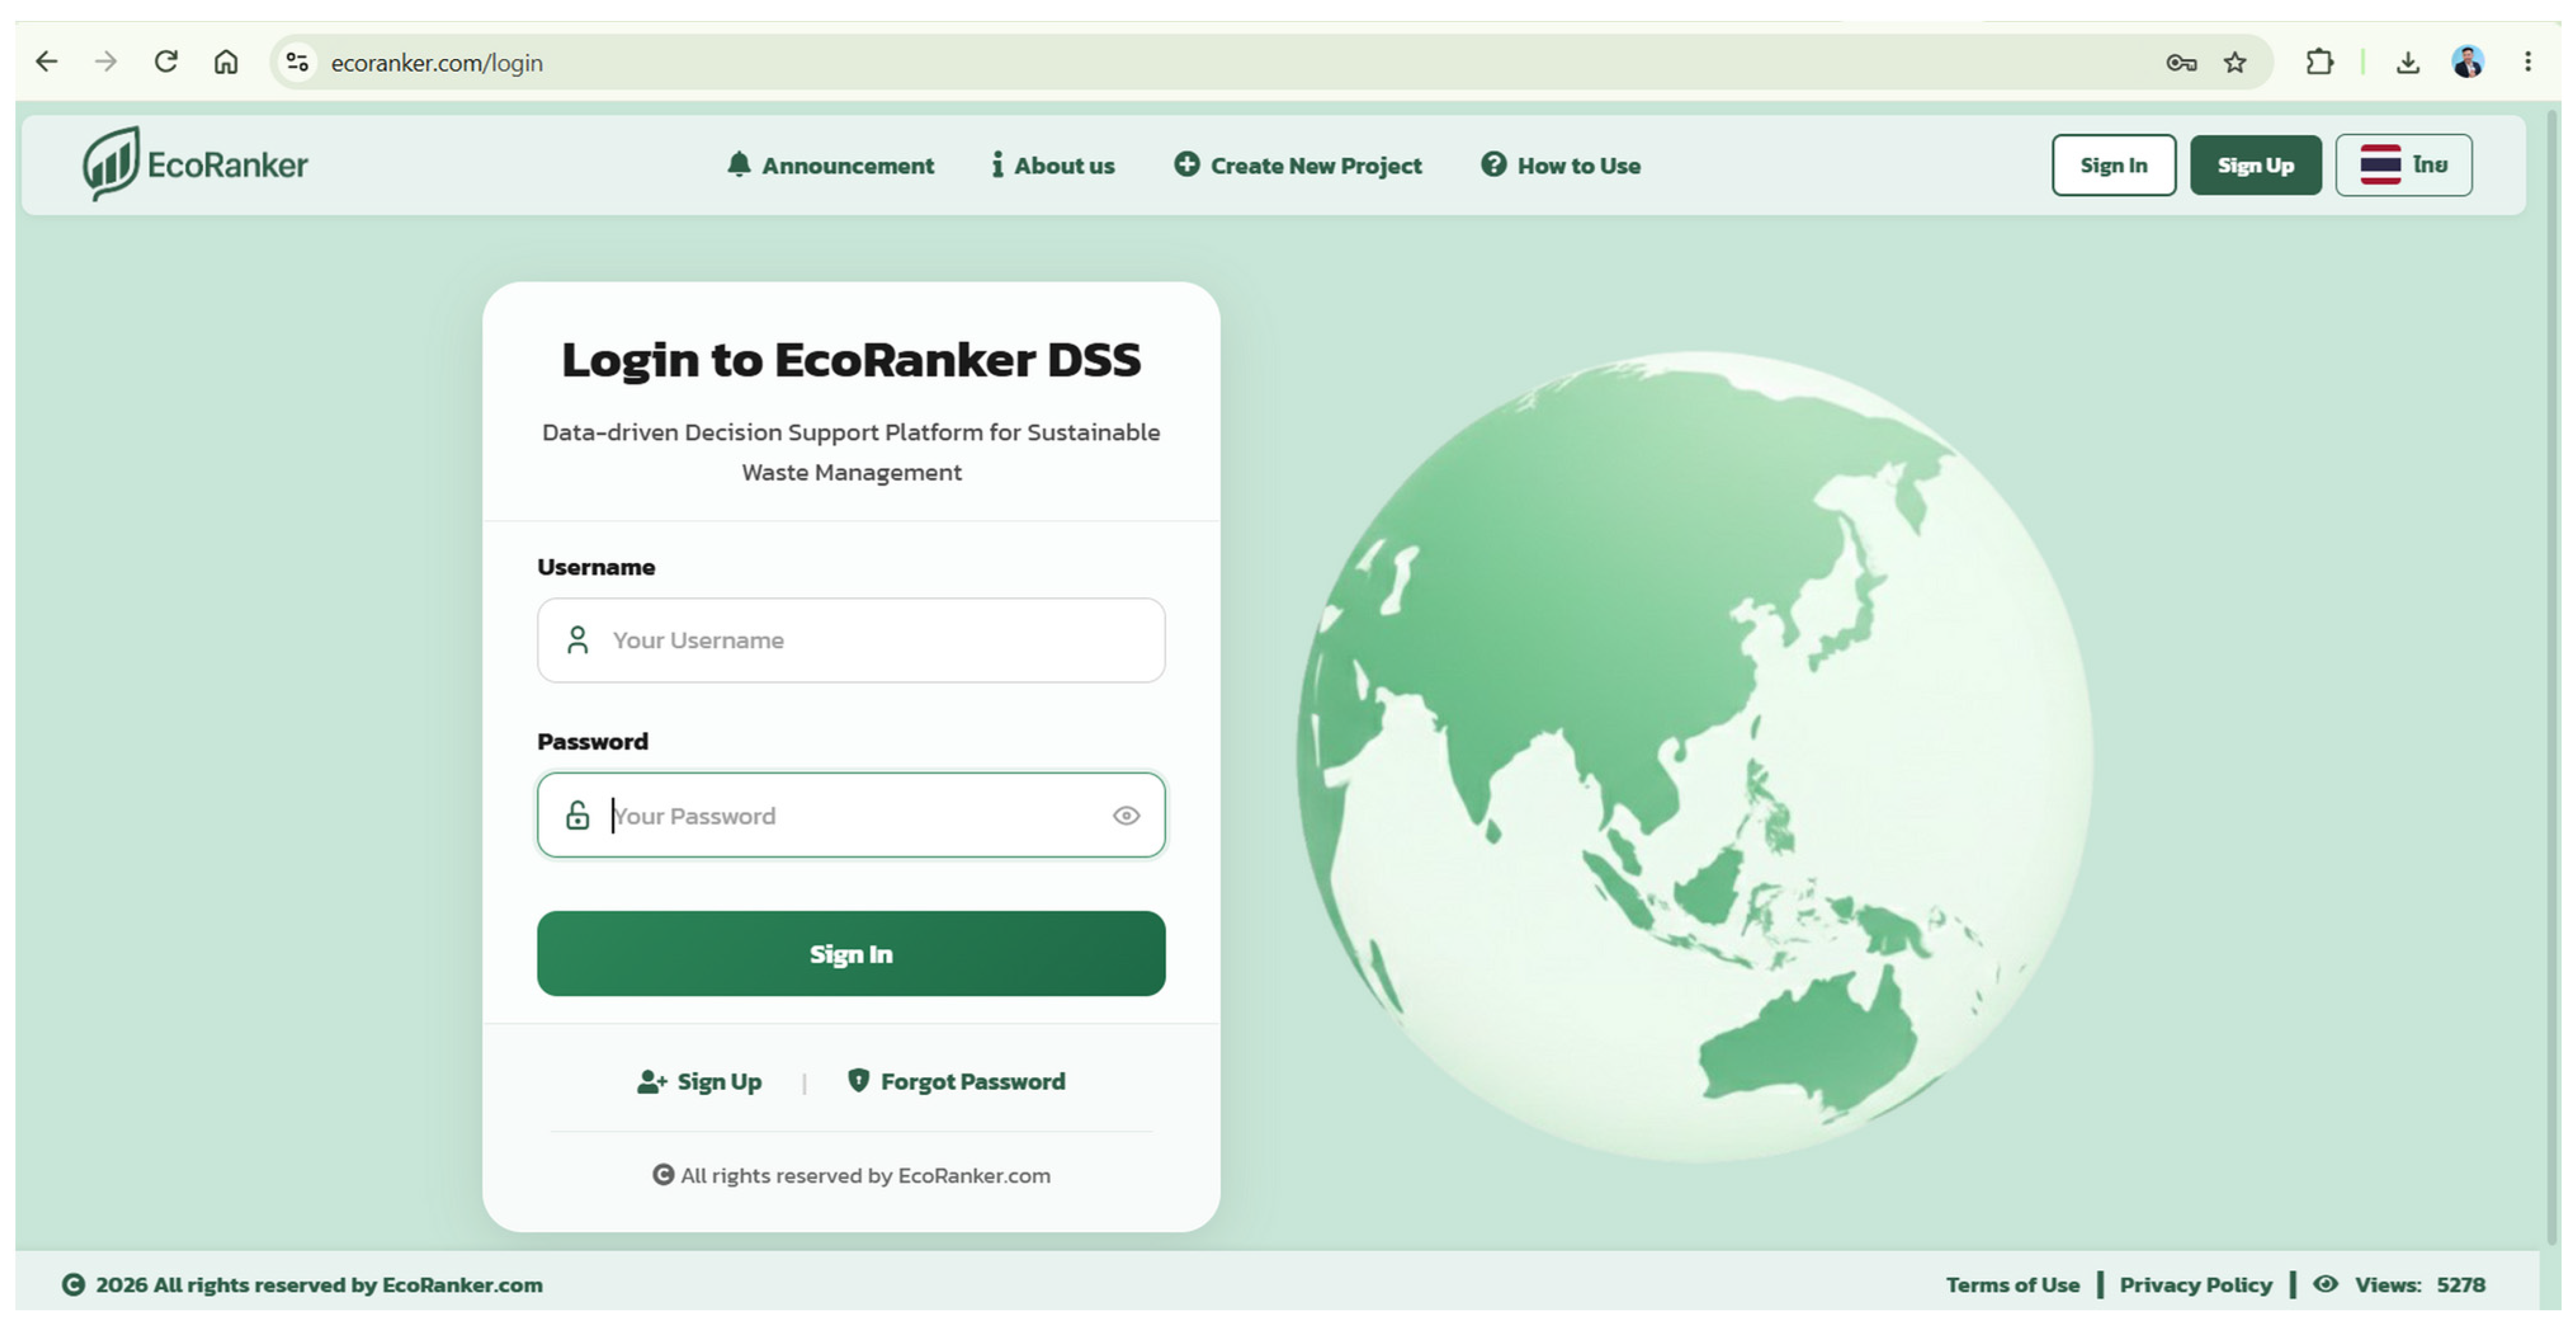
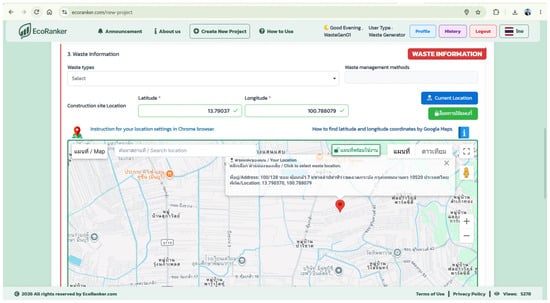
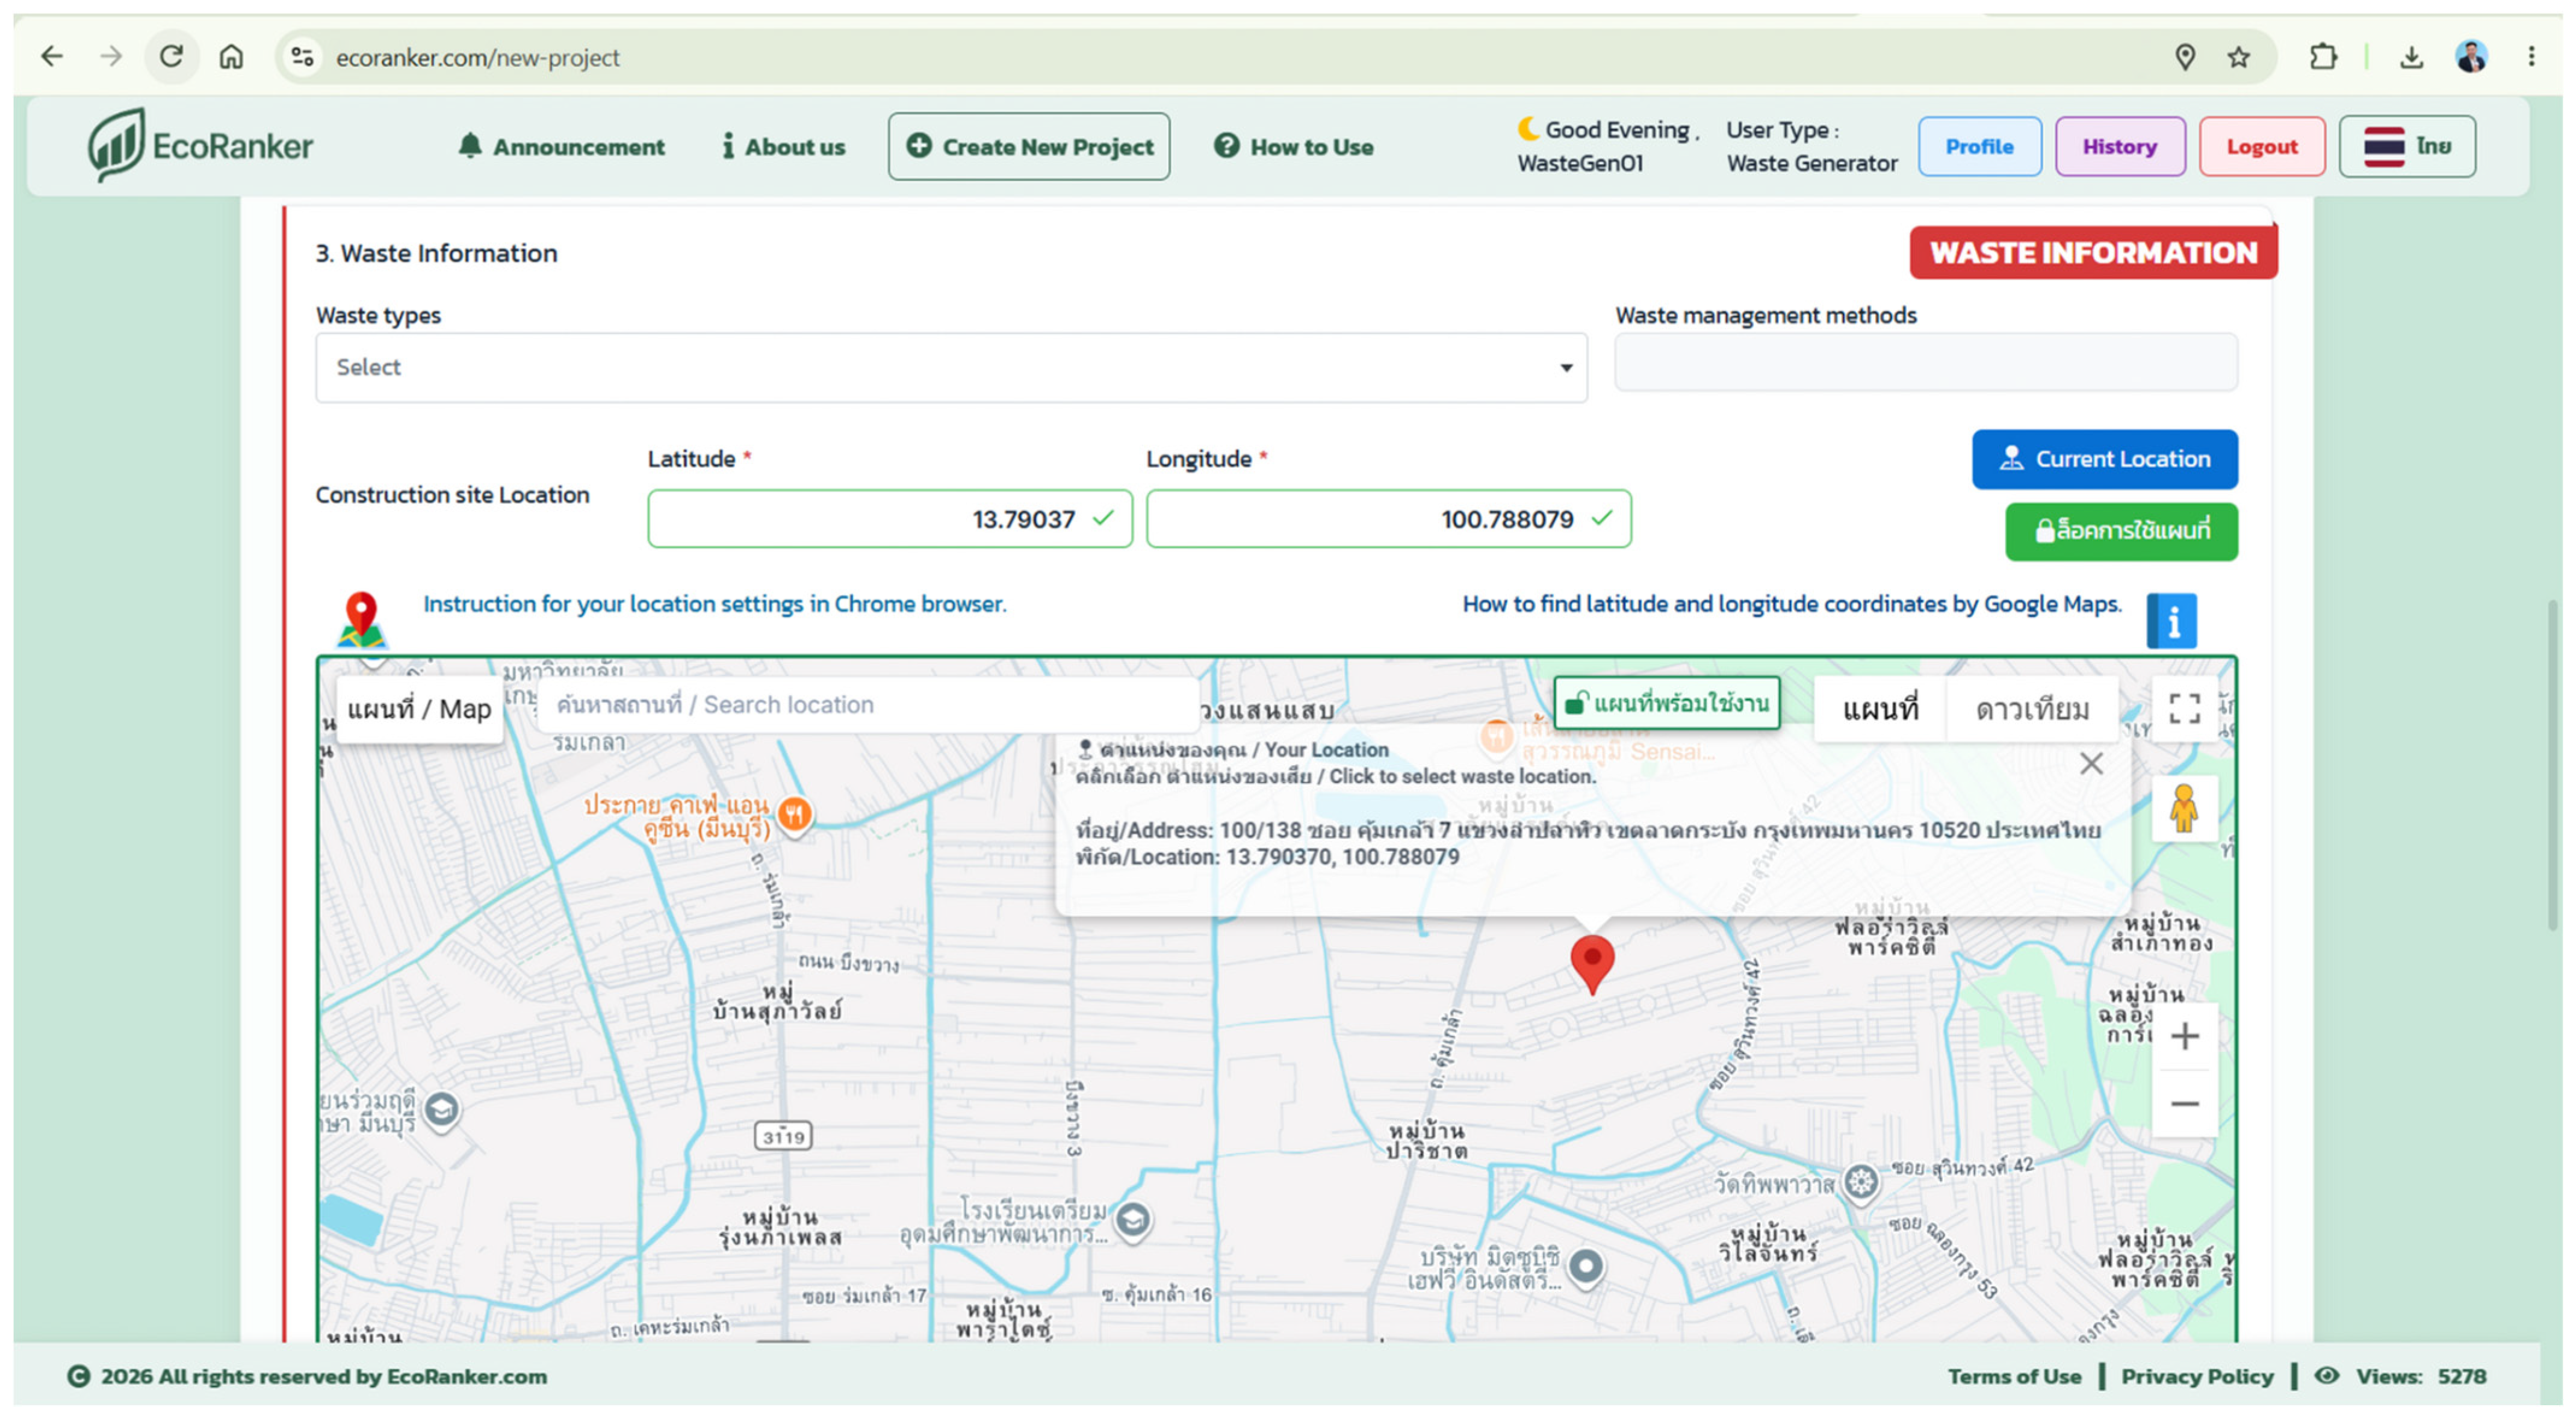
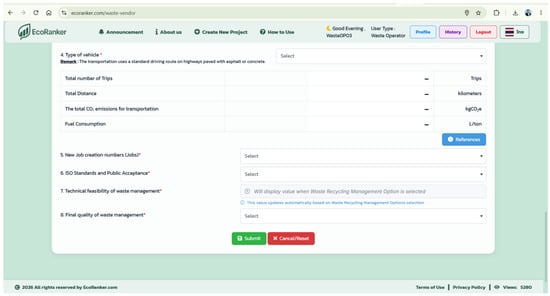
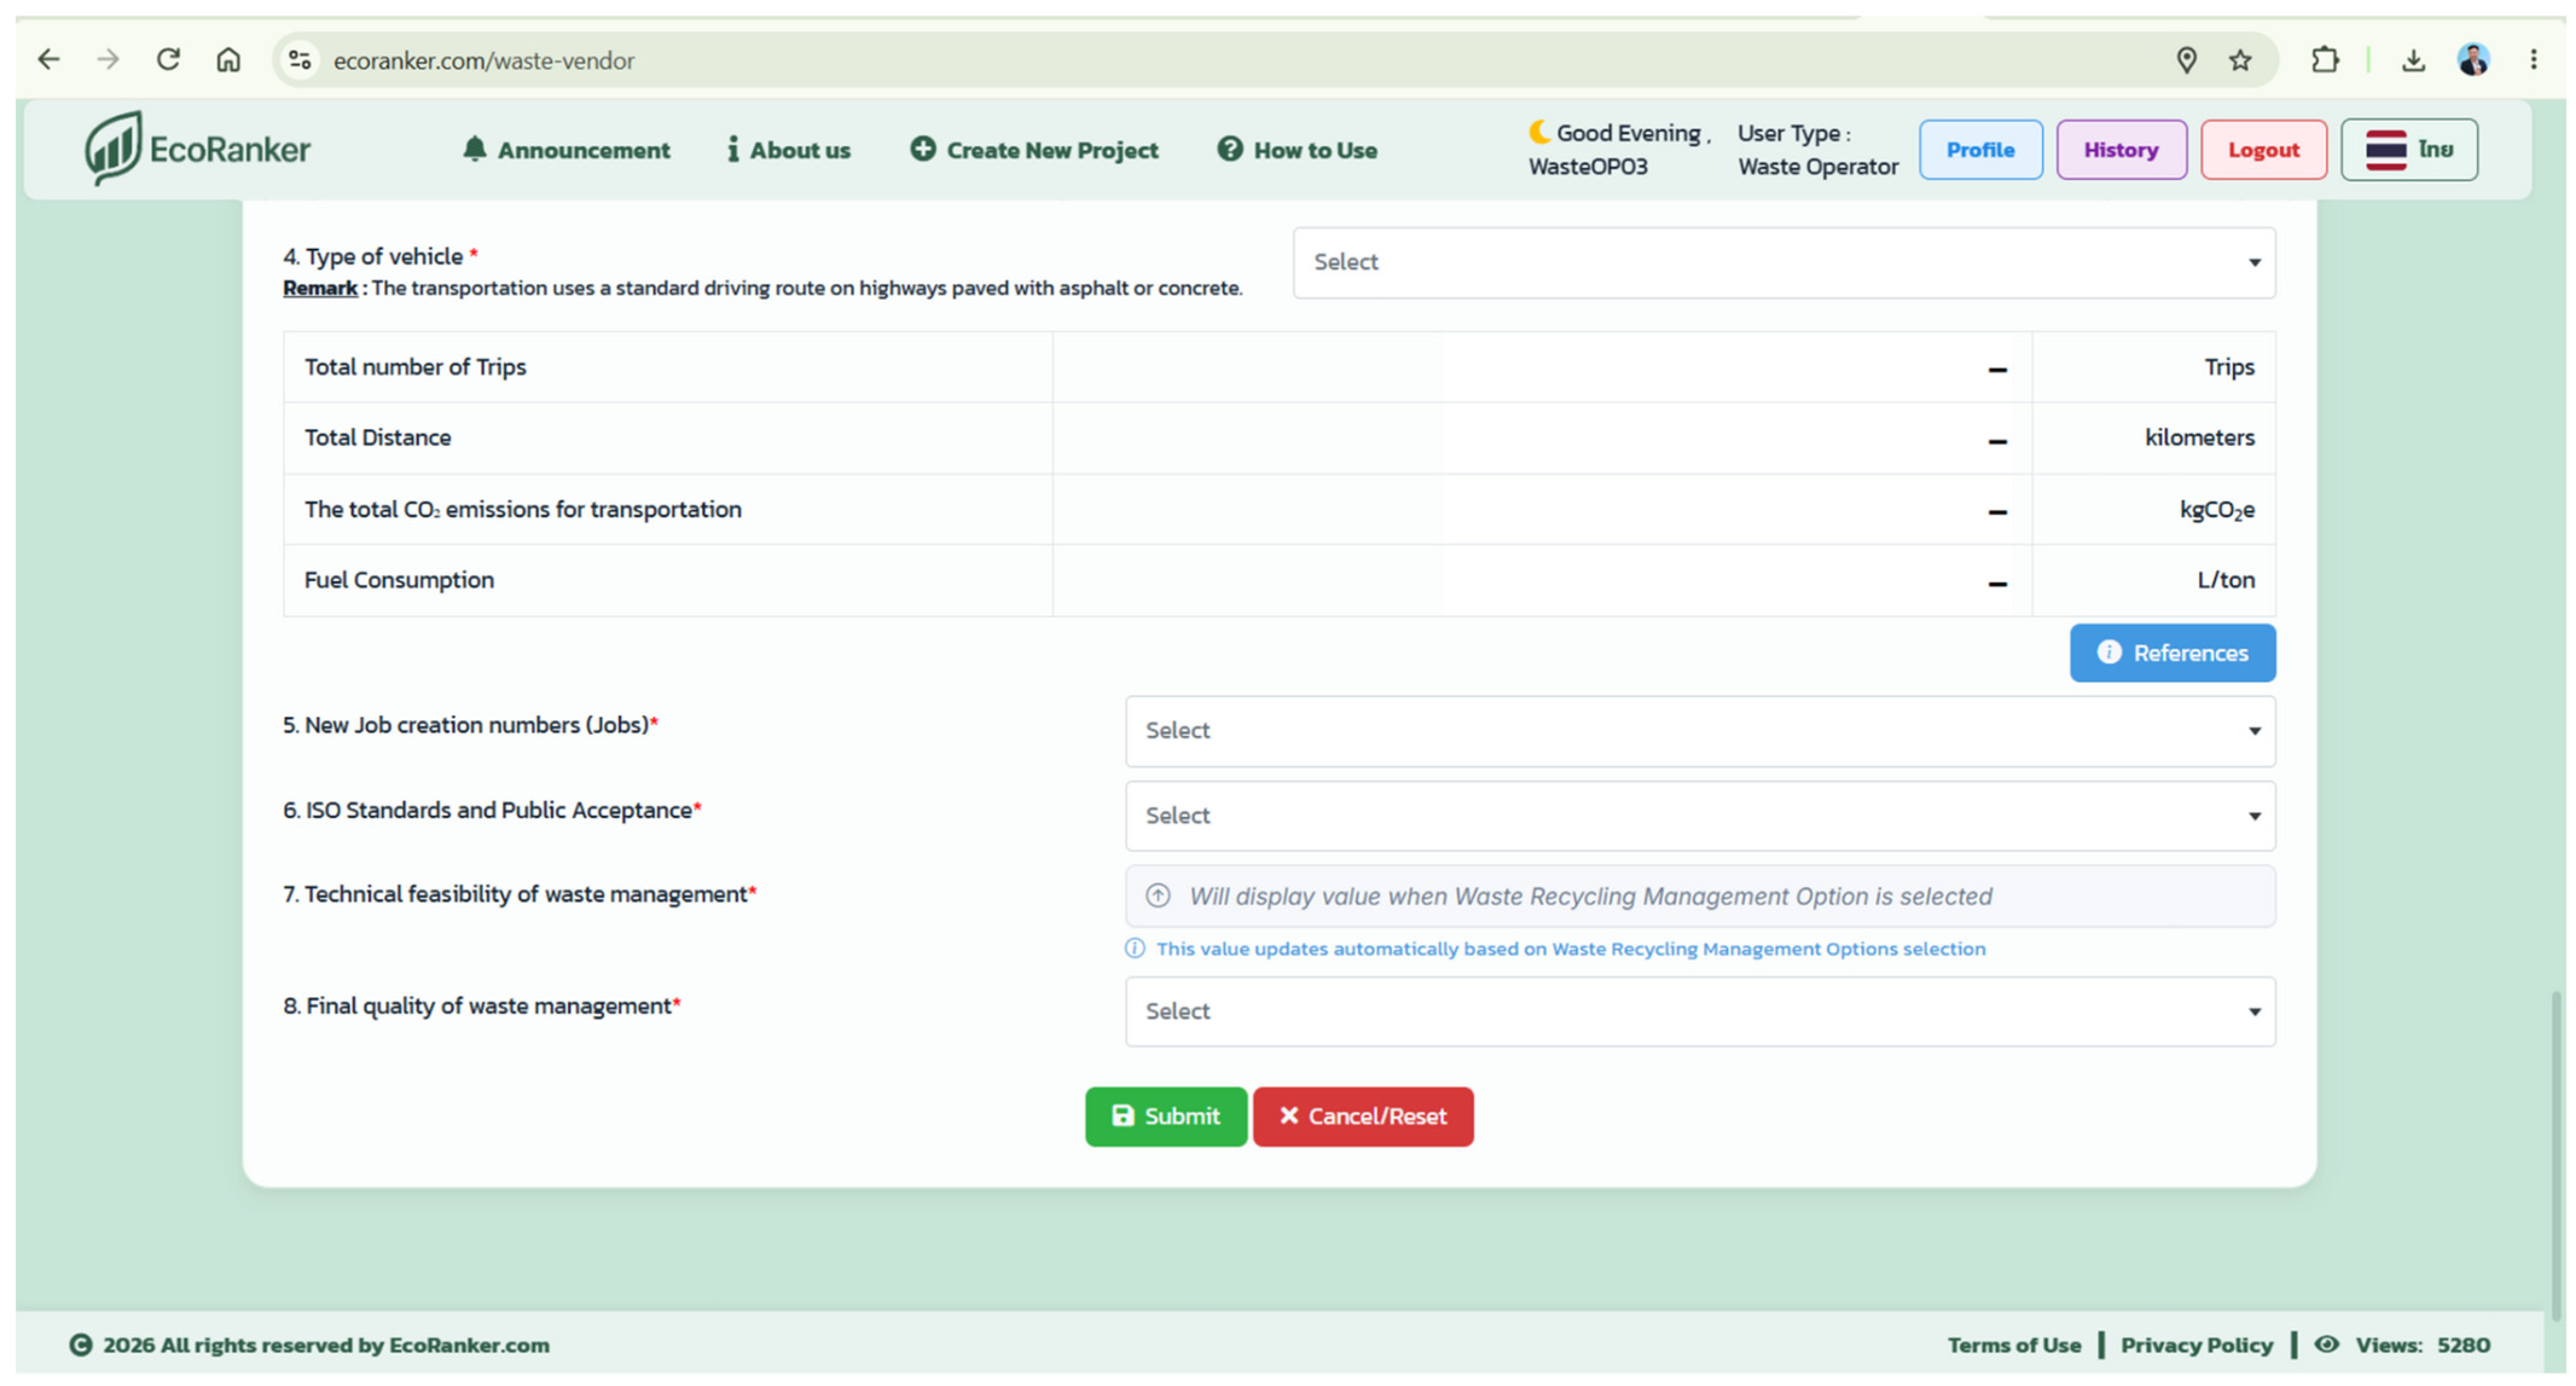
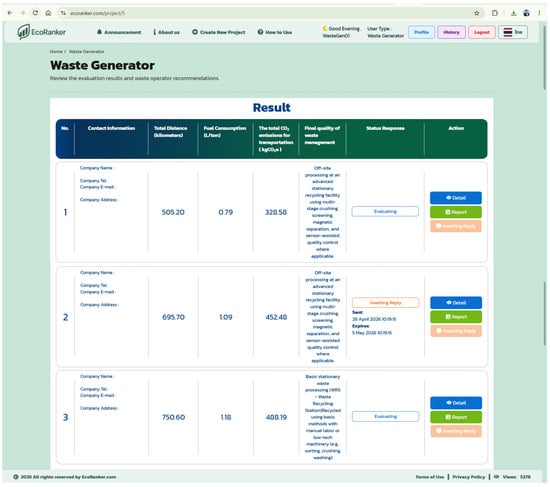
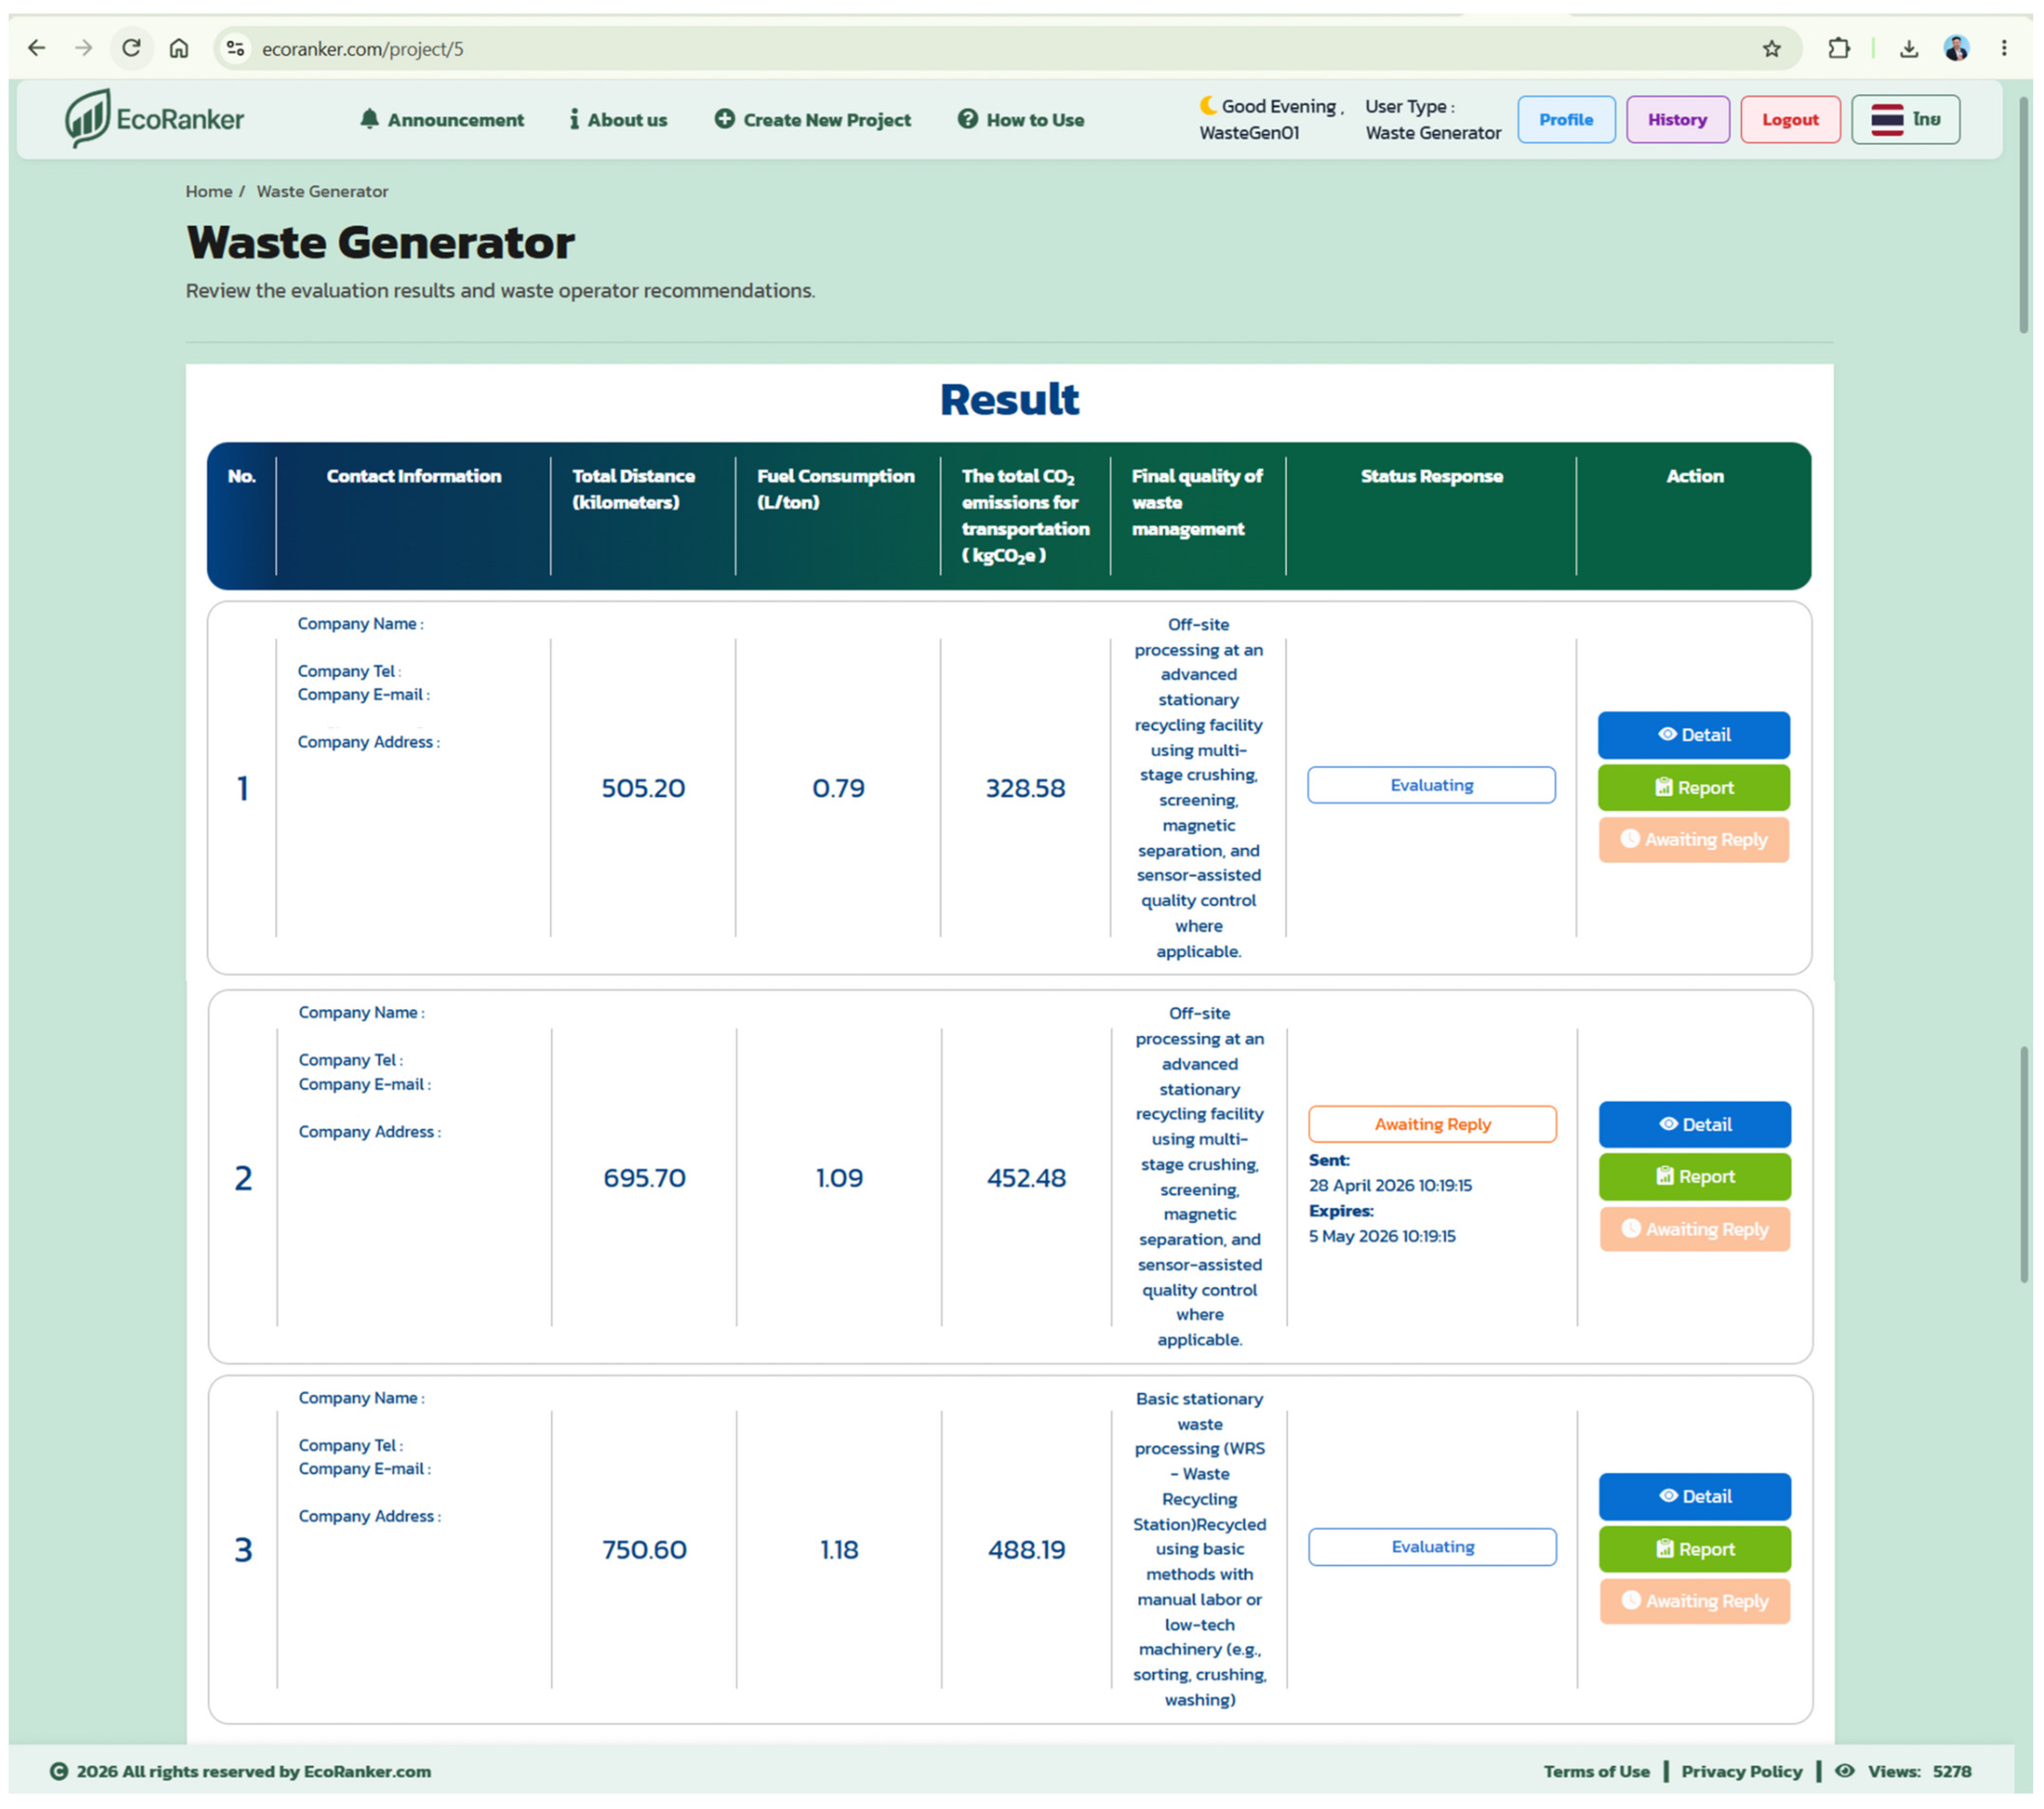

Disclaimer/Publisher’s Note: The statements, opinions and data contained in all publications are solely those of the individual author(s) and contributor(s) and not of MDPI and/or the editor(s). MDPI and/or the editor(s) disclaim responsibility for any injury to people or property resulting from any ideas, methods, instructions or products referred to in the content. |
© 2026 by the authors. Licensee MDPI, Basel, Switzerland. This article is an open access article distributed under the terms and conditions of the Creative Commons Attribution (CC BY) license.