


Abstract
Digital payment systems offer vital opportunities to democratize financial service access, yet their adoption remains constrained in cash-dominant developing economies. This study examines factors influencing the behavioral adoption intentions of general consumers in Tajikistan by extending the Technology Acceptance Model (TAM) to incorporate perceived trust, perceived risk, and perceived compatibility. Data were collected from 296 participants across urban and rural areas using a mixed-mode sampling design. Model testing was conducted using Partial Least Squares Structural Equation Modeling (PLS-SEM) and Multi-Group Analysis (MGA), validated through Measurement Invariance of Composite Models (MICOMs), Cronbach’s alpha, composite reliability, and HTMT. The model accounts for 67.4% of the variance in adoption intentions (R2 = 0.674). Perceived compatibility (β = 0.647, p < 0.001) and perceived trust (β = 0.152, p = 0.027) emerged as the primary drivers of adoption, indicating that cultural alignment and institutional legitimacy carry more weight than functional utility. Conversely, perceived risk, usefulness, and ease of use were non-significant across the overall sample. However, MGA revealed critical population heterogeneity: perceived ease of use acts as an active adoption catalyst among female adopters (Diff = 0.328, pMGA = 0.006), urban residents (Diff = 0.315, pMGA = 0.011), and higher-education cohorts (Diff = −0.269, pMGA = 0.058), while perceived trust acts as a significant stronger driver for less educated users (Diff = 0.226, pMGA = 0.087). This study offers context-specific strategic insights for building inclusive, sustainable digital ecosystems in post-Soviet Central Asia, advancing Sustainable Development Goals (SDG 1, SDG 8, and SDG 10) by distinguishing micro-level behavioral intentions from macro-level system usage.
Keywords:
sustainable development; digital payment systems; perceived compatibility; perceived risk; perceived trust; technology acceptance model JEL Classification:
G21; O33; P34
1. Introduction
Over the last decade, the global financial landscape has changed significantly due to the rapid development of Information and Communication Technologies (ICT), prompting a shift from cash to a developed digital ecosystem. Digital payment technologies—such as mobile wallets, online banking, QR codes, and contactless cards—have become a powerful alternative to cash, facilitating transactions and allowing more people to access financial services [1]. This digital transformation at a macro-development level has been an important mechanism to foster global financial inclusion and tackle the large socioeconomic digital divide. This directly supports the United Nations Sustainable Development Goals (SDGs), namely SDG 1 (No Poverty), SDG 8 (Decent Work and Economic Growth) and SDG 10 (Reduced Inequalities).
Despite the apparent global convergence toward a digital financial ecosystem, substantial regional disparities persist. Developed countries benefit from well-established regulatory frameworks and high digital literacy; however, transition economies in the post-Soviet era face deep-rooted structural impediments that slow the migration away from cash reliance [2]. Tajikistan, a landlocked country in Central Asia, presents an illustrative case of “nascent digital transformation” [3,4]. Historically, Tajikistan’s economy was based on cash, and a substantial portion of the population still remains unbanked or underbanked. To counter this, the National Bank of Tajikistan (NBT) advanced the “National Financial Inclusion Strategy 2022–2026” (NFIS), integrating numerous financial credit institutions to expand market competitiveness and modern digital services [5].
According to the National Bank of Tajikistan reports, the implementation of the NFIS resulted in an 11-fold increase in customers accessing accounts via mobile phones or the Internet, a 14% increase in electronic point-of-sale (POS) terminals, and a 260% increase in customers making or receiving digital payments [5]. However, top-down infrastructure deployment contrasts with actual consumer adoption patterns. As of mid-2025, cash accounted for 71.8% of all transactions in Tajikistan, with cashless payments accounting for only 28.2%. This demonstrates the clear disparity between the growth of technological infrastructure and the rate at which consumer behaviors change. Furthermore, according to FinDev Gateway’s regional data, 55% of adults in Tajikistan have an account, leaving 45% fully unbanked [6].
This adoption friction is increased by infrastructural constraints (particularly the uneven distribution of network coverage and operating expenses), as well as deep-rooted psychological hurdles such as anxieties about transaction security and operational failures [7,8,9].
The traditional Technology Acceptance Model (TAM) developed by Davis [10], states that Perceived Usefulness (PU) and Perceived Ease of Use (PEU) are the primary determinants influencing technology adoption. However, empirical data obtained under conditions of high economic uncertainty show that the simplicity of the original TAM limits its capacity to capture the multi-dimensional nature of financial technology adoption [11]. In Tajikistan, the adoption process is significantly affected by psychological barriers, including Perceived Risk (PR) and a critical need for Perceived Trust (PT) in institutional digital systems [8].
There remains a need for empirical research examining how Perceived Compatibility (PC)—the degree to which innovations correspond to established cultural values and daily practices—interacts with Trust and Risk to shape behavioral intentions in transition economies. This study aims to address this gap by developing an augmented TAM paradigm tailored to the socio-economic context of Tajikistan. The expanded approach focuses not only on technical model validation, but also on the strategic design of information systems to bridge the urban–rural digital divide and promote inclusive financial inclusion. By expanding the traditional model, its core focus on usefulness and ease of use [10] is complemented by integrating Perceived Trust (PT), Perceived Risk (PR), and Perceived Compatibility (PC) [11]. The research is structured around three main questions:
- How does perceived risk influence digital payment adoption intention in Tajikistan?
- What is the impact of perceived trust on customer willingness to adopt fintech solutions?
- How does perceived compatibility with daily habits and cultural norms influence usage intention?
To provide a rigorous analytical framework, demographic factors including age, education, and income are incorporated as control variables within the model [12], ensuring a comprehensive evaluation of user heterogeneity.
Consequently, this study offers both theoretical and practical significance for macro development and information systems literature. Theoretically, this study offers significant value by extending the Technology Acceptance Model (TAM) into an under-represented transition economy and combining trust and risk components [13,14] with Moore and Benbasat’s [15] concepts of compatibility to assess cultural norm congruency. In particular, the theoretical model shows that Perceived Compatibility (PC), together with Perceived Trust (PT) and Perceived Risk (PR), is an important cognitive link in a cash-based economy like Tajikistan [16]. Descriptive data and transition-economy studies show that institutional trust serves as a buffer against perceived risk [17]. Formal mediation testing between trust and risk represents an important trajectory for future empirical verification, ensuring the current model avoids unverified causal claims. This expands the academic boundary scope of TAM from mere interface characteristics to broader cultural alignment, trust architectures, and systemic pathways to financial inclusion.
The results furnish empirical evidence for financial entities and developers striving to enhance digital financial uptake. With the increasing prevalence of electronic wallets and cashless transactions, local financial institutions recommend that service providers incorporate their systems into everyday transactional activities and enhance user safeguards. Moreover, public–private financial literacy initiatives might utilize focused marketing strategies to address behavioral stagnation, hence fostering inclusive development within at-risk communities [5]. Significantly, although these results contribute to methods for financial inclusion, the research’s empirical focus is confined solely to the analysis of behavioral intentions.
2. Theoretical Background and Hypothesis Development
2.1. Digital Payment Adoption: Global Trends vs. Central Asian Realities
The ubiquity of digital payment systems (DPSs) has led to numerous studies on increasing access to financial inclusion and consumer behavior [18]. In developed markets, the main determinants of the adoption of new technologies are typically perceived ease of use and perceived usefulness [10]. However, the situation is considerably more nuanced in developing countries and transition economies, where it is necessary to take into account external environmental factors such as the legislative framework, infrastructure development and the level of digital literacy [2]. Therefore, enhancing digital information systems in these areas contributes to an important macro-development goal: eliminating systemic barriers to financial inclusion, bridging the wide urban–rural digital divide, and laying the foundation for attaining United Nations Sustainable Development Goals (SDGs), especially SDG 1 (No Poverty) and SDG 10 (Reduced Inequalities).
Tajikistan’s financial landscape is adversely affected by three main factors: a significant informal cash economy, a large digital disparity between rural and urban regions, and an underdeveloped banking sector. These structural limitations confine a significant segment of the population within a post-Soviet, cash-oriented historical framework, presenting a major obstacle to regional economic integration. Although research focuses heavily on macro-level fintech institutional innovations, it often overlooks the micro-level consumer psychology governing Tajik customers. Understanding these localized determinants is important for moving toward a formal digital economy, offering a strategic pathway to expand financial inclusion to marginalized demographic groups.
2.2. Theoretical Foundation: The Augmented Technology Acceptance Model (TAM)
The Technology Acceptance Model (TAM), developed by Davis [10], remains the leading paradigm for assessing technological transitions, arguing that perceived usefulness (PU) and perceived ease of use (PEU) are the primary antecedents of behavioral intentions (BIs) [10,16]. However, given that digital payments involve significant financial and personal information, the parsimonious structure of the original TAM is often inadequate under conditions of high economic uncertainty [18,19].
To address these limitations, recent research has shifted to augmented TAM paradigms, integrating context-specific constructs such as perceived trust (PT), perceived risk (PR), and perceived compatibility (PC) to clarify the nuances of financial decision-making [8]. Rather than operating as a pure technical model validation, the conceptual framework for digital payment acceptance in Tajikistan is anchored in an augmented TAM that addresses cash dependency, institutional trust deficits, and digital literacy gaps. By modeling these psychological dimensions, the framework evaluates the strategic customization of information systems to bridge the digital divide and foster equitable socio-economic growth.
2.3. Research Model and Hypothesis Development
The structural links between the extended TAM components are comprehensively examined using Partial Least Squares Structural Equation Modeling (PLS-SEM) [20]. The dependent variable is Behavioral Intention (BI), which serves as a robust predictor of subsequent usage while maintaining strict conceptual separation from actual behavior. To account for demographic disparities and explicitly trace vulnerabilities within the digital divide, three demographic control factors (age, education, and income) are modeled as direct pathways to Behavioral Intentions (BIs) [21].
2.3.1. Perceived Compatibility (PC) and Cultural Alignment
Perceived Compatibility is defined as the degree to which an innovation fits the values, past experiences, and needs of potential adopters. In Tajikistan, cash is not only a transaction medium, but also a deeply entrenched cultural practice linked to informal economic survival. Research shows that for digital payments to flourish in Tajikistan, they must be compatible with users’ daily lives, especially in rural areas where digital literacy varies [20]. Moore and Benbasat [15] emphasize that an innovation must remain consistent with existing values and habitual behaviors. While local platforms like Alif Mobi and Dushanbe City have experienced growth in registrations, cash reliance continues to limit their daily transactional use. Overcoming this cultural inertia is vital for driving digital financial inclusion and supporting sustainable regional development (SDG 8). Thus, the following hypothesis is proposed:
- Hypothesis 1 (H1): Perceived compatibility positively influences the behavioral intention to adopt digital payment services.
2.3.2. Perceived Trust (PT) as a Catalyst for Adoption
Trust serves as a psychological counterweight to vulnerability, defined as a user’s belief in the reliability, security, and integrity of a service provider [13]. People in transition countries such as Tajikistan continue to distrust formal financial transactions due to historical institutional instability. This institutional mistrust is firmly engrained within the cash-dominant environment, where individuals favor physical cash over digitized assets because physical media requires no third-party verification. Systemic trust mitigates consumers’ fear of the unknown in an expanding fintech market [17,19]. Based on this logical progression, the following hypothesis is suggested:
- Hypothesis 2 (H2): Perceived trust positively influences the behavioral intention to adopt digital payment systems.
2.3.3. The Inhibitory Role of Perceived Risk (PR)
Perceived Risk is the consumer’s subjective assessment of potential problems, including loss of money, fraud, or violation of their privacy breaches [8]. In a transition economy such as Tajikistan, the growing perception of risk presents a significant barrier to the adoption of fintech technology, especially in areas where consumer protections are still evolving [22]. Unmitigated risk perceptions intensify the digital divide, thereby obstructing vulnerable and low-income populations from accessing digital financial services. Examining this construct reveals specific risk sub-dimensions that influence user avoidance:
- Security and Privacy Risks: Concerns about hacking and data leakage are the main reasons why people don’t want to use mobile applications. Studies in comparable developing countries show that insufficient encryption and concerns about identity theft significantly reduce adoption intentions.
- Monetary Risk: In countries undergoing regulatory evolution, people are particularly afraid of transactions failing or financial fraud. Without robust dispute resolution mechanisms, Tajik clients often consider cash to be “safer” and more transparent than digital alternatives, despite its physical vulnerabilities.
Theoretically, perceived risk functions as a direct deterrent to adoption; even if an application is perceived as useful, barriers caused by negative risk perceptions impede behavioral intentions. Accordingly, the following hypothesis is formulated:
- Hypothesis 3 (H3): Perceived risk negatively influences the behavioral intention to adopt digital payment methods.
2.3.4. Baseline TAM Core Paths: Perceived Usefulness and Perceived Ease of Use
Davis [10] introduced Perceived Usefulness (PU) and Perceived Ease of Use (PEU) as the core primary antecedents of the standard Technology Acceptance Model. Davis [10] defines Perceived Usefulness as the user’s practical judgment of enhanced transaction efficiency, whereas Perceived Ease of Use is the user’s relative lack of cognitive complexity when engaging with the application interface. In transition economies, structural simplicity and clear functional value are critical foundations for attracting users away from alternative physical cash flows. This study provides empirical evidence for how differences in utility and simplicity of use across demographic groups can enable personalized information systems to bridge the digital divide and support inclusive growth. As a result, the following baseline paths are established:
- Hypothesis 4 (H4): Perceived usefulness positively influences the behavioral intention to adopt digital payment systems.
- Hypothesis 5 (H5): Perceived ease of use positively influences the behavioral intention to adopt digital payment systems.
2.4. Conceptual Framework
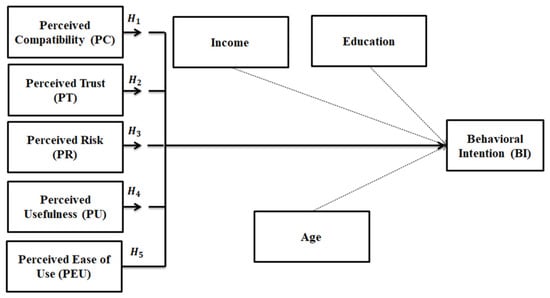
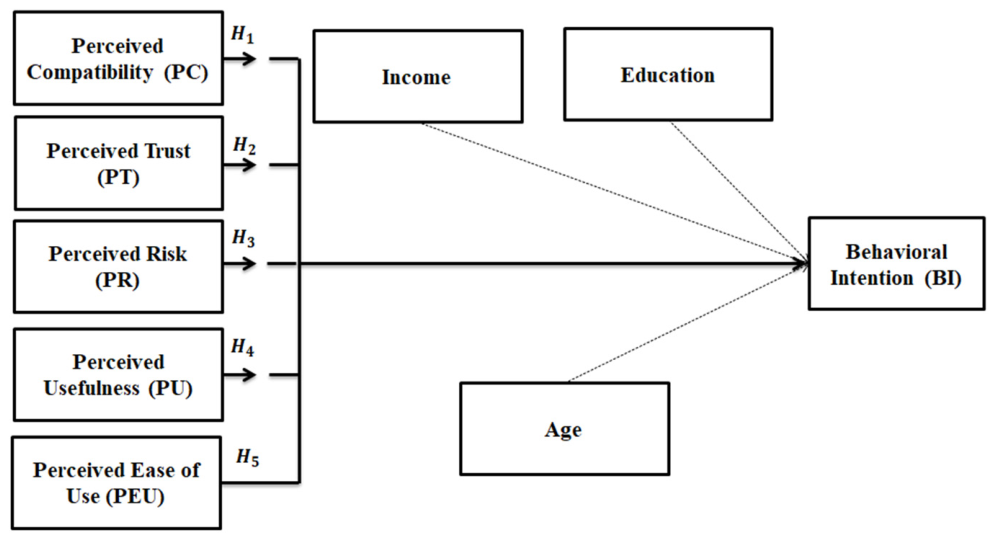
While the original Technology Acceptance Model TAM [10] primarily emphasizes perceived usefulness (PU) and perceived ease of use (PEU), it often ignores the psychological and environmental hurdles inherent to transition economies [18]. Figure 1 illustrates the conceptual framework governing digital payment adoption in Tajikistan.
Figure 1.
Conceptual Framework for Digital Payment Adoption: An Augmented TAM with psychological factors. Note: Solid lines represent hypothesized direct effects (H1 through H5); dashed lines represent control variables.
Alongside the fundamental structural pathways, demographic factors like age, income, and education are incorporated into the study model as direct control pathways to behavioral intention (BI). These are the variables theoretically required to elucidate population variance and to explicitly monitor vulnerabilities inside the digital divide, although not being articulated as formal hypotheses.
Age is a factor, since older generations frequently exhibit a reduced inclination to utilize automated financial services, highlighting generational differences in digital literacy and reluctance toward technology adoption. Education is influenced by cognitive capacity, technological preparedness, and the relative simplicity with which individuals navigate intricate digital interfaces and security measures. Ultimately, income influences the cost of mobile phones and the accessibility of essential resources, which are fundamental requirements for engaging with mobile payment systems [12]. The assessed impacts of perceived compatibility, trust, and risk are strong and free from underlying socioeconomic disparities when accounting for demographic variables.
3. Materials and Methods
3.1. Variable Operationalization and Measurement Instrument
Table 1 lists the latent constructs, specific measurement items, demographic controls, and operational factors used in this study to ensure structural clarity, empirical transparency, and content validity. The assessment scales were adapted from existing psychometric instruments in the technology acceptance literature to better reflect the socioeconomic, institutional, and cash-centric aspects of Tajikistan’s transitional financial system.
Table 1.
Operationalization of variables and measurements.
Significantly, the BI3 signal distinctly conveys the intention to persist in utilizing digital payments (‘I am likely to continue using digital payments’). The variable of interest is platform loyalty and the desire for sustained adoption among active users, rather than the initial trial acceptance by completely unbanked non-users, as 92.7% of the surveyed participants were previous users of mobile payment platforms (e.g., DC Payment and Alif Mobi).
Importantly, the psychometric factors are designed to capture the interaction between psychological and infrastructural elements in a severe digital divide and are not just validated for pure technical models but for investigating ways to structural financial inclusion. Demographic control variables are introduced as direct paths to the dependent variable in order to isolate structural variance.
Survey Design and Validation
The primary research instrument was divided into two operational sections: (i) an initial screening section for gathering demographic and socioeconomic data (capturing adult participants aged 18 and above) to contextualize respondents within the regional digital divide, and (ii) a psychometric evaluation section using a 7-point Likert scale ranging from 1 (Strongly Disagree) to 7 (Strongly Agree).
Pre-testing and Pilot Study: A thorough pilot study with an initial cohort of 30 participants was executed utilizing SmartPLS 4 to evaluate the linguistic precision, cultural suitability, and dependability of the tool. The pilot results produced Cronbach’s alpha coefficients exceeding the 0.70 threshold for all latent constructs and necessitated slight modifications in language to enhance clarity. To eliminate technical confusion, translations into regional languages including Tajik and Russian were implemented and verified.
Statistical Validation Criteria: To guarantee robust measurement quality, specific numerical criteria were established: Cronbach’s Alpha (α > 0.70), Composite Reliability (ρa and ρc > 0.70), and Convergent Validity (Average Variance Extracted—AVE > 0.50). The discriminant validity was evaluated by the Heterotrait–Monotrait (HTMT) ratio, applying the conservative threshold of <0.85, with the liberal threshold of <0.90 and HTMT-inference applied for conceptually proximate constructs [24].
Common Method Bias (CMB) Mitigation: To reduce the risk of distortion stemming from potential Common Method Bias (CMB), procedural remedies were implemented ex ante, including ensuring respondent anonymity, refinement of item wording, and physical separation of measurement items for independent and dependent variables [25]. Because all constructs were collected from a single informant at a single point in time, CMB was assessed ex post using the full collinearity test [26,27]; the execution procedure and its empirical results are reported in Section 4.2.1. Harman’s single-factor test was also performed as a supplementary diagnostic (Section 4.2.1).
3.2. Data Collection and Sampling Strategy
This study used a multi-channel, mixed-mode data collection approach method to provide a representative overview of various population groups in Tajikistan.
- Survey Dissemination and Channels: Data collection was conducted via a mixed-mode administration strategy resulting in an effective distribution of approximately 62% online responses and 38% offline responses. In the online track, the instrument was distributed on popular platforms in Tajikistan (Telegram, WhatsApp, Instagram and Facebook) to reach urban, digitally proficient users. Offline surveys were administered via paper and tablets in public places such as universities, financial institutions, and commercial centers across Dushanbe, Khujand, and surrounding regional districts.
- Sampling Technique: A non-probability purposive sampling approach was utilized. Participants must meet two criteria: (i) they must have a smartphone or other device connected to the Internet, and (ii) they must know the basics of digital payments. This ensures that the data reflects the “informed behavioral intention” capable of transitioning into actual usage within the financial ecosystem.
- Sample Size Justification: The final valid sample size (N = 296) was formally established according to the statistical power parameters for PLS-SEM [28]. First, according to standard statistical power guidelines and the “10-times rule” (where the maximum number of structural arrows directed at a latent construct is multiplied by 10), the minimum sample size requirement was easily met. Second, an a priori power assessment utilizing G*Power 3.1 [29] and the inverse square root approach [30] was assessed to guarantee more methodological rigor beyond basic heuristics. The minimal sample size needed to identify small-to-medium effect sizes (f2 ≥ 0.02 to 0.15) is between 138 and 210 observations at a standard significance level (α = 0.05) and a statistical target power of 0.80. With a statistical power of more than 95% for structural model estimation, the retained sample of N = 296 surpasses these baseline requirements. Additionally, this sample size is in line with and larger than other recent empirical research assessing the adoption of digital financial services and technology acceptance in developing and emerging economies [31,32].
- Translation and Linguistic Equivalence: The research instrument has been prepared in both Tajik and Russian to match the multilingual landscape of Tajikistan. The back-translation method was used, in which unbiased experts translated the versions into English to ensure that they had the same meaning and did not reflect any cultural prejudice.
3.3. Data Analysis Procedures: PLS-SEM and MGA
Partial Least Squares Structural Equation Modeling (PLS-SEM) was selected over covariance-based SEM (CB-SEM) because it is better suited for exploratory research and can handle complex models with both latent and control variables (age, education, and income) without requiring strict normalization distributions [25]. The primary measurement model evaluation, structural model estimation, bootstrapping (5000 resamples), full collinearity testing, MICOM permutation analysis, and Multi-Group Analysis (MGA) were conducted using SmartPLS 4 (Version 4.1.1.5).
- Measurement Model Evaluation: This includes an internal consistency assessment (Cronbach’s Alpha and Composite Reliability), convergent validity (AVE), and discriminant validity (modern Heterotrait–Monotrait (HTMT) ratios).
- Structural Model Evaluation and Predictive Validation: Hypothesis testing was executed using the bootstrapping process (5000 subsamples) to determine the significance of path coefficients, R2 values for explanatory power, and effect sizes (f2). The Standardized Root Mean Square Residual (SRMR < 0.08) was used to assess the overall model fit.
- Multigroup Analysis (MGA) and Invariance Testing: To study the differences in social and economic factors across demographic subgroups, a Multigroup Analysis (MGA) was conducted using the permutation method. Crucially, prior to conducting MGA path comparisons, Measurement Invariance of Composite Models (MICOMs) was assessed by permutation analysis (5000 permutations) to evaluate measurement invariance and confirm that the observed group disparities reflect genuine structural differences rather than measurement bias. This enables the study to scientifically delineate demographic diversity (urban versus rural; gender distinctions) and pinpoint specific policy avenues for inclusive macro growth.
4. Empirical Results and Analysis
4.1. Descriptive Statistics and Measurement Reliability
The research collected empirical data to assess the factors influencing the intention to use digital payments among general customers in both urban and rural areas of Tajikistan. A hybrid sampling methodology was used which encompassed online dissemination via digital platforms and conducted offline surveys in major commercial centers. A cumulative total of 330 responses were gathered. Following meticulous data cleansing to ensure strict ethical compliance and analytical consistency, 20 participants under the age of 18 (minors) were excluded from the analysis, yielding a final valid sample of N = 296 adult respondents. The preserved sample size was sufficient to satisfy the minimum requirements for Partial Least Squares Structural Equation Modeling (PLS-SEM).
The demographic analysis indicates a broad representation of the Tajik population: the sample skews toward younger age groups, with 30.07% in the 18–24 range (N = 89), 23.65% in the 25–34 range (N = 70), and 18.24% in the 35–44 range (N = 54). The older age groups are also included (15.54% aged 45–54, n=46; 12.50% aged 55 and above, n=37). The gender distribution is balanced, with 164 males (55.41%) and 132 females (44.59%). The majority of participants reside in urban regions (54.39%, N = 161), while the rest inhabit rural locales (45.61%, N = 135). In accordance with research ethics protocols, informed consent was obtained from all adult participants prior to survey administration. The full demographic breakdown and sampling tracks are detailed in Table 2.
Table 2.
Demographic profile and sample characteristics (N = 296).
To assess behavioral inclinations about financial technologies, the data indicates that the vast majority of participants utilize digital payment platforms. Regarding platform-specific utilization, DC Payment and Alif Mobi remain the dominant choices, supported by frequent daily and weekly transactions across urban and rural cohorts. From a macro-development standpoint, the prevalent use of digital payments in Tajikistan signifies their transformation from mere financial innovations into essential tools of daily commerce, serving as a structural mechanism supporting digital retail transactions.
Table 3 provides summary statistics on the main analytical variables based on the N = 296 dataset. Behavioral Intentions (BI) had a high mean of 5.757 (SD = 1.311) on a 7-point scale, indicating that the majority of respondents were more likely to adopt digital payments. Perceived Compatibility (PC) received the highest score (meaN = 5.741; SD = 1.152) among independent psychometric variables, indicating that people in Tajikistan believe that these digital tools are well suited to their lifestyle and current needs.
Table 3.
Summary statistics (N = 296).
On the other hand, the mean of Perceived Risk (PR) was noticeably compressed at 3.405 (SD = 1.749). This indicator is lower than the theoretical average of 4.0, which means that customers are aware of the risks, but do not consider them as a structural barrier to financial inclusion. All Cronbach’s α values range from 0.802 to 0.928, which is significantly higher than the standard academic value of 0.70.
4.2. Measurement Model Evaluation
The measurement model for convergent reliability, indicator reliability, and discriminant validity was tested using Partial Least Squares Structural Equation Modeling (PLS-SEM) in SmartPLS 4, following established methodological guidelines [25].
4.2.1. Convergent Validity, Reliability and Common Method Bias Assessment
Three parameters were used to verify convergent validity and construct reliability: Cronbach’s alpha (α), Composite Reliability (CR), and Average Variance Extracted (AVE). Table 4 demonstrates that all constructs possess robust internal consistency. The Cronbach’s Alpha (α) values varied between 0.802 and 0.928, the Composite Reliability (ρc) values ranged from 0.883 to 0.949, and factor loadings for each item exceeded the 0.70 criterion (ranging from 0.814 to 0.932), showcasing the strong reliability of the indicators. The Average Variance Extracted (AVE) confirmed convergent validity, with all values (0.716 to 0.845) exceeding the minimum benchmark of 0.50.
Table 4.
Latent variable reliability and validity statistics.
A comprehensive collinearity assessment was conducted in accordance with the work of Kock and Lynn [27] and Kock [26] to examine indicator reliability, multicollinearity, and Common Method Bias (CMB). First, vertical collinearity at the indicator level was assessed via outer VIFs within the reflective measurement framework; all values ranged from 1.632 to 4.450, remaining safely below the conventional threshold of 5.0. Second, to assess lateral collinearity and screen for CMB, the full collinearity test was performed [27]. The full collinearity test was performed by creating a dummy random variable (RDV) and regressing all six reflective latent variables on it. The resulting full-collinearity VIFs ranged from 1.412 to 3.785. As shown in Table 4, the full collinearity VIF for Perceived Compatibility (PC) is 3.785, marginally exceeding the 3.3 threshold. However, this does not indicate construct redundancy. Following Kock [26], lateral collinearity is only a critical concern if the Inner VIF in the structural model also exceeds 3.3. In our model, the Inner VIF for PC is strictly below the threshold (3.258), confirming that the path estimates are not distorted. Furthermore, the HTMT-inference test (Section 4.2.2) confirmed the upper bound of the 95% confidence interval for the PC–BI correlation remains below 1.0. Consequently, PC and BI were retained as distinct variables, as combining a predictor (compatibility) with the outcome (intention) would undermine the core theoretical framework. Single-indicator demographic controls were not included in the full collinearity model, as they are objective variables and not subject to common method variance in the same sense as reflective latent constructs.
Furthermore, all 21 psychometric indicator items were subjected to an unrotated principal component factor analysis to conduct Harman’s single-factor test for evaluating Common Method Bias (CMB) ex-post, beyond collinearity standards. The initial unrotated factor accounted for 48.37% of the total variance. Because Harman’s test lacks a universally accepted cutoff and is widely regarded as a weak diagnostic [24], the absence of CMB is not established by this test alone. These empirical assessments, when integrated with the rigorous full collinearity and ex-ante procedural protections (guaranteed respondent confidentiality, clear item wording, and physical separation of measurement items), confirm that common method bias does not compromise the structural integrity of the model.
4.2.2. Discriminant Validity
The ratio of Heterotrait–Monotrait (HTMT) was used to evaluate discriminant validity across all reflective constructs and demographic control factors (Table 5).
Table 5.
Discriminant validity assessment using HTMT.
The majority of inter-construct HTMT ratios significantly fall short of the conservative threshold of 0.85. Three pairs exhibited elevated values: Perceived Compatibility and Behavioral Intention (HTMT = 0.898), Perceived Compatibility and Perceived Usefulness (HTMT = 0.857), and Perceived Ease of Use and Perceived Usefulness (HTMT = 0.918). The conceptual proximity of baseline TAM antecedents often results in heightened correlations within technology adoption frameworks. To formally confirm discriminant validity among these constructs, three rigorous methodological standards are implemented:
- Compliance with the Liberal HTMT0.90 Threshold: Henseler et al. [25] suggest a universal threshold of 0.90 for conceptually analogous constructs in structural equation modeling. HTMT(PC, PU) = 0.857 and HTMT(PC, BI) = 0.898 both remain significantly below the 0.90 threshold.
- Bootstrapping Inference (HTMTinference): According to Hair et al. [34] and Henseler et al. [25], discriminant validity is empirically validated if the 95% bias-corrected and accelerated (BCa) bootstrap confidence interval for the HTMT value excludes 1.0. Employing the 5000-resample bootstrap method in SmartPLS 4 [28], the upper bounds of the 95% BCa confidence intervals for all construct pairs, including HTMT(PEU, PU) = 0.918, do not equal 1.0, indicating that the constructs are statistically different.
- Collinearity Diagnostics: The inner VIF values at the construct level were examined to confirm that the strong structural path coefficient between Perceived Compatibility and Behavioral Intention is not biased or distorted by multicollinearity among the predictor constructs. The Inner VIF for Perceived Compatibility is 3.258, remaining beneath the conservative threshold of 3.3. While this confirms the stability of the structural path estimate, the close proximity between PC and BI is transparently acknowledged as a measurement overlap limitation, monitored via full collinearity VIFs and HTMT bounds.
4.2.3. Control Variables
Demographic characteristics such as age, education, and income were included to the structural model as single-indicator control variables. In accordance with PLS-SEM methodology [34], conventional internal consistency reliability and convergent validity metrics (such as Cronbach’s alpha, composite reliability, and AVE) are not applicable to single-indicator constructs. Consequently, their outer indicator loadings are fixed at 1.000, and measurement error is assumed to be zero.
4.3. Structural Model and Hypothesis Testing
To test the hypothesized relationships, the structural model was evaluated using a standard bootstrapping process with 5000 resamples after the measurement model was validated. Model fit was evaluated using the Standardized Root Mean Square Residual (SRMR). The estimated structural model yielded an SRMR value of 0.053, which is well below the conservative threshold criterion of 0.08, indicating a good overall structural model fit [35,36].
The major endogenous variable, Behavioral Intention (BI), generated an R2 coefficient of 0.674 (Adjusted R2 = 0.665), indicating that the independent constructs collectively explain 67.4% of the variance in consumer digital adoption intentions in Tajikistan. Additionally, for the primary target construct, Behavioral Intention (BI), cross-validated predictive relevance was assessed. The resulting empirical Q2 value was 0.557 (construct-validated redundancy), which is far higher than the baseline requirement of zero (Q2 > 0). A Q2 value greater than 0.35 indicates that the structural model has significant predictive relevance for digital payment adoption behavior [34].
4.3.1. Path Analysis and Hypothesis Results
Table 6 outlines the structural path coefficients (β), standard errors (SE), t-values, p-values, and effect sizes (f2), and Inner VIF values for all hypothesized relationships and control variables.
Table 6.
Structural model results and hypothesis testing (N = 296).
4.3.2. Discussion of Findings
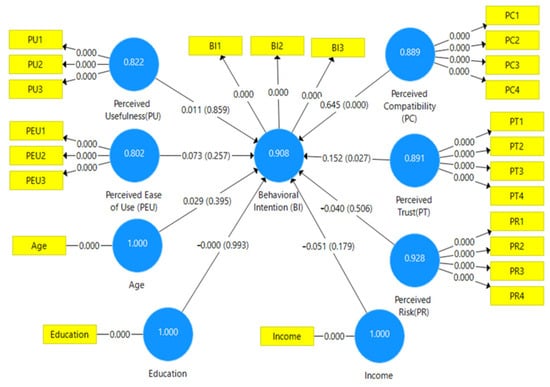
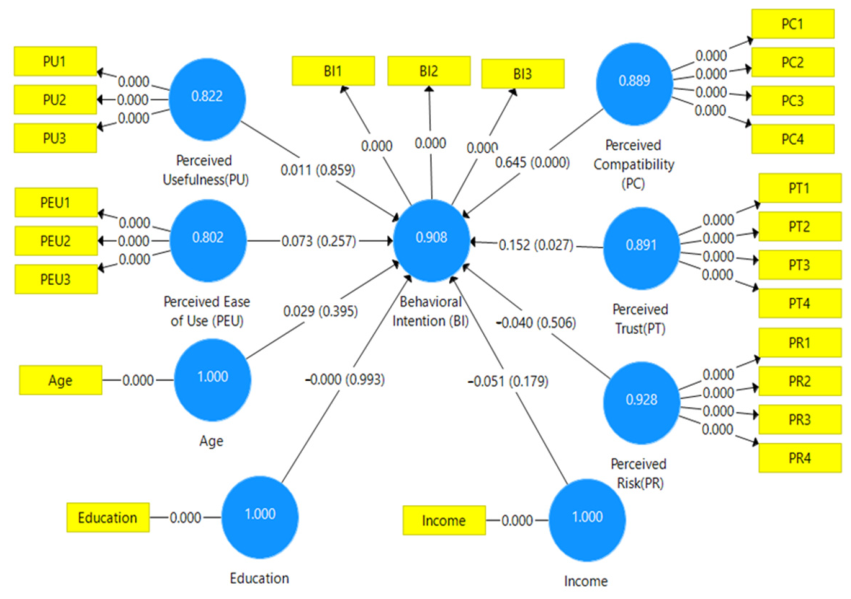
The empirical findings offer significant insights into the dynamics of digital financial modernization in a post-Soviet transition economy (N = 296). First, Perceived Compatibility (H1) emerged as the primary positive driver of digital payment adoption intention (β = 0.645, p < 0.001) exhibiting a significant effect size (f2 = 0.393). This indicates that in expanding digital marketplaces, aligning financial innovations with consumers’ daily habits, cultural practices, and lifestyle workflows is vastly more crucial than mere software functionality. Secondly, Perceived Trust (H2) exerted a positive and significant effect (β = 0.152, p = 0.027). Trust in prominent ecosystem facilitators (such as DC Payment and Alif Mobi) effectively mitigates psychological reluctance and serves as a vital catalyst for systemic inclusion. The effect size is evaluated as small yet consistent (f2 = 0.029), indicating its independent predictive significance for systemic financial inclusion (Figure 2).
Figure 2.
Structural path coefficients (N = 296).
On the other hand, Perceived Risk (H3), Perceived Usefulness (PU, H4), and Perceived Ease of Use (PEU, H5) were shown to be statistically insignificant in this structural model. Within advanced digital landscapes characterized by extensive mobile application adoption, essential utility features such as effectiveness and user-friendliness have evolved from key competitive differentiators to baseline market expectations. In addition, the non-significance of perceived risk indicates that operational security challenges are predominantly counterbalanced by substantial institutional and brand trust.
4.4. Heterogeneity Analysis (Multi-Group Analysis)
To examine potential unobserved heterogeneity within the demographic segments while maintaining methodological integrity, the Measurement Invariance of Composite Models (MICOM) process was performed utilizing permutation analysis prior to executing Multi-Group Analysis (MGA) in SmartPLS 4. In accordance with the work of Henseler et al. [35], establishing configural (Step 1) and compositional invariance (Step 2) is a mandatory prerequisite before comparing path coefficients across subsamples.
4.4.1. Measurement Invariance Assessment (MICOM Results)
The empirical MICOM results across the three demographic groups (Gender, Location, and Education) confirm that Partial Measurement Invariance is established for key constructs in each group comparison, validating the use of PLS-MGA:
- Gender Partition (Female vs. Male): Configural invariance was established (Step 1). Configural and compositional invariance were established for most constructs (p > 0.05), with the exception of Perceived Risk (PR), which exhibited a significant permutation p-value (p = 0.002), indicating a lack of compositional invariance. Consequently, MGA path comparisons involving Perceived Risk are omitted for the gender partition.
- Location Partition (Rural vs. Urban): Configural invariance was established (Step 1). Step 2 compositional invariance was successfully confirmed for 5 of the 6 reflective constructs: Behavioral Intention (p = 0.313), Perceived Compatibility (p = 0.453), Perceived Ease of Use (p = 0.556), Perceived Risk (p = 0.161), and Perceived Trust (p = 0.177). Only Perceived Usefulness (PU) exhibited significant weighting variation (p = 0.024). Thus, Partial Measurement Invariance is fully established for the regional model, validating PLS-MGA execution.
- Education Partition (Low Education vs. High Education): Configural invariance was established (Step 1). Compositional invariance was established for baseline constructs, but Perceived Usefulness (PU) (p = 0.024), and Perceived Risk (PR) (p = 0.016) failed Step 2 invariance thresholds, restricting comparative MGA evaluation for these specific paths.
Table 7 summarizes the complete three-step MICOM evaluation results.
Table 7.
Combined MICOM summary across demographic variables.
4.4.2. Subgroup Comparison Results
Table 8 shows the multi-group comparison results, detailing group-specific path coefficients, group differences, and permutation-based p-values across demographic partitions.
Table 8.
Multi-group analysis (MGA) results.
4.4.3. Interpretation of Heterogeneous Effects
In addition to the fundamental structural estimates, the multi-group analysis enabled by established partial measurement invariance provides essential empirical insights into the demographic differences and contextual subtleties influencing the adoption of digital finance in Tajikistan.
Despite the fact that functional constructs such as Perceived Usefulness (PU) and Perceived Ease of Use (PEU) exhibited non-significant direct effects in the comprehensive pooled model (Table 6), the localized subgroup analysis (Table 8) suggests that these non-significant global findings are primarily attributable to two structural dynamics.
- Subgroup Masking and Unobserved Heterogeneity: The Multi-Group Analysis indicates that usability exerts a behavioral impact, although this impact is significantly dependent on demographic factors.
- ○
- Gender Usability Preference: Among female users, Perceived Ease of Use (PEU) exhibits a statistically significant positive influence on adoption intention (β = 0.271, p = 0.003), while its impact on male consumers is slightly negative and not statistically significant (β = −0.057). The disparity in path (Diff = 0.328, pMGA = 0.006) suggests that female adopters in Tajikistan highly valued the simplicity of the application, its user interface design, and navigational ease.
- ○
- Urban–Rural Digital Divide: In urban environments, PEU serves as a beneficial catalyst for active adoption (β = 0.210, p = 0.018), whereas in rural locales, it presents a non-significant negative effect (β = −0.105, p = 0.192). The structural path difference (Diff = 0.315, pMGA = 0.011) indicates a notable regional disparity: in rural locales, the primary determinants of app adoption are functional necessity, service accessibility, and lifestyle compatibility, whereas in digitally competitive urban environments (e.g., Dushanbe, Khujand), user interface convenience plays a pivotal role in app selection.
- ○
- Educational Attainment Gradient: It reveals a statistically significant disparity in usability trajectories between highly educated participants (β = 0.164, p = 0.068) and those with lower educational backgrounds (β = −0.105, p = 0.350) (Diff = 0.269, pMGA = 0.058). Furthermore, Perceived Trust (PT) acts as a significantly stronger positive driver for lower-educated consumers (β = 0.331, p < 0.001) compared to higher-educated users (β=0.105, p = 0.297) (Diff = −0.226, pMGA = 0.087), indicating that institutional trust serves as a critical safety net for individuals navigating digital financial platforms with lower baseline formal education.
- Construct Overlap and Variance Mitigation: Perceived Usefulness (PU) and Perceived Ease of Use (PEU) have evolved into standard market expectations (“hygiene factors”) within established, mobile-oriented financial environments featuring extensive platform implementation (e.g., DC Payment, Alif Mobi), transitioning from unique competitive advantages. The robust theoretical and empirical connection between traditional TAM categories and Perceived Compatibility (PC), indicated by elevated HTMT values, implies that functional utility and user-friendliness are predominantly encompassed within the broader context of lifestyle alignment.
- Methodological Transparency in Invariance Screening: The constructs that did not meet MICOM Step 2 compositional invariance, namely Perceived Risk (PR) in the gender partition (p = 0.002), Perceived Usefulness (PU) in the location partition (p = 0.024), and PU (p = 0.024) and PR (p = 0.016) in the education partition, were excluded from MGA path comparison assertions in strict compliance with the PLS-SEM reporting standards [35]. This evaluation safeguards against measurement bias in structural analyses and guarantees that reported subgroup disparities accurately represent demographic variations.
In contrast, the invariant pathways concerning Perceived Compatibility (PC) showed no statistically significant variations among the subgroups (pMGA > 0.10), indicating its systemic and universal foundational role in driving Tajikistan’s national digital financial transition.
5. Conclusions and Implications
5.1. Research Conclusions
The purpose of this study was to examine the main factors influencing the adoption of digital payment systems in Tajikistan by extending the Technology Acceptance Model (TAM) with perceived compatibility, perceived trust, and perceived risk to evaluate behavioral adoption intention across urban and rural consumer sectors. The results show that Perceived Compatibility (PC) is the primary positive driver of adoption intention (β = 0.645, p < 0.001), followed by Perceived Trust (PT), which exerts a statistically significant positive effect (β = 0.152, p = 0.027). Conversely, Perceived Risk (PR) (β = −0.040, p = 0.506), Perceived Usefulness (PU) (β = 0.011, p = 0.859), and Perceived Ease of Use (PEU) (β = 0.073, p = 0.257) were non-significant in the global structural model. In particular, compatibility is the most significant factor, indicating that in this historically cash-centric and fragmented post-Soviet environment, cultural and behavioral conformity is valued more than raw technical utility.
The structural success of digital finance in Tajikistan depends on how well technology fits into people’s daily lives and cultural values. Furthermore, the statistical significance of Perceived Trust (PT) (β = 0.152, p = 0.027) underscores that institutional reliability and platform security serve as foundational psychological safeguards. The statistical non-significance of Perceived Risk (H3) also implies that perceived risk operates at a baseline level that does not directly hinder behavioral adoption intention among active users, rather than indicating security concerns are absent.
It should be noted that the classical TAM indicators of Perceived Usefulness (H4) and Perceived Ease of Use (H5) did not achieve statistical significance in the global pooled model (N = 296). Viewed through the conceptual lens of Herzberg’s Motivation–Hygiene Theory, this pattern suggests that as digital ecosystems mature, basic utility and user-friendliness may function primarily as baseline expectations rather than active differentiators of adoption intent. This theoretical framework provides a credible rationale for the predominance of utilitarian elements in environments where mobile payment systems are extensively adopted, even if our survey methodology did not explicitly address hygienic versus motivational traits.
Additionally, the dependent variable evaluates ongoing usage intention instead of initial trial adoption, given that the empirical sample reflects a mature or swiftly evolving user demographic, with most respondents possessing previous platform experience. Examining post-adoption persistence and ongoing involvement yields essential understanding of how services evolve from fleeting novelty to enduring daily practices in nascent digital economies like Tajikistan.
5.2. Research Discussion
Empirical verification of H1: Perceived Compatibility confirms that digital payments are considered in the context of lifestyle integration. This critical link demonstrates that in a historically cash-centric, low-trust post-Soviet environment, seamless integration into customary cash workflows (e.g., local market purchases, peer-to-peer transfers, and utility payments) far outperforms abstract assessments of performance benefits. This result is supported by previous research on the use of digital banking services and shows that compatibility is a crucial factor in public perception of new technologies [18]. By embedding into daily consumer routines, compatibility serves as an essential mechanism to overcome historical cash reliance.
The positive path coefficient of H2 Perceived Trust underlines that trust in institutions is crucial for the adoption of financial technologies and cultivating consumer adoption intention. In Tajikistan, where the digital infrastructure is still under construction, trust in the system provider (such as established local platforms Alif Mobi and DC Payment) helps to reduce concerns about system stability, data security, and fraud. Conversely, H3 (Perceived Risk) demonstrated a statistically non-significant effect. Rather than indicating an absence of security concerns, this non-significance suggests that perceived risk operates as a baseline ambient factor that does not actively hinder adoption intent among active or experienced users in Tajikistan’s evolving ecosystem.
Furthermore, traditional TAM assumptions—H4: Perceived Usefulness (PU) and H5: Perceived Ease of Use (PEU)—were statistically insignificant in the global structural model. This suggests that fundamental operational simplicity and practical value are standard prerequisites, rather than drivers for behavioral differences. The significance of structural insights among various demographic groups is demonstrated by a Multi-group Analysis (MGA) performed subsequent to the validation of the Measurement Invariance of Composite Models (MICOMs):
- Perceived Ease of Use (PEU) exhibits significant subgroup heterogeneity, acting as a powerful adoption catalyst among female consumers (Diff = 0.328, pMGA = 0.006), whereas its effect is slightly negative and non-significant for male users. In urban centers, PEU positively drives adoption (β = 0.210, p = 0.018), whereas in rural areas, its direct impact is non-significant (β = −0.105, p = 0.192), producing a significant structural difference (Diff = 0.315, pMGA = 0.011). Urban environments demand interface convenience due to platform competition, while rural users prioritize functional availability and basic accessibility. Usability trajectories vary significantly across education levels (Diff = −0.269, pMGA = 0.058), with highly educated users leveraging ease of use more effectively (β = 0.164, p = 0.068). In addition, Perceived Trust (PT) acts as a significantly stronger driver for consumers with lower educational backgrounds (β = 0.331, p < 0.001) than for higher-educated users (β = 0.105, p = 0.297) (Diff = −0.226, pMGA = 0.087). These subgroup findings demonstrate that demographic factors operate as contextual moderators, uncovering critical behavioral variations masked within the global structural model.
5.3. Research Implications
5.3.1. Theoretical Implications
This study improves the Information Systems (ISs) and technology adoption literature in transition economies in various ways:
- Contextualization of TAM: This research offers a theoretical contribution by demonstrating that traditional utilitarian factors (PU and PEU) diminish in explanatory strength within evolving transition contexts, where Perceived Compatibility and Perceived Trust emerge as primary drivers.
- Cultural and Lifestyle Alignment: Regarding the dominance of compatibility, the high path coefficient for PC shows that cultural conformity and lifestyle alignment are fundamentally more important than functional utility, offering a culturally grounded framework for financial technology adoption in post-Soviet, cash-dominant economies.
- Behavioral Distinction: The theoretical framework refrains from over-extending microeconomic perception data to macro-level financial inclusion or actual post-adoption usage behaviors, clearly distinguishing “behavioral adoption intention” from “actual system usage.”
5.3.2. Managerial Implications
From a practical perspective, the empirical findings offer clear strategic directions for service providers and policy makers:
- Lifestyle-Centric Design: To address cash reliance, digital payment solutions should match the lifestyle and work of the people in their respective regions. Developers should build systems that integrate with popular local payment workflows, offer help in different languages, and facilitate small transactions to emulate daily cash routines.
- Prioritizing Compatibility and Security: Because Perceived Compatibility serves as the dominant direct catalyst for electronic transactions, product development and marketing strategies must prioritize lifestyle alignment and habit conformity above abstract functional features. To build institutional trust, institutions should allocate funds for strict security measures, clear confidentiality rules, and transparent customer support mechanisms. Cooperation with banks, telephone companies, and government agencies can help increase ecosystem familiarity.
- Segmented Strategic Targeting: The multi-group analysis revealed significant demographic and spatial heterogeneity, implying that providers should employ segmented strategies. In urban areas and among female segments, promotional strategies should emphasize user interface simplicity and app accessibility (PEU), whereas rural and lower-education strategies should focus on building institutional trust, overcoming operational hurdles, and integrating micro-transactions into local commerce.
5.4. Limitations and Future Research
5.4.1. Limitations
Despite its developmental contributions, this study is subject to certain limitations. First, the results were obtained using a self-assessment questionnaire, which could include biases such as social desirability and confusion in some technical terms. Second, the data collection relied on online channels and targeted offline sampling in commercial centers, necessitating a fundamental understanding of smart devices, thereby excluding digitally marginalized, ultra-rural, and entirely unbanked groups, which constrains the generalization of these results across diverse socioeconomic levels. Third, this study used a cross-sectional approach to assess users’ perceptions at a particular point in time, which limits the possibility of establishing a long-term causal relationship or tracking actual usage behavior over time.
Fourth, a key methodological limitation is that Multi-Group Analysis (MGA) could not be executed for all structural relationships across all demographic partitions. In strict compliance with the Measurement Invariance of Composite Models (MICOM) protocol [35], constructs that failed Step 2 compositional invariance—specifically Perceived Risk in the gender partition, Perceived Usefulness in the location partition, and both PU and PR in the education partition—were excluded from MGA path comparisons. While this screening protects structural comparisons against measurement bias, it limits full subgroup comparative evaluation across the entire theoretical model.
Fifth, while the full collinearity VIF for Perceived Compatibility (3.785) exceeds the conservative 3.3 threshold, we did not combine it with Behavioral Intention, as suggested by Kock [26], because combining them would theoretically conflate the predictor with the criterion. However, we acknowledge that this shared variance is a limitation. Future research employing longitudinal designs or objective behavioral logs should re-evaluate the discriminant boundary between compatibility and intention in transition economies.
Finally, while this study examined demographic moderation via Multi-Group Analysis, it did not formally evaluate complex mediation effects or inter-construct moderations among cognitive perceptions, such as the mediating role of Perceived Trust and Perceived Risk.
5.4.2. Future Research
Future research could expand on these findings through several pathways. First, future research could correlate behavioral intentions with actual long-term payment usage over time by employing longitudinal or objective usage log data. Secondly, researchers should recognize and evaluate structural mediation/moderation frameworks (e.g., trust mediating/moderating risk perception) to clarify the particular trust–risk dynamics. Third, the framework could be enhanced by incorporating contextual variables such as digital financial literacy, regulatory policy support, and physical infrastructure quality. This would enrich theoretical comprehension. Fourth, qualitative techniques, such as comprehensive interviews or focus groups, might enhance a quantitative methodology by exploring the social, cultural, and psychological dimensions of the post-Soviet cash transition. Fifth, the psychometric assessments of behavioral intention reflect sustained usage and loyalty to reuse rather than initial adoption, as the majority of survey participants possessed prior practical experience with digital payment systems. Future research may distinctly categorize new adopters and seasoned users to juxtapose initial obstacles with elements that promote continued usage. Finally, comparative assessments between Tajikistan and its neighbors (e.g., Uzbekistan or Kyrgyzstan) could help scientists identify similarities and regional differences across Central Asia.
Author Contributions
M.W.: Supervision, Formal Analysis, Validation, Writing—Review & Editing. J.Z.: Supervision, Methodology, Validation, Writing—Review & Editing. A.S.: Conceptualization, Methodology, Data Curation, Formal Analysis, Software, Investigation, Resources, Writing—Original Draft, Writing—Review & Editing, Visualization, Project Administration. All authors have read and agreed to the published version of the manuscript.
Funding
This research did not receive any specific grant from funding agencies in the public, commercial, or not-for-profit sectors.
Institutional Review Board Statement
Ethical review and approval were waived for this study because it involved an anonymous, non-interventional survey of adult participants. According to the Law of the Republic of Tajikistan No. 1197 “On Scientific Activity” (2015) and Law No. 1537 “On Protection of Personal Data” (2018), formal institutional ethics committee approval is not mandated for low-risk, non-clinical socio-economic research. The study was conducted in strict accordance with the ethical principles outlined in the Declaration of Helsinki.
Informed Consent Statement
Verbal informed consent was obtained from every respondent before the questionnaire was administered. Verbal consent was obtained rather than written documentation due to practical field conditions across urban and rural data collection settings, where participants preferred a verbal walk-through of the study scope. All participants were explicitly informed that their participation was completely voluntary, their answers would be fully anonymized, and they could stop the interview at any time.
Data Availability Statement
The survey data supporting the results of this study is not publicly available due to confidentiality agreements with participants but is available from the corresponding author upon reasonable request.
Acknowledgments
The authors sincerely thank the organizations and local coordinators in Tajikistan for their facilitation, guidance, and cooperation during the data collection phase of this study. We are deeply grateful to all the respondents who participated in the survey and generously shared their time and insights. Finally, we thank our families, friends, and colleagues for their unwavering support throughout our academic journey.
Conflicts of Interest
The authors declare no conflicts of interest.
References
- Chong, A.Y.L.; Chan, F.T.; Ooi, K.B. Predicting consumer decisions to adopt mobile commerce: Cross country empirical examination between China and Malaysia. Decis. Support Syst. 2012, 53, 34–43. [Google Scholar] [CrossRef] [Scilit]
- Chandra, S.; Srivastava, S.C.; Theng, Y.L. Evaluating the role of trust in consumer adoption of mobile payment systems: An empirical analysis. Commun. Assoc. Inf. Syst. 2010, 27, 561–588. [Google Scholar] [CrossRef] [Scilit]
- National Bank of Tajikistan. Electronic Money; NBT Official Bulletin: Dushanbe, Tajikistan, 2025; Available online: https://nbt.tj/en/payment_system/mablaghoi-elektroni.php (accessed on 15 January 2026).
- World Bank. World Bank to Strengthen Digital Public Infrastructure and Digital Skills in Tajikistan; World Bank Press Release: Washington, DC, USA, 2024; Available online: https://www.worldbank.org/en/news/press-release/2024/12/17/world-bank-to-strengthen-digital-public-infrastructure-and-digital-skills-in-tajikistan (accessed on 15 January 2026).
- Tolibzoda, F. Examining the State of Financial Inclusion in Tajikistan; Alliance for Financial Inclusion (AFI)/National Bank of Tajikistan: Dushanbe, Tajikistan, 2025; Available online: https://afi-global.org/opinion/examining-the-state-of-financial-inclusion-in-tajikistan/ (accessed on 15 January 2026).
- FinDev Gateway. Financial Inclusion in Europe and Central Asia; CGAP: Washington, DC, USA, 2025; Available online: https://www.findevgateway.org/region/financial-inclusion-europe-and-central-asia (accessed on 15 January 2026).
- Trend News Agency. Tajikistan Sees Rise in Cashless Payments in 1H2025; Trend News Agency: Baku, Azerbaijan, 2025; Available online: https://www.trend.az/casia/tajikistan/4076466.html (accessed on 15 January 2026).
- Featherman, M.S.; Pavlou, P.A. Predicting e-services adoption: A perceived risk facets perspective. Int. J. Hum.-Comput. Stud. 2003, 59, 451–474. [Google Scholar] [CrossRef] [Scilit]
- Riquelme, H.E.; Rios, R.E. The moderating effect of gender in the adoption of mobile banking. Int. J. Bank Mark. 2010, 28, 328–341. [Google Scholar] [CrossRef] [Scilit]
- Davis, F.D. Perceived usefulness, perceived ease of use, and user acceptance of information technology. MIS Q. 1989, 13, 319–340. [Google Scholar] [CrossRef] [Scilit] [PubMed]
- Venkatesh, V.; Morris, M.G.; Davis, G.B.; Davis, F.D. User acceptance of information technology: Toward a unified view. MIS Q. 2003, 27, 425–478. [Google Scholar] [CrossRef] [Scilit]
- Alalwan, A.A.; Dwivedi, Y.K.; Rana, N.P. Factors influencing adoption of mobile banking by Jordanian bank customers: Extending UTAUT2 with trust. Int. J. Inf. Manag. 2017, 37, 99–110. [Google Scholar] [CrossRef] [Scilit]
- Gefen, D.; Karahanna, E.; Straub, D.W. Trust and TAM in online shopping: An integrated model. MIS Q. 2003, 27, 51–90. [Google Scholar] [CrossRef] [Scilit]
- Luarn, P.; Lin, H.H. Toward an understanding of the behavioral intention to use mobile banking. Comput. Hum. Behav. 2005, 21, 873–891. [Google Scholar] [CrossRef] [Scilit]
- Moore, G.C.; Benbasat, I. Development of an instrument to measure the perceptions of adopting an information technology innovation. Inf. Syst. Res. 1991, 2, 192–222. [Google Scholar] [CrossRef] [Scilit]
- Dwivedi, Y.K.; Rana, N.P.; Jeyaraj, A.; Clement, M.; Williams, M.D. Re-examining the Unified Theory of Acceptance and Use of Technology (UTAUT): Towards a revised theoretical model. Inf. Syst. Front. 2019, 21, 719–734. [Google Scholar] [CrossRef] [Scilit]
- Chauhan, S. Acceptance of mobile money by poor citizens of India: Integrating trust into the technology acceptance model. Info 2015, 17, 58–68. [Google Scholar] [CrossRef] [Scilit]
- Oliveira, T.; Thomas, M.; Baptista, G.; Campos, F. Mobile payment: Understanding the determinants of customer adoption and intention to recommend the technology. Comput. Hum. Behav. 2016, 61, 404–414. [Google Scholar] [CrossRef] [Scilit]
- Kim, C.; Mirusmonov, M.; Lee, I. An empirical examination of factors influencing the intention to use mobile payment. Comput. Hum. Behav. 2010, 26, 310–322. [Google Scholar] [CrossRef] [Scilit]
- Hair, J.F.; Hult, G.T.M.; Ringle, C.M.; Sarstedt, M. A Primer on Partial Least Squares Structural Equation Modeling (PLS-SEM); SAGE Publications: Thousand Oaks, CA, USA, 2014. [Google Scholar]
- Putrevu, J.; Mertzanis, C. The adoption of digital payments in emerging economies: Challenges and policy responses. Digit. Policy Regul. Gov. 2024, 26, 476–500. [Google Scholar] [CrossRef] [Scilit]
- Noreen, M.; Ghazali, Z.; Mia, M.S. The impact of perceived risk and trust on adoption of mobile money services: An empirical study in Pakistan. J. Asian Finan. Econ. Bus. 2021, 8, 347–355. [Google Scholar]
- Slade, E.; Williams, M.; Dwivedi, Y. Devising a research model to examine adoption of mobile payments: An extension of UTAUT2. Mark. Rev. 2014, 14, 310–335. [Google Scholar] [CrossRef] [Scilit]
- Henseler, J.; Ringle, C.M.; Sarstedt, M. A new criterion for assessing discriminant validity in variance-based structural equation modeling. J. Acad. Mark. Sci. 2015, 43, 115–135. [Google Scholar] [CrossRef] [Scilit]
- Podsakoff, P.M.; MacKenzie, S.B.; Lee, J.Y.; Podsakoff, N.P. Common method biases in behavioral research: A critical review of the literature and recommended remedies. J. Appl. Psychol. 2003, 88, 879–903. [Google Scholar] [CrossRef] [Scilit] [PubMed]
- Kock, N. Common method bias in PLS-SEM: A full collinearity assessment approach. Int. J. e-Collab. 2015, 11, 1–10. [Google Scholar]
- Kock, N.; Lynn, G.S. Lateral collinearity and misleading results in variance-based SEM: An illustration and recommendations. J. Assoc. Inf. Syst. 2012, 13, 546–580. [Google Scholar] [CrossRef] [Scilit]
- Hair, J.F.; Ringle, C.M.; Sarstedt, M. PLS-SEM: Indeed a silver bullet. J. Mark. Theory Pract. 2011, 19, 139–152. [Google Scholar] [CrossRef] [Scilit]
- Faul, F.; Erdfelder, E.; Buchner, A.; Lang, A.G. Statistical power analyses using G*Power 3.1: Tests for correlation and regression analyses. Behav. Res. Methods 2009, 41, 1149–1160. [Google Scholar] [CrossRef] [Scilit] [PubMed]
- Kock, N.; Hadaya, P. Minimum sample size estimation in PLS-SEM: The inverse square root and gamma-exponential methods. Inf. Syst. J. 2018, 28, 227–261. [Google Scholar] [CrossRef] [Scilit]
- Al-Qeisi, K.; Dennis, C.; Alamanos, E.; Jayawardhena, C. Website design quality and usage behavior: Unified Theory of Acceptance and Use of Technology. J. Bus. Res. 2014, 67, 2282–2290. [Google Scholar] [CrossRef] [Scilit]
- Shareef, M.A.; Baabdullah, A.; Dutta, S.; Kumar, V.; Dwivedi, Y.K. Consumer adoption of mobile banking services: An empirical examination of factors according to adoption stages. J. Retail. Consum. Serv. 2018, 43, 54–67. [Google Scholar] [CrossRef] [Scilit]
- Fornell, C.; Larcker, D.F. Evaluating structural equation models with unobservable variables and measurement error. J. Mark. Res. 1981, 18, 39–50. [Google Scholar] [CrossRef] [Scilit]
- Hair, J.F., Jr.; Hult, G.T.M.; Ringle, C.M.; Sarstedt, M.; Danks, N.P.; Ray, S. Partial Least Squares Structural Equation Modeling (PLS-SEM) Using R: A Workbook; Springer Nature: Cham, Switzerland, 2021. [Google Scholar]
- Henseler, J.; Hubona, G.; Ray, P.A. Using PLS path modeling in new technology research: Updated guidelines. Ind. Manag. Data Syst. 2016, 116, 2–20. [Google Scholar] [CrossRef] [Scilit]
- Hu, L.T.; Bentler, P.M. Cutoff criteria for fit indexes in covariance structure analysis: Conventional criteria versus new alternatives. Struct. Equ. Model. 1999, 6, 1–55. [Google Scholar] [CrossRef] [Scilit]

Disclaimer/Publisher’s Note: The statements, opinions and data contained in all publications are solely those of the individual author(s) and contributor(s) and not of MDPI and/or the editor(s). MDPI and/or the editor(s) disclaim responsibility for any injury to people or property resulting from any ideas, methods, instructions or products referred to in the content. |
© 2026 by the authors. Licensee MDPI, Basel, Switzerland. This article is an open access article distributed under the terms and conditions of the Creative Commons Attribution (CC BY) license.