


Abstract
Regional sustainability increasingly depends on interactions among regional digitalization, green mobility, and tourism development, yet the temporal structure of these relationships remains insufficiently understood. Using a balanced panel of 31 provincial-level regions in mainland China from 2012 to 2023, this study constructs entropy-weighted composite indices of regional digitalization, green mobility, and tourism competitiveness. These indices are analyzed using a panel vector autoregression model, Granger-causality tests, impulse-response functions, and forecast error variance decomposition. The results identify a digitally centered and asymmetric pattern of lagged predictive relationships from regional digitalization to green mobility and tourism competitiveness, from green mobility to tourism competitiveness, and from tourism competitiveness back to regional digitalization. These relationships differ markedly in their temporal profiles. Specifically, responses to digitalization peak near one-fifth of a standard deviation and persist. Digitalization shocks account for an increasing share of the forecast error variance of green mobility and tourism competitiveness over time, whereas the response of tourism competitiveness to green mobility emerges quickly but attenuates over time. By integrating the three systems within a joint dynamic framework, this study extends research based on separate pairwise relationships and shows that they co-evolve at different speeds. The findings support long-term digital investment and closer coordination between tourism demand and green-mobility provision in regional sustainability strategies.
1. Introduction
Regional digitalization is reshaping the conditions under which regions pursue sustainable development. Its significance lies not only in technological progress, but also in its capacity to strengthen information connectivity, improve coordination across economic and public-service systems, and enable more efficient use of regional resources and infrastructure [1,2]. These enabling functions are particularly relevant to mobility, where growing travel demand and continued reliance on conventional transport have intensified congestion, energy consumption, carbon emissions, and other environmental costs. The transition toward green mobility has consequently become an increasingly urgent component of regional sustainable development [3,4].
The tourism sector is an important component of regional economies and a key arena in which these two transitions converge. Its development depends heavily on cross-regional information flows, coordination among firms and public agencies, and the movement of visitors. Tourism-related transport adds to the environmental burden of travel [5], whereas accessible and low-carbon mobility improves how visitors reach and experience destination resources [6]. Integrating regional digitalization with green mobility can therefore improve regional data connectivity and service coordination while reducing the environmental pressures associated with visitor movement. Tourism competitiveness is therefore increasingly connected to the joint evolution of regional digitalization and green mobility rather than to either system in isolation.
Research has captured several parts of this convergence, but mainly one relationship at a time, either by estimating the effect of one system on another or, particularly in Chinese studies, by measuring the coupling coordination degree between two systems [7,8]. Studies of the digitalization–tourism link have estimated the effect of smart-city construction on tourism efficiency [9] or examined the relationship between the digital economy and destination competitiveness [10]. Using a two-way fixed-effects model, Yin et al. [11] found that the digital economy supports green mobility. Transport accessibility and smart-mobility practices have also been linked to tourism competitiveness [12]. In the reverse direction, Li et al. [13] found that changes in visitor demand encourage the digital transformation of tourism enterprises. Case studies by Dušek et al. [14] and Nicholson [15] consider the three domains together and show how digital tools help integrate visitor flows into sustainable mobility. Their case-based designs are well suited to documenting mechanisms within destinations, but are not intended to trace how the systems adjust to one another over time.
Thus, even when panel data are used, existing studies either examine one pair of constructs in a prespecified direction or document cases without tracing their dynamics. Although PVAR models have been applied in tourism research [16,17], to the best of our knowledge, they have not been used to examine these three systems jointly. A search of Web of Science, Scopus, and CNKI in October 2026, combining terms for panel vector autoregression, digitalization, transport or green mobility, and tourism, identified no study that estimated the three systems within one PVAR framework. Three questions therefore remain open: whether a directional link persists once the past values of the third system are considered; whether links running in different directions form a feedback process; and when cross-system responses emerge, how long they persist, and whether the systems adjust at different speeds.
To address these questions, this study uses panel data for 31 provincial-level regions in mainland China from 2012 to 2023. China offers an informative setting because its digital infrastructure development and green transport transition have been promoted through national policy initiatives, including the Broadband China strategy and low-carbon transport system pilots [18,19], yet provinces differ considerably in digital development, mobility systems, and tourism conditions. For example, digital financial inclusion is markedly higher in eastern than in western provinces [20]. This combination allows cross-system dynamics to be compared across regions under a common institutional framework. Entropy-weighted composite indices of the three systems are incorporated into a panel vector autoregression (PVAR) model that treats all three as endogenous. The study has two objectives. The first, corresponding to the first two questions, is to identify the directional predictive relationships among the three systems when they are estimated jointly and to assess whether these relationships are consistent with a directional feedback cycle. The second, corresponding to the third question, is to compare the timing, persistence, and relative contribution of cross-system responses using impulse response functions and forecast error variance decomposition. Answering these questions also matters for policy, because differences in the timing and persistence of responses affect how digital, mobility, and tourism policies should be coordinated and sequenced.
This study makes three contributions. First, by estimating regional digitalization, green mobility, and tourism competitiveness within the same endogenous system, the study moves beyond separately estimated pairwise relationships. It assesses whether the directional links remain when the historical dynamics of the third system are taken into account, whether their overall pattern is consistent with a feedback cycle, and whether shocks are followed by delayed system-wide responses consistent with propagation through the third system. Second, it adds temporal evidence to this literature by comparing when cross-system responses emerge, how long they persist, and how their relative importance changes over time. The results indicate that the systems adjust at different speeds, with regional digitalization showing the most persistent responses and accounting for a growing share of the forecast error variance of the other two systems as the horizon lengthens. Third, from a practical perspective, this dynamic evidence provides a basis for sequencing regional sustainability policy, distinguishing long-term digital investment from mobility measures whose tourism effects are more immediate, and identifying where coordination between tourism and transport authorities is needed. In this study, sustainability enters as an interpretative framework rather than as an observed outcome.
2. Literature Review and Theoretical Framework
2.1. Regional Digitalization and Tourism Competitiveness
Regional digitalization is increasingly regarded as a source of tourism competitiveness because tourism depends heavily on information exchange, resource coordination, and market connectivity. It refers to the diffusion and use of digital resources across a regional system, supported by both digital foundations and digital applications [2]. By reducing information and transaction costs, expanding market reach, and improving supply–demand matching, digitalization helps translate tourism resources into service quality and market performance [21]. Empirical studies support this enabling role. Smart-city construction has been found to improve destination tourism efficiency through informatization, technological innovation, and industrial upgrading [9], and digital infrastructure, finance, innovation, and governance form complementary configurations associated with high tourism competitiveness [10]. Digital finance appears particularly important: evidence from OECD economies indicates that financial technology is associated with higher tourist arrivals [22]. Accordingly, the following hypothesis is proposed:
H1:
Regional digitalization positively predicts subsequent improvements in tourism competitiveness.
2.2. Regional Digitalization and Green Mobility
Beyond its role in tourism development, regional digitalization is also a key enabler of the transition toward green mobility. By enabling the real-time collection and exchange of data on traffic conditions, passenger demand, and service availability, digitalization improves the match between transport supply and travel demand. Transport operators can use these data to plan routes and dispatch vehicles more accurately, thereby increasing vehicle utilization while reducing empty travel and emissions [23]. For users, smart applications provide reliable information on arrival times, routes, and transfers, reducing travel uncertainty and making public transport and shared mobility more attractive alternatives to private cars [24], particularly when congestion and parking difficulties increase the costs of driving. At the governance level, big-data-enabled traffic management allows public authorities to manage congestion more precisely, improve network efficiency, and reduce transport emissions [25]. At the provincial level, Lee et al. [26] report a negative association between digital economy development and transport-sector CO2 emissions in China, with variation across regions and levels of urbanization. More directly, Yin et al. [11] found that digital economy development promotes green mobility and that this relationship is strengthened by low-carbon transport policies. Accordingly, the following hypothesis is proposed:
H2:
Regional digitalization positively predicts subsequent improvements in green mobility.
2.3. Green Mobility and Tourism Competitiveness
Green mobility could strengthen tourism competitiveness by improving how visitors reach and experience a destination while reducing the environmental burden of their movement. Destination-competitiveness models treat accessibility and transport services as supporting resources that determine how effectively visitors can reach and use attractions [6]. By combining efficient public transport with walking and cycling, green mobility reduces dependence on private vehicles [27] and improves both accessibility and environmental quality. Empirically, transport accessibility and connectivity have been associated with regional tourism competitiveness [12], transport modes with tourist satisfaction [28], and smart-mobility practices with tourism inflows [29]. Accordingly, the following hypothesis is proposed:
H3:
Green mobility positively predicts subsequent improvements in tourism competitiveness.
2.4. Dynamic Interactions Among the Three Systems
The relationships in H1–H3 are well supported when examined individually and, in this study, serve as the building blocks of a three-variable system. Less is known about whether they persist when the three systems evolve together and whether they form a feedback cycle. Co-evolutionary theory, which holds that interdependent actors, sectors, and institutions adjust to one another over time and has been applied to explain how tourism areas develop [30], offers a framework for this question. From this perspective, regional digitalization, green mobility, and tourism competitiveness are interdependent subsystems whose mutual adjustment may be reciprocal, lagged, and uneven. Three considerations follow.
First, regional digitalization may be linked to tourism both directly and indirectly through mobility, because digital infrastructure connects visitors, service providers, and mobility systems. Second, tourism competitiveness may feed back into regional digitalization. Demand-pull innovation theory holds that expanding demand raises the expected returns to technological investment [31]. Growing visitor flows increase demand for online information, digital booking, and data-based destination management, and changes in tourist demand have been found to encourage the digital transformation of tourism enterprises, particularly in regions with stronger innovation environments and big-data capabilities [13]. At the regional level, provincial panel evidence from China also shows that tourism industry development positively predicts subsequent informatization [32]. Third, co-evolution is likely to be uneven. Transitions in transport systems involve co-evolving changes in technology, markets, policy, culture, and user practices [33], so whether demand from a single sector such as tourism can reshape provincial mobility systems is theoretically ambiguous. No directional expectation is therefore specified for the path from tourism competitiveness to green mobility, or for that from green mobility to regional digitalization. Accordingly, the following hypothesis is proposed:
H4:
Within the same three-variable system, tourism competitiveness positively predicts subsequent regional digitalization.
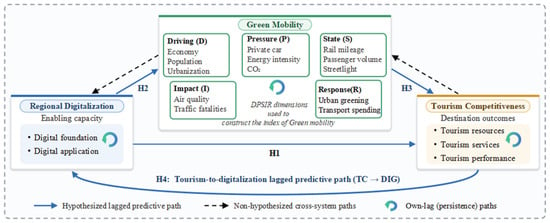
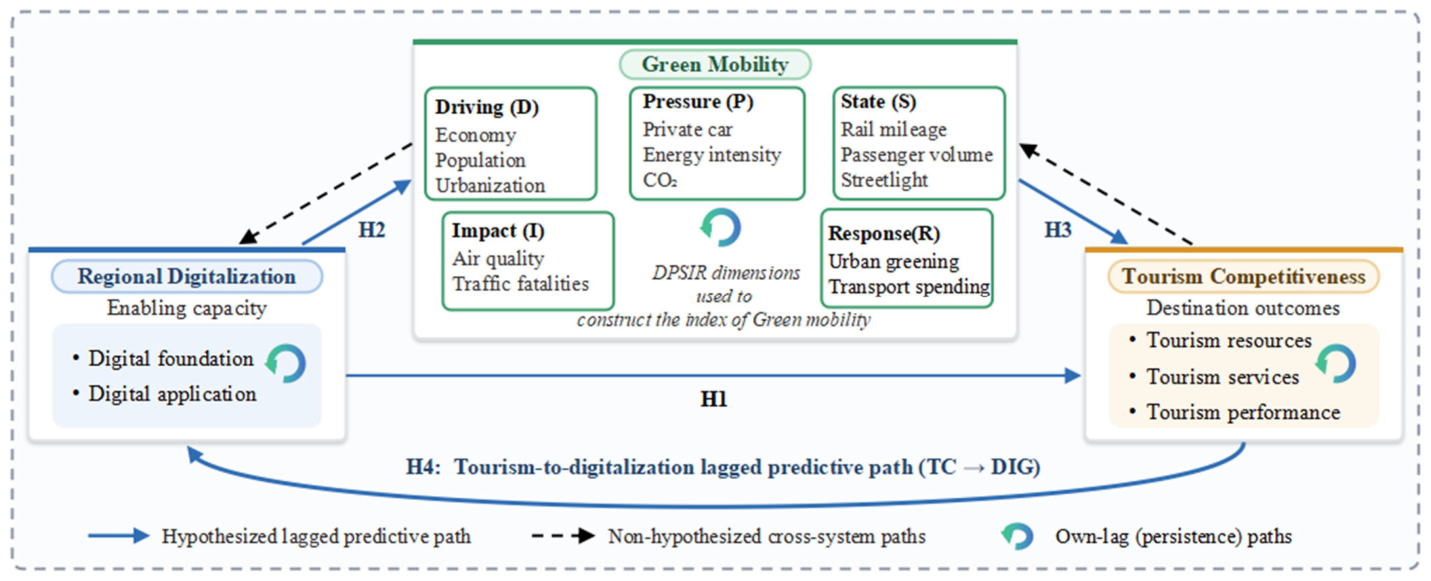
If H2, H3, and H4 hold jointly, the three links form a directional cycle of lagged predictive relationships (DIG → GM → TC → DIG). The conceptual framework is shown in Figure 1.
Figure 1.
Conceptual framework. Note: The DPSIR dimensions are used to construct the GM index and do not represent estimated pathways. The placement of green mobility illustrates the integrated three-system framework and does not imply a mediating role.
3. Data and Methodology
3.1. Data Source
This study uses provincial panel data for 31 provincial-level regions in mainland China from 2012 to 2023. Hong Kong, Macao, and Taiwan are excluded due to differences in statistical systems and data availability. The data are primarily collected from the China Statistical Yearbook, the China Culture and Tourism Statistical Yearbook and the China City Statistical Yearbook. Data for digital financial inclusion are obtained from the Institute of Digital Finance, Peking University. Where the same indicator is reported in multiple sources, nationally compiled statistical yearbooks are used whenever possible to ensure consistency in statistical definitions, while provincial statistical yearbooks are used to supplement unavailable observations. Of the 10,416 indicator observations, 23 (0.22%) were missing. The 11 isolated interior gaps were filled by linear interpolation of the raw indicators before normalization, using available observations on either side of each gap [34]. The remaining 12 missing observations concern inbound overnight tourist arrivals and international tourism receipts in Tibet and Qinghai during 2020–2022. These values were estimated by multiplying each province’s 2019 value by the ratio of the corresponding national value in that year to its 2019 level [35]. This procedure retains provincial starting levels but imposes national proportional changes on the missing observations; it cannot recover province-specific pandemic trajectories. Both interpolation and ratio-based estimation may affect indicator dispersion and the estimated dynamics of the composite indices.
3.2. Variable Measurement
3.2.1. Regional Digitalization
Considering that regional digitalization involves both digital foundations and practical applications, empirical studies generally construct multidimensional and comprehensive indicator systems rather than relying on a single measure [1,36,37]. Following this perspective, this study measures regional digitalization from two dimensions: digital foundation and digital application. The digital foundation dimension captures the conditions supporting digital connectivity and includes six indicators: total volume of telecommunications services, software business revenue, Internet broadband access ports, Internet broadband subscribers, total mobile phone users, and mobile phone penetration rate. The digital application dimension captures the practical use of digital services in economic and social activities and is proxied by the Peking University Digital Financial Inclusion Index [20]. This index reflects the breadth of coverage, depth of use, and degree of digitalization of financial services, providing a comparable province-level indicator of digital application [38]. The indicators are assigned positive attributes because higher values represent greater digital activity, wider connectivity and service use, or broader digital financial application. They are then normalized over the full province-year sample and aggregated using the entropy-weighting method. Detailed indicator definitions, attributes, and weights are reported in Table 1.
Table 1.
Measurement framework of regional digitalization.
3.2.2. Green Mobility
Green mobility is closely related to concepts such as sustainable mobility and green transportation, although these terms differ somewhat in emphasis. Sustainable mobility generally adopts a broader perspective that incorporates the economic, social, and environmental dimensions of transportation, whereas green transport focuses more directly on reducing resource consumption, emissions, and other environmental burdens [3]. In this study, green mobility is defined at the regional-system level as the capacity of a transportation system to meet mobility needs through accessible and efficient transport services while limiting resource consumption and environmental pressures and responding to sustainability goals. This definition therefore covers not only transport supply, but also the pressures, outcomes, and governance efforts associated with mobility development [27].
Given its systemic and multidimensional nature, regional green mobility is increasingly assessed using composite indicator systems rather than a single proxy [4,10,41]. This study constructs the green mobility index using the Driving Force–Pressure–State–Impact–Response (DPSIR) framework, which extends the Pressure–State–Response framework of the OECD [42] and has been incorporated into the indicator system of the European Environment Agency [43]. Its systematic structure enables the socioeconomic drivers, transport-related pressures, system conditions, resulting impacts, and policy responses associated with regional green mobility to be considered within a unified framework [27,44]. Specifically, in the driving-force dimension, GDP per capita and urbanization are assigned positive attributes because they represent economic resources and urban conditions that may support public transport. Natural population growth is assigned a negative attribute because, for a given level of transport capacity, it increases mobility demand and pressure on existing services. In the pressure dimension, private car ownership, per capita carbon emissions, and energy intensity are negative because they represent environmental pressure to which low-carbon mobility responds. In the state dimension, rail transit operating mileage and daily per capita public transit passenger volume are assigned positive attributes as measures of transport provision and use, while streetlight coverage is a positive proxy for pedestrian conditions. In the impact dimension, air quality is positive and road traffic fatalities are negative, reflecting environmental quality and safety. In the response dimension, built-up area greening and government transportation expenditure are positive proxies for supportive urban conditions and policy effort. Detailed indicator measurement, attributes and weights are reported in Table 2.
Table 2.
Measurement framework of green mobility.
3.2.3. Tourism Competitiveness
Destination competitiveness models identify core resources and supporting factors as key determinants of competitiveness, and treat visitor arrivals and tourism receipts as indicators of its outcomes [6,48]. The measurement literature distinguishes between absolute-performance approaches, which describe observed tourism resources, service capacity, and market outcomes, and relative-efficiency approaches, which evaluate how effectively a destination transforms available resources into tourism outputs relative to a benchmark [49,50]. Accordingly, this study adopts the former approach and defines tourism competitiveness operationally as a destination’s strength in tourism resources and service capacity, together with its ability to attract visitors and generate tourism receipts. Because destination performance depends on the joint contribution of these elements rather than on any single attribute [49], the index is constructed from three dimensions, namely tourism resources, tourism services, and tourism performance. Tourism resources are represented by the numbers of A-grade tourist attractions and museums, capturing a destination’s attraction and cultural-resource base. Tourism services are measured by the numbers of star-rated hotels and travel agencies, reflecting regional reception and service capacity. Tourism performance is captured by domestic tourist arrivals, domestic tourism revenue, inbound overnight tourist arrivals, and international tourism receipts, representing realized outcomes in domestic and international markets. All eight indicators are assigned positive attributes because higher values represent a larger tourism resource base, greater service capacity, or stronger realized market performance. The choice of measures draws on previous quantitative assessments of tourism competitiveness and destination performance [51,52,53]. Detailed indicator measurement, attributes and weights are reported in Table 3.
Table 3.
Measurement framework of tourism competitiveness.
3.3. Methodology
3.3.1. The Entropy Weighting Method
The entropy-weighting method is grounded in Shannon’s concept of information entropy [55] and determines indicator weights based on the information contained in the observed data. Indicators with greater observed dispersion provide more discriminatory information and therefore receive greater weights. This data-driven procedure reduces direct reliance on researchers’ subjective judgments. Because entropy weights depend on observed dispersion, they may be sensitive to the statistical characteristics and range of the sample [56]. In this study, the entropy-weighting method is employed to integrate multiple indicators into comprehensive indices of regional digitalization, green mobility, and tourism competitiveness. The specific steps are as follows:
The first step is constructing the initial indicator matrix. Assuming that the evaluation system contains N observations and M indicators, the original data matrix can be expressed as
where xij represents the original value of indicator j for observation i.
The second step is data normalization. Since different indicators may have different measurement units and attribute directions, the min–max normalization method is applied. Equation (2) calculates the normalized value for positive indicators and Equation (3) applies to negative indicators:
The third step is calculating the proportion of each indicator. The contribution of observation i to indicator j is calculated as
The fourth step is calculating the entropy value of each indicator. A smaller entropy value indicates greater variation and more information provided by the indicator. The entropy value is obtained as
The fifth step is determining the weight of each indicator. The calculation formula is as follows:
The sixth step is constructing the composite index. The comprehensive index for each observation is calculated as
where wj represents the weight of indicator j, and Ui denotes the final composite index. For all three indices, the entropy weights are calculated once using the pooled province–year observations and are then applied consistently to all years, rather than being recalculated separately for each year. Holding the weights constant ensures that changes in the composite indices over time reflect changes in the underlying indicators rather than changes in the weighting scheme, thereby preserving the intertemporal comparability required by the PVAR analysis.
3.3.2. Panel Vector Autoregression Model
To investigate the dynamic interactions among regional digitalization, green mobility, and tourism competitiveness, this study employs a panel vector autoregression (PVAR) model using Stata 17.0. The econometric foundation for estimating vector autoregressions with panel data was developed by Holtz-Eakin et al. [57], who introduced a GMM approach for dynamic multivariate panel systems. Love and Zicchino [58] subsequently demonstrated how orthogonalized impulse response functions and forecast error variance decomposition can be used within a PVAR framework to trace dynamic responses to shocks and their relative importance over time. Unlike single-equation panel models that impose a fixed distinction between dependent and explanatory variables, the PVAR framework treats DIG, GM, and TC as endogenous, allowing each variable to depend on its own past values and those of the other variables [59]. It is therefore suitable for examining mutual adjustment among the three systems within a single multivariate framework.
PVAR has been applied in tourism research. He et al. [16] examined the dynamic relationship among red tourism, airline seat capacity, and COVID-19 conditions in China and found that red tourist numbers significantly predicted subsequent changes in airline seat capacity. Duncan and Hailemariam used the model to examine how tourism demand responds over time to changes in travel-related Internet search intensity, finding that the positive response of visitor nights persisted for several quarters [17]. These applications demonstrate the usefulness of PVAR for examining the direction and persistence of dynamic relationships in tourism-related systems.
The model is specified as follows:
where Yit represents the vector of endogenous variables, including regional digitalization (DIG), green mobility (GM), and tourism competitiveness (TC), expressed as , β0 represents the intercept term, Bk denotes the coefficient matrix for the k-th lag, where p represents the optimal lag order selected. μi and γt denote province-specific and year-specific effects, respectively; ξit is the random disturbance vector.
Following Abrigo and Love [59], the system is estimated using the generalized method of moments (GMM), with forward orthogonal deviations applied to remove province-specific effects and appropriately lagged values of the endogenous variables used as instruments. Because the lagged values of DIG, GM, and TC enter every equation, each cross-system coefficient is estimated conditional on the lagged histories of all three indices. The three equations therefore form a single multivariate dynamic system, with the directional coefficients presented separately only to facilitate interpretation. Panel Granger-causality tests are used to assess predictive direction, impulse response functions to trace the magnitude and persistence of responses to shocks, and forecast error variance decomposition to evaluate the relative contributions of different shocks over time. Accordingly, the results are interpreted as evidence of dynamic predictive interdependence rather than definitive structural causation.
4. Empirical Results
4.1. Descriptive Analysis
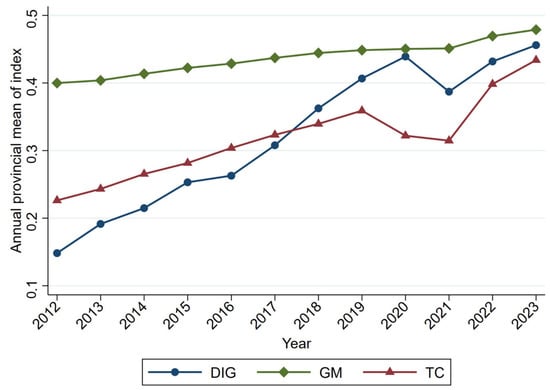
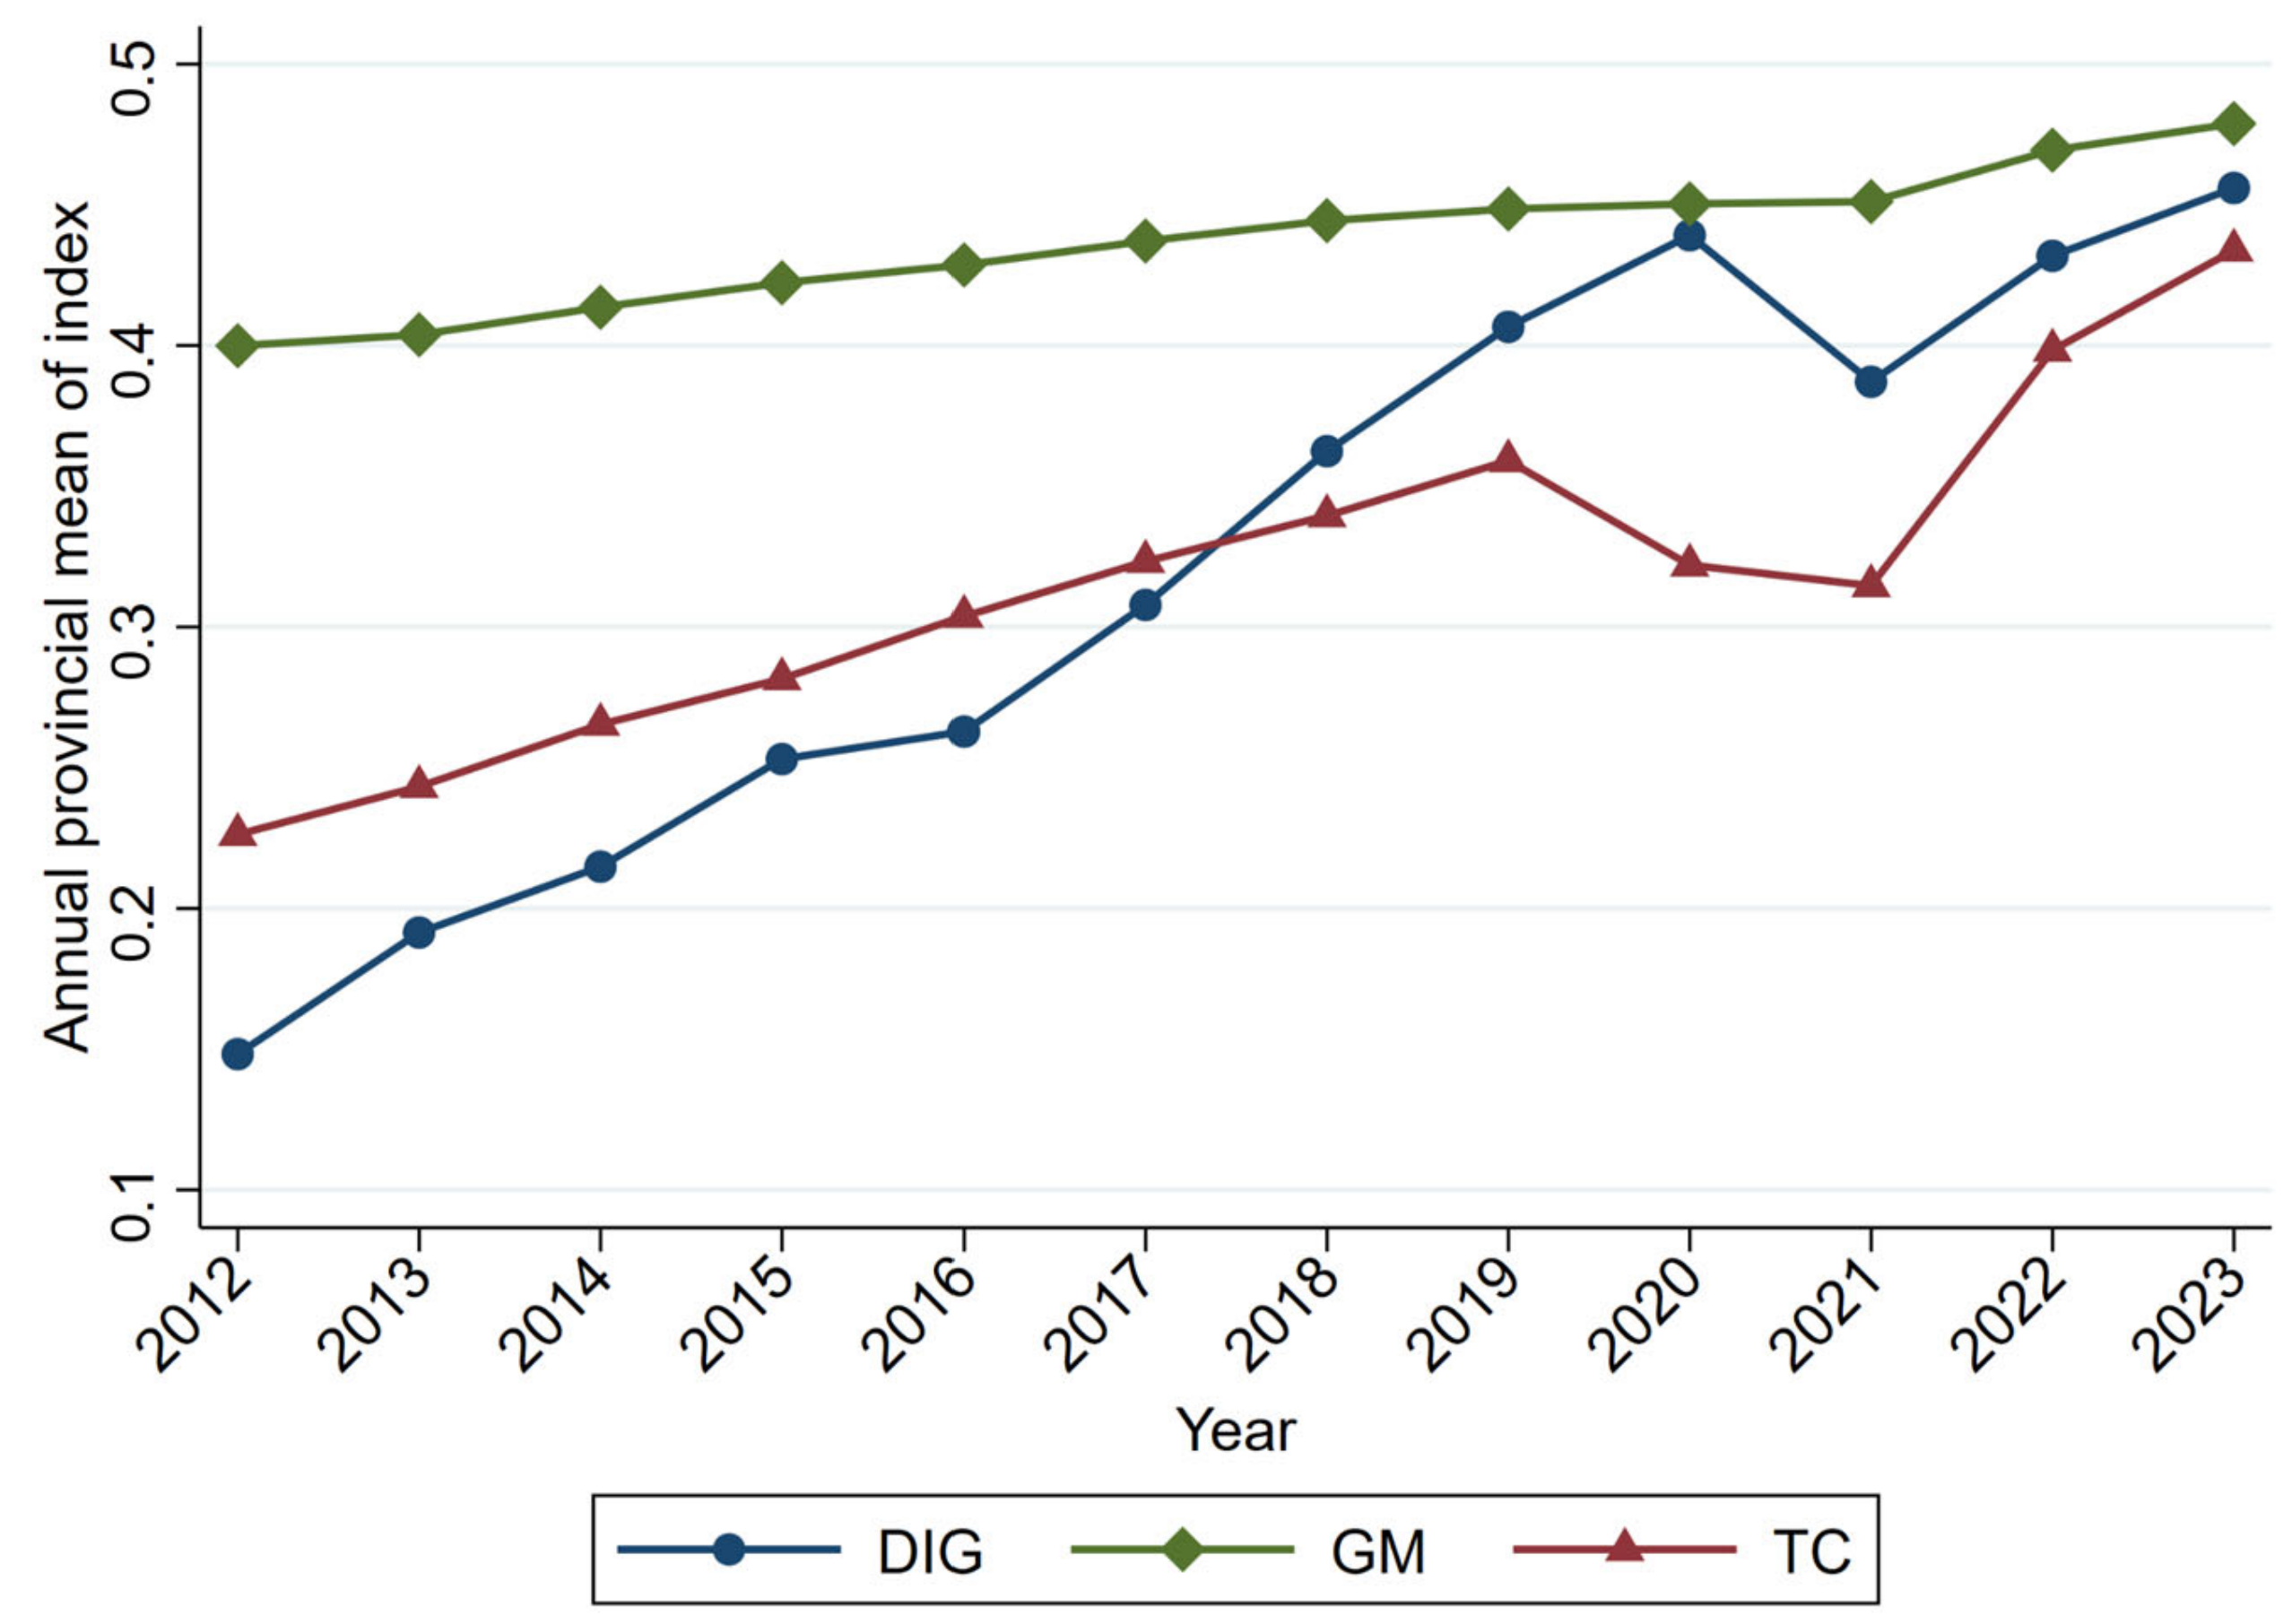
Table 4 reports the descriptive statistics of the main variables. Each variable contains 372 observations, corresponding to a balanced panel of 31 provincial-level regions from 2012 to 2023. DIG exhibits the greatest dispersion, with a standard deviation of 0.161 and values ranging from 0.047 to 0.972. Its mean of 0.322 exceeds its median of 0.291, and its skewness of 1.172 indicates a relatively pronounced right-skewed distribution. GM displays more moderate positive skewness, with a mean of 0.437, a median of 0.428, and a skewness of 0.444. By comparison, the mean and median of TC are nearly identical, at 0.318 and 0.316, respectively, and its skewness of 0.092 indicates an approximately symmetric distribution. Supplementary Table S1 provides the between- and within-province standard deviations and pairwise correlations. Within-province variation is similar to between-province variation for DIG, greater for TC, and smaller for GM. Figure 2 plots the annual mean of each index. GM increases steadily, while DIG rises overall despite a temporary decline in 2021. TC rises from 2012 to 2019, declines each year from 2020 to 2022, and rebounds in 2023. The downturn in TC coincides with the COVID-19 period and provides context for the dynamic analysis that follows.
Table 4.
Descriptive statistics of the main variables.
Figure 2.
Annual mean values of DIG, GM, and TC from 2012 to 2023.
4.2. Unit Root and Lag Order Selection
Before estimating the PVAR model, panel unit root tests were conducted to examine the stationarity of the variables. Given the short time dimension of the provincial panel dataset, the Harris–Tzavalis (HT) test was used as the primary test because its asymptotic framework assumes a fixed (T) as (N) increases. To ensure the robustness of the stationarity assessment, additional tests, including the Levin–Lin–Chu (LLC), Im–Pesaran–Shin (IPS), and ADF-Fisher tests, were also conducted. All specifications include a linear time trend, and the series were cross-sectionally demeaned to mitigate the influence of common shocks. As reported in Table 5, the HT test rejects the null hypothesis that all panels contain a unit root for DIG, GM, and TC. The complementary tests yield consistent results, providing evidence that all three series are stationary.
Table 5.
Panel unit root test results.
The optimal lag order is determined using the MBIC, MAIC, and MQIC criteria proposed by Andrews and Lu [60]. Selecting the appropriate lag length is a critical step in PVAR modeling, as it directly affects the accuracy of the estimated dynamic relationships and the predictive performance of the system. Among specifications for which these criteria can be computed, lower values are preferred. As reported in Table 6, all three criteria attain their minimum values at lag 1, consistently favoring a first-order specification. Therefore, PVAR (1) is selected to investigate the dynamic interactions among regional digitalization, green mobility, and tourism competitiveness.
Table 6.
Lag order selection criteria for the PVAR model.
4.3. PVAR Estimation
Table 7 reports the estimation results of the PVAR (1) model. The three equations are estimated as one system, and each equation includes the lagged values of all three indices, so each cross-system coefficient is conditional on the lagged values of the other indices. Following Abrigo and Love [59], the model is estimated by GMM using forward orthogonal deviations, also known as the Helmert transformation. This transformation removes province-specific effects, while appropriately lagged values are used as instruments for the transformed endogenous variables. Specifically, the lagged coefficients of DIG, GM, and TC in their corresponding equations are positive and statistically significant at the 1% level, suggesting that each system maintains significant persistence of different magnitudes. The cross-system associations are asymmetric: lagged DIG is positively associated with GM (β = 0.319) and TC (β = 0.141), lagged GM with TC (β = 0.608), and lagged TC with DIG (β = 0.582), all at the 1% level. However, the coefficients of GM on DIG and TC on GM are statistically insignificant. Thus, DIG and TC exhibit bidirectional lagged associations, whereas the remaining significant cross-system associations are directional.
Table 7.
PVAR (1) model estimation results.
Table 7 also reports the GMM diagnostics. The Hansen J-test does not reject the overidentifying restrictions (χ2(18) = 18.19, p = 0.443). The Arellano–Bond tests, obtained from auxiliary equation-specific GMM estimations using the same sample, assess serial correlation in first-differenced errors. AR (1) is significant in all three equations, as expected after differencing. The AR (2) tests do not reject the null hypothesis of no second-order serial correlation at the 5% level. These auxiliary diagnostics therefore provide no evidence at that level of second-order serial correlation that would raise concerns about the use of lagged instruments in the GMM estimation.
4.4. Granger-Causality
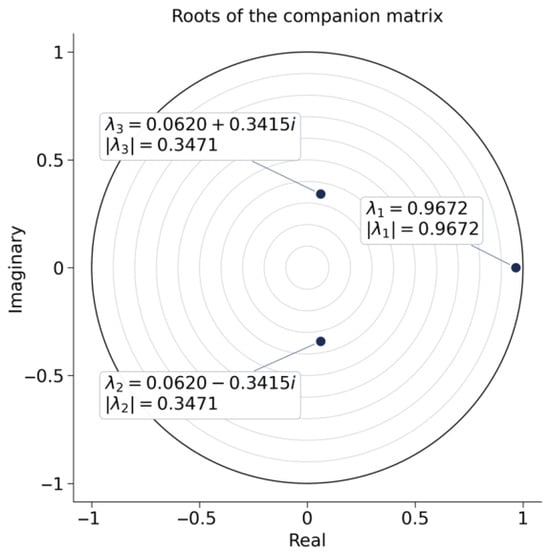
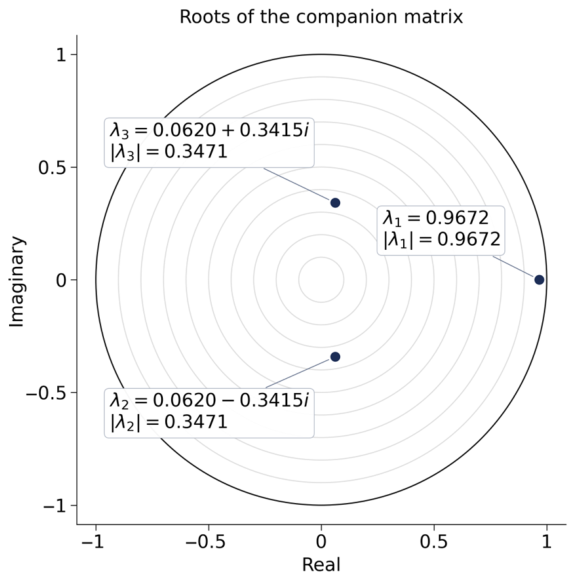
Before interpreting the dynamic responses, we examine the stability of the estimated PVAR system. As shown in Figure 3, the eigenvalue stability condition is satisfied, with the largest eigenvalue modulus equal to 0.9672, which is below one. The PVAR (1) model therefore meets the stability condition for computing impulse responses and forecast error variance decompositions. However, the dominant root is close to one, indicating substantial persistence. Given the panel’s 12-year time dimension, results at longer forecast horizons, particularly year 10, should be interpreted cautiously as model-implied patterns.
Figure 3.
Stability test of the PVAR (1) model. Notes: λ1 is the dominant real eigenvalue of the companion matrix, λ2 and λ3 are a complex-conjugate pair. |λ| denotes the eigenvalue modulus, i is the imaginary unit, and the outer black circle represents |λ| = 1.
Table 8 presents the Granger-causality tests for each equation of the PVAR system. In addition to testing each excluded variable separately, it includes a joint test (ALL) of whether the lagged values of both other variables can be excluded. The joint tests reject the null hypothesis in all three equations (p < 0.001), so each system is predicted by the other two when they are considered together. Taken separately, DIG Granger-causes both GM and TC, GM Granger-causes TC, and TC Granger-causes DIG. GM does not Granger-cause DIG, nor does TC Granger-cause GM. Together with the positive coefficients in Table 7, these results support H1–H4 in the baseline PVAR (1) specification. The joint support for H2, H3, and H4 is consistent with a directional cycle of lagged predictive relationships (DIG → GM → TC → DIG). Granger-causality is interpreted here as temporal predictive precedence rather than structural causation.
Table 8.
Granger-causality test results.
To assess sensitivity to sample composition, sample period, and lag length, we estimated an alternative PVAR (2) model and re-estimated PVAR (1) on two restricted samples: one excluding Beijing and Guangdong and the other covering the contiguous pre-pandemic period, 2012–2019. All three specifications satisfy the stability condition (Supplementary Table S3). Both restricted samples yield the same Granger-causality conclusions as the baseline, and the four hypothesized cross-system associations remain positive and statistically significant. In PVAR (2), DIG continues to Granger-cause GM and TC, and GM continues to Granger-cause TC. However, the joint test of the two TC lags in the DIG equation is not significant (p = 0.382). Thus, the predictive links from DIG to GM and TC and from GM to TC remain supported across these checks, whereas the feedback from TC to DIG is supported in the baseline and restricted samples but is sensitive to the lag specification. PVAR (1) remains the baseline because the lag-selection criteria favor one lag (Table 6).
4.5. Impulse Response Analysis
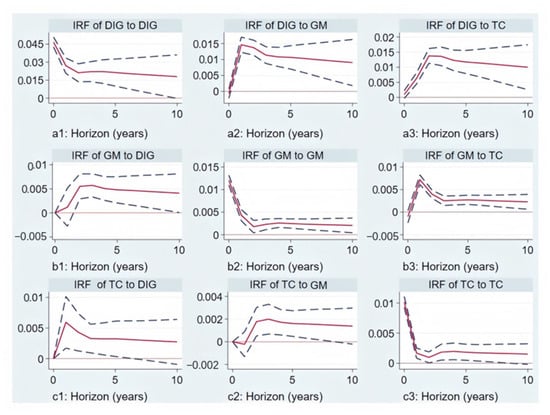
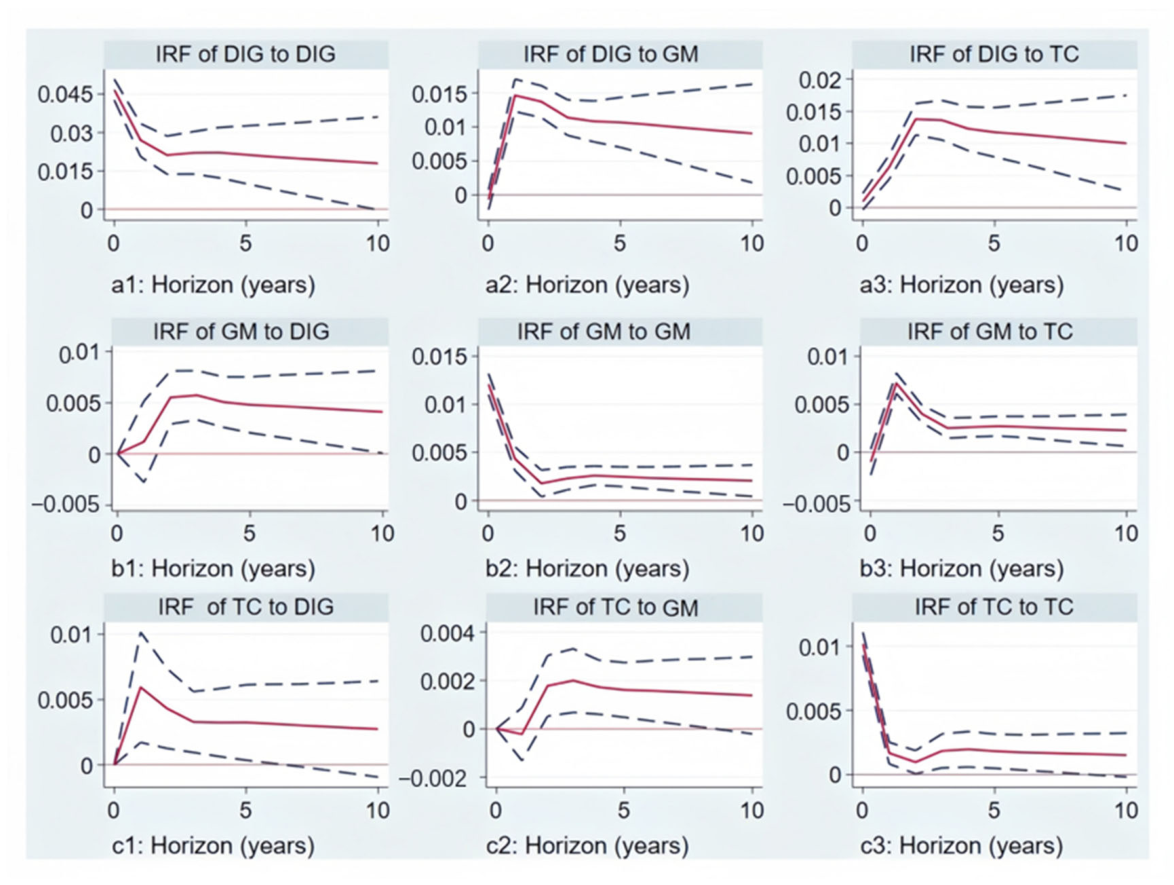
To further examine the dynamic adjustment among three systems, impulse-response analysis was conducted based on the PVAR (1) model. Figure 4 reports the orthogonalized impulse responses to a one-standard-deviation shock over ten years, with 95% confidence intervals from 500 Monte Carlo replications. Given the persistence of the estimated system, responses near the end of this horizon should be interpreted as model-implied patterns rather than precise forecasts. The values are given in Supplementary Table S2. A response is treated as significant only while its confidence interval excludes zero. Because the indices range from 0 to 1 and change slowly, the raw responses are small. To show their size relative to the normal variation in each index, each peak is also expressed as a share of the sample standard deviation of the responding index (see Table 4). Each system responds positively to its own shock, and the response declines gradually, indicating clear persistence (see Figure 4(a1,b2,c3)).
Figure 4.
Impulse response functions. Notes: Panels (a1–a3) show the responses of DIG, GM, and TC, respectively, to a DIG shock; panels (b1–b3) show their responses to a GM shock; and panels (c1–c3) show their responses to a TC shock. The orthogonalized shocks are identified using a Cholesky decomposition with the ordering DIG, GM, TC. The horizontal axis represents the forecast horizon (years), and the vertical axis denotes the magnitude of the impulse response. The solid lines represent the estimated impulse responses, while the dashed lines indicate the 95% confidence intervals. The results are based on 500 Monte Carlo replications over a 10-year horizon.
The largest cross-system responses follow a DIG shock. GM peaks at 0.0147 in the first year and TC at 0.0138 in the second, about 20% and 18% of their standard deviations (0.073 and 0.078). Both peaks exceed the initial responses of GM and TC to their own shocks (0.0121 and 0.0102). The responses remain significant from the first year onward and still retain 62% and 73% of their peaks in the tenth year (see Figure 4(a2,a3)). These substantial and long-lasting responses are consistent with H2 and H1.
The response of TC to a GM shock peaks at 0.0072 in the first year (about 9% of the standard deviation of TC). It falls to 0.0040 in the second year and then remains at around 0.0025. The 95% confidence intervals exclude zero at all reported horizons from year 1 onwards. At year 10, the response is 0.00229 (95% CI [0.00068, 0.00390]); its lower bound is close to zero but remains positive (Figure 4(b3); Supplementary Table S2). This pattern is consistent with H3. The response of DIG to a GM shock becomes significant only in the second year. It peaks at 0.0057 in the third year (about 4% of the standard deviation of DIG), and its lower bound approaches zero by the tenth year (Figure 4(b1)). Although the Granger test does not detect a direct predictive relationship from GM to DIG (Table 8), this delayed response is consistent with possible propagation through TC.
Following a positive TC shock, the estimated response of DIG peaks at 0.0059 in the first year, equivalent to about 4% of the standard deviation of DIG. The response remains statistically significant until around the sixth year (Figure 4(c1)), consistent with H4. The response of GM to a TC shock peaks at 0.0020 in the third year, equivalent to 3% of the standard deviation of GM, and is significant from the second to about the eighth year (see Figure 4(c2)). Because TC does not Granger-cause GM, this response is consistent with propagation through DIG. The response to a TC shock and the propagated responses are significant but small, at 3–4% of a standard deviation, compared with about one-fifth for the responses to a DIG shock.
Together with the Granger-causality results, the impulse responses are consistent with the directional cycle (DIG → GM → TC → DIG) implied jointly by H2, H3, and H4. The baseline Cholesky ordering DIG, GM, TC assumes that digital conditions may register within a year in mobility and tourism, and mobility conditions in tourism, whereas tourism-related adjustments to province-wide systems may take longer. This assumption concerns contemporaneous shocks and does not restrict lagged feedback. The signs and timing of the main impulse responses remain unchanged when the variables are reordered (Supplementary Figure S1).
4.6. Variance Decomposition
Forecast error variance decomposition is used to compare the relative importance of shocks from the three systems (Table 9). At the one-year horizon, the forecast error variance of each variable is explained mainly by its own shocks. As the horizon lengthens, cross-system shocks become more important, but asymmetrically. DIG remains largely explained by its own shocks, which account for 96.31% of its forecast error variance at the five-year horizon and 95.27% at the ten-year horizon. TC shocks explain less than 2% of the forecast error variance of DIG at the five- and ten-year horizons. The lagged TC coefficient of 0.582 (Table 7) refers to a full one-unit change in TC, whereas a one-standard-deviation TC shock initially changes TC by only 0.0102 index units (Figure 4(c3); Supplementary Table S2). The feedback is therefore statistically significant but small in its contribution to forecast variance, which is also consistent with its sensitivity to the lag order. By contrast, the share of GM’s forecast error variance explained by DIG shocks rises from 0.35% at the one-year horizon to 77.33% at the five-year horizon and 83.45% at the ten-year horizon, while GM’s own share falls to 14.98%. TC shows a similar shift: the share explained by DIG shocks rises from 0.86% to 74.19% and 82.87%, and its own share falls from 98.19% to 9.09%; GM shocks explain a further 8.04% at the ten-year horizon. Regional digitalization thus becomes the dominant source of longer-horizon variation in both GM and TC. Across alternative Cholesky orderings, DIG shocks explain 75.59–79.03% of GM’s and 72.05–76.55% of TC’s five-year forecast error variance. At ten years, the corresponding ranges are 81.22–85.35% and 80.32–85.17%, respectively (Supplementary Table S4). Thus, DIG remains the largest contributor to the forecast error variance of both GM and TC across orderings, although the exact shares vary.
Table 9.
Forecast error variance decomposition results (%).
5. Discussion
5.1. Regional Digitalization as a Foundation for Sustainable Regional Transformation
Regional digitalization is a persistent foundation whose association with the other system unfolds as digital capabilities become embedded in regional activities. Viewed as an enabling general-purpose technology, digitalization creates value through complementary investments in data systems, platforms, organizational capabilities, and practical applications, all of which take time to develop [61]. The impulse responses show different initial timing: following a DIG shock, GM peaks in the first year and TC in the second (Figure 4(a2,a3)). Both responses then decline slowly, and regional digitalization accounts for the largest share of the longer-horizon forecast-error variance in both green mobility and tourism competitiveness. Recent case studies point in a similar direction. Dušek et al. [14] examine how smart technologies link tourism services and transport management in a smart-region city, and Nicholson [15] documents how digital twins, visitor apps, and integrated cultural–transport passes help integrate visitor flows into sustainable urban mobility in several European Capitals of Smart Tourism. Both treat digital tools as the layer that connects tourism with mobility management. The present results add a regional and longitudinal perspective: across Chinese provinces, digitalization precedes improvements in both green mobility and tourism competitiveness.
The two systems, however, respond at different speeds. One possible explanation for the relatively quick green-mobility response is that transport activities depend directly on information connectivity and data-based coordination. Digital technologies support real-time traffic management, public transport coordination, shared-mobility services, route optimization, and better matching of transport supply with travel demand. Their contribution lies less in expanding transport capacity than in changing how existing mobility resources are organized and used. This can reduce congestion, unnecessary travel, and energy consumption while improving the accessibility and efficiency of low-carbon transport. This interpretation is consistent with Yin et al. [11], who find that digital-economy development promotes green mobility in Chinese cities. The response of tourism competitiveness is more gradual, because destination performance depends on the coordinated adaptation of tourism firms, destination organizations, service providers, and visitors. Digital capabilities take longer to translate into competitive advantages. Zainal-Abidin et al. [62] and Liu et al. [63] show that digital platforms facilitate stakeholder collaboration and support tourism-industry upgrading, but both benefits require sustained interaction, organizational learning, and institutional adaptation.
5.2. The Front-Loaded Response of Tourism Competitiveness to a Green-Mobility Shock
The estimated response of tourism competitiveness to a green-mobility shock is strongest early and then settles at a lower positive level. One possible explanation is improved accessibility: better public transport connectivity and low-carbon mobility services may reduce travel time, congestion, and uncertainty for visitors. Lower travel frictions are associated with higher tourist satisfaction [28], and transport accessibility is recognized as a key determinant of destination-level competitiveness [12]. As improved mobility becomes a routine service, its differentiating value may diminish. This is consistent with Nicholson’s [15] observation that sustainable visitor mobility depends on integrating visitor needs into permanent urban mobility systems. Accessibility alone, however, does not provide the distinctive resources and experiences needed to sustain competitiveness [6].
Tourists’ perceptions offer a further possible explanation. Green travel modes such as shared bicycles and electric sightseeing vehicles may initially carry novelty value [64], but as they become widespread, visitors may regard them as expected amenities rather than distinctive attractions. These behavioral accounts remain conjectural, because the response profile follows from the estimated first-order PVAR system and cannot be distinguished from the dynamics implied by its coefficients. Although DIG predicts GM and GM predicts TC, an indirect DIG-to-TC effect through GM has not been separately estimated or tested. The co-evolutionary perspective expects regional systems to adjust to one another over time, with lags and to uneven degrees [30]. One possible interpretation is that the GM–TC association varies across the response horizon: it may be stronger while mobility reduces travel frictions and offers differentiating value, and weaker once these services become routine. For regional development, green-mobility investment can be evaluated alongside distinctive tourism resources and services, with tourism outcomes monitored over time.
5.3. An Asymmetric Pattern of Lagged Predictive Relationships Among Regional Digitalization, Green Mobility, and Tourism Competitiveness
The baseline PVAR (1) results suggest a dynamically connected but asymmetric regional system. Tourism competitiveness positively predicts subsequent regional digitalization: the response of digitalization to a TC shock remains statistically significant until around the sixth year. This feedback, however, is small, with TC shocks accounting for less than 2% of digitalization’s forecast error variance. The feedback remains significant after excluding Beijing and Guangdong and in the pre-pandemic subsample but is not statistically detected in PVAR (2), indicating sensitivity to the lag specification. From the same co-evolutionary perspective, the baseline findings suggest uneven mutual adjustment [30]: tourism competitiveness responds strongly and persistently to regional digitalization but feeds back only weakly. The feedback itself is consistent with demand-pull innovation theory, which argues that expanding market opportunities direct technological change by raising the expected returns to innovation [31]. As tourism competitiveness strengthens, tourism firms and destination organizations may face greater pressure to meet changing visitor expectations, which may raise the value of digital service delivery, data use, and platform-based coordination. Li et al. [13] similarly find that changes in tourist demand promote the digital transformation of tourism enterprises, particularly in regions with stronger big data capabilities and more supportive innovation environments. The small feedback may reflect digitalization’s role as a general-purpose technology serving many sectors, with tourism representing only one source of demand.
By contrast, a direct lagged association from tourism competitiveness to green mobility was not statistically detected in this sample. With 31 provinces observed over 12 years, the model may have limited statistical power to detect a weaker association; the nonsignificant result therefore does not establish that this link is absent. The small, delayed response of green mobility is consistent with possible propagation through regional digitalization, although this pathway has not been separately tested. If the direct association is weak, two contextual factors might contribute. First, tourism demand may be limited in scale and spatial reach. Tourist flows are often seasonal and concentrated in particular destinations and travel corridors, and outside tourism-intensive cities they may not be large enough to materially affect overall traffic conditions [65]. Second, tourism demand may not be easily transmitted to transport planning. In a smart-region case, Dušek et al. [14] find that data sharing and coordination between tourism and transport actors remain fragmented, so tourism demand is not readily reflected in mobility planning. Because regional green mobility depends on sustained and geographically broad adjustments in transport networks, low-carbon services, energy use, and governance, pressure from tourism may reach the broader green mobility system more readily in tourism-intensive regions.
6. Conclusions and Implications
6.1. Conclusions
Using panel data from 31 provincial-level regions in mainland China between 2012 and 2023, this study applies the entropy-weighting method to construct composite indices of regional digitalization, green mobility, and tourism competitiveness and employs a PVAR framework to examine their dynamic relationships. The results point to a digitally centered and asymmetric regional system. The responses of green mobility and tourism competitiveness to regional digitalization are positive and persistent, whereas the response of tourism competitiveness to green mobility is more rapid but attenuates. Tourism competitiveness provides statistically significant predictive feedback to regional digitalization in the baseline model, but this feedback contributes little to forecast error variance and is sensitive to the lag specification, whereas no statistically significant direct predictive relationship from tourism competitiveness to green mobility is detected. These findings suggest that digital capacity, sustainable mobility, and tourism development play distinct but interconnected roles in regional sustainable development.
6.2. Theoretical and Policy Implications
Theoretically, this study makes two contributions. First, it moves beyond separately estimated pairwise relationships by examining regional digitalization, green mobility, and tourism competitiveness within one endogenous system. The baseline estimates suggest a bidirectional lagged predictive association between regional digitalization and tourism competitiveness, while the direct lagged association from tourism competitiveness to green mobility remains uncertain in this sample. The weak predictive response from tourism competitiveness to digitalization is consistent with demand-pull innovation theory [31], suggesting that tourism demand may contribute to regional digital capacity. Because regional digitalization is a general-purpose technology serving many sectors [61], demand from a single sector may be directed toward this shared capability and diluted by the demand of other sectors.
Second, the temporal evidence shows that the three systems adjust at different speeds. Green mobility responds to regional digitalization faster than tourism competitiveness does, the response of tourism competitiveness to green mobility is front-loaded, and regional digitalization shows the most persistent responses and accounts for a growing share of forecast error variance as the horizon lengthens. The co-evolutionary perspective expects regional systems to adjust to one another with lags and to uneven degrees [30]. The present results show that this unevenness has a clear direction, with regional digitalization at the center of the system, and that enabling conditions such as green mobility are associated with competitiveness mainly in an early phase, before they become part of a destination’s normal operating conditions.
Practically, the results provide a basis for sequencing regional sustainability policy. Green mobility and tourism competitiveness both respond positively and persistently to regional digitalization, but green mobility responds faster. Digital initiatives could therefore be evaluated over multiple years, with mobility outcomes reviewed earlier than tourism outcomes rather than judging both against the same annual performance target. Tourism competitiveness responds to green mobility more quickly, but this response is strongest shortly after a shock and then settles at a lower positive level. Mobility improvements could therefore be coordinated with destination services during the early response period, while their longer-run contribution to tourism competitiveness is monitored. Finally, in the baseline model, regional digitalization shows a weak positive response to tourism competitiveness, whereas no statistically significant direct predictive relationship from tourism competitiveness to green mobility is detected. Tourism is one source of demand for digital services, for example through smart-tourism platforms and online destination services, but only a minor one. Regional digital plans could therefore combine tourism demand with that of other sectors, such as transport and public services. Implementation may nevertheless be constrained by regional digital divides and by the coordination costs of aligning data, responsibilities, and policy priorities across tourism and transport authorities [14,20]. Regional strategies could therefore be adapted to local digital capabilities and supported by formal cross-departmental planning mechanisms.
6.3. Limitations and Future Research
Several limitations should be acknowledged. First, because this study is based on Chinese provinces, the strength and timing of the identified relationships may differ across institutional and developmental contexts. The findings may offer useful insights for other developing and emerging economies undergoing similar digital transformation. However, differences in institutional environments, economic structures, technological development, and tourism systems mean that they should not be transferred directly, and the policy implications should be interpreted with caution outside the Chinese context. Cross-country comparisons are also needed to determine whether the digitally centered and asymmetric structure identified in this study applies to other economies.
Second, digital networks, transport systems, and tourist flows frequently extend beyond administrative boundaries, whereas the present analysis does not explicitly consider cross-regional interactions. Future research could employ spatial econometric models and regional network analysis to examine spillover effects among digitalization, green mobility, and tourism competitiveness.
Third, the 12-year panel is relatively short for dynamic analysis, so the 10-year variance shares mainly indicate long-run patterns and are subject to greater uncertainty. The period also includes the COVID-19 pandemic, which caused a sharp and regionally uneven decline in tourism in 2020–2022. Although the main conclusions hold in the pre-pandemic subsample (2012–2019), pandemic-related structural changes cannot be ruled out. Longer time series would allow richer lag structures, weaker feedback from tourism competitiveness to regional digitalization, and the role of the pandemic to be examined in greater detail. Such series would also allow structural break tests and a comparison with a tourism index that excludes the international components most affected by the pandemic.
Finally, the PVAR framework primarily identifies dynamic associations and predictive relationships rather than definitive structural causality. Quasi-natural experiments, exogenous policy shocks, and structural identification strategies could be used to strengthen causal inference. The sensitivity of the findings to size-adjusted definitions of the DIG and TC indices and to a narrower, transport-focused definition of the GM index remains untested.
Supplementary Materials
The following supporting information can be downloaded at https://www.mdpi.com/article/10.3390/su182111369/s1. Table S1: Variation and pairwise correlations of DIG, GM, and TC; Table S2: Orthogonalized impulse responses and 95% confidence intervals at selected horizons; Table S3: Robustness checks: alternative lag order and restricted samples; Table S4: PVAR (1) residual correlations and forecast error variance decomposition under alternative Cholesky orderings; Figure S1: Orthogonalized impulse responses under alternative Cholesky orderings.
Author Contributions
Conceptualization, T.G. and D.Y.; methodology, T.G.; software, T.G.; validation, T.G.; formal analysis, T.G.; investigation, T.G.; data curation, T.G.; writing—original draft preparation, T.G.; writing—review and editing, T.G. and D.Y.; visualization, T.G.; supervision, D.Y.; funding acquisition, D.Y. All authors have read and agreed to the published version of the manuscript.
Funding
This research was funded by the Guangdong Provincial Department of Education Youth Innovation Talents Project “Research on the Mechanism and Pathways of Digital Economy Empowering the Integration of Agriculture, Culture, and Tourism to Enhance Quality and Efficiency” (Project No.: 2025WQNCX087), which was initiated on 24 October 2025.
Institutional Review Board Statement
Not applicable.
Informed Consent Statement
Not applicable.
Data Availability Statement
The datasets analyzed during the current study are available from the corresponding author upon reasonable request.
Acknowledgments
The authors thank the anonymous reviewers and editors for their constructive comments and suggestions, which significantly improved the quality of this paper.
Conflicts of Interest
The authors declare no conflicts of interest.
Abbreviations
The following abbreviations are used in this manuscript:
| DIG | Regional digitalization |
| GM | Green mobility |
| TC | Tourism competitiveness |
| FEVD | Forecast error variance decomposition |
References
- Guo, S.; Diao, Y.; Du, J. Coupling coordination measurement and evaluation of urban digitalization and green development in China. Int. J. Environ. Res. Public Health 2022, 19, 15379. [Google Scholar] [CrossRef] [Scilit]
- Vial, G. Understanding digital transformation: A review and a research agenda. J. Strateg. Inf. Syst. 2019, 28, 118–144. [Google Scholar] [CrossRef] [Scilit]
- Heidari, I.; Eshlaghy, A.T.; Seyyed Hoseini, S.M. Sustainable transportation: Definitions, dimensions, and indicators—Case study of importance-performance analysis for the city of Tehran. Heliyon 2023, 9, e20457. [Google Scholar] [CrossRef] [Scilit]
- Sdoukopoulos, A.; Pitsiava-Latinopoulou, M.; Basbas, S.; Papaioannou, P. Measuring progress towards transport sustainability through indicators: Analysis and metrics of the main indicator initiatives. Transp. Res. Part D. Transp. Environ. 2019, 67, 316–333. [Google Scholar] [CrossRef] [Scilit]
- Gössling, S.; Balas, M.; Mayer, M.; Sun, Y.-Y. A review of tourism and climate change mitigation: The scales, scopes, stakeholders and strategies of carbon management. Tour. Manag. 2023, 95, 104681. [Google Scholar] [CrossRef] [Scilit]
- Dwyer, L.; Kim, C. Destination Competitiveness: Determinants and Indicators. Curr. Issues Tour. 2003, 6, 369–414. [Google Scholar] [CrossRef] [Scilit]
- Liu, H.; Tan, Z.; Xia, Z. The Coupling Coordination Relationship and Driving Factors of the Digital Economy and High-Quality Development of Rural Tourism: Insights from Chinese Experience Data. Land 2024, 13, 1734. [Google Scholar] [CrossRef] [Scilit]
- Yang, K.; Feng, G.-F.; Ma, Y.; Chang, C.-P. Dynamic coupling coordination of digital economy and high-quality development in transportation sector. Int. J. Transp. Econ. 2024, 51, 157–191. [Google Scholar]
- Ma, L.; Liu, C.; Zhan, Y. How smart city construction affects destination tourism efficiency. Tour. Econ. 2024, 30, 1600–1623. [Google Scholar] [CrossRef] [Scilit]
- Zhang, Y.; Zhang, J.K. Examining the complex causal relationships between the digital economy and urban tourist destination competitiveness. Econ. Change Restruct. 2024, 57, 152. [Google Scholar] [CrossRef] [Scilit]
- Yin, X.; Zhang, J.; Zheng, X. How does digital Economy influence green mobility for sustainable development? Moderating effect of policy instruments. Sustainability 2024, 16, 9316. [Google Scholar] [CrossRef] [Scilit]
- Sánchez-Rivero, M.; Miguel-Barrado, V.; Rodríguez-Rangel, M.C.; Pérez-Calderón, E. Evolution of transport, accessibility and tourism competitiveness in Extremadura (Spain): A benchmarking analysis. Eur. Transp. Res. Rev. 2024, 16, 66. [Google Scholar] [CrossRef] [Scilit]
- Li, N.; Liu, Z.; Zhang, X. A study on the impact of dynamic visitor demand on the digital transformation of enterprises—Considerations based on the regional innovation environment and the level of big data. Sustainability 2023, 15, 261. [Google Scholar] [CrossRef] [Scilit]
- Dušek, J.; Krásna, S.; Dušková Pryk, B.; Kováčová, A.; Lorencová, N. Smart technologies in sustainable urban tourism management: An urban case study within the smart region context. Sustainability 2026, 18, 6184. [Google Scholar] [CrossRef] [Scilit]
- Nicholson, A. Exploring the Links Between Tourism and Sustainable Urban Mobility: Insights from Winners of the European Capital of Smart Tourism. Available online: https://urban-mobility-observatory.transport.ec.europa.eu/exploring-links-between-tourism-and-sustainable-urban-mobility-insights-winners-european-capital_en (accessed on 27 September 2026).
- He, H.; Tsui, K.W.H.; Wu, H.; Lin, L. Exploring the red tourism–aviation nexus through the PVAR model: The case of China during the COVID-19 pandemic. Case Stud. Transp. Policy 2024, 18, 101288. [Google Scholar] [CrossRef] [Scilit]
- Duncan, A.; Hailemariam, A. Come and say G’day: Using search engine data to understand the dynamics of tourism demand in Australia. Tour. Econ. 2025, 31, 1428–1451. [Google Scholar] [CrossRef] [Scilit]
- Si, L.-j.; Cao, H.-y.; Wang, J. The impact of a low-carbon transport system policy on total factor carbon emission performance: Evidence from 283 cities in China. Socioecon. Plan. Sci. 2024, 96, 102091. [Google Scholar] [CrossRef] [Scilit]
- Luo, Q.; Hu, H.; Feng, D.; He, X. How does broadband infrastructure promote entrepreneurship in China: Evidence from a quasi-natural experiment. Telecommun. Policy 2022, 46, 102440. [Google Scholar] [CrossRef] [Scilit]
- Guo, F.; Wang, J.; Wang, F.; Kong, T.; Zhang, X.; Cheng, Z. Measuring China’s digital financial inclusion: Index compilation and spatial characteristics. China Econ. Q. 2020, 19, 1401–1418. [Google Scholar]
- Bekele, H.; Raj, S. Digitalization and digital transformation in the tourism industry: A bibliometric review and research agenda. Tour. Rev. 2025, 80, 894–913. [Google Scholar] [CrossRef] [Scilit]
- Lu, W.; Alexis, G. Tourism Under Global Uncertainty: Technology, Governance, and Clean Energy Pathways Toward SDGs in OECD Nations. Sustain. Dev. 2026, 34, 8856–8870. [Google Scholar] [CrossRef] [Scilit]
- Chang, X.; Wu, J.; Kang, Z.; Pan, J.; Sun, H.; Lee, D.-H. Estimating emissions reductions with carpooling and vehicle dispatching in ridesourcing mobility. npj Sustain. Mobil. Transp. 2024, 1, 16. [Google Scholar] [CrossRef] [Scilit]
- Henriquez-Jara, B.; Arriagada, J.; Montenegro, K.; Tirachini, A.; Munizaga, M. The effects of a real-time public transport information app on travel behaviour, traffic levels and the environment. Travel Behav. Soc. 2025, 40, 101024. [Google Scholar] [CrossRef] [Scilit]
- Wu, K.; Ding, J.; Lin, J.; Zheng, G.; Sun, Y.; Fang, J.; Xu, T.; Zhu, Y.; Gu, B. Big-data empowered traffic signal control could reduce urban carbon emission. Nat. Commun. 2025, 16, 2013. [Google Scholar] [CrossRef] [Scilit]
- Lee, C.-C.; Yuan, Y.; Wen, H. Can digital economy alleviate CO2 emissions in the transport sector? Evidence from provincial panel data in China. Nat. Resour. Forum 2022, 46, 289–310. [Google Scholar] [CrossRef] [Scilit]
- Ladi, T.; Mahmoudpour, A.; Sharifi, A. Assessing environmental impacts of transportation sector by integrating DPSIR framework and X-Matrix. Case Stud. Transp. Policy 2022, 10, 434–443. [Google Scholar] [CrossRef] [Scilit]
- Martin, J.C.; Román, C.; Moreira, P.; Moreno, R.; Oyarce, F. Does the access transport mode affect visitors’ satisfaction in a World Heritage City? The case of Valparaiso, Chile. J. Transp. Geogr. 2021, 91, 102969. [Google Scholar] [CrossRef] [Scilit]
- Marchesani, F.; Masciarelli, F.; Bikfalvi, A. Cities (r)evolution in the smart era: Smart mobility practices as a driving force for tourism flow and the moderating role of airports in cities. Int. J. Tour. Cities 2023, 9, 1025–1045. [Google Scholar] [CrossRef] [Scilit]
- Ma, M.; Hassink, R. An evolutionary perspective on tourism area development. Ann. Tour. Res. 2013, 41, 89–109. [Google Scholar] [CrossRef] [Scilit]
- Schmookler, J. Invention and Economic Growth; Harvard University Press: Cambridge, MA, USA, 1966. [Google Scholar]
- Guo, Z.; Yang, W.; Chen, Q.; Huang, X. The contribution and interactive relationship of tourism industry development and technological innovation to the informatization level: Based on the context of low-carbon development. Front. Environ. Sci. 2023, 11, 999675. [Google Scholar] [CrossRef] [Scilit]
- Geels, F.W. A socio-technical analysis of low-carbon transitions: Introducing the multi-level perspective into transport studies. J. Transp. Geogr. 2012, 24, 471–482. [Google Scholar] [CrossRef] [Scilit]
- Moritz, S.; Bartz-Beielstein, T. imputeTS: Time Series Missing Value Imputation in R. R J. 2017, 9, 207–218. [Google Scholar] [CrossRef] [Scilit]
- de Waal, T.; Pannekoek, J.; Scholtus, S. Handbook of Statistical Data Editing and Imputation; John Wiley & Sons: Hoboken, NJ, USA, 2011. [Google Scholar]
- Shang, X.; Niu, H. Analysis of the Spatiotemporal Evolution and Driving Factors of China’s Digital Economy Development Based on ESDA and GM-GWR Model. Sustainability 2023, 15, 11970. [Google Scholar] [CrossRef] [Scilit]
- Tang, R. Digital economy drives tourism development—Empirical evidence based on the UK. Econ. Res.-Ekon. Istraz. 2022, 36, 2003–2020. [Google Scholar] [CrossRef] [Scilit]
- Tao, Z.; Zhi, Z.; Shangkun, L. Digital Economy, Entrepreneurship, and High-Quality Economic Development: Empirical Evidence from Urban China. Front. Econ. China 2022, 17, 393–426. [Google Scholar]
- Zhao, J.; Zhang, Y.; Chen, A.; Zhang, H. Analysis on the Spatio-Temporal Evolution Characteristics of the Impact of China’s Digitalization Process on Green Total Factor Productivity. Int. J. Environ. Res. Public Health 2022, 19, 14941. [Google Scholar] [CrossRef] [Scilit]
- Li, Z.; Liu, Y. Research on the Spatial Distribution Pattern and Influencing Factors of Digital Economy Development in China. IEEE Access 2021, 9, 63094–63106. [Google Scholar] [CrossRef] [Scilit]
- Yu, H.; Yang, Q. Evaluation of the development level of green transportation in national central cities. Sustainability 2024, 16, 7270. [Google Scholar] [CrossRef] [Scilit]
- OECD. OECD Core Set of Indicators for Environmental Performance Reviews; Environment Monographs No. 83; OECD: Paris, France, 1993. [Google Scholar]
- European Environment Agency. Environmental Indicators: Typology and Overview; Technical Report No. 25; European Environment Agency: Copenhagen, Denmark, 1999. [Google Scholar]
- Zhang, C.; Li, W.; Huang, W.; Wu, H.; Skitmore, M.; Xia, B.; Wang, W. Comprehensive evaluation in urban green transportation development: Evidence from 30 cities in China. Res. Transp. Bus. Manag. 2024, 57, 101231. [Google Scholar] [CrossRef] [Scilit]
- Hou, X.; Lv, T.; Xu, J.; Deng, X.; Liu, F.; Lam, J.S.L.; Zhang, Z.; Han, X. Evaluation of urban public transport sustainability in China based on the Driving Force-Pressure-State-Impact-Response (DPSIR) framework—A case study of 36 major cities. Environ. Impact Assess. Rev. 2023, 103, 107263. [Google Scholar] [CrossRef] [Scilit]
- Deng, C.; Shi, Z.; Chi, B.; Wang, J. Evaluating the development levels of green urban transportation systems. Sustainability 2024, 16, 4795. [Google Scholar] [CrossRef] [Scilit]
- Wang, M.; Lin, X.; Yu, L. Comprehensive evaluation of green transportation in Chongqing main urban area based on sustainable development theory. Syst. Sci. Control Eng. 2019, 7, 369–378. [Google Scholar] [CrossRef] [Scilit]
- Ritchie, J.R.B.; Crouch, G.I. The Competitive Destination: A Sustainable Tourism Perspective; CABI Publishing: Wallingford, UK, 2003. [Google Scholar]
- Mendola, D.; Volo, S. Building composite indicators in tourism studies: Measurements and applications in tourism destination competitiveness. Tour. Manag. 2017, 59, 541–553. [Google Scholar] [CrossRef] [Scilit]
- Cracolici, M.F.; Nijkamp, P.; Rietveld, P. Assessment of Tourism Competitiveness by Analysing Destination Efficiency. Tour. Econ. 2008, 14, 325–342. [Google Scholar] [CrossRef] [Scilit]
- Cao, Q.; Sarker, M.N.I.; Zhang, D.; Sun, J.; Xiong, T.; Ding, J. Tourism competitiveness evaluation: Evidence from mountain tourism in China. Front. Psychol. 2022, 13, 809314. [Google Scholar] [CrossRef] [Scilit]
- De la Peña, M.R.; Núñez-Serrano, J.A.; Turrión, J.; Velázquez, F.J. A New Tool for the Analysis of the International Competitiveness of Tourist Destinations Based on Performance. J. Travel Res. 2019, 58, 207–223. [Google Scholar] [CrossRef] [Scilit]
- Li, L.; Li, W. Spatial temporal evolution of tourism destination competitiveness and its coordination with ecological environment in coastal areas of China. Front. Sustain. Cities 2025, 7, 1629222. [Google Scholar] [CrossRef] [Scilit]
- Sánchez, A.G.; López, D.S. Tourism destination competitiveness: The spanish mediterranean case. Tour. Econ. 2015, 21, 1235–1254. [Google Scholar] [CrossRef] [Scilit]
- Shannon, C.E. A mathematical theory of communication. Bell Syst. Tech. J. 1948, 27, 379–423. [Google Scholar] [CrossRef] [Scilit]
- Wu, J.; Li, P.; Qian, H.; Chen, J. On the sensitivity of entropy weight to sample statistics in assessing water quality: Statistical analysis based on large stochastic samples. Environ. Earth Sci. 2015, 74, 2185–2195. [Google Scholar] [CrossRef] [Scilit]
- Holtz-Eakin, D.; Newey, W.; Rosen, H.S. Estimating Vector Autoregressions with Panel Data. Econometrica 1988, 56, 1371–1395. [Google Scholar] [CrossRef] [Scilit]
- Love, I.; Zicchino, L. Financial development and dynamic investment behavior: Evidence from panel VAR. Q. Rev. Econ. Financ. 2006, 46, 190–210. [Google Scholar] [CrossRef] [Scilit]
- Abrigo, M.R.M.; Love, I. Estimation of Panel Vector Autoregression in Stata. Stata J. 2016, 16, 778–804. [Google Scholar] [CrossRef] [Scilit]
- Andrews, D.W.K.; Lu, B. Consistent model and moment selection procedures for GMM estimation with application to dynamic panel data models. J. Econom. 2001, 101, 123–164. [Google Scholar] [CrossRef] [Scilit]
- Brynjolfsson, E.; Rock, D.; Syverson, C. The productivity J-curve: How intangibles complement general purpose technologies. Am. Econ. J. Macroecon. 2021, 13, 333–372. [Google Scholar] [CrossRef] [Scilit]
- Zainal-Abidin, H.; Scarles, C.; Lundberg, C. The antecedents of digital collaboration through an enhanced digital platform for destination management: A micro-DMO perspective. Tour. Manag. 2023, 96, 104691. [Google Scholar] [CrossRef] [Scilit]
- Liu, Q.; Gao, J.; Li, S. The innovation model and upgrade path of digitalization driven tourism industry: Longitudinal case study of OCT. Technol. Forecast. Soc. Change 2024, 200, 123127. [Google Scholar] [CrossRef] [Scilit]
- Blomstervik, I.H.; Olsen, S.O. Progress on novelty in tourism: An integration of personality, attitudinal and emotional theoretical foundations. Tour. Manag. 2022, 93, 104574. [Google Scholar] [CrossRef] [Scilit]
- Schmöcker, J.-D. Estimation of city tourism flows: Challenges, new data and COVID. Transp. Rev. 2021, 41, 137–140. [Google Scholar] [CrossRef] [Scilit]

Disclaimer/Publisher’s Note: The statements, opinions and data contained in all publications are solely those of the individual author(s) and contributor(s) and not of MDPI and/or the editor(s). MDPI and/or the editor(s) disclaim responsibility for any injury to people or property resulting from any ideas, methods, instructions or products referred to in the content. |
© 2026 by the authors. Licensee MDPI, Basel, Switzerland. This article is an open access article distributed under the terms and conditions of the Creative Commons Attribution (CC BY) license.