


Abstract
Urban flooding poses significant risks to life, infrastructure, and the environment, motivating the development of interactive digital-twin platforms that combine geospatial modeling, real-time environmental observations, and immersive visualization. This study presents UniTwin, a sensor-informed digital twin platform for campus-scale environmental monitoring and flood-awareness visualization developed in Unity. The framework focuses on real-time visualization, environmental data integration, and interactive situational awareness within a digital-twin environment. A site-specific virtual model of the Texas A&M University-Corpus Christi campus was reconstructed using geospatial terrain, building geometry, and elevation information derived from Cesium and complementary spatial data sources through a Blender-based workflow. Historical rainfall datasets together with live rainfall observations retrieved from the WeatherLink API drive environmental scenarios and real-time visualization, enabling users to examine evolving rainfall conditions, assess building-level flood-awareness states through dynamic color-coded indicators, adjust rainfall intensity, and interactively explore the environment from multiple viewpoints. The implementation leverages Apple Metal GPU acceleration and the Universal Render Pipeline (URP) to deliver responsive, real-time rendering and interactive performance. By integrating geospatial reconstruction, live environmental observations, immersive visualization, semantic building information, and digital twin technologies within a unified framework, UniTwin provides a practical foundation for flood awareness, environmental monitoring, emergency preparedness, and the future integration of physics-based flood simulation and AI-assisted decision support capabilities.
1. Introduction
Floods represent one of the most pervasive and destructive natural hazards worldwide, inflicting severe human, economic and infrastructure losses each year. With increasing urbanization and intensification of climate-induced rainfall, pluvial and flash floods in urban environments have become increasingly unpredictable and damaging. The intricate interaction between impervious surfaces, topography and drainage systems generates highly localized flow patterns that remain challenging to represent accurately and efficiently in real-time flood simulations. Despite significant advances in numerical modeling, there is a persistent gap between physically accurate flood prediction and intuitive real-time visualization for communication and decision making. Bridging this divide between physical realism and interactive responsiveness is the driving motivation for emerging research in 3D flood simulation, visualization and digital twin frameworks. Early computational flood models were dominated by two dimensional shallow water equation (SWE) solvers, capable of reproducing large-scale flow dynamics but limited in fine-grained urban resolution. These solvers, while physically rigorous, often required long runtimes and post-processing for visualization. Hadimlioglu et al. introduced FloodSim, a Unity-based simulation platform that couples hydrodynamic computation with real-time visualization through Position-Based Fluid (PBF) modeling [1]. However, the interactive responsiveness of PBF and SPH solvers comes with trade-offs in large-domain scalability and numerical fidelity. Grid-based models using GPU acceleration now complement these particle approaches, offering physically robust large-scale simulations that maintain near-real-time performance. Rong et al. [2] developed a nonuniform structured grid GPU solver with super grid channel coupling, achieving city-scale flood simulations with order-of-magnitude speedups compared to CPUs. Similarly, Vacondio et al. optimized GPU SWE solvers with adaptive grid strategies to minimize redundant computation [3], and Morales-Hernández et al.’s TRITON framework extended GPU hydrodynamics to multi-GPU environments for continental-scale applications [4]. Foundational efforts such as Sanders et al.’s ParBreZo [5] and Kalyanapu et al.’s GPU-enhanced SWE models [6] established the technical feasibility of real-time flood modeling through high-performance parallel computation. Collectively, these studies demonstrate the growing capability of GPU-accelerated hydrodynamic models to support efficient flood simulation and provide an important foundation for interactive flood visualization and digital twin research.
While numerical modeling defines the quantitative core, visualization and communication determine how flood information is understood and acted upon. Traditional 2D flood maps, though useful for scientific analysis, often fail to convey the human-scale impact of floods. User studies by Zhu et al. revealed that participants exposed to dynamic isometric 3D street views exhibited significantly higher comprehension of flood depth and evacuation difficulty than those viewing static 2D maps [7]. Immersive systems such as Boorboor et al.’s Submerse platform leverage Unity’s high-fidelity rendering and Level-of-Detail (LOD) techniques to display storm-surge simulations in virtual environments with minimal latency [8]. Similarly, Symeonidis et al. proposed a mixed-reality (XR) system for situational awareness in flood emergencies, integrating holographic overlays and real-time data streams [9]. Complementary advances, including Dang et al.’s 3D panoramic VR fusion method [10] and Stavroulakis et al.’s AR architecture for real-time flood management [11], further demonstrate the potential of immersive visualization to enhance user engagement, perception accuracy and emergency decision-making.
Parallel to visualization research, GIS-based digital twins are emerging as the spatial foundation for next-generation flood management. Saksena et al. integrated surface, subsurface, and river hydrology into a unified flood-mapping framework, highlighting the need for multiscale coupling [12]. Leandro et al. developed 1D–2D coupled flood models that accurately represent drainage interactions and overland flow pathways [13]. In parallel, Al-Kalbani and Rahman demonstrated how 3D city models can operationalize flash-flood risk monitoring in arid urban contexts [14]. Andriessen et al. further advanced this direction by integrating CityGML-based semantic 3D city models with flood simulation results to identify and classify buildings and critical infrastructure affected by flooding [15], while Wu et al. integrated spatio-temporal GIS with hydrodynamic models for dynamic 3D risk simulation [16]. Collectively, these efforts highlight the convergence of geospatial intelligence, hydrodynamic modeling, and interactive visualization, providing the conceptual foundation for modern digital-twin flood frameworks.
Equally transformative are hardware and engine-level advancements enabling physically realistic rendering and parallel computation. Metal and CUDA GPU architectures have made it possible to perform particle-based and grid-based hydrodynamics at real-time frame rates on consumer devices. Open-source SPH implementations targeting Apple’s Metal API have emerged [17], though peer-reviewed performance comparisons against CUDA-based solvers remain scarce. Recent evaluations show that Apple Silicon GPUs can deliver competitive performance on scientific workloads [18,19], and direct Metal–CUDA comparisons have begun to appear for machine learning [20]. However, rigorous portability studies for real-time physics simulation remain limited. Gebraad and Fichtner achieved seamless GPU acceleration for C++-based physics using Metal’s unified memory architecture on M-series chips [21]. Meanwhile, the Unity Universal Render Pipeline (URP) [22], Cesium for Unity plugin [23], and BlenderGIS workflows [24] have streamlined 3D city rendering, terrain integration, and real-world coordinate alignment for simulation environments. Combined with real-time weather APIs like WeatherLink [25] and dynamic water assets such as Weather Maker [26], these tools form the technical ecosystem for interactive, data-driven flood simulations.
Despite progress across these domains, fully integrated digital-twin platforms that combine geospatial reconstruction, real-time environmental data, interactive visualization, and flood-awareness capabilities remain limited. Many existing systems continue to rely on decoupled workflows, where simulation, visualization, and environmental data processing are performed separately rather than within a unified interactive environment. Developing practical digital twins therefore requires balancing computational efficiency, visual realism and user interactivity while maintaining compatibility with real-world geospatial and environmental data sources.
Building upon these advances, this work presents UniTwin, a sensor-informed digital twin framework for interactive campus-scale flood visualization developed in Unity. The name UniTwin is derived from “University Digital Twin,” reflecting its primary focus as a campus-scale 3D spatial framework. It is completely distinct from UNESCO’s UNITWIN (University Twinning and Networking) program and general-purpose industrial universal twin platforms. Unlike traditional hydrodynamic flood models, UniTwin emphasizes integration of real-time environmental observations, geospatial reconstruction, and interactive visualization within a unified digital-twin environment. The proposed framework integrates geospatial reconstruction, historical and live rainfall observations, GPU-accelerated rendering, and immersive visualization within a unified environment designed to support flood awareness and emergency planning. By combining digital twin technologies with real-time environmental data and interactive 3D visualization, UniTwin contributes toward practical, scalable, and user-centered flood management systems. According to standard digital twin classifications, systems with an automated physical-to-virtual data stream function as a digital shadow. Within this taxonomy, UniTwin is established as a sensor-informed, visualization-oriented digital twin framework that lays the foundation for future closed-loop, bidirectional decision support. Furthermore, it provides a flexible foundation for future AI-assisted environmental monitoring and decision-support applications.
The contributions of this study are:
- Development of a sensor-informed digital twin for campus-scale environmental monitoring.
- Integration of real-time WeatherLink observations within a Unity-Cesium geospatial environment.
- A workflow for combining geospatial reconstruction, semantic building information, and interactive visualization.
- Demonstration of flood-awareness visualization driven by real environmental observations.
As climate-induced extreme precipitation events increase in frequency and intensity, urban infrastructure faces escalating risks that threaten long-term social, economic, and environmental sustainability. Digital twins serve as essential tools for advancing sustainable smart campus governance and resilient urban management by converting fragmented sensing data into actionable situational awareness. By combining real-time environmental monitoring with 3D geospatial visualization, UniTwin aligns directly with this approach.
2. Materials and Methods
2.1. System Overview
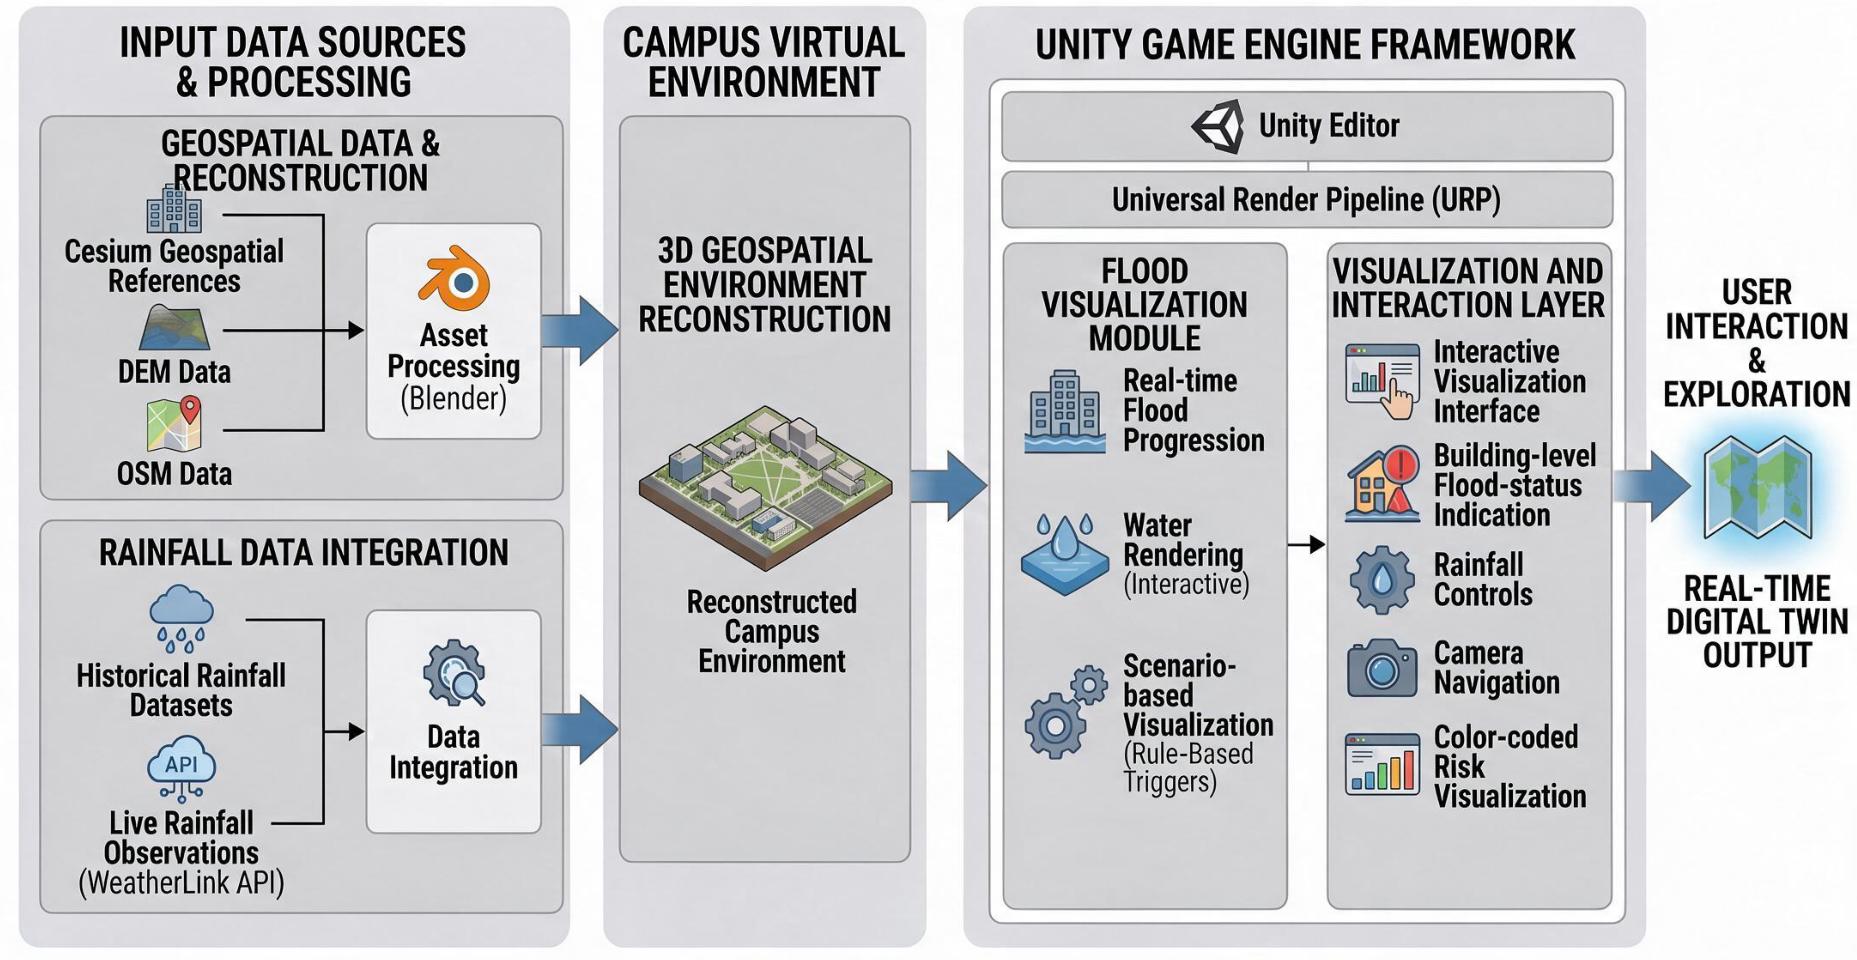
This study presents a rainfall-driven, real-time 3D digital twin for flood-awareness visualization for the Texas A&M University–Corpus Christi campus developed using the Unity game engine. The framework integrates four major components:
- 3D geospatial environment: A campus-scale virtual environment reconstructed from Cesium-derived geospatial references, DEM/OSM data, and Blender-based asset processing.
- Rainfall data integration: Historical rainfall datasets together with live rainfall observations retrieved through the WeatherLink API.
- Flood visualization module: A real-time visualization framework that represents rainfall-driven flood-awareness visualization through interactive water rendering and scenario-based environmental visualization.
- Visualization and interaction layer: Interactive visualization providing building-level flood-status indication, rainfall controls, camera navigation and color-coded risk visualization.
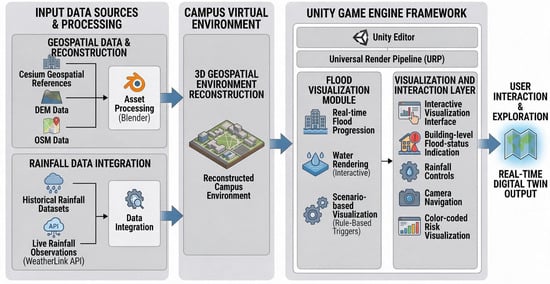
The proposed framework builds upon the visualization concepts introduced in FloodSim [1] by incorporating campus-scale geospatial reconstruction, real-time rainfall integration through the WeatherLink API and interactive 3D visualization within Unity. The reconstructed campus environment preserves real-world scale using geospatial reference data processed through Blender and is rendered using Unity’s Universal Render Pipeline (URP) to support realistic lighting, terrain visualization and interactive user exploration. Figure 1 shows the overview of the UniTwin framework.
Figure 1.
Overview of the UniTwin framework illustrating the integration of geospatial reconstruction, WeatherLink environmental data ingestion, rule-based scenario visualization, and the resulting real-time digital twin output.
- Artificial Intelligence Declaration: During the preparation of this manuscript, the authors utilized generative AI tools—specifically Large Language Models including Gemini 3.1 Pro, and Gemini 3.6 Flash—solely for the purposes of English language editing, stylistic polishing, prose refinement, manuscript structuring, and response letter formatting. All technical calculations, spatial dataset processing, experimental performance benchmarks, data curation, digital elevation models, C# scripting, and scientific conclusions were generated, curated, and independently verified entirely by the authors. The authors have reviewed and edited the output and take full responsibility for the content and scientific integrity of this publication.
2.2. Study Area and Data Sources
The proposed UniTwin digital twin represents the Texas A&M University–Corpus Christi campus, including academic buildings, road networks, pedestrian pathways, courtyards, parking areas and adjacent coastal regions. The primary objective is to provide an interactive three-dimensional environment for visualizing rainfall scenarios, building-level flood awareness, and campus-scale environmental conditions to support emergency preparedness, infrastructure planning and risk communication.
Terrain elevation was reconstructed using a spatial resolution Digital Elevation Model (DEM) ( pixels) formatted in the NAD83/UTM Zone 14N coordinate reference system (EPSG:26914). Spatial alignment among DEM terrain, OpenStreetMap (OSM) vector data, and Cesium geospatial references was performed using BlenderGIS to preserve real-world scale () and geographic layout across the campus domain. The reconstructed campus model incorporates 331 unique meshes comprising 2,672,098 vertices and 3,241,500 triangles to represent 55 building structures and infrastructure networks. Standard Unity world transformations were used for scene alignment; exact numerical georegistration error (RMS error via physical ground control points) was not measured and is noted as a scope boundary. This workflow follows established approaches for integrating DEM-based terrain models with three-dimensional GIS and digital twin applications [15,16,27].
Campus buildings were reconstructed from OpenStreetMap data together with publicly available campus design resources. The resulting models were processed using BlenderGIS and exported as GLTF assets for integration into Unity. Each building was assigned semantic attributes, including building elevation (), roof height, and functional category, enabling building-level visualization and semantic organization within the digital twin. This semantic representation is consistent with previous research on three-dimensional city models and digital twin environments [14,15,28]. Although the initial tests are not performed for semantic representation, the semantic information is embedded into the data for future integration.
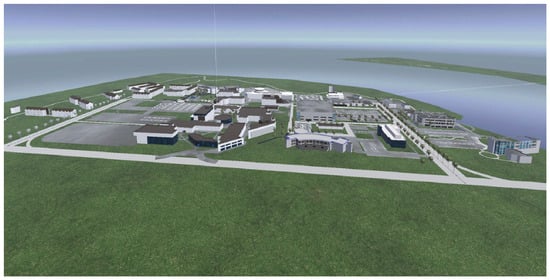
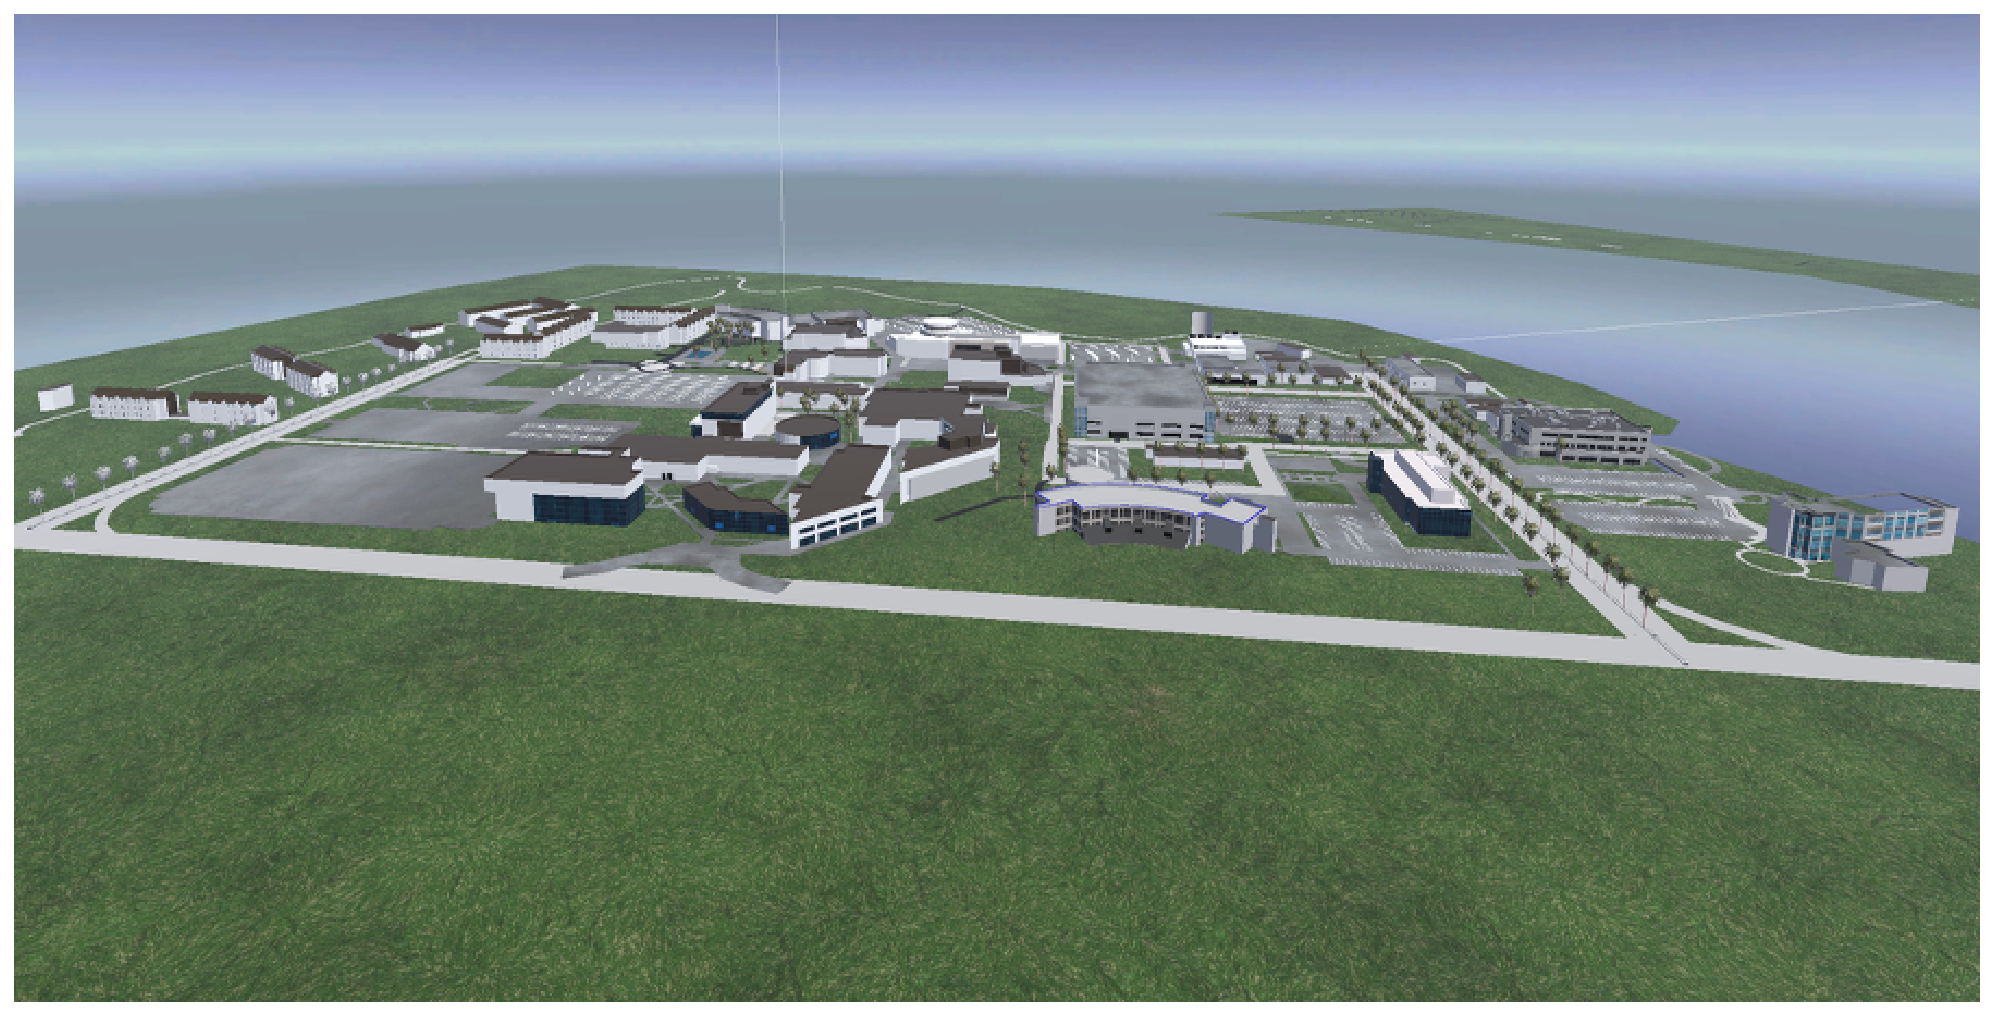
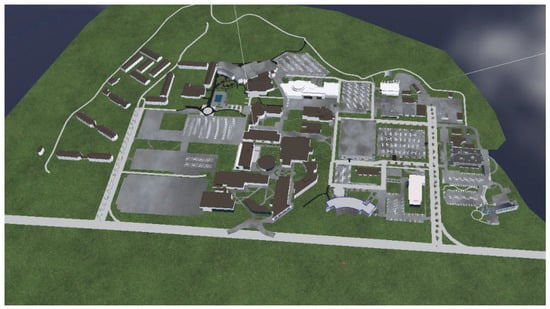
Environmental observations are obtained from the WeatherLink API, which provides real-time and historical rainfall measurements together with associated weather information. These observations serve as the primary environmental input for the UniTwin framework, retrieved primarily from the TAMUCC02 weather station located on campus. The acquisition, processing, synchronization and visualization of WeatherLink data are described in Section 2.4. This data is also used for supporting rainfall visualization and flood-awareness assessment. Figure 2 shows the reconstructed campus view with building, terrain, and transportation network data.
Figure 2.
Three-dimensional isometric view of the reconstructed Texas A&M University–Corpus Christi campus, illustrating major buildings, terrain, transportation networks and adjacent coastal areas within the UniTwin digital twin environment.
2.3. 3D Environment Construction
A reproducible workflow was adopted for constructing the UniTwin three-dimensional digital twin environment:
- Acquire terrain data and geospatial reference information from DEM datasets and Cesium-derived resources.
- Extract, clean, and refine terrain and building models using Blender and the BlenderGIS extension.
- Import the processed assets into Unity using the Universal Render Pipeline (URP), preserving real-world scale and geographic alignment.
- Align the reconstructed environment using geospatial reference information to maintain spatial consistency throughout the campus.
- Configure collision meshes, rendering materials, and scene components to support interactive visualization.
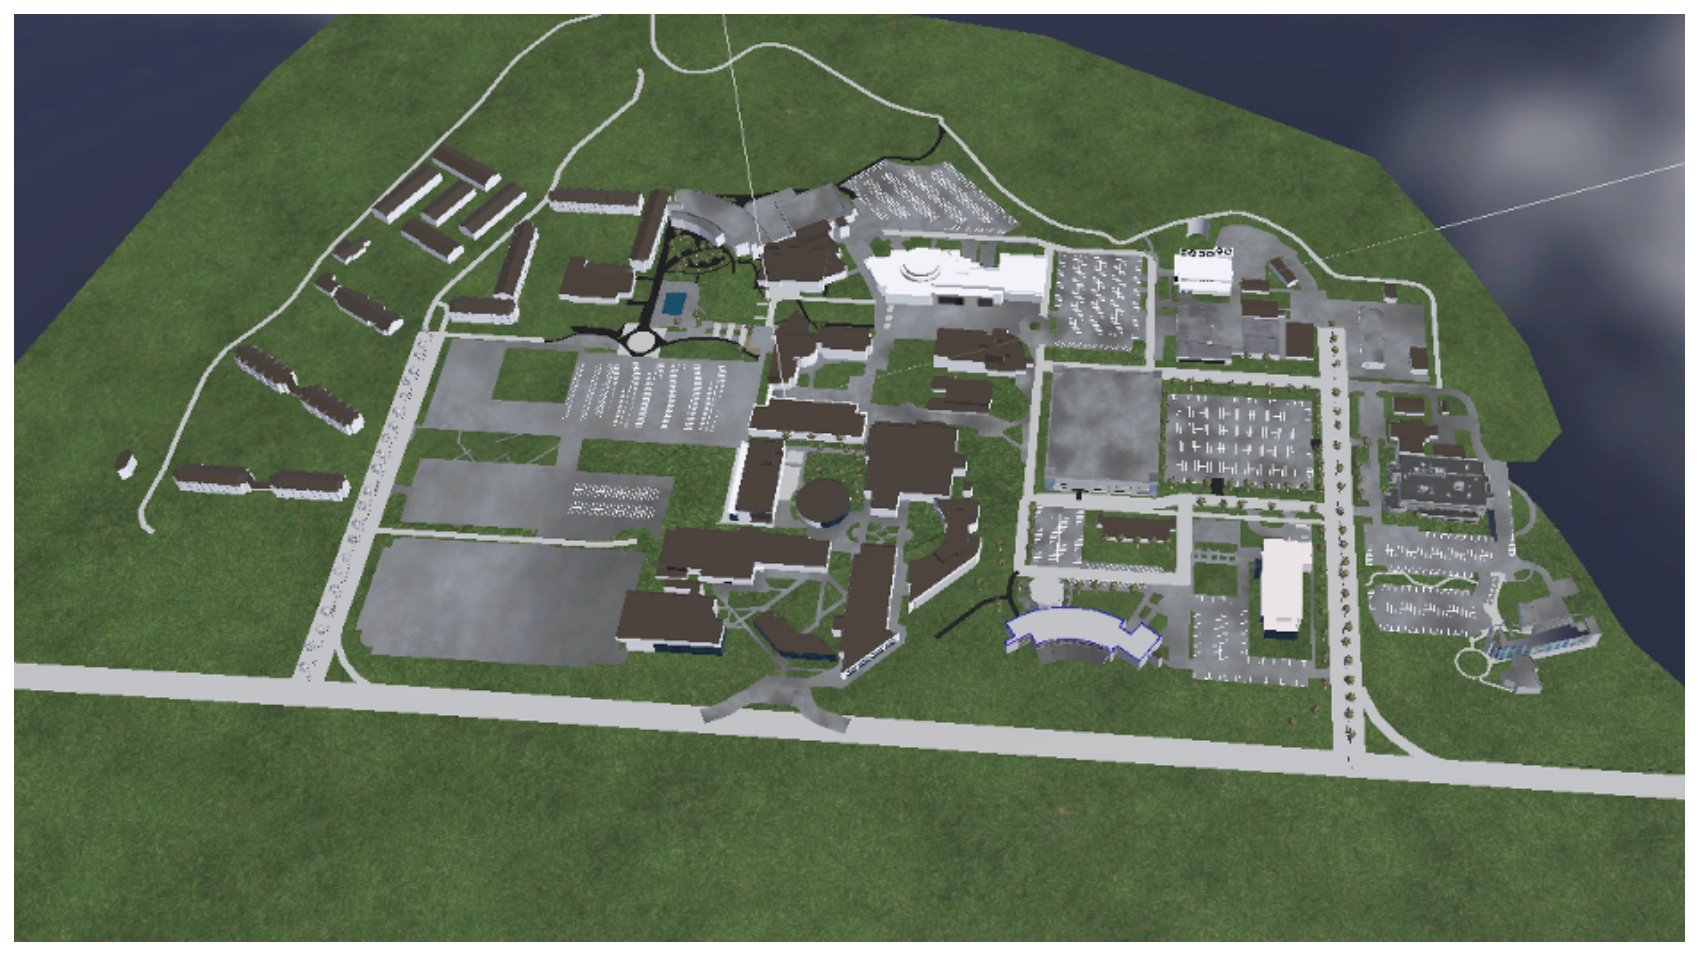
This workflow provides a reproducible approach for constructing a campus-scale digital twin while preserving geospatial consistency, rendering efficiency and interactive visualization performance. To characterize the reconstructed environment, Table 1 summarizes the principal spatial and semantic components incorporated into the UniTwin digital twin. Figure 3 illustrates the spatial arrangement of buildings, transportation infrastructure, and terrain features incorporated into the UniTwin environment.
Table 1.
Characteristics of the reconstructed UniTwin campus digital twin environment.
Figure 3.
Top-down view of the reconstructed Texas A&M University–Corpus Christi digital twin following terrain reconstruction, mesh refinement, and geospatial alignment within the Unity Universal Render Pipeline (URP).
Scene optimization techniques, including Level of Detail (LOD), camera-frustum culling, optimized meshes, texture compression, and Unity URP rendering optimizations, were incorporated to maintain responsive real-time visualization. These techniques reduce rendering overhead for distant objects while preserving visual quality and interactive performance during user navigation.
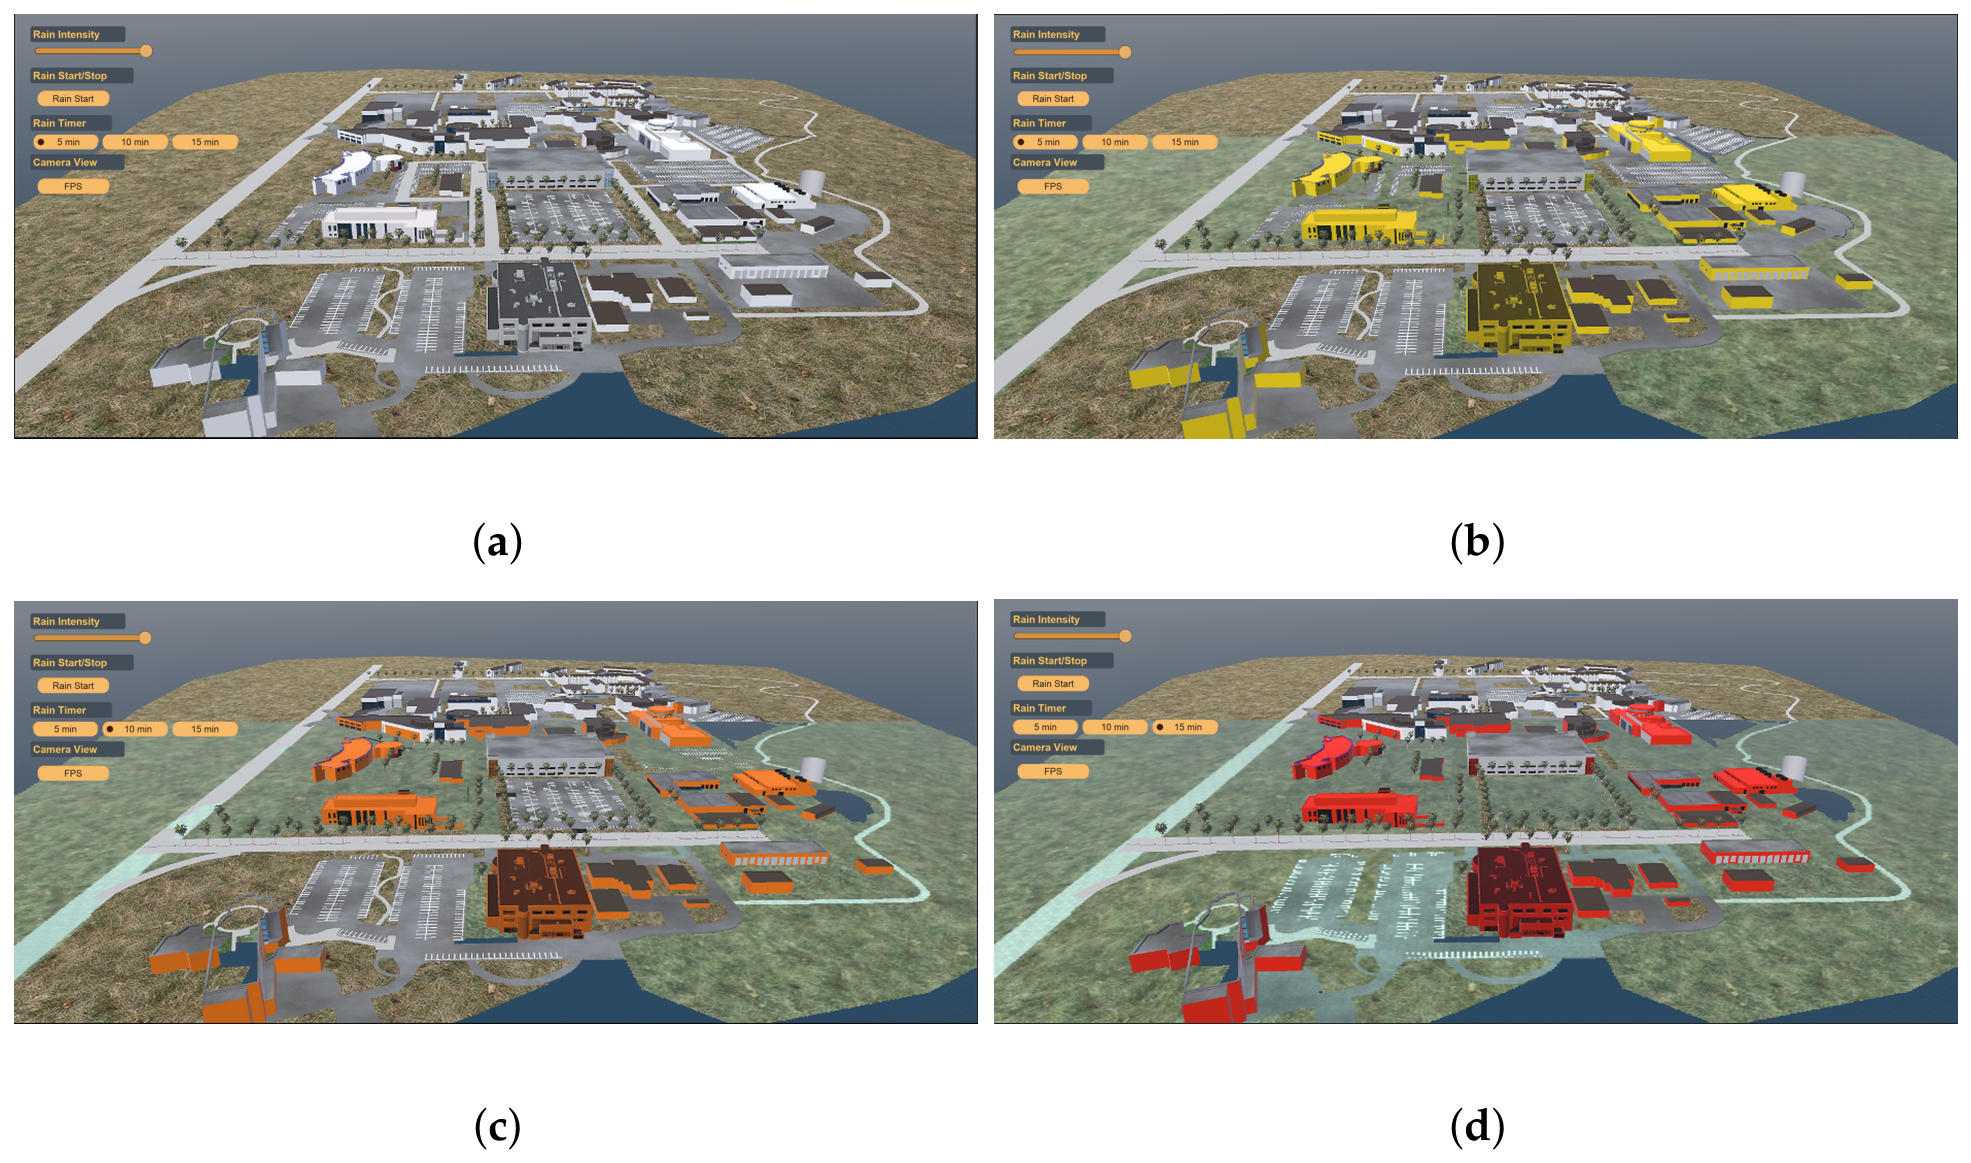
Each building was assigned semantic metadata, including base elevation (), building category, and predefined visualization thresholds corresponding to flood-warning levels. Rainfall intensity or scenario duration linearly accumulates the virtual water plane elevation (). To distinguish scenario-based visualization from actual flood prediction, building alert states are triggered by comparing against each building’s base ground elevation . Specifically, visual threshold indicators evaluate relative water elevation () against absolute world-Y offsets: Below 0.2, structures retain normal rendering; between 0.2 and 0.5, building colors transition dynamically from yellow toward orange; between 0.5 and 1.0, colors transition from orange toward red; and at or above 1.0, high-flood red alert states are triggered. Rather than outputting calibrated hydraulic inundation depths from 2D hydrodynamic calculations, these values serve as scenario-based visualization thresholds designed for intuitive risk communication and situational awareness. This implementation is shown in Figure 4.
Figure 4.
Building-level flood-awareness visualization using predefined color-coded warning thresholds for interactive situational awareness and risk communication.
2.4. Rainfall and Environmental Input
Rainfall observations are retrieved at five-minute intervals through the WeatherLink API [25], providing real-time rainfall intensity (), cumulative precipitation and associated weather variables. Historical WeatherLink records can also be replayed to visualize representative rainfall events and evaluate different rainfall scenarios. API responses are automatically parsed into Unity-readable JSON objects, storing timestamped rainfall values, , that dynamically update the rainfall visualization throughout the digital twin. Environmental data updates are time-triggered through an asynchronous polling manager in Unity that queries the WeatherLink API at configured 5-min sensor transmission intervals. Upon receiving an HTTP GET payload, JSON parsing updates , immediately updating shader material properties and building highlight scripts. Rainfall rates retrieved from the TAMUCC02 station are applied uniformly across the modeled campus domain. While spatial uniformity provides an effective operational assumption for campus-scale visualization, it represents a limitation during highly localized convective storms or micro-burst events where precipitation rates vary spatially across the campus.
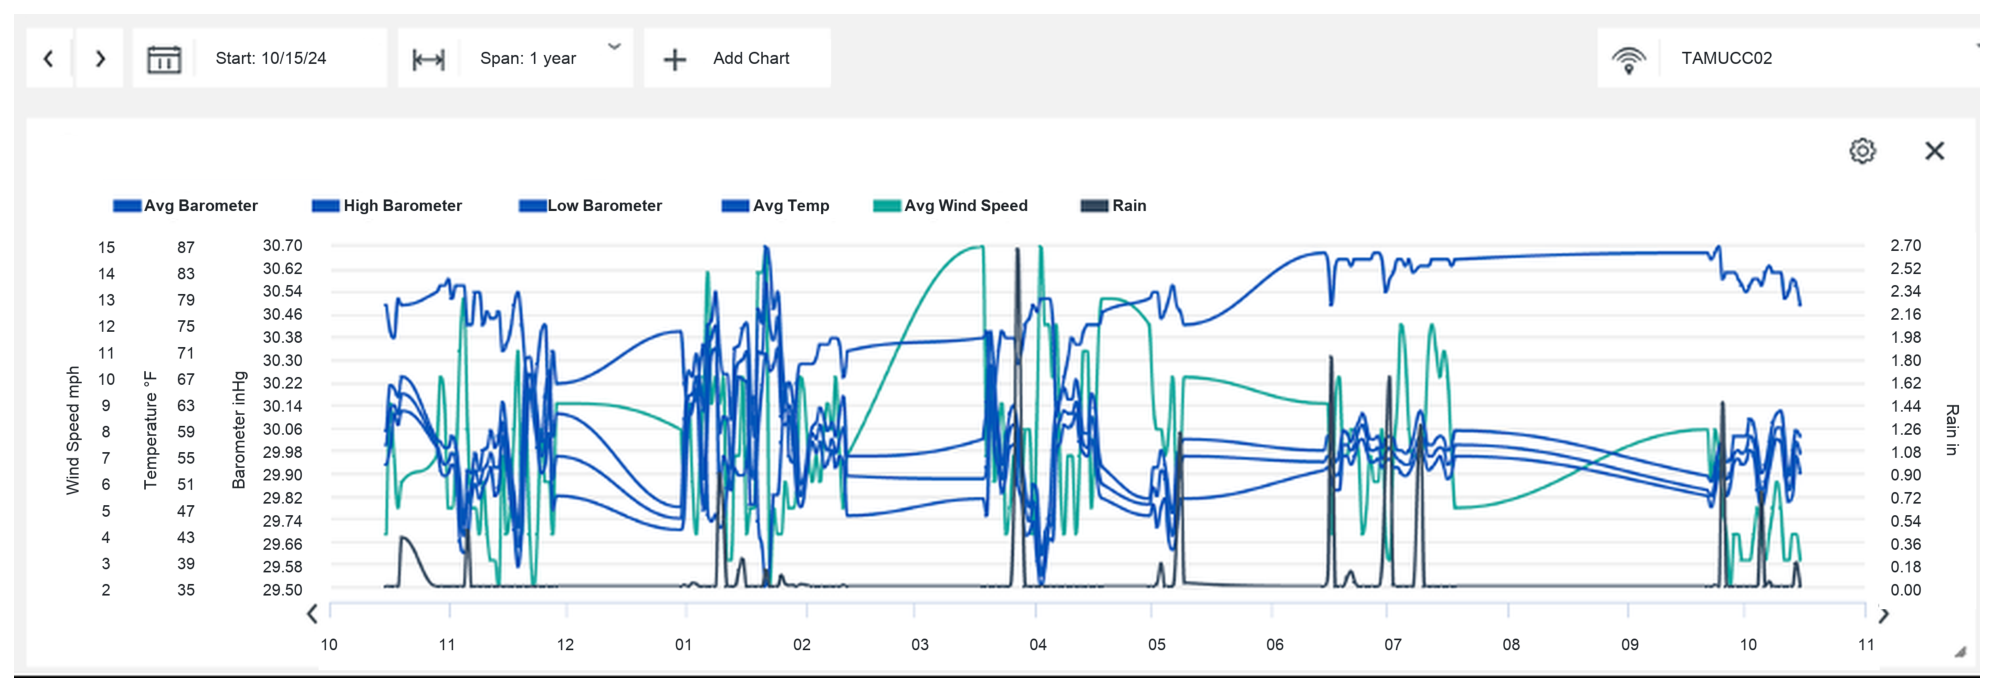
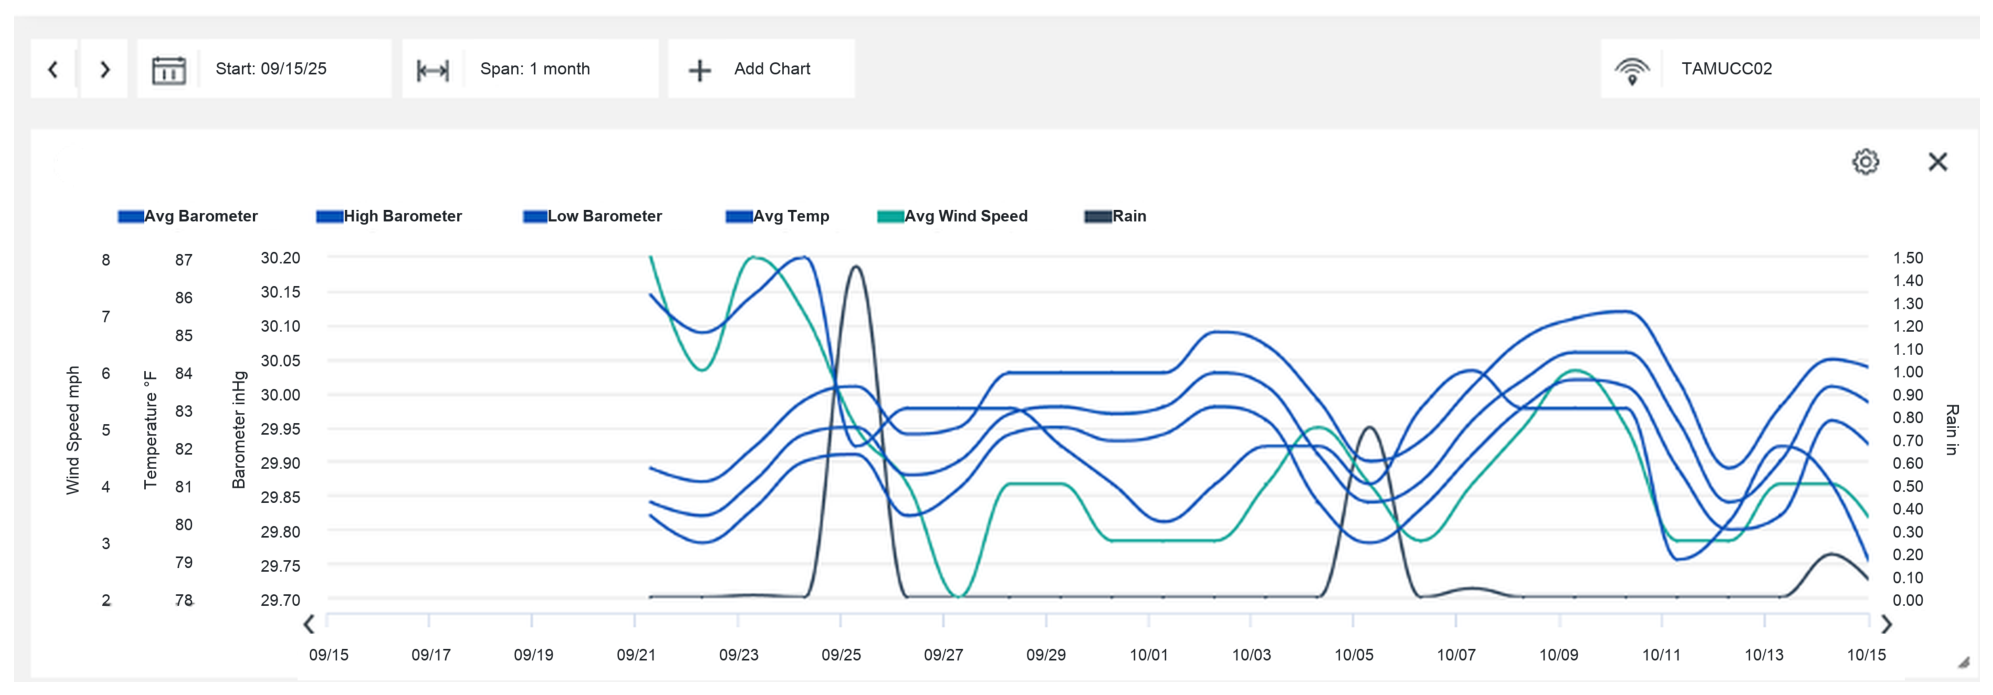
The WeatherLink integration enables UniTwin to synchronize environmental observations with the visualization environment, allowing users to explore evolving rainfall conditions through an interactive interface. Rather than calculating numerical flood depths, these live environmental inputs drive dynamic visualization thresholds and rule-based flood-awareness levels across the campus model to support real-time situational awareness. Figure 5 illustrates the WeatherLink environmental monitoring dashboard used to access historical and real-time sensor observations utilized within UniTwin.
Figure 5.
WeatherLink dashboard for the TAMUCC02 weather station illustrating historical environmental observations, including rainfall, temperature, wind speed, and barometric pressure used as environmental inputs for the UniTwin digital twin.
Representative environmental parameters, including Manning’s roughness coefficient (n), infiltration characteristics, and surface permeability, are maintained within the framework to represent different land-cover conditions and preserve compatibility with established hydrologic modeling practices. Although the current implementation focuses on interactive visualization rather than numerical hydrodynamic simulation, these parameters provide a structured foundation for future integration of shallow-water equation (SWE) solvers, Smoothed Particle Hydrodynamics (SPH), dam-break simulation and other advanced physics-based flood modeling capabilities.
2.5. Interactive Rainfall Visualization Framework
The proposed framework integrates real-time and historical rainfall observations within an interactive Unity-based digital twin environment. Rainfall is visualized using the Rain Maker particle system, which provides configurable rainfall intensity, mist effects, and camera-relative particle rendering to maintain consistent visual coverage throughout user navigation. Runtime controls enable users to adjust rainfall intensity, select predefined rainfall scenarios, and immediately observe corresponding changes within the reconstructed three-dimensional campus environment.
Rather than performing physics-based hydrodynamic computation, the framework emphasizes environmental visualization, situational awareness, and interactive exploration. This approach provides an intuitive environment for communicating rainfall conditions, supporting flood-awareness visualization, and examining the potential impacts of rainfall scenarios within the campus digital twin.
2.6. Digital Twin Visualization, Integration, and User Interaction
The reconstructed Texas A&M University–Corpus Christi campus serves as an interactive digital twin that enables users to explore rainfall scenarios within a geospatially referenced three-dimensional environment. The digital twin integrates reconstructed terrain, campus buildings, road networks, and surrounding coastal features into a unified visualization platform while preserving the spatial layout of the study area.
The visualization framework combines real-time environmental observations with interactive scene rendering to improve situational awareness during rainfall events. Rainfall data retrieved from the WeatherLink API are continuously synchronized with the visualization engine, enabling dynamic updates of environmental conditions throughout the simulation. Building-level flood awareness is communicated through predefined color-coded visualization thresholds (yellow = 0.05 m, orange = 0.15 m, and red = 0.30 m), allowing users to rapidly identify different flood-status levels across the campus.
The user interface provides interactive controls for rainfall intensity, scenario selection, and camera navigation, allowing users to examine different regions of the campus from multiple viewpoints while maintaining spatial consistency through geospatial reference information and Unity-based rendering workflows [23].
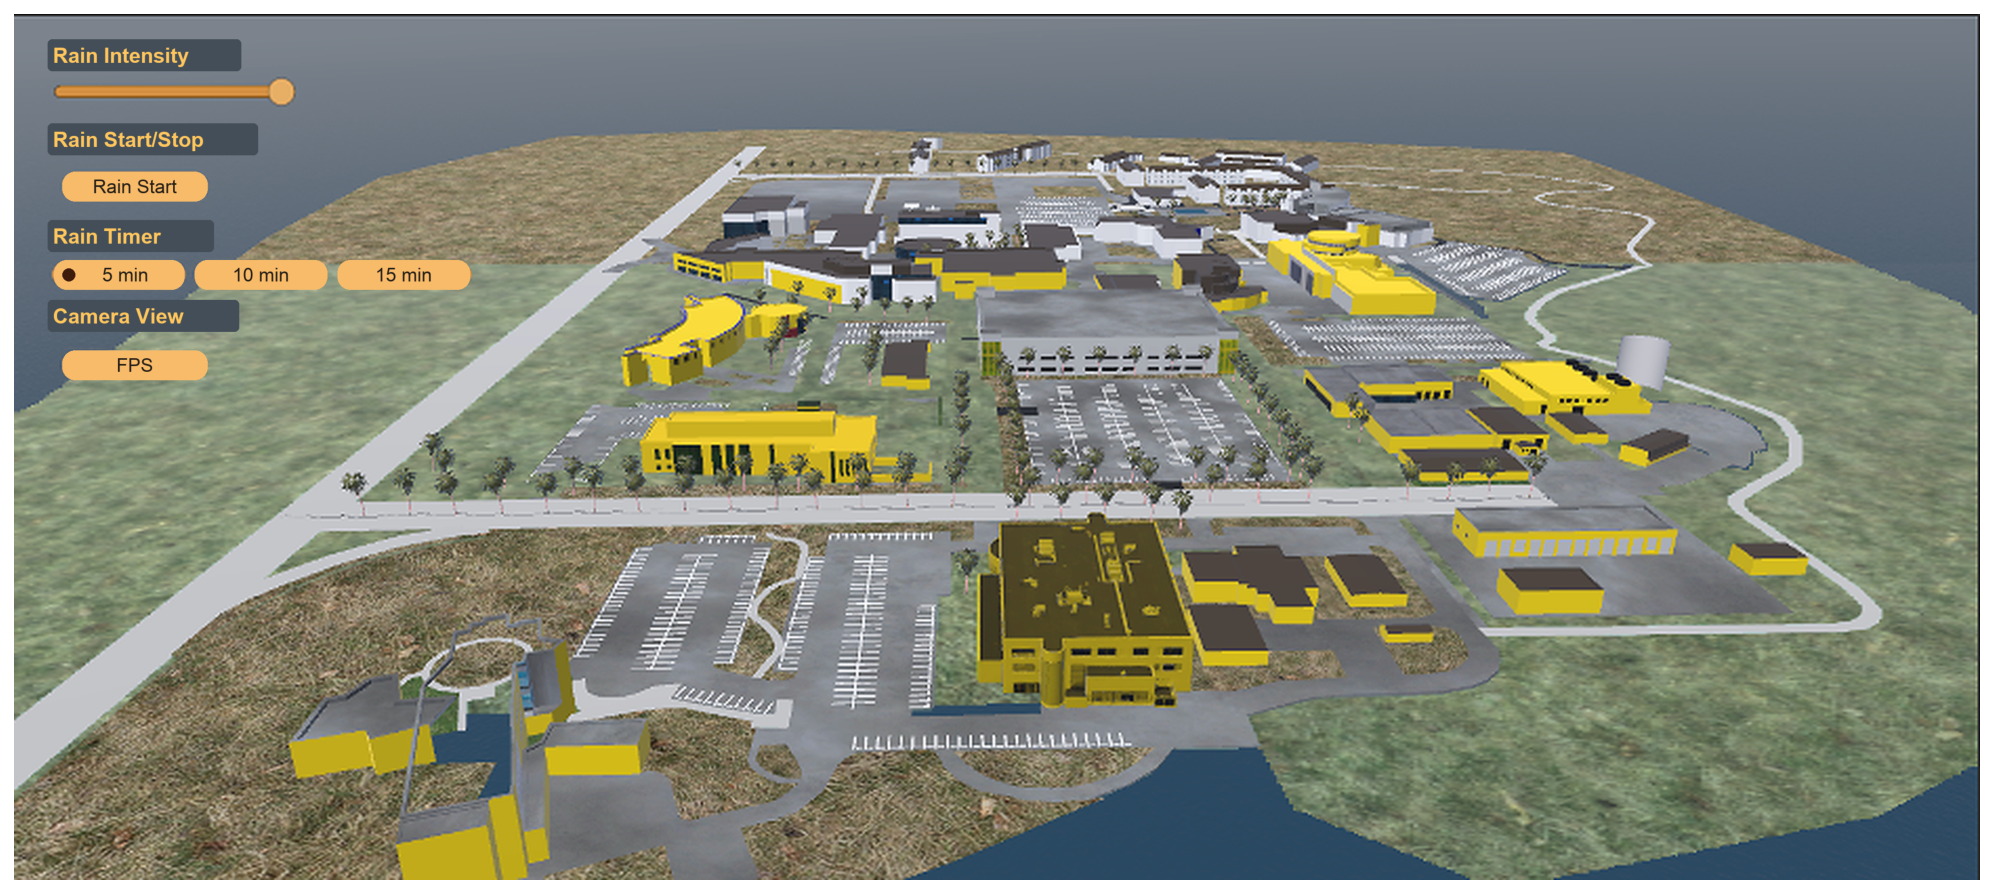
By integrating geospatial reconstruction, semantic building information, environmental observations, and interactive visualization, the proposed digital twin provides an effective platform for flood awareness, educational demonstration, emergency preparedness, and future decision-support applications. The modular architecture is also designed to support future integration of UAV imagery, IoT sensors, and additional environmental monitoring systems for enhanced situational awareness and decision-support capabilities [29]. Figure 6 illustrates the runtime UniTwin interface, showing the integration of rainfall controls, camera-view presets, environmental visualization, and interactive user exploration within the reconstructed campus digital twin.
Figure 6.
Unity-based digital twin interface showing rainfall controls, scenario selection, camera-view presets, and interactive exploration of the reconstructed campus environment during a representative rainfall visualization scenario.
3. Results and Discussion
3.1. System Evaluation
The proposed UniTwin framework was evaluated using both historical rainfall datasets and real-time WeatherLink observations. The evaluation was designed to assess the system’s ability to integrate environmental sensing, maintain interactive visualization performance, and support flood-awareness monitoring within a campus-scale digital twin environment.
Three aspects of system performance were considered:
- Environmental-data integration, including the acquisition and synchronization of WeatherLink observations with the digital twin environment.
- Digital twin characteristics, including the spatial extent of the reconstructed campus, the number of modeled assets, and the representation of semantic building information.
- Runtime performance, including rendering responsiveness, scene execution, and environmental-data update latency during representative rainfall scenarios.
The evaluation was conducted on an Apple M4 Pro platform using Unity 6, the Universal Render Pipeline (URP), and Apple’s Metal graphics framework. Representative rainfall scenarios were executed using both historical and live environmental observations to examine the responsiveness of rainfall visualization, building-level warning indicators, user interaction, and environmental synchronization within the UniTwin framework.
The reported results focus on environmental monitoring performance, digital-twin functionality, and interactive visualization characteristics rather than numerical hydrodynamic accuracy. Because the framework prioritizes real-time rendering responsiveness and situational awareness over 2D shallow-water numerical solvers, the displayed color-coded warning states represent scenario-based visualization thresholds and rule-based flood-awareness levels rather than quantitatively validated inundation depths. While the spatial domain maintains geographic consistency using DEM data (EPSG:26914) and OSM vector footprints, exact numerical transformation residuals between physical GIS coordinates and Unity world space were not independently established using ground survey control points. The system’s geospatial alignment supports visualization-oriented flood awareness rather than survey-grade spatial positioning. The current implementation is intended to support situational awareness and environmental monitoring while providing a foundation for future integration of physics-based flood-simulation capabilities.
3.2. System Setup and Rainfall Visualization Scenarios
The proposed UniTwin framework was developed in Unity 6 using the Universal Render Pipeline (URP) and executed on an Apple M4 Pro platform through Apple’s Metal graphics framework. The study domain represents the Texas A&M University–Corpus Christi campus and its surrounding coastal environment. The platform configuration and data sources used during the evaluation are summarized in Table 2.
Table 2.
Experimental platform and system configuration used during runtime evaluation.
Environmental observations were obtained from the WeatherLink API through asynchronous HTTP requests. The retrieved JSON responses were parsed at runtime and used to update rainfall visualization controls. The user interface provides quick-selection presets (5 min, 10 min, and 15 min) representing demonstration playback durations for interactive visualization sessions.
Three representative rainfall scenarios were evaluated to examine system performance across varying durations and intensities: (i) a short-duration event lasting 15 min at an intensity of () (≈22.23 mm total precipitation depth), (ii) a medium-duration event lasting 30 min at () (≈22.50 mm total depth), and (iii) a longer-duration event lasting 60 min at () (≈22.50 mm total depth). These scenarios represent duration-normalized events delivering approximately of cumulative rainfall depth to evaluate rainfall visualization, API synchronization, visualization threshold activation, and runtime responsiveness.
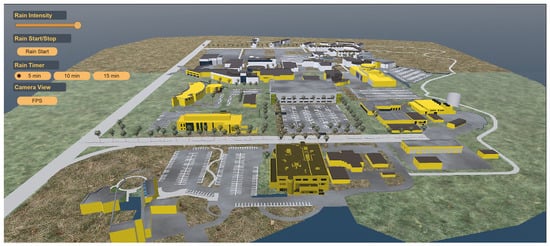
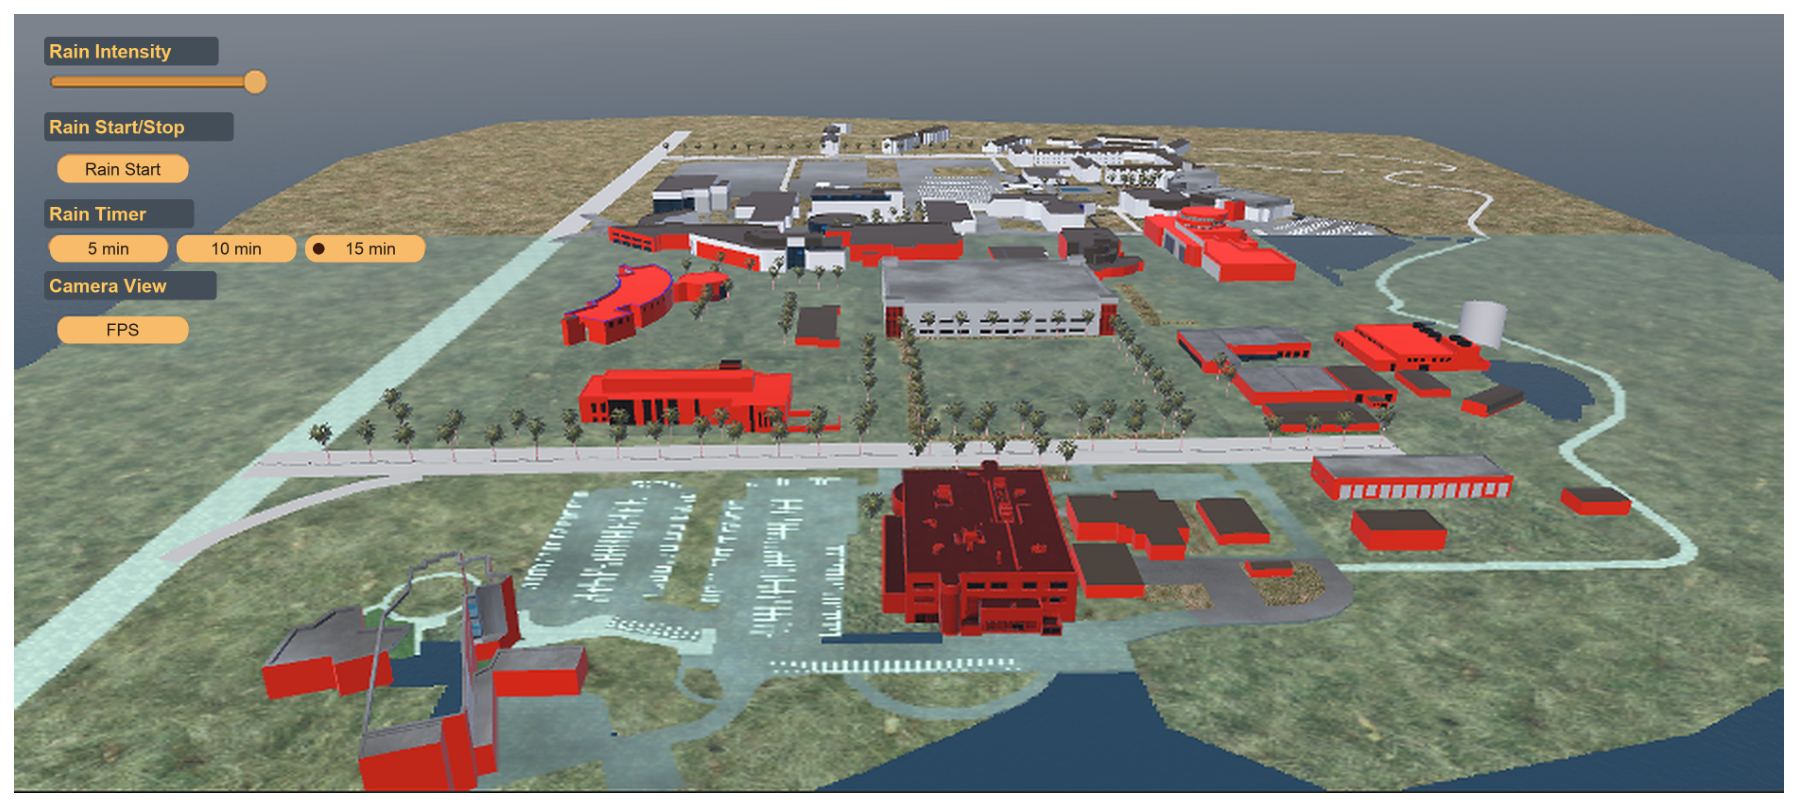
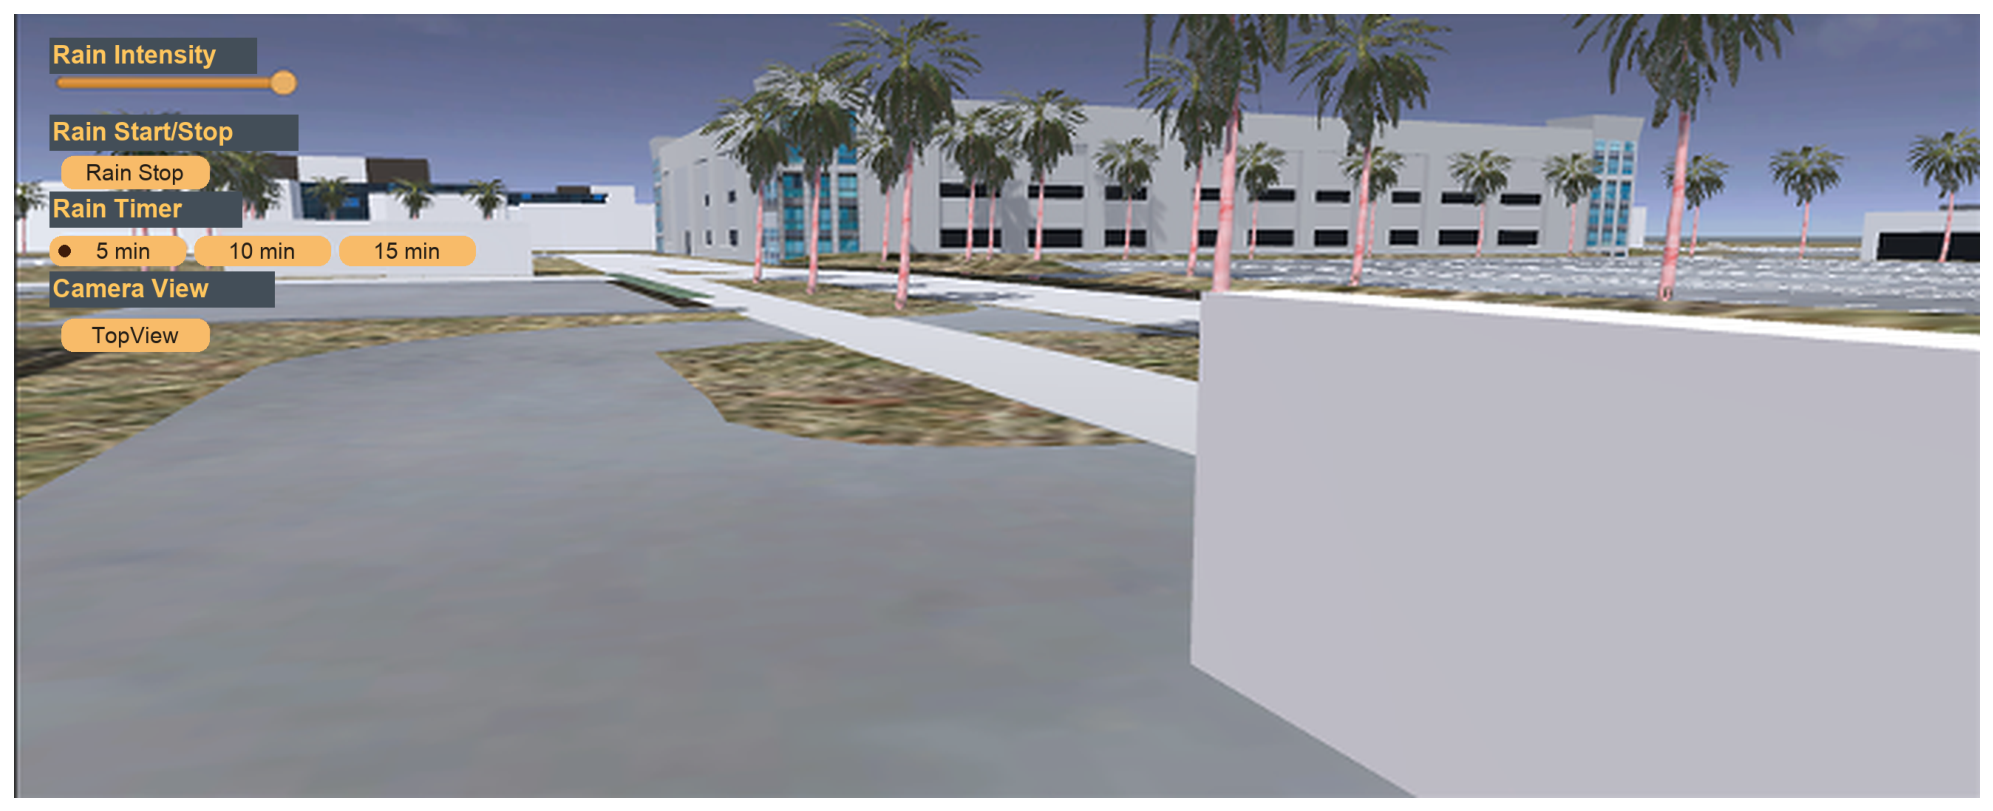
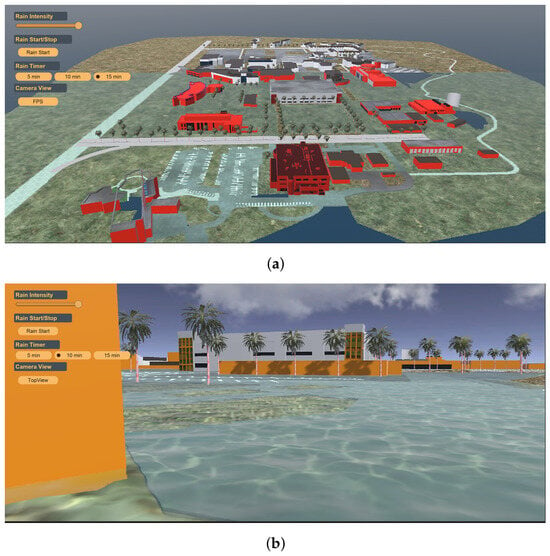
Figure 7 illustrates the runtime evaluation environment, including rainfall controls, scenario-duration selection, camera-view management, and interactive exploration capabilities available within the UniTwin digital twin. Figure 8 presents representative environmental observations collected during the evaluation period. The observed variability in rainfall intensity was used to define and examine multiple rainfall-awareness scenarios within the UniTwin digital twin environment.
Figure 7.
Runtime UniTwin environment used during scenario evaluation, displaying active rainfall controls set to 88.9 mm/h (3.5 in/h) intensity, scenario-duration selection, camera-view management, environmental visualization, and interactive exploration of the reconstructed Texas A&M University–Corpus Christi digital twin.
Figure 8.
Representative WeatherLink environmental observations collected during the evaluation period, including rainfall, temperature, wind speed, and barometric pressure measurements used as environmental inputs to the UniTwin digital twin framework.
3.3. Scenario Demonstration and Visual Evaluation
The proposed digital twin framework was evaluated through a series of interactive rainfall scenarios using environmental observations obtained from the WeatherLink API. The objective of this evaluation was to examine how real-time environmental observations influenced rainfall visualization, building-level warning indicators, and user interaction within the UniTwin digital twin environment.
Two representative rainfall scenarios were investigated to demonstrate the system’s capability under different rainfall conditions. The first scenario represents a short-duration, high-intensity rainfall event, while the second represents a longer-duration rainfall event. WeatherLink observations were used to drive rainfall conditions within the digital twin environment. As rainfall intensity increased, rainfall effects, water-surface visualization, and building-level warning indicators were updated dynamically throughout the simulation.
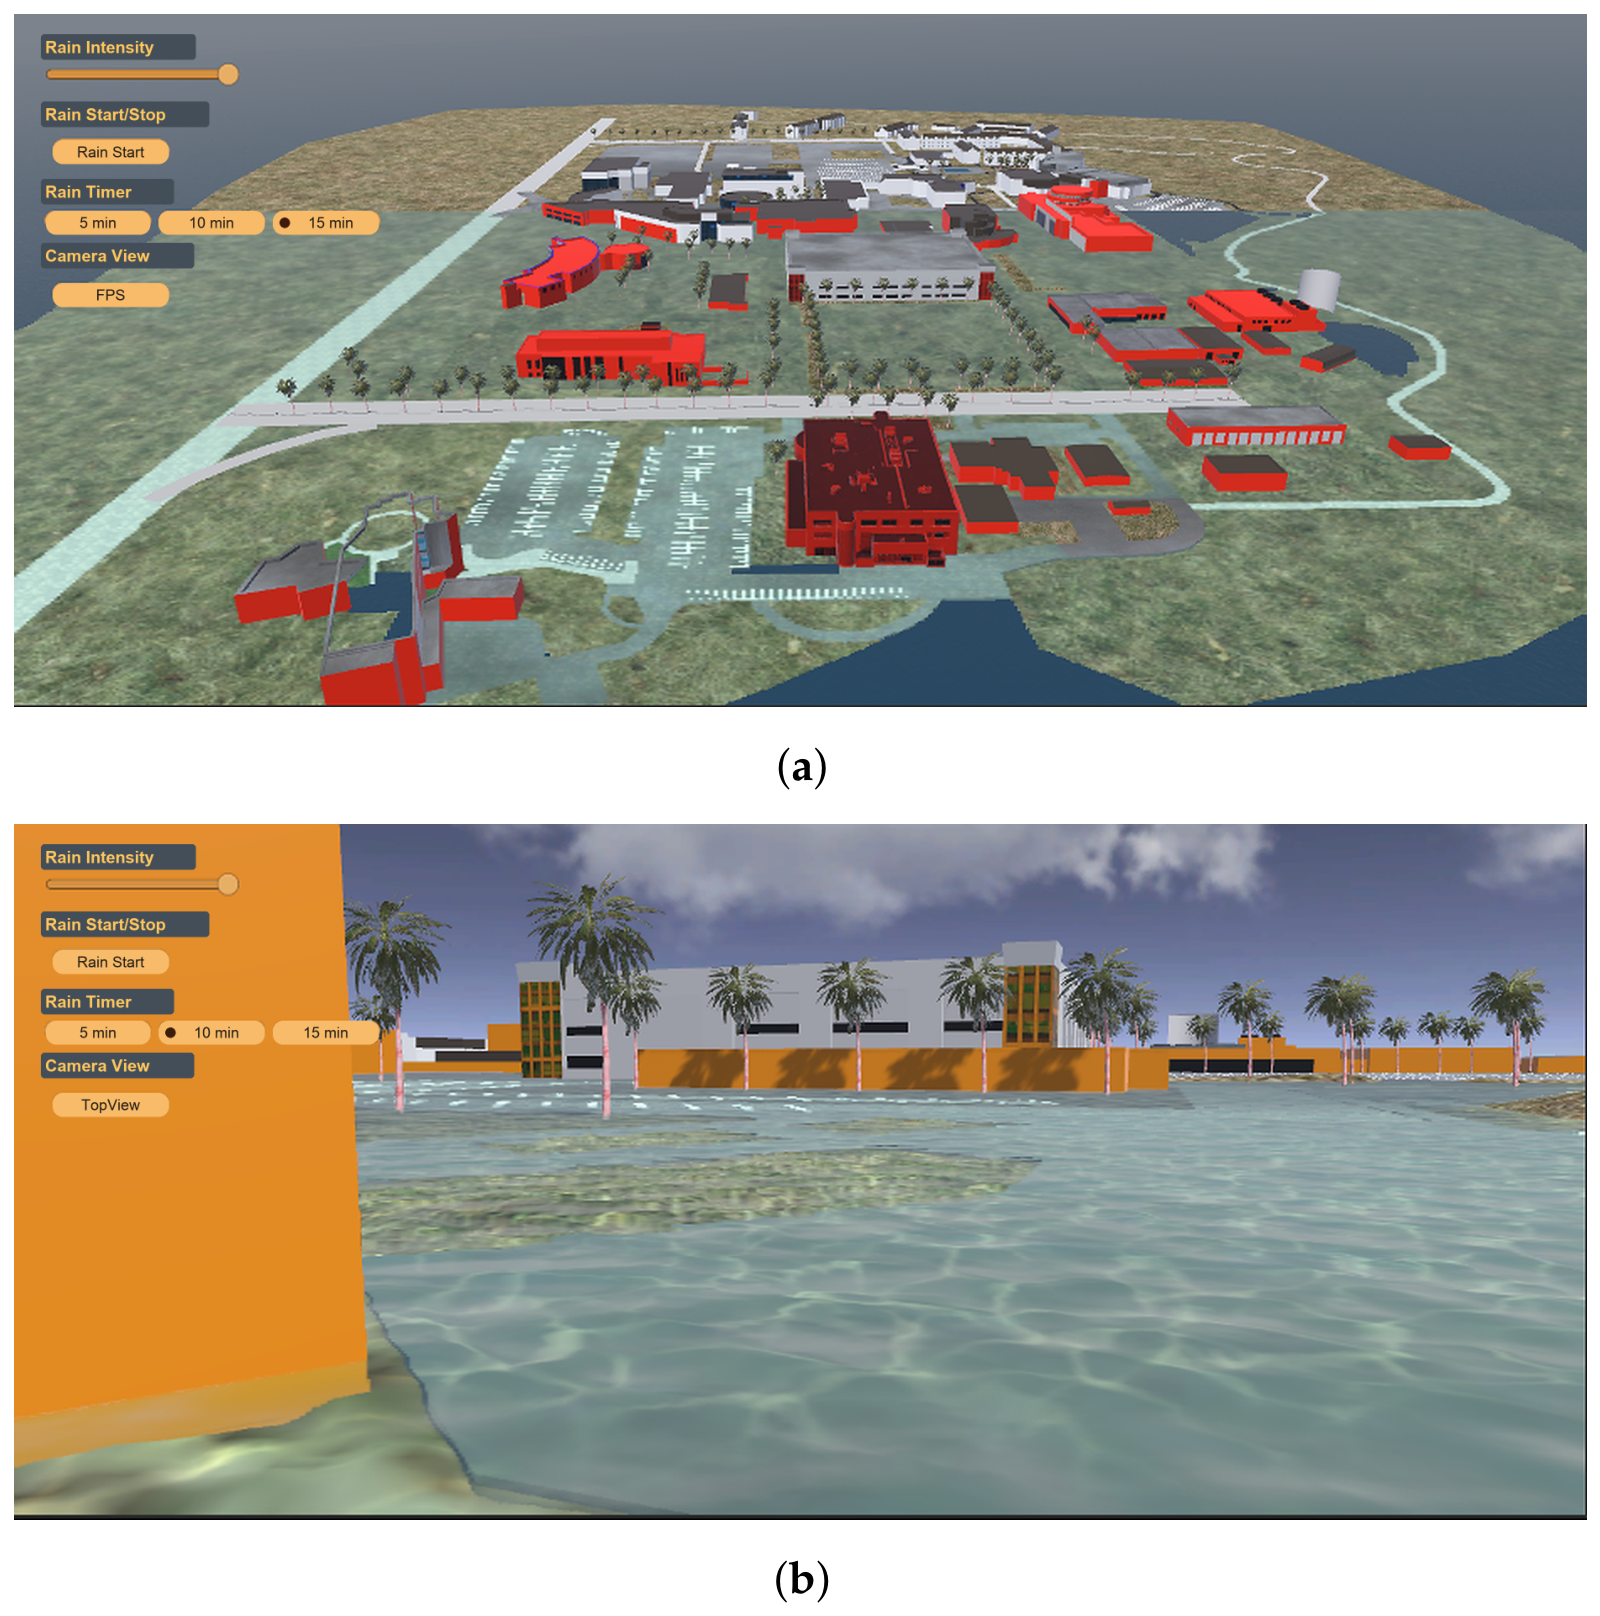
Figure 9 presents two representative runtime snapshots of the UniTwin digital twin under increasing rainfall conditions. Figure 9a illustrates a campus-wide rainfall scenario with building-level warning visualization, while Figure 9b shows the interactive runtime response of the digital twin during rainfall conditions. As rainfall intensity increases, predefined building-level warning thresholds are activated, allowing the visualization framework to highlight potentially affected structures using semantic color-coded indicators.
Figure 9.
Representative rainfall scenarios demonstrating building-level flood-status visualization within the UniTwin digital twin. (a) Campus-wide building-level warning visualization driven by 88.9 mm/h intensity. (b) Interactive rainfall visualization response.
The dynamic synchronization between environmental observations, rainfall visualization, and building-level warning states enabled users to observe the spatial progression of rainfall conditions throughout the reconstructed campus environment. This visual representation supports situational awareness by providing an intuitive view of changing environmental conditions and associated warning levels across the campus.
3.4. Interactive Visualization and User Experience
The UniTwin digital twin provides an interactive environment for exploring rainfall conditions and associated flood-awareness indicators within the reconstructed Texas A&M University–Corpus Christi campus. Users can navigate the environment from multiple viewpoints, adjust rainfall intensity, and examine different regions of the campus through configurable camera controls and scenario-management tools.
As rainfall conditions increase, predefined building-level warning thresholds are activated and represented using color-coded indicators. This visualization approach enables users to rapidly identify potentially affected structures and observe how warning states evolve throughout the campus environment. The integration of rainfall effects, environmental observations, and semantic building information provides an intuitive mechanism for communicating rainfall-related conditions within the digital twin.
Figure 10 illustrates the progression of rainfall-awareness scenarios within UniTwin. The visualization transitions from the baseline condition to increasing warning levels represented by yellow, orange and red indicators, allowing users to observe the spatial evolution of rainfall conditions and the corresponding changes in building-level flood-status visualization. Interactive camera navigation enables exploration of different regions of the campus from multiple viewpoints, enhancing situational awareness and supporting effective communication of rainfall scenarios.
Figure 10.
Progressive flood-awareness visualization within the UniTwin digital twin environment. Building-level warning indicators transition from the initial condition to yellow, orange, and red warning thresholds as rainfall conditions increase, providing intuitive visual communication of changing warning states across the campus environment. (a) Initial baseline rainfall scenario (0 mm/h). (b) Yellow visualization threshold (0.2 world-Y level/22.5 mm/h intensity). (c) Orange visualization threshold (0.5 world-Y level/45.0 mm/h intensity). (d) Red visualization threshold (1.0 world-Y level/88.9 mm/h intensity).
The interactive visualization capabilities support situational awareness, environmental monitoring, educational demonstration, and emergency-preparedness applications by combining real-time environmental observations with an immersive three-dimensional digital twin environment [7,8,9].
3.5. Scenario Analysis and Runtime Performance
To evaluate the robustness of the proposed digital twin framework, multiple rainfall scenarios were executed using both WeatherLink environmental observations and user-defined rainfall configurations. The analysis focused on environmental-data synchronization, rainfall visualization responsiveness, building-level warning activation, and overall runtime performance during scenario execution.
To provide quantitative context for the evaluated rainfall scenarios, Table 3 summarizes the principal environmental-monitoring characteristics obtained from the TAMUCC02 WeatherLink station during the evaluation period. These observations served as the primary environmental inputs driving rainfall-awareness visualization within the UniTwin framework.
Table 3.
Environmental monitoring characteristics used during evaluation.
The environmental observations indicate substantial temporal variability in rainfall conditions, including short periods of elevated rainfall intensity and longer intervals of lower precipitation. These variations provided a range of representative environmental conditions for examining rainfall visualization, warning-state activation, and digital-twin responsiveness.
Runtime performance was evaluated during scenario execution to assess the responsiveness of the visualization environment and the efficiency of environmental-data synchronization. To verify real-time communication efficiency, WeatherLink API performance was measured across 10 live request cycles. While station polling operates at 300 s (5 min) intervals, API network latency averaged 111.767 ms (SD: 17.642 ms; range: 85.615 ms to 151.955 ms). Asynchronous UnityWebRequest execution and client-side fallback logic ensure that data acquisition remains non-blocking, retaining the last valid observation during network delays to prevent frame drops. Furthermore, CPU-side building color updates executed in a mean time of 0.0335 ms across 10,000 samples, demonstrating negligible overhead for visual threshold updates. Table 4 summarizes the principal performance characteristics observed during the evaluation.
Table 4.
Data communication latency, visual threshold CPU execution cost, and rendering frame-rate benchmarks across baseline and active-rain simulation conditions.
The measured runtime performance indicates that the framework maintained interactive operation while processing environmental observations and visualization updates, demonstrating the feasibility of real-time environmental monitoring within a campus-scale digital twin environment.
The results indicate that the proposed framework can integrate environmental sensing, geospatial reconstruction, and interactive visualization within a single campus-scale digital twin environment. WeatherLink observations were synchronized successfully with the visualization framework, allowing rainfall conditions and warning indicators to update dynamically during scenario execution. The combination of Unity URP, Apple’s Metal graphics framework, and scene optimization techniques supported responsive visualization on consumer hardware while maintaining interactive exploration capabilities.
3.6. System Integration and Broader Implications
The proposed framework integrates environmental observations, geospatial reconstruction, semantic building information, and interactive three-dimensional visualization within a unified campus-scale digital twin environment. By combining WeatherLink environmental sensing, Cesium-derived geospatial data, BlenderGIS-based asset preparation, and Unity visualization technologies, UniTwin provides a practical platform for environmental monitoring and flood-awareness applications.
The integration of real-time environmental observations with an interactive digital twin enables users to explore changing rainfall conditions while maintaining spatial awareness of campus buildings, transportation infrastructure, and surrounding environmental features. This capability supports situational awareness, emergency preparedness, risk communication, and educational applications within a realistic spatial context.
Beyond the presented campus-scale implementation, the proposed architecture is adaptable to larger urban, coastal, and smart-campus environments. The modular design supports integration with additional environmental sensing technologies, including IoT devices, UAV imagery, and weather-radar products, allowing the platform to evolve toward more comprehensive environmental-monitoring systems.
While the current implementation relies on single-station (TAMUCC02) rainfall data across the campus domain, the modular ingestion pipeline is explicitly designed to ingest spatially distributed multi-station sensor networks, IoT rain gauges, and radar precipitation grids to resolve localized micro-scale storm variability in future implementations.
The framework also provides a foundation for the future incorporation of physics-based flood simulation (such as coupling with 2D shallow-water hydrodynamic solvers like LISFLOOD-FP or HEC-RAS), integration of hydrodynamic properties, AI-assisted forecasting, and bidirectional automated feedback loops to achieve full digital twin reciprocity. Currently, UniTwin operates as a one-way sensor-informed Digital Shadow for visual situational awareness without automated emergency dispatch or push-alerting mechanisms. Future extensions will incorporate automated bidirectional feedback protocols to communicate generated flood-warning alerts directly to campus management and emergency response personnel. These extensions will further strengthen the role of digital twins as interactive tools for environmental resilience, monitoring, and data-driven decision making.
4. Conclusions and Future Work
This study presented UniTwin, a sensor-informed digital twin platform for real-time campus environmental monitoring and flood-awareness visualization. Operating as a sensor-informed digital shadow, the framework integrates geospatial reconstruction, semantic building information, live and historical environmental observations obtained through the WeatherLink API, and interactive three-dimensional visualization within a unified Unity-based environment. Using the Texas A&M University–Corpus Christi campus as a case study, the platform demonstrated how real-world environmental observations can be synchronized with a virtual environment to support situational awareness, environmental monitoring, and interactive exploration.
The results demonstrate the feasibility of combining geospatial digital-twin technologies, environmental sensing, and immersive visualization within a campus-scale monitoring platform. Environmental observations were successfully integrated into the digital twin through WeatherLink data synchronization, while interactive rainfall visualization and building-level warning indicators enabled intuitive communication of changing environmental conditions. Runtime evaluation demonstrated that the framework can maintain responsive visualization and user interaction on consumer hardware while supporting real-time environmental awareness.
The proposed framework contributes a reproducible workflow for integrating environmental observations, geospatial reconstruction, and interactive visualization within a unified digital twin environment. Beyond flood-awareness applications, the platform provides a foundation for smart-campus monitoring, resilience planning, environmental education, and decision-support activities.
Future work will focus on extending UniTwin through the integration of physics-based flood-simulation capabilities based on Shallow Water Equations (SWEs), Smoothed Particle Hydrodynamics (SPH), and GPU-accelerated computational methods to support quantitative prediction of flood depth, flow velocity, and inundation extent. Additional developments will include UAV imagery, IoT sensor networks, weather-radar products, and AI-assisted forecasting models to enhance environmental awareness and operational decision support.
Future research will also investigate deployment beyond campus environments, including urban and coastal applications, as well as immersive visualization through augmented reality (AR), virtual reality (VR), and extended reality (XR) technologies. These advancements will support the evolution of UniTwin from a visualization-oriented environmental monitoring platform into a comprehensive intelligent digital twin for environmental resilience, emergency preparedness, and data-driven decision making.
In addition to its flood awareness visualization capabilities, UniTwin offers a scalable basis for sustainable smart campus management, for resilient urban planning, and for environmental stewardship. By incorporating sensor-driven virtual platforms into the institutional processes involved in making decisions, it improves the organization’s preparedness, helps create campus communities that are conscious of the climate issue, and contributes to the long-term sustainability of coastal and urban built environments as climate variability increases.
Author Contributions
Conceptualization, A.H.; methodology, A.H. and M.I.A.; software, M.I.A.; validation, A.H. and M.I.A.; data curation, A.H. and M.I.A.; writing—original draft preparation, A.H. and M.I.A.; writing—review and editing, A.H.; visualization, M.I.A.; project administration, A.H. All authors have read and agreed to the published version of the manuscript.
Funding
This research received no external funding.
Institutional Review Board Statement
Not applicable.
Informed Consent Statement
Not applicable
Data Availability Statement
The live environmental telemetry stream utilized in this study is retrieved via the WeatherLink API connected to the TAMUCC02 weather station, an institutional sensing asset managed by Texas A&M University–Corpus Christi. Due to institutional network security and API access restrictions, live API credentials cannot be publicly disclosed. Access to live station telemetry for research collaboration may be made available upon reasonable request to the corresponding author.
Acknowledgments
During the preparation of this manuscript, the authors utilized generative AI tools for English language editing, stylistic polishing, prose refinement, and response document formatting. All technical calculations, spatial data processing, experimental benchmarks, performance data curation, digital elevation models, C# scripting, and scientific conclusions were generated, curated, and independently verified entirely by the authors.
Conflicts of Interest
The authors declare no conflicts of interest.
References
- Hadimlioglu, I.A.; King, S.A.; Starek, M.J. FloodSim: Flood Simulation and Visualization Framework Using Position-Based Fluids. ISPRS Int. J. Geo-Inf. 2020, 9, 163. [Google Scholar] [CrossRef] [Scilit]
- Rong, Y.; Bates, P.; Neal, J. GPU-Accelerated Urban Flood Modeling Using a Nonuniform Structured Grid and a Super Grid Scale River Channel. Water Resour. Res. 2024, 60, e2023WR036128. [Google Scholar] [CrossRef] [Scilit]
- Vacondio, R.; Dal Palù, A.; Ferrari, A.; Mignosa, P.; Aureli, F.; Dazzi, S. A non-uniform efficient grid type for GPU-parallel Shallow Water Equations models. Environ. Model. Softw. 2017, 88, 119–137. [Google Scholar] [CrossRef] [Scilit]
- Morales-Hernández, M.; Sharif, M.B.; Kalyanapu, A.; Ghafoor, S.M.; Dullo, T.T.; Gangrade, S.; Kao, S.C.; Norman, M.R.; Evans, K.J. TRITON: A Multi-GPU open source 2D hydrodynamic flood model. Environ. Model. Softw. 2021, 141, 105034. [Google Scholar] [CrossRef] [Scilit]
- Sanders, B.F.; Schubert, J.E.; Detwiler, R.L. ParBreZo: A parallel, unstructured grid, Godunov-type, shallow-water code for high-resolution flood inundation modeling at the regional scale. Adv. Water Resour. 2010, 33, 1456–1467. [Google Scholar] [CrossRef] [Scilit]
- Kalyanapu, A.J.; Shankar, S.; Pardyjak, E.R.; Judi, D.R.; Burian, S.J. Assessment of GPU computational enhancement to a 2D flood model. Environ. Model. Softw. 2011, 26, 1009–1016. [Google Scholar] [CrossRef] [Scilit]
- Zhu, J.; Laefer, D.F.; Lejano, R.P.; Gmelch, P.; O’Keeffe, E.; Chandna, K. From 2D to 3D: Flood risk communication in a flood-prone neighborhood via dynamic, isometric street views. Prog. Disaster Sci. 2025, 26, 100419. [Google Scholar] [CrossRef] [Scilit]
- Boorboor, S.; Kim, Y.; Hu, P.; Moses, J.M.; Colle, B.A.; Kaufman, A.E. Submerse: Visualizing Storm Surge Flooding Simulations in Immersive Display Ecologies. IEEE Trans. Vis. Comput. Graph. 2024, 30, 6365–6377. [Google Scholar] [CrossRef] [Scilit] [PubMed]
- Symeonidis, S.; Samaras, S.; Stentoumis, C.; Plaum, A.; Pacelli, M.; Grivolla, J.; Shekhawat, Y.; Ferri, M.; Diplaris, S.; Vrochidis, S. An Extended Reality System for Situation Awareness in Flood Management and Media Production Planning. Electronics 2023, 12, 2569. [Google Scholar] [CrossRef] [Scilit]
- Dang, P.; Zhu, J.; Zhou, Y.; Rao, Y.; You, J.; Wu, J.; Zhang, M.; Li, W. A 3D-Panoramic fusion flood enhanced visualization method for VR. Environ. Model. Softw. 2023, 169, 105810. [Google Scholar] [CrossRef] [Scilit]
- Stavroulakis, A.; Dimelli, D.; Roumeliotis, M.; Mania, A. An Augmented Reality System Architecture for Flood Management. In Proceedings of the 10th International Conference on Geographical Information Systems Theory, Applications and Management—GISTAM. INSTICC; SciTePress: Setúbal, Portugal, 2024; pp. 211–218. [Google Scholar] [CrossRef] [Scilit]
- Saksena, S.; Merwade, V.; Singhofen, P.J. Flood inundation modeling and mapping by integrating surface and subsurface hydrology with river hydrodynamics. J. Hydrol. 2019, 575, 1155–1177. [Google Scholar] [CrossRef] [Scilit]
- Leandro, J.; Chen, A.S.; Djordjević, S.; Savić, D.A. Comparison of 1D/1D and 1D/2D Coupled (Sewer/Surface) Hydraulic Models for Urban Flood Simulation. J. Hydraul. Eng. 2009, 135, 495–504. [Google Scholar] [CrossRef] [Scilit]
- Al Kalbani, K.; Rahman, A.A. 3D city model for monitoring flash flood risks in Salalah, Oman. Int. J. Eng. Geosci. 2022, 7, 17–23. [Google Scholar] [CrossRef] [Scilit]
- Andriessen, L.; Agugiaro, G.; Borgers, A.; Pauwels, P. Semantic 3D city models as support for urban flood resilience: Experiences from Rotterdam. Isprs Ann. Photogramm. Remote Sens. Spat. Inf. Sci. 2024, X-4/W4-2024, 5–12. [Google Scholar] [CrossRef] [Scilit]
- Wu, Y.; Peng, F.; Peng, Y.; Kong, X.; Liang, H.; Li, Q. Dynamic 3D Simulation of Flood Risk Based on the Integration of Spatio-Temporal GIS and Hydrodynamic Models. ISPRS Int. J. Geo-Inf. 2019, 8, 520. [Google Scholar] [CrossRef] [Scilit]
- Joly, P. SPH-Fluid-Metal-GPU: SPH Fluid Simulation on Apple GPUs Using Metal. Available online: https://github.com/Pierre-Joly/SPH-Fluid-Metal-GPU (accessed on 1 October 2026).
- Kenyon, C.; Capano, C. Apple Silicon Performance in Scientific Computing. In Proceedings of the 2022 IEEE High Performance Extreme Computing Conference (HPEC), Waltham, MA, USA, 19–23 September 2022; pp. 1–10. [Google Scholar] [CrossRef] [Scilit]
- Hübner, P.; Hu, A.; Peng, I.; Markidis, S. Apple vs. Oranges: Evaluating the Apple Silicon M-Series SoCs for HPC Performance and Efficiency. In Proceedings of the 2025 IEEE International Parallel and Distributed Processing Symposium Workshops (IPDPSW), Milano, Italy, 3–7 June 2025; pp. 45–54. [Google Scholar] [CrossRef] [Scilit]
- Saini, R.; Andreopoulos, W.B. Performance Comparison of Machine Learning Across Metal, Cuda, and Software-Based Neuromorphic Simulation. Inventions 2026, 11, 55. [Google Scholar] [CrossRef] [Scilit]
- Gebraad, L.; Fichtner, A. Seamless GPU Acceleration for C++-Based Physics with the Metal Shading Language on Apple’s M Series Unified Chips. Seismol. Res. Lett. 2023, 94, 1670–1675. [Google Scholar] [CrossRef] [Scilit]
- Unity Technologies. Universal Render Pipeline Overview. Available online: https://docs.unity3d.com/Packages/com.unity.render-pipelines.universal@11.0/manual/ (accessed on 1 October 2026).
- Cesium. Cesium for Unity. Available online: https://cesium.com/learn/unity/ (accessed on 1 October 2026).
- BlenderGIS Project. BlenderGIS Add-On: Install and Usage (Project Documentation). Available online: https://github.com/domlysz/BlenderGIS/wiki/Install-and-usage (accessed on 1 October 2026).
- Davis Instruments. Real-Time Weather Data API for Rainfall Sensors. Available online: https://weatherlink.github.io/v2-api/ (accessed on 1 October 2026).
- Technologies, U. Weather Maker—Volumetric Clouds and Weather System for Unity. Available online: https://assetstore.unity.com/packages/tools/particles-effects/weather-maker-sky-weather-water-light-60955 (accessed on 1 October 2026).
- Esri. Flood Simulation in ArcGIS Pro 3.7. Available online: https://www.esri.com/content/dam/esrisites/en-us/media/technical-papers/flood-simulation-arcgis-pro.pdf (accessed on 1 October 2026).
- Beil, C.; Kutzner, T.; Schwab, B.; Willenborg, B.; Gawronski, A.; Kolbe, T.H. Integration of 3D point clouds with semantic 3D city models—Providing semantic information beyond classification. Isprs Ann. Photogramm. Remote Sens. Spat. Inf. Sci. 2021, VIII-4/W2-2021, 105–112. [Google Scholar] [CrossRef] [Scilit]
- Hernández, D.; Cecilia, J.M.; Cano, J.C.; Calafate, C.T. Flood Detection Using Real-Time Image Segmentation from Unmanned Aerial Vehicles on Edge-Computing Platform. Remote Sens. 2022, 14, 223. [Google Scholar] [CrossRef] [Scilit]

Disclaimer/Publisher’s Note: The statements, opinions and data contained in all publications are solely those of the individual author(s) and contributor(s) and not of MDPI and/or the editor(s). MDPI and/or the editor(s) disclaim responsibility for any injury to people or property resulting from any ideas, methods, instructions or products referred to in the content. |
© 2026 by the authors. Licensee MDPI, Basel, Switzerland. This article is an open access article distributed under the terms and conditions of the Creative Commons Attribution (CC BY) license.