


Abstract
Corporate supply chain green transformation supports sustainable production and environmental coordination across supply chains. Identifying its key predictors can inform sustainable supply chain management. Using a sample of 1119 Chinese listed firms from 2018 to 2023, this study applies explainable machine learning to examine predictive factors, nonlinear associations, and regional heterogeneity. The results show that firm size, leverage, fixed asset ratio, and operating expense burden make relatively large predictive contributions among internal factors, while industry peer greenness and regional economic development stand out among external factors. The predictive contribution of firm size increases at higher levels, whereas those of the fixed asset ratio and operating expense burden initially rise and then decline. Firm size and industry peer greenness exhibit model-based predictive interactions. Secondary predictors vary across regions: economic development and ownership concentration are prominent in eastern China, trade openness in central China, financing structure and profitability in western China, and ownership type and asset structure in northeastern China. These findings suggest tailoring support to firm resources and regional conditions, strengthening industry collaboration and information sharing, and cross-checking textual disclosures against actual environmental performance.
1. Introduction
As China pursues high-quality development, green and low-carbon transformation is extending beyond firms’ own production processes to encompass collaboration with upstream and downstream partners. Supply chains connect procurement, production, and product distribution. Their environmental practices affect both firms’ resource efficiency and the transmission of green technologies and management requirements across organizational boundaries. Corporate supply chain green transformation therefore offers an important means of reducing environmental impacts throughout the supply chain and strengthening industrial competitiveness [1]. In 2024, the Central Committee of the Communist Party of China and the State Council issued the Opinions on Accelerating the Comprehensive Green Transformation of Economic and Social Development. The document encourages firms to follow green procurement guidelines and establish green supply chains where feasible, thereby supporting coordinated transformation among upstream and downstream firms [2,3]. However, policy support and market demand do not necessarily translate into corporate action. Green technology development and supplier upgrading require sustained investment, while financing constraints and uncertain returns may weaken firms’ willingness to undertake these changes. Differences in technological capabilities and environmental management across supply chain partners create further difficulties, compounded by limited information sharing and high coordination costs [4]. A firm’s capacity for green production thus does not necessarily enable it to transform its wider supply chain. Identifying the key drivers [5], the conditions under which they matter, and their interactions can help improve the targeting of green transformation policies and support collaboration across firms.
Corporate supply chain green transformation involves the interplay of internal resources, transactional relationships, and external requirements. Green technological capabilities provide a technical foundation for substituting cleaner materials and modifying production processes, but incorporating technological advances into procurement and production also requires financial investment and organizational coordination [5,6]. Financial resources can support supplier audits, equipment upgrades, and continuous improvement, whereas debt servicing and operating expenses may crowd out such investment [3,7]. The relationship between resource conditions and transformation may therefore be nonlinear. Studies of digital supply chains provide a broader framework for these information flows [8]. Digital capabilities can connect procurement, production, and environmental records, reducing information collection and monitoring costs, but their value depends on whether the data inform actual management decisions [9]. Stable supplier relationships facilitate consistent standards and joint improvement, while excessive dependence on a few partners may increase the cost of replacing noncompliant suppliers [4,10]. Regulatory pressure changes firms’ incentives by increasing noncompliance costs and strengthening information requirements, although responses remain constrained by resources and implementation capabilities [11]. These interdependent or opposing pathways provide a theoretical basis for examining nonlinear associations and conditional interactions. Digital capabilities, transactional dependence, and regulatory pressure form part of the theoretical background; however, the available features do not allow this study to directly examine their independent roles.
Research on small and medium-sized enterprises also highlights the structure of green supply chain management and its sustainability implications [12]. Existing research provides a foundation for understanding corporate supply chain green transformation, but the predictive contributions, variations across feature ranges, and interaction patterns of different factors within a common feature framework warrant further investigation. Linear models generally require prespecified functional forms and interaction terms, which may limit their ability to capture complex patterns involving multiple factors [13]. Accordingly, this study examines Chinese A-share listed firms and develops a feature framework covering internal firm conditions and industry and regional environments. It constructs a proxy for transformation using green supply chain keyword frequencies in annual reports, compares the out-of-sample performance of tree ensemble models with a linear benchmark, and uses SHAP to examine the predictive contributions, nonlinear associations, and regional differences in key features.
This study offers three potential contributions. First, it incorporates internal firm conditions and external environments into a common predictive framework to compare the information provided by different features. Second, it introduces a previous-year outcome benchmark to compare the out-of-sample predictive performance of two information sources—the selected features and firms’ own history—and clarify the extent to which the features capture historical persistence. Third, it combines dependence plots with model-based interaction analysis to identify conditional differences that a single average relationship may obscure. By distinguishing text-based proxy measurement from actual environmental performance, and predictive associations from causal effects, the study informs sustainable supply chain monitoring and subsequent investigations of underlying mechanisms.
2. Literature Review
Recent research on corporate green transformation increasingly examines how environmental practices extend across supply chains. A meta-analysis links green supply chain management to green innovation and highlights interorganizational learning as a useful perspective for understanding this relationship [14]. Research on Chinese manufacturing firms also examines internal innovation and external institutional pressures together when explaining green supply chain adoption [15]. These studies suggest that corporate supply chain green transformation depends on both firms’ own capabilities and the conditions under which they cooperate with business partners.
The natural-resource-based view provides a theoretical foundation for understanding internal capabilities. It argues that capabilities associated with pollution prevention and product stewardship can become sources of competitive advantage when integrated with corporate strategy [5]. Green transformation therefore involves more than additional environmental expenditure; it requires changes in technologies, management processes, and resource allocation. Research on supply chain integration further shows that its relationship with green innovation depends partly on the support provided by green information systems [6]. Related studies examine green intellectual capital and green knowledge acquisition as conditions associated with innovation and environmental performance [16,17]. These findings suggest that technological capabilities and organizational coordination need to be considered together. Developing green technologies does not necessarily ensure their application throughout the supply chain. Firms must also incorporate environmental requirements into procurement, production, and cooperation with business partners. Green innovation and supply chain greenness may not move in tandem, warranting further examination of the conditions underlying this divergence. Drawing on the natural-resource-based view, green innovation and its persistence are expected to be positively associated with supply chain green transformation. However, this association depends on whether technological advances are incorporated into business operations and does not necessarily imply that these indicators will rank highly in predictive importance.
Financial conditions provide another explanation for differences in implementation. Evidence from Chinese listed firms links supply chain finance to green innovation, identifying the alleviation of financing constraints and stronger supply chain networks among the relevant mechanisms [3]. Analytical research also compares internal collaborative financing with external investment for capital-constrained green supply chains, showing that financing arrangements need to be considered alongside operational decisions [7]. Supplier upgrading and production adjustments require sustained investment, while uncertain returns may discourage firms from undertaking costly changes. Financially constrained firms may therefore struggle to act even when environmental requirements are clear. For better-resourced firms, organizational capabilities and implementation efficiency may become more important. Broader corporate sustainability research also links the materiality of sustainability issues to financial outcomes and examines investor confidence in the relationship between ESG performance and firm value [18,19]. These studies provide financial context, although their outcomes differ from supply chain greening. Financial conditions may consequently shape the circumstances under which other capabilities contribute to supply chain greening. Cash flow and profitability are therefore generally expected to be positively associated with green transformation, whereas leverage reflects both financing support and debt repayment constraints, leaving its expected association ambiguous. Fixed assets provide a production base but may also increase upgrading costs; operating expenses support management and coordination but may compete for resources needed for transformation. These opposing effects provide a rationale for examining nonlinear relationships.
Supply chain relationships can influence environmental practices through coordination and dependence. Evidence from Chinese listed firms associates supplier concentration with higher carbon emission intensity through increased energy consumption and reduced green innovation, illustrating the potential environmental costs of dependence on major suppliers [10]. Research on customer pressure further shows that firms’ adoption of green supply chain management depends on the institutional logics under which they operate [20]. Stable relationships may facilitate information exchange and common environmental standards, but dependence on particular partners can also limit adjustment options. Research on supply chain integration emphasizes the role of flexibility in supply chain performance [21], while supply chain measurement frameworks caution against treating performance as a single dimension [22]. Supply chain concentration therefore cannot be assumed to have a uniform relationship with environmental improvement. Its implications need to be examined alongside firms’ resources and trading conditions.
Digitalization provides new tools for coordinating environmental information. Research on manufacturing operations identifies digital applications across different dimensions of green supply chain management and emphasizes the importance of management coordination in their adoption [9]. Evidence from the garment industry examines green supply chain management and circular economy practices as channels connecting Industry 4.0 technologies with sustainable supply chain performance [23]. Research on digital capabilities also incorporates green supply chain collaboration and top management’s environmental awareness, connecting information capabilities with organizational and interfirm conditions [24]. Evidence from Chinese listed firms further links supply chain digitization to green innovation through supply chain integration and management efficiency [25]. Research in related settings links digitalization to supply chain ESG performance and traceability in ethically sourced materials [26,27]. Studies of digital transformation further examine enterprise competitiveness and value creation among SMEs [28,29], whereas research on the digital economy, renewable energy, and global value chains focuses on broader sustainability outcomes [30]. At the regional level, digitalization has also been studied in relation to green innovation, high-quality energy development, and urban resilience [31,32,33]. Firm-level research considers green innovation through resilience and examines ESG performance in manufacturing firms [34,35]. These outcomes differ from the present text-based supply chain measure and are used here as context rather than direct evidence about its predictors. Together, these studies suggest that digital tools can support green practices, but their value depends on how they are incorporated into business processes. General digital investment should therefore be distinguished from the capability to use information for environmental management.
External institutional pressures also shape firms’ responses. Recent research examines institutional pressures, green innovation, and green supply chain practices alongside big data analytics capabilities, emphasizing their combined relevance to circular supply chain performance [36]. Research on manufacturing SMEs further considers green supply chain practices as a channel connecting environmental orientation with performance and identifies institutional pressure as a condition shaping this relationship [37]. These findings complement evidence that internal innovation and external pressures jointly explain green supply chain adoption [15]. External requirements may encourage firms to introduce environmental standards, but implementation depends on their capacity to finance, organize, and coordinate the necessary changes. Environmental regulation has also been linked to heterogeneous green productivity outcomes in China [38]. Research on corporate social responsibility during the COVID-19 pandemic shows that external shocks can alter firms’ social responsibility and marketing context [39]; accordingly, annual-report language may reflect changes in attention alongside operational change. Differences among firms operating in similar environments therefore require attention to the match between external requirements and internal resources.
These studies provide evidence on the conditions associated with green supply chain practices, but the relative predictive importance of different factors and their joint relationships remain open to investigation. Much of the literature examines specified pathways among selected factors. Causal research on data elements and corporate green transformation addresses a different question: how a defined intervention changes outcomes [40]. Methodological work further distinguishes moderation from mediation, reinforcing the need to describe model interactions without claiming an identified causal pathway [41]. A complementary approach is to assess multiple features within a common predictive framework and explore nonlinear patterns without specifying every interaction in advance. SHAP provides a framework based on cooperative game theory for attributing model predictions to individual features [42,43]. Building on this literature, this study combines internal firm characteristics and external conditions within a common feature framework. Model comparisons and feature attribution identify key predictors of corporate supply chain green transformation and examine their nonlinear and interactive patterns. The findings are interpreted as predictive associations and assessed for stability, providing evidence that can inform subsequent causal research. The differences among these studies lie primarily in the conditions under which resources are converted into action, transaction dependence matters, and firms respond to institutional pressures. This perspective provides the starting point for comparing the predictive contributions of different factors and how those contributions vary across their respective ranges.
3. Research Design and Explanation
3.1. Sample and Data
This study examines Chinese A-share listed firms. Firm-level data were matched with annual-report green supply chain keyword counts, annual industry classifications, and regional economic data by firm code and year. The initial dataset comprises 11,200 firm-year observations for 1120 firms from 2014 to 2023. Restricting the period to 2018–2023 leaves 6720 observations. After excluding 177 observations with missing outcome values, constructing the industry peer measure and green innovation persistence measure, and excluding a further eight observations with missing industry peer values, the final unbalanced panel contains 6535 observations for 1119 firms. Table 1 details the sample selection process. Missing keyword counts were not treated as zeros. Missing records may arise from incomplete annual-report collection, text parsing, or database coverage, and may also be associated with firms’ disclosure characteristics. Because the original reports corresponding to all missing observations have not been individually checked, the reasons for missingness cannot be determined. Missing values are therefore not interpreted as evidence of an absence of green supply chain activities, nor is the resulting sample loss assumed to be random. Historical information required for the peer and innovation persistence measures was obtained from data preceding the analysis period. The sample covers Chinese A-share listed firms with the required data. Listed and unlisted firms may differ systematically in their resources, governance structures, and disclosure requirements. The findings therefore should not be directly generalized to unlisted firms or the wider SME population.
Table 1.
Definitions of the target variable and predictive features.
3.2. Research Methods
3.2.1. Machine Learning Models
This study uses XGBoost, LightGBM, and random forests, with ridge regression as a linear benchmark. XGBoost controls model complexity through iterative regression trees and regularization [44]; LightGBM uses an efficient gradient boosting framework [45]; and random forests combine multiple trees to reduce prediction variability [46]. Ridge regression provides the linear benchmark [47]. All models use the same temporal splits and evaluation metrics.
3.2.2. Explainability Analysis
SHAP is used to explain out-of-sample predictions [42,43]. Mean absolute SHAP values and their shares measure global and relative feature importance. Dependence plots and TreeSHAP interaction values are used to examine the direction of predictive contributions, variation across feature ranges, and joint predictive contributions. These results describe model-based prediction attribution; they do not establish causal effects or economic mechanisms.
3.2.3. Model Evaluation
An expanding-window design is used: models are trained on 2018–2020, 2018–2021, and 2018–2022 data to predict outcomes in the following year. Within each training window, Optuna conducts 20 hyperparameter optimization trials using temporal validation and RMSE as the selection criterion [48]. The random seed is set to 42.
3.2.4. Robustness Checks
Predictive performance and SHAP rankings are compared across algorithms, test years, and configurations in which the features are lagged. The sensitivity of the results to extreme outcome values is examined by treating the tails of the training outcome. Ridge regression serves as the linear prediction benchmark and is evaluated on the same test observations using the same metrics as the other models.
3.3. Variable Selection
3.3.1. Target Variable
Corporate supply chain green transformation involves incorporating environmental considerations into procurement, production, logistics, distribution, and end-of-life recovery and disposal. No single operational indicator fully captures this process. He et al. [49] argue that listed firms’ annual reports contain information on green supply chain strategies, implementation, achievements, and challenges. They construct a keyword dictionary covering different stages of the supply chain and use textual analysis and word frequencies to measure supply chain greenness. Following this measurement approach, this study uses the natural logarithm of one plus the frequency of green supply chain keywords in each firm’s annual report as a proxy for its level of supply chain green transformation:
Here, is the frequency of green supply chain keywords in firm ’s annual report in year . We use annual-report keyword counts provided by the database and do not combine them with counts from corporate social responsibility reports. Missing keyword counts are not coded as zero. This text-based proxy indirectly captures information about green supply chain activities, but it may also reflect managerial attention and disclosure practices. We therefore interpret the identified predictors within this measurement scope.
3.3.2. Predictive Features
Features are selected from two levels: internal firm factors and the external environment. Internal factors cover basic firm characteristics, operations, corporate governance, and green technological capabilities. Firm size, ownership type, and age describe the resource base and development stage. Leverage, profitability, cash flow, the fixed asset ratio, firm value, and operating expense burden capture financial conditions and operating resource allocation. Board characteristics and ownership structure describe decision-making and monitoring arrangements. Green innovation and its persistence capture technological accumulation. Together, these factors describe the resources and organizational conditions available for implementing environmental requirements.
External factors comprise industry peer greenness, economic development, trade openness, and industrial structure. Industry peer greenness captures associations with the common industry environment and other firms’ green supply chain disclosures. Regional economic conditions affect access to green services and supporting resources, trade openness describes links with external markets, and industrial structure captures regional production and service conditions. The final feature set contains 17 internal factors and four external factors, as defined in Table 1.
Industry peer greenness (Peer) is the mean of other firms in the previous year within the industry to which firm i belongs in the current year:
Here, is firm i’s industry in year , is the set of firms in that industry with valid target values in the previous year, and is the number of eligible firms after excluding firm . The peer mean is calculated using all firms with valid keyword counts and industry information, rather than only the final modeling sample. Firm i’s previous-year observation is excluded when it belonged to the same industry. Using historical information avoids incorporating peers’ contemporaneous target values.
Green innovation persistence (Persist) is classified as an internal technological capability. It is measured as the proportion of years with at least one green invention patent application in the three-year window ending in the current year:
Here, is the number of green invention patent applications in the relevant year, and is an indicator function. Observations without three consecutive years of records are excluded from the complete model sample. This measure captures the continuity of innovation activity and provides information distinct from annual green innovation levels.
4. Empirical Results
4.1. Feature Importance Analysis
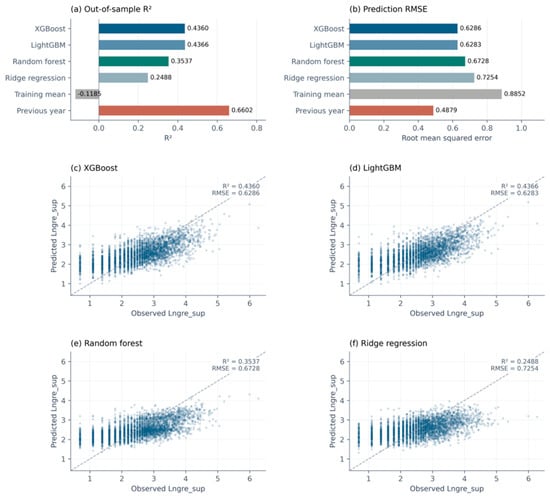
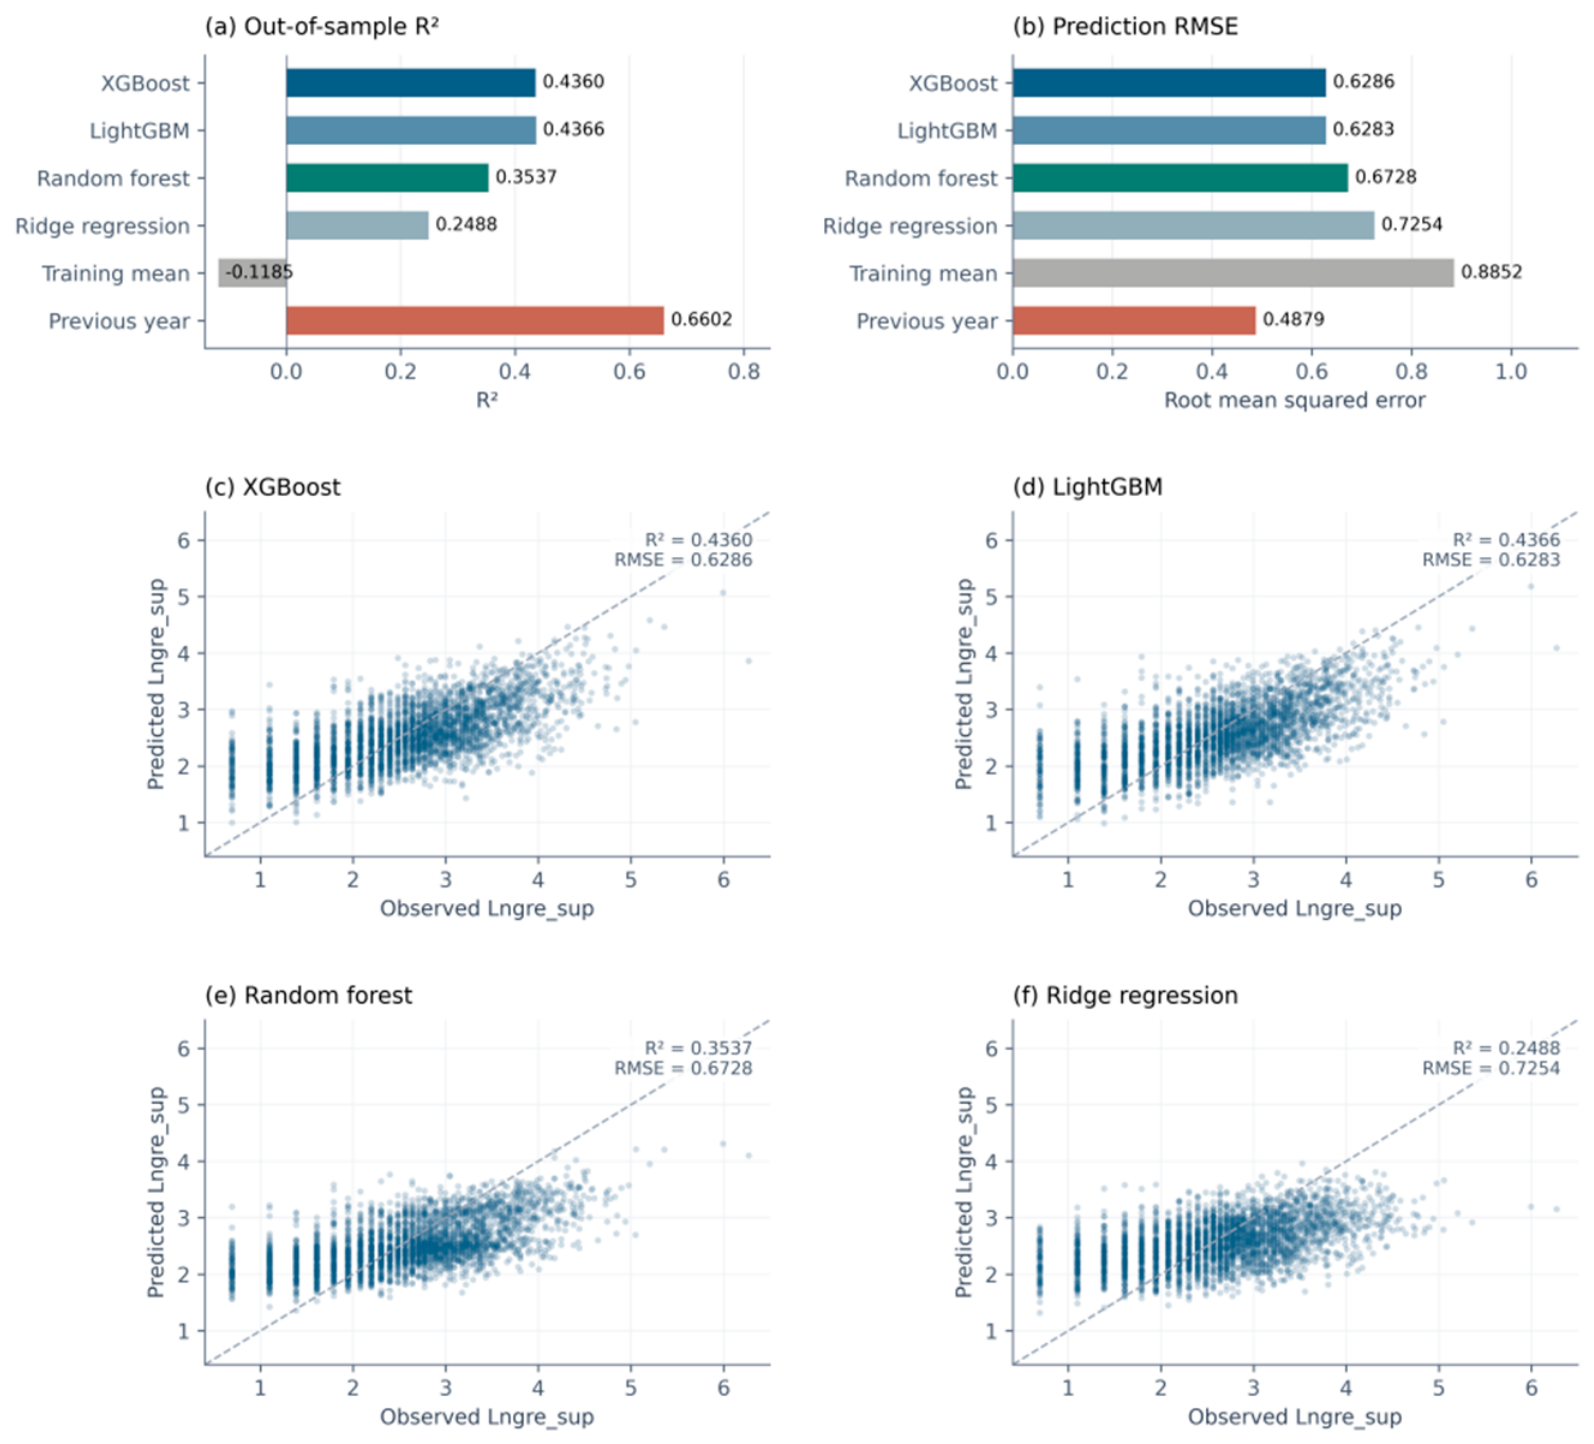
An expanding-window validation scheme is used, with hyperparameter optimization conducted within each training period, yielding 3307 out-of-sample observations. Table 2 shows that LightGBM and XGBoost achieve R2 values of 0.4366 and 0.4360 and RMSE values of 0.6283 and 0.6286, respectively. Their predictive performance is similar, and both outperform random forests and ridge regression, indicating that nonlinear models extract more predictive information from the available features. The previous-year benchmark achieves an R2 of 0.6602, exceeding all four learning models and suggesting substantial annual persistence in firms’ green supply chain disclosures. The prediction models do not jointly include firms’ own lagged outcomes and the other features. This comparison therefore evaluates different sources of predictive information and does not establish that the selected features provide incremental predictive value beyond firms’ own historical persistence. Figure 1 indicates that the learning models tend to underestimate higher observed values. XGBoost is used for the subsequent attribution analysis, while other tree models assess the stability of the identified predictors.
Table 2.
Comparison of out-of-sample predictive performance.
Figure 1.
Out-of-sample predictive performance and observed versus predicted values. Note: Predictions are based on expanding-window temporal validation. The test sample comprises 3307 firm-year observations from 2021 to 2023. Test-year data were not used to determine preprocessing rules or select hyperparameters. Unless otherwise stated, the same expanding-window validation procedure and out-of-sample definition apply to subsequent figures.
Table 3 reports the ten most important features identified by permutation importance for each model. Importance is measured by the increase in out-of-sample RMSE after randomly permuting a feature; a larger increase indicates greater model reliance on that feature. Firm size and industry peer greenness occupy the top two positions in all four models. The fixed asset ratio, leverage, and economic development also consistently appear among the top ten. XGBoost shares nine of its top ten features with LightGBM, eight with random forests, and five with ridge regression. Although individual rankings differ, the main sources of predictive information show some consistency across models.
Table 3.
Top ten predictors identified by permutation importance across models.
Out-of-sample SHAP values are calculated from the fitted XGBoost models. Each feature’s contribution magnitude is measured by its mean absolute SHAP value, and its relative importance is calculated as a percentage of the total across all 21 features. Table 4 shows that industry peer greenness and firm size rank first and second, accounting for 20.15% and 18.74%, respectively, or 38.89% combined. Permutation importance measures changes in prediction error, while SHAP allocates contributions to model outputs. The two rankings therefore need not coincide.
Table 4.
Mean absolute SHAP values and relative feature importance.
Among internal factors, firm size makes the largest predictive contribution, followed by leverage, the fixed asset ratio, and operating expense burden. Green supply chain management requires firms to adjust their own production processes while undertaking supplier selection, environmental audits, and the implementation of environmental standards. The resources and organizational capacity associated with firm size may therefore provide valuable predictive information. Leverage describes financing arrangements, the fixed asset ratio captures the production asset base and potential adjustment constraints, and operating expense burden reflects resources committed to management and market activities. Their importance does not imply that larger size, higher debt, or greater expenditure is invariably favorable; the relationships require further examination through nonlinear analysis.
Governance and technological capabilities provide supplementary information. Ownership concentration ranks seventh, while return on equity, firm value, operating cash flow, and firm age also contribute to prediction. These features suggest that decision-making arrangements, profitability, and development stage help distinguish firms’ green transformation levels. Green innovation persistence ranks thirteenth, whereas annual green innovation ranks twenty-first. Their additional predictive contributions are relatively limited once industry conditions and operating characteristics are included. This low ranking may reflect overlapping information among features, the text-based outcome proxy, and delays in applying green technologies. It should not be taken as evidence that green innovation is unimportant to actual supply chain green transformation. Patent activity and supply chain greening capture different dimensions of corporate behavior, and applying technological capabilities to procurement and management may require complementary resources and organizational support.
Among external factors, industry peer greenness makes the largest predictive contribution, followed by economic development. Industrial structure and trade openness rank tenth and fifteenth, respectively. Industry peer greenness may capture common industry constraints and market requirements, alongside learning and convergence among firms. However, because this feature is constructed from prior-year values of the same text-based outcome, its high importance may partly reflect common industry trends and temporal persistence rather than peer influence. SHAP importance alone cannot distinguish these explanations. Economic development and industrial structure describe the regional availability of green services and supporting resources, while trade openness captures external market connections. Internal and external factors account for 68.11% and 31.89% of total relative importance, respectively. However, the categories contain 17 and four features, so these totals describe the attribution structure of the selected feature set. They cannot be interpreted as evidence that internal conditions are causally more important than the external environment.
4.2. Heterogeneity Analysis
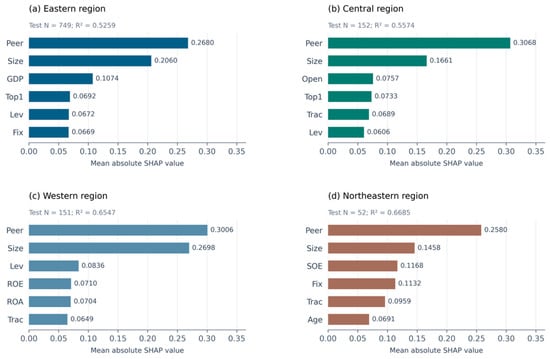
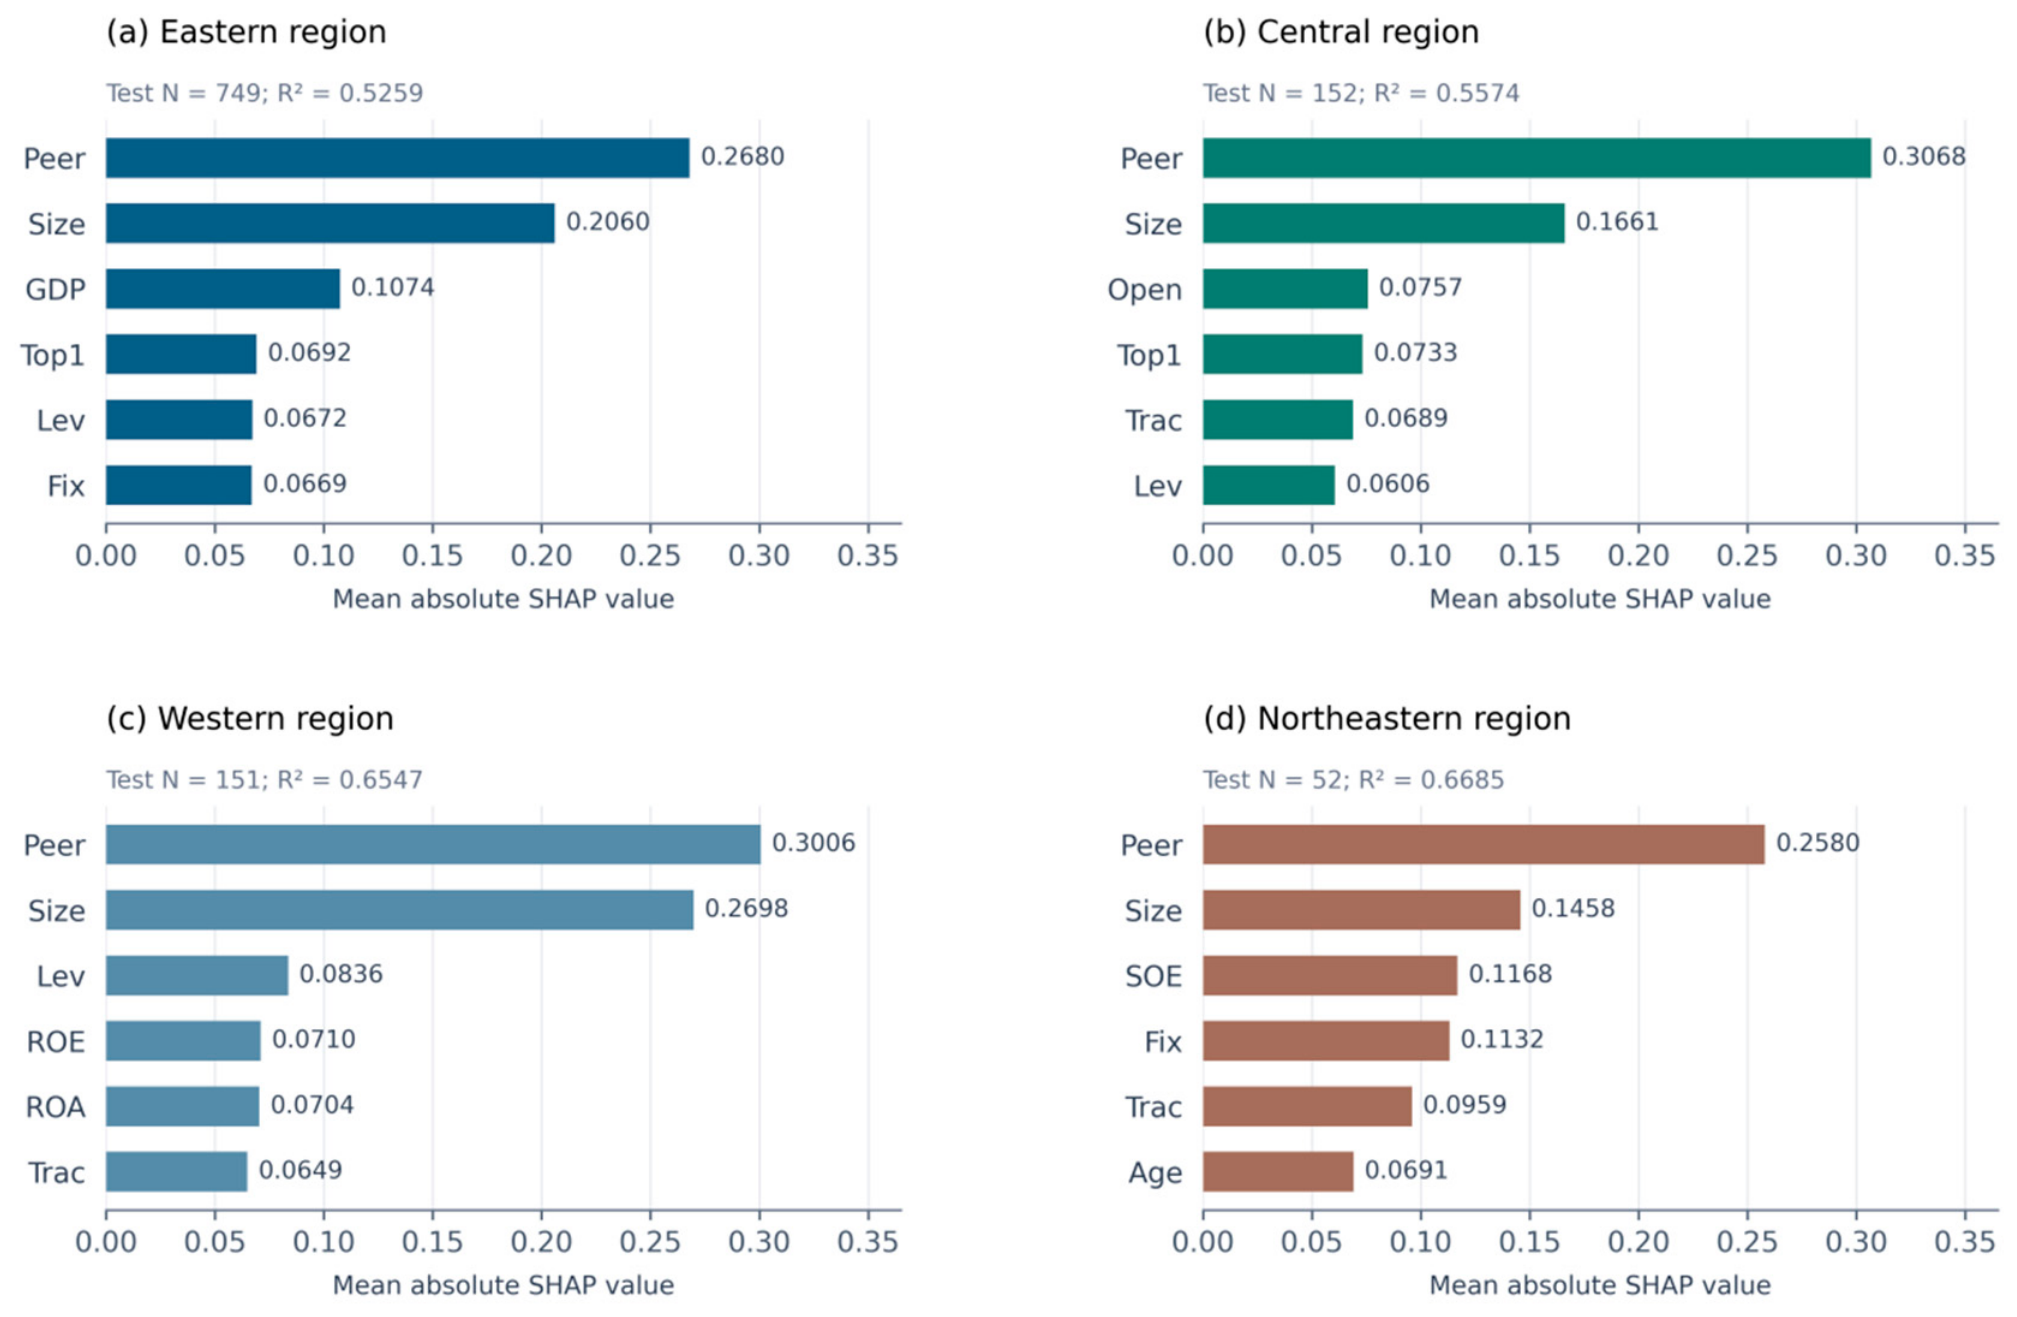
Corporate supply chain green transformation is associated with both firm-specific conditions and regional development environments. Global rankings may therefore conceal regional differences. Following the regional classification of China’s National Bureau of Statistics, the sample is divided into eastern, central, western, and northeastern China. Separate regional models are trained using the XGBoost hyperparameters selected from the national training sample for 2018–2022 and evaluated on firms observed in 2023. Continuous features are winsorized using percentiles from each region’s training sample, and the test year is excluded from model adjustment. Figure 2 presents the six most important features in each region, ranked by mean absolute SHAP value.
Figure 2.
Regional heterogeneity in SHAP attribution for corporate supply chain green transformation based on XGBoost. Note: SHAP values are calculated from out-of-sample predictions for firms in each region in 2023. The test samples comprise 749 firms in eastern China, 152 in central China, 151 in western China, and 52 in northeastern China. Test-year data were not used to determine preprocessing rules or select hyperparameters.
Industry peer greenness and firm size occupy the top two positions in all four regions. Higher values generally correspond to higher SHAP contributions, indicating relatively stable predictive relevance for the industry environment and firm resources. Secondary predictors, however, differ across regions. In eastern China, economic development and ownership concentration rank third and fourth, followed by leverage and the fixed asset ratio. Regional development and corporate governance thus provide notable additional information. In central China, trade openness ranks third, while ownership concentration, operating expense burden, and leverage complete the top six, linking predictions to external markets, governance, and financial conditions.
In western China, leverage, return on equity, and return on assets rank third to fifth, followed by operating expense burden. Financing structure and profitability are therefore more prominent secondary predictors in this group. In northeastern China, state ownership, the fixed asset ratio, operating expense burden, and firm age supplement the two leading features. State ownership appears among the top six only in this region, suggesting that differences in the outcome are more closely associated with ownership type and asset structure within this regional sample.
4.3. Robustness Checks
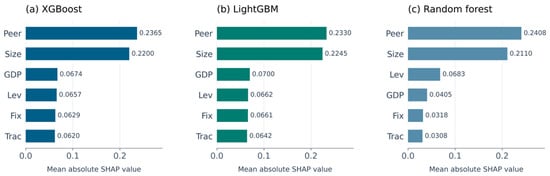
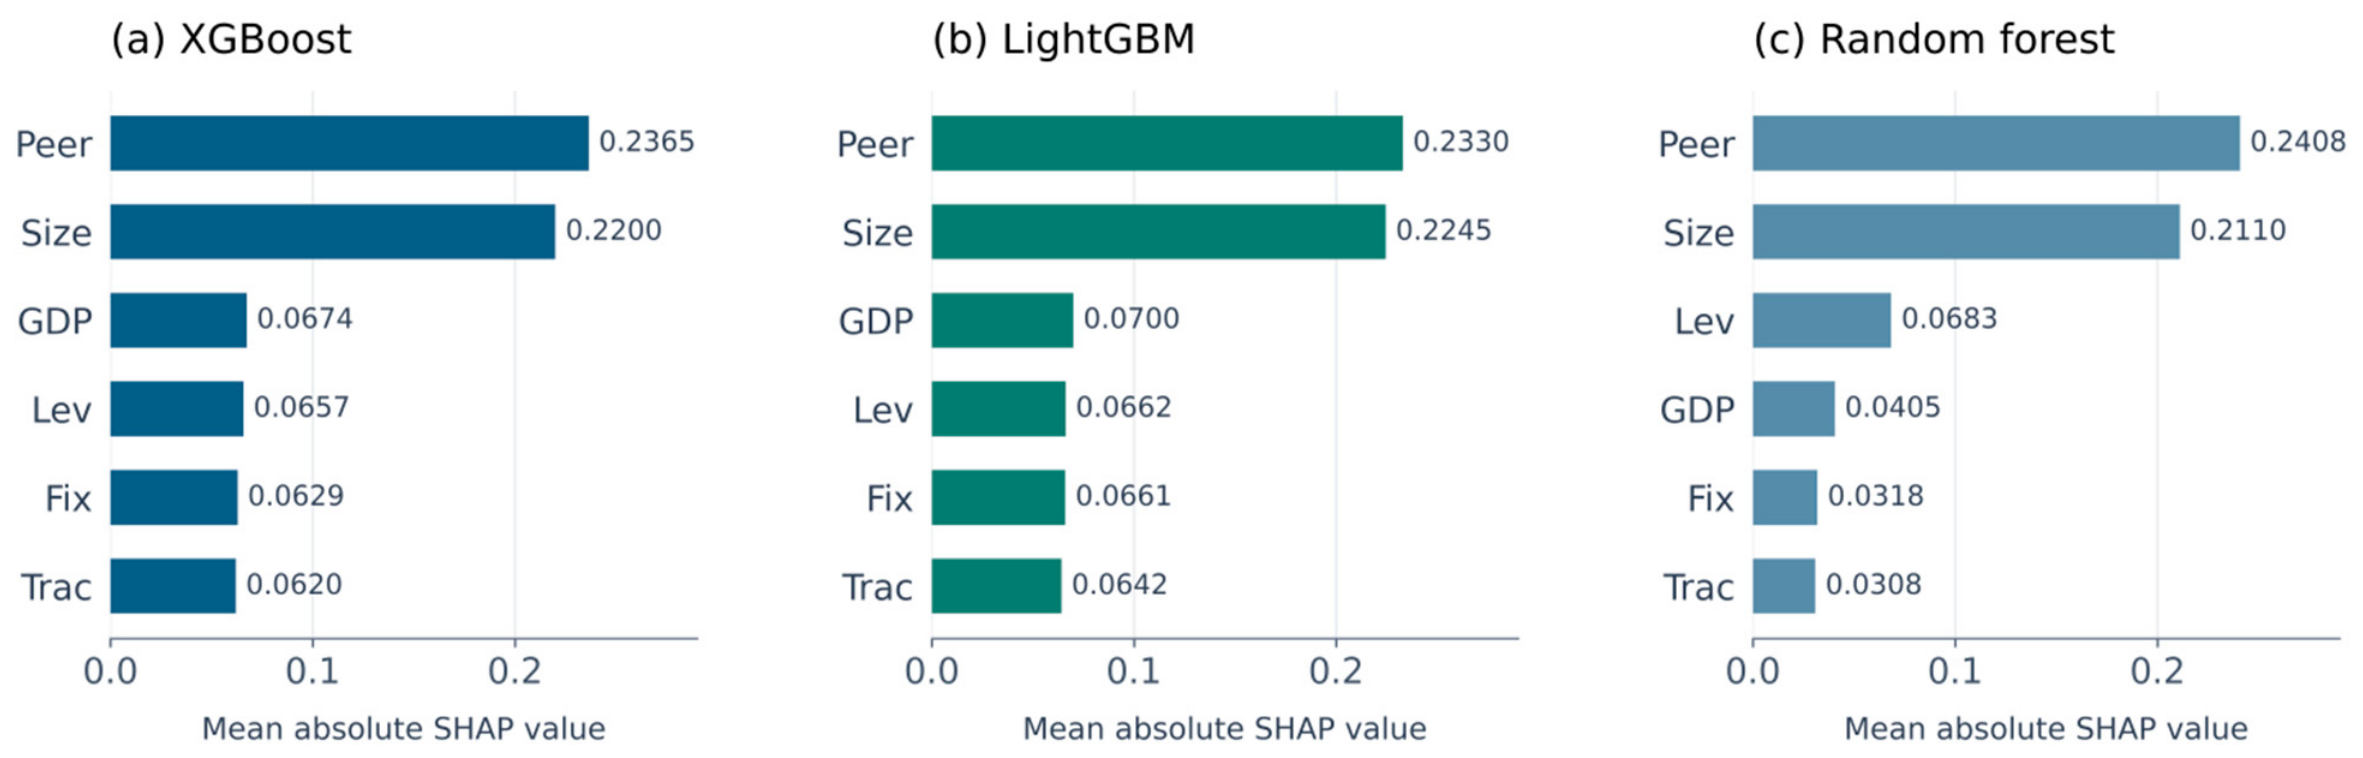
To assess sensitivity to algorithm choice, SHAP values are calculated for XGBoost, LightGBM, and random forests, and mean absolute contributions are aggregated over the same rolling test observations for 2021–2023. Preprocessing rules and hyperparameters are determined from the training data, and attribution uses out-of-sample observations only. Figure 3 presents the six most important features identified by each model.
Figure 3.
Comparison of the top six features by global SHAP importance across XGBoost, LightGBM, and random forests.
The three algorithms identify the same six leading features, with industry peer greenness and firm size consistently occupying the top two positions. Economic development, leverage, the fixed asset ratio, and operating expense burden also remain among the top six. Only the positions of economic development and leverage are reversed in the random forest ranking. Across all 21 features, the rank correlations between XGBoost and LightGBM and between XGBoost and random forests are 0.9922 and 0.9455, respectively, indicating substantial stability across algorithms.
A three-fold expanding-window validation further assesses performance over time. Models are trained on 2018–2020, 2018–2021, and 2018–2022 observations to predict 2021, 2022, and 2023, respectively. Table 5 reports R2 values of 0.3927, 0.4001, and 0.5055, with an arithmetic mean of 0.4328. The model provides out-of-sample predictive information in all three years. Prediction errors decline in 2023, although performance varies across years.
Table 5.
XGBoost performance across three temporal validation folds.
Table 6 compares annual SHAP rankings. Firm size and industry peer greenness occupy the top two positions in all three test windows, while economic development, the fixed asset ratio, and operating expense burden consistently appear among the top six. Leverage ranks third in 2021 and 2022, whereas ownership concentration enters the top six in 2023. These results indicate stability in the leading predictors alongside annual changes in the relative contributions of secondary features.
Table 6.
Top six features by SHAP importance across temporal validation folds.
To assess sensitivity to information timing, all 21 features are replaced with their one-year and two-year lagged values in separate specifications. Observations are matched exactly by firm code and year, retaining the firm-year observations available under all three configurations. Each specification uses 2020 as the starting training year and generates rolling predictions for 2021–2023. Hyperparameters are held constant across configurations within each test fold to reduce differences arising from sample composition and tuning. Each configuration contains 3197 test observations. Because industry peer greenness already uses previous-year information, lagging the full feature set moves its information date further into the past.
On the common sample, R2 is 0.4225, 0.3887, and 0.4115 for contemporaneous, one-year-lagged, and two-year-lagged features, respectively. The modest declines indicate that predictive performance persists under lagged specifications. Industry peer greenness and firm size remain the leading features, with firm size ranking first in both lagged configurations. Economic development, leverage, and the fixed asset ratio remain among the top six in all configurations. The principal predictive information therefore shows some persistence across periods.
5. Nonlinear Associations and Model-Based Interactions in Corporate Supply Chain Green Transformation
5.1. Predictive Contributions and Interaction Patterns of Key Features
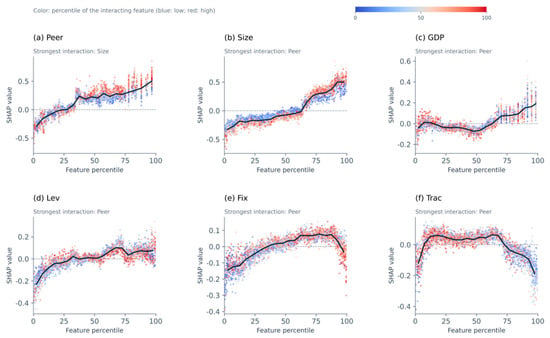
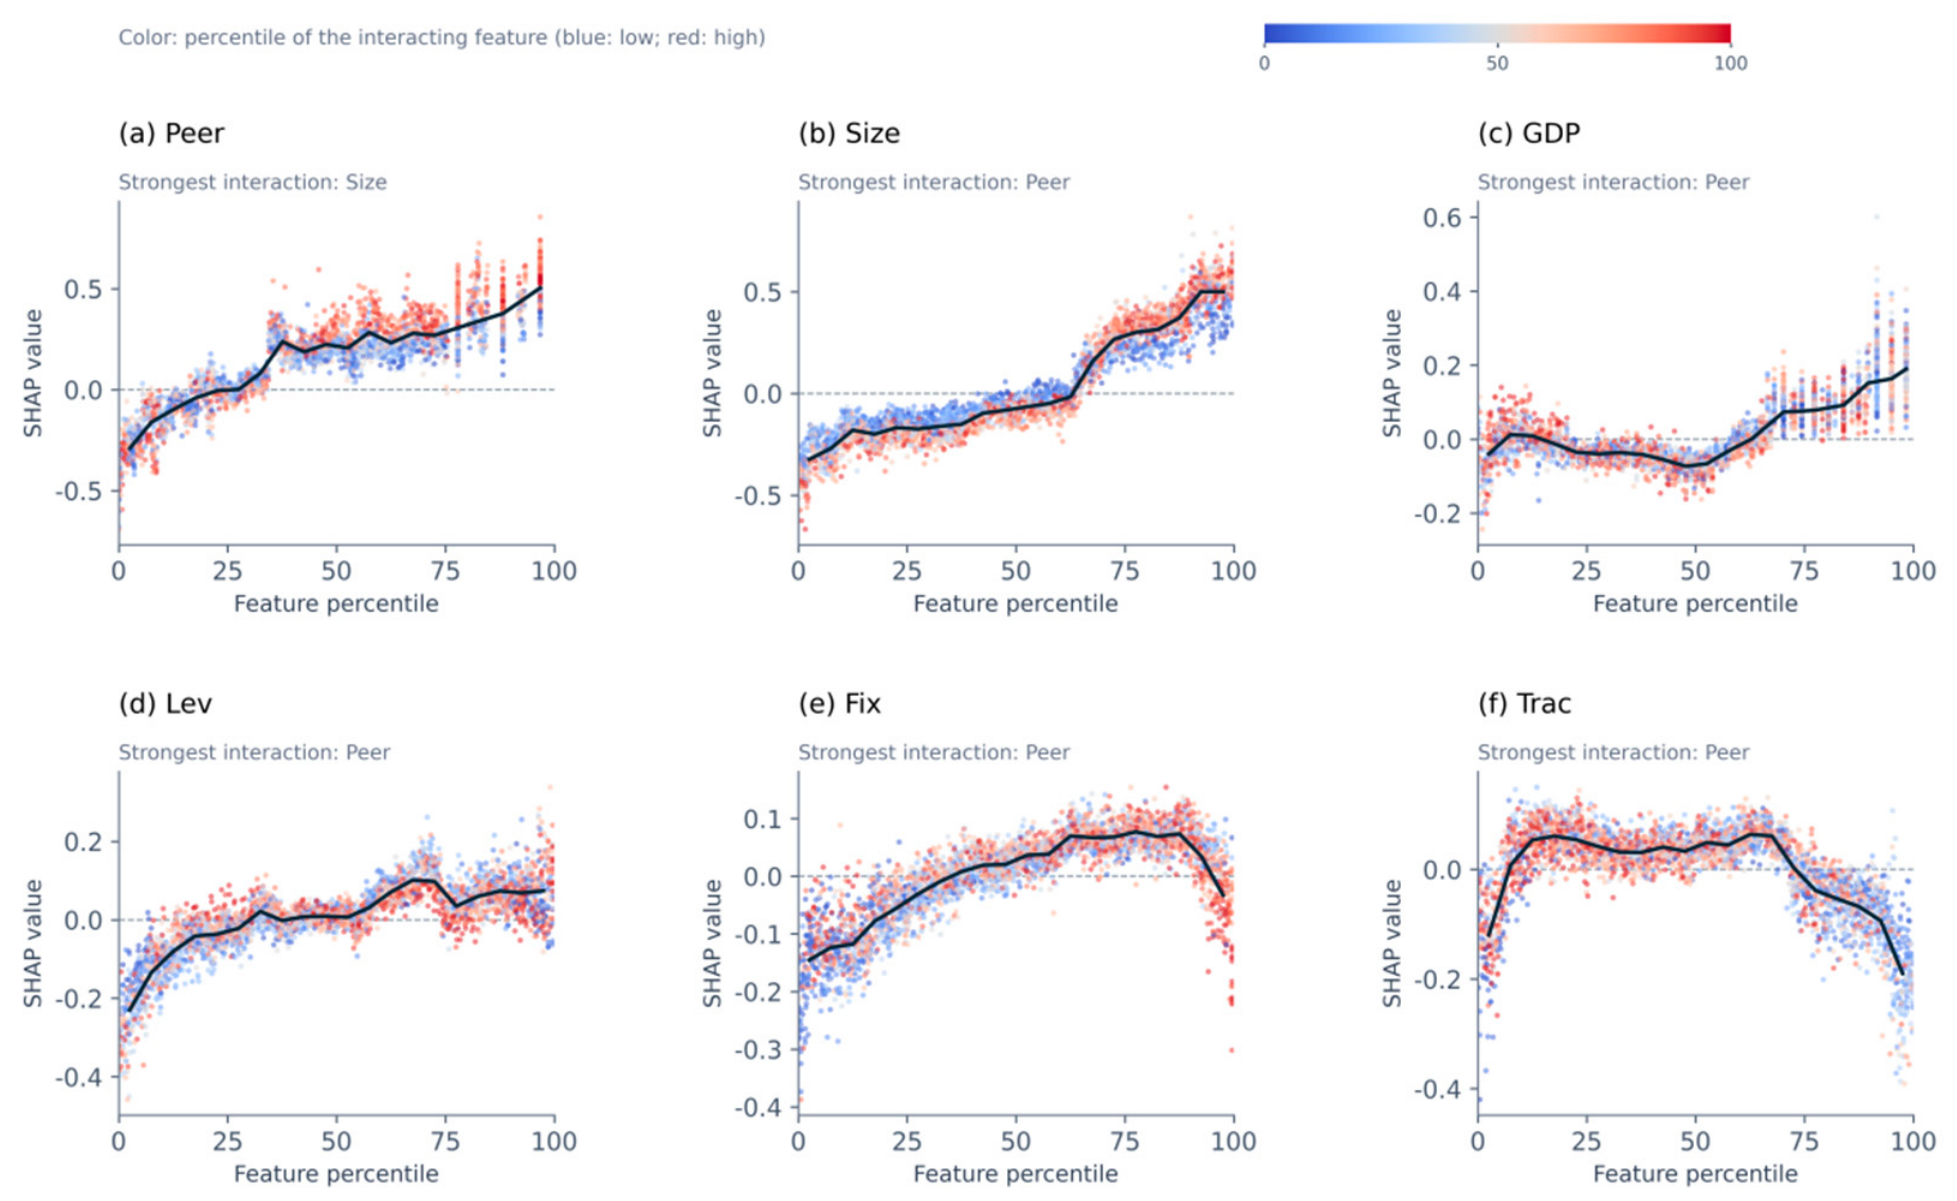
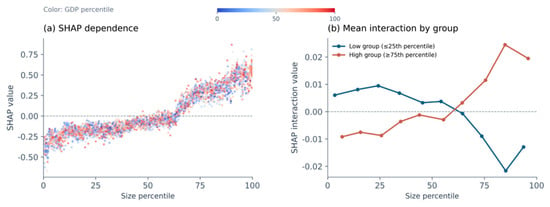
Dependence plots are constructed for the six highest-ranked features by SHAP importance. Quantile-group means summarize nonlinear patterns, and colors identify the strongest interacting feature (Figure 4). The contribution of industry peer greenness generally changes from negative to positive as its value increases. The contribution of firm size rises markedly in the upper range before leveling off (Figure 4a,b). These two variables are each other’s strongest interacting feature. When both firm size and industry peer greenness are high, the mean interaction contribution is 0.0696. When only firm size or only industry peer greenness is high, the corresponding values are −0.0332 and −0.0524, respectively. This pattern indicates complementarity between firm resources and the industry environment within the model.
Figure 4.
SHAP dependence plots for the six most important features.
The contribution of economic development fluctuates around zero or remains negative in the lower and middle ranges, gradually becoming positive in the upper range. The contribution of leverage generally increases but displays fluctuations and a plateau at higher values (Figure 4c,d). These patterns indicate that the predictive relevance of regional development and financing structure varies across feature ranges. The contributions of both the fixed asset ratio and operating expense burden first rise and then decline (Figure 4e,f). The former is higher in the middle-to-upper range but falls noticeably at the highest values. The latter is generally positive in the middle range and becomes negative at higher values. These results suggest that production assets and operating expenditure may provide conditions for transformation, while excessive asset concentration or a heavy expense burden may restrict adjustment capacity.
5.2. Predictive Interactions Between Firm Resources and the External Environment
Economic development and trade openness are examined as interacting features to assess how the external environment is conditionally associated with the contributions of firm size and industry peer greenness.
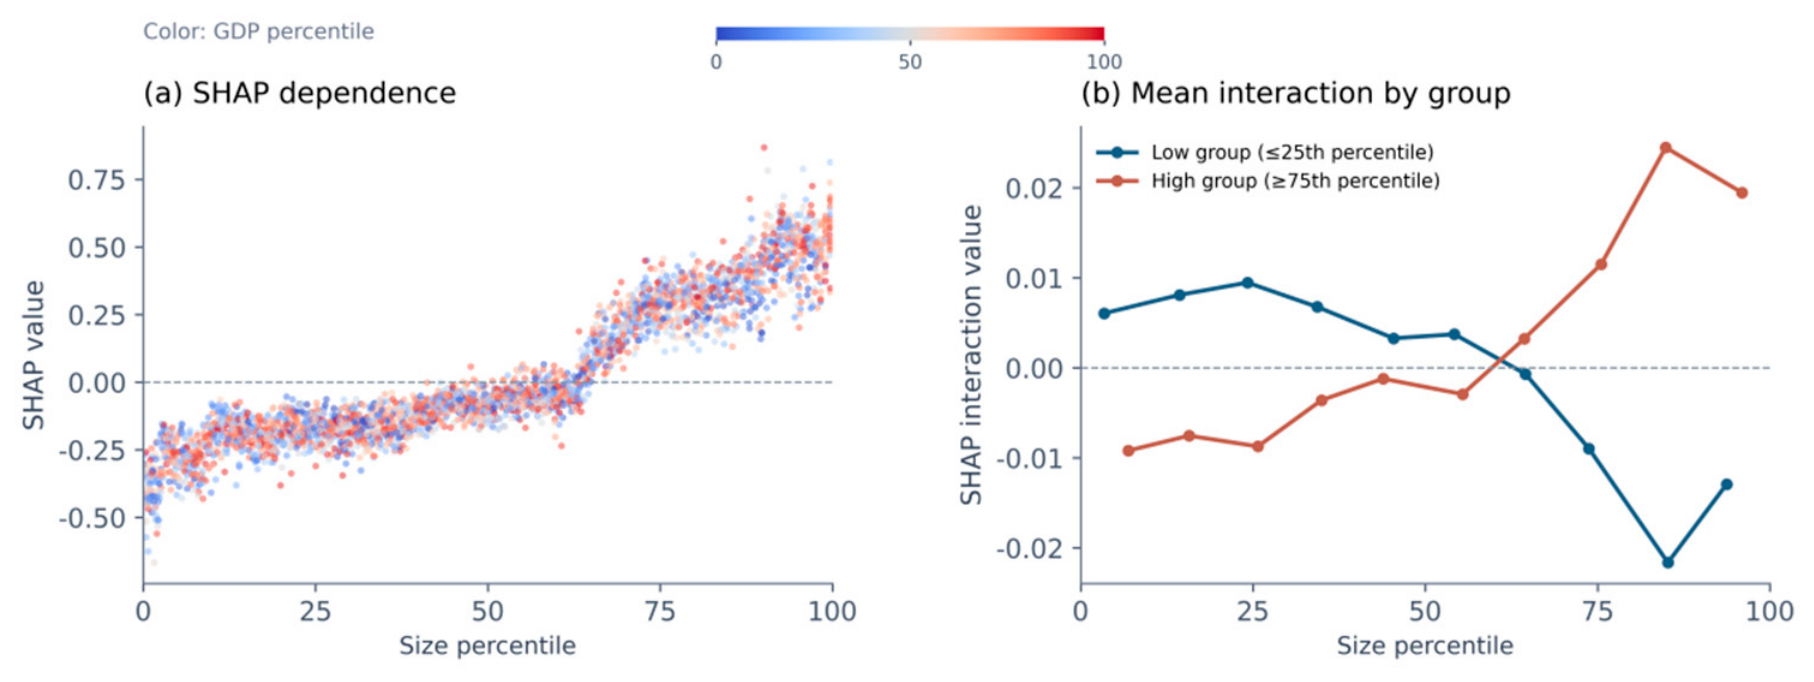
Figure 5 indicates a matching pattern between regional economic conditions and firm resources. Among observations in the upper quartile of firm size, the mean interaction contributions for the high and low economic development groups are 0.0206 and −0.0161, respectively. Among observations in the lower quartile of firm size, the corresponding values are −0.0077 and 0.0074. More favorable regional conditions display a positive interaction with larger firms, whereas smaller firms do not show the same gain. This suggests that firms’ ability to use external resources may depend on their own organizational capabilities. This difference may be related to firms’ ability to make use of external resources. More economically developed regions tend to offer better access to specialized services and information. Larger firms may be better able to use these resources for supplier management and the coordination of environmental information, whereas smaller firms may face staffing and financial constraints.
Figure 5.
Predictive contribution of firm size to supply chain green transformation, with economic development as the interacting feature.
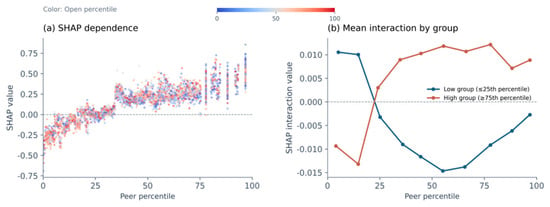
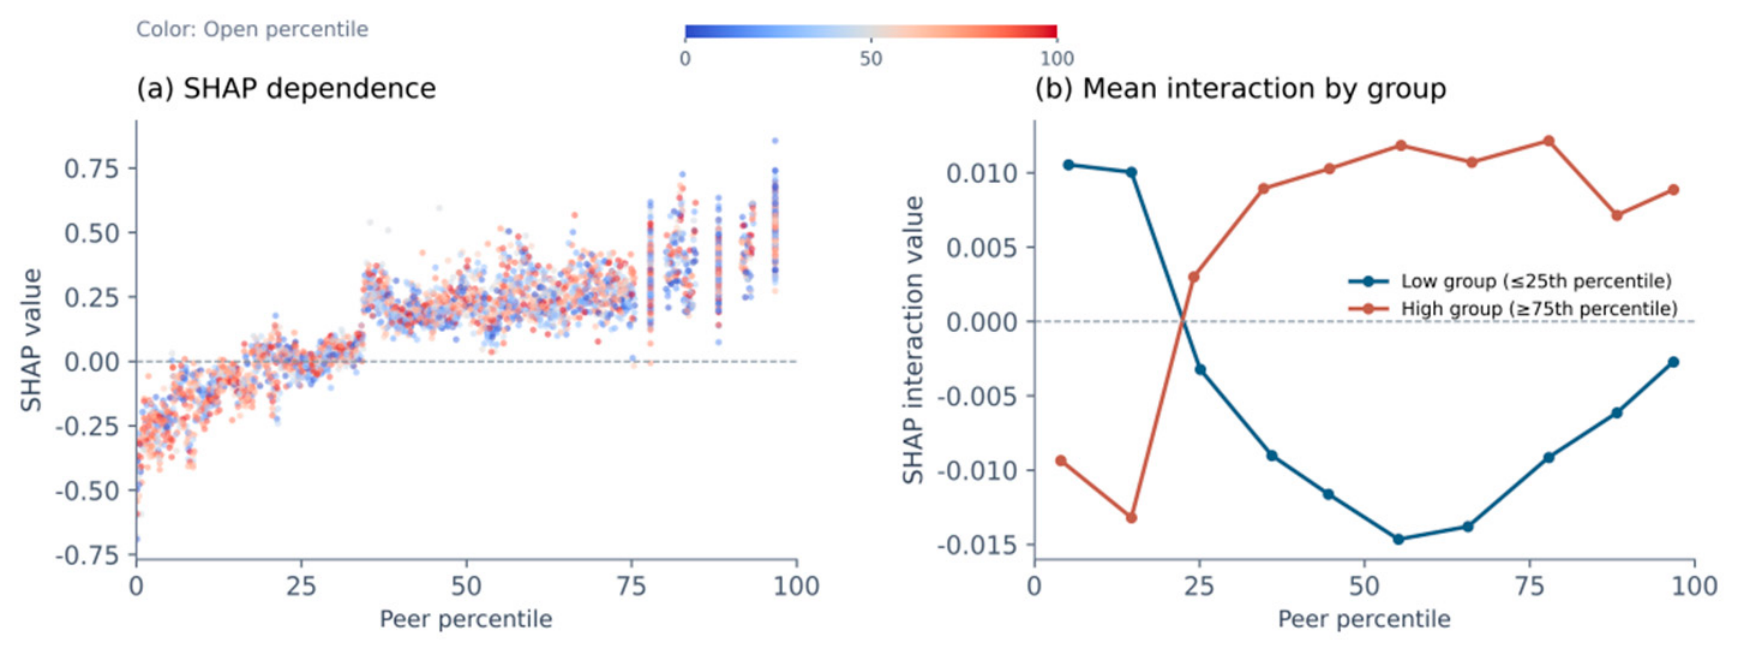
Figure 6 shows that the interaction between trade openness and industry peer greenness varies across feature ranges. Among observations in the upper quartile of industry peer greenness, the mean interaction contributions for the high and low trade openness groups are 0.0080 and −0.0050, respectively. However, the overall SHAP contribution of industry peer greenness is approximately 0.406 in both groups, indicating a limited additional interaction contribution. Overall, the predictive role of the external environment is conditional and needs to be interpreted alongside firm resources and industry conditions. Greater trade openness may expose firms to more requirements concerning customer standards and environmental information, which may be associated with existing green practices and reporting norms within their industries. However, openness may also reflect differences in industry composition.
Figure 6.
Predictive contribution of industry peer greenness to supply chain green transformation, with trade openness as the interacting feature.
6. Conclusions and Implications
Using 6535 firm-year observations for 1119 Chinese listed firms from 2018 to 2023, this study develops a hyperparameter-optimized XGBoost model and applies SHAP to examine key predictors, nonlinear associations, and regional heterogeneity in corporate supply chain green transformation. Under the original feature configuration, industry peer level and firm size are the strongest predictors. Economic development, leverage, fixed asset ratio, and expense burden provide additional information, and the leading features show some stability across models and years. The predictive contribution of firm size increases at higher values and exhibits a model-based interaction with industry peer level. The contributions of fixed asset ratio and expense burden initially rise and then decline, while interactions involving the external environment vary with firm conditions. Regionally, industry peer level and firm size remain important across all groups, but secondary predictors differ: economic development and corporate governance are more prominent in eastern China, trade openness in central China, financing structure and profitability in western China, and ownership type and asset structure in northeastern China. The prediction models do not jointly include firms’ own lagged outcomes and the other features. This comparison therefore evaluates different sources of predictive information and does not establish that the selected features provide incremental predictive value beyond the firms’ own historical persistence.
These findings suggest four priorities. First, strengthen industry collaboration through supplier training, knowledge sharing, consistent procurement standards, and verifiable assessment criteria. Second, tailor support to firms’ resources: public technical services and joint training can assist relatively smaller listed firms within the sample, while firms with greater capacity can support improvements among their supply chain partners. Decisions about assets and expenses should account for cash flow and equipment utilization rather than treating expansion or additional borrowing as universal solutions. Third, align regional services with firms’ needs, including specialized services, assistance with external standards, financing for technological upgrades, and asset renewal. Regional rankings are exploratory, and the small northeastern subsample warrants particular caution. Fourth, strengthen monitoring by checking textual information against green procurement, supplier environmental performance, and emissions records and by conducting regular out-of-sample evaluations. An increase in keyword frequency should not be equated with an improvement in transformation, and policy effects require separate evaluation.
The sample period also covers the COVID-19 pandemic, which may have affected firms’ operations, managerial attention, and annual-report disclosures. The year-specific out-of-sample evaluations do not isolate or rule out pandemic-related effects. Consequently, the current design cannot distinguish changes in green supply chain practices from pandemic-related disclosure adjustments, and differences in predictive performance across years should not be interpreted as pandemic effects.
Author Contributions
Conceptualization, Z.X. and N.Z.; methodology, Z.X. and Z.Z.; software, Z.X.; validation, Z.X. and Z.Z.; formal analysis, Z.X.; data curation, Z.X. and Z.Z.; writing—original draft preparation, Z.X.; writing—review and editing, Z.Z. and N.Z.; visualization, Z.X.; supervision, N.Z. All authors have read and agreed to the published version of the manuscript.
Funding
This research received no external funding.
Institutional Review Board Statement
Not applicable.
Informed Consent Statement
Not applicable.
Data Availability Statement
The data supporting the findings of this study are available from the corresponding author upon reasonable request. Access to and use of data obtained from third-party databases are subject to the applicable licensing agreements.
Acknowledgments
The authors would like to thank the reviewers of the manuscript for their helpful comments.
Conflicts of Interest
The authors declare no conflict of interest.
References
- Zhu, Q.; Sarkis, J. Relationships between operational practices and performance among early adopters of green supply chain management practices in Chinese manufacturing enterprises. J. Oper. Manag. 2004, 22, 265–289. [Google Scholar] [CrossRef] [Scilit]
- Tumpa, T.J.; Ali, S.M.; Rahman, M.H.; Paul, S.K.; Chowdhury, P.; Khan, S.A.R. Barriers to green supply chain management: An emerging economy context. J. Clean. Prod. 2019, 236, 117617. [Google Scholar] [CrossRef] [Scilit]
- Gu, H.; Yang, S.; Xu, Z.; Cheng, C. Supply chain finance, green innovation, and productivity: Evidence from China. Pac.-Basin Financ. J. 2023, 78, 101981. [Google Scholar] [CrossRef] [Scilit]
- Vachon, S.; Klassen, R.D. Environmental management and manufacturing performance: The role of collaboration in the supply chain. Int. J. Prod. Econ. 2008, 111, 299–315. [Google Scholar] [CrossRef] [Scilit]
- Hart, S.L. A natural-resource-based view of the firm. Acad. Manag. Rev. 1995, 20, 986–1014. [Google Scholar] [CrossRef] [Scilit]
- Qu, K.; Liu, Z. Green innovations, supply chain integration and green information system: A model of moderation. J. Clean. Prod. 2022, 339, 130557. [Google Scholar] [CrossRef] [Scilit]
- Lai, Z.; Lou, G.; Ma, H.; Chung, S.H.; Wen, X.; Fan, T. Optimal green supply chain financing strategy: Internal collaborative financing and external investments. Int. J. Prod. Econ. 2022, 253, 108598. [Google Scholar] [CrossRef] [Scilit]
- Büyüközkan, G.; Göçer, F. Digital supply chain: Literature review and a proposed framework for future research. Comput. Ind. 2018, 97, 157–177. [Google Scholar] [CrossRef] [Scilit]
- Lai, K.H.; Feng, Y.; Zhu, Q. Digital transformation for green supply chain innovation in manufacturing operations. Transp. Res. Part E Logist. Transp. Rev. 2023, 175, 103145. [Google Scholar] [CrossRef] [Scilit]
- Guo, S.; Xie, X.; Chen, M.; Gong, Y. Supplier concentration and corporate carbon emissions. Econ. Anal. Policy 2024, 82, 571–585. [Google Scholar] [CrossRef] [Scilit]
- Zhu, Q.; Sarkis, J.; Lai, K.H. Institutional-based antecedents and performance outcomes of internal and external green supply chain management practices. J. Purch. Supply Manag. 2013, 19, 106–117. [Google Scholar] [CrossRef] [Scilit]
- Jo, D.; Kwon, C. Structure of green supply chain management for sustainability of small and medium enterprises. Sustainability 2022, 14, 50. [Google Scholar] [CrossRef] [Scilit]
- Athey, S.; Imbens, G.W. Machine learning methods that economists should know about. Annu. Rev. Econ. 2019, 11, 685–725. [Google Scholar] [CrossRef] [Scilit]
- Li, L.; Shan, S.; Dai, J.; Che, W.; Shou, Y. The impact of green supply chain management on green innovation: A meta-analysis from the inter-organizational learning perspective. Int. J. Prod. Econ. 2022, 250, 108622. [Google Scholar] [CrossRef] [Scilit]
- Wang, M.; Zhang, G. What motivates firms to adopt a green supply chain and how much does it matter? Front. Environ. Sci. 2023, 11, 1227008. [Google Scholar] [CrossRef] [Scilit]
- Wang, C.H.; Juo, W.J. An environmental policy of green intellectual capital: Green innovation strategy for performance sustainability. Bus. Strategy Environ. 2021, 30, 3241–3254. [Google Scholar] [CrossRef] [Scilit]
- Sahoo, S.; Kumar, A.; Upadhyay, A. How do green knowledge management and green technology innovation impact corporate environmental performance? Understanding the role of green knowledge acquisition. Bus. Strategy Environ. 2023, 32, 551–569. [Google Scholar] [CrossRef] [Scilit]
- Khan, M.; Serafeim, G.; Yoon, A. Corporate sustainability: First evidence on materiality. Account. Rev. 2016, 91, 1697–1724. [Google Scholar] [CrossRef] [Scilit]
- Tang, H.; Xiong, L.; Peng, R. The mediating role of investor confidence on ESG performance and firm value: Evidence from Chinese listed firms. Financ. Res. Lett. 2024, 61, 104988. [Google Scholar] [CrossRef] [Scilit]
- Geng, R.; Lin, S.; Dai, J. Examining customer pressure and green supply chain management in emerging market: An institutional logics perspective. Int. J. Prod. Econ. 2024, 278, 109431. [Google Scholar] [CrossRef] [Scilit]
- Khanuja, A.; Jain, R.K. The mediating effect of supply chain flexibility on the relationship between supply chain integration and supply chain performance. J. Enterp. Inf. Manag. 2021, 35, 1548–1569. [Google Scholar] [CrossRef] [Scilit]
- Gunasekaran, A.; Patel, C.; McGaughey, R.E. A framework for supply chain performance measurement. Int. J. Prod. Econ. 2004, 87, 333–347. [Google Scholar] [CrossRef] [Scilit]
- Karmaker, C.L.; Al Aziz, R.; Ahmed, T.; Misbauddin, S.M.; Moktadir, M.A. Impact of industry 4.0 technologies on sustainable supply chain performance: The mediating role of green supply chain management practices and circular economy. J. Clean. Prod. 2023, 419, 138249. [Google Scholar] [CrossRef] [Scilit]
- Cheng, W.; Li, Q.; Wu, Q.; Ye, F.; Jiang, Y. Digital capability and green innovation: The perspective of green supply chain collaboration and top management’s environmental awareness. Heliyon 2024, 10, e32290. [Google Scholar] [CrossRef] [Scilit] [PubMed]
- Ma, J.; Li, Q.; Zhao, Q.; Liou, J.; Li, C. From bytes to green: The impact of supply chain digitization on corporate green innovation. Energy Econ. 2024, 139, 107942. [Google Scholar] [CrossRef] [Scilit]
- Zhu, Y.; Zhang, Z. Supply chain digitalization and corporate ESG performance: Evidence from supply chain innovation and application pilot policy. Financ. Res. Lett. 2024, 67, 105818. [Google Scholar] [CrossRef] [Scilit]
- Kshetri, N. Blockchain systems and ethical sourcing in the mineral and metal industry: A multiple case study. Int. J. Logist. Manag. 2022, 33, 1–27. [Google Scholar] [CrossRef] [Scilit]
- Li, H.; Yu, Y.; Liu, F.; Zhou, B. Multi-path adjustment in digital transformation and enhancement of enterprise competitiveness. J. Innov. Knowl. 2025, 10, 100735. [Google Scholar] [CrossRef] [Scilit]
- Matarazzo, M.; Penco, L.; Profumo, G.; Quaglia, R. Digital transformation and customer value creation in Made in Italy SMEs: A dynamic capabilities perspective. J. Bus. Res. 2021, 123, 642–656. [Google Scholar] [CrossRef] [Scilit]
- Zhang, Y.; Khan, N.U.; Cai, H.H.; Tang, S.; Bousrih, J. Sowing the seeds of sustainability: Digitalization, renewable energy, and carbon emissions in emerging economies’ global value chains. J. Environ. Manag. 2025, 393, 127119. [Google Scholar] [CrossRef] [Scilit] [PubMed]
- Luo, S.; Yimamu, N.; Li, Y.; Wu, H.; Irfan, M.; Hao, Y. Digitalization and sustainable development: How could digital economy development improve green innovation in China? Bus. Strategy Environ. 2023, 32, 1847–1871. [Google Scholar] [CrossRef] [Scilit]
- Wang, J.; Wang, B.; Dong, K.; Dong, X. How does the digital economy improve high-quality energy development? The case of China. Technol. Forecast. Soc. Change 2022, 184, 121960. [Google Scholar] [CrossRef] [Scilit]
- Xu, J.; Yang, B.; Yuan, C. The impact of supply chain digitalization on urban resilience: Do industrial chain resilience, green total factor productivity and innovation matter? Energy Econ. 2025, 145, 108443. [Google Scholar] [CrossRef] [Scilit]
- Luo, Q.; Deng, L.; Zhang, Z.; Wang, H. The impact of digital transformation on green innovation: Novel evidence from firm resilience perspective. Financ. Res. Lett. 2025, 74, 106767. [Google Scholar] [CrossRef] [Scilit]
- Guo, P.; Wang, X.; Jiang, H.; Meng, X. Does digital transformation improve manufacturing ESG performance: Evidence from China. Sustainability 2025, 17, 7278. [Google Scholar] [CrossRef] [Scilit]
- Singh, R.K.; Joshi, H.T. Greening the supply chain: Institutional pressures, data-driven innovations, and the road to circular sustainability. Bus. Strategy Environ. 2024, 33, 6029–6044. [Google Scholar] [CrossRef] [Scilit]
- Agyapong, A.; Aidoo, S.O.; Acquaah, M.; Akomea, S. Environmental orientation and sustainability performance; the mediated moderation effects of green supply chain management practices and institutional pressure. J. Clean. Prod. 2023, 430, 139592. [Google Scholar] [CrossRef] [Scilit]
- Xie, R.-H.; Yuan, Y.-J.; Huang, J.-J. Different types of environmental regulations and heterogeneous influence on “green” productivity: Evidence from China. Ecol. Econ. 2017, 132, 104–112. [Google Scholar] [CrossRef] [Scilit]
- He, H.; Harris, L. The impact of COVID-19 pandemic on corporate social responsibility and marketing philosophy. J. Bus. Res. 2020, 116, 176–182. [Google Scholar] [CrossRef] [Scilit] [PubMed]
- Zhang, S.; Han, W.; Wu, X. The causal impact of data elements on corporate green transformation: Evidence from China. Systems 2025, 13, 515. [Google Scholar] [CrossRef] [Scilit]
- Baron, R.M.; Kenny, D.A. The moderator-mediator variable distinction in social psychological research: Conceptual, strategic, and statistical considerations. J. Pers. Soc. Psychol. 1986, 51, 1173–1182. [Google Scholar] [CrossRef] [Scilit] [PubMed]
- Lundberg, S.M.; Lee, S.I. A unified approach to interpreting model predictions. In Advances in Neural Information Processing Systems 30; Guyon, I., Luxburg, U.V., Bengio, S., Wallach, H., Fergus, R., Vishwanathan, S., Garnett, R., Eds.; Curran Associates: Red Hook, NY, USA, 2017; pp. 4765–4774. [Google Scholar]
- Lundberg, S.M.; Erion, G.; Chen, H.; DeGrave, A.; Prutkin, J.M.; Nair, B.; Katz, R.; Himmelfarb, J.; Bansal, N.; Lee, S.I. From local explanations to global understanding with explainable AI for trees. Nat. Mach. Intell. 2020, 2, 56–67. [Google Scholar] [CrossRef] [Scilit] [PubMed]
- Chen, T.; Guestrin, C. XGBoost: A scalable tree boosting system. In Proceedings of the 22nd ACM SIGKDD International Conference on Knowledge Discovery and Data Mining, San Francisco, CA, USA, 13–17 August 2016; pp. 785–794. [Google Scholar]
- Ke, G.; Meng, Q.; Finley, T.; Wang, T.; Chen, W.; Ma, W.; Ye, Q.; Liu, T.Y. LightGBM: A highly efficient gradient boosting decision tree. In Advances in Neural Information Processing Systems 30; Guyon, I., Luxburg, U.V., Bengio, S., Wallach, H., Fergus, R., Vishwanathan, S., Garnett, R., Eds.; Curran Associates: Red Hook, NY, USA, 2017; pp. 3146–3154. [Google Scholar]
- Breiman, L. Random forests. Mach. Learn. 2001, 45, 5–32. [Google Scholar] [CrossRef] [Scilit]
- Hoerl, A.E.; Kennard, R.W. Ridge regression: Biased estimation for nonorthogonal problems. Technometrics 1970, 12, 55–67. [Google Scholar] [CrossRef] [Scilit]
- Akiba, T.; Sano, S.; Yanase, T.; Ohta, T.; Koyama, M. Optuna: A next-generation hyperparameter optimization framework. In Proceedings of the 25th ACM SIGKDD International Conference on Knowledge Discovery & Data Mining, Anchorage, AK, USA, 4–8 August 2019; pp. 2623–2631. [Google Scholar]
- He, X.; Chen, J.; Yu, Y. Green transformation and labor reallocation: Micro-level evidence from supply chain enterprises. China Ind. Econ. 2025, 10, 117–135. [Google Scholar]

Disclaimer/Publisher’s Note: The statements, opinions and data contained in all publications are solely those of the individual author(s) and contributor(s) and not of MDPI and/or the editor(s). MDPI and/or the editor(s) disclaim responsibility for any injury to people or property resulting from any ideas, methods, instructions or products referred to in the content. |
© 2026 by the authors. Licensee MDPI, Basel, Switzerland. This article is an open access article distributed under the terms and conditions of the Creative Commons Attribution (CC BY) license.