


Abstract
Environmental disclosure can diverge from rated environmental performance, raising questions about the operating implications of this gap and the role of corporate governance. This study examines these relationships using 32,126 firm-year observations from 4580 Chinese A-share listed firms during 2015–2024. The gap is measured as the difference between industry–year standardized environmental disclosure and Huazheng environmental ratings. Firm and year fixed-effects estimates show a negative average association between the gap and subsequent operating revenue per employee, with sensitivity to historical-performance controls, matching, and outcome measurement. The negative association is stronger among firms with CEO duality: a one-standard-deviation increase in the gap is associated with approximately 2.07% lower revenue per employee in the following year among firms combining the CEO and board-chair positions. The interaction remains negative and significant across the principal revenue specifications and receives weak support at the 10% level under strict accounting value added on a common sample. Component analysis shows that, among firms with CEO duality, disclosure is negatively associated with subsequent revenue per employee conditional on ratings, while ratings are positively associated with the outcome conditional on disclosure. These findings extend organizational decoupling research by identifying leadership structure as a governance condition associated with differences in the operating implications of environmental disclosure–rating divergence.
1. Introduction
Environmental reporting connects corporate sustainability commitments with the information available to stakeholders, while implementation depends on firms’ operating practices and governance. Eccles et al. [1] associate stronger sustainability orientations with distinct organizational processes and governance arrangements. Research on greenwashing examines how favorable environmental communication can diverge from underlying conduct [2], and evidence linking symbolic–substantive discrepancies with financial outcomes suggests that this divergence has economic relevance [3]. A related question concerns the operating performance of firms whose disclosure is extensive relative to their rated environmental performance, and whether leadership structure helps explain variation in that relationship.
The present study examines this question through an environmental disclosure–rating gap. The measure compares standardized disclosure with a standardized environmental rating among industry–year peers, capturing relative divergence between two observed information sources. Such divergence can arise from selective communication, extensive reporting of unfavorable outcomes, differences in reporting and rating timing, or uneven implementation of environmental commitments. Greenwashing research provides a theoretical background for examining these discrepancies, while identifying deliberate misrepresentation requires additional evidence about communication content and intent. Corporate disclosures also inform environmental ratings, creating information overlap between the measure’s components. The construction and interpretation of the gap are therefore central to the analysis.
Prior research links greenwashing with innovation [4] and green total factor productivity [5], establishing connections between environmental communication and economic activity. Revenue per employee offers a complementary perspective by relating sales generation to the employment base. It varies with prices, demand, product mix, outsourcing, and the organization of productive work. Research on employees’ responses to perceived greenwashing [6,7], the productivity dimension of corporate social responsibility [8], and environmental management practices [9] provides reasons to examine this relationship. Employee attitudes and organizational implementation offer possible explanations linking environmental credibility to operating outcomes. The disclosure–rating gap captures divergence in firm-level information, while these behavioral explanations concern how employees perceive and respond to corporate conduct.
Leadership structure may condition the operating association of the gap. CEO duality combines executive responsibility with chairmanship of the board that oversees management. Finkelstein and D’Aveni [10] describe the resulting trade-off between unity of command and managerial entrenchment, and Boyd [11] emphasizes the contextual nature of its performance implications. Unified leadership can facilitate coordination between reporting and operations. Where disclosure and rated outcomes diverge, independent scrutiny may become especially important for evaluating managerial explanations and addressing implementation difficulties. Evidence relating CEO power to environmental decoupling [12] motivates examining this governance condition. The question extends from how managerial authority relates to the formation of a gap to how it conditions the gap’s association with subsequent operating performance.
Chinese listed firms provide a setting in which reporting incentives, environmental regulation, and governance arrangements intersect. Marquis and Qian [13] show that government signals and monitoring conditions influence the substantive or symbolic character of CSR reporting in China. Hu et al. [14] associate environmental tax reform with increased greenwashing among heavily polluting firms, illustrating how regulatory responses can involve changes in communication as well as environmental activity. State ownership, controlling shareholders, and pollution exposure can also shape the objectives and information facing corporate boards. These features motivate examining CEO duality alongside ownership and industry comparisons and provide the institutional context for interpreting the findings.
The study addresses two questions: Is a larger environmental disclosure–rating gap associated with lower subsequent revenue per employee, and is this association more negative under CEO duality? The analysis uses 32,126 firm-year observations from 4580 Chinese A-share listed firms during 2015–2024. The gap combines a 24-item environmental disclosure measure with Huazheng environmental ratings. Firm and year fixed-effects models relate revenue per employee to the preceding year’s gap, CEO duality, and firm characteristics. A common-sample comparison with an accounting value-added measure examines sensitivity to outcome construction. Additional analyses assess alternative gap measures, rating benchmarks, historical operating performance, and the interaction specification.
The baseline estimates show a negative average association between the gap and subsequent revenue per employee. A one-standard-deviation increase in the gap corresponds to approximately 0.71% lower revenue per employee in the following year. This association receives support across the principal revenue robustness specifications, with sensitivity to historical-performance controls, matching, and outcome measurement. The interaction with CEO duality is more consistent: among firms combining the CEO and board-chair positions, a one-standard-deviation increase in the gap is associated with approximately 2.07% lower subsequent revenue per employee. The negative interaction persists after historical-performance adjustment, interactions between duality and all controls, and alternative clustering choices. The baseline common-sample value-added interaction provides weak support at the 10% level, with greater sensitivity across alternative specifications.
Component analysis shows that, among firms with CEO duality, disclosure is negatively associated with subsequent revenue per employee conditional on ratings, while ratings are positively associated with the outcome conditional on disclosure. Exploratory mechanism analyses provide weak support for selected individual relationships before adjustment for multiple comparisons, leaving the proposed adverse transmission chain unresolved. The findings place the strongest evidence in the relationship between leadership structure and the revenue association of disclosure–rating divergence.
The principal contribution is to identify CEO duality as a governance condition associated with a steeper negative relationship between disclosure–rating divergence and subsequent revenue per employee. Organizational decoupling research examines how policies, practices, and outcomes become disconnected [15,16], while research on CEO power connects managerial authority with environmental decoupling [12]. The present analysis brings these perspectives to the operating association of an observed gap. The evidence is consistent with monitoring costs becoming relevant when communication and rated outcomes diverge, alongside the potential coordination benefits of unified leadership. This interpretation places the distribution of executive and board authority at the center of the governance explanation.
A further contribution concerns the operating dimension of environmental misalignment. Comparing revenue and value added on the same sample clarifies how the association varies across outcome measures, while the component analysis distinguishes the information contained in disclosure and ratings. The contrast between the average and interaction results places the strongest empirical support in the revenue relationship conditional on leadership structure. These findings connect environmental disclosure–rating divergence with the economic dimension of corporate sustainability and motivate closer board scrutiny of how environmental commitments relate to implementation and operating outcomes.
Section 2 develops the conceptual framework and hypotheses. Section 3 describes the sample, measurement, and empirical models. Section 4 presents the main estimates, robustness checks, analyses addressing endogeneity concerns, flexible interaction diagnostics, and further analyses. Section 5 discusses the findings in relation to governance, measurement, and the Chinese institutional context. Section 6 presents the conclusions, implications, and directions for future research. Appendix A reports the supporting diagnostics and additional estimates.
2. Literature Review and Hypothesis Development
2.1. Environmental Disclosure and Rated Performance
Research on greenwashing examines discrepancies between environmental communication and substantive conduct. Lyon and Montgomery [17] describe several forms of misleading environmental communication, while de Freitas Netto et al. [18] distinguish practices at the firm and product levels. Selective disclosure can create favorable impressions by emphasizing relatively benign activities and giving less visibility to consequential environmental impacts [19]. This literature makes the correspondence between communication and underlying activity central to the credibility of corporate environmental commitments.
Environmental disclosure also serves an informative function. Clarkson et al. [20] associate stronger environmental performance with more extensive discretionary disclosure, and Kim and Lyon [21] distinguish exaggeration from understatement in sustainability communication. Extensive reporting can convey favorable achievements or provide detailed information about environmental problems. Its interpretation consequently depends on the information reported, the conditions facing the firm, and the benchmark used to assess performance.
Peer-relative measures offer one way to examine divergence between communication and performance. Yu et al. [22] compare ESG disclosure with ESG performance, while Dorfleitner and Utz [23] develop a framework that distinguishes apparent from actual green performance. Building on this distinction, the present study examines an environmental disclosure–rating gap: the difference between standardized disclosure and a standardized environmental rating among industry–year peers. Higher values indicate more extensive disclosure relative to rated performance. The construct captures an observable discrepancy relevant to greenwashing research; evidence about deliberate deception depends additionally on the accuracy, selectivity, and purpose of the reported information.
Several circumstances can produce such a gap. Reporting may expand before operational improvements appear in ratings, firms may disclose unfavorable outcomes extensively, or communication and implementation may develop unevenly across organizational units. The environmental rating also incorporates disclosure information, creating a shared information component on the two sides of the measure. The gap therefore combines firms’ reporting and operating circumstances with the rating provider’s assessment process. This interpretation motivates examining alternative rating and timing constructions and considering disclosure and rating components separately.
Organizational decoupling provides a theoretical perspective on the subset of these discrepancies associated with implementation difficulties. Bromley and Powell [15] distinguish the separation of formal policies from practices and the weak connection between activities and their intended outcomes. Graafland and Smid [16] examine alignment among CSR policies, programs, and impacts, while MacLean and Behnam [24] show how formal compliance arrangements can coexist with practices detached from their stated purposes. Applied to environmental management, this perspective directs attention to the organizational work required to connect public commitments with operating decisions. The disclosure–rating gap is an empirical indicator of divergence through which these questions can be examined; the organizational processes behind it remain matters for theoretical interpretation and further evidence.
2.2. Disclosure–Rating Gaps and Revenue per Employee
The proposed relationship concerns the operating conditions that can accompany divergence between environmental disclosure and rated performance. Research connects symbolic environmental behavior with adverse financial outcomes [3], weaker innovation [4], and lower green total factor productivity [5]. Revenue per employee provides a complementary outcome by relating sales generation to the employment base. It captures an economic dimension of labor productivity that includes output prices, demand, product mix, and outsourcing alongside the organization of productive work. The hypothesis focuses on this revenue-based measure; accounting value added per employee provides an alternative outcome for assessing its scope.
Organizational implementation is the central theoretical link. Environmental commitments can require coordination among reporting, investment, production, and personnel decisions. Where formal commitments become detached from operating practices, managerial attention may be directed toward maintaining visible programs while difficulties in implementation remain unresolved [15,16,24]. Such conditions can accompany inefficient coordination or delayed adjustments in productive activity. A higher disclosure–rating gap may identify firms in which communication has advanced further than the capabilities or practices reflected in rated outcomes. The predicted negative association follows from these accompanying organizational conditions.
This argument distinguishes the volume of reporting from the resources devoted to it. Greater disclosure can improve transparency, including transparency about unfavorable performance. The resource-allocation interpretation concerns competing priorities and weak implementation; disclosure volume alone provides limited evidence about reporting costs. Likewise, the environmental-rating component may reflect operational capabilities that are also relevant to revenue generation. Examining the components separately can help assess whether their conditional associations fit the interpretation of divergence or point toward a broader relationship involving reporting intensity and rated capabilities.
Employee responses offer a related behavioral pathway when workers perceive inconsistency between corporate claims and workplace practices. Donia and Tetrault Sirsly [25] explain how employees attribute CSR to substantive or symbolic motives. Robertson et al. [6] link perceived greenwashing to corporate hypocrisy and turnover intentions, and Li et al. [7] relate perceived greenwashing to job performance through organizational cynicism. These studies suggest that perceived inconsistency can weaken the attitudes and behaviors supporting productive work. The firm-level gap and employees’ perceptions represent different constructs, so this pathway depends on whether workers encounter and interpret the underlying discrepancy.
Research on environmental management supports the relevance of implementation to productive activity. Delmas and Pekovic [9] associate environmental standards with higher labor productivity and identify training and interpersonal contacts as relevant mechanisms. Hur et al. [26] connect perceived CSR with employee creativity through compassion and intrinsic motivation, while Hasan et al. [8] examine productivity in the relationship between corporate social and financial performance. These findings provide a basis for expecting operating outcomes to vary with how environmental and social commitments are embedded in organizational practice. Employee behavior and resource allocation are proposed explanations for the association examined here; the exploratory mechanism analyses assess selected observable links.
The directional prediction is that larger gaps accompany organizational conditions associated with lower subsequent revenue generation relative to employment. Firms’ prior operating difficulties can also influence communication choices, making reverse causality relevant to the empirical assessment. The hypothesis is expressed as an association between lagged divergence and the subsequent operating outcome:
H1.
A larger environmental disclosure–rating gap is negatively associated with subsequent operating revenue per employee.
2.3. CEO Duality as a Governance Condition
CEO duality combines executive leadership with chairmanship of the board that oversees management. Agency theory emphasizes the separation of decision-making and decision control [27], while research on boards recognizes both monitoring and advisory functions [28]. These functions are relevant to environmental commitments because directors must assess information supplied by managers, evaluate implementation, and consider competing uses of organizational resources. Leadership structure can therefore condition the operating association of a disclosure–rating gap.
Combining the two positions can also provide coordination benefits. Finkelstein and D’Aveni [10] describe a trade-off between unity of command and managerial entrenchment, and Boyd [11] develops a contingency perspective on duality and performance. Unified leadership can clarify responsibility, reduce disagreements over priorities, and facilitate timely decisions across reporting and operations. Evidence that CEO power can support environmental improvement when combined with relevant expertise further indicates that concentrated authority has context-dependent implications [29]. These benefits provide a competing expectation: duality could help firms address implementation difficulties and weaken the negative association between divergence and operating outcomes.
The monitoring argument becomes more salient when environmental disclosure and rated outcomes diverge. Directors then face a task of evaluating why communication and performance differ and whether managers’ explanations justify existing plans. Under duality, the executive responsible for those plans also occupies a central position in setting the board’s agenda and reviewing their execution. Dependence on managerial information may make it harder to challenge the assumptions behind reporting and resource decisions. Hermalin and Weisbach [30] emphasize independence from executive influence in board monitoring, and Duru et al. [31] identify board independence as relevant to the relationship between duality and performance. In this setting, weaker scrutiny may allow implementation difficulties to persist into subsequent operating periods.
Research on sustainability governance supports examining this monitoring channel as a contextual explanation. Gull et al. [12] associate CEO power with environmental decoupling, and Sauerwald and Su [32] connect CEO overconfidence with CSR decoupling while identifying a role for directors’ expertise and ownership incentives. Aguilera et al. [33] locate environmental sustainability within the relationships among boards, executives, owners, and other actors. These studies suggest that the implications of concentrated authority depend partly on the capacity of surrounding governance arrangements to evaluate and correct misalignment. The present hypothesis concerns how duality conditions the operating association of an observed gap, extending the question beyond how managerial power relates to gap formation.
The Chinese listed-firm setting makes ownership and environmental exposure relevant to this reasoning. Controlling shareholders may provide monitoring, while concentrated ownership can also align board priorities closely with those of a dominant owner. State ownership can introduce policy objectives alongside commercial objectives, and pollution exposure can increase the importance of environmental compliance in operating decisions. These circumstances may alter the information, incentives, and corrective options available to directors. They motivate the ownership and industry comparisons in the empirical analysis. The theoretical expectation concerns scrutiny of implementation within these governance arrangements, with the direction of subgroup differences left to formal comparison.
For firms with larger disclosure–rating gaps, the monitoring argument predicts that the cost of limited independent challenge outweighs the potential coordination benefit of unified leadership in the association with subsequent revenue per employee. This expectation rests on the importance of assessing implementation when communication and rated outcomes diverge. Where executive and board leadership are combined, unresolved organizational difficulties may remain embedded in decisions over operating priorities and resources. The resulting hypothesis is:
H2.
The negative association between the environmental disclosure–rating gap and subsequent operating revenue per employee is stronger among firms with CEO duality.
Figure 1 presents the hypothesized association between the environmental disclosure–rating gap in year t − 1 and operating revenue per employee in year t, with CEO duality in t − 1 as the moderator. The employee and organizational pathways discussed above provide possible theoretical explanations for these relationships.
Figure 1.
Conceptual framework. Notes: H1 predicts a negative association between the environmental disclosure–rating gap in year t − 1 and operating revenue per employee in year t. H2 predicts a more negative association among firms with CEO duality in t − 1. The outcome is measured as the natural logarithm of operating revenue per employee. Arrows represent hypothesized associations. Accounting value added per employee is examined as an alternative outcome.
3. Research Design
3.1. Sample Selection and Data Sources
The study covers Chinese A-share listed firms over the outcome years 2015–2024. A supporting panel spanning 2012–2025 supplies the observations needed to construct annual lags and examine alternative rating dates. After the exclusion of financial firms and firms designated ST or PT, the supporting panel contains 54,786 firm-year observations, of which 41,935 fall within the outcome period. Complete data on the variables required for the main regressions are available for 32,404 observations. Removing 278 singleton observations yields an estimation sample of 32,126 firm-years from 4580 firms. Table A1 compares the 32,404 eligible observations with the 9531 excluded at the complete-case stage. Eligible observations tend to represent larger firms and include a higher proportion of state-owned firms.
Environmental disclosure items come from CSMAR, and the Huazheng environmental pillar score serves as the main rating. Bloomberg and SynTao had more limited coverage of the study sample. Wind was selected for the alternative-provider comparison because its environmental score allowed the Huazheng and Wind specifications to be estimated on the same 21,709 firm-years (Table A3, Panel A). Financial statements, ownership data, and corporate governance variables come from CSMAR. Operating revenue is taken directly from annual consolidated financial statements with report type A and a December 31 reporting date. Monetary amounts are expressed in RMB. Source tables are matched by firm identifier and fiscal year after verification of unique firm-year keys.
Revenue per employee and value added per employee use the annual employee count recorded as Employ in the supporting panel. This count matches the Employ field in the B27 firm-level controls dataset for all 32,126 firm-years in the main estimation sample. An independent check against CSMAR’s Employee Structure table yielded comparable year-end counts for 31,659 firm-years. Of these, 31,526 (99.58%) matched exactly and 133 differed. Comparable CSMAR counts were unavailable for the remaining 467 firm-years. The ZhiXing production-factor dataset supplied a separate employee series for comparison.
Historical industry codes follow the 2012 China Securities Regulatory Commission classification. The same codes define the industry groups used to standardize disclosure and ratings and to estimate industry × year fixed effects. For an outcome observed in year t, the disclosure–rating gap, CEO duality, and control variables are drawn from year t − 1. Lags require an observation in the immediately preceding calendar year.
The accounting comparison requires complete depreciation and amortization components and positive accounting value added. These criteria yield 28,172 eligible firm-years. After singleton removal, the common sample contains 27,755 observations from 4230 firms. The revenue and value-added regressions use these same observations and the same employee counts, so differences between the two estimates reflect the choice of outcome on a fixed sample.
3.2. Variable Measurement
Table 1 summarizes the variables. The primary outcome is operating revenue per employee, and the alternative outcome is a strict accounting value-added proxy per employee. The explanatory measure is termed the environmental disclosure–rating gap, reflecting the divergence between reported environmental information and an external environmental rating.
Table 1.
Variable definitions and measurement.
3.2.1. Revenue and Value Added per Employee
Revenue-based labor productivity, LP, is calculated from operating revenue reported directly in the consolidated income statement and the employee count in the supporting panel:
Positive operating revenue and a positive employee count are required. Revenue per employee captures sales generation relative to employment and incorporates output prices, demand, business composition, and outsourcing alongside labor utilization. The financial-statement numerator is constructed independently of the Size control.
The alternative outcome uses an accounting value-added proxy, VA. Let Cost denote operating cost, Sell selling expense, Admin administrative expense, Finance finance expense, DA depreciation and amortization, and StaffCash cash paid to and on behalf of employees. All components are measured in RMB:
The strict construction requires three observed depreciation and amortization fields: the combined field for fixed-asset depreciation, oil and gas depletion, and productive biological asset depreciation; intangible-asset amortization; and amortization of long-term deferred expenses. An unavailable component makes the strict sum missing. Positive value added and a positive employee count are required for the logarithm. This construction combines accrual-based accounts with employee cash payments and is interpreted as an accounting proxy for value added.
Main-sample log revenue per employee is winsorized at the 1st and 99th percentiles of the 32,404 eligible observations. For the strict common-sample comparison, each log outcome is winsorized separately at the corresponding percentiles of the 28,172 eligible observations before singleton removal. Control-variable transformations are held consistent across these comparisons.
Accounting sensitivity checks use the broader database depreciation aggregate, observed R&D expenses from 2018 onward, and separately observed right-of-use asset depreciation during 2021–2024. The broader aggregate follows the database’s missing-component treatment, whereas the strict construction requires all three components. These alternatives are evaluated within their available-data samples (Table A3, Panel B).
3.2.2. Environmental Disclosure–Rating Gap
The disclosure component contains 24 items from five CSMAR environmental-information categories: environmental liabilities, environmental management, supervision and certification, disclosure channels, and environmental performance and governance disclosure. ISO 9001 [34] is excluded because it concerns quality management. ISO 14001 [35] remains as an environmental-management certification item.Twelve emissions and environmental-performance disclosure items use three-point coding: 0 for no description, 1 for qualitative disclosure, and 2 for quantitative disclosure. Twelve additional items use binary coding for environmental management practices, ISO 14001 [35] certification, and reporting channels. Each item enters the sum with unit weight on its original coding scale, giving a theoretical range of 0–36. A database-coded zero is a valid score, while an unavailable item remains missing. The aggregate requires all 24 items to be observed:
The rating component, EP, is the Huazheng environmental pillar score. Record-level comparison identifies the annual series used in the panel with the October rating period. Huazheng ratings incorporate corporate disclosures alongside other information, creating an overlapping information component between the disclosure measure and the rating.
Disclosure and ratings are standardized separately within the same industry–year groups using paired observations in the supporting panel. Each group must contain at least five observations with both components available and positive variation in each component. Group means and sample standard deviations are calculated from identical paired observations:
where j denotes the firm’s industry. Positive values indicate more extensive disclosure relative to rated performance among industry–year peers; negative values indicate the reverse ordering. The regressions retain the signed gap. The interaction specification uses the uncentered lagged gap, so the coefficient on CEO duality is evaluated at Gap = 0.
The difference combines information and measurement error from both components. Standardization establishes a common comparison scale, while the reliability of the resulting gap depends on the quality of each component and their covariance. Identical gap values can also arise from different combinations of disclosure and ratings. Component regressions therefore examine the two scores separately, and alternative rating comparisons assess sensitivity to the benchmark. The measure captures observable disclosure–rating divergence; evidence about deliberate misrepresentation additionally depends on communication content, accuracy, and intent.
Two alternative continuous measures assess construction sensitivity. Gap_Pos equals max(Gap, 0), preserving positive magnitudes and assigning zero to nonpositive values. Gap_Raw replaces standardized log disclosure with the standardized raw 24-item sum, using the same paired-observation and minimum-group-size rules. For matching, PositiveGap equals one when the lagged gap is positive and zero when it is nonpositive among observations with an observed lagged gap.
Rating sensitivity checks consider timing, methodology period, and provider. The timing comparison pairs disclosure in fiscal year s with either the October rating in year s or the following April rating. Both specifications measure revenue per employee in s + 2 and date CEO duality and controls to s, using a common sample. Additional specifications restrict rating years to 2019 onward or substitute the Wind environmental score on overlapping observations. The historical files have unverified point-in-time snapshot status, which remains relevant to the temporal interpretation. Table A3, Panel A, reports the timing and provider comparisons; Results for the rating-period restriction are reported in Section 4.4 and Table A4, Panel A.
3.2.3. CEO Duality and Control Variables
Dual equals one when the CEO and board chair are the same individual and zero otherwise. The interaction model includes the lagged gap, lagged CEO duality, and their product.
The 12 controls comprise seven financial and operating characteristics—Size, Lev, ROA, Growth, Cashflow, TobinQ, and FirmAge—and five ownership and governance characteristics—SOE, Top1, Board, Indep, and INST. All enter with a one-year lag. Continuous controls retain the 1st- and 99th-percentile winsorization in the prepared panel; binary variables retain their original values.
3.3. Empirical Models
The average association is estimated using firm and year fixed effects:
Y denotes LP in the main analysis and either LP or LP_VA in the strict common-sample comparison. X contains the 12 controls. Firm fixed effects, μi, absorb time-invariant firm characteristics, and year fixed effects, λt, capture common annual shocks. The principal specifications introduce financial controls first and ownership and governance controls subsequently. H1 predicts β1 < 0 in the fully controlled revenue model.
The moderation specification adds CEO duality and its interaction with the gap:
The conditional gap slope equals θ1 for Dual = 0 and (θ1 + θ3) for Dual = 1. H2 predicts θ3 < 0. The interaction coefficient supplies the formal test of the slope difference. The coefficient θ2 represents the conditional governance-group difference at Gap = 0. Standard errors are clustered by firm in the principal specifications. Conditional slopes are calculated as linear combinations from the joint model, with standard errors obtained from the estimated covariance matrix.
Results report the within R2, estimation sample size, and economic significance. For a log outcome, the percentage change associated with a one-standard-deviation increase in the gap is calculated as 100[exp(b × SD(Gap)) − 1], using the gap standard deviation in the relevant estimation sample. Applying this transformation to the interaction coefficient expresses the change in the ratio of the two governance groups’ multiplicative responses. Table A6 reports these magnitudes and their 95% confidence intervals.
Descriptive statistics use the actual estimation samples after singleton removal. Main-sample descriptive statistics are reported in Section 4.1, and Table A2, Panel A, presents the main-sample Pearson correlation matrix. Variance inflation factors are calculated after absorbing firm and year fixed effects from the regressors. The Gap × Dual product is formed before this transformation. Table A2, Panel B, reports VIFs for the average-association and interaction specifications in the main and common samples.
3.4. Robustness, Endogeneity, and Further Analyses
Robustness checks replace Gap with Gap_Pos and Gap_Raw, exclude outcome year 2020, introduce industry × year fixed effects, and restrict rating years to 2019 onward. These procedures apply to the main revenue sample and both strict common-sample outcomes. Additional specifications interact Dual with every control variable and calculate standard errors clustered by lagged industry × outcome year, or jointly by firm and those cells. Results for the main revenue specifications are reported in Section 4.4. Table A4 presents the common-sample comparisons and additional interaction and clustering checks.
Historical-performance checks add the prior outcome level, LPi,t-1, and the prior change, LPi,t-1 − LPi,t-2. Specifications with and without these terms use the same eligible subsample, separating adjustment for operating history from changes in sample coverage. Table A5, Panel A, reports this comparison.
Propensity score matching compares observations with positive and nonpositive lagged gaps. A logit model estimates the propensity score using the 12 lagged controls, year indicators, and lagged industry indicators. One-to-one nearest-neighbor matching uses replacement, a caliper of 0.01, and common support. Matching is pooled across observations, with year and industry included in the score model.
Matched positive-gap observations receive unit weight, and selected controls receive matching-frequency weights. The weighted regression retains distinct firm-year observations and applies these frequencies as analytic weights, with the full controls, firm and year fixed effects, and firm-clustered standard errors. Standardized covariate differences use a common denominator based on unmatched-group variances. Balance diagnostics cover the 12 firm controls. Table A5, Panel B, and Figure A1 report the matched estimate and covariate balance. This analysis estimates a binary positive-versus-nonpositive gap contrast, whereas the principal regressions examine a continuous-gap association. Historical-performance controls and matching address observed differences, while residual time-varying confounding and reverse causality remain relevant to interpretation.
Flexible interaction diagnostics follow Hainmueller, Mummolo, and Xu [36]. With binary Dual and continuous Gap, the diagnostic curve estimates the conditional difference between Dual = 1 and Dual = 0 across the gap distribution. The three-bin specification permits bin-specific intercepts, gap slopes, governance differences, and interaction slopes. A Gaussian local linear estimator absorbs firm and year fixed effects and allows local variation in control coefficients. Evaluation uses 11 points within the intersection of the two governance groups’ 5–95th percentile gap ranges. Bandwidths of 0.5, 0.75, and 1.0 gap standard deviations assess smoothing sensitivity. Confidence intervals are pointwise. Section 4.6 presents the main revenue diagnostics, Table A7 summarizes the specification tests, and Figure A2 and Figure A3 show common-sample diagnostics and bandwidth comparisons.
Component regressions include standardized disclosure, the standardized environmental rating, Dual, and both component × Dual interactions. Conditional slopes are calculated for each governance group. These estimates distinguish the associations of the two components underlying the gap (Section 4.7.1 and Table A8).
Ownership and industry analyses report subgroup estimates alongside pooled triple-interaction tests. The ownership comparison distinguishes state-controlled from non-state-controlled firms. Narrow and broad classifications based on historical industry codes identify polluting sectors. The pooled tests evaluate whether the gap–duality interaction differs across groups. Table A9 reports the estimates and industry classifications.
Exploratory mechanism analyses examine staff cash expenditure and administrative expenditure, each divided by lagged total assets, and absolute deviations from an investment-prediction model. Investment is predicted within industry–year groups containing at least 20 observations using growth opportunities, leverage, cash flow, firm age, asset size, stock returns, and lagged investment. The auxiliary model uses two-digit manufacturing codes and broad categories elsewhere. Absolute residuals measure investment deviation. Proxy values are winsorized at the 1st and 99th percentiles of their available 2015–2024 observations.
For each proxy, Gap, Dual, and controls are dated s, the intermediate variable is dated s + 1, and revenue per employee is dated s + 2. The equations control for the s-year proxy and outcome, use a common complete sample within each proxy analysis, and include firm and year fixed effects with firm-clustered standard errors. Average and interaction specifications assess the association between the gap and the subsequent proxy. Reduced and proxy-augmented outcome equations examine the subsequent revenue associations. Holm-adjusted p-values account for testing the three proxies separately within the average and interaction first-stage families. Table A10 reports the estimates and first-stage adjustments. These proxies capture expenditure and investment patterns, and the analyses assess exploratory links relevant to the proposed organizational explanations.
4. Empirical Results
This section examines the association between the environmental disclosure–rating gap and subsequent operating revenue per employee, with particular attention to CEO duality. The analysis covers sample characteristics, baseline estimates, alternative outcomes, robustness checks, endogeneity concerns, interaction diagnostics, and further analyses. Gap denotes the 24-item measure defined in Section 3. Positive values indicate more extensive disclosure relative to rated environmental performance among industry–year peers.
4.1. Descriptive Statistics, Correlations, and Multicollinearity
Table 2 reports descriptive statistics for the 32,126 observations from 4580 firms used in the main fixed-effects regressions over 2015–2024. Log operating revenue per employee has a mean of 13.9657 and a standard deviation of 0.8314. The gap has a mean of 0.0020 and a standard deviation of 1.1181. CEO duality is present in 30.98% of observations, while state-owned firms account for 31.42%. The dependent variable is measured in year t, and the gap, governance indicators, and controls are measured in t − 1.
Table 2.
Descriptive statistics for the main estimation sample.
The Pearson correlation between the lagged gap and current log revenue per employee is −0.0069, indicating little unconditional linear association. Table A2, Panel A, reports the main-sample correlation matrix. These descriptive correlations provide context for the conditional associations estimated by the fixed-effects models.
Collinearity is assessed after absorbing firm and year fixed effects from the explanatory variables. The Gap × Dual product is constructed before this transformation. The baseline model has a mean VIF of 1.218 and a maximum of 1.551; the interaction model has a mean of 1.239 and a maximum of 1.552. Both regressor matrices have full column rank. The maximum VIF remains below 1.57 in the common sample (Table A2, Panel B), indicating low linear collinearity among the within-transformed regressors.
Of 41,935 candidate observations in the analytical-period dataset, 32,404 satisfy the initial eligibility criteria, and 32,126 remain after singleton removal. Eligible observations represent larger firms and a higher proportion of state-owned firms than excluded observations, alongside differences in profitability and information availability (Table A1). These coverage differences delimit the population represented by the estimates.
4.2. Baseline Association and CEO Duality
Table 3 relates the disclosure–rating gap to operating revenue per employee in the following year. With firm and year fixed effects alone, the estimated gap coefficient is −0.0032 (p = 0.2593). It becomes more negative with the addition of financial controls (−0.0064, p = 0.0135) and changes little when governance controls are added (−0.0064, p = 0.0147). In the fully adjusted model in column (3), a one-standard-deviation increase in the gap (1.1181 units) is associated with approximately 0.71% lower subsequent revenue per employee. This specification supports H1 for the revenue outcome.
Table 3.
Baseline association between the disclosure–rating gap and subsequent revenue per employee.
Of the 4580 firms in the estimation sample, 1491 (32.55%) are observed under both leadership arrangements, as measured by the lagged duality indicator used in column (4). The CEO and chair positions are separate in every observed estimation year for 2078 firms and combined in every observed estimation year for 1011 firms. Firms that change status provide within-firm variation in duality. Firms with a stable leadership structure also contribute to the slope comparison through changes in their disclosure–rating gap over time.
Column (4) shows that the gap slope is more negative when the CEO also chairs the board. The estimated difference between the slopes is −0.0176 (p = 0.0004), supporting H2. For firms with separate positions, the slope is −0.0011 (p = 0.7125). For firms with combined positions, it is −0.0187 (p < 0.0001). A one-standard-deviation increase in the gap thus corresponds to approximately 0.12% lower subsequent revenue per employee under separate leadership and 2.07% lower subsequent revenue per employee under combined leadership. Table A6 reports the corresponding 95% confidence intervals.
Figure 2 illustrates this difference using adjusted predictions from column (4). Over the same range of gap values, predicted revenue per employee changes little for firms with separate positions and declines more steeply for firms with combined positions.
Figure 2.
Adjusted predictions of log revenue per employee by CEO duality. Notes. Predictions are evaluated at the 10th percentile, 25th percentile, sample mean, 75th percentile, and 90th percentile of the uncentered 24-item disclosure–rating gap. Both lines use the same distribution of controls and estimated fixed effects in the main estimation sample. Table 3 reports the conditional slopes and their firm-clustered standard errors.
4.3. Revenue-Based and Value-Added Outcomes
Table 4 compares revenue per employee with the accounting value-added proxy on a strict common sample of 27,755 observations from 4230 firms. The sample requires complete observations for all three depreciation and amortization components, positive value added, and a common employee denominator. The outcome constructions are defined in Section 3.2.1, and accounting sensitivity checks appear in Table A3, Panel B.
Table 4.
Revenue and value added on the strict common sample.
On the common sample, the average revenue coefficient is −0.0059 (p = 0.0275), while the average value-added coefficient is −0.0036 (p = 0.2258). The revenue interaction remains negative and significant (−0.0151, p = 0.0031). The value-added interaction is also negative (−0.0108) and significant at the 10% level (p = 0.0525), providing weak support for the governance difference under this outcome definition.
For value added, the gap slope among duality firms is significant at the 5% level (p = 0.0216), while the difference between governance-group slopes receives support at the 10% level. These tests concern distinct quantities: the first evaluates the within-group slope, and the second evaluates moderation. The common-sample comparison supports a negative average association for revenue and a more weakly estimated governance difference for value added.
4.4. Robustness and Specification Checks
Table 5 examines whether the association between the disclosure–rating gap and subsequent revenue per employee depends on how the gap is measured or which years and fixed effects are included. The positive-gap specification sets nonpositive gaps to zero and retains the full sample. The raw-score specification standardizes the sum of the 24 disclosure items before subtracting the standardized environmental rating. Under both measures, the average gap coefficient is negative and significant at the 10% level, providing weak support for H1. The interaction with CEO duality is negative and significant across all six specifications, including those that exclude outcome year 2020, use industry × year fixed effects, or restrict the sample to rating years from 2019 onward.
Table 5.
Robustness checks for revenue per employee.
The revenue interaction also remains negative and significant when CEO duality is interacted with all controls and when standard errors are clustered by industry × year or by both firm and industry × year (Table A4, Panel B). For strict value added, the interaction receives weak support at the 10% level with all control interactions (p = 0.0672) and with two-way clustering (p = 0.0567). It is statistically insignificant under the positive-gap measure (p = 0.3062) and after excluding outcome year 2020 (p = 0.1302). Table A4, Panel A, reports the corresponding estimates for both outcomes on the common sample.
Table A3, Panel A, compares rating dates and providers. The timing check pairs disclosure in fiscal year s with either the October rating in that year or the following April rating and measures revenue per employee in year s + 2. On the same sample, the interaction is negative under both alignments (p = 0.0047 for October and p = 0.0014 for April), while both average gap coefficients are statistically insignificant.
The provider comparison holds the sample fixed at 21,709 firm-year observations. With the Wind environmental score, the average gap coefficient is negative but statistically insignificant (p = 0.1315). Support for H1 is therefore sensitive to the choice of environmental rating. The estimated interaction with CEO duality is similar across providers: −0.0150 with Huazheng (p = 0.0026) and −0.0148 with Wind (p = 0.0029).
4.5. Historical Performance and Endogeneity Concerns
Historical operating performance may influence both environmental communication and subsequent revenue per employee. The additional specifications therefore control for prior outcome levels and changes to examine whether the estimated associations persist after accounting for firms’ operating histories.
Within the same subsample of 29,551 observations, the average gap coefficient is statistically significant before these controls are included (p = 0.0188) and becomes insignificant after their inclusion (p = 0.3192). The interaction with CEO duality remains negative and significant (p = 0.0007; Table A5, Panel A). The average association is therefore sensitive to historical performance, while the governance-conditioned association persists after this adjustment.
A complementary propensity score matching analysis improves balance on observed covariates and yields a negative, statistically insignificant positive-gap estimate; the matching procedure, balance diagnostics, and regression results appear in Table A5, Panel B, and Figure A1.
Persistent operating deterioration remains a plausible explanation for part of the average negative association. Firms experiencing weaker performance may expand environmental communication to maintain stakeholder confidence. If this response increases the measured gap and operating difficulties continue, the estimated relationship with subsequent revenue per employee can become more negative. Historical-performance controls address observed aspects of this sequence, while time-varying unobserved conditions remain relevant to interpretation. The estimates are interpreted as conditional associations, with more consistent evidence for the interaction with CEO duality than for the average gap association.
4.6. Flexible Interaction Diagnostics
Following the diagnostic framework of Hainmueller, Mummolo, and Xu [36], this analysis examines the linear interaction specification and common support across governance groups. With binary Dual and continuous Gap, Figure 3 plots the conditional difference between Dual = 1 and Dual = 0 across the gap distribution. The slope of this curve in the linear model equals the interaction coefficient.
Figure 3.
Conditional duality differences across the disclosure–rating gap. Notes: The vertical axis shows the conditional Dual = 1 minus Dual = 0 difference in log revenue per employee. The dashed gray line and solid teal line represent the linear and local linear estimates, respectively, with corresponding shaded bands indicating pointwise 95% confidence intervals. Orange points represent the three-bin estimates, with vertical error bars indicating 95% confidence intervals. The lower panel shows observation counts within the displayed range for Dual = 0 (gray) and Dual = 1 (orange). The local estimator uses a Gaussian bandwidth of 0.75 gap standard deviations. Table A7 reports specification tests; Figure A2 and Figure A3 present common-sample diagnostics and bandwidth comparisons.
Figure 3 compares the linear specification with a three-bin model and a local linear estimator. The bin model permits separate intercepts, gap slopes, duality differences, and interaction slopes within equal-frequency bins, evaluated at their medians. The joint test of the full linear restrictions yields p = 0.4786, and the test restricted to the conditional-difference curve yields p = 0.2855 (Table A7). These results indicate limited statistical evidence of departures from linearity over the evaluated range. The high-minus-low-bin contrast is −0.0383 (p = 0.0040), supporting a decline in the conditional duality difference as Gap increases. Interpretation of the specification tests also depends on the precision of the flexible estimates.
The local estimates absorb firm and year fixed effects and allow control coefficients to vary locally through interactions with centered Gap. Evaluation covers 11 points within the intersection of the two groups’ 5–95th percentile gap ranges. The displayed bandwidth is 0.75 gap standard deviations; bandwidths of 0.5 and 1.0 assess smoothing sensitivity. Figure A2 presents the common-sample outcomes, and Figure A3 compares bandwidths. The high-minus-low-bin contrast provides weak support at the 10% level in the common revenue sample (p = 0.0647) and is statistically insignificant for strict value added (p = 0.1252; Table A7).
4.7. Further Analyses
4.7.1. Disclosure and Rating Components
Table 6 reports the conditional slopes of standardized environmental disclosure and the environmental rating. Among firms with CEO duality, the association with subsequent revenue per employee is more pronounced for disclosure. Holding the rating constant, the disclosure coefficient is −0.0259. Holding disclosure constant, the rating coefficient is +0.0131. Both coefficients are statistically significant, and the disclosure estimate is approximately twice as large in absolute value. Among firms with separate CEO and board-chair positions, both estimates are close to zero.
Table 6.
Conditional slopes of disclosure and rating by CEO duality status.
Using disclosure minus rating as a single predictor imposes equal and opposite slopes on the two components. For firms with CEO duality in the main revenue sample, a Wald test evaluates this restriction by testing whether the two conditional slopes sum to zero. Their estimated sum is −0.0128 (firm-clustered SE = 0.0086, 95% CI [−0.0296, 0.0039], p = 0.1336). Thus, the point estimates place greater weight on disclosure, while the confidence interval also includes the equal-and-opposite relationship implied by the gap measure.
For strict value added, the disclosure slope among firms with CEO duality is negative and statistically insignificant (−0.0103, p = 0.1519). The positive rating slope receives weak support at the 10% level (+0.0111, p = 0.0735). Table A8 reports the conditional slopes for all three outcome samples.
4.7.2. Ownership and Industry Comparisons
Table A9 reports subgroup estimates and pooled triple-interaction tests. In the main revenue sample, the gap interaction is significant among non-state-owned firms and statistically insignificant among state-owned firms. The pooled ownership difference is statistically insignificant (p = 0.9751). The narrow and broad pollution classifications also yield insignificant group differences (p = 0.9401 and p = 0.5482). The formal comparisons provide limited evidence of systematic ownership or industry heterogeneity. Differences in subgroup-specific significance reflect both estimated coefficients and their precision; the pooled tests evaluate the cross-group differences directly. The ownership classification distinguishes state from non-state control. Table A9 also documents the historical industry codes used for the pollution classifications.
4.7.3. Exploratory Mechanism Analyses
The exploratory analyses consider staff cash expenditure relative to lagged assets, administrative expenditure relative to lagged assets, and absolute deviations from an industry–year investment-prediction model. Explanatory variables and baseline outcomes are dated s, the intermediate variable s + 1, and revenue per employee s + 2. Each proxy analysis uses a common complete sample and controls for its s-year proxy and outcome. The respective samples contain 26,930, 27,130, and 24,557 observations. Table A10 reports the estimates and first-stage multiplicity adjustments.
The associations between the gap and subsequent staff cash expenditure are statistically insignificant. The administrative-expenditure interaction has an unadjusted p-value of 0.0970, and the average gap association with investment deviation has p = 0.0709. These estimates provide weak support for individual first-stage relationships at the 10% level. Their Holm-adjusted p-values are 0.2909 and 0.2127, respectively. Administrative expenditure and investment deviation are positively associated with subsequent revenue per employee. These downstream estimates differ from the negative relationships anticipated by an adverse resource-allocation pathway. The analyses therefore identify selected unadjusted first-stage associations while leaving the complete adverse transmission chain unresolved. The proxies capture financial and investment patterns, and the dynamic fixed-effects estimates are interpreted as exploratory associations.
Across the principal revenue specifications, CEO duality is associated with a more negative gap–revenue relationship. The average association and value-added estimates are more sensitive to measurement and specification. The mechanism results point to individual resource-related associations whose interpretation requires more direct evidence about employee behavior and organizational implementation. Section 5 develops the theoretical and practical implications of these findings.
5. Discussion
The relationship between environmental disclosure–rating gaps and subsequent revenue per employee is more pronounced when the CEO also chairs the board. The distinction between the average association and this difference across leadership structures matters for interpreting the findings. The average association depends on the outcome measure, the rating provider, and the treatment of prior operating performance. The difference across leadership structures is more consistent across the revenue specifications.
5.1. Interpreting the Revenue and Value-Added Results
The fully adjusted baseline model links a larger disclosure–rating gap to lower revenue per employee in the following year. This finding extends research on environmental communication and financial performance [3], innovation [4], and green total factor productivity [5] to the revenue firms generate relative to employment. Revenue per employee reflects selling prices, demand, product mix, and outsourcing as well as labor utilization. Two firms with similar output per worker can therefore record different revenue per employee. The common-sample comparison illustrates the importance of this distinction. For the same firm-years, the average gap coefficient is negative and significant for revenue but statistically insignificant for strict accounting value added (Table 4). Purchased inputs, operating margins, and the timing of expense recognition affect the two measures differently.
Support for H1 is also sensitive to the choice of rating provider. With the Wind environmental score, the average revenue coefficient is statistically insignificant (p = 0.1315), although the interaction with CEO duality remains negative and significant (Table A3, Panel A). Operating history offers a further explanation for the sensitivity of the average estimate. A firm facing declining sales may expand environmental communication to maintain stakeholder confidence. If operating difficulties persist, more extensive disclosure can precede another year of weak revenue, making the estimated association more negative. The average coefficient shrinks after adjustment for prior revenue levels and changes. The matched comparison likewise yields a statistically insignificant estimate (Table A5). H1 thus receives support in the baseline revenue specification, with weaker evidence across alternative measures and comparisons.
5.2. CEO Duality and the Governance of Environmental Misalignment
Among firms combining the CEO and board-chair positions, a one-standard-deviation increase in the gap is associated with approximately 2.07% lower revenue per employee in the following year. Among firms with separate positions, the corresponding estimate is −0.12% and statistically insignificant. The interaction test supports a difference between the two slopes (Table 3 and Table A6). The strict value-added interaction provides weak support at the 10% level in the baseline common sample (p = 0.0525) and varies across specifications (Table A4). H2 therefore has its clearest empirical support for revenue per employee.
The trade-off between coordination and independent oversight helps explain why leadership structure may matter in this setting [10,11]. A CEO who also chairs the board can coordinate reporting and operating decisions when an environmental project requires cooperation across departments. A persistent gap, however, poses a different task for the board. Directors must assess whether a reported initiative is progressing, whether a low rating reflects a delay in implementation, and whether management’s explanation warrants a change in operating plans. Under duality, the executive responsible for those plans also chairs the body reviewing their progress. This arrangement may make it harder for directors to challenge an explanation or press for corrective action. The steeper revenue slope under duality is consistent with that interpretation. The regressions identify the difference in slopes, while the board’s actual review process remains a question for direct investigation.
Prior research links CEO power to environmental decoupling [12] and distinguishes formal commitments from organizational practices and outcomes [15,16]. The contribution here concerns what follows an observed discrepancy. A gap of a given size has a different association with subsequent revenue depending on how executive and board authority are distributed. This finding connects the governance of environmental commitments with their operating implications.
5.3. Disclosure Components and the Interpretation of Mechanisms
The component estimates place greater weight on disclosure. Among firms with CEO duality, the disclosure slope conditional on the rating is −0.0259, approximately twice the absolute size of the rating slope conditional on disclosure (+0.0131). The Wald test of equal and opposite slopes yields p = 0.1336 (Table 6 and Table A8). The larger disclosure estimate is therefore a feature of the point estimates, while equal and opposite slopes remain compatible with the data.
The negative disclosure slope admits several interpretations. At a given rating, a firm may report more extensively because it faces environmental difficulties, because it has begun an investment whose benefits have yet to appear in the rating, or because operating pressure has increased the incentive to communicate. These circumstances have different implications for reporting credibility. A firm that describes an unfavorable outcome candidly can have the same measured gap as one that selectively emphasizes its commitments. This distinction places the findings within the greenwashing literature while reserving judgments about intent for evidence on the content and accuracy of particular claims [17,18,23].
Organizational decoupling theory suggests that commitments can place demands on managerial attention and coordination before changes in operating practices become visible [15,16,24]. The exploratory tests offer limited evidence about this process. Selected associations involving administrative expenditure and investment deviation receive weak support at the 10% level before adjustment for multiple comparisons. Neither remains significant after the Holm adjustment, and both proxies are positively associated with subsequent revenue per employee (Table A10). These results leave the proposed adverse mechanism unresolved. Prior studies link perceived greenwashing to employee attitudes and behavior [6,7,25]. Testing that explanation here would require evidence on what employees observed and how they responded, such as personnel records or employee surveys.
5.4. Environmental Ratings and the Chinese Institutional Context
Environmental ratings partly draw on firms’ own disclosures. A change in reporting can therefore affect both sides of the measured gap. Regulation and corporate investment can also change the underlying environmental outcomes on a different timetable. In China, research on CSR reporting and environmental tax reform shows how institutional pressures shape firms’ communication choices [13,14]. Wei, Zhu, and Liu [37] distinguish strategic and substantive innovation responses to market-based environmental regulation and examine how these responses vary with CSR. Lin et al. [38] link digital technology adoption to carbon performance through firms’ capabilities. These studies help explain how a company’s disclosure, operating practices, and environmental rating can adjust at different speeds.
Ownership and industry exposure can shape the decisions facing boards. State ownership can bring policy objectives into operating decisions, controlling shareholders can influence board priorities, and firms in polluting industries face different compliance demands. In the main revenue sample, formal comparisons yield statistically insignificant differences in the CEO duality interaction between state-owned and non-state-owned firms and between polluting and other industries (Table A9). The evidence for a difference by leadership structure is consequently clearer than the evidence for further differences by ownership or pollution exposure. Its most direct application is to Chinese listed firms with comparable reporting, rating, and financial coverage (Table A1).
6. Conclusions
6.1. Main Findings
Across 32,126 firm-year observations from 4580 Chinese A-share listed firms during 2015–2024, the association between environmental disclosure–rating gaps and subsequent revenue per employee is more negative when the CEO also chairs the board. Among firms with combined leadership, a one-standard-deviation increase in the gap is associated with approximately 2.07% lower revenue per employee in the following year. The corresponding estimate for firms with separate positions is −0.12% and statistically insignificant. The difference between these slopes is statistically significant and persists across the principal revenue specifications. The interaction also receives weak support at the 10% level for strict accounting value added on the common sample. H2 thus receives its strongest support for revenue per employee.
Support for H1 is more fragile. The average association is negative in the fully adjusted baseline revenue model but statistically insignificant with the Wind environmental rating, after adjustment for prior operating performance, and under the strict value-added measure. The matched comparison likewise yields a statistically insignificant estimate. Among firms with CEO duality, the negative disclosure coefficient is larger in absolute value than the positive rating coefficient. The component estimates nevertheless remain compatible with equal and opposite slopes.
6.2. Theoretical Contributions
Research on organizational decoupling examines how corporate commitments can diverge from practices and outcomes. This study extends that question to the operating performance that follows an observed divergence and identifies leadership structure as a condition under which the association varies. The distinction matters for governance theory. Combining the CEO and chair positions can facilitate coordination across business units, while also giving the executive responsible for environmental plans a central role in the board’s review of their progress. The steeper revenue slope under duality is consistent with independent scrutiny becoming particularly important when disclosure and ratings diverge. How directors exercise that scrutiny remains an open empirical question.
6.3. Practical Implications
Where the CEO also chairs the board, independent directors could request a review of persistent disclosure–rating gaps. For a reported environmental initiative, the review could compare the announced commitment with the resources assigned, the implementation milestone reached, and the environmental outcome recorded. Managers could support that review by identifying the person responsible for each commitment and documenting changes in its scope or timetable.
Investors can use a persistent gap as a reason to examine the underlying claims and the dates on which progress became observable. Rating providers could make such comparisons easier by documenting indicator definitions, methodology revisions, and historical rating dates. Regulators could improve comparability by requiring firms to identify the reporting period and organizational boundary covered by each environmental claim. The effectiveness of these practices in improving oversight or operating performance warrants direct evaluation.
6.4. Limitations and Future Research
The panel estimates describe conditional associations. Firms facing declining revenue may expand environmental communication while operating difficulties persist, making the estimated gap–revenue association more negative. A disclosure policy change that generates plausibly external variation could help distinguish this sequence from the consequences of a reporting change. Physical output and hours worked would also help separate labor efficiency from prices, demand, and outsourcing in the revenue measure.
Environmental ratings draw partly on corporate disclosures, so the two components of the gap share information. Independent environmental indicators and verified historical rating records would clarify what each component captures. Establishing deliberate misrepresentation would additionally require evidence about the accuracy and selectivity of individual claims. The exploratory expenditure and investment results leave the proposed organizational mechanisms unresolved. Personnel records, employee surveys, and records of board deliberations could distinguish employee responses from changes in resource allocation or oversight.
The findings apply most directly to Chinese listed firms with sufficient environmental and financial records. The estimation sample contains larger firms and a higher proportion of state-owned firms than the excluded observations. Comparisons with unlisted firms and with firms operating under different board and disclosure arrangements would help establish how far the observed governance relationship extends.
Author Contributions
Conceptualization, J.D. and Y.H.; methodology, J.D.; software, J.D.; formal analysis, J.D.; investigation, J.D.; data curation, J.D.; writing—original draft preparation, J.D.; writing—review and editing, J.D. and Y.H.; supervision, Y.H. All authors have read and agreed to the published version of the manuscript.
Funding
This research received no external funding.
Institutional Review Board Statement
Not applicable.
Informed Consent Statement
Not applicable.
Data Availability Statement
The data used in this study were obtained from CSMAR, CNRDS, Huazheng ESG, Wind, and the supplementary production-factor dataset distributed by ZhiXing Data Analysis. Access to these third-party datasets is governed by the respective providers’ licensing terms. Researchers may obtain the source data from the relevant providers, subject to their access requirements. The analysis code and documentation of variable construction and sample selection are available from the corresponding author upon reasonable request.
Conflicts of Interest
The authors declare no conflicts of interest.
Abbreviations
The following abbreviations are used in this manuscript:
| Abbreviation | Full Term |
| CEO | Chief Executive Officer |
| CNRDS | China Research Data Services Platform |
| CSMAR | China Stock Market & Accounting Research Database |
| CSRC | China Securities Regulatory Commission |
| CSR | Corporate Social Responsibility |
| ESG | Environmental, Social, and Governance |
| FE | Fixed Effects |
| LP | Natural Logarithm of Operating Revenue per Employee |
| LP_VA | Natural Logarithm of Accounting Value Added per Employee |
| PSM | Propensity Score Matching |
| ROA | Return on Assets |
| SOE | State-Owned Enterprise |
| ST | Special Treatment |
| PT | Particular Transfer |
| VA | Accounting Value Added |
| VIF | Variance Inflation Factor |
Appendix A
This appendix reports sample diagnostics, measurement sensitivity, additional specification checks, and exploratory analyses supporting Section 4. Revenue and value-added outcomes retain their respective estimation samples. Tables report coefficients with standard errors in parentheses and exact p-values. Values between 0.05 and 0.10 indicate significance at the 10% level.
Table A1.
Sample construction and selection.
Table A2.
Correlations and multicollinearity.
The timing comparison pairs fiscal-year disclosure with either the October rating or the following April rating and evaluates the outcome in year s + 2 on a common sample. The Wind comparison uses a separate common sample. Shared disclosure inputs and unverified historical snapshot dates qualify the interpretation of these rating comparisons.
Table A3.
Measurement and rating sensitivity.
Strict value added requires all three depreciation and amortization components to be observed. The broader D&A construction, R&D adjustment, and right-of-use depreciation adjustment are evaluated in their own available-data samples. The employee denominator is identical within each revenue/value-added comparison. Value added is an accounting proxy combining accrual-based accounts and cash paid to employees.
Main revenue results appear in Table 5 of the main text. Positive gap equals max(Gap, 0) and retains the full eligible sample. The raw-score measure standardizes the 24-item sum before subtracting the standardized rating. The post-2019 restriction uses rating years from 2019 and outcome years 2020–2024. Firm fixed effects and full controls enter all models; industry × year fixed effects replace year fixed effects in that specification. Standard errors are clustered by firm.
Table A4.
Additional robustness and inference checks.
Within the same subsample, adding historical performance controls reduces the magnitude of the average gap coefficient from −0.0066 to −0.0020 and increases its p-value from 0.0188 to 0.3192. The interaction with CEO duality remains negative and statistically significant after adjustment (−0.0139; p = 0.0007). The average association is therefore sensitive to operating history, while the governance-conditioned association persists in this comparison.
Table A5.
Historical performance controls and propensity score matching.
Matching retains 16,837 positive-gap observations and 8947 distinct controls from the 32,404 eligible observations. Matching with replacement permits a control observation to be selected multiple times, yielding 25,784 distinct observations with positive matching weights. After removing 425 singletons, the weighted fixed-effects regression includes 25,359 observations.
Mean absolute standardized covariate bias falls from 5.81% to 0.65%, indicating improved balance on observed characteristics. Figure A1 presents the individual covariate balance diagnostics. The weighted positive-gap coefficient is negative and statistically insignificant (−0.00976; SE = 0.00638; p = 0.1265).
The matched estimate concerns a binary positive-versus-nonpositive gap contrast, whereas the main regressions estimate a continuous-gap relationship. The matching analysis improves observed comparability and yields an imprecise negative association. Persistent operating deterioration and unobserved differences remain relevant to interpretation.
Figure A1.
Covariate balance before and after matching.
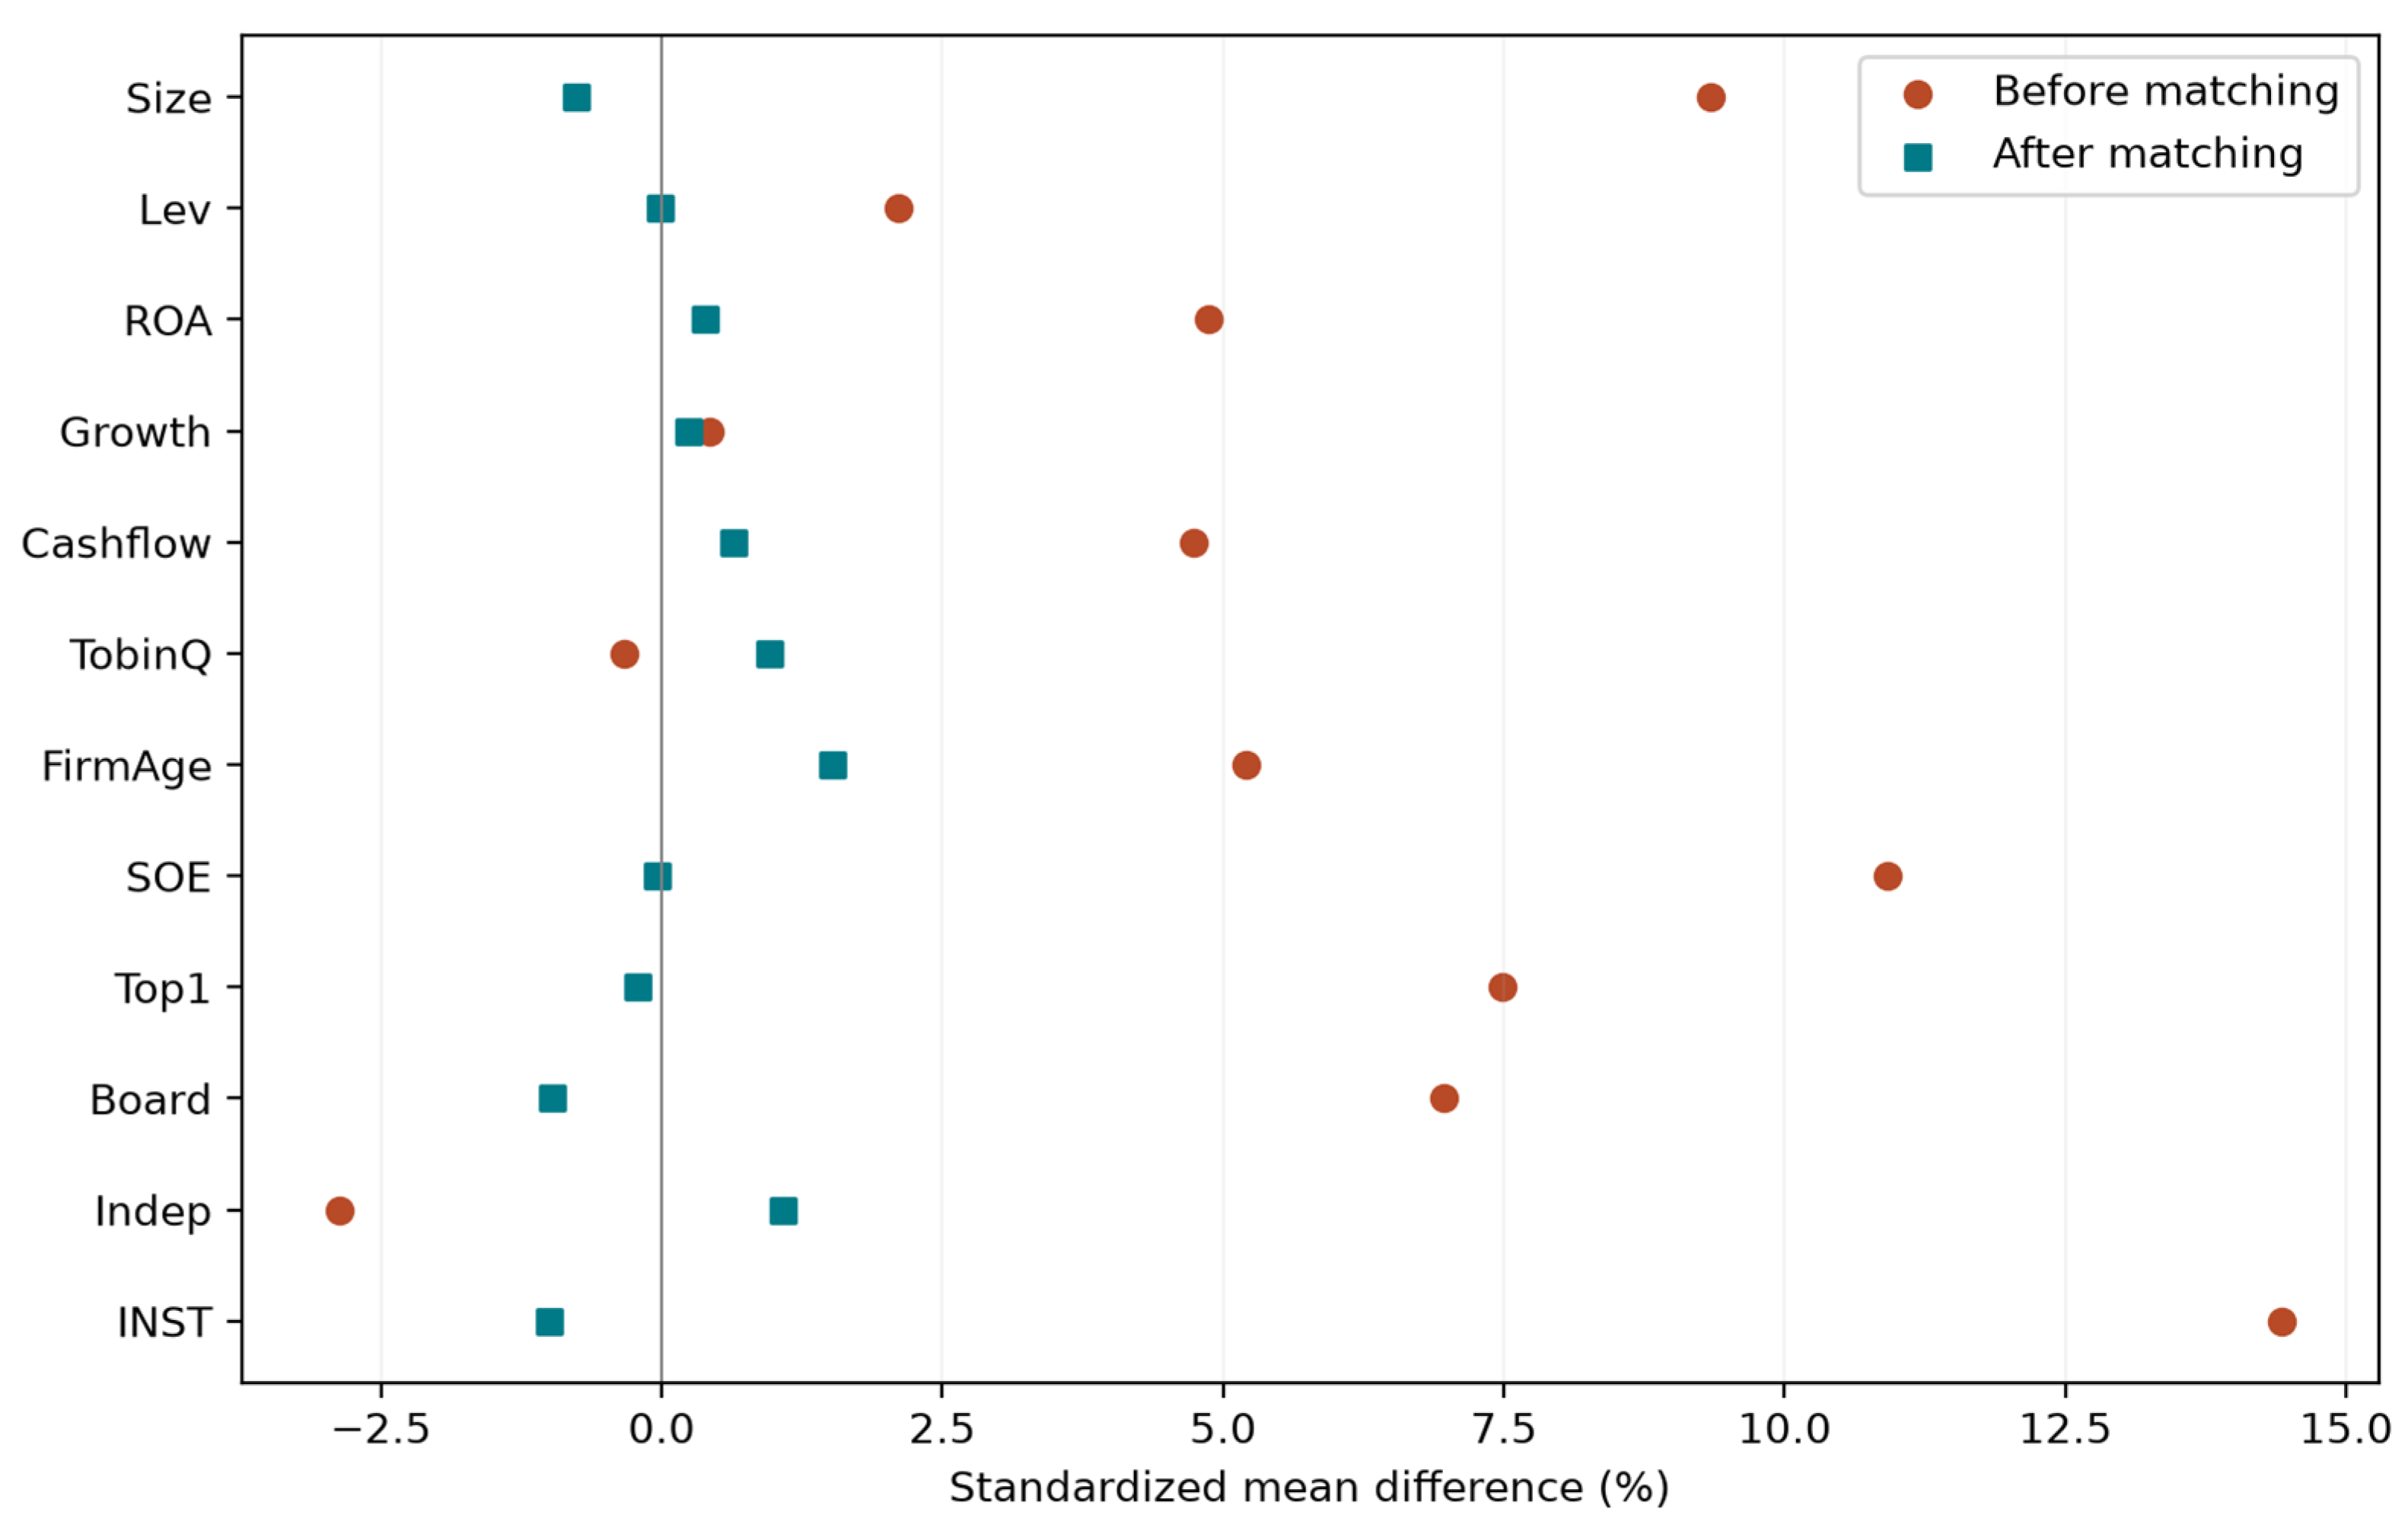
Table A6.
Economic magnitude of the estimated associations.
Percentage changes equal 100 × [exp(b × SD(Gap)) − 1]. For the interaction, the transformation describes the change in the ratio between the two duality groups per one-standard-deviation increase in Gap. Gap standard deviations equal 1.1181 in the main sample and 1.1170 in the common sample. Each average association comes from a separate model; conditional slopes and slope differences come from the interaction model. N = 32,126 for main revenue and 27,755 for both common-sample outcomes.
Table A7.
Flexible interaction diagnostics.
The binning analysis divides the overlapping Gap distribution into three regions and estimates the conditional Dual contrast. The full restriction test compares the flexible specification with the linear interaction model; the curve test evaluates linearity of the conditional contrast. High minus low compares the conditional Dual contrast across the extreme bins. The main revenue plot appears in Figure 3 of the main text. Figure A2 presents common-sample diagnostics.
Figure A2.
Flexible interactions in the common sample. Intervals are pointwise 95% confidence intervals. Curves describe conditional differences between Dual = 1 and Dual = 0.
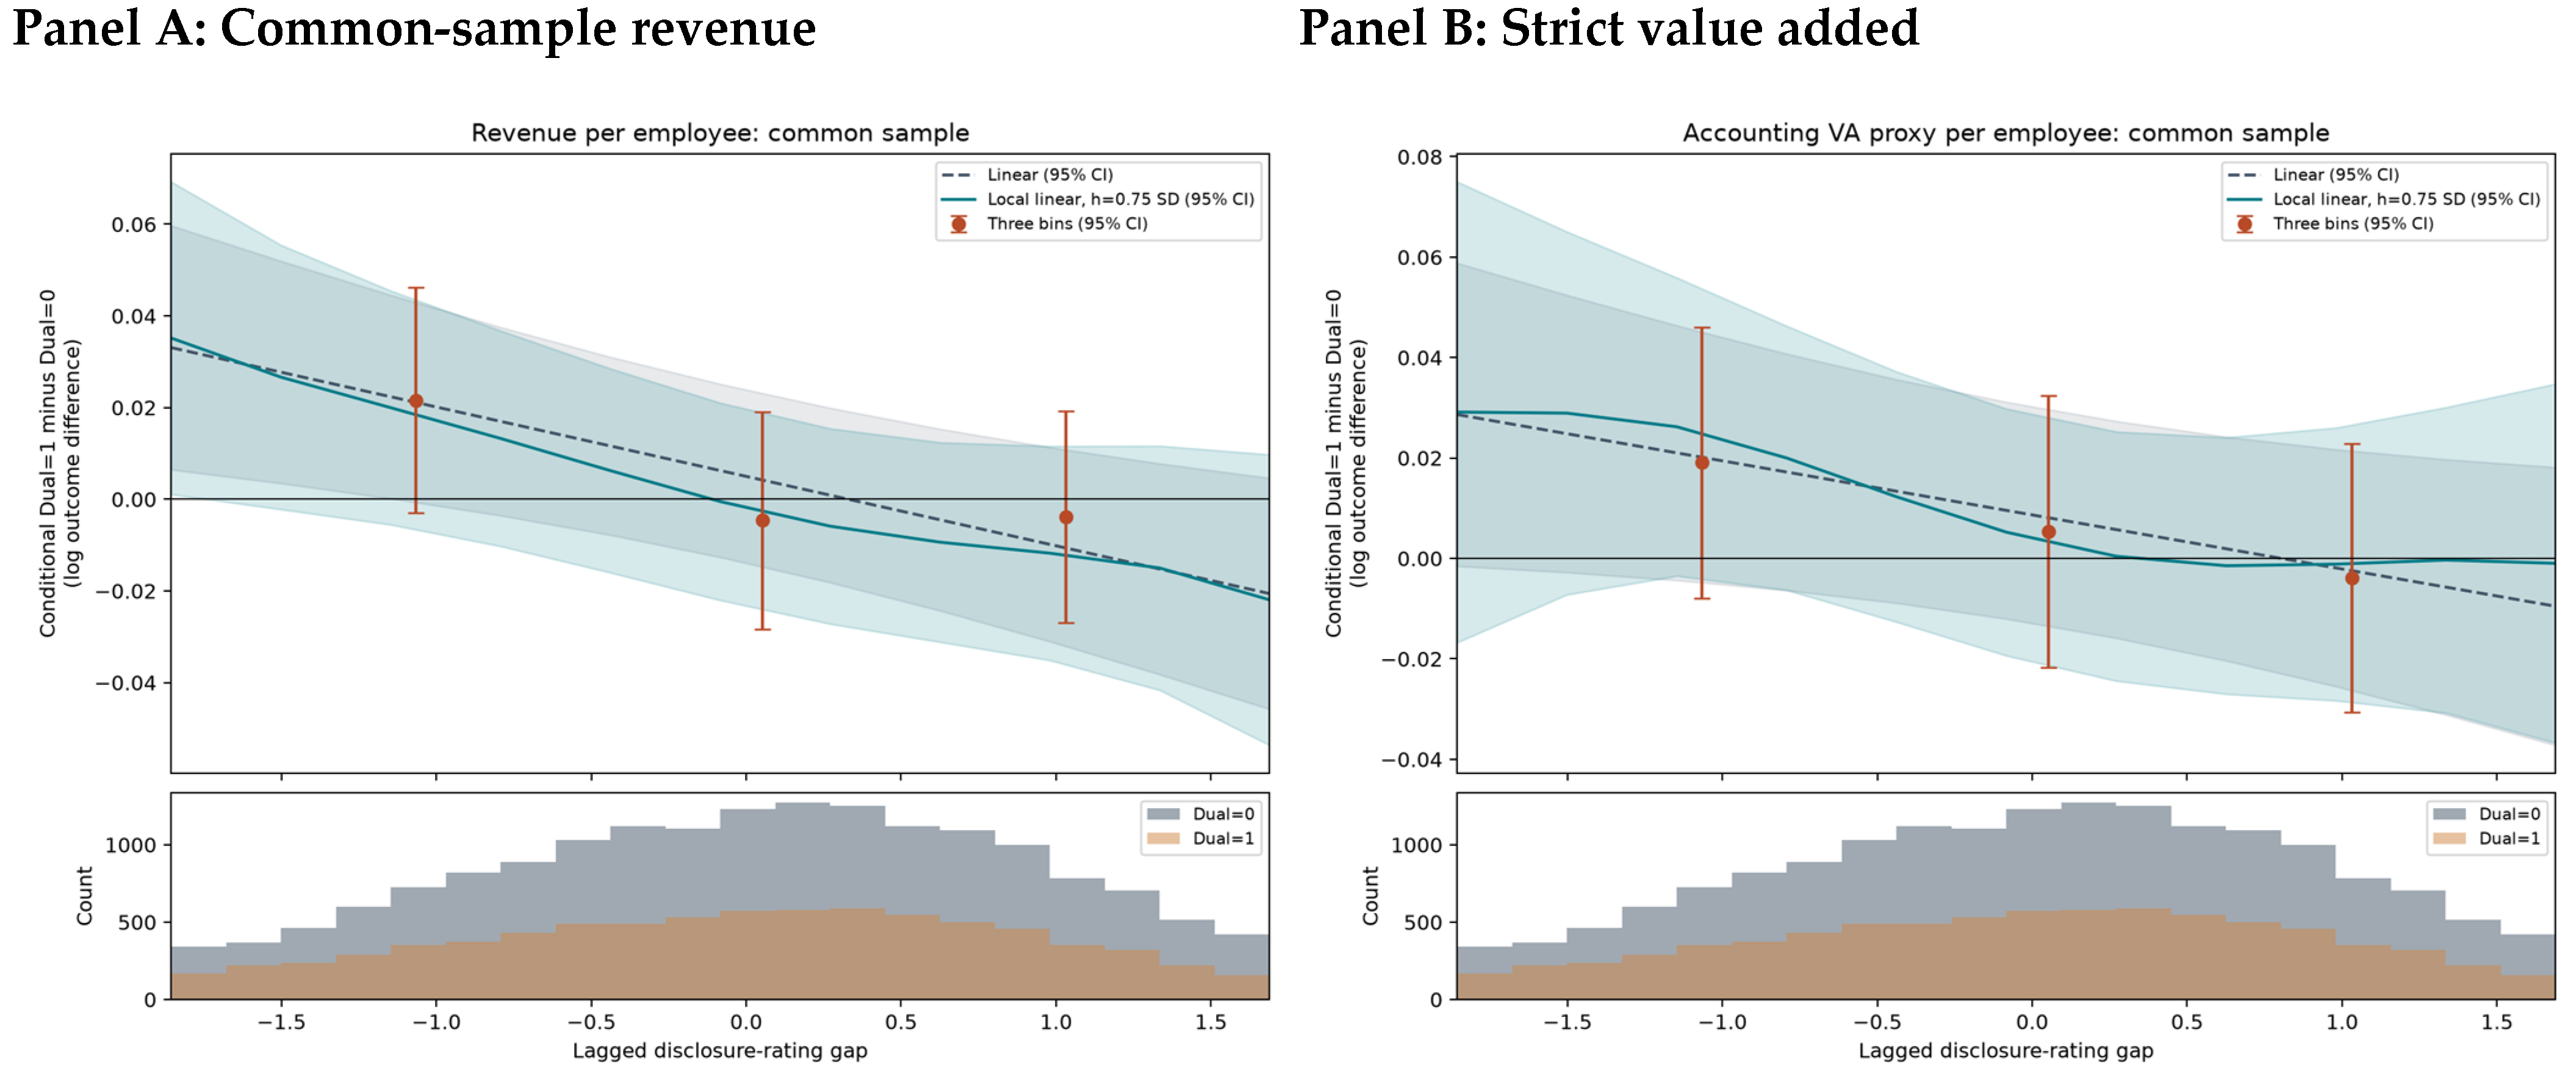
Figure A3.
Sensitivity to the smoothing bandwidth. Notes: Gaussian kernel estimates use bandwidths of 0.5, 0.75, and 1 standard deviation of Gap over the overlap region. Intervals are pointwise 95% confidence intervals. The orange, teal, and dark gray curves represent local linear estimates using bandwidths of 0.5, 0.75, and 1.0 gap standard deviations, respectively. The corresponding shaded bands indicate pointwise 95% confidence intervals.
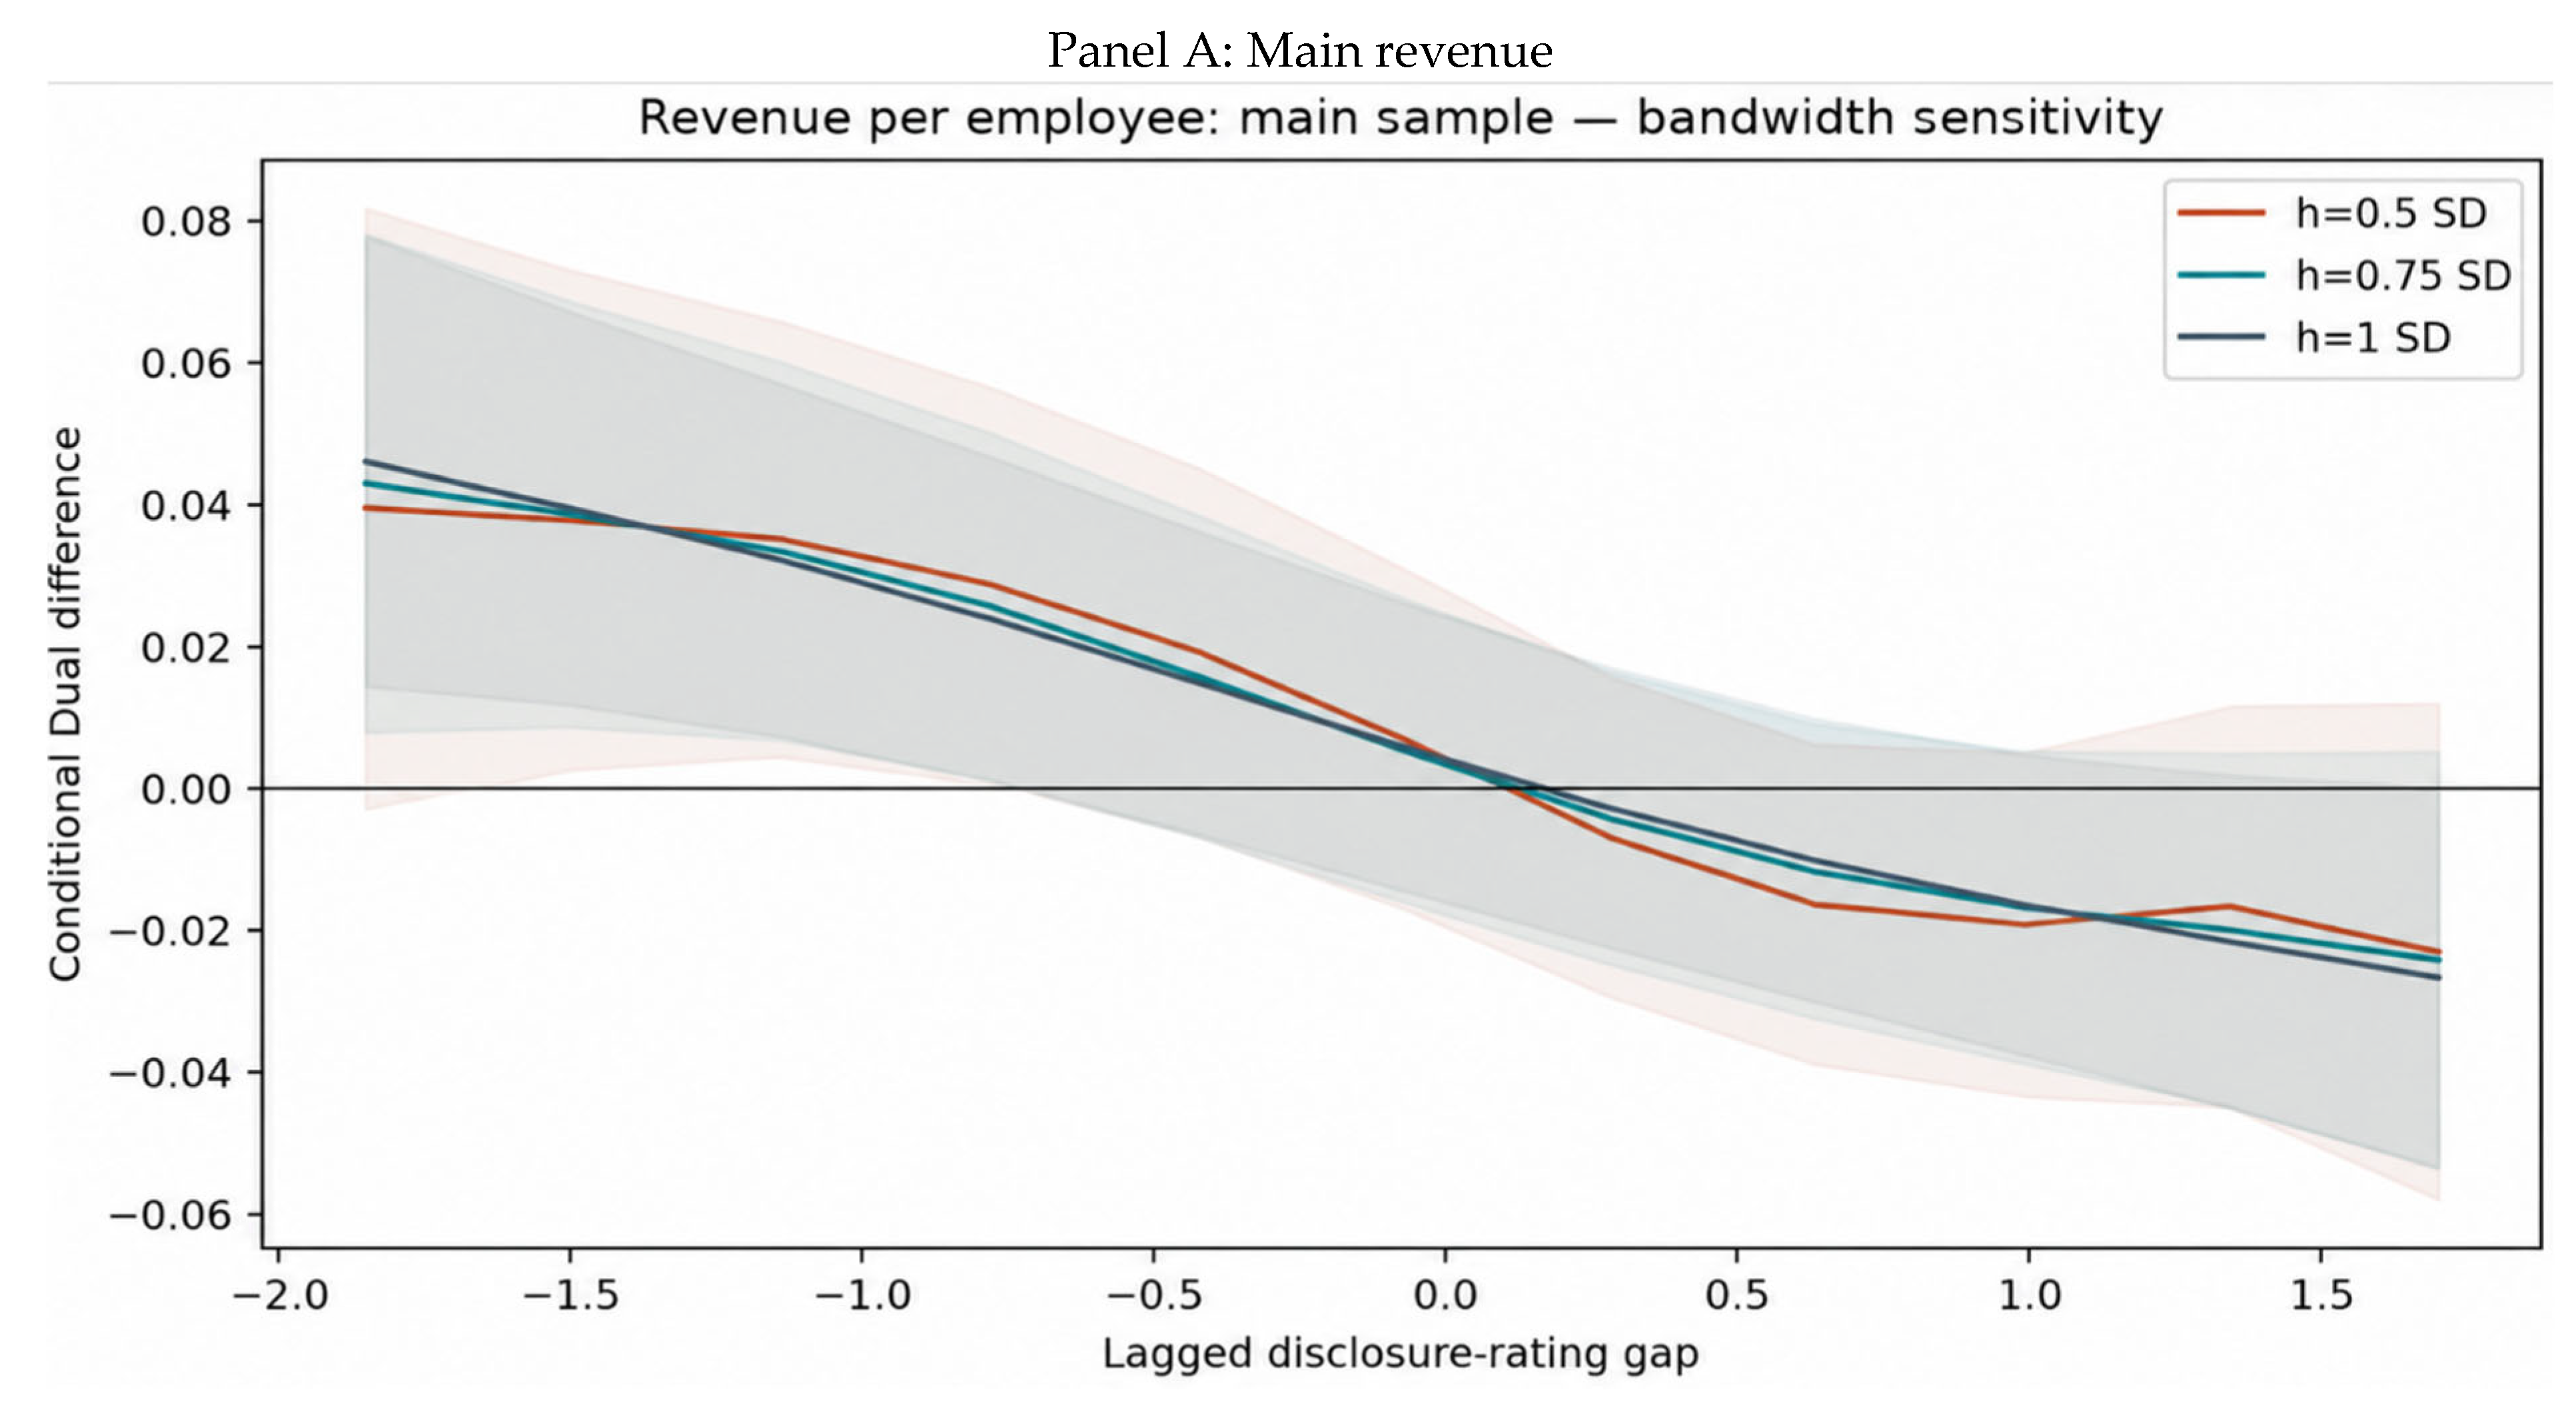
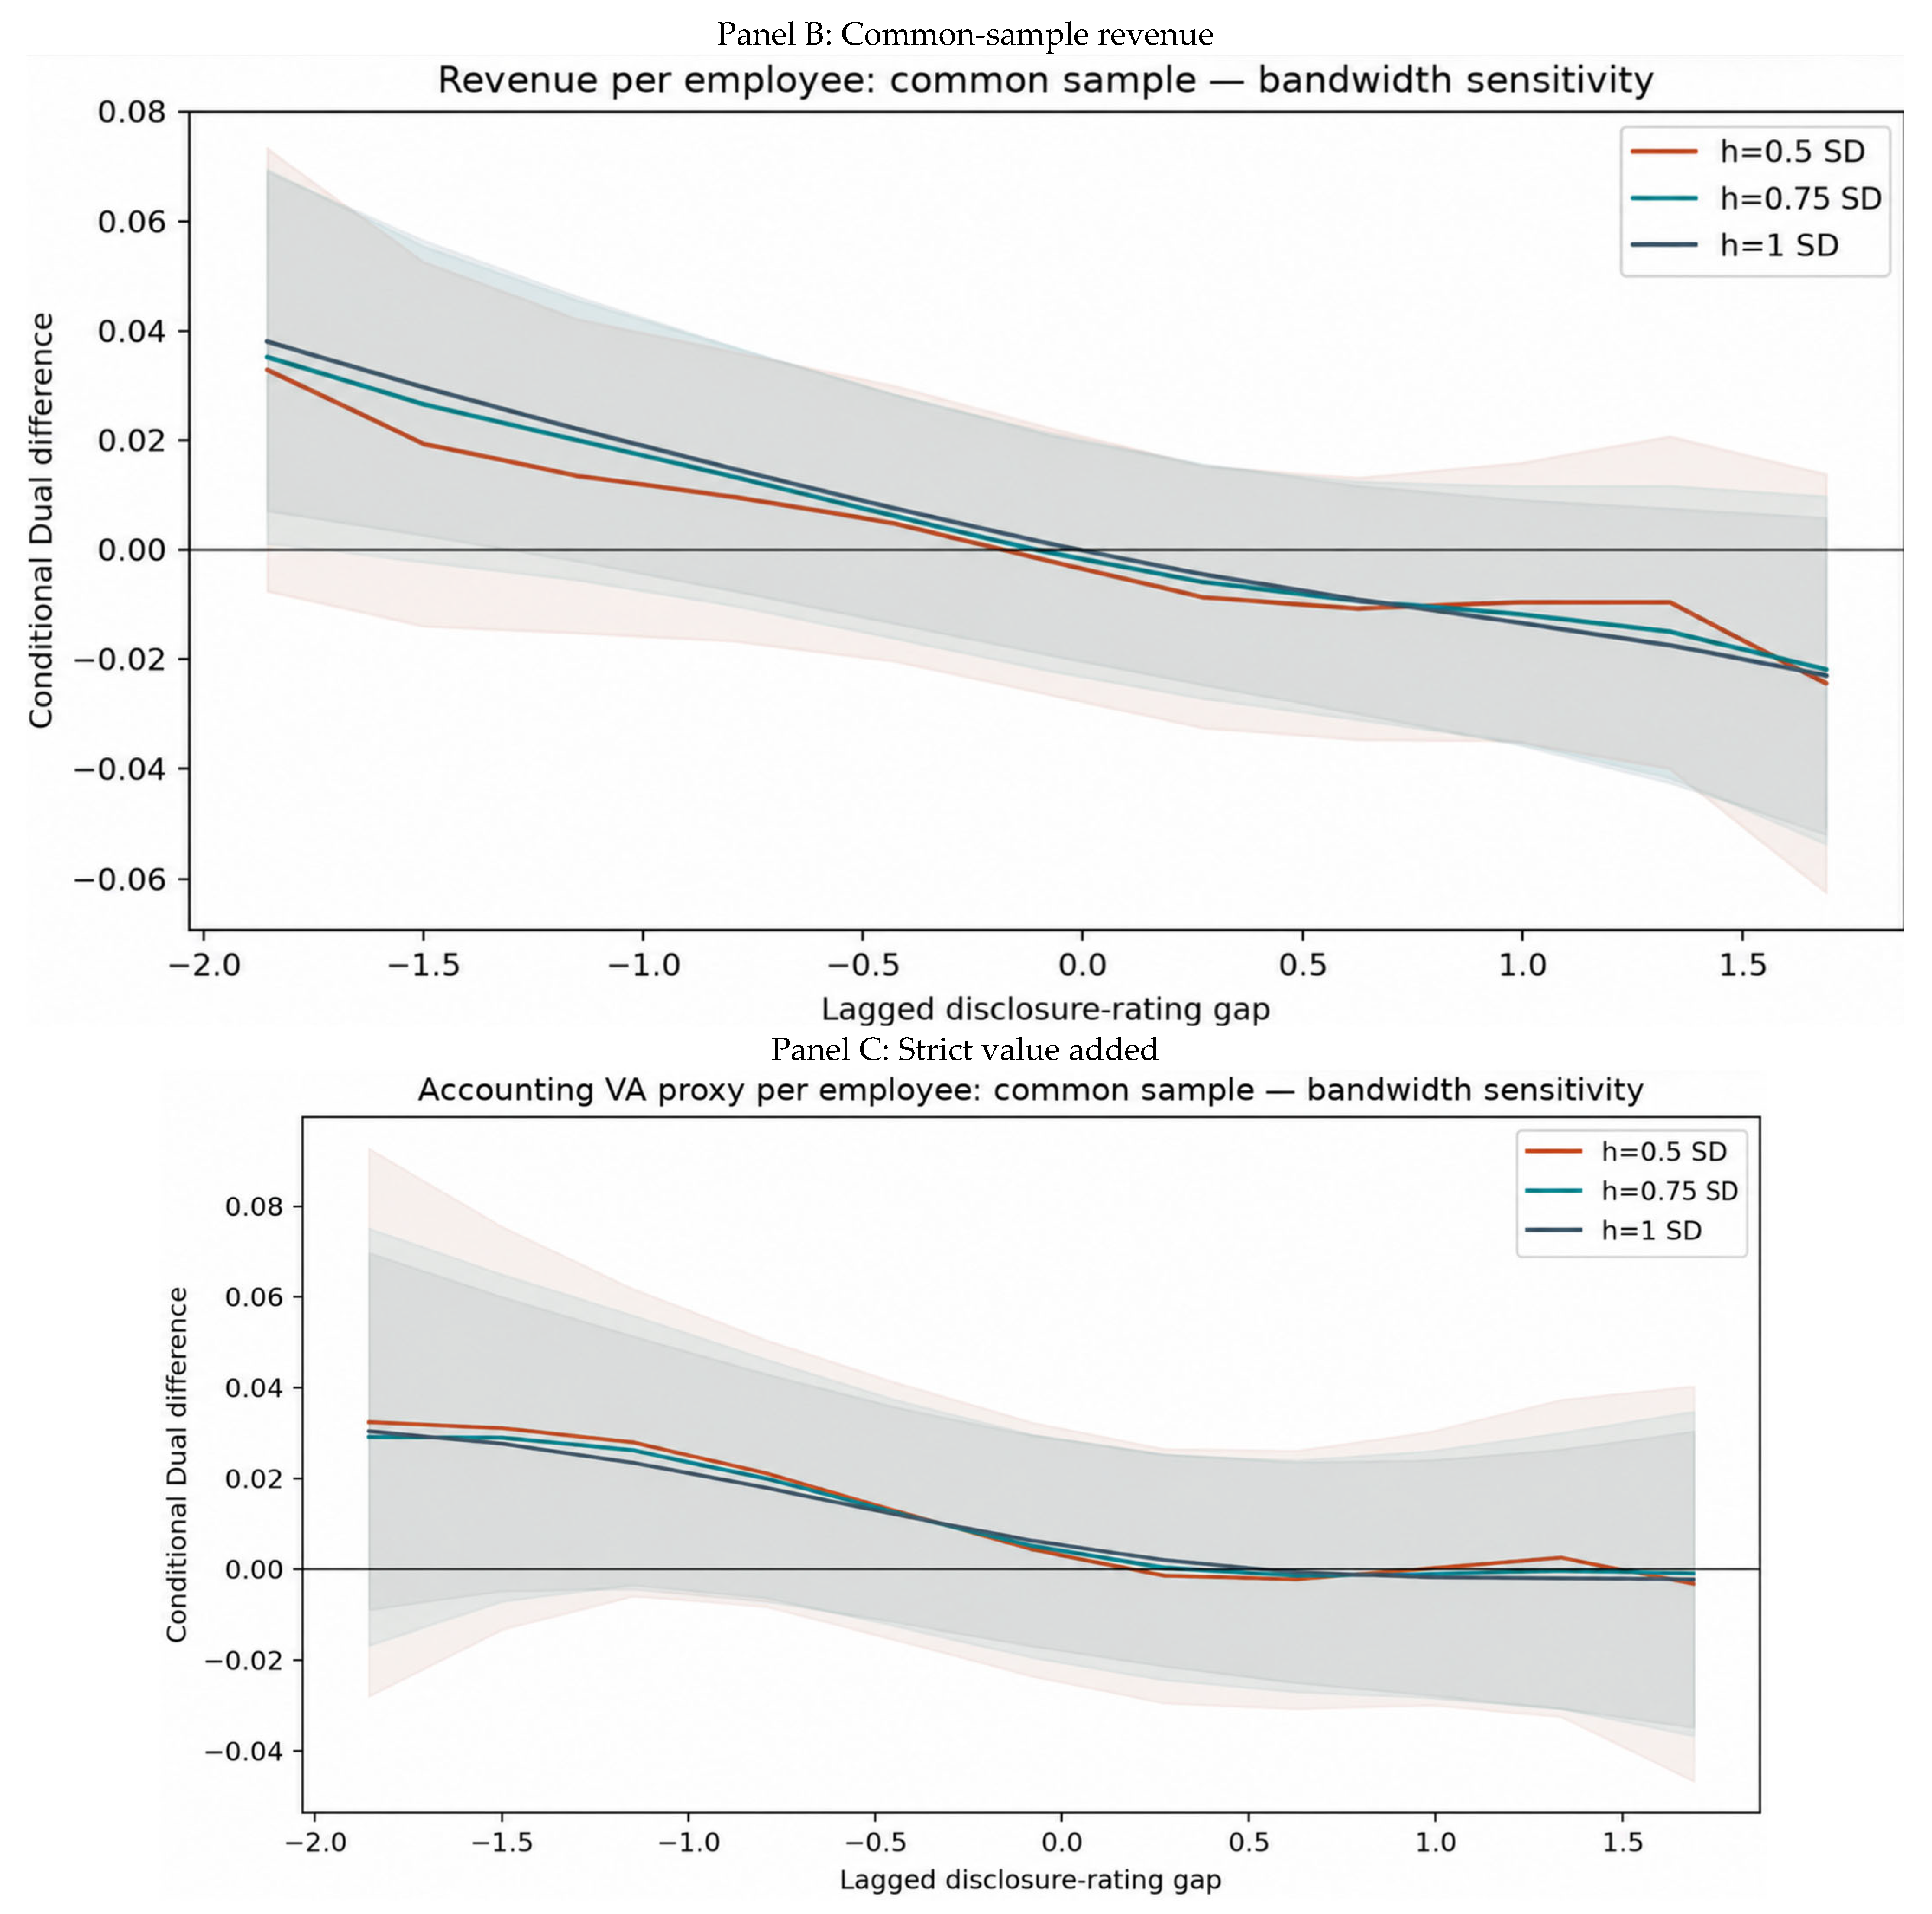
Table A8.
Conditional slopes of disclosure and environmental ratings and the equal-and-opposite restriction.
Panel A reports each component’s conditional slope holding the other component constant. Panel B tests whether the disclosure and rating slopes sum to zero among firms with CEO duality in the main revenue sample. This is the restriction implied by using standardized disclosure minus the standardized rating as a single predictor for this group. The standard error of the sum incorporates the covariance between the estimated slopes.
Table A9.
Ownership and industry heterogeneity.
For ownership, groups 0 and 1 denote non-state-owned and state-owned firms. For industry classifications, groups 0 and 1 denote other and polluting industries. The pooled difference is the triple-interaction coefficient from the full-sample specification; it tests heterogeneity across the groups. Separate subgroup estimates can involve additional singleton removal. All models include the full controls and firm and year fixed effects, with firm-clustered standard errors.
Strict pollution classification: B06, B07, B08, B09, B10, C15, C17, C19, C22, C25, C26, C27, C28, C29, C30, C31, C32, C33, D44. Classification uses lagged historical industry codes.
Broad pollution classification: B06, B07, B08, B09, B10, B11, C13, C15, C17, C18, C19, C22, C25, C26, C27, C28, C29, C30, C31, C32, C33, D44. Classification uses lagged historical industry codes.
Table A10.
Exploratory mechanism analyses.
The sequence is Gap in year s, the mechanism proxy in s + 1, and revenue per employee in s + 2. Models control for the mechanism proxy and outcome in year s, the baseline controls, and firm and year fixed effects. Standard errors are clustered by firm. Each proxy uses a common complete-case sample across its equations. Holm adjustment covers the three proxies separately for the average and interaction tests in Panel A. The proxy measures capture staff payments, administrative expenditure, and investment allocation; they provide exploratory evidence about the proposed channels.
The administrative-intensity interaction is significant at 10% before multiplicity adjustment. Its adjusted p-value is 0.2909. Staff cash intensity has imprecise first-stage estimates, while the administrative and investment proxy coefficients in the revenue equation are positive. These patterns leave the proposed adverse mechanism chain empirically unresolved.
References
- Eccles, R.G.; Ioannou, I.; Serafeim, G. The impact of corporate sustainability on organizational processes and performance. Manag. Sci. 2014, 60, 2835–2857. [Google Scholar] [CrossRef] [Scilit]
- Delmas, M.A.; Burbano, V.C. The drivers of greenwashing. Calif. Manag. Rev. 2011, 54, 64–87. [Google Scholar] [CrossRef] [Scilit]
- Walker, K.; Wan, F. The harm of symbolic actions and green-washing: Corporate actions and communications on environmental performance and their financial implications. J. Bus. Ethics 2012, 109, 227–242. [Google Scholar] [CrossRef] [Scilit]
- Chen, L.; Ma, Y.; Feng, G.-F.; Chang, C.-P. Does environmental governance mitigate the detriment of greenwashing on innovation in China? Pac.-Basin Financ. J. 2024, 86, 102450. [Google Scholar] [CrossRef] [Scilit]
- Gong, Q.; Kong, Z.; Li, L.; Dong, X.; Li, Y. The consequences of hypocrisy: How ESG greenwashing undermines green total factor productivity. J. Int. Financ. Mark. Inst. Money 2026, 106, 102241. [Google Scholar] [CrossRef] [Scilit]
- Robertson, J.L.; Montgomery, A.W.; Ozbilir, T. Employees’ response to corporate greenwashing. Bus. Strategy Environ. 2023, 32, 4015–4027. [Google Scholar] [CrossRef] [Scilit]
- Li, W.; Li, W.; Seppänen, V.; Koivumäki, T. How and when does perceived greenwashing affect employees’ job performance? Evidence from China. Corp. Soc. Responsib. Environ. Manag. 2022, 29, 1722–1735. [Google Scholar] [CrossRef] [Scilit]
- Hasan, I.; Kobeissi, N.; Liu, L.; Wang, H. Corporate social responsibility and firm financial performance: The mediating role of productivity. J. Bus. Ethics 2018, 149, 671–688. [Google Scholar] [CrossRef] [Scilit]
- Delmas, M.A.; Pekovic, S. Environmental standards and labor productivity: Understanding the mechanisms that sustain sustainability. J. Organ. Behav. 2013, 34, 230–252. [Google Scholar] [CrossRef] [Scilit]
- Finkelstein, S.; D’Aveni, R.A. CEO duality as a double-edged sword: How boards of directors balance entrenchment avoidance and unity of command. Acad. Manag. J. 1994, 37, 1079–1108. [Google Scholar] [CrossRef] [Scilit]
- Boyd, B.K. CEO duality and firm performance: A contingency model. Strateg. Manag. J. 1995, 16, 301–312. [Google Scholar] [CrossRef] [Scilit]
- Gull, A.A.; Hussain, N.; Khan, S.A.; Mushtaq, R.; Orij, R. The power of the CEO and environmental decoupling. Bus. Strategy Environ. 2023, 32, 3951–3964. [Google Scholar] [CrossRef] [Scilit]
- Marquis, C.; Qian, C. Corporate social responsibility reporting in China: Symbol or substance? Organ. Sci. 2014, 25, 127–148. [Google Scholar] [CrossRef] [Scilit]
- Hu, S.; Wang, A.; Du, K. Environmental tax reform and greenwashing: Evidence from Chinese listed companies. Energy Econ. 2023, 124, 106873. [Google Scholar] [CrossRef] [Scilit]
- Bromley, P.; Powell, W.W. From smoke and mirrors to walking the talk: Decoupling in the contemporary world. Acad. Manag. Ann. 2012, 6, 483–530. [Google Scholar] [CrossRef]
- Graafland, J.; Smid, H. Decoupling among CSR policies, programs, and impacts: An empirical study. Bus. Soc. 2019, 58, 231–267. [Google Scholar] [CrossRef] [Scilit]
- Lyon, T.P.; Montgomery, A.W. The means and end of greenwash. Organ. Environ. 2015, 28, 223–249. [Google Scholar] [CrossRef] [Scilit]
- de Freitas Netto, S.V.; Sobral, M.F.F.; Ribeiro, A.R.B.; Soares, G.R.L. Concepts and forms of greenwashing: A systematic review. Environ. Sci. Eur. 2020, 32, 19. [Google Scholar] [CrossRef] [Scilit]
- Marquis, C.; Toffel, M.W.; Zhou, Y. Scrutiny, norms, and selective disclosure: A global study of greenwashing. Organ. Sci. 2016, 27, 483–504. [Google Scholar] [CrossRef] [Scilit]
- Clarkson, P.M.; Li, Y.; Richardson, G.D.; Vasvari, F.P. Revisiting the relation between environmental performance and environmental disclosure: An empirical analysis. Account. Organ. Soc. 2008, 33, 303–327. [Google Scholar] [CrossRef] [Scilit]
- Kim, E.-H.; Lyon, T.P. Greenwash vs. brownwash: Exaggeration and undue modesty in corporate sustainability disclosure. Organ. Sci. 2015, 26, 705–723. [Google Scholar] [CrossRef] [Scilit]
- Yu, E.P.-Y.; Luu, B.V.; Chen, C.H. Greenwashing in environmental, social and governance disclosures. Res. Int. Bus. Financ. 2020, 52, 101192. [Google Scholar] [CrossRef] [Scilit]
- Dorfleitner, G.; Utz, S. Green, green, it’s green they say: A conceptual framework for measuring greenwashing on firm level. Rev. Manag. Sci. 2024, 18, 3463–3486. [Google Scholar] [CrossRef] [Scilit]
- MacLean, T.L.; Behnam, M. The dangers of decoupling: The relationship between compliance programs, legitimacy perceptions, and institutionalized misconduct. Acad. Manag. J. 2010, 53, 1499–1520. [Google Scholar] [CrossRef] [Scilit]
- Donia, M.B.L.; Tetrault Sirsly, C.-A. Determinants and consequences of employee attributions of corporate social responsibility as substantive or symbolic. Eur. Manag. J. 2016, 34, 232–242. [Google Scholar] [CrossRef] [Scilit]
- Hur, W.-M.; Moon, T.-W.; Ko, S.-H. How employees’ perceptions of CSR increase employee creativity: Mediating mechanisms of compassion at work and intrinsic motivation. J. Bus. Ethics 2018, 153, 629–644. [Google Scholar] [CrossRef] [Scilit]
- Fama, E.F.; Jensen, M.C. Separation of ownership and control. J. Law Econ. 1983, 26, 301–325. [Google Scholar] [CrossRef] [Scilit]
- Adams, R.B.; Hermalin, B.E.; Weisbach, M.S. The role of boards of directors in corporate governance: A conceptual framework and survey. J. Econ. Lit. 2010, 48, 58–107. [Google Scholar] [CrossRef] [Scilit]
- Walls, J.L.; Berrone, P. The power of one to make a difference: How informal and formal CEO power affect environmental sustainability. J. Bus. Ethics 2017, 145, 293–308. [Google Scholar] [CrossRef] [Scilit]
- Hermalin, B.E.; Weisbach, M.S. Endogenously chosen boards of directors and their monitoring of the CEO. Am. Econ. Rev. 1998, 88, 96–118. [Google Scholar]
- Duru, A.; Iyengar, R.J.; Zampelli, E.M. The dynamic relationship between CEO duality and firm performance: The moderating role of board independence. J. Bus. Res. 2016, 69, 4269–4277. [Google Scholar] [CrossRef] [Scilit]
- Sauerwald, S.; Su, W. CEO overconfidence and CSR decoupling. Corp. Gov. Int. Rev. 2019, 27, 283–300. [Google Scholar] [CrossRef] [Scilit]
- Aguilera, R.V.; Aragón-Correa, J.A.; Marano, V.; Tashman, P.A. The corporate governance of environmental sustainability: A review and proposal for more integrated research. J. Manag. 2021, 47, 1468–1497. [Google Scholar] [CrossRef] [Scilit]
- ISO 9001:2015; Quality Management Systems—Requirements. International Organization for Standardization: Geneva, Switzerland, 2015.
- ISO 14001:2015; Environmental Management Systems—Requirements with Guidance for Use. International Organization for Standardization: Geneva, Switzerland, 2015.
- Hainmueller, J.; Mummolo, J.; Xu, Y. How much should we trust estimates from multiplicative interaction models? Simple tools to improve empirical practice. Political Anal. 2019, 27, 163–192. [Google Scholar] [CrossRef] [Scilit]
- Wei, T.; Zhu, Q.; Liu, W. The Effect of Market-Based Environmental Regulations on Green Technology Innovation—The Regulatory Effect Based on Corporate Social Responsibility. Sustainability 2024, 16, 4719. [Google Scholar] [CrossRef] [Scilit]
- Lin, W.; Wang, Y.; Zhang, Q.; Peron, M.; Lu, J. Emerging opportunities or paradoxes: Assessing the effect of digital technology adoption on corporate carbon performance. J. Environ. Manag. 2025, 391, 126399. [Google Scholar] [CrossRef] [Scilit] [PubMed]
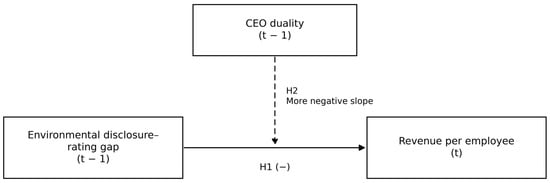
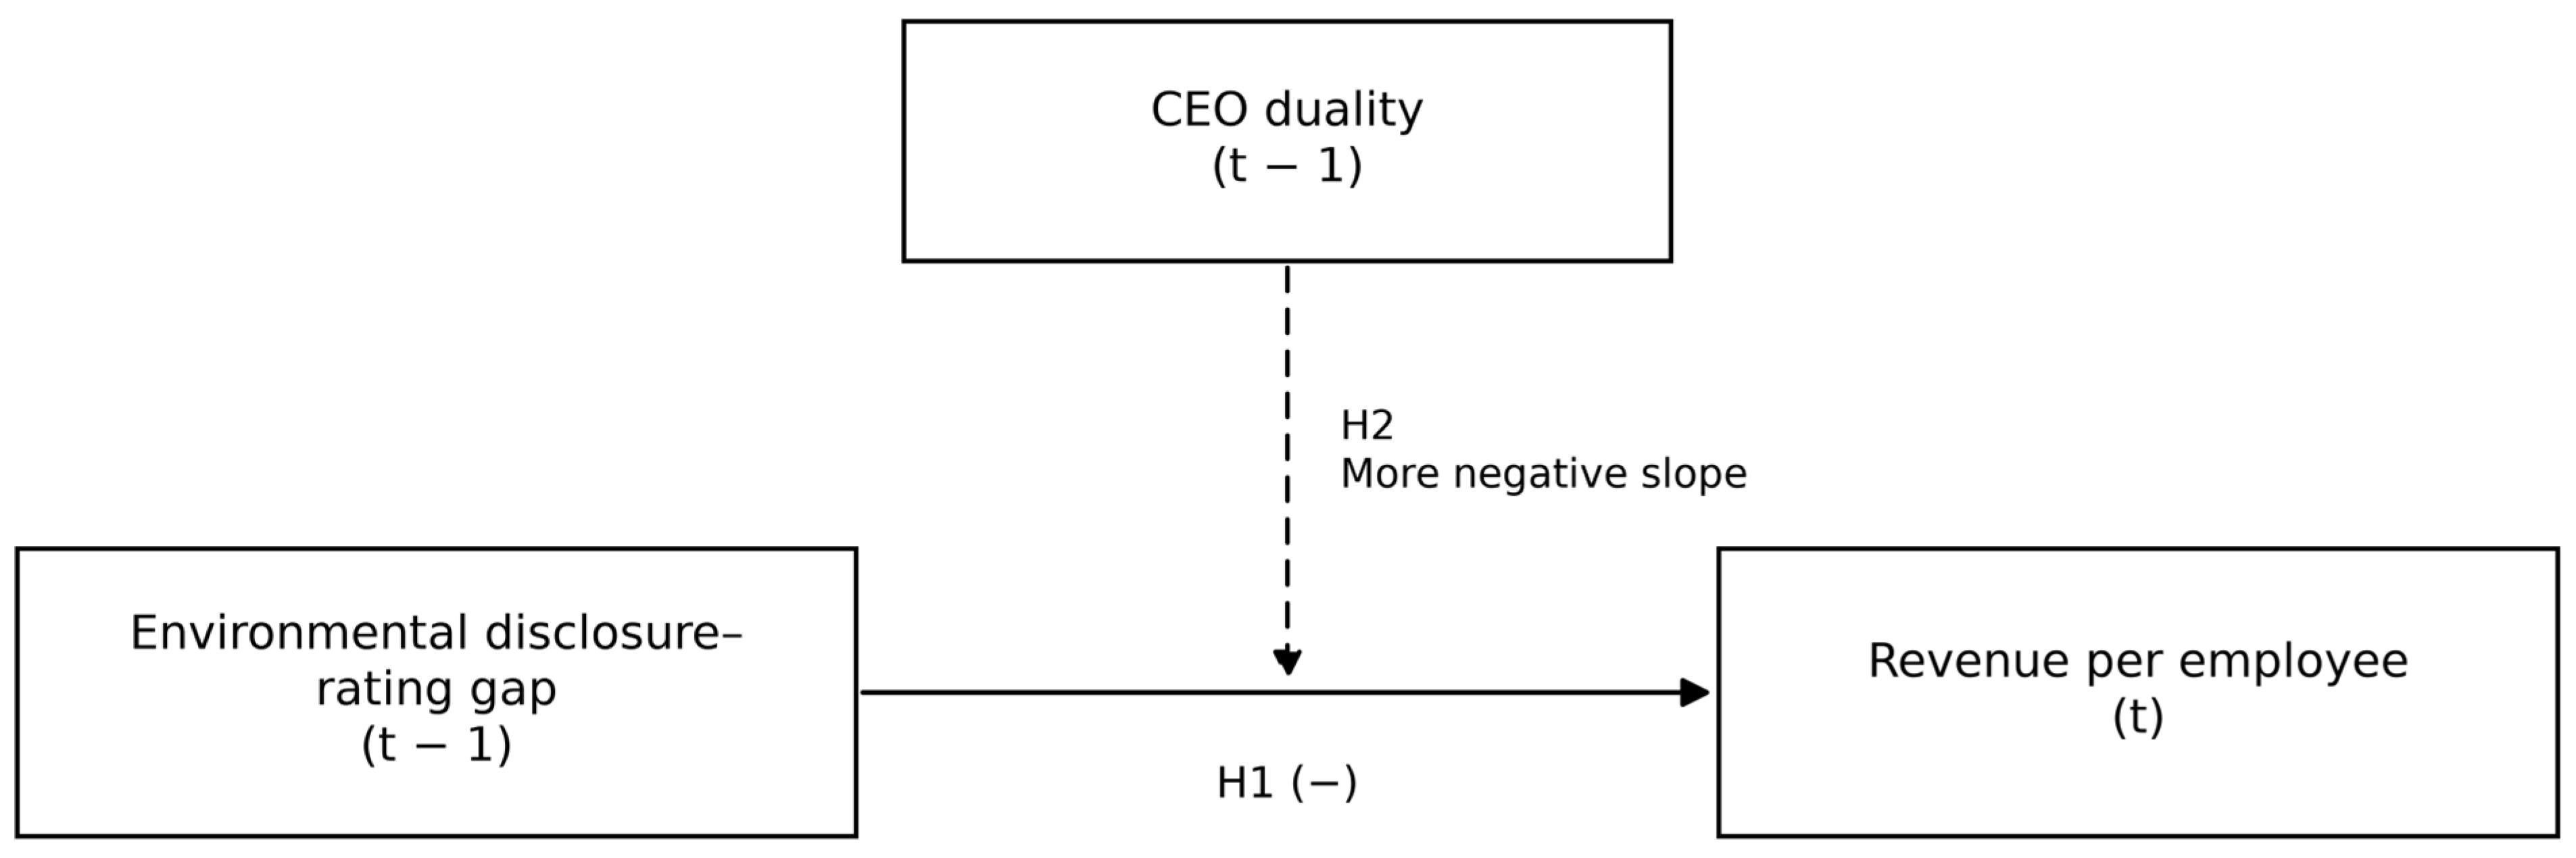
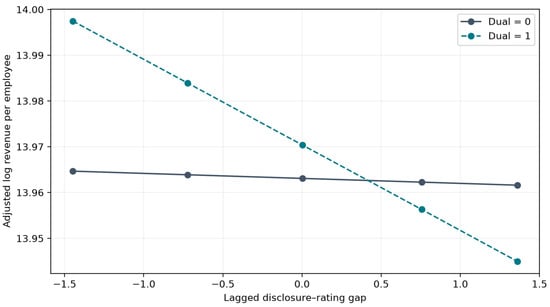
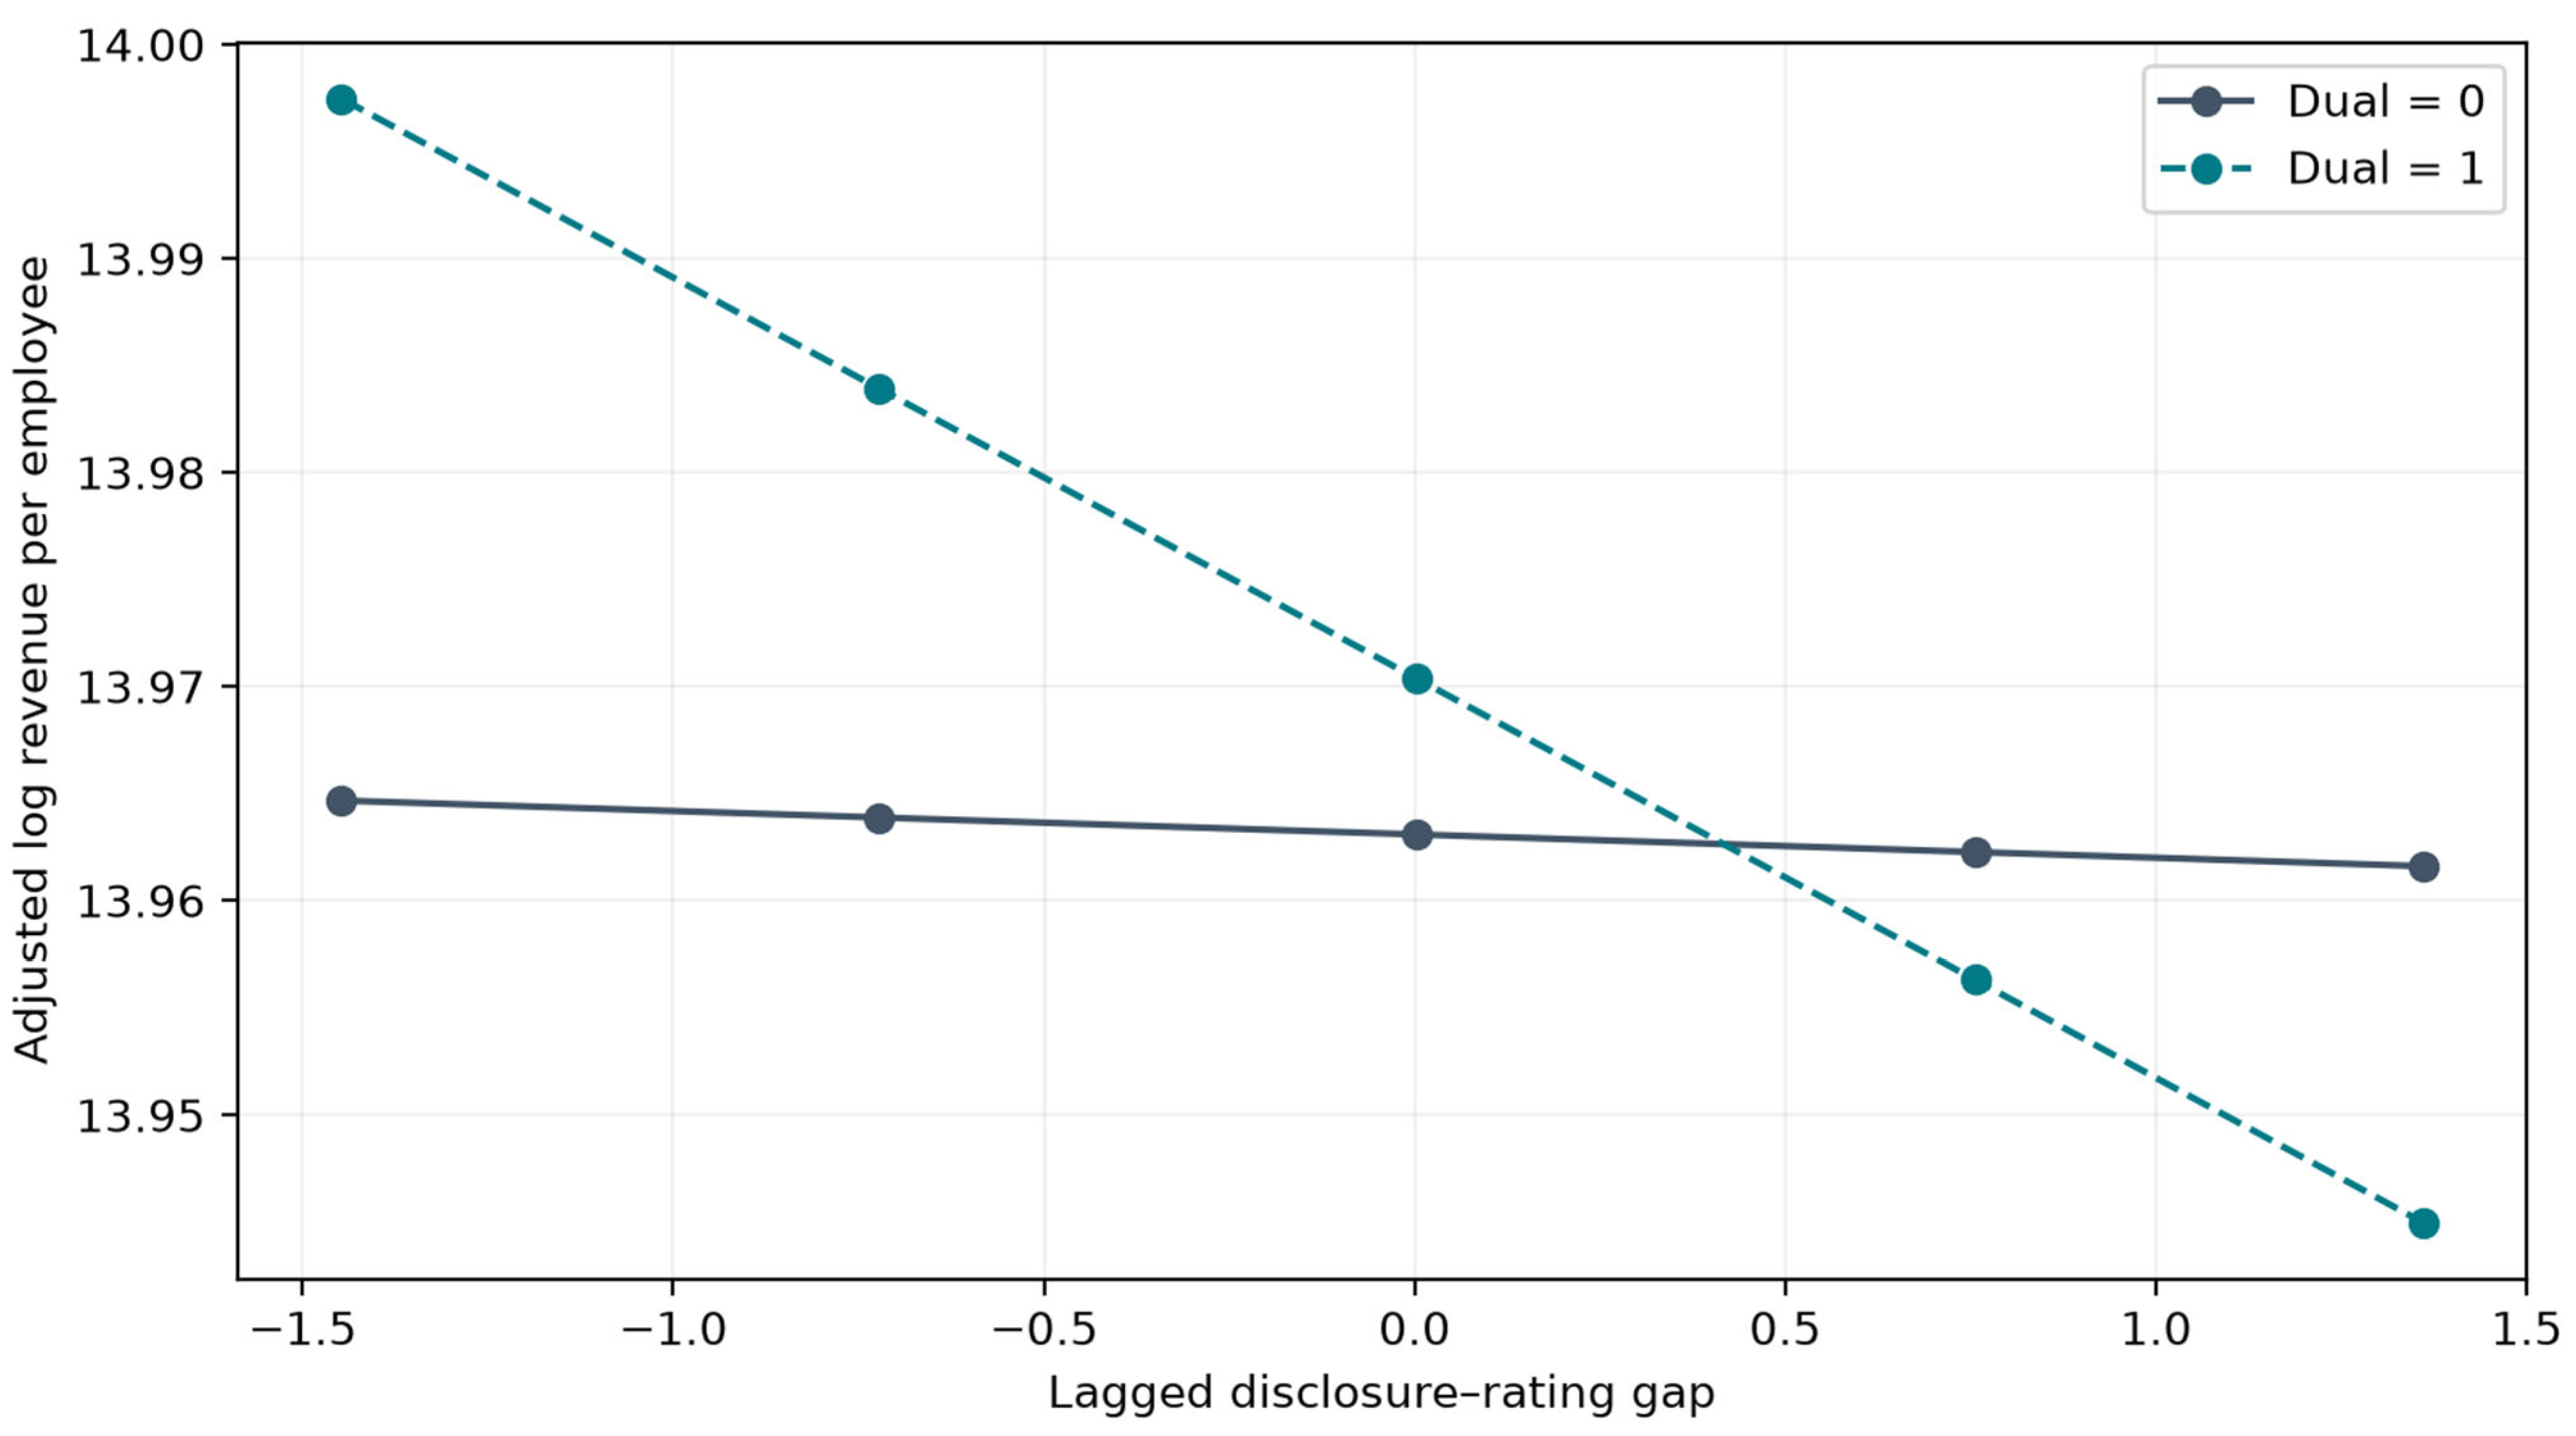
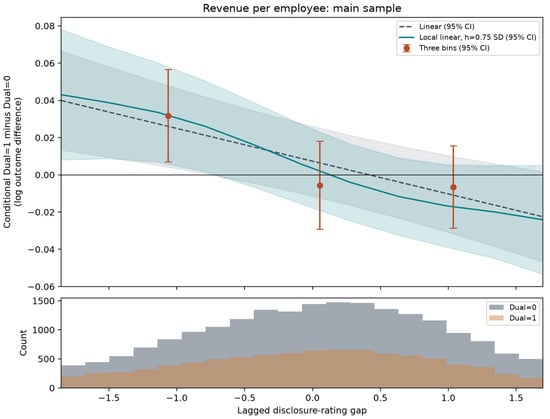
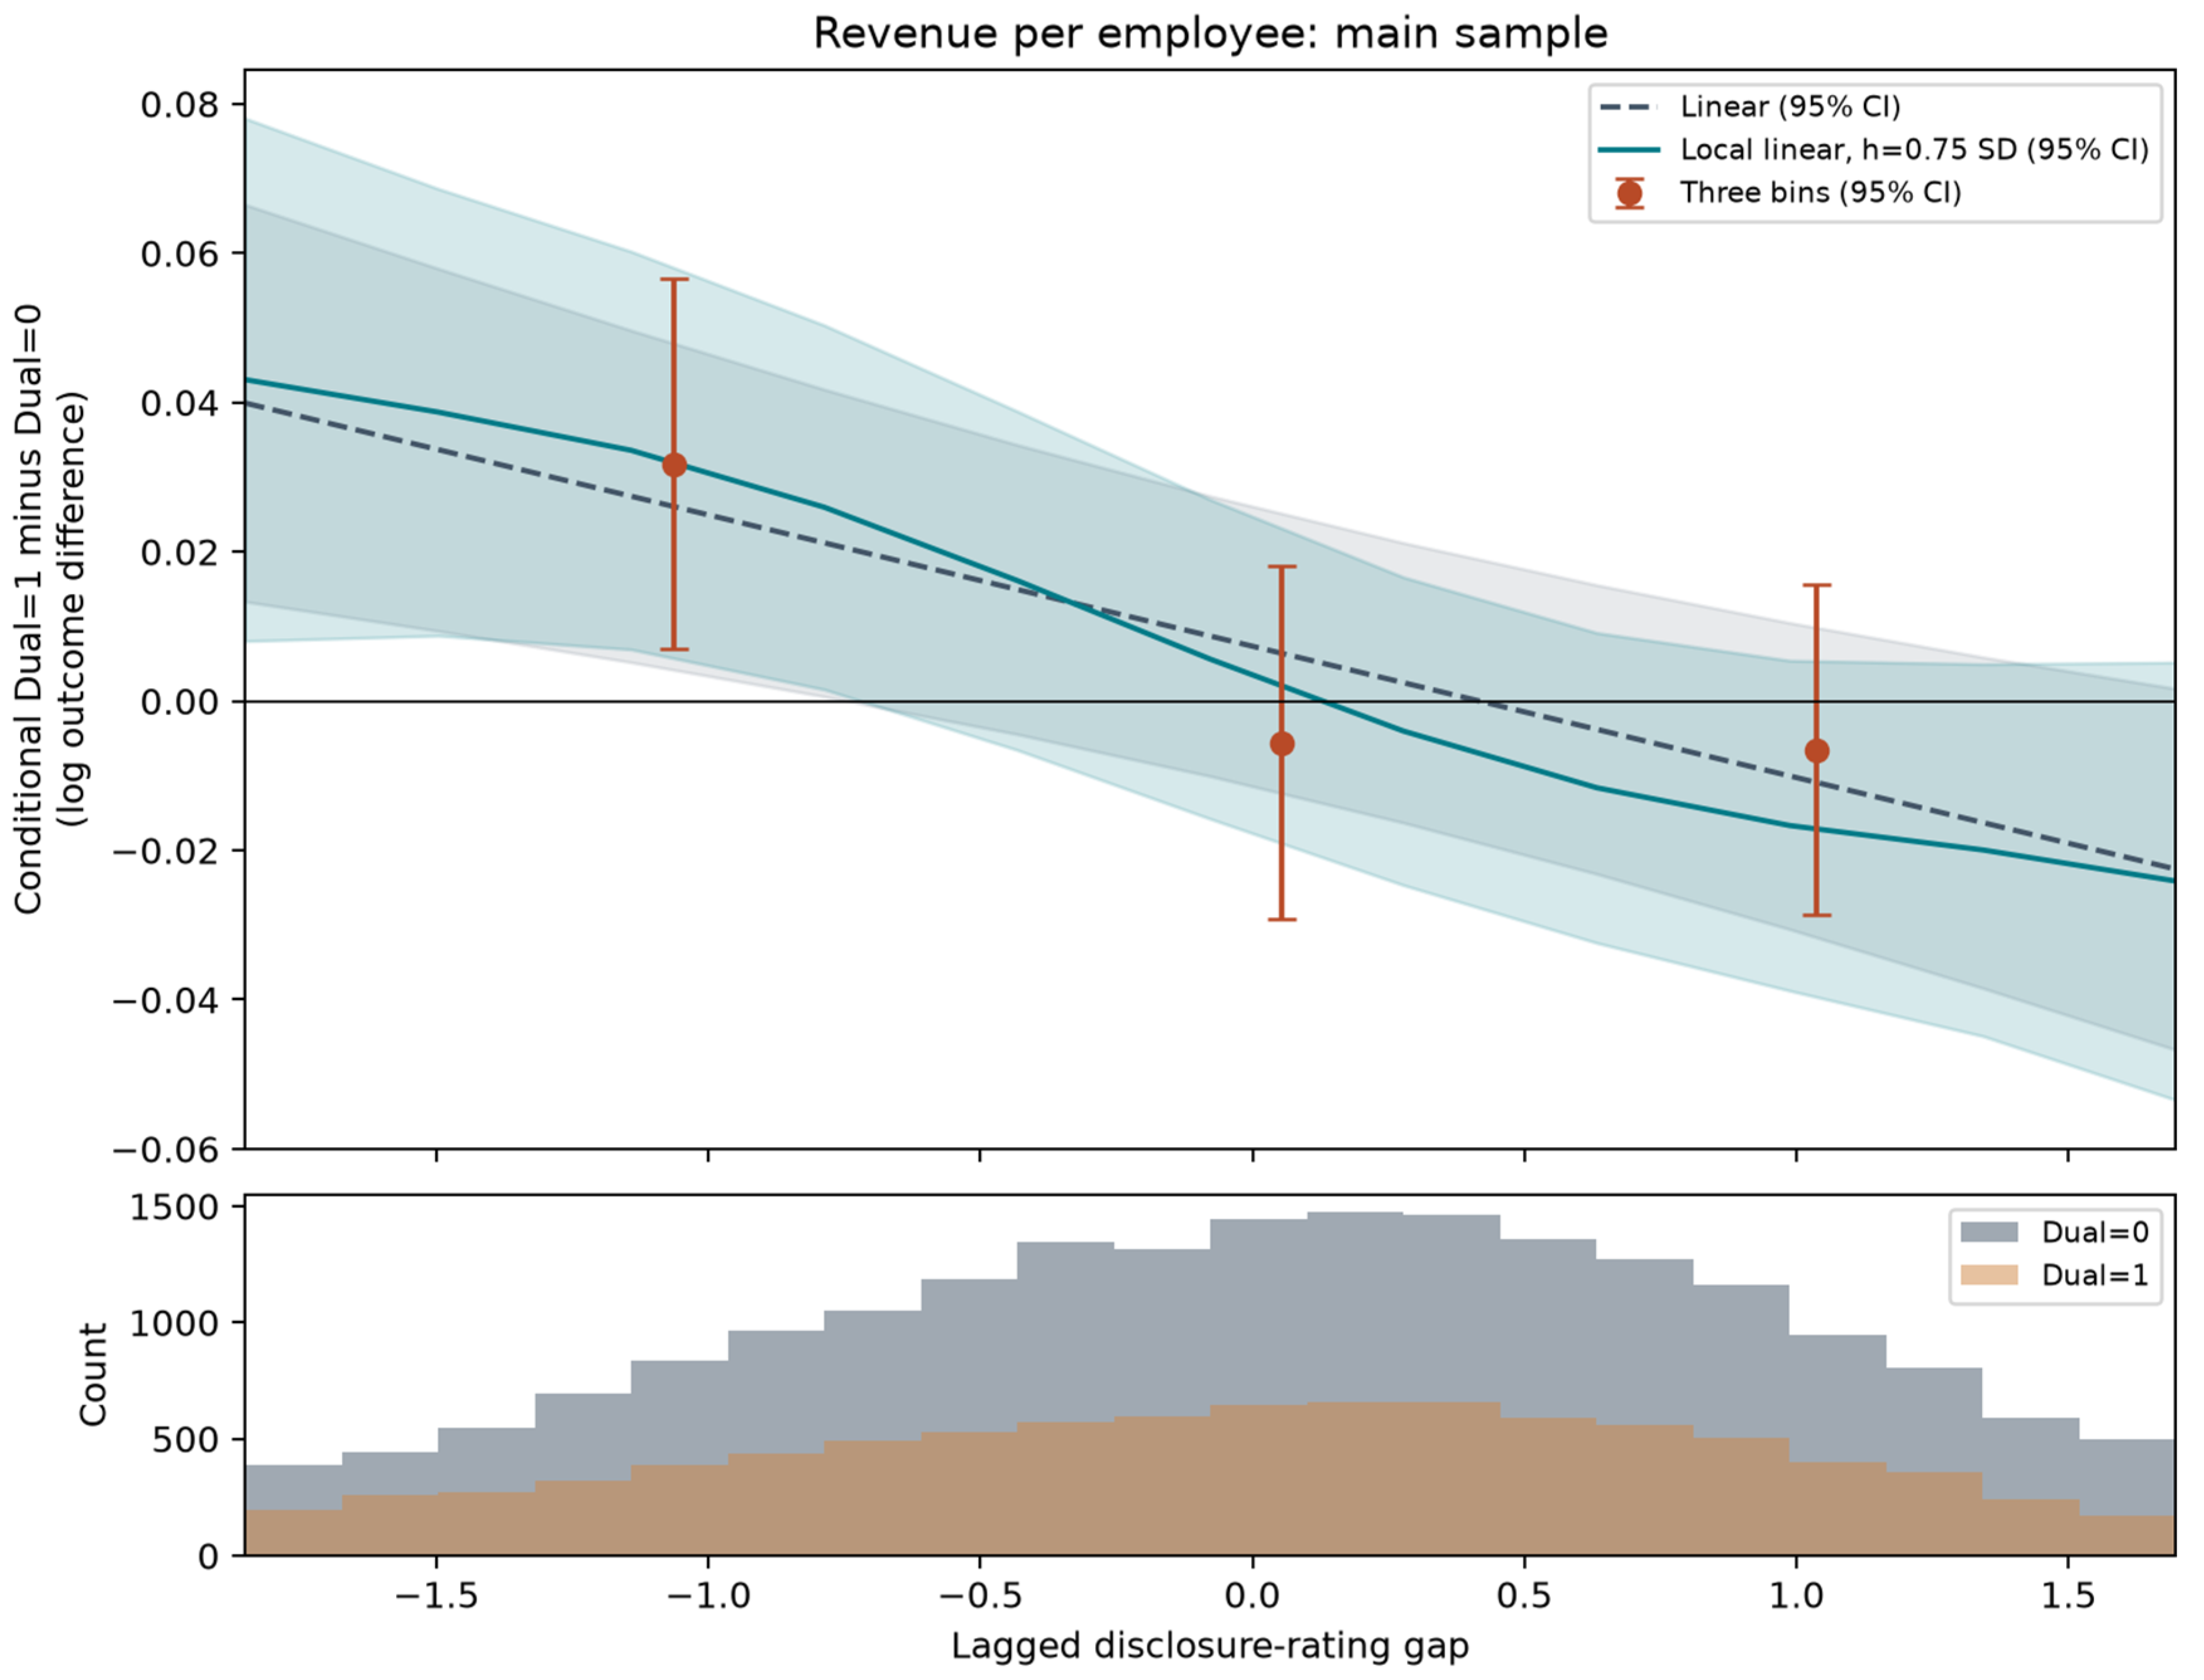

Disclaimer/Publisher’s Note: The statements, opinions and data contained in all publications are solely those of the individual author(s) and contributor(s) and not of MDPI and/or the editor(s). MDPI and/or the editor(s) disclaim responsibility for any injury to people or property resulting from any ideas, methods, instructions or products referred to in the content. |
© 2026 by the authors. Licensee MDPI, Basel, Switzerland. This article is an open access article distributed under the terms and conditions of the Creative Commons Attribution (CC BY) license.