


Abstract
Digitalization and green development have advanced together across major Chinese cities, but aggregate co-movement does not necessarily imply a robust positive association within cities. Using a balanced panel of 100 major Chinese cities (2012–2023), we construct multidimensional digitalization (DIG) and green development (GDI) indices and combine spatial and distributional analysis with a common five-specification comparison, covariance decomposition, and robustness checks. Both index means increase, while DIG dispersion widens and GDI dispersion narrows. The correlation between the annual mean DIG and GDI is 0.991 but falls to 0.517 after linear detrending, and to 0.130 for annual changes. Persistent city differences and common-year movement account for 48.04% and 51.67% of pooled covariance, respectively, whereas the two-way residual accounts for 0.30%. The two-way fixed-effects estimate is negative but statistically imprecise (β = −0.181, p = 0.150). Dimension-specific and alternative weight estimates are not uniform, cautioning against interpreting the composite result as evidence that every environmental outcome responds identically. We describe this pattern as a co-evolution–conversion gap: strong system-level co-movement coexists with weak or uncertain average within-city alignment. The findings support assessing energy, pollution, and ecological outcomes directly rather than inferring green performance from digital capability alone. Urban policymakers should evaluate digital investment alongside direct measures of energy use, emissions, pollution, and ecological amenities, while tailoring complementary actions to local industrial and energy conditions.
1. Introduction
1.1. Digital and Green Transitions in Urban Sustainability
Digitalization and green transition have advanced rapidly and simultaneously across Chinese cities. This parallel progress has encouraged an intuitive narrative of digital–green synergy: as cities become more connected, data-intensive, and innovation-oriented, they should also become cleaner, more resource-efficient, and more livable. Yet a system-wide rise in digital and green indicators and a city-level relationship between digital upgrading and green improvement are not the same empirical claim. The former describes co-evolution of two transitions; the latter asks whether additional digital progress within a city is systematically accompanied by additional green progress once common temporal forces and persistent city differences are separated out.
For urban sustainability, digital upgrading is a potential capacity, whereas resource use, pollution, and ecological amenities are outcomes that must be assessed directly. This distinction links the present digital–green inquiry to environmental and economic dimensions of sustainable urban development; it does not assume that greater digital capacity is an environmental benefit by definition.
This distinction is fundamentally a level-of-analysis problem. National digital policy, technological diffusion, macroeconomic development, environmental regulation, clean-energy investment, and infrastructure expansion can move the digital and green trajectories of many cities in the same direction at the same time. Such common movement can generate a strong pooled or system-level association even if deviations in a city’s digital trajectory from the national pattern are only weakly aligned with deviations in its green trajectory. Aggregate co-movement, cross-city distributional change, and within-city alignment therefore answer different questions and should not be treated as interchangeable evidence.
There is also a substantive reason why system-level co-evolution need not translate automatically into city-level green outcomes. Digitalization is best understood as an enabling capability rather than an environmental outcome in itself. Connectivity, computing, digital finance, data-intensive management, and innovation can improve monitoring, coordination, resource allocation, and technological diffusion, but their environmental realization depends on complementary urban systems such as the energy mix, environmental regulation, industrial structure, pollution-control infrastructure, green investment, and implementation capacity. Green development, by contrast, is a realized sustainability outcome. A gap between digital capability and green performance can therefore arise when those complementary conditions do not keep pace with digital expansion.
1.2. Prior Evidence and the Research Gap
The existing literature provides mechanisms on both sides of this conversion process. Digital technologies can reduce information and coordination costs [1], while innovation-based growth theory explains how technological change can reshape productivity and production possibilities [2]. Directed technical change can support cleaner production when incentives redirect innovation toward environmental objectives [3,4], and environmental policy can further induce technological responses and resource-productivity gains [5,6]. Empirically, Chinese studies report positive links between the digital economy and green economic efficiency or green-economy development [7,8], green total factor productivity [9,10], and broader urban green growth and green development outcomes [11,12]. Related evidence also finds favorable digital-economy associations with green eco-efficiency and comprehensive green development [13,14]. Digital infrastructure has been linked to lower urban carbon emissions [15,16,17,18], green economic transformation [16], and higher carbon-emission efficiency or lower carbon intensity [19,20]. At the same time, communication networks, computing facilities, data centers, devices, and digitally enabled activity require electricity, materials, land, and capital, and efficiency gains can coexist with activity expansion and rebound effects [21]. More broadly, energy remains a material input to economic activity and growth [22]. Other studies therefore report carbon-increasing or otherwise conditional effects of digital infrastructure [23,24], while smart-city and big-data policies may improve selected environmental outcomes without implying uniform gains across the full sustainability portfolio [25,26]. These findings make the environmental realization of digital capability a contingent process rather than an accounting identity.
Recent work also points to uneven transition outcomes: digitalization can intensify city-tier polarization even when average urban sustainability improves, while digital-economy policies can help ecologically lagging cities catch up [27,28]. Transition scholarship more broadly emphasizes that system change can proceed unevenly across levels, institutions, and technological components [29]. More recent Chinese-city evidence highlights nonlinear digital–green relationships [30], spatial spillovers [31,32], and regional heterogeneity [33]. These advances deepen understanding of how digitalization may affect particular environmental outcomes, but a simpler inferential issue remains comparatively underemphasized: how much of the apparent digital–green relationship reflects the common system-wide movement, and how much survives when the analysis shifts to within-city variation after common annual forces are absorbed? We use co-evolution to denote parallel system-level movement in digital and green development over time. We use conversion descriptively—not causally—to denote the empirical extent to which within-city digital upgrading is systematically accompanied by within-city green improvement after common temporal forces and persistent city differences are removed. A co-evolution–conversion gap therefore refers to strong system-level co-evolution coexisting with weak or statistically imprecise within-city alignment.
Recent city-level work also examines digital-economy spillovers for urban shrinkage [34] and the sustainability implications of urban expansion [35]. These papers study different outcomes; they provide context for urban heterogeneity rather than proof of a digital–green conversion mechanism. The contribution here is the explicit decomposition of aggregate covariation and a common-model comparison of within-city alignment.
1.3. Research Questions
The study is guided by three connected questions that separate aggregate trajectories from within-city associations. RQ1 asks whether digitalization and green development move in parallel in their annual means and spatial distributions over the 2012–2023 period, and whether their cross-city dispersion changes in similar ways. It therefore distinguishes co-movement in average levels from convergence or divergence across cities. RQ2 asks how the observed DIG–GDI association changes across pooled OLS, city fixed effects only, year fixed effects only, two-way fixed effects (TWFE), and first differences. Comparing these specifications shows how the estimated association changes as persistent cross-city differences and common annual movement are controlled for separately or jointly. These are complementary diagnostics of variation, not a hierarchy of causal estimators. RQ3 asks whether the within-city association is consistent across the three GDI dimensions and across city groups, and whether it is sensitive to alternative index weights, GDP-normalized components, lagged DIG, expanded controls, and spatial specifications. Together, the questions test the stability and scope of the observed pattern without treating descriptive co-evolution as evidence of a causal digital–green effect.
1.4. Research Objectives
The objectives are to (i) characterize aggregate and cross-city digital–green change, (ii) quantify common-year, between-city, and remaining within-city variation, and (iii) test whether the conditional relationship differs across green outcomes, city groups, and measurement assumptions. These objectives correspond to the three research questions developed in Section 1.3.
The analysis uses a balanced panel of 100 major Chinese cities observed annually from 2012 to 2023. We construct a multidimensional digitalization index covering infrastructure, application, and capability and a green development index covering resource–carbon performance, pollution–environmental quality, and ecological amenities. The empirical sequence is deliberately layered. We first document system-level and spatial co-evolution with annual means and common-scale maps, then visualize cross-city distributional restructuring with selected-year raincloud plots that combine density envelopes, boxplots, and the underlying city observations. We next trace a common DIG-GDI specification through pooled OLS, city fixed effects only, year fixed effects only, TWFE, and first differences to make aggregation dependence explicit, before testing robustness to alternative weighting, denominator choices, timing, controls, and sample composition.
1.5. Research Contributions
The paper makes three contributions. First, it reframes the digital–green nexus as a multi-level empirical problem, explicitly distinguishing system-level co-evolution, cross-city distributional evolution, and within-city conversion. Second, it makes aggregation dependence visible by applying a common-specification diagnostic across pooled, one-way fixed-effects, two-way fixed-effects, and first-difference variation; this is an inferential comparison, not a claim of a new estimator. Third, it links that comparison to multidimensional, pooled-standardized measures and common-scale spatial and distributional evidence, while subjecting the central within-city result to alternative weighting, non-GDP-normalized outcomes, lag structures, expanded controls, and sample changes. The contribution lies in clarifying what different levels of evidence do—and do not—imply about the digital–green transition.
The additional revision analyses include a balanced-panel covariance decomposition, outcome-specific regressions, formal city-group contrasts, limited interaction and spatial specifications, and sensitivity to weighting and adjustment horizons. These are descriptive extensions to the original research question, not a separate causal research design.
The remainder of the paper is organized as follows: Section 2 develops the enabling-capability and level-of-analysis framework underlying the distinction between co-evolution and conversion. Section 3 introduces the large-city sample, index construction, spatial and distributional visualization, TWFE model, robustness design, and common-specification aggregation diagnostic. Section 4 reports system-level co-evolution, distributional dynamics, within-city estimates, robustness checks, and the aggregation-dependence diagnostic. Section 5 discusses the conceptual and policy implications of the co-evolution–conversion gap, and Section 6 concludes the study.
2. Literature Review and Analytical Framework
2.1. Digitalization as an Enabling Capability and Green Development as a Realized Outcome
Digitalization can enlarge a city’s capacity to coordinate, monitor, innovate, and allocate resources without determining the environmental use of that capacity. Lower information and transaction costs can improve matching between firms, suppliers, finance, and public services [1]; digital monitoring and automation can reduce process variability and idle capacity; digital finance can ease financing constraints; and data-intensive governance can improve traffic management and environmental monitoring. These mechanisms make digitalization an enabling capability with potentially important environmental applications, but not a green outcome by definition.
Whether that capability is realized as green improvement depends on complementary institutions and production conditions. Directed technical change favors cleaner technologies when regulation, market demand, energy prices, finance, or policy incentives make clean innovation more valuable [3,4]. Environmental policy and regulation can further shape innovation responses and resource productivity [5,6]. Urban energy systems, industrial composition, pollution-control infrastructure, environmental enforcement, and green public investment can therefore condition the translation of digital capability into resource–carbon performance, pollution reduction, and ecological amenities. The same digital investment can consequently coexist with different environmental outcomes across cities and over time.
Four complementary conditions help organize the theoretical expectation: energy structure shapes the emissions cost of digital electricity demand; environmental regulation shapes incentives for cleaner production; industrial structure changes both the technologies used and the denominators of intensity indicators; and local execution capacity shapes the implementation of monitoring and environmental investment. These are competing, potentially offsetting conditions. Simultaneous national digital and environmental programs may also generate common yearly co-movement, which can coexist with heterogeneous city-level associations.
Digitalization can also create direct and indirect environmental burdens. Communication networks, computing facilities, data centers, and end-user devices require electricity and embodied materials [21], while lower digital-service costs can expand production and consumption and generate rebound effects [21]. More broadly, energy remains a fundamental input to economic activity and growth [22]. The net environmental relationship therefore reflects efficiency, scale, composition, and complementary governance effects. This theoretical ambiguity is precisely why strong system-level co-evolution should not be assumed to imply automatic city-level conversion.
2.2. From Co-Evolution to Conversion: A Level-of-Analysis Framework
The framework distinguishes three analytically separate layers. Co-evolution refers to parallel movement of digitalization and green development in the urban system over time. Conversion refers only to empirical within-city alignment: whether a city becoming more digital relative to its own history and the common annual environment is systematically associated with becoming greener. It does not denote a causally identified transformation mechanism. A co-evolution–conversion gap exists when strong system-level co-movement coexists with weak or statistically imprecise within-city alignment. The term is not intended to denote a new econometric bias; rather, it labels a substantive mismatch between progress observed at the urban-system level and the extent to which enabling digital capability is reflected in within-city sustainability outcomes.
Cross-city distributional evolution forms a second, complementary layer. A rising national mean can coexist with widening dispersion if leading cities advance faster, or with compression if lagging cities catch up. Kernel-density visualization can therefore show whether the two transitions share similar cross-city distributional paths [36]. Different dispersion trajectories demonstrate that parallel average progress is not synonymous with identical distributional evolution, but they do not by themselves establish whether within-city conversion is strong or weak; that question requires panel variation within cities.
The third layer concerns the source of variation. Pooled associations combine cross-city differences and common time movement. City fixed effects remove persistent differences between cities, whereas year fixed effects remove shocks and trends common to the sample in a given year; these are different transformations, not steps in a hierarchy of increasingly preferred estimators. TWFE absorbs both sources, and first differences provide a complementary change-on-change specification. Comparing a common specification across these structures is therefore used as an aggregation-dependence diagnostic rather than as a ranking of causal effects.
2.3. Research Questions and Analytical Sequence
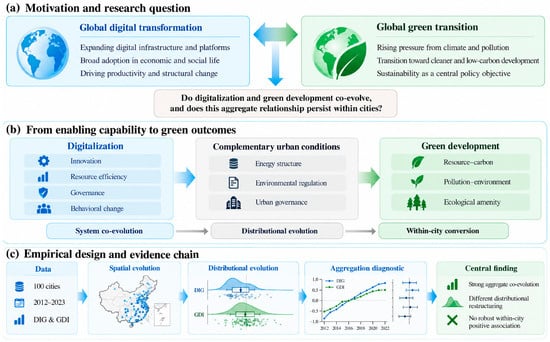
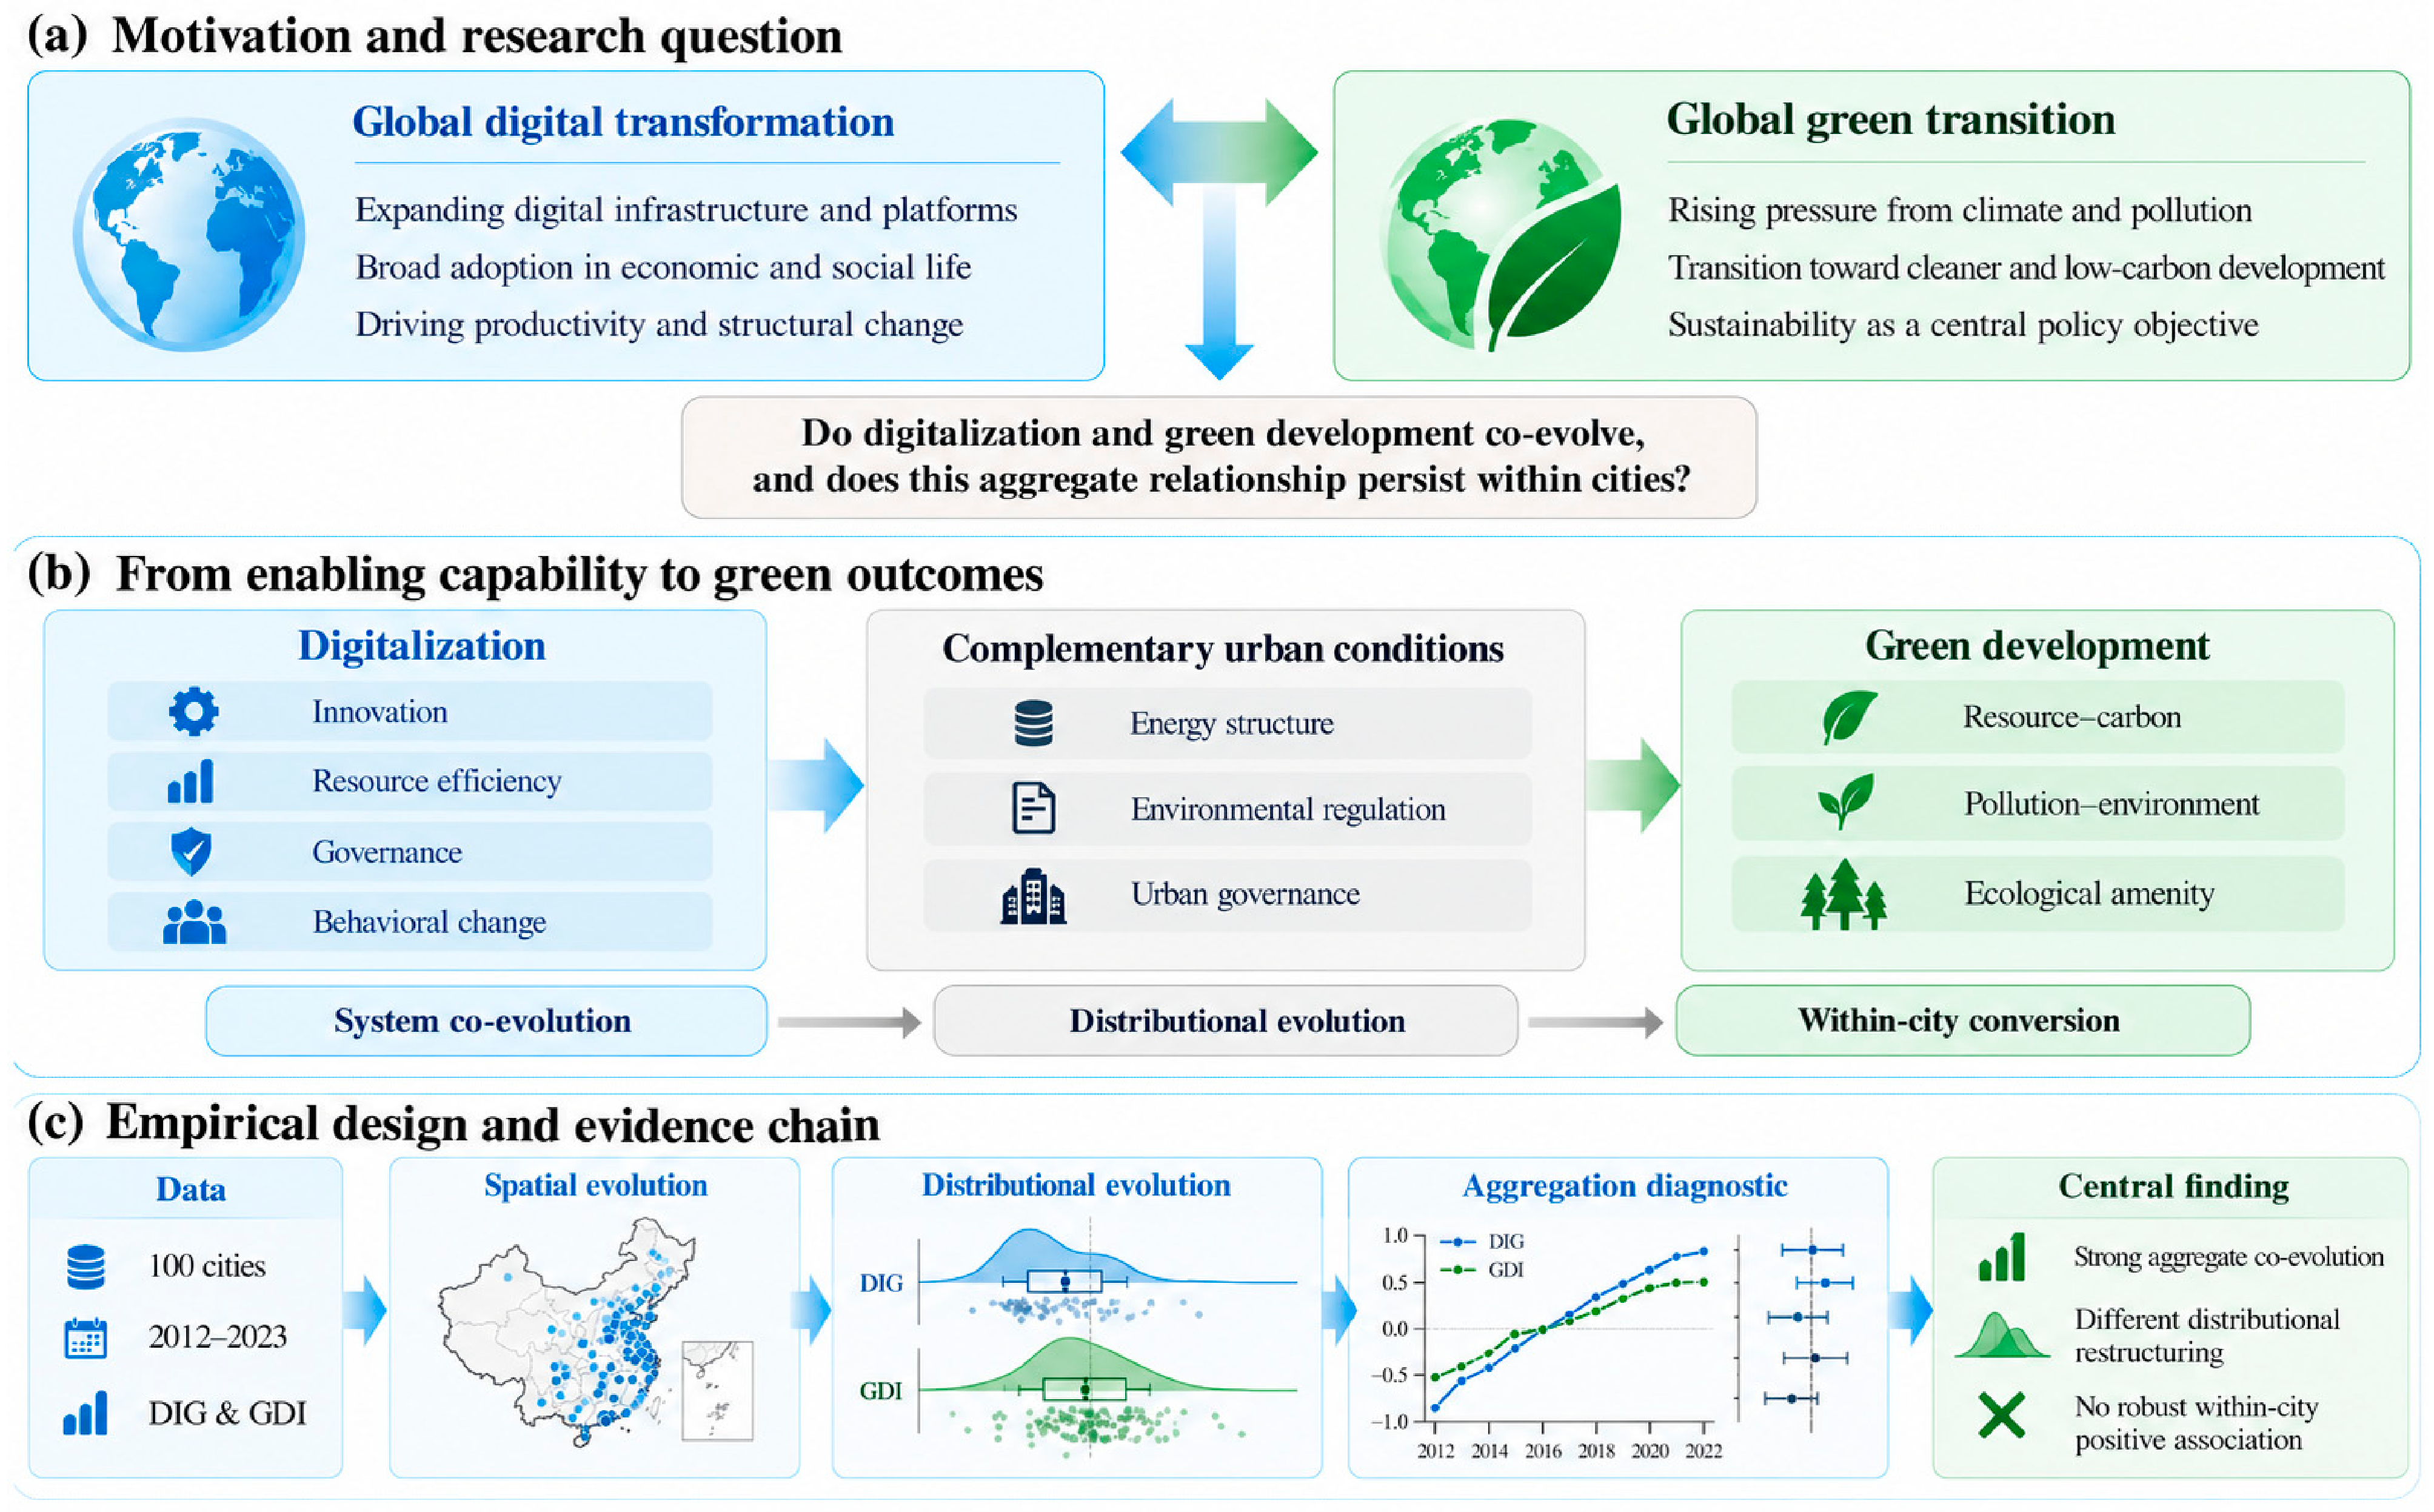
The study is organized around three research questions. RQ1 asks how digitalization and green development co-evolved across major Chinese cities between 2012 and 2023 at the system level, spatially, and across the city distribution. RQ2 asks how the estimated DIG-GDI association changes when the source of variation shifts from pooled co-movement to city-specific, year-specific, two-way fixed-effects, and first-difference variation. RQ3 asks whether the within-city pattern is sensitive to alternative index construction, GDP-normalized environmental components, timing, control sets, and sample composition. Together, these questions separate parallel progress, distributional evolution, and within-city conversion without treating any one layer as a proxy for the others. Figure 1 summarizes this conceptual logic and the corresponding empirical evidence chain.
Figure 1.
Conceptual framework and empirical evidence chain for the digital–green co-evolution–conversion gap. Note: Arrows represent hypothesized enabling or conditioning relationships rather than identified causal effects.
3. Materials and Methods
3.1. Sample Selection and Data Sources
The empirical sample is a balanced panel of 100 major Chinese cities observed annually from 2012 to 2023, yielding 1200 city-year observations. The sampling frame begins with the 105 large cities identified under the Seventh National Population Census classification [37]. Four county-level cities—Kunshan, Yiwu, Cixi, and Jinjiang—are excluded to maintain comparability in administrative rank and statistical reporting, leaving 101 prefecture-level-and-above cities. Xiangyang is further excluded because key indicators in critical years cannot be harmonized into a complete and comparable 2012–2023 sequence. The final sample therefore contains 21 mega/super-large cities, 14 type-I large cities, and 65 type-II large cities.
The focus on China’s large-city system is a deliberate decision rather than a convenience during sampling. Large cities concentrate digital infrastructure, digital finance, digital-industry employment, technological innovation, energy demand, pollution-control investment, and formal environmental-governance capacity; they are therefore the urban settings in which digital-to-green conversion is both most developed and most measurable. Long-term coverage of several digital and environmental indicators is significantly more fragmented in medium and small cities. In addition, ratio-based outcomes such as energy, carbon, and pollution intensity can be disproportionately sensitive to discrete plant entry or exit, large projects, administrative boundary changes, and reporting discontinuities when the underlying economic base is small. Mechanically expanding the panel would therefore require substantially heavier interpolation and harmonization and could reduce longitudinal comparability. Medium and small cities remain substantively important, but they require a research design tailored to their data structure; the intended population of inference here is China’s large-city system rather than all Chinese cities.
The analytical panel matches city-year measures from statistical yearbooks, the Peking University Digital Financial Inclusion Index, patent and telecommunications records, and precompiled municipal environmental datasets. Archived source records link the city-level CO2 series to EDGAR_2024_GHG [38] and the annual PM2.5 series to CHAP [39]. We use these existing municipal series rather than performing a new extraction from raw emissions or air-quality rasters. The source dictionary describes energy and carbon intensities relative to 2012-constant-price municipal GDP. Because some upstream geographic allocation and historical industrial-pollutant denominator conventions are incompletely documented, we also evaluate a restricted environmental outcome excluding the intensity variables and discuss the remaining measurement limitations in Section 5.3. The balanced 100-city analytical panel contains complete values for the core variables across 1200 city-year observations; this completeness does not establish how all earlier missing values were handled by source compilers.
3.2. Construction of Digitalization and Green Development Indices
The main explanatory variable is a multidimensional digitalization index. Continuous component indicators are winsorized at the first and 99th percentiles. Highly skewed measures—real per capita telecommunications business, digital-industry employment density, and digital-technology invention patents—are transformed using ln(1 + x) before pooled standardization. Digital infrastructure combines broadband penetration and computing infrastructure; digital application combines real per capita telecommunications business and digital financial inclusion; and digital capability combines digital-industry employment density and digital-technology invention patents per 10,000 residents. Indicators are equally weighted within each dimension, the three dimensions are equally weighted, and the final aggregate is standardized across the pooled sample.
Green development is constructed analogously. Resource–carbon performance combines energy intensity and carbon-emission intensity, both reverse-coded after winsorization and pooled standardization. Pollution–environmental quality combines sulfur-dioxide intensity, industrial-wastewater intensity, smoke/dust intensity, and annual PM2.5 concentration, also reverse-coded. Ecological amenities combine built-up-area greening coverage and park green space per capita. The three dimension scores are standardized, equally weighted, and re-standardized to form GDI. Higher values of DIG and GDI therefore indicate greater digitalization and better comprehensive green performance, respectively. Equal weighting is the preferred transparent aggregation rule; robustness checks additionally use PCA-based DIG and GDI measures. For GDI, the first principal component of the three standardized dimensions explains 46.7% of dimension-level variance and correlates 0.991 with the equal-weight index; the corresponding PCA-based DIG correlation is 0.9997. Table 1 summarizes the component structure and transformations, and Table A3 summarizes selected alternative-index estimates.
Table 1.
Construction of the digitalization and green development indices.
The reported indicator structure shares no identical measured component across DIG and GDI. Across 48 cross-index component pairs, the largest absolute pooled correlation is 0.706, compared with 0.422 after two-way demeaning; empirical correlation does not imply a duplicated indicator definition. The source dictionary classifies both the resource–carbon components (2/2) and three pollution–environmental components (3/4) as economic-output intensities, while the ecological-amenities component (0/2) is GDP normalized. These component counts are not effective index weights and do not independently establish upstream denominator formulas. A restricted air-quality/amenity outcome excluding the intensity components is used as a sensitivity check.
Table 2 reports descriptive statistics for the standardized indices and baseline controls. The preferred Core4 set comprises real GDP per capita, built-up urban population density, openness, and government intervention. Industrial upgrading and financial deepening are excluded from the primary Core4 model because both may themselves respond to digitalization and absorb part of the transition pathway; they are potential additional controls rather than defining components of the benchmark specification.
Table 2.
Descriptive statistics on reported unlogged scales (except standardized indices).
Table 2 displays GDP per capita and population density on unlogged source-declared scales. Openness and government intervention are presented as percentages in Table 2, whereas regression models use their underlying ratios (not percentage-point units). Small strictly positive values are shown with enough precision to avoid false zeros. Zero means for DIG and GDI arise from pooled standardization rather than physical absence. The underlying digital-component records also contain zero computing-node and patent measures; excluding observations in which either recorded a zero leaves the benchmark conclusion unchanged (DIG coefficient −0.180, p = 0.157, N = 1183).
3.3. Spatial Mapping and Distributional Visualization
Spatial evolution is displayed for 2012, 2018, and 2023. The 100 analytical-sample cities are plotted at fixed coordinates, and DIG and GDI each use one common color scale across the three benchmark years. This permits direct comparison of level changes rather than within-year re-ranking. The geographic backdrop uses China standard administrative-boundary data approved as GS(2024)0650, including the standard national boundary and South China Sea inset; analytical values are shown only for the 100 sample cities.
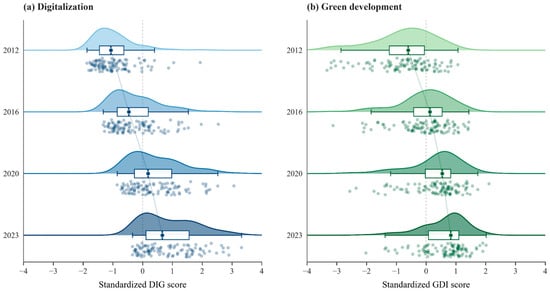
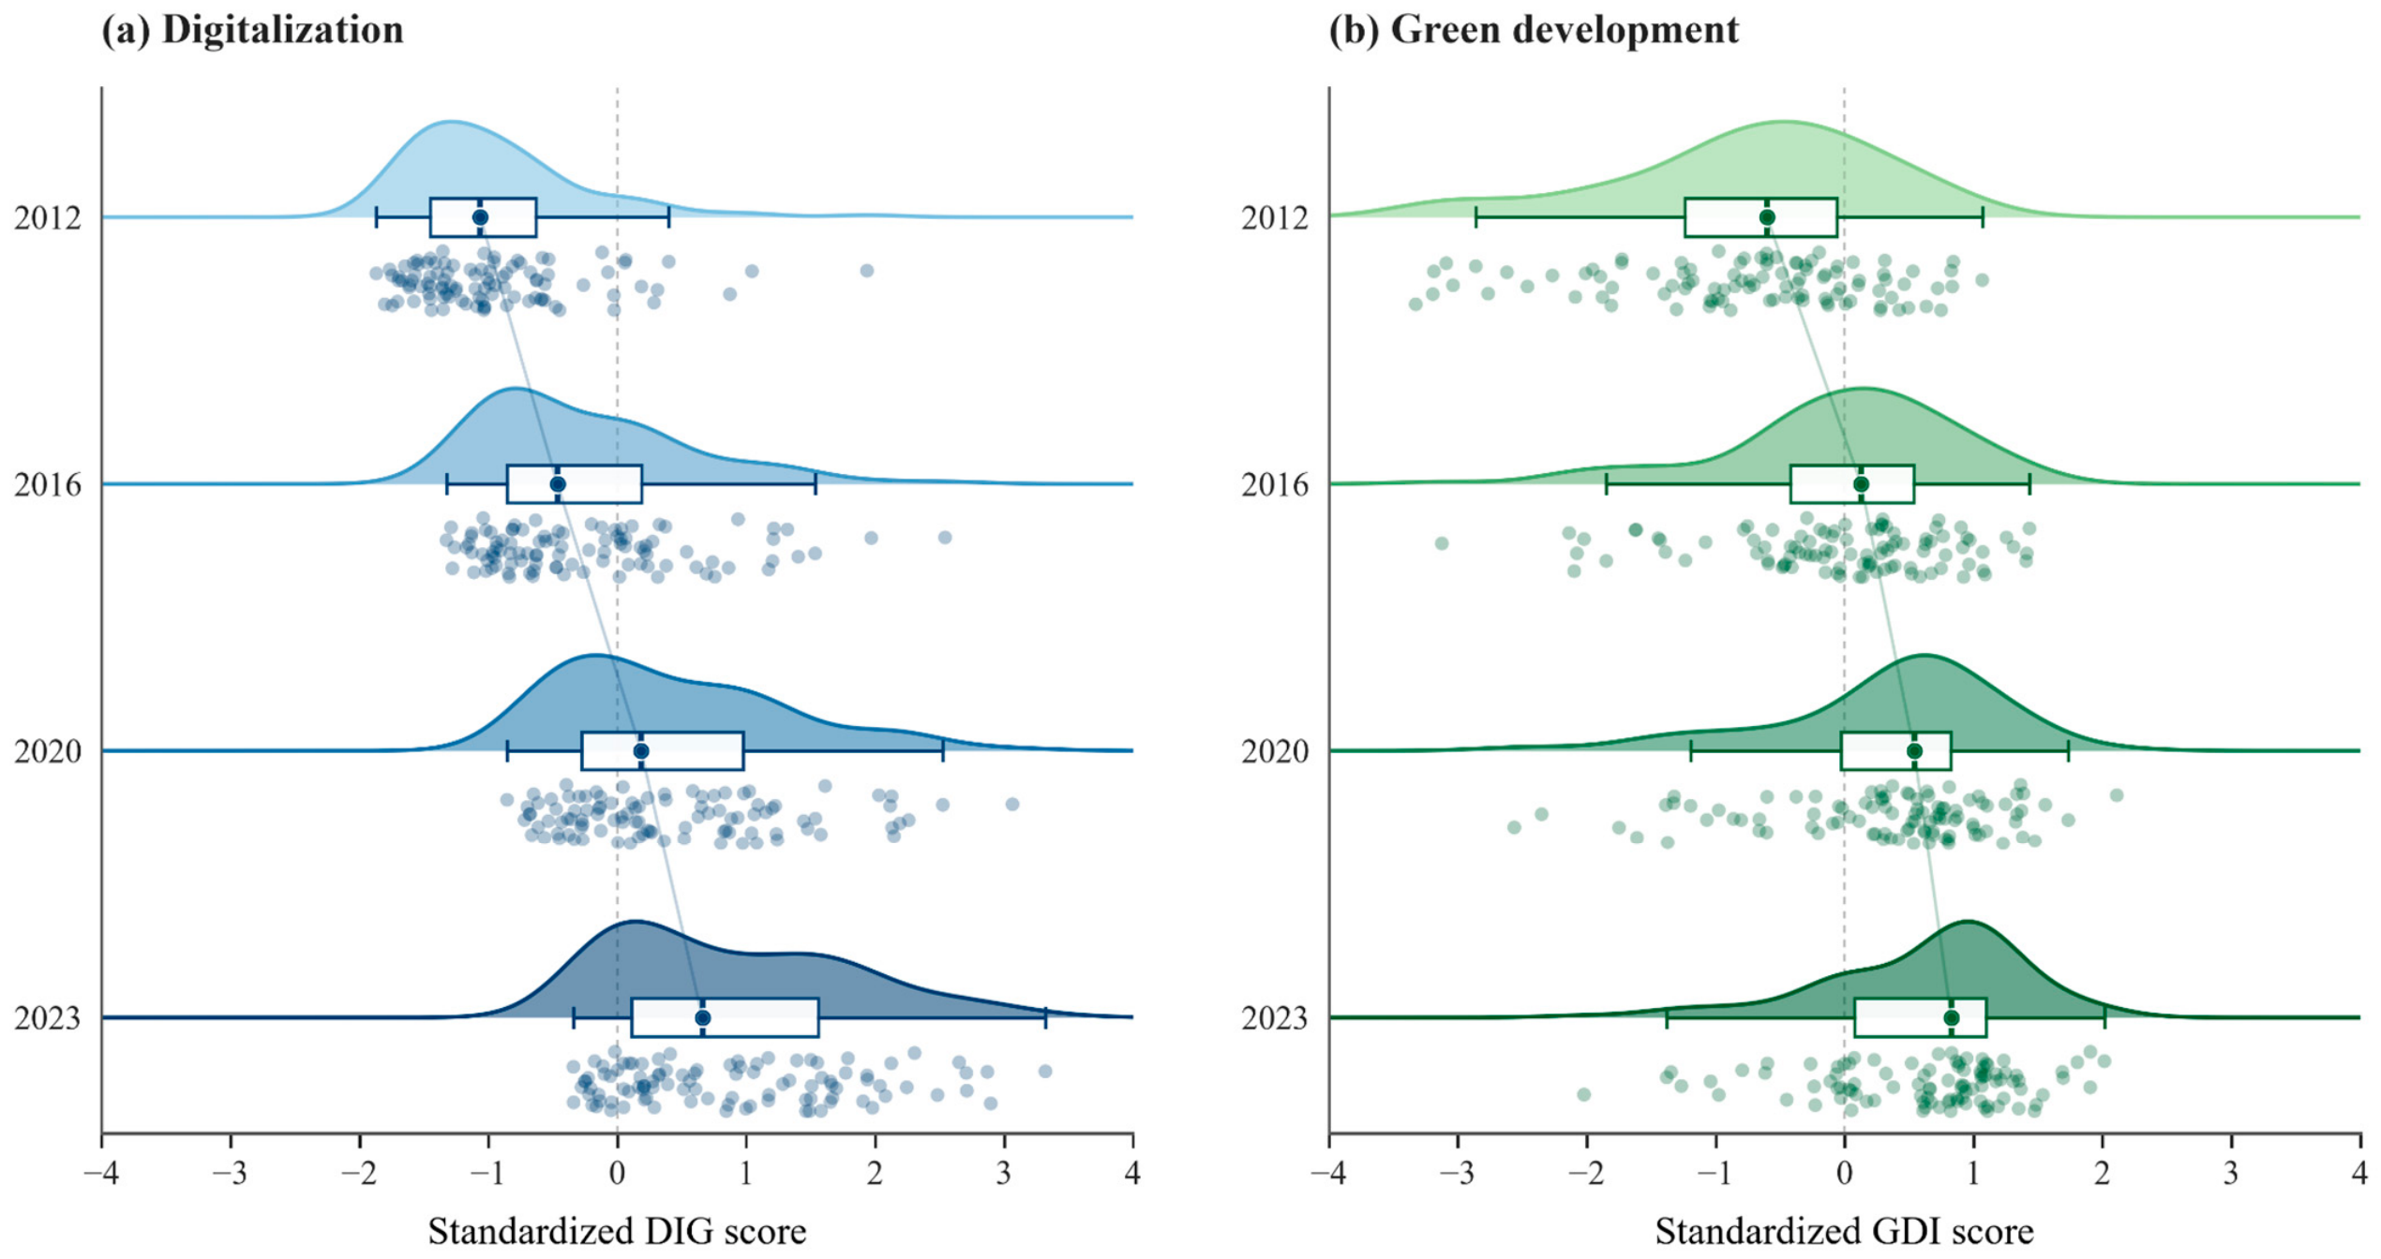
To characterize distributional dynamics beyond the mean, we uses horizontal raincloud plots for 2012, 2016, 2020, and 2023. Each raincloud combines a Gaussian kernel-density envelope, a compact boxplot, and the 100 underlying city observations. The kernel-density component is used only as a descriptive smoothing layer, while the boxplots and raw observations preserve the empirical annual distributions [36]. The Gaussian estimator used for the density envelope is written as Equation (1):
In Equation (1), K is the Gaussian kernel, n = 100, and h denotes the bandwidth. For each index, h is fixed across years and selected once from the pooled 1200 city-year observations using Scott’s rule. Because pooled DIG and GDI are standardized to unit variance, the resulting bandwidth is approximately 0.2422 for both indices; the same bandwidth is then used for every selected year. Because the raw city observations and boxplots are displayed alongside the density envelope, the substantive interpretation does not depend on the smoothed curve alone. The rainclouds are descriptive visualizations rather than formal convergence club or polarization tests.
3.4. Two-Way Fixed Effects and Robustness Design
The benchmark specification estimates the within-city association between digitalization and green development using city and year fixed effects. The model is written as Equation (2):
GDIit = α + βDIGit + γ′Xit + μi + λt + εit
In Equation (2), μi and λt denote city and year fixed effects. Xit contains log real GDP per capita, log urban population density, openness, and government intervention in the preferred Core4 specification. Standard errors are clustered at the city level to allow arbitrary within-city serial correlation and heteroskedasticity [40]. The coefficient β is interpreted as a conditional within-city association rather than a fully identified causal effect.
Robustness checks timing, weighting, common denominators, trends, spatial associations, alternative inference assumptions, and sample composition. The reported specifications include one-year-lagged DIG; PCA- and pooled entropy-weighted DIG and GDI; a restricted air-quality/amenity outcome excluding the economic-output intensity fields; city-specific linear trends and region-by-year fixed effects; and an estimate excluding four municipalities. Province-clustered and finite-bandwidth spatial–temporal covariance estimates assess inference sensitivity, while city/year fixed-effects SLX specifications examine local and neighboring digitalization conditional on local and spatially lagged controls. First differences relate annual changes in GDI to changes in DIG and Core4 controls with year effects. The principal results are reported in the results section, and selected measurement, timing, and trend checks are visualized; none of these specifications identifies a causal relationship.
The first-difference robustness specification is written as Equation (3):
ΔGDIit = βΔDIGit + γ′ΔXit + λt+Δεit
In Equation (3), Δ denotes the first-difference operator, λt captures common year effects in the differenced specification, and the remaining terms retain the definitions used in Equation (2).
3.5. Common-Specification Aggregation Diagnostic
To diagnose how the apparent digital–green relationship depends on the source of variation, we estimate a common Core4 specification under five analytical structures: pooled OLS, city fixed effects only, year fixed effects only, city-and-year fixed effects, and first differences with year fixed effects. City-clustered standard errors are used throughout. The pooled model combines cross-sectional and temporal variation; city FEs remove persistent cross-city differences; year FEs remove common annual variation; TWFE absorbs both; and first differences relate annual changes in DIG and GDI after differencing the Core4 controls. The one-way FE specifications remove different sources of covariance and are not interpreted as an ordered estimator hierarchy. The comparison is diagnostic rather than causal.
3.6. Additional Diagnostics, Urban Conditions, and Identification Limits
To assess the stability of the annual-mean correlation based on 12 observations, we examine separate six-year windows, leave-one-year-out windows, linearly detrended annual means, and annual changes. For a balanced panel, pooled DIG–GDI covariance is decomposed exactly into between-city, common-year, and two-way residual covariance. These accounting shares are not policy-effect contributions. We also estimate separate TWFE specifications for the three GDI dimensions, compare East with Central/West and 21 mega/super-large cities with 79 other large cities, and test predeclared interaction terms with one-year-lagged policy attention, industrial upgrading, and industrial electricity share. The latter proxies are not direct measures of environmental enforcement or a fuel/coal mix. The initial-GDP and digital-infrastructure interaction checks are summarized in Table A3; the quadratic DIG check discussed in Section 4.5 is also exploratory.
Further sensitivity checks use fixed two-level entropy-weight alternatives, city-specific linear trends, region-by-year effects, province-clustered uncertainty, and four-/eight-neighbor SLX specifications, including local and neighboring controls. Timing checks include one-year-lagged DIG and an early-versus-late three-year-average change comparison. The preferred TWFE model has no exogenous policy shock or valid instrument; contemporaneous local policies, reverse causality, heterogeneous trends, and measurement error may confound all conditional estimates. Accordingly, neither a lagged variable nor a spatially lagged covariate is interpreted as a causal mechanism or spillover. The one-year DIG lag provides a parsimonious short-horizon check on the 2013–2023 sample; the early-to-late three-year-average comparison examines a longer adjustment window.
4. Results
4.1. Aggregate Co-Evolution and Distributional Divergence
Both systems advance substantially over the sample period. The mean DIG increases by 1.846 pooled standard deviations between 2012 and 2023, while the mean GDI increases by 1.360 pooled standard deviations. Because both indices are standardized over the full 2012–2023 panel, the 2012 annual means (−0.965 for DIG and −0.743 for GDI) indicate positions below the full-period mean rather than negative levels of digitalization or green development. By 2023, the corresponding annual means reach 0.881 and 0.617. The cross-sectional dispersions move in opposite directions: the standard deviation of DIG rises from 0.667 to 0.908, whereas that of GDI declines from 1.016 to 0.771. Parallel progress in average levels is therefore accompanied by divergent cross-city distributional dynamics.
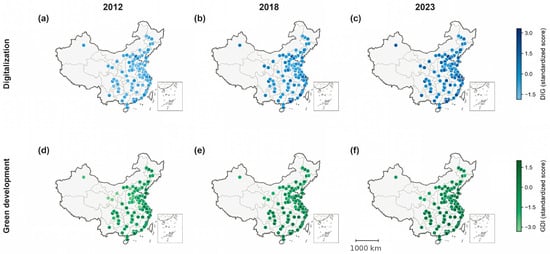
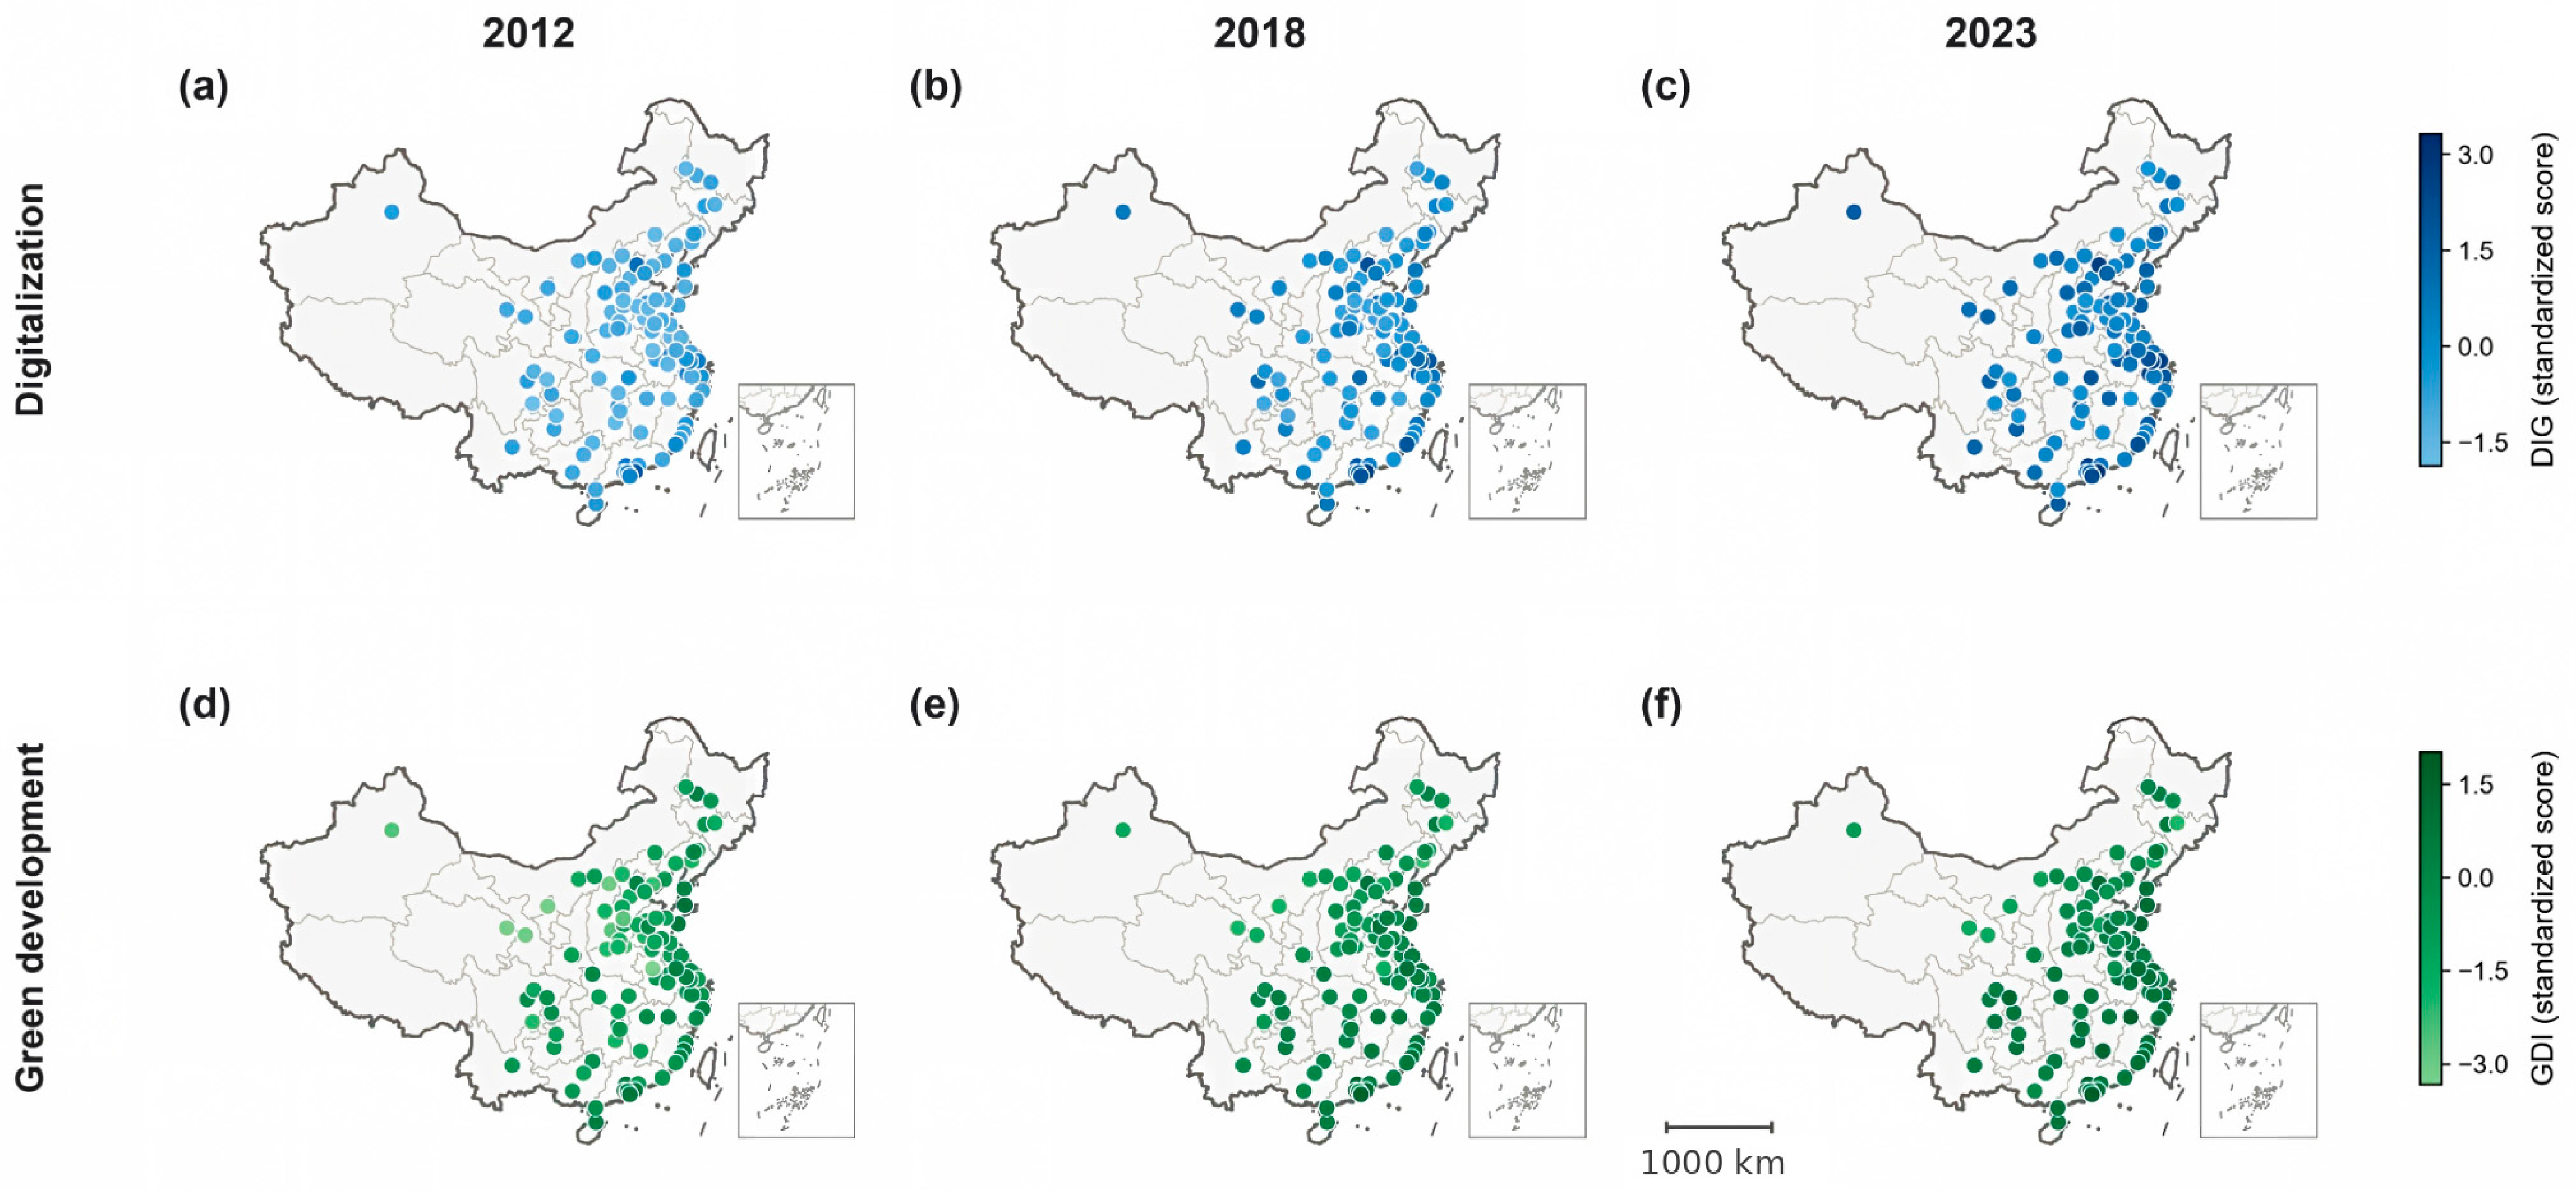
Figure 2 brings the two spatial trajectories into a common 2 × 3 layout. The top row reports DIG and the bottom row reports GDI for 2012, 2018, and 2023, with a fixed scale within each index. The map shows broad upward movement in both systems across the large-city network, but the spatial pattern of green development is not a mirror image of digitalization. The maps therefore document parallel spatial advancement rather than causal mapping from digital gains to green gains.
Figure 2.
Spatial co-evolution of digitalization and green development in major Chinese cities, 2012–2023: (a) DIG in 2012; (b) DIG in 2018; (c) DIG in 2023; (d) GDI in 2012; (e) GDI in 2018; and (f) GDI in 2023. Note: Ministry of Natural Resources standard-map service, approval no. GS(2024)0650. Analytical values are authors’ calculations for the 100-city sample.
These movements occurred during overlapping national digital-infrastructure expansion and environmental-transition initiatives. They are consistent with uneven diffusion of broadband, digital finance, and digital capability alongside more compressed composite green scores, but the present index trajectories do not identify which national policy explains either change. Regional trends and selected city profiles provide descriptive context rather than causal case evidence.
Figure 3 compares the selected-year cross-city distributions using raincloud plots. For DIG, the distribution shifts steadily to the right and spreads out: the annual standard deviation rises from 0.667 in 2012 to 0.908 in 2023. GDI also shifts right, but its distribution becomes more concentrated, with the standard deviation falling from 1.016 to 0.771. The raw city points, boxplots, and density envelopes therefore show that the two systems improve while undergoing different forms of distributional restructuring. This divergence is descriptive and should not by itself be interpreted as evidence of weak within-city conversion.
Figure 3.
Distributional evolution of digitalization and green development in selected years. Note: Raincloud plots combine density envelopes, boxplots, and city-level observations for 2012, 2016, 2020, and 2023; DIG and GDI are standardized over the pooled 2012–2023 sample. The fixed sample includes East (50 cities), Central (20), West (20), and Northeast (10). Blue represents digitalization (DIG), while green represents green development (GDI). Shaded areas indicate kernel density estimates. The vertical dashed lines mark the zero reference, and the thin gray lines connect the annual mean markers.
At the aggregate level, the two upward trajectories nevertheless move closely together. Across the 12 annual observations, the correlation between the mean DIG and mean GDI is 0.991. This strong descriptive co-movement motivates the stricter panel question examined next: does the apparent linkage persist when common national time movement and stable city differences are removed? This high annual-mean correlation should therefore be interpreted as evidence of shared aggregate movement rather than as an estimate of a structural digital–green relationship.
The correlation of the 12 annual sample means is 0.991. It remains 0.971 for 2012–2017 and 0.992 for 2018–2023, with leave-one-year-out estimates between approximately 0.989 and 0.997. However, it drops to 0.517 after separate linear detrending and to 0.130 for changes in annual means. An exact covariance decomposition attributes 48.04% of pooled DIG–GDI covariance to persistent city differences, 51.67% to common-year variation, and 0.30% to the two-way residual covariance. These are statistical shares, not identified contributions of government programs (Table A1).
4.2. Within-City Conversion: Baseline TWFE Evidence
Table 3 places the five diagnostic specifications under the same Core4 definitions and displays their DIG coefficients, clustered standard errors, confidence intervals, p-values, and samples in one location. The positive pooled slope (0.510) falls to 0.249 under city fixed effects and to 0.038 under year fixed effects alone. With both city and year effects, the estimate is −0.181 (SE 0.125, p = 0.150); the first-difference estimate is −0.060 (p = 0.476). These models remove different sources of variation; they are not a hierarchy of increasingly credible causal estimators. The benchmark does not identify a robust positive average within-city association, but its negative point estimate is also insufficient evidence of environmental harm.
Table 3.
Unified five-specification comparison of the DIG–GDI association.
The distinction is substantive. A pooled description answers whether more digital observations tend to coincide with greener observations; TWFE asks whether a city becoming more digital relative to its own history and to the common annual movement is systematically associated with becoming greener. The preferred estimate is negative but statistically imprecise, so the evidence supports neither a robust positive digital–green dividend nor a statistically established negative average effect.
4.3. Robustness of the Within-City Conversion Gap
Table 4 presents the main checks for measurement, timing, heterogeneous trends, neighboring-city covariates, and alternative inference assumptions. The benchmark TWFE estimate remains statistically imprecise under city clustering, and PCA-based alternatives, the restricted air-quality/amenity outcome, and sampled-city SLX neighbor terms do not reveal a stable positive average within-city association. An entropy-weighted DIG measure yields a negative estimate (−0.240, p = 0.042), while the finite-bandwidth spatial covariance specification produces a negative confidence interval excluding zero. We report these differences as sensitivity to index construction and dependence assumptions, rather than evidence of a causal environmental loss from digitalization.
Table 4.
Robustness checks for the within-city DIG-GDI association.
4.4. Aggregation Dependence and Evidence Synthesis
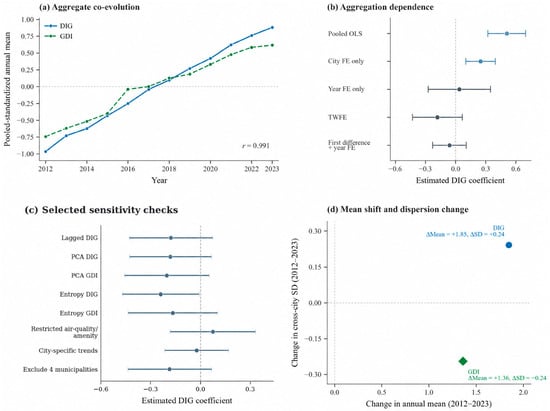
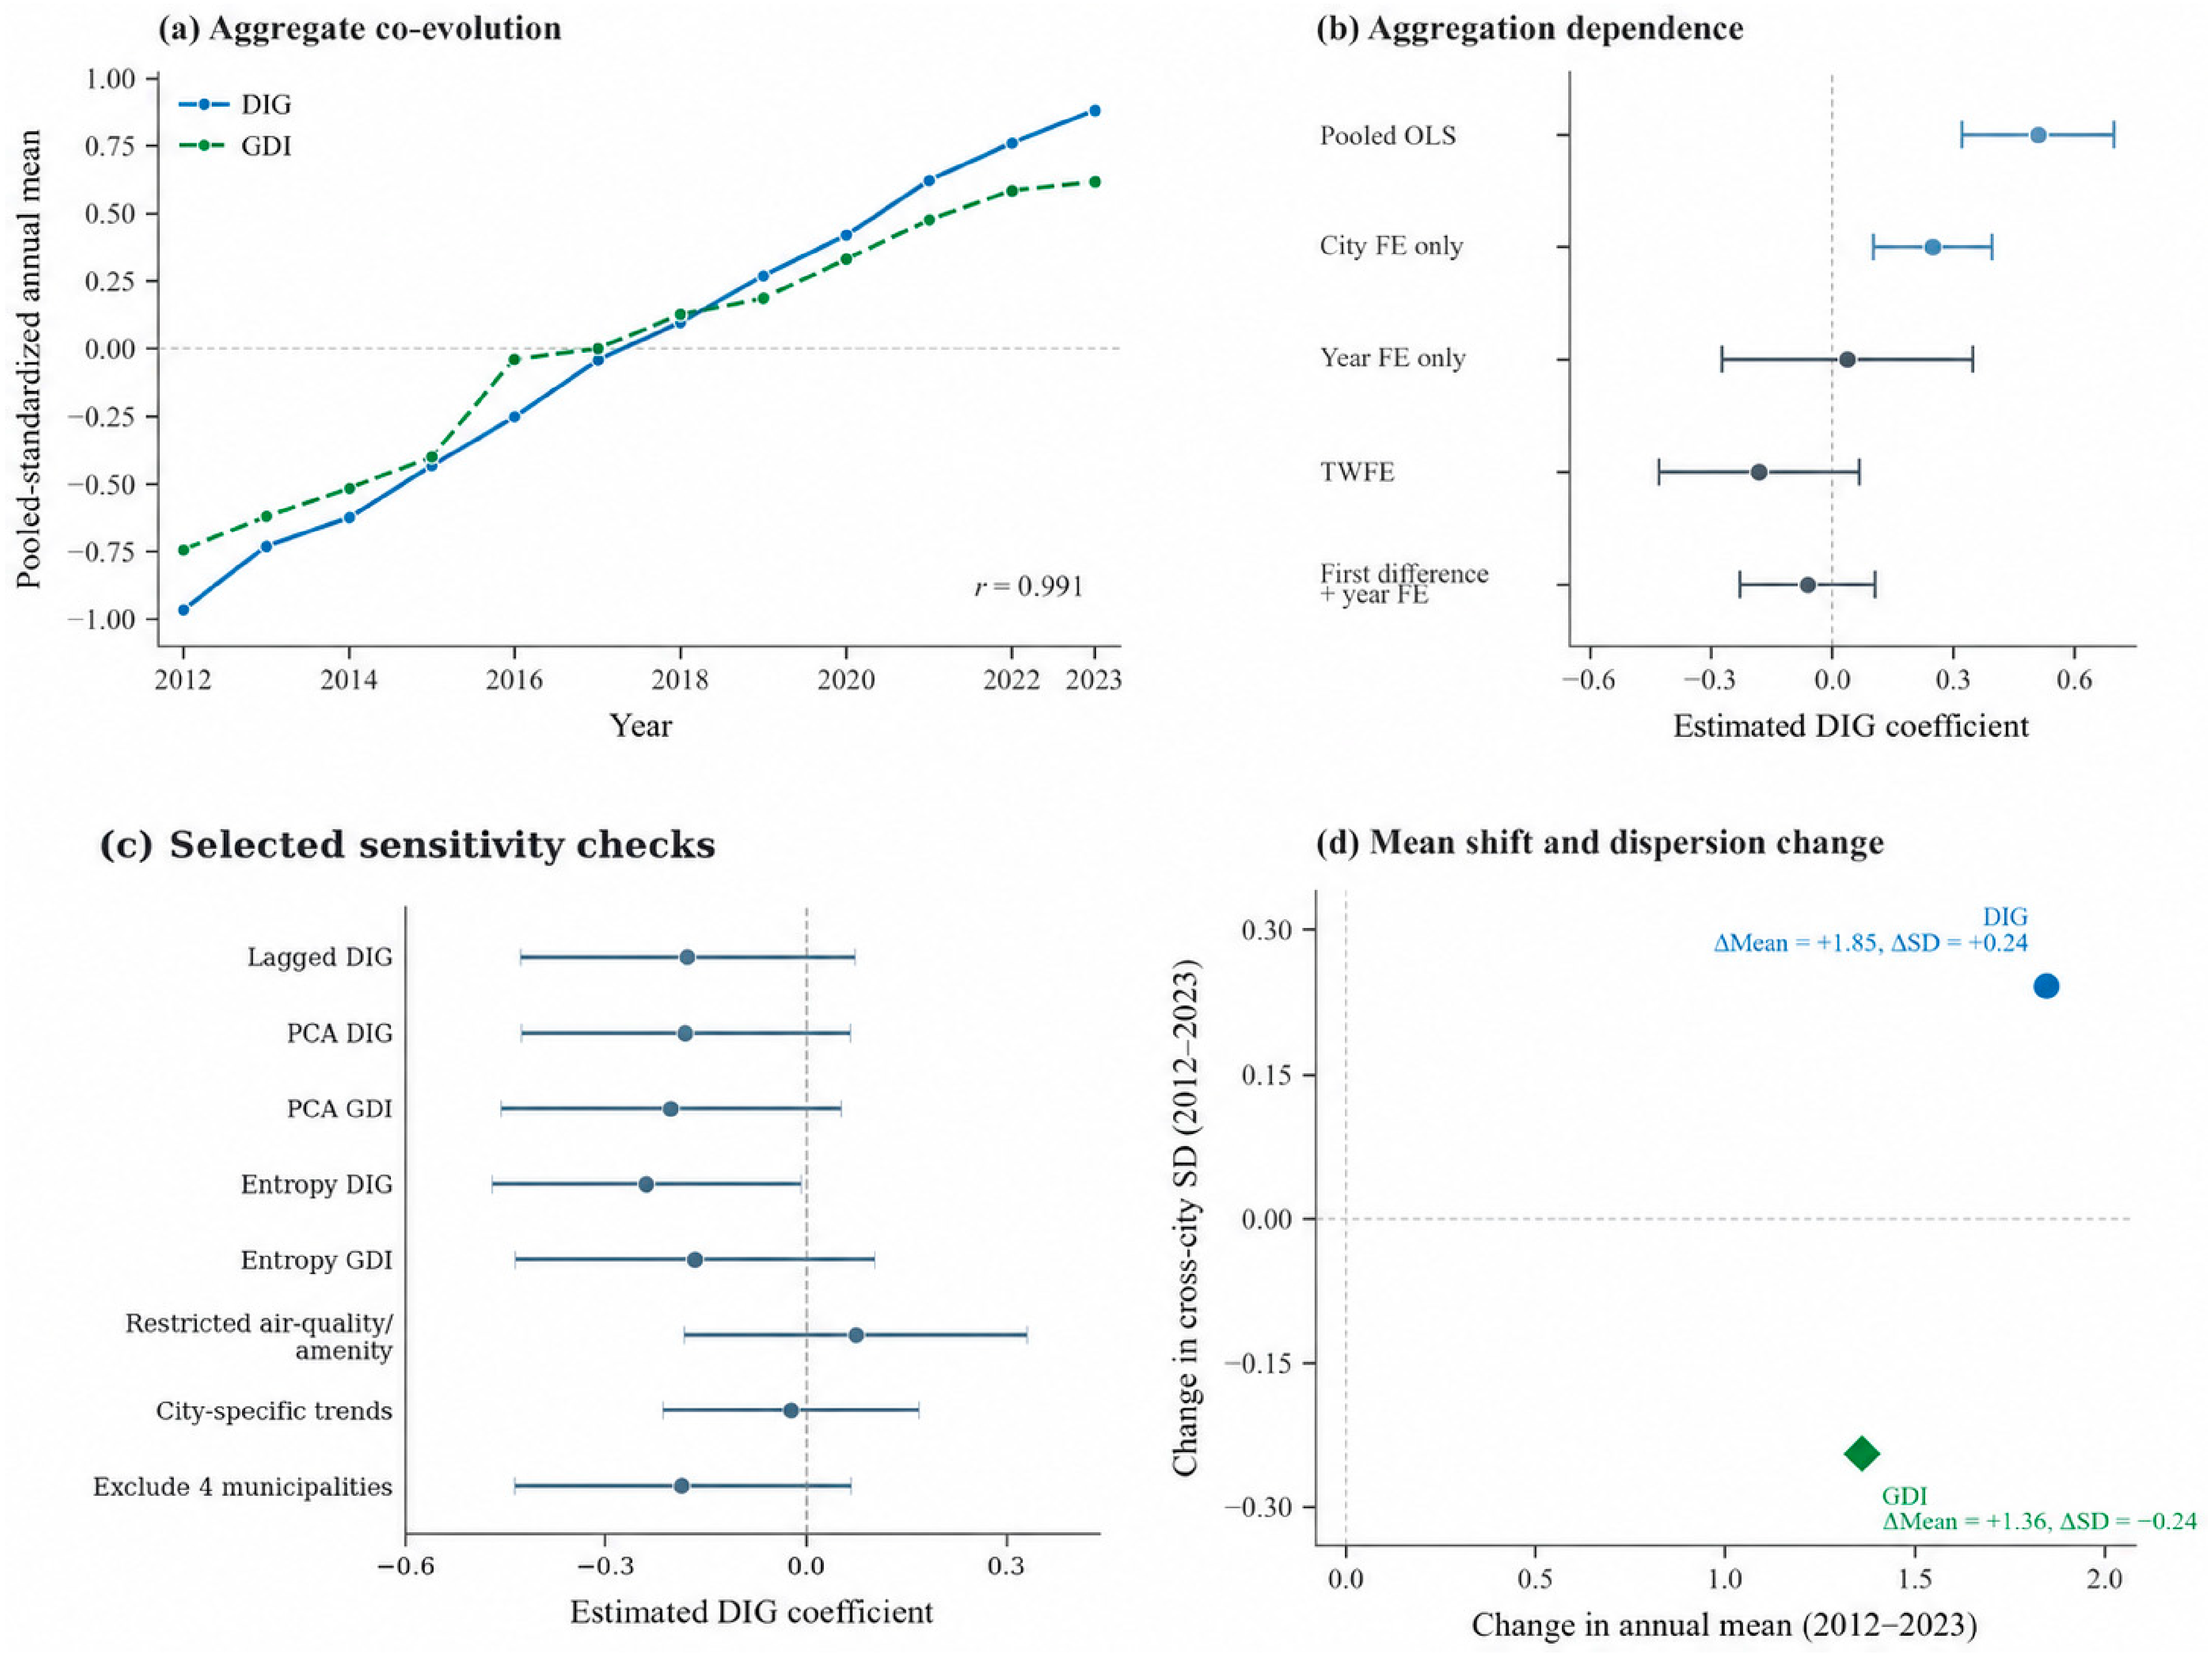
Figure 4 synthesizes the paper’s core evidence in four panels. Panel (a) displays the 2012–2023 annual mean trajectories, whose correlation is 0.991. Panel (b) then holds the Core4 conditioning set fixed while changing the source of variation. The pooled estimate is 0.510 (p < 0.001); with city fixed effects only, it falls to 0.249 (p = 0.001), while with year fixed effects only it falls much more sharply to 0.038 (p = 0.813). This contrast is consistent with common annual movement accounting for a substantial share of the pooled association, without treating the specifications as a causal ranking.
Figure 4.
Aggregate co-evolution, aggregation dependence, robustness, and distributional restructuring of the digital–green relationship. Note: Panel (a) shows the annual mean DIG and GDI scores from 2012 to 2023. Panels (b,c) show 95% confidence intervals. The specifications are diagnostic and are not interpreted as a causal estimator hierarchy. Panel (c) displays a selected subset of Table 4 checks; the remaining estimates are reported in Table 4. Panel (d) shows changes in the annual mean and cross-city standard deviation of DIG and GDI between 2012 and 2023. In panel (b), blue indicates statistically significant positive estimates, whereas gray indicates estimates that are not statistically significant at the 5% level.
Once persistent city differences and common annual variation are jointly absorbed, the TWFE coefficient is −0.181 (95% CI [−0.429, 0.067], p = 0.150), and the first-difference estimate is −0.060 (p = 0.476). Panel (c) shows eight selected Table 4 estimates—including lagged DIG, PCA and entropy alternatives, the restricted outcome, city-specific trends, and municipality exclusion—with their reported 95% confidence intervals. The full set of spatial and covariance specifications is reported in Table 4. These tests do not establish a consistent positive within-city association, and their different inferential assumptions should not be conflated.
Panel (d) completes the evidence chain by contrasting changes in the mean and cross-city standard deviation from 2012 to 2023. DIG moves to the upper-right quadrant (mean +1.846; SD +0.241), whereas GDI moves to the lower-right quadrant (mean +1.360; SD −0.245). Thus, strong aggregate co-evolution coexists with different distributional restructuring and weak within-city alignment. This level dependence is the empirical basis for the co-evolution–conversion gap developed in Section 5.
4.5. Green Outcomes, City Heterogeneity, and Spatial Sensitivity
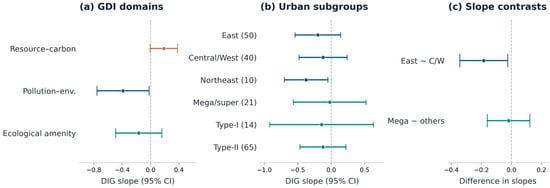
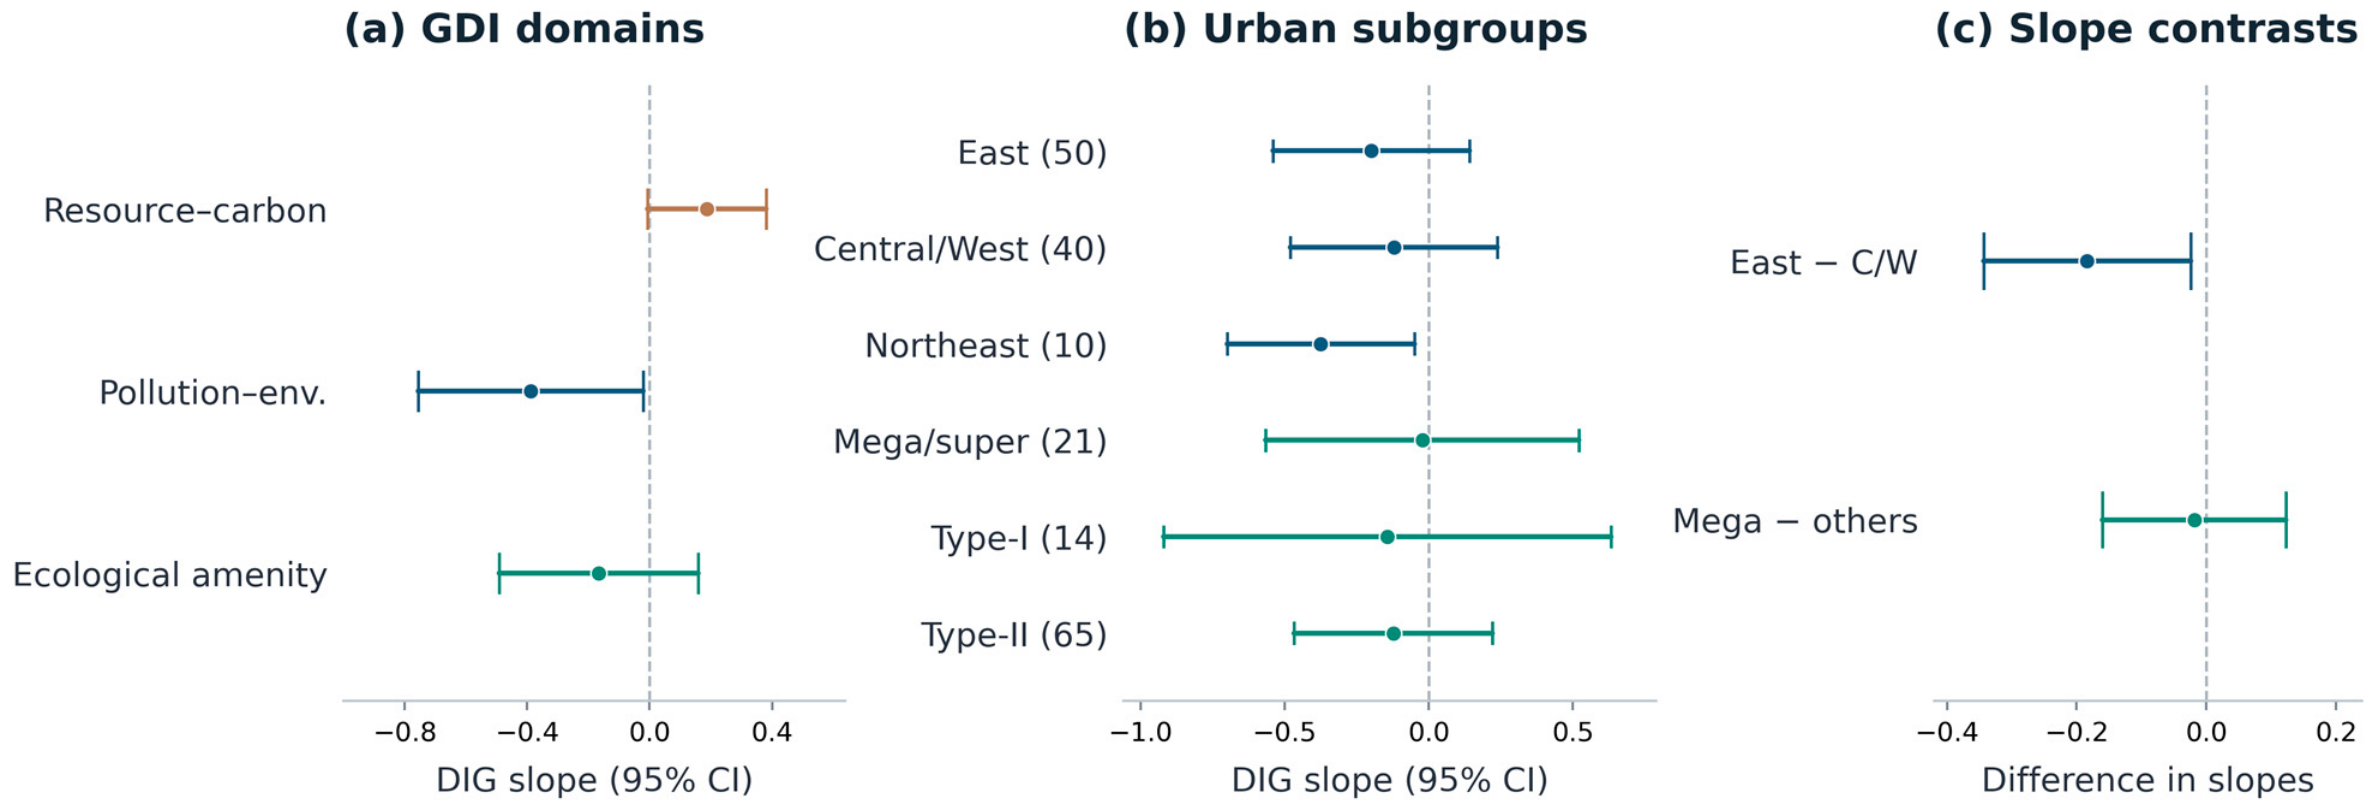
Table 5 and Figure 5 examine whether a single composite coefficient conceals different conditional associations. Under TWFE, the resource–carbon, pollution–environmental-quality, and ecological-amenities slopes are 0.187 (p = 0.059), −0.389 (p = 0.038), and −0.166 (p = 0.314), respectively. No individual dimension survives the three-outcome Holm correction, but the resource–carbon minus pollution difference is 0.575 (Holm-adjusted p = 0.029). The formal East-minus-Central/West slope contrast is −0.184 (Holm p = 0.049), whereas the city-size contrast is imprecise (p = 0.798). Separately fitted Northeast estimates rely on only ten cities and are treated as exploratory. These are differences in conditional estimates, not demonstrated differential causal effects.
Table 5.
Green dimensions, group contrasts, and observed-condition interactions.
Figure 5.
TWFE associations by green development dimension, separately fitted city groups, and formal group–slope contrasts. Note: Panels show 95% city-clustered intervals; contrasts and pointwise intervals are distinct inferential objects.
Interactions with the lagged city conditions do not provide evidence that any observed proxy reliably narrows the co-evolution–conversion gap. Industrial upgrading interacts negatively with DIG (−0.059; Holm p = 0.024), contrary to a uniformly favorable industrial-transition prediction; interactions with green policy attention and industrial electricity share are imprecise. Initial city GDP per capita and initial digital-infrastructure comparisons likewise do not yield robust interactions after the two-test Holm correction (adjusted p = 0.179 in both cases). The quadratic DIG term is negative (−0.065, p = 0.010), but the evaluated marginal-slope confidence intervals include zero; this exploratory curvature does not identify a reliable threshold or policy optimum. These findings cannot establish the effects of regulatory enforcement, fuel mix, or implementation capacity.
The spatial extension includes both local and neighboring DIG plus local and neighboring Core4 controls under city and year effects. Neighboring DIG estimates are 0.037 (p = 0.868) for a four-neighbor graph and −0.213 (p = 0.521) for eight neighbors. The geographic network covers only the 100 sampled large cities, and some long-distance nearest-neighbor links reflect that incomplete coverage; the analysis neither identifies causal spatial spillovers nor quantifies the spatial contribution to national co-evolution. A one-year DIG lag (−0.179, p = 0.160) and an early-to-late change estimate (−0.261, p = 0.159) are also inconclusive about adjustment speed.
Three descriptive city trajectories make this distinction concrete. Between the 2012–2014 and 2021–2023 averages, Liaocheng’s DIG increased by 1.167 standardized units while its composite GDI fell by 0.504; Huizhou’s DIG and GDI rose by 1.494 and 1.085; and Huainan’s rose by 1.361 and 2.006. Individual pollutant, resource, and amenity indicators may still move in opposite directions within a city. These examples describe observed profiles rather than identify local policy mechanisms (Table A3).
5. Discussion
5.1. The Co-Evolution–Conversion Gap
The central finding is the level-dependent contrast between strong descriptive system-level co-evolution and weak within-city alignment. The estimand changes substantively as the level of analysis changes: pooled models combine cross-city differences and common temporal co-movement, whereas TWFE and first differences isolate narrower forms of within-city variation. The annual means of DIG and GDI co-move closely, the pooled association is positive, and both systems improve substantially. Yet the association contracts sharply when common annual variation is removed and remains statistically imprecise under TWFE and first differences. The raw pooled DIG–GDI correlation is around 0.511, whereas the correlation between two-way-demeaned DIG and GDI is only around 0.025. In the terminology used here, conversion denotes this residual within-city alignment rather than a causally identified mechanism; the evidence therefore points to strong aggregation dependence in the observed digital–green relationship.
This pattern is compatible with a setting in which national technological diffusion, macroeconomic development, digital infrastructure programs, environmental regulation, clean-energy investment, and other common forces raise both systems during the same period. Such shared movement can generate strong system-level co-movement without implying that marginal digital progress within a particular city is sufficient to produce comprehensive green improvement. The present design does not identify which common force dominates, nor does it establish that digitalization has no environmental effect. It shows instead that parallel progress and within-city conversion are distinct empirical propositions.
The distributional evidence is complementary rather than proof of the conversion gap. Digitalization becomes more dispersed across cities while comprehensive green performance becomes more concentrated. Figure 3 makes this contrast visible in the selected-year distributions, while Figure 4d summarizes it as a change in cross-city standard deviation. This divergence shows that the two systems do not share the same distributional trajectory even though their means rise together. It should not be interpreted by itself as evidence that within-city conversion is weak; that conclusion rests on the panel specifications in Section 4.2, Section 4.3 and Section 4.4.
5.2. Implications for Digital-Green Transition Research
The co-evolution–conversion gap changes how the existing literature should be interpreted. Studies reporting positive pooled, policy, or outcome-specific digital effects remain informative, but their estimands need not answer the same question as the TWFE model of comprehensive green performance. Carbon efficiency, pollution control, ecological amenities, and composite green development can respond differently, while national digital and environmental policies can move simultaneously. The practical implication is to state explicitly whether a study is describing system-level co-movement, distributional change, or within-city alignment rather than treating these as interchangeable forms of evidence.
The enabling-capability perspective provides a substantive interpretation of this distinction. Digital infrastructure, finance, data, and innovation enlarge the set of actions available to firms and governments, but realized green outcomes also depend on the energy system, industrial composition, environmental institutions, pollution-control capacity, and green investment. The empirical gap therefore need not be read as a failure of digitalization per se. It is consistent with incomplete or uneven realization of digital capability within a broader urban transition system.
The findings are compatible with previous reports of favorable digital–green relationships because studies of green productivity, carbon intensity, and pollutant concentrations examine distinct outcomes, samples, and sources of variation [7,10,19,20]. Specifically, Huang et al. [7] examined urban green economic efficiency, Qian et al. [10] examined green total factor productivity, Yu and Hu [19] examined carbon-emission efficiency, and Zhang et al. [20] examined carbon-emission intensity, whereas our GDI combines resource–carbon performance, pollution–environmental quality, and ecological amenities. The present dimension contrast cautions against extending any single outcome-specific relationship to a composite green index. Recent city-level electric-vehicle emissions accounting [41] and charging-capacity planning [42] provide external examples of why technological deployment and realized emissions can diverge, but those studies do not directly validate the present panel’s mechanisms.
This perspective also clarifies what the present study does not identify. The aggregation diagnostic locates where the apparent relationship weakens, but it cannot determine which complementary condition is responsible or how much each mechanism contributes. That distinction is deliberate: establishing the level-of-analysis problem is the purpose of this paper, while identifying specific conversion mechanisms requires designs targeted to particular policies, technologies, or institutional conditions.
5.3. Contributions and Limitations
This study contributes a deliberately focused account of the digital–green nexus. First, it conceptualizes the co-evolution–conversion gap as a level-of-analysis problem, distinguishing system-level parallel progress from within-city alignment without treating conversion as a causal mechanism. Second, it makes the aggregation dependence of the relationship explicit through a common-specification diagnostic spanning pooled OLS, city FE only, year FE only, TWFE, and first differences. Third, it connects that inferential comparison to independent spatial and distributional evidence showing that digitalization and green development can improve simultaneously while following different cross-city dispersion paths. These contributions rely on transparent measurement and estimand clarification rather than on increasingly complex estimators.
For policy evaluation, the East–Central/West slope contrast motivates context-sensitive assessment, whereas the unsupported mega/super-large versus other-large contrast does not justify ranking cities by size. Central dashboards should report direct environmental measures alongside digital indicators. Local investment and regulation should be evaluated against the distinct resource–carbon, pollution, and amenity outcomes; the observational interaction evidence does not establish that any tested policy lever is effective.
Several limitations remain. First, the observational panel does not exploit a single exogenous digital-policy shock, so all coefficients are conditional associations rather than causal effects; correspondingly, conversion is used as a descriptive within-city alignment concept. Second, the intended population of inference is China’s large-city system, and the results should not be mechanically extrapolated to medium and small cities, where long-term data coverage, economic scale, and sensitivity of intensity measures to discrete shocks differ. Third, composite indices simplify multidimensional transitions even though PCA and restricted-index checks reduce dependence on one weighting or denominator convention. Fourth, the aggregation diagnostic identifies where the association weakens but does not identify which national forces generate the common trend or which local complementarities determine successful digital-to-green realization. These are natural directions for future mechanism-focused and quasi-experimental research.
The 100-city balanced panel cannot be generalized mechanically to smaller cities. Energy and pollution intensities may reflect changes in output denominators or major industrial projects, as well as physical environmental change, and composite scores can conceal offsetting component movements. Some upstream compilation procedures and historical intensity definitions are imperfectly documented; the restricted-outcome check and explicit-source descriptions clarify this measurement boundary. Neither alternative weighting nor subgroup and spatial specifications overcome the observational design’s limitations. Only 2.77% of the total DIG variation remains after removing city and year means. Limited residual variation, heterogeneous outcome relationships, and sensitivity to alternative inference assumptions may contribute to the imprecision of the average TWFE estimate, but do not identify a single cause.
6. Conclusions and Policy Implications
6.1. Main Conclusions
This study reassesses the digital–green nexus using a balanced panel of 100 major Chinese cities from 2012 to 2023. Rather than treating parallel digital and green progress as evidence of a single coupled transition, the empirical design separates system-level co-evolution, cross-city distributional dynamics, and within-city conversion, with conversion defined as descriptive alignment rather than a causal mechanism. Because the sample is restricted to 100 major cities, these findings should not be extrapolated directly to small or medium-sized cities.
Three conclusions emerge. First, both systems advance strongly: mean DIG increases by 1.846 pooled-standardized units and mean GDI by 1.360 pooled-standardized units, while digitalization becomes more dispersed and green development more concentrated across cities. Second, descriptive system-level co-evolution is strong: annual mean DIG and GDI correlate at 0.991 and the pooled Core4 coefficient is 0.510. Third, the relationship is strongly aggregation-dependent. The coefficient is 0.249 with city FE only but only 0.038 with year FE only, becomes −0.181 under TWFE, and remains statistically imprecise in first differences. Alternative weighting, outcome construction, timing, controls, and sample changes do not generate a robust positive within-city association. The central empirical result is therefore a co-evolution–conversion gap, not evidence of an intrinsically negative digital effect.
The annual-mean correlation is high in levels but materially lower after detrending or differencing, while almost all pooled covariance arises from persistent city differences and common-year movement. Heterogeneity across green development dimensions and selected weighting/inference choices limits any claim of a universal positive or negative effect. The substantive conclusion is that there is a need to distinguish descriptive co-evolution from measured within-city alignment; it is not a claim of ineffective digital policies.
6.2. Policy Implications
First, urban digital policy should not use parallel growth in digital and green indicators as evidence that digitalization automatically causes green improvement. Digital-progress dashboards and smart-city evaluations should track environmental outcomes directly rather than use digital upgrading as a proxy for sustainability performance.
Second, policy evaluation should distinguish national co-evolution from local conversion. Common national programs can raise digital and green indicators at the same time, but city governments still need to assess whether additional connectivity, computing capacity, digital finance, and innovation are accompanied by measurable changes in energy use, carbon intensity, pollution, and ecological amenities at the local level.
Third, the large-city evidence argues for a conversion-oriented policy framework: the relevant question is not only how rapidly a city digitalizes, but whether its institutional, industrial, energy, and environmental systems convert digital capability into broad sustainability outcomes. The present study does not identify those complementary conditions causally, so they should be treated as targets for subsequent diagnosis rather than mechanisms already established here. Urban sustainability research should therefore distinguish progress in the two systems from the degree to which progress in one system is reflected in outcomes in the other.
Author Contributions
Conceptualization, Y.L. and H.L.; methodology, Y.L. and H.L.; validation, Y.L.; formal analysis, Y.L.; investigation, Y.L.; data curation, Y.L. and H.L.; writing—original draft preparation, Y.L. and H.L.; writing—review and editing, H.L.; project administration, Y.L. All authors have read and agreed to the published version of the manuscript.
Funding
This work was supported by the Ministry of Education of the Republic of Korea and the National Research Foundation of Korea (NRF-2025S1A5A2A01007457).
Institutional Review Board Statement
Not applicable.
Informed Consent Statement
Not applicable.
Data Availability Statement
The processed city-level panel and analysis code are available from the corresponding author upon reasonable request, subject to data-use conditions of the original data providers.
Acknowledgments
During preparation of this manuscript, the authors used ChatGPT (GPT-5.6 model, OpenAI) for English translation and editing, statistical-code drafting and debugging for robustness and consistency checks, and document-formatting support. The tool was not used as a source of empirical data or bibliographic authority. All analytical decisions, data preparation, computations, reference verification, interpretation, and final text were reviewed by the authors, who take full responsibility for the publication.
Conflicts of Interest
The authors declare no conflicts of interest.
Appendix A. Selected Diagnostic Evidence
This appendix reports the sensitivity statistics, specification checks, and summary contrasts needed to follow the revised main text. It does not reproduce every intermediate regression coefficient; full numerical outputs can be supplied on reasonable request subject to original-data conditions.
Table A1.
Annual-mean and covariance diagnostics.
Table A2.
Five-specification Core4 coefficients (selected controls).
Table A3.
Additional sensitivities and illustrative city trajectories.
References
- Goldfarb, A.; Tucker, C. Digital economics. J. Econ. Lit. 2019, 57, 3–43. [Google Scholar] [CrossRef] [Scilit]
- Romer, P.M. Endogenous technological change. J. Political Econ. 1990, 98, S71–S102. [Google Scholar] [CrossRef] [Scilit] [PubMed]
- Acemoglu, D.; Aghion, P.; Bursztyn, L.; Hemous, D. The environment and directed technical change. Am. Econ. Rev. 2012, 102, 131–166. [Google Scholar] [CrossRef] [Scilit] [PubMed]
- Aghion, P.; Dechezlepretre, A.; Hemous, D.; Martin, R.; Van Reenen, J. Carbon taxes, path dependency, and directed technical change: Evidence from the auto industry. J. Political Econ. 2016, 124, 1–51. [Google Scholar] [CrossRef] [Scilit]
- Jaffe, A.B.; Newell, R.G.; Stavins, R.N. Environmental policy and technological change. Environ. Resour. Econ. 2002, 22, 41–70. [Google Scholar] [CrossRef] [Scilit]
- Porter, M.E.; van der Linde, C. Toward a new conception of the environment-competitiveness relationship. J. Econ. Perspect. 1995, 9, 97–118. [Google Scholar] [CrossRef] [Scilit]
- Huang, L.; Zhang, H.; Si, H.; Wang, H. Can the digital economy promote urban green economic efficiency? Evidence from 273 cities in China. Ecol. Indic. 2023, 155, 110977. [Google Scholar] [CrossRef] [Scilit]
- Liao, W. How does the digital economy affect the development of the green economy? Evidence from Chinese cities. PLoS ONE 2023, 18, e0289826. [Google Scholar] [CrossRef] [Scilit] [PubMed]
- Lyu, Y.; Wang, W.; Wu, Y.; Zhang, J. How does digital economy affect green total factor productivity? Evidence from China. Sci. Total Environ. 2023, 857, 159428. [Google Scholar] [CrossRef] [Scilit] [PubMed]
- Qian, J.; Zhou, Y.; Hao, Q. The effect and mechanism of digital economy on green total factor productivity: Empirical evidence from China. J. Environ. Manag. 2024, 372, 123237. [Google Scholar] [CrossRef] [Scilit] [PubMed]
- Ren, Y.; Tian, Z.; Liu, C. Impact of the digital economy on urban green growth: Empirical evidence from China. PLoS ONE 2023, 18, e0296072. [Google Scholar] [CrossRef] [Scilit] [PubMed]
- Xiao, Y.; Wu, S.; Liu, Z.Q.; Lin, H.J. Digital economy and green development: Empirical evidence from China’s cities. Front. Environ. Sci. 2023, 11, 1124680. [Google Scholar] [CrossRef] [Scilit]
- Yang, Y.; Liang, Q. Digital economy, environmental regulation and green eco-efficiency: Empirical evidence from 285 cities in China. Front. Environ. Sci. 2023, 11, 1113293. [Google Scholar] [CrossRef] [Scilit]
- Zhao, P.; Guo, J.; Wang, Y. How does the digital economy affect green development? Evidence from 284 cities in China. Sustainability 2023, 15, 11596. [Google Scholar] [CrossRef] [Scilit]
- Liao, K.; Liu, J. Digital infrastructure empowerment and urban carbon emissions: Evidence from China. Telecommun. Policy 2024, 48, 102764. [Google Scholar] [CrossRef] [Scilit]
- Ma, R.; Lin, B. Digital infrastructure construction drives green economic transformation: Evidence from Chinese cities. Humanit. Soc. Sci. Commun. 2023, 10, 460. [Google Scholar] [CrossRef] [Scilit]
- Wei, M.; Yin, X. Broadband infrastructure and urban carbon emissions: Quasi-experimental evidence from China. Urban Clim. 2024, 54, 101863. [Google Scholar] [CrossRef] [Scilit]
- Xiao, X.; Liu, C.; Li, S. How the digital infrastructure construction affects urban carbon emissions: A quasi-natural experiment from the Broadband China policy. Sci. Total Environ. 2024, 912, 169284. [Google Scholar] [CrossRef] [Scilit] [PubMed]
- Yu, J.; Hu, W. The impact of digital infrastructure construction on carbon emission efficiency: Considering the role of central cities. J. Clean. Prod. 2024, 448, 141687. [Google Scholar] [CrossRef] [Scilit]
- Zhang, W.; Fan, H.; Zhao, Q. Seeing green: How does digital infrastructure affect carbon emission intensity? Energy Econ. 2023, 127, 107085. [Google Scholar] [CrossRef] [Scilit]
- Lange, S.; Pohl, J.; Santarius, T. Digitalization and energy consumption: Does ICT reduce energy demand? Ecol. Econ. 2020, 176, 106760. [Google Scholar] [CrossRef] [Scilit]
- Stern, D.I. The role of energy in economic growth. Ann. N. Y. Acad. Sci. 2011, 1219, 26–51. [Google Scholar] [CrossRef] [Scilit] [PubMed]
- Tang, K.; Yang, G. Does digital infrastructure cut carbon emissions in Chinese cities? Sustain. Prod. Consum. 2023, 35, 431–443. [Google Scholar] [CrossRef] [Scilit]
- Wang, Y.; An, Q.; Xie, Q.; Wang, R. The impact of new digital infrastructures on urban carbon emissions: An empirical study from Chinese cities. Front. Environ. Sci. 2024, 12, 1414034. [Google Scholar] [CrossRef] [Scilit]
- Wang, F. Does the construction of smart cities make cities green? Evidence from a quasi-natural experiment in China. Cities 2023, 140, 104436. [Google Scholar] [CrossRef] [Scilit]
- Zhang, Y.; Ran, C. Effect of digital economy on air pollution in China? New evidence from the National Big Data Comprehensive Pilot Area policy. Econ. Anal. Policy 2023, 79, 986–1004. [Google Scholar] [CrossRef] [Scilit]
- Liu, Y.; Xie, Y.; Zhong, K. Impact of digital economy on urban sustainable development: Evidence from Chinese cities. Sustain. Dev. 2024, 32, 307–324. [Google Scholar] [CrossRef] [Scilit]
- Lai, A.; Li, Z.; Hu, X.; Wang, Q. Does digital economy improve city-level eco-efficiency in China? Econ. Anal. Policy 2024, 81, 1198–1213. [Google Scholar] [CrossRef] [Scilit]
- Geels, F.W. Technological transitions as evolutionary reconfiguration processes: A multi-level perspective and a case-study. Res. Policy 2002, 31, 1257–1274. [Google Scholar] [CrossRef] [Scilit]
- Cai, L.; Luo, X.; Gao, Z.; Cao, Y. How does the digital economy promote green development? Empirical evidence from 282 Chinese cities. Environ. Plan. B Urban Anal. City Sci. 2025, 52, 2215–2234. [Google Scholar] [CrossRef] [Scilit]
- Fan, Q.; Yang, J.; Song, Y. Heterogeneous effects of the digital economy on high-quality green development of urban economy and its spatial spillovers: Evidence from the Upper Yangtze River Economic Belt. Front. Sustain. Cities 2025, 7, 1629300. [Google Scholar] [CrossRef] [Scilit]
- Liang, J.; Qiao, C. The impact of digital economy on urban green and low-carbon development: Mechanism and spatial spillover effect. Front. Sustain. Cities 2025, 7, 1591826. [Google Scholar] [CrossRef] [Scilit]
- Ding, H.; Wei, Q.; Wang, Z. Digital Economy and Urban Green Development: Regional Heterogeneity and Empirical Evidence from Chinese Cities. Economics 2026, 20, 20250187. [Google Scholar] [CrossRef] [Scilit]
- Li, Z.; Sun, P.; Cao, N.; Li, Z. The spatial spillover effect and nonlinear influence mechanism of digital economy on urban shrinkage. Cities 2026, 171, 106762. [Google Scholar] [CrossRef] [Scilit]
- Wei, G.; He, B.-J.; Sun, P.; Liu, Y.; Li, R.; Ouyang, X.; Luo, K.; Li, S. Evolutionary trends of urban expansion and its sustainable development: Evidence from 80 representative cities in the Belt and Road Initiative region. Cities 2023, 138, 104353. [Google Scholar] [CrossRef] [Scilit]
- Silverman, B.W. Density Estimation for Statistics and Data Analysis; Chapman and Hall: London, UK, 1986. [Google Scholar]
- Office of the Leading Group of the State Council for the Seventh National Population Census. Tabulation on 2020 China Population Census by County; China Statistics Press: Beijing, China, 2022.
- European Commission Joint Research Centre (JRC); International Energy Agency (IEA). EDGAR Community GHG Database, Version EDGAR_2024_GHG; European Commission: Brussels, Belgium, 2024. [Google Scholar]
- Wei, J.; Li, Z.; Lyapustin, A.; Sun, L.; Peng, Y.; Xue, W.; Su, T.; Cribb, M. Reconstructing 1-km-resolution high-quality PM2.5 data records from 2000 to 2018 in China: Spatiotemporal variations and policy implications. Remote Sens. Environ. 2021, 252, 112136. [Google Scholar] [CrossRef] [Scilit]
- Cameron, A.C.; Miller, D.L. A practitioner’s guide to cluster-robust inference. J. Hum. Resour. 2015, 50, 317–372. [Google Scholar] [CrossRef] [Scilit]
- Deng, Y.; Ma, M.; Zhou, N.; Yuan, H.; Ma, Z.; Ma, X. City-level energy and emission assessment based on 20+ million electric vehicle registrations in China. Nexus 2026, 3, 100148. [Google Scholar] [CrossRef] [Scilit]
- Hao, Y.; Yuan, H.; Zhou, N.; Ma, M. Synergetic capacity planning of private and public EV charging piles via city-scale multiobjective optimization. Appl. Energy 2027, 427, 128873. [Google Scholar] [CrossRef] [Scilit]

Disclaimer/Publisher’s Note: The statements, opinions and data contained in all publications are solely those of the individual author(s) and contributor(s) and not of MDPI and/or the editor(s). MDPI and/or the editor(s) disclaim responsibility for any injury to people or property resulting from any ideas, methods, instructions or products referred to in the content. |
© 2026 by the authors. Licensee MDPI, Basel, Switzerland. This article is an open access article distributed under the terms and conditions of the Creative Commons Attribution (CC BY) license.