


Abstract
Urban blue–green infrastructure (GBI) spans wetlands, parks, waterways, and historic landscapes, yet ecological performance and public preference are often assessed separately. We develop a dual-track spatial framework for Suzhou, China, combining an ecosystem service balance (ESB) index based on ten indicators derived from remote sensing and InVEST with preference mapping from participatory GIS (PPGIS) and visual preference surveys (VPS; 453 valid responses). We distinguish natural GBI, GBI in semi natural settings, and GBI in artificially constructed settings, while treating blue and cultural GBI as cross-cutting themes. Because the two layers are not calibrated to a common scale, we compare percentile ranks within the common valid area (relative spatial standing, not absolute gaps) and use multinomial logit models to examine perceptual attributes associated with preferred GBI types. Under a ±30-percentile-point threshold, 22.23% of the area ranked higher on ESB, 59.98% showed relatively close ranks, and 17.80% ranked higher on preference. Higher ESB ranks clustered along the network of Lake Tai, rivers, hills, and wetlands around the urban periphery, whereas higher preference ranks were more common in cultural corridors and waterfronts in the inner city; objective advantage was most prevalent in Wujiang and preference advantage in Gusu. Rankings were consistent across KDE bandwidths of 300–800 m (Spearman’s ρ = 0.977–0.995), although hotspot overlap varied (Jaccard = 0.836–0.917). In the natural GBI choice model, social cohesion (AME = 3.88 percentage points, 95% CI 0.97–6.78) and heritage identity (AME = 4.29 percentage points, 95% CI 1.66–6.93) were positively associated with choice. The framework can inform ecological assessment at individual sites, public engagement, and planning tailored to local contexts.
1. Introduction
Urban blue–green infrastructure (GBI) encompasses parks, wetlands, rivers, canals, and associated green spaces that support urban ecosystems and everyday life. In cities such as Suzhou, these environments range from lakeside wetlands to canal-side streets and historic waterway districts, each with different ecological functions, public uses, and design needs. Understanding these differences is increasingly important as urbanisation intensifies. More than 56% of the world’s population lives in urban areas, with the share projected to reach 68% by 2050 [1,2]. Urban growth increases pressure on ecosystems and demand for ecosystem services [3,4]. GBI is therefore an important component of sustainable urban planning [5], with growing attention to both ecological functions and public experience (Supplemental Material S1). However, ecological conditions and public perceptions do not always align [6,7]. Considering both perspectives can inform more context-sensitive and socially responsive GBI planning [8].
GBI brings together green spaces, such as forests, parks, and grasslands, with blue environments, including rivers, lakes, and wetlands [9]. Although earlier research often considered these features under green infrastructure, the importance of water-related landscapes has received increasing attention [10,11,12]. This has encouraged a more integrated approach to green and blue spaces in urban planning [13]. However, different water-related settings provide different ecological and social benefits. Wetlands and natural shorelines support habitat and water regulation, while urban canals and waterfront spaces also offer opportunities for recreation and everyday public use. Historic waterways and gardens additionally contribute to aesthetic experience and cultural heritage [14]. These cultural ecosystem services connect ecological environments with people’s experiences and sense of place [15,16]. Recognising these differences is important when assessing GBI in cities where water and historic urban landscapes are closely intertwined.
GBI can be classified by ecological function, location, scale, and degree of human intervention. It includes large environments such as wetlands, urban forests, and parks, as well as smaller features such as street greenery and community gardens [17,18,19]. A common classification distinguishes natural, semi-natural, and artificial GBI according to their degree of naturalness and management [20,21]. However, these categories alone do not fully capture the distinctive characteristics of urban waterways and historic landscapes. For example, natural wetlands, managed parks, constructed waterfronts, and historic canal districts differ in their ecological functions, public uses, and design considerations. We therefore retain the three naturalness-based categories and include blue-themed and cultural-themed GBI to represent water-related and heritage characteristics. These two themes may overlap with the three naturalness-based categories rather than forming mutually exclusive landscape types (Supplemental Material S2).
In terms of the method, assessment of urban GBI is moving from single objective indicators to the integration of multiple data sources. Objective datasets often rely on remote-sensing indices such as NDVI, NDWI, and LST, combined with models like InVEST for evaluation [22], and capture characteristics such as spatial accessibility [23], temperature regulation [24] and water regulation [25]. While objective data can quantify ecological quality at the urban scale with reasonable accuracy, they cannot fully substitute the ‘human-eye’ perspective of subjective quality and thus cannot comprehensively reflect the quality or attractiveness of GBI [26]. On the subjective side, existing studies draw on questionnaires [27], image-based visual preference, participatory GIS, and social media or behavioural footprints [18,28,29]. These approaches foreground cultural services [30], public participation [31], pro-active behaviours [19], and human well-being [32], but face limitations in scale, precision, and explanatory power. To connect these perspectives, we align objective ecological indicators and mapped public preferences on a common spatial grid, compare their relative spatial rankings, and identify areas where the two patterns diverge.
Despite growing research on urban GBI, three gaps remain. First, objective ecological assessments and public perceptions are often examined separately, making it difficult to identify where their spatial patterns differ [33]. Second, conventional GBI classifications do not fully represent the distinctive roles of waterways and cultural heritage landscapes [34]. Third, ecological conditions, spatially mapped preferences, and residents’ GBI type choices have rarely been examined within a single integrated framework [35]. To address these gaps, we develop a dual-track assessment using Suzhou as a case study. Remote sensing and InVEST-based indicators are used to assess ecosystem-service conditions and human-use pressures, while visual preference surveys (VPS) and participatory GIS (PPGIS) capture residents’ evaluations of different GBI settings and their preferred locations. By comparing the relative spatial rankings of objective and subjective assessments, we identify areas where ecological conditions and public preferences differ. Multinomial logit models are then used to examine associations between perceptual attributes and GBI type choice. The main contribution is the integration of these approaches into a spatially aligned diagnostic workflow that includes blue-themed and cultural-themed GBI and provides evidence for further site-specific assessment and planning.
Accordingly, this study examines the spatial relationships between objective ecological quality and public preferences across Suzhou’s blue–green environments. It aims to identify their spatial patterns and the perceptual attributes associated with residents’ GBI type choices, providing evidence to inform GBI assessment and planning. We therefore address three key questions. First, using the objective biophysical assessment, how can the spatial distribution of GBI quality be identified? Second, how can residents’ subjective perceptions and preferences towards GBI be mapped, and how do their spatial patterns compare with objective ecological quality? Third, which perceptual attributes and respondent characteristics are associated with residents’ preferred GBI types?
2. Methods
2.1. Study Area
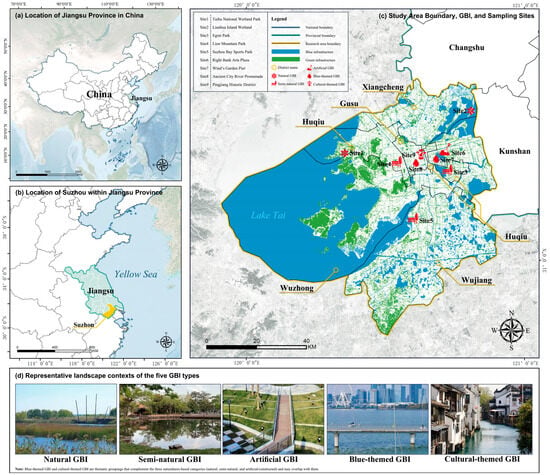
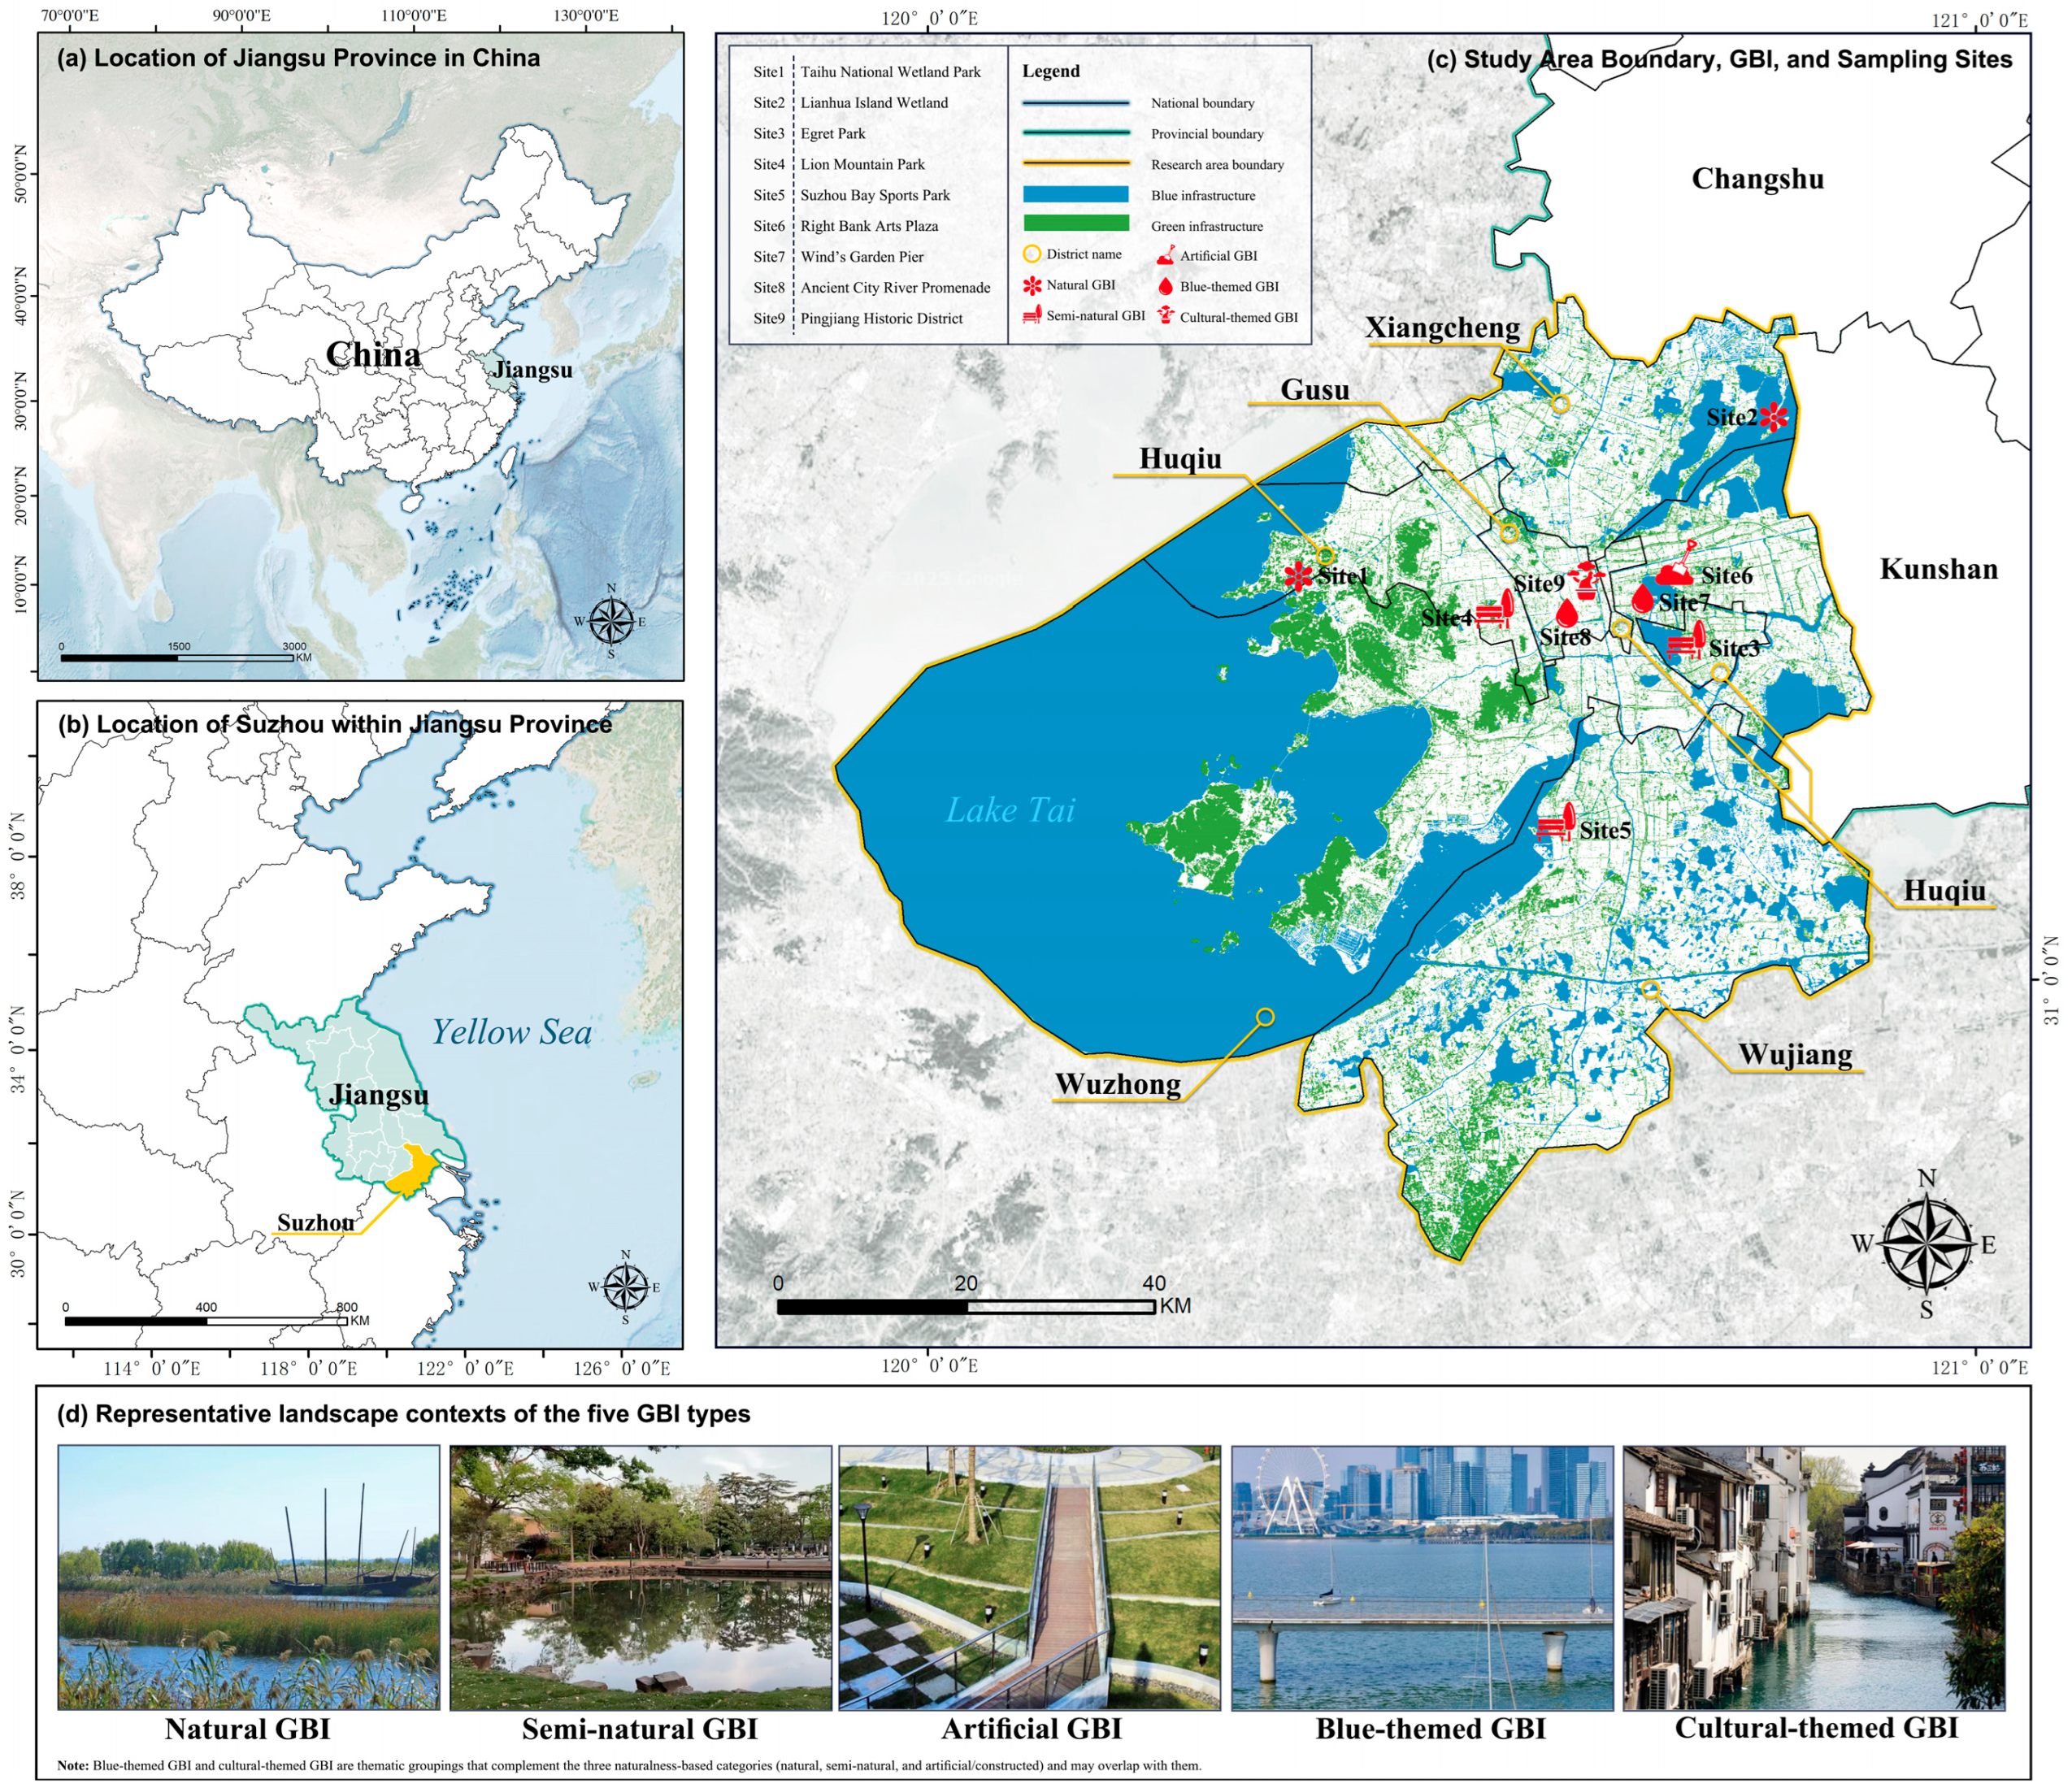
Suzhou lies in the southeastern part of Jiangsu Province, within the core of the Yangtze River Delta. It possesses an extensive network of rivers and lakes, a long-standing canal system, and distinctive garden landscapes. The historic urban pattern of “parallel waterways and roads; rivers adjoining streets” had already taken shape at least as early as the Southern Song, as evidenced by the Pingjiang Map, giving it a history approaching a millennium. Since Suzhou’s Classical Gardens were inscribed on the World Heritage List in 1997, nine gardens have been listed, and in 2025 the city was designated an “International Wetland City” [36,37]. This makes Suzhou an ideal case for examining the multifunctional performance of GBI and its mismatches with public perception. The study area covers five core districts (Figure 1, yellow boundary). Sampling locations for subjective data collection adopted a stratified design across two dimensions—administrative districts and GBI types—to maintain balance across the five districts and five GBI categories. Ultimately, nine field sites were selected for context-specific visual preference assessment and ground verification (Figure 1, red markers).
Figure 1.
(a) Location of Jiangsu Province in China. (b) Location of Suzhou in Jiangsu Province. (c) Study area boundary, spatial configuration of blue green infrastructure, and the nine survey sites included in this study. District names are labelled for reference. (d) Representative landscape contexts of the five GBI types: natural GBI, semi natural GBI, artificial GBI, blue themed GBI, and cultural themed GBI.
2.2. Data Collection
Objective data integrated multi-source remote-sensing and geospatial datasets: Dynamic World v1 (Sentinel-2-based 10 m land use/land cover, LULC); Sentinel-2 Level-2A surface reflectance (10 m, for NDVI and MNDWI); Landsat 8/9 Level-2 surface temperature (native ~30 m, for LST); Tianditu administrative boundaries (for study-area delineation and cartography); and points of interest (POIs) extracted via the OSM Overpass API. Ecosystem-service indicators (carbon storage, water yield, and flood-mitigation potential) were modelled with InVEST (v3.x) using harmonised land-use/land-cover, terrain, soil, and climate inputs. The InVEST Urban Flood Risk Mitigation (UFRM) output was interpreted as scenario-dependent modelled flood-mitigation potential, rather than observed flood mitigation. All datasets underwent temporal constraints (primarily 2024), cloud/thin-cloud and shadow filtering (SCL/QA60 for Sentinel-2; QA_PIXEL for Landsat), projection and resolution harmonisation, clipping to the study area, and annual median compositing where applicable in GEE and ArcGIS Pro. ArcGIS Pro (version 3.4) was used, and GEE was accessed via https://code.earthengine.google.com/ on 28 September 2025. Specifically, the original 10 m Dynamic World land-use/land-cover (LULC) data were resampled to 30 m, and the objective analysis rasters were aligned to a common 30 m spatial grid. The objective indicators were normalised to a 0–1 range for spatial visualisation and descriptive comparison, while the composite ecosystem service balance (ESB) index was constructed using the two-stage Z-score standardisation described in Section 2.3.1. For subsequent objective–subjective spatial alignment, the ESB raster was resampled to match the 100 m KDE grid, as described in Section 2.3.2. We note that multi-source integration and annual compositing may dampen seasonal differences and fine-scale signals; parameters, thresholds, and data-access details are provided in Supplemental Material S3.
This study employed a combined visual preference survey (VPS) and participatory GIS (PPGIS) design, with on-site questionnaires at nine sampling locations covering five GBI types. Trained enumerators conducted face-to-face interviews in Suzhou during March–May 2025, 09:00–20:00 on weekdays and weekends; the spring schedule enhanced the visibility of blue–green features and reduced seasonal bias. The study received ethics approval from Soochow University (SOASCU202519). Using location-stratified random sampling (nine strata; target ≥50 per site), 567 questionnaires were collected. The structured questionnaire comprised four parts (Supplemental Material S4): (1) demographics; (2) a VPS module—context images plus scene descriptions with Likert ratings for the five GBI types; (3) behaviour and preferences; and (4) a PPGIS module—in which respondents annotated, on printed Suzhou base maps, points/lines/polygons for GBI they liked or considered of high ecological quality, with optional notes. After collection, paper maps were digitised and geocoded to create PPGIS features. Each questionnaire took approximately 8–12 min. After data collection, records were screened for questionnaire completeness, response patterns, and PPGIS usability. Records were excluded if key analytical items were missing, the same rating was consistently selected across all GBI scenarios (a potential indicator of low-quality responding), or PPGIS annotations could not be reliably located or digitised. In total, 114 records (20.1%) were excluded, leaving 453 records with usable questionnaire responses and PPGIS annotations for joint analysis. The distribution of respondents across the nine survey sites and the composition of the final sample are summarised in Table 1.
Table 1.
Survey-site distribution and sample composition of the valid respondents.
2.3. Variables and Analysis
2.3.1. Construction and Standardization of the Composite Objective Quality Index (ESB)
To characterise Suzhou’s GBI supply capacity and relative pressure, we integrate ten remote-sensing/model indicators in two groups: (i) supply (7; higher is better)—NDVI, MNDWI, canopy/shade, carbon storage (InVEST), water yield (InVEST), scenario-based flood-mitigation potential (InVEST UFRM); and (ii) pressure/exposure (3; higher indicates greater pressure/exposure)—POI density, HAI, and heat exposure (LST; reversed so cooler is better). We treat LST as a regulating-service outcome and operationalize it here as a proxy for thermal exposure/heat stress (i.e., the pressure that regulation needs to offset), rather than as a preference-side demand indicator. All indicators were pre-processed in GIS (harmonised projection/resolution, study-area clipping) and composited annually for 2024 to reduce cloud/noise and temporal inconsistencies. To remove scale and distribution differences, we use a two-step Z-score: first align directions (supply/function positive; LST, POI, HAI sign-inverted), then apply a first Z-score to each indicator (cell , indicator ):
On the same spatial base, the seven supply indicators and the three pressure indicators are averaged with equal weights to construct ESS and ESD, respectively; equal weighting serves as a transparent baseline to minimise normative assumptions; each index is then standardised again using the Z-score to ensure comparability. The composite balance index (ESB) is defined as:
For spatial presentation and zoning, ESB is interpreted as follows: ESB > 0 denotes higher net supply/benefit; ESB < 0 denotes insufficient supply or higher pressure. We use quantile classification and define the Top 10% as comprehensive priority units. The composite index is equal-weighted and evaluated via three robustness checks: (i) jackknife (dropping each of the 10 indicators) assessing rank concordance with the baseline (Spearman’s ρ) and priority overlap (Jaccard/hit rate, Top 10%); (ii) aggregation alternatives (geometric mean or median in place of the arithmetic mean); and (iii) threshold/classification consistency across Top 8/10/12% and quantiles vs. Jenks (Jaccard, hit rate, Cohen’s κ, Spearman). We also compute global Moran’s I (Queen contiguity, 999 permutations) to characterise spatial clustering and provide context for threshold sensitivity.
For communication, district-level means are computed for the ten standardised indicators and ESB, and supply/function items are aggregated into three biophysical ES dimensions (SUPP/REG/PROV). These dimensions are operational proxies from objective data, intended for summary supply–pressure profiling rather than statistical inference or causal claims: SUPP = habitat quality + carbon storage; REG = canopy/shade + (−LST) + modelled UFRM flood-mitigation potential + MNDWI; PROV = water yield + NDVI. POI density is retained exclusively as a proxy for potential human-use pressure within the ESB assessment and is not used as an indicator of cultural ecosystem-service supply.
2.3.2. Subjective Preference Mapping and Objective and Subjective Alignment
PPGIS outputs, including hand drawn points, lines, and polygons on printed base maps, were digitised in GIS. After topological checks and removal of duplicate records, preference polygons were retained for spatial analysis. VPS Likert scores were used for site specific ratings, whereas PPGIS was used to construct a continuous surface of subjective preference intensity. All spatial data were projected to WGS 1984 UTM Zone 51N and aligned to a common 100 m grid. Grid centroids were spatially joined to the preference polygons, retaining respondent identifiers and overlapping records to preserve contributions from different respondents.
To ensure equal contributions from individual respondents, the total number of input points contributed by respondent was denoted by , and each point was assigned a weight as follows:
Thus, the total weight contributed by each respondent was one. Weighted kernel density estimation (KDE) was conducted in ArcGIS Pro using search radii of 300, 600, and 800 m and a 100 m output cell size. The 600 m bandwidth was used for the primary preference surface, while the other two bandwidths were used for sensitivity analysis. The KDE output was normalised to the range of 0 to 1 for visualisation.
For objective and subjective alignment, the ESB raster was resampled to the same 100 m grid, and only cells with valid values in both layers were retained (). Rather than subtracting the normalised raw values, ESB and KDE600 values were ranked separately within the common valid area, with average ranks assigned to tied values. Rank scores were scaled from 0 to 1000, approximately corresponding to percentile points from 0 to 100. The relative rank difference was calculated as follows:
Negative values indicated a higher relative rank for ESB, whereas positive values indicated a higher relative rank for subjective preference. Cells with were classified as objectively stronger, those with as relatively close in rank, and those with as subjectively stronger. Thresholds of ±200 and ±400 rank score units were also tested, corresponding approximately to differences of ±20 and ±40 percentile points. These categories represent relative spatial ranking differences rather than calibrated differences in absolute ecological performance and public preference.
KDE bandwidth sensitivity was assessed using pairwise Spearman rank correlations and Jaccard overlap of high preference areas across the three bandwidths. Correlations were calculated for both the full study area and the subset of cells with positive density under at least one bandwidth. High preference areas were defined using the 90th percentile of density values for each bandwidth, including tied values at the threshold. These measures distinguished the stability of overall spatial rankings from the stability of hotspot locations and extents.
2.3.3. Construction of Subjective Variables and Statistical Modelling Methods
Based on the VPS questionnaire data, we constructed subjective variables under a five situational contexts and ten subjective-perception items framework and used a multinomial logit model to explain respondents’ choices of their most-preferred GBI type. The questionnaire employed a 1–5 Likert scale; analyses were conducted on the complete-case sample after removing missing values to ensure a common estimation sample across models. In line with the questionnaire design, ten items were extracted from four ecosystem-service dimensions: seven cultural-service items (aesthetic value, health and well-being benefits, landscape coherence, waterscape attractiveness, visitation intention, social relations and cohesion, cultural heritage and identity), one regulating-service item (microclimate regulation), one supporting-service item (biodiversity maintenance), and one provisioning-service item (edible and medicinal plants). Each respondent answered for all five GBI contexts. This yielded a type and item scoring matrix that served as the unified input for subsequent modelling and visualisation.
To control individual tendencies toward uniformly high or low ratings, we constructed two layers of relative preference. First, at the type level, we calculated a composite score for each GBI type as the mean of its ten questionnaire items. This score summarises overall preference across the ten items; it is not a dimension-level score intended to compare the four ecosystem-service categories. Because cultural services were represented by seven items and each of the other three categories by one item, the composite reflects the questionnaire’s item composition rather than equal weighting of the four categories. For each type, its composite score was contrasted with the mean composite score of the other four types, and the resulting five values were Z-score standardised. Second, at the item level, for each item within a given type, the score was contrasted with the mean score for the same item across the other four types; these values were Z-score standardised to obtain a 10-item × 5-type matrix of item-level relative preferences. Four covariates—age, weekly visitation frequency, attitude toward whether GBI should be increased, and willingness to engage in governance—were included and Z-score standardised. Type choice was modelled using a multinomial logit. Model A (core) used the most-preferred GBI type as the dependent variable, with the four covariates and the five type-level relative preferences as predictors. Model B (item) used the ten item-level relative preferences as predictors to distinguish how specific perceptual attributes affect type-choice probabilities. Both models were estimated on the complete-case sample and report average marginal effects (AME) with 95% confidence intervals and p-values; multiple comparisons were controlled via the Benjamini–Hochberg procedure to compute the false discovery rate (FDR) and limit Type I error.
3. Results
3.1. Objective Ecological Quality and ESB at the City Scale
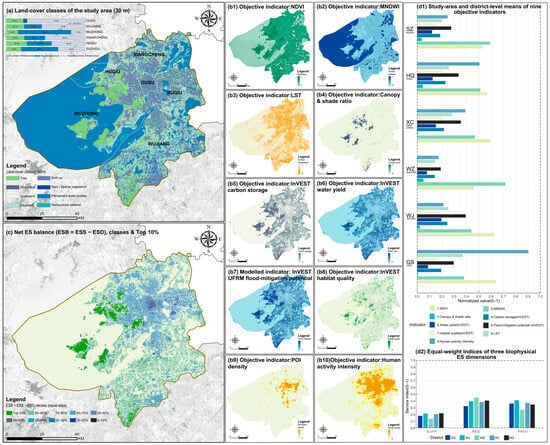
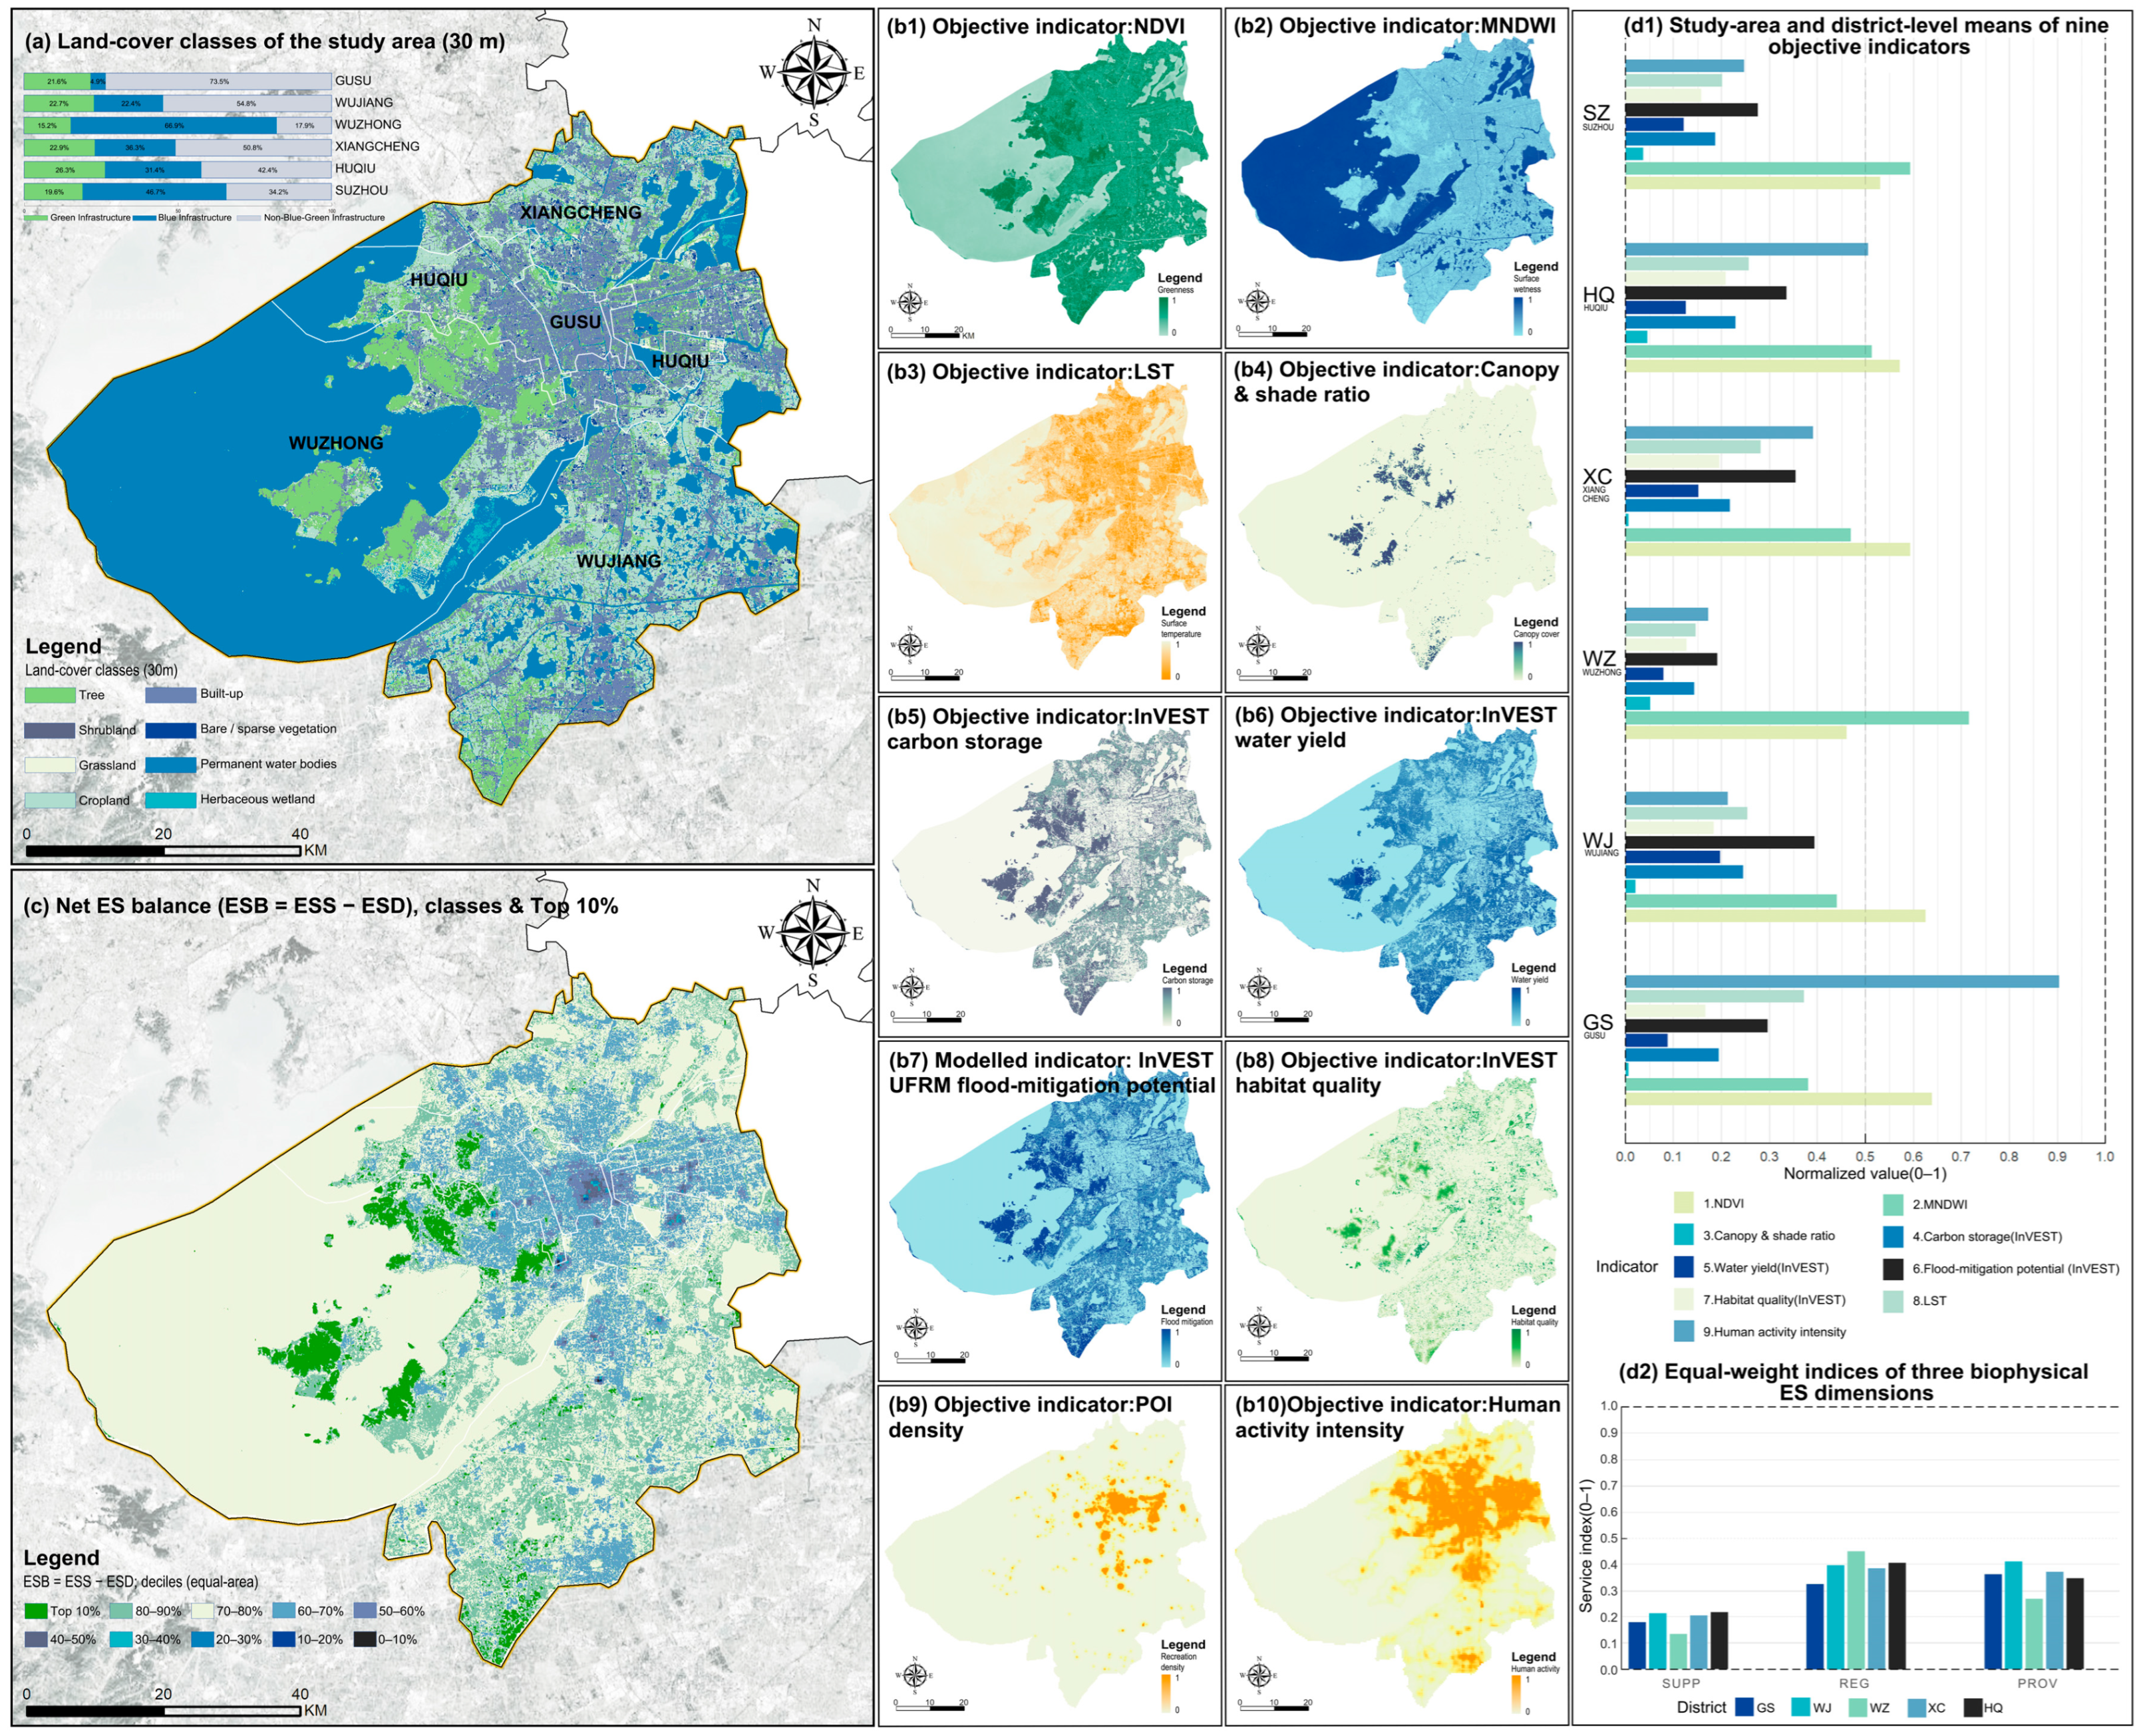
The study area shows a land–water composite along the west–south edge and a dense built-up core (Figure 2a), forming a GBI backbone of Lake Tai, the river network, hills, and wetlands. The ten indicators align with this pattern (Figure 2(b1–b10)): blue–green metrics are highest along the backbone (NDVI: Gusu 0.639; MNDWI: Wuzhong 0.716; canopy/shade: Wuzhong/Huqiu 0.052/0.045; water yield and modelled UFRM flood-mitigation potential: Wujiang 0.198 and 0.394, respectively; habitat quality: Huqiu 0.209; carbon storage: Wujiang 0.245). Urban-use/thermal metrics peak in the core (POI/HAI/LST highest in Gusu: 0.699/0.904/0.372). Accordingly, the ESB (equal-weight aggregation + two-stage standardisation) delineates a continuous blue–green backbone (Figure 2c): Top 10% values link the Lake Tai shoreline, western mountains, and southern wetlands, while the inner city is dominated by low–medium patchy values. District-level summaries further reveal the division of roles and emphases (Figure 2(d1,d2)).
Figure 2.
(a) Land-cover classes of the study area (30 m). (b1–b10) Spatial distributions of the ten objective indicators used in the ESB assessment. (c) Ecosystem service balance (ESB), classified by deciles, with the Top 10% highlighted. (d1) Study-area and district-level means of nine objective indicators, excluding POI density. (d2) District-level equal-weighted indices of three biophysical ecosystem-service dimensions: supporting (SUPP), regulating (REG), and provisioning (PROV).
Under the equal-weight aggregation of the three biophysical ecosystem-service dimensions, SUPP is the mean of habitat quality and carbon storage; REG is the mean of canopy/shade, reversed (−LST), flood mitigation and MNDWI; and PROV is the mean of water yield and NDVI. PROV is highest in Wujiang (0.412) and lowest in Wuzhong (0.270); REG is highest in Wuzhong (0.453) and lowest in Gusu (0.328); and SUPP is highest in Huqiu (0.219) and lowest in Wuzhong (0.136). These results depict an overall objective ES layout in which the peripheral blue–green backbone carries the main provisioning, regulating and supporting functions, whereas the inner city experiences greater human-use and environmental pressures (Supplemental Material S5).
Robustness checks showed high pixel-wise rank concordance under leave-one-out testing (mean Spearman’s ρ ≈ 0.972; median Top-10% Jaccard ≈ 0.930). Replacing the arithmetic mean with the median retained rank concordance with the baseline (ρ ≈ 0.888), although the overlap of Top-10% priority areas was lower (Jaccard ≈ 0.208). Priority-area overlap was also limited when the classification threshold changed: Jaccard overlap was 0.260 for Top 8% and 0.173 for Top 12% relative to the Top-10% baseline. Spearman’s rank correlation evaluates the ordering of all cells, whereas the Jaccard index measures the overlap between threshold-defined priority areas. Therefore, high rank concordance can coexist with lower spatial overlap when changes in aggregation or classification thresholds alter which cells are included in the priority set. ESB exhibited strong spatial clustering (Moran’s I ≈ 0.834, p = 0.001). These results indicate that the overall ESB ranking structure was comparatively stable under indicator omission, whereas the exact spatial extent of priority areas was sensitive to aggregation and classification settings (Supplemental Material S6).
3.2. Subjective Profiles and Objective–Subjective (Mis)Match
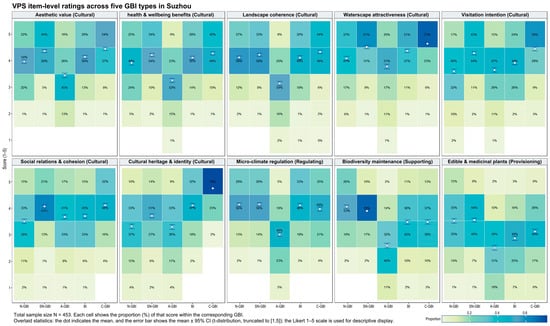
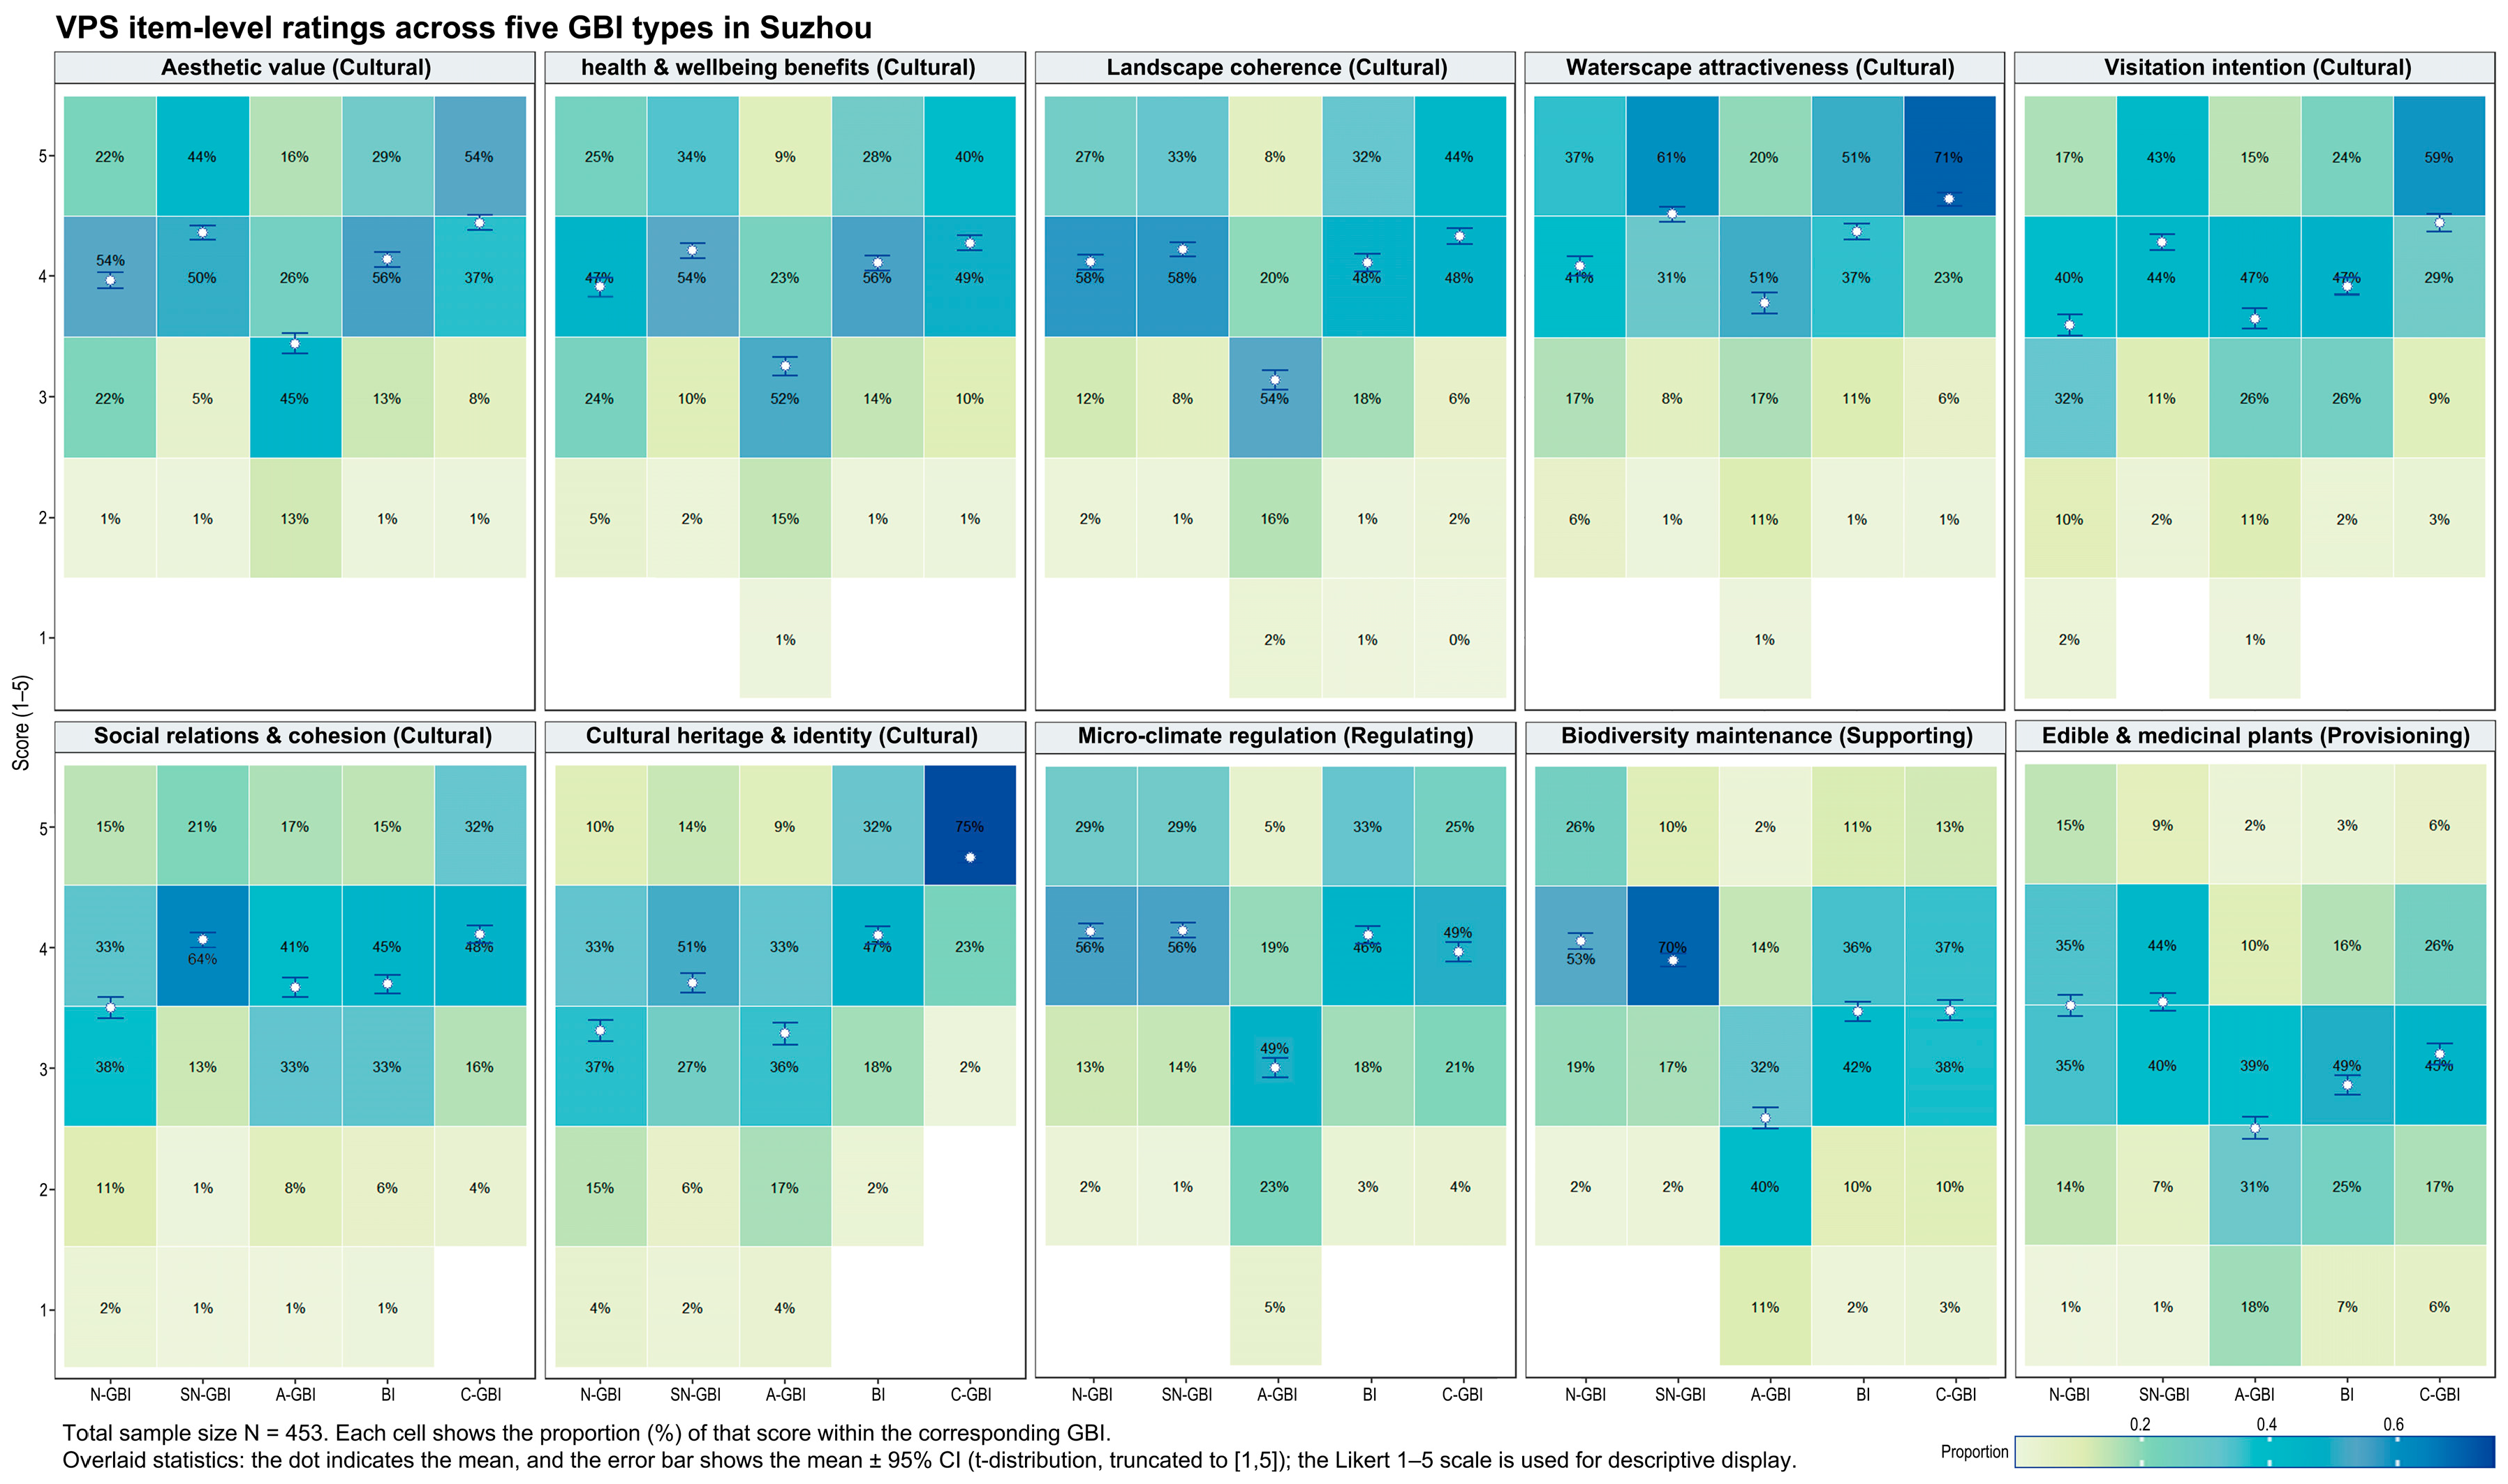
We obtained 453 valid questionnaires (male 51.0%, female 49.0%). The largest age group was 31–40 (30.0%), followed by 18–24 (24.1%) and 25–30 (23.8%) (Supplemental Material S7). VPS item-level profiles varied across GBI types. Cultural-themed types received higher ratings for cultural heritage and identity, aesthetic value, and visitation intention; blue-themed types stood out for waterscape attractiveness and visitation intention; natural and semi-natural types received higher ratings for microclimate regulation and biodiversity maintenance; and artificial types showed relatively higher ratings for visitation intention and social relations/cohesion (Figure 3). These findings describe patterns in individual questionnaire items rather than direct comparisons of the four ecosystem-service dimensions, which differed in the number of items used to represent them.
Figure 3.
Distributions of ratings (1–5) for the ten individual VPS items across five GBI types. Each heatmap shows the percentage of responses at each rating; overlaid points and error bars indicate item means and 95% confidence intervals. Items are grouped by ecosystem-service category for presentation only; no dimension-level composite scores are compared.
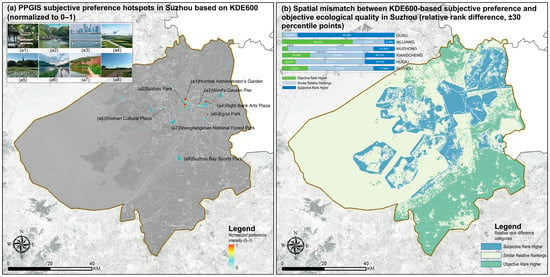
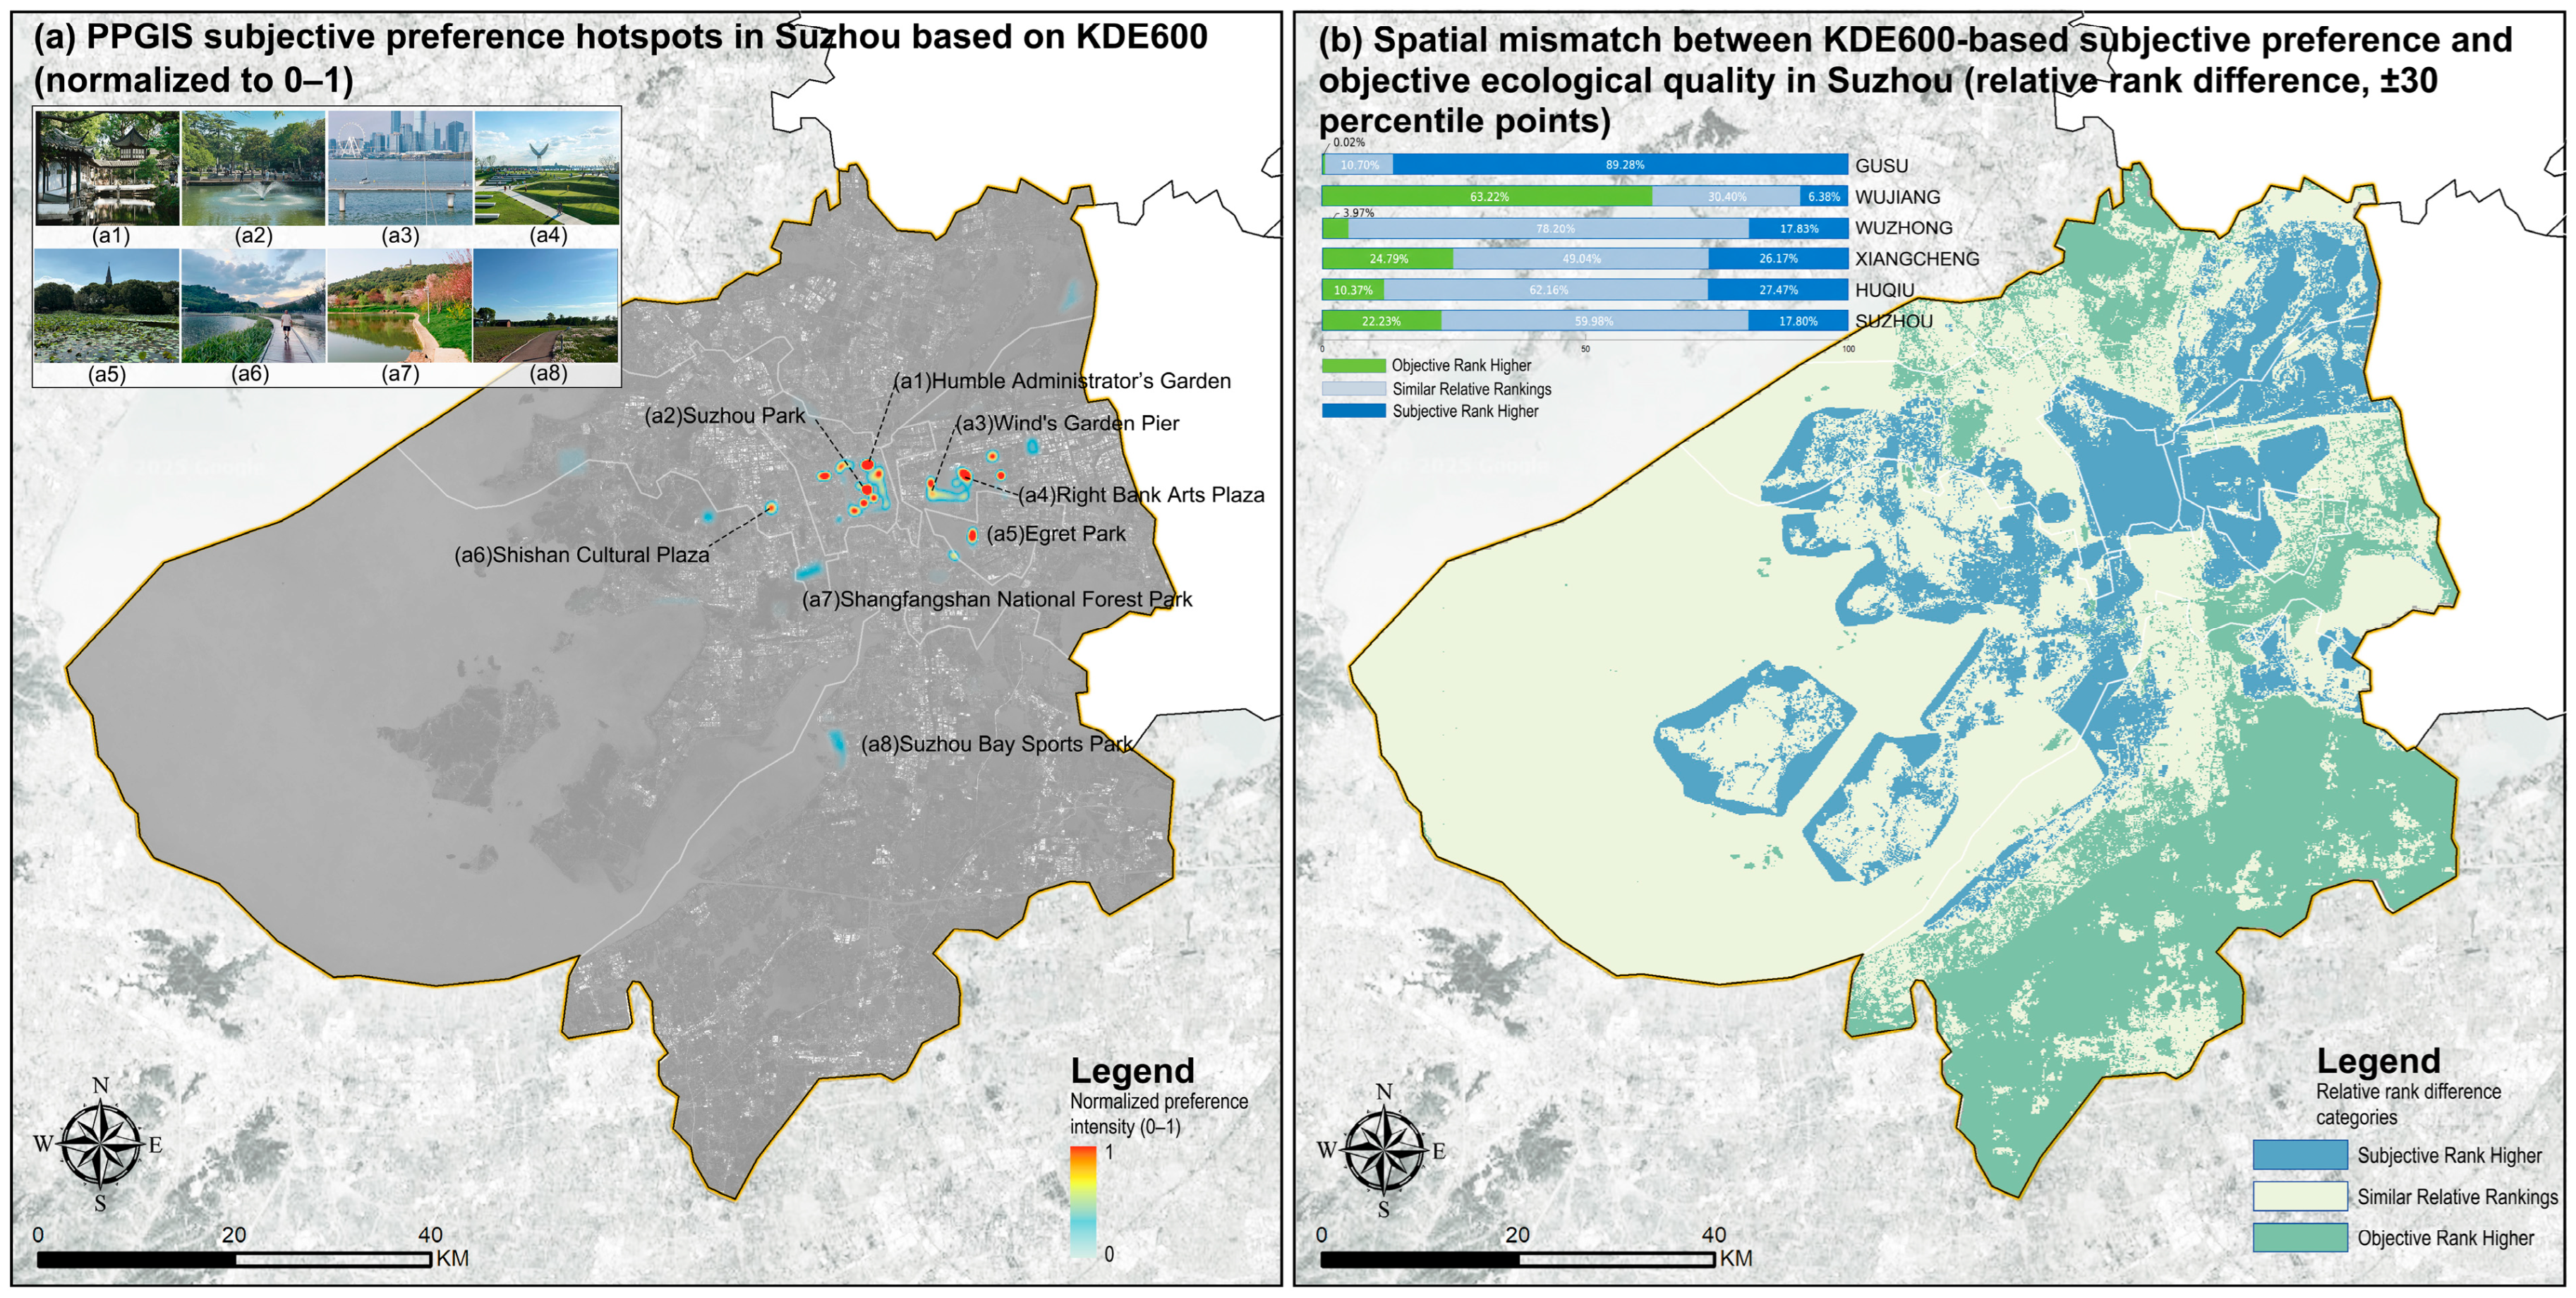
After digitisation and respondent-equal-weighted KDE, the 600 m preference surface revealed localised high-intensity clusters. Selected GBI locations are labelled in Figure 4a. To compare objective ESB and subjective preference without assuming that their normalised values represent equivalent measurement magnitudes, we examined their relative percentile ranks within the common valid analysis area (N = 461,175 cells; approximately 4611.7 km2; Figure 4b). Under the primary ±30-percentile-point threshold, 22.23% of the area was classified as objectively stronger, 59.98% as relatively close in rank, and 17.80% as subjectively stronger. District-level patterns varied substantially: Wujiang had the largest share of objectively stronger areas (63.22%), whereas Gusu had the largest share of subjectively stronger areas (89.28%). Wuzhong was dominated by areas with relatively close rankings (78.20%). Threshold sensitivity analysis showed that the relatively close class accounted for 48.29% of the common valid area under the ±20 threshold and 75.14% under the ±40 threshold. The corresponding proportions of objectively stronger and subjectively stronger areas also changed with the threshold (Supplemental Material S8, Table S2a,b). These classes describe differences in relative spatial standing within Suzhou rather than direct differences in the absolute magnitude of ecosystem-service performance and public preference.
Figure 4.
(a) PPGIS-derived subjective-preference intensity mapped using respondent-equal-weighted KDE with a 600 m bandwidth and 100 m output cell size. Values were normalised to 0–1 for visualisation. Inset photographs show selected GBI locations. (b) Differences between the percentile ranks of KDE600 and ESB within the common valid area, classified as objectively stronger, relatively close in rank, or subjectively stronger using a ±30-percentile-point threshold. The inset bar chart shows the area proportions of the three classes by district and for Suzhou as a whole.
The bandwidth sensitivity analysis demonstrated a high degree of consistency in subjective-preference spatial patterns. Pairwise Spearman rank correlations across the 300, 600, and 800 m KDE surfaces ranged from 0.9773 to 0.9948 for the entire study area (n = 464,346 cells). When the analysis was restricted to cells with positive density under at least one bandwidth (n = 357,871), correlations remained high (ρ = 0.9623–0.9909). The Jaccard overlap of the top-decile high-value areas ranged from 0.8358 to 0.9169, with the lowest overlap observed between 300 and 800 m and the highest between 600 and 800 m. A total of 42,171 cells were consistently identified as high-value areas under all three bandwidths. These findings indicate that the overall spatial ranking of subjective preference was relatively stable across the tested bandwidths, although the exact extent of high-value areas showed some sensitivity to bandwidth selection (Supplemental Material S9, Figure S1 and Table S3a,b).
3.3. Determinants of GBI Type Choice: Multinomial Modelling of Subjective Drive
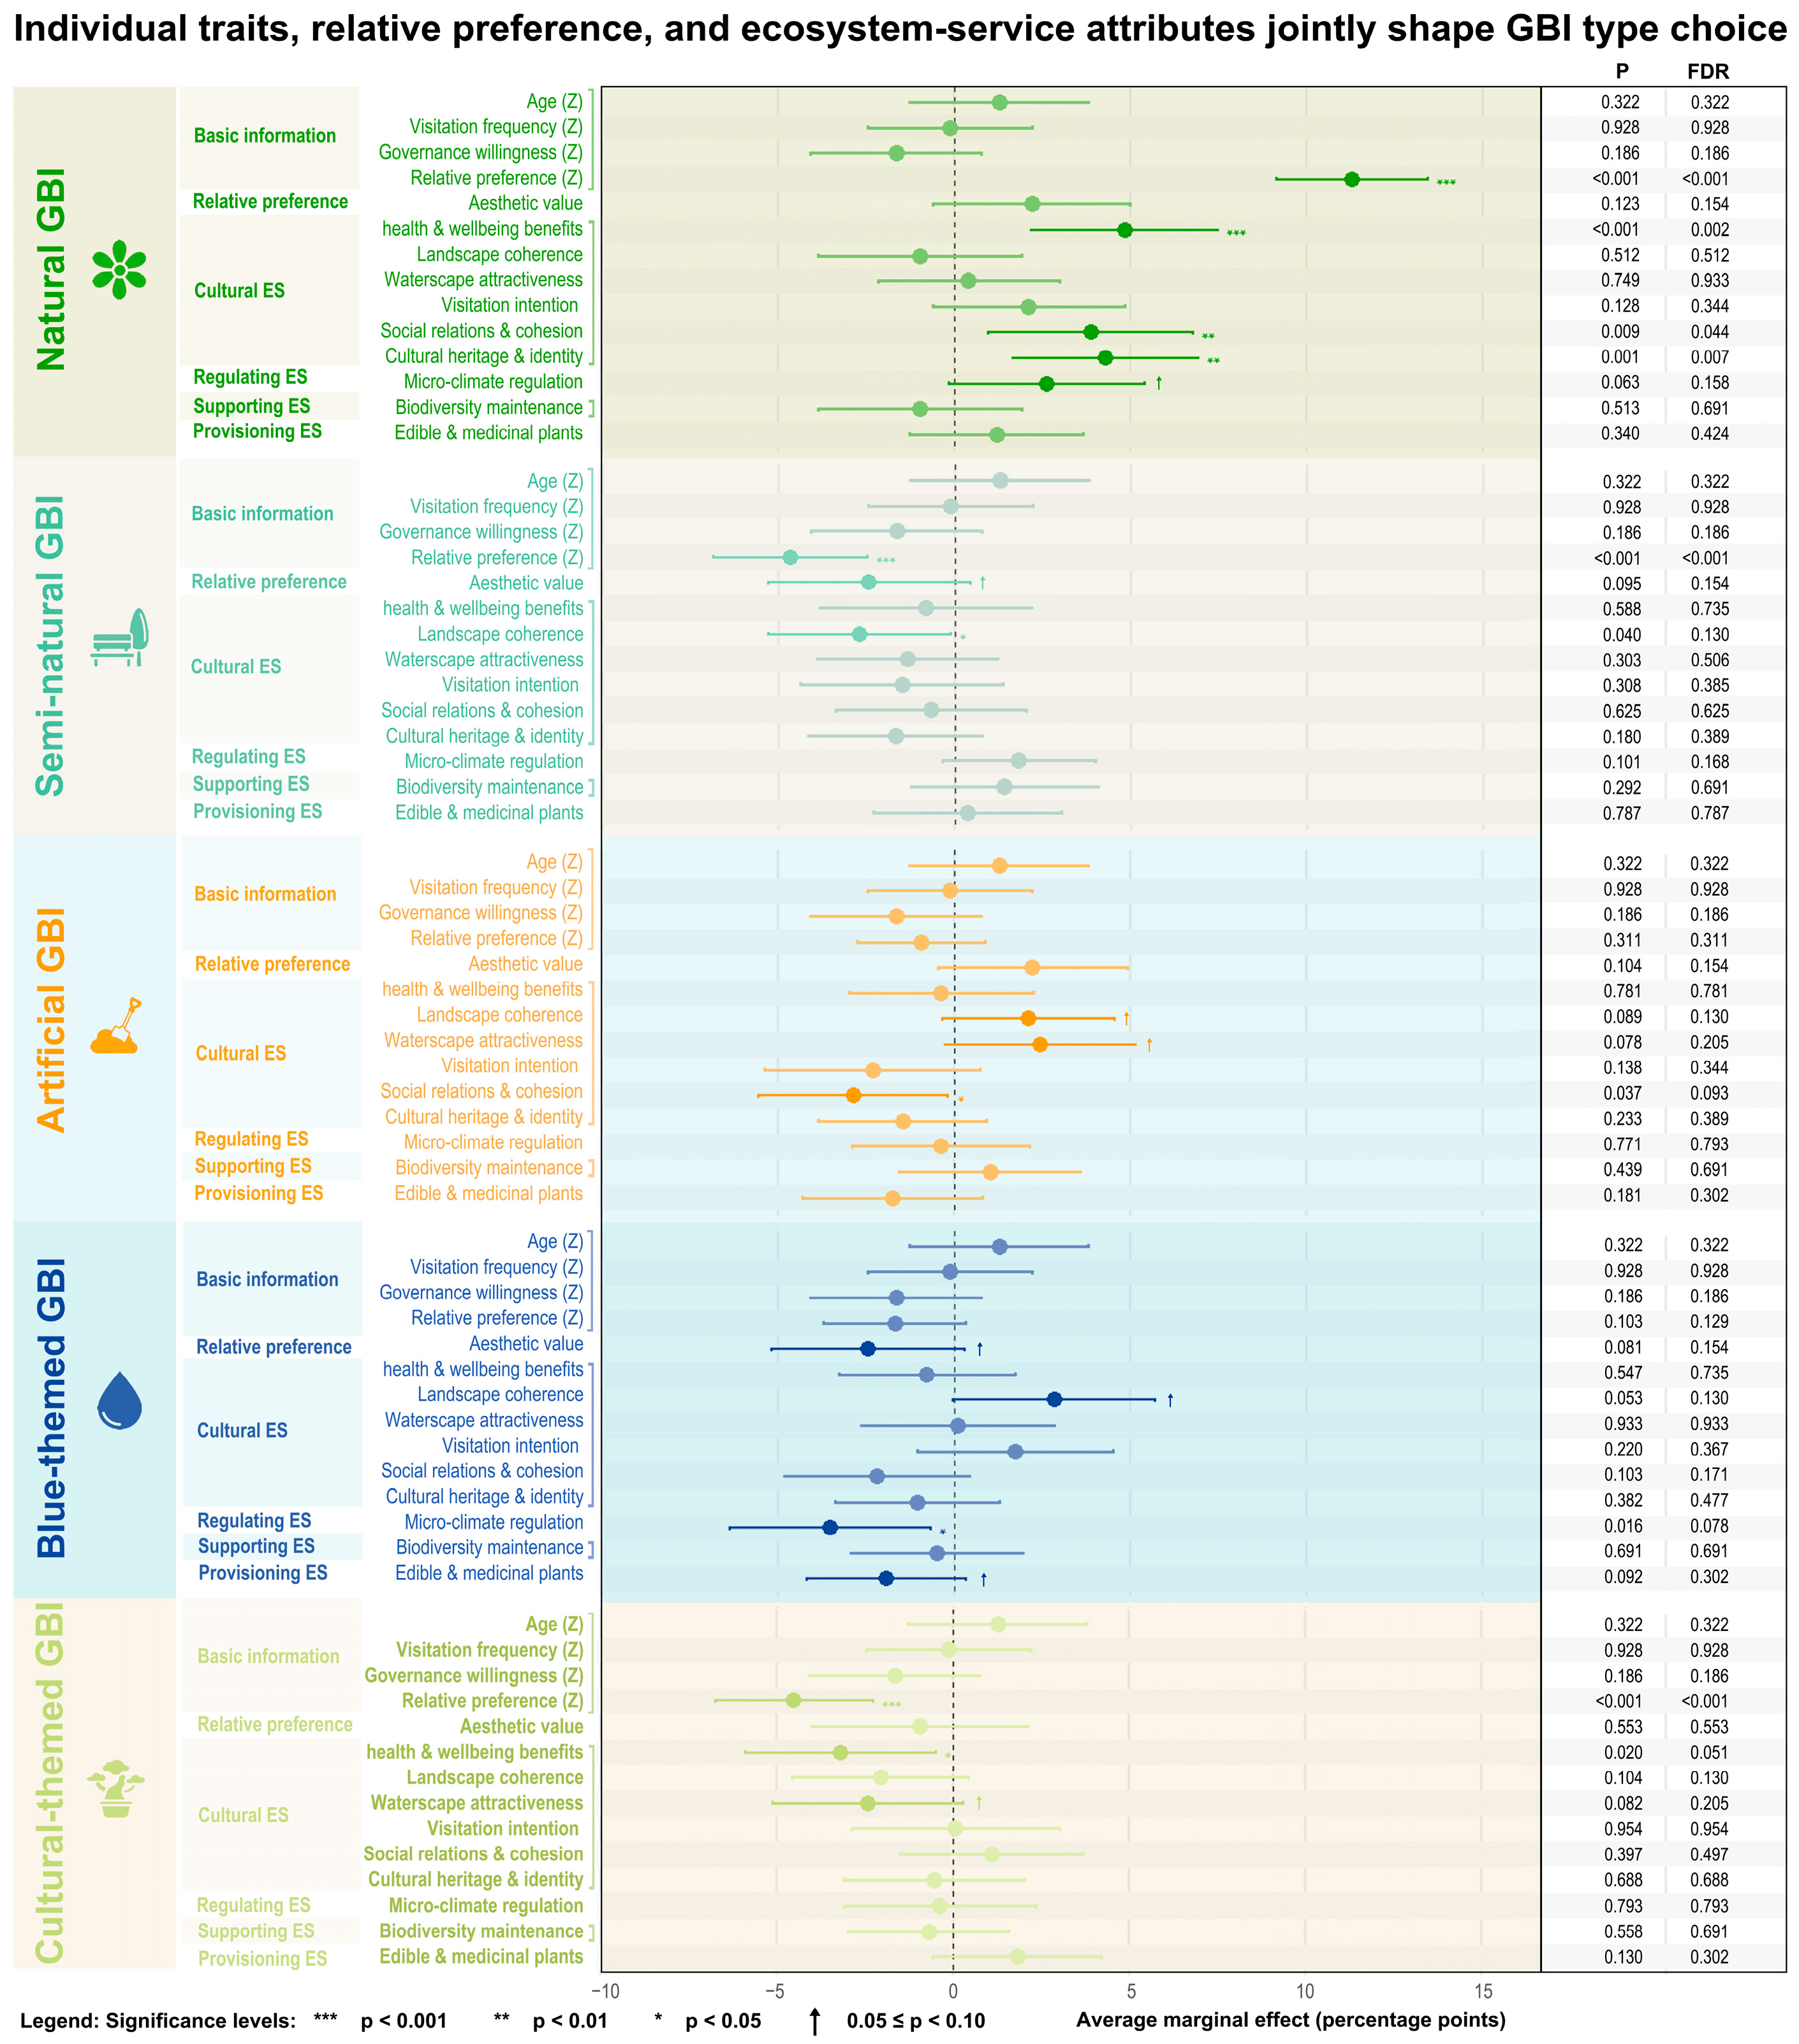
In the multinomial logit, we report average marginal effects (AME, percentage points; BH–FDR adjusted) based on the questionnaire data (Figure 5). A positive AME indicates that a one-standard-deviation increase in an attribute raises the probability of choosing that type, whereas a negative AME indicates a decrease in that probability—i.e., preference spills over to other types. Results show that relative preference is the strongest positive predictor across three type choices (natural, semi-natural, cultural; all p = 0.001), essentially validating the internal consistency of the scale structure. Type-specific results are as follows: for natural types, coefficients are almost uniformly positive, with significant items ‘social relations and cohesion’ (p = 0.009) and ‘heritage and identity’ (p = 0.001), and a marginally positive ‘microclimate regulation’ (p = 0.063), indicating that strengthening these cues shifts preferences towards natural types. For semi-natural types, most significant items are negative: ‘landscape coherence’ is significantly negative (p = 0.040) and ‘aesthetic value’ is marginally negative (p = 0.095), suggesting that when these perceptions strengthen, preferences shift away from semi-natural types. For artificial types, ‘social relations and cohesion’ is significantly negative (p = 0.037), with marginally negative ‘landscape coherence’ (p = 0.089) and ‘waterscape attraction’ (p = 0.078), indicating that social or landscape-oriented preferences more readily direct preferences towards non-artificial settings. For blue-themed types, aside from a marginally positive ‘landscape coherence’ (p = 0.053), most significant or marginally significant items are negative—‘microclimate regulation’ (p = 0.016), ‘aesthetic value’ (p = 0.081), and ‘edible/medicinal plants’ (p = 0.092)—implying that stronger functional or provisioning preferences shift preferences towards natural/semi-natural types. For cultural-themed types, ‘health and well-being benefits (restoration)’ is significantly negative (p = 0.020) and ‘waterscape attraction’ is marginally negative (p = 0.082), indicating preference spillover to non-cultural types. Baseline characteristics (age, visitation frequency, willingness to engage in governance) have generally small and unstable effects after controlling for relative preferences and items (mostly p ≥ 0.10); (see Supplemental Material S10).
Figure 5.
Average marginal effects (AME, percentage points) with 95% confidence intervals for baseline covariates, type-level relative preferences and item-level matched relative preferences; right-hand columns report p-values and BH–FDR.
4. Discussion
4.1. Peripheral Water–Green Backbone as the ES Driver; Inner Core as a Pressure Hotspot
The results indicate that Suzhou exhibits a blue–green backbone structured by the Lake Tai shoreline, river-network corridors, the western hills, and the southern wetlands; provisioning, regulating, and supporting services are pronounced at the periphery, whereas they are weaker in the inner city owing to high-intensity use and the urban heat island. Mechanistically, proximity to water and the wetland network directly underpins hydrology and retention; ventilation corridors directly shape the thermal environment and, together with open water, co-influence the local microclimate; continuous hill forests elevate habitat quality and carbon storage; while in the central built-up area, high POI density and human activity combined with higher land-surface temperatures dilute per-unit-area ecological performance. A similar peripheral carrying capacity–inner-city pressure centre gradient has been repeatedly documented in many studies [14,38]. Suzhou’s particularity lies in the way its dense water network and expansive lakefront jointly amplify regulating and supporting services, strengthening the continuity between blue and green. This specificity has been evidenced for subtropical hot–humid regions (including Suzhou), where water bodies exhibit larger and more stable cooling footprints and efficiencies, with waterbody morphology and scale often acting as dominant controls [39]. Accordingly, citywide priorities should favour water–greenspace co-ordinated GBI units, with particular emphasis on connectivity and the optimisation of hydrological processes, to increase the scale and balance of regulating and supporting services [40,41].
4.2. Relative Spatial Rankings and Type-Level Perceptions
In our subjective results, cultural and blue-themed GBI scenarios more readily elicit subjective preference and willingness to visit, whereas natural/semi-natural GBI scenarios are more readily recognised as delivering ecological functions such as microclimate regulation and biodiversity maintenance. This has been corroborated by many other studies [42,43,44]. At the spatial level, the rank-based comparison identifies heterogeneous relative standings between objective ESB and subjective KDE600, but it does not quantify the magnitude of a perception–function gap. Under the ±30-percentile-point threshold, 22.23% of the common valid area had a higher relative ESB rank, 59.98% showed relatively close rankings, and 17.80% had a higher relative KDE600 rank. The district-level results further indicate substantial spatial heterogeneity: objectively stronger areas were most prevalent in Wujiang, subjectively stronger areas in Gusu, and relatively close rankings in Wuzhong. These patterns identify locations for further investigation rather than establish why the differences occur. Accessibility, visitation frequency, place identity, and the visibility of ecological processes may be relevant explanatory hypotheses, as suggested by previous studies [40,45], but the present cross-sectional analysis does not test them as causal explanations. The VPS results provide complementary type-level evidence on how respondents evaluate microclimate, aesthetic, and cultural attributes across GBI contexts; these findings should be interpreted alongside, rather than as a direct explanation of, the mapped rank differences.
Contrary to findings that often associate water bodies with strongly perceived regulating or supporting functions [46], our item-level results indicate that blue-themed types received lower ratings than natural and semi-natural types for the microclimate-regulation and biodiversity-maintenance items. This likely reflects invisibility rather than absence of function: hydrological and ecological effects tend to manifest at event or seasonal scales, and their immediate salience is frequently diluted by waterside hardscaping, concerns about riparian safety, and water-quality issues. This underscores that blue–green co-ordination in morphology and interface design is crucial for enhancing the perceptibility of blue functions [40,47].
4.3. Preferences Follow Cues, Not Just Supply
Evidence shows that choices among GBI types are not a simple projection of objective supply but are dominated by perceptible cues in a supply–cue–choice process; immediate sensations from canopy shade give natural and semi-natural types an advantage in the subjective recognition of microclimate regulation, consistent with extensive research on shade-induced cooling and thermal comfort [48]. In prior studies, cultural-heritage and landmark waterfront spaces often receive higher scores for aesthetics and willingness to visit owing to their symbolism and place narratives [45,49]. We observe this in both cultural- and blue-themed contexts, indicating that subjective preference is shaped by two pathways: immediate physiological feedback (temperature, humidity, wind, radiation) and accumulated meaning cues (landscape imagery and socio-cultural experience).
Regarding preferences for specific GBI types, blue-themed contexts exhibit negative marginal effects on functional items, differing from many findings that “waterfront cooling is positively perceived” [50]. Possibly because the cooling and habitat functions of water bodies are contingent on events and boundary conditions, and safety or water-quality concerns dilute perception, rendering these functions less visible and weakening subjective support. Cultural-themed contexts show a negative marginal effect on the health and well-being item, at variance with the common finding that cultural landscapes promote restoration [51]. Given that our cultural sites are mostly in the high-density, high-activity inner old city, such intensity may attenuate feelings of static restoration while still elevating aesthetics and identity; thus, when health-related cues strengthen, preferences spill over towards quieter natural or semi-natural settings. In addition, semi-natural types are crowded out when aesthetics and coherence increase, implying that once a landscape crosses a higher aesthetic threshold, respondents are more inclined to reclassify it as natural or cultural, reflecting category-boundary drift and an iconicity preference effect. By contrast, most existing studies treat aesthetics/coherence as within-type positives—i.e., higher scores increase the likelihood of choosing that same type [40]. This divergence likely arises because Suzhou’s density of heritage/landmark assets raises aesthetic thresholds that trigger reclassification towards natural/cultural, and because our use of relative preferences with a multinomial choice model captures cross-type substitution, which appears as crowding-out. The observed associations suggest that perceptual cues and individual preferences may be related to GBI type choice. These findings complement the spatial ranking comparison but do not establish causal pathways between objective ecosystem-service conditions, perceived attributes, and preferences.
4.4. Dual-Track Assessment: Objective and Subjective
NbS-based GBI planning principles provide a clear direction for urban blue–green systems [52] and are consistent with our findings: they emphasise city-scale layout with connectivity and hydrological processes as the backbone; consider regulating services alongside cultural experience; and progressively embed performance orientation, rather than area-based targets, into planning and project management [53,54,55]. In Suzhou, these principles can be informed by the objective ESB map, the KDE600 preference surface, and their relative-rank comparison. Because this comparison identifies differences in relative spatial standing rather than calibrated differences in absolute magnitudes, the resulting classes should be used to prioritise locations for further assessment and engagement, rather than as proof that a location has been objectively under-recognised or subjectively overvalued. Routine monitoring could combine the two maps to identify where improving access, communicating ecological functions, or adapting waterfront interfaces may warrant investigation; the effects of such interventions on visitation or well-being would need to be evaluated separately.
Relative to the evidence chain in this study, current policies still show gaps: first, single-track assessment—there is a lack of dual-track indicators pairing objective ecological performance with subjective perception, hindering timely identification of mismatch hotspots [56]; second, insufficient standardisation of blue–green–wind interfaces, rendering water-regulation benefits invisible/non-diffusive [57]; third, missing data–operations feedback loops—systematic records and long-term monitoring of microclimate parameters are lacking, and cultural hotspots also lack institutionalised capacity management and quiet-space provision [58].
Within the existing policy context, we recommend three parallel optimisations: (1) precision increments and equitable risk reduction—codify species–canopy–urban-form coupling in development control and reviews; (2) blue–green interface retrofits—replace hard revetments with composite sections combining shade–ventilation–riparian access, and concurrently advance waterfront micro-renewals and open water-quality information to enhance the perceptibility of blue functions; (3) dual-track assessment and co-governance—publish annual lists of mismatch hotspots based on objective and subjective indicators; at inner-city cultural nodes, introduce capacity management and quiet-space provision together with place-based narratives to balance aesthetics and restoration and to prevent crowding-out and performance dilution where perception is high but function is low.
4.5. Limitations
This study uses a single-city, spring, cross-sectional design, which cannot capture seasonal dynamics or extreme events. To mitigate bias, we performed 2024 multi-temporal annual compositing with harmonised projection/resolution on the objective side, and on the subjective side surveyed nine sites across weekdays/weekends (09:00–20:00) and used PPGIS–KDE to build a continuous preference surface. Remote sensing and InVEST are proxy indicators with potential scale/parameter sensitivity; accordingly, we applied two-step Z-score standardisation and within-group equal-weighted aggregation, ran three robustness checks (jackknife, aggregation-form substitution, threshold/classification sensitivity) plus Moran’s I diagnostics. The results showed relatively stable overall rankings under indicator-omission tests, whereas the spatial extent of priority areas was more sensitive to aggregation and classification settings. In particular, the InVEST UFRM indicator represents modelled flood-mitigation potential under the specified rainfall-depth and curve-number assumptions, rather than observed flood mitigation. As the output was not validated against observed flood events or runoff in this study, it should be interpreted as a scenario-specific proxy. Because VPS scores can be affected by scene and individual differences, we used location-stratified sampling and type/item relative preferences to control rating tendencies, with covariates Z-standardised. Looking ahead, we will conduct multi-season and event-period in situ environment–thermal-perception co-measurements and shade–ventilation–riparian-access experiments to build a causal pipeline from supply to cues to choice, and extend the dual-track (objective–subjective) assessment to other cities. The VPS questionnaire included seven cultural-service items and one item for each of the other three dimensions. Thus, the ten-item composite does not weight the four dimensions equally and should be interpreted as an item-based summary rather than a dimensionally balanced measure. Future research should adopt a more balanced and validated questionnaire to improve comparability across dimensions.
5. Conclusions
This study demonstrates that ecological assessments and public preferences provide complementary perspectives on urban blue–green infrastructure (GBI). In Suzhou, areas with higher relative ecosystem service balance (ESB) rankings were more prevalent along the peripheral network of Lake Tai, rivers, hills, and wetlands, whereas higher relative preference rankings occurred more frequently along inner city cultural corridors and waterfronts. Although the overall spatial ranking patterns were robust across the tested kernel density estimation bandwidths, the boundaries of high preference areas varied. These findings highlight the spatial heterogeneity of ecological performance and public appreciation, showing why neither ecological indicators nor public preferences alone provide a sufficient basis for assessing urban blue green environments. Importantly, the comparison identifies differences in relative spatial standing rather than calibrated gaps in absolute ecological performance and public preference.
The preference survey further suggests that choices among GBI landscape contexts are associated with perceptual and sociocultural attributes. In particular, social relations and cohesion, as well as cultural heritage and identity, were positively associated with the choice of natural GBI. Together, these findings support a context sensitive approach to urban GBI planning. Peripheral wetlands and natural shorelines may warrant further assessment of habitat conservation, water regulation, and the accessibility and visibility of ecological benefits. In inner city waterways and historic districts, planning may need to balance ecological quality with public access, cultural experience, heritage protection, and visitor pressures. The proposed dual track framework can help identify locations for further investigation and public engagement, while supporting differentiated planning responses across urban and rural landscape settings.
Several limitations warrant consideration. The analysis is based on a single city and cross-sectional preference data, while some ecological indicators are derived from remote sensing or model-based estimates. Future research should validate these indicators with field observations, extend the framework across seasons and cities, and use longitudinal or intervention-based designs to evaluate the effects of planning interventions on ecological performance and public experience.
Supplementary Materials
The following supporting information can be downloaded at: https://www.mdpi.com/article/10.3390/su182111134/s1, Supplemental Material S1: Key International Policies on Green-Blue Infrastructure [59,60,61]; Supplemental Material S2: GBI Conceptual Classification (Main Classes + Cross-Cutting Strata); Supplemental Material S3: Objective Data Sources Summary: Data Sources, Processing Workflow, and Export Settings for Study Indicators; Supplemental Material S4: Questionnaire; Supplemental Material S5: District Statistics of Objective Variables and Three Biophysical ES Indices (0–1 Normalized; Suzhou, 2024); Supplemental Material S6: ESB Robustness Checks: Jackknife Indicator-Omission Sensitivity, Alternative Aggregation, Threshold and Classification Sensitivity, and Spatial Autocorrelation (Moran’s I); Supplemental Material S7: VPS Survey Basics and Type-Preference Score Summary; Supplemental Material S8: Sensitivity Analysis of Objective–Subjective Relative Ranking Differences; Supplemental Material S9: Summary of KDE Bandwidth Sensitivity Analysis (Figure S1 and Table S3a,b); Supplemental Material S10: Average Marginal Effects (AME) from Multinomial Logit Models of GBI Type Choice.
Author Contributions
Conceptualization, H.Z. and C.M.; methodology, H.Z. and C.M.; formal analysis, H.Z.; investigation, H.Z. and X.S.; supervision, C.M.; writing—original draft preparation, H.Z., C.M., and X.S.; writing—review and editing, H.Z., C.M., and X.S. All authors have read and agreed to the published version of the manuscript.
Funding
This research was supported by the Shaanxi Provincial Department of Education (Grant No. 20JK0814), awarded to the corresponding author, Chenyue Mao.
Institutional Review Board Statement
The study was conducted in accordance with the Declaration of Helsinki and approved by the Ethics Committee of the School of Arts, Soochow University (protocol code SOASCU202519; approval date: 21 January 2025).
Informed Consent Statement
Informed consent was obtained from all participants involved in the study. Because the survey was anonymous, the informed-consent information was provided on the first page of the questionnaire, and written signatures were not collected. Participants indicated their informed consent by proceeding with and submitting the questionnaire.
Data Availability Statement
The objective data sources, data-processing workflows, and export settings used in this study are documented in Supplemental Material S3. The questionnaire used to collect subjective data is provided in Supplemental Material S4. The survey data and any additional data supporting the findings of this study are available from the corresponding author upon reasonable request.
Conflicts of Interest
The authors declare no conflict of interest.
References
- Population Division of the United Nations Department of Economic and Social Affairs. 68% of the World Population Projected to Live in Urban Areas by 2050; Population Division of the United Nations Department of Economic and Social Affairs: New York, NY, USA, 2018; Available online: https://population.un.org/wup/assets/WUP2018-PressRelease.pdf (accessed on 27 October 2026).
- UN-Habitat. World Cities Report 2022: Envisaging the Future of Cities; UN-Habitat: Nairobi, Kenya, 2022; Available online: https://unhabitat.org/world-cities-report-2022-envisaging-the-future-of-cities (accessed on 27 October 2026).
- Carpenter, S.R.; Mooney, H.A.; Agard, J.; Capistrano, D.; DeFries, R.S.; Díaz, S.; Dietz, T.; Duraiappah, A.K.; Oteng-Yeboah, A.; Pereira, H.M.; et al. Science for managing ecosystem services: Beyond the Millennium Ecosystem Assessment. Proc. Natl. Acad. Sci. USA 2009, 106, 1305–1312. [Google Scholar] [CrossRef] [Scilit] [PubMed]
- Wang, Y.; Fu, Q.; Guo, J.; Wang, T.; Chen, J. Unveiling the dynamics of urbanization and ecosystem services: Insights from the Su-Xi-Chang Region, China. npj Urban Sustain. 2024, 4, 36. [Google Scholar] [CrossRef] [Scilit]
- Perera, A.C.S.; Davies, P.J.; Graham, P.L. A global review of urban blue-green planning tools. Land Use Policy 2024, 140, 107093. [Google Scholar] [CrossRef] [Scilit]
- Lamond, J.; Everett, G. Willing to have, willing to help, or ready to own—Determinants of variants of stewardship social practices around Blue-Green Infrastructure in dense urban communities. Front. Water 2023, 5, 1048494. [Google Scholar] [CrossRef] [Scilit]
- Melon, M.; Sikorski, P.; Archiciński, P.; Łaszkiewicz, E.; Hoppa, A.; Zaniewski, P.; Zaniewska, E.; Strużyński, W.; Sudnik-Wójcikowska, B.; Sikorska, D. Nature on our doorstep: How do residents perceive urban parks vs. biodiverse areas? Landsc. Urban Plan. 2024, 247, 105059. [Google Scholar] [CrossRef] [Scilit]
- Milcu, A.I.; Hanspach, J.; Abson, D.; Fischer, J. Cultural Ecosystem Services: A Literature Review and Prospects for Future Research. Ecol. Soc. 2013, 18, 44. [Google Scholar] [CrossRef] [Scilit]
- Veerkamp, C.J.; Schipper, A.M.; Hedlund, K.; Lazarova, T.; Nordin, A.; Hanson, H.I. A review of studies assessing ecosystem services provided by urban green and blue infrastructure. Ecosyst. Serv. 2021, 52, 101367. [Google Scholar] [CrossRef] [Scilit]
- Gledhill, D.G.; James, P. Rethinking urban blue spaces from a landscape perspective: Species, scale and the human element. Salzb. Geogr. Arb. 2008, 42, 151–164. [Google Scholar]
- Kumar, P.; Debele, S.E.; Khalili, S.; Halios, C.H.; Sahani, J.; Aghamohammadi, N.; Andrade, M.D.F.; Athanassiadou, M.; Bhui, K.; Calvillo, N.; et al. Urban heat mitigation by green and blue infrastructure: Drivers, effectiveness, and future needs. Innovation 2024, 5, 100588. [Google Scholar] [CrossRef] [Scilit] [PubMed]
- White, M.P.; Elliott, L.R.; Gascon, M.; Roberts, B.; Fleming, L.E. Blue space, health and well-being: A narrative overview and synthesis of potential benefits. Environ. Res. 2020, 191, 110169. [Google Scholar] [CrossRef] [Scilit] [PubMed]
- United Nations. Transforming Our World: The 2030 Agenda for Sustainable Development; (A/RES/70/1); United Nations: Geneva, Switzerland, 2015; Available online: https://docs.un.org/en/A/res/70/1 (accessed on 27 October 2026).
- Yang, Z.; Yang, J.; Chen, S. Neighborhood Effects of Blue Space in Historical Environments on the Mental Health of Older Adults: A Case Study of the Ancient City of Suzhou, China. Land 2024, 13, 1328. [Google Scholar] [CrossRef] [Scilit]
- McPhearson, T.; Andersson, E.; Elmqvist, T.; Frantzeskaki, N. Resilience of and through urban ecosystem services. Ecosyst. Serv. 2015, 12, 152–156. [Google Scholar] [CrossRef] [Scilit]
- Su, R.; Ye, S.; Yu, L.; Wu, J.; Kang, Y.; Chen, R. Social and ecological factors on the perception of cultural ecosystem services and disservices: Insights from Shanghai, China. Landsc. Urban Plan. 2025, 259, 105373. [Google Scholar] [CrossRef] [Scilit]
- Ghofrani, Z.; Sposito, V.; Faggian, R. A Comprehensive Review of Blue-Green Infrastructure Concepts. Int. J. Environ. Sustain. 2017, 6, 15–36. [Google Scholar] [CrossRef] [Scilit]
- Macháč, J.; Brabec, J.; Arnberger, A. Exploring public preferences and preference heterogeneity for green and blue infrastructure in urban green spaces. Urban For. Urban Green. 2022, 75, 127695. [Google Scholar] [CrossRef] [Scilit]
- Mishra, H.S.; Bell, S.; Roberts, B.R.; White, M.P. Theory-based design for promoting positive behaviours in an urban blue space: Pre-and-post observations of a community co-created intervention in Plymouth, United Kingdom. Landsc. Urban Plan. 2023, 233, 104708. [Google Scholar] [CrossRef] [Scilit]
- Pauleit, S.; Ambrose-Oji, B.; Andersson, E.; Anton, B.; Buijs, A.; Haase, D.; Elands, B.; Hansen, R.; Kowarik, I.; Kronenberg, J.; et al. Advancing urban green infrastructure in Europe: Outcomes and reflections from the GREEN SURGE project. Urban For. Urban Green. 2019, 40, 4–16. [Google Scholar] [CrossRef] [Scilit]
- Sutton-Grier, A.E.; Wowk, K.; Bamford, H. Future of our coasts: The potential for natural and hybrid infrastructure to enhance the resilience of our coastal communities, economies and ecosystems. Environ. Sci. Policy 2015, 51, 137–148. [Google Scholar] [CrossRef] [Scilit]
- Zhang, L.; Wang, S.; Zhai, W.; He, Z.; Shi, W.; Li, Y.; Zhao, C. How does Blue-Green Infrastructure affect the urban thermal environment across various functional zones? Urban For. Urban Green. 2025, 105, 128698. [Google Scholar] [CrossRef] [Scilit]
- Wolff, M. Taking one step further—Advancing the measurement of green and blue area accessibility using spatial network analysis. Ecol. Indic. 2021, 126, 107665. [Google Scholar] [CrossRef] [Scilit]
- Qiu, X.; Kil, S.-H.; Jo, H.-K.; Park, C.; Song, W.; Choi, Y.E. Cooling Effect of Urban Blue and Green Spaces: A Case Study of Changsha, China. Int. J. Environ. Res. Public Health 2023, 20, 2613. [Google Scholar] [CrossRef] [Scilit] [PubMed]
- Hasan, M.M.; Pramanik, M.; Alam, I.; Kumar, A.; Avtar, R.; Zhran, M. Assessing the efficacy of artificial intelligence based city-scale blue green infrastructure mapping using Google Earth Engine in the Bangkok metropolitan region. J. Urban Manag. 2025, 14, 434–450. [Google Scholar] [CrossRef] [Scilit]
- Sánchez, I.A.V. Accessing eye-level greenness visibility from open-source street view images: A methodological development and implementation in multi-city and multi-country contexts. Sustain. Cities Soc. 2024, 103, 105262. [Google Scholar] [CrossRef] [Scilit]
- Wang, J.; Foley, K. Preference and perception of individuals for blue-green infrastructure in the promotion of climate-resilient cities: A visual experiment in Ireland and China. Urban For. Urban Green. 2025, 106, 128730. [Google Scholar] [CrossRef] [Scilit]
- Rall, E.; Hansen, R.; Pauleit, S. The added value of public participation GIS (PPGIS) for urban green infrastructure planning. Urban For. Urban Green. 2019, 40, 264–274. [Google Scholar] [CrossRef] [Scilit]
- Huai, S.; Chen, F.; Liu, S.; Canters, F.; Van De Voorde, T. Using social media photos and computer vision to assess cultural ecosystem services and landscape features in urban parks. Ecosyst. Serv. 2022, 57, 101475. [Google Scholar] [CrossRef] [Scilit]
- Dou, Y.; Yu, X.; Bakker, M.; De Groot, R.; Carsjens, G.J.; Duan, H.; Huang, C. Analysis of the relationship between cross-cultural perceptions of landscapes and cultural ecosystem services in Genheyuan region, Northeast China. Ecosyst. Serv. 2020, 43, 101112. [Google Scholar] [CrossRef] [Scilit]
- Xiao, Y. Barriers to Public Participation in Urban Green Infrastructure in China from Stakeholders’ and Residents’ Perspective, A Case Study in Yangzhou. Int. J. Soc. Sci. Public Adm. 2024, 3, 43–57. [Google Scholar] [CrossRef] [Scilit]
- Mouratidis, K. How COVID-19 reshaped quality of life in cities: A synthesis and implications for urban planning. Land Use Policy 2021, 111, 105772. [Google Scholar] [CrossRef] [Scilit] [PubMed]
- Liu, D.; Kwan, M.-P.; Yang, Z.; Kan, Z. Comparing subjective and objective greenspace accessibility: Implications for real greenspace usage among adults. Urban For. Urban Green. 2024, 96, 128335. [Google Scholar] [CrossRef] [Scilit]
- Wood, K.A.; Jupe, L.L.; Aguiar, F.C.; Collins, A.M.; Davidson, S.J.; Freeman, W.; Kirkpatrick, L.; Lobato-de Magalhães, T.; McKinley, E.; Nuno, A.; et al. A global systematic review of the cultural ecosystem services provided by wetlands. Ecosyst. Serv. 2024, 70, 101673. [Google Scholar] [CrossRef] [Scilit]
- Ma, Y.; Yang, J. A review of methods for quantifying urban ecosystem services. Landsc. Urban Plan. 2025, 253, 105215. [Google Scholar] [CrossRef] [Scilit]
- UNESCO World Heritage Centre. World Heritage Committee Inscribes 46 New Sites on World Heritage List; UNESCO World Heritage Centre: Paris, France, 1997; Available online: https://whc.unesco.org/en/news/180/ (accessed on 27 October 2026).
- Convention on Wetlands (Ramsar Convention Secretariat). Wetland City Accreditation; Convention on Wetlands (Ramsar Convention Secretariat): Gland, Switzerland, 2025; Available online: https://www.ramsar.org/our-work/activities/wetland-city-accreditation (accessed on 27 October 2026).
- Massaro, E.; Schifanella, R.; Piccardo, M.; Caporaso, L.; Taubenböck, H.; Cescatti, A.; Duveiller, G. Spatially-optimized urban greening for reduction of population exposure to land surface temperature extremes. Nat. Commun. 2023, 14, 2903, Correction in Nat. Commun. 2023, 14, 5786. [Google Scholar] [CrossRef] [Scilit] [PubMed]
- Hu, N.; Wang, G.; Ma, Z.; Ren, Z.; Zhao, M.; Meng, J. The cooling effects of urban waterbodies and their driving forces in China. Ecol. Indic. 2023, 156, 111200. [Google Scholar] [CrossRef] [Scilit]
- Li, M. Enhancing the cooling effect of urban green infrastructure: An empirical analysis of interactive impacts and optimizing pathways over 310 Chinese cities. Landsc. Urban Plan. 2025, 259, 105344, Correction in Landsc. Urban Plan. 2026, 267, 105543. [Google Scholar] [CrossRef] [Scilit]
- Molné, F.; Donati, G.F.A.; Bolliger, J.; Fischer, M.; Maurer, M.; Bach, P.M. Supporting the planning of urban blue-green infrastructure for biodiversity: A multi-scale prioritisation framework. J. Environ. Manag. 2023, 342, 118069. [Google Scholar] [CrossRef] [Scilit] [PubMed]
- Hao, J.; Gao, T.; Qiu, L. How do species richness and colour diversity of plants affect public perception, preference and sense of restoration in urban green spaces? Urban For. Urban Green. 2024, 100, 128487. [Google Scholar] [CrossRef] [Scilit]
- Huang, S.; Xiao, X.; Tian, T.; Che, Y. Seasonal influences on preferences for urban blue-green spaces: Integrating land surface temperature into the assessment of cultural ecosystem service value. Sustain. Cities Soc. 2024, 102, 105237. [Google Scholar] [CrossRef] [Scilit]
- Jiao, M.; Jenerette, G.D.; Zhou, W.; Wang, J.; Zheng, Z. Adaptive shading: How microclimates and surface types amplify tree cooling effects? Urban For. Urban Green. 2024, 101, 128546. [Google Scholar] [CrossRef] [Scilit]
- Zou, Y.; Yang, Y.; Li, Y.; Liao, J.; Xiao, H. How do tourists’ heritage spatial perceptions affect place identity? A case study of Quanzhou, China. J. Hosp. Tour. Manag. 2023, 55, 460–470. [Google Scholar] [CrossRef] [Scilit]
- Zhang, R.; Zhu, L.; Yang, X.; Han, R.; Zhang, Y.; Kang, J. The effects of interaction with audiovisual elements on perceived restoration in urban parks in freezing weather. Urban For. Urban Green. 2024, 96, 128337. [Google Scholar] [CrossRef] [Scilit]
- Nian, X.; Cao, Y.; Li, Y.; Zhang, Y.; Hong, B. Effects of environmental factors on multisensory perceptions of comfort, safety, and pleasure in autumnal urban riverfront spaces. Sustain. Cities Soc. 2025, 131, 106710. [Google Scholar] [CrossRef] [Scilit]
- Li, W. The influence of visual and auditory environments in parks on visitors’ landscape preference, emotional state, and perceived restorativeness. Humanit. Soc. Sci. Commun. 2024, 11, 1491. [Google Scholar] [CrossRef] [Scilit]
- O’Sullivan, K.; Shirani, F.; Hale, R.; Pidgeon, N.; Henwood, K. Identity, place narrative and biophilic urban development: Connecting the past, present and future for sustainable liveable cities. Front. Sustain. Cities 2023, 5, 1139029. [Google Scholar] [CrossRef] [Scilit]
- Lam, C.K.C.; Pan, H.; Nie, W.; Li, X.; Wu, J.; Yin, Z.; Han, J. Effects of perceived environmental quality and psychological status on outdoor thermal comfort: A panel study in Southern China. Sustain. Cities Soc. 2024, 112, 105578. [Google Scholar] [CrossRef] [Scilit]
- Nie, X.; Wang, Q.; Wu, J.; Wang, H.; Chen, Z.; He, J. Effectively enhancing perceptions of cultural ecosystem services: A case study of a karst cultural ecosystem. J. Environ. Manag. 2022, 315, 115189. [Google Scholar] [CrossRef] [Scilit] [PubMed]
- IUCN. Global Standard for Nature-Based Solutions: A User-Friendly Framework for the Verification, Design and Scaling Up of NbS, 1st ed.; IUCN: Gland, Switzerland, 2020. [Google Scholar] [CrossRef] [Scilit]
- Li, L.; Carter, J. Exploring the relationship between urban green infrastructure connectivity, size and multifunctionality: A systematic review. Landsc. Ecol. 2025, 40, 61. [Google Scholar] [CrossRef] [Scilit] [PubMed]
- Sahay, S. Nature-based solutions as urban adaptation to climate risk: Framework for economic evaluation as decision support tool. Sustain. Cities Soc. 2025, 118, 106037. [Google Scholar] [CrossRef] [Scilit]
- Wan, J.; Wu, H.; Collins, R.; Deng, K.; Zhu, W.; Xiao, H.; Tang, X.; Tian, C.; Zhang, C.; Zhang, L. Integrative analysis of health restoration in urban blue-green spaces: A multiscale approach to community park. J. Clean. Prod. 2024, 435, 140178. [Google Scholar] [CrossRef] [Scilit]
- Tang, Y.; Xiao, W.; Yuan, F. Evaluating objective and perceived ecosystem service in urban context: An indirect method based on housing market. Landsc. Urban Plan. 2025, 254, 105245. [Google Scholar] [CrossRef] [Scilit]
- Guo, Q.; Lin, Y.; Zhang, X. Identification and cooling effect analysis of urban ventilation corridors in coastal hilly cities: A case study of Shenzhen. Urban Clim. 2025, 61, 102393. [Google Scholar] [CrossRef] [Scilit]
- O’Brien, C.M.; Mossman, M.; Chamberlain, L.; Jenkins, J.; Watson, J.; Wilson, R.; Williams-Clark, D.; Singer, A.; Riggio, K.; Gallet, D.; et al. Community-centered instrumentation and monitoring of nature-based solutions for urban stormwater control. Front. Water 2024, 6, 1370501. [Google Scholar] [CrossRef] [Scilit]
- UN-Habitat. New Urban Agenda; (A/RES/71/256*); UN-Habitat: Nairobi, Kenya, 2016; Available online: https://unhabitat.org/sites/default/files/2019/05/nua-english.pdf (accessed on 27 October 2026).
- Convention on Biological Diversity. Kunming-Montreal Global Biodiversity Framework; (CBD/COP/DEC/15/4); Convention on Biological Diversity: Montreal, QC, Canada, 2022; Available online: https://www.cbd.int/doc/decisions/cop-15/cop-15-dec-04-en.pdf (accessed on 27 October 2026).
- European Commission. European Water Resilience Strategy; (COM(2025) 280 final); European Commission: Brussels, Belgium, 2025; Available online: https://eur-lex.europa.eu/legal-content/EN/TXT/?uri=CELEX:52025DC0280 (accessed on 27 October 2026).

Disclaimer/Publisher’s Note: The statements, opinions and data contained in all publications are solely those of the individual author(s) and contributor(s) and not of MDPI and/or the editor(s). MDPI and/or the editor(s) disclaim responsibility for any injury to people or property resulting from any ideas, methods, instructions or products referred to in the content. |
© 2026 by the authors. Licensee MDPI, Basel, Switzerland. This article is an open access article distributed under the terms and conditions of the Creative Commons Attribution (CC BY) license.