


Abstract
China’s dual-carbon goals require the construction industry to overcome persistent constraints on efficiency, financing, and low-carbon transition, yet how digital inclusive finance and green finance jointly foster new quality productive forces in this sector remains underexplored. Drawing on the socio-technical deep transition framework, this study uses panel data from 30 provincial-level regions of China over 2011–2022 and applies panel vector autoregression, fixed-effects, moderating-effect, panel-threshold, and spatial Durbin models to examine dynamic effects, conditioning mechanisms, threshold effects, and spatial spillovers. Digital inclusive finance exerts a stable positive effect on new quality productive forces in the construction industry, whereas green finance is regionally heterogeneous in the short term but turns promotive over the long term. Coordinated development of the two significantly enhances new quality productive forces, and this effect is stronger in regions with higher economic development and stronger financial regulation; capital misallocation weakens it, while regional innovation capacity strengthens it. Human capital generates a threshold effect, and the coordinated development produces spatial spillovers across neighboring regions. These findings advance a finance-enabled understanding of new quality productive forces in the construction industry and underscore the importance of coordinated financial governance for sustainable industrial transformation and regional development.
1. Introduction
Since 2002, China’s construction industry has expanded rapidly, with total output exceeding CNY 30 trillion by the end of 2024. As a foundational sector of the national economy, the construction industry has made sustained contributions to China’s economic growth [1]. However, its growth rate has fallen below 10% in recent years. Demographic change, shifts in the stage of economic development, and weakening labor-cost advantages have eroded traditional drivers of construction growth. The development model based on factor inputs, labor intensity, and scale expansion is therefore under increasing pressure to transform. Construction and building operations also remain major sources of energy consumption and carbon emissions. At the same time, digital, intelligent, and green transformation in the industry remains lagging, constraining resource utilization, environmental governance, and organizational management efficiency [2]. It is therefore necessary to explore a development model for the construction industry in the new era and to cultivate new quality productive forces. New quality productive forces are innovation-led productive forces generated by technological breakthroughs, factor allocation innovation, and industrial transformation and upgrading. They are characterized by high technology, high efficiency, and high quality, and are consistent with the new development philosophy [3]. Since the proposition of “new quality productive forces” was put forward in 2023 and incorporated into the Government Work Report in 2024, it has provided clear guidance for the high-quality development of the construction industry. Examining new quality productive forces from the perspectives of digitalization and greening is therefore of practical significance.
Finance shapes production relations and factor reallocation through capital supply, risk pricing, and resource allocation. It therefore provides an institutional foundation for cultivating new quality productive forces [4]. However, traditional finance is limited by outreach costs, collateral requirements, and opaque project information. These constraints make it difficult to serve small and medium-sized enterprises along the construction industry chain or to finance green retrofitting. With the diffusion of digital technologies, digital inclusive finance and green finance have become important financial instruments for real-economy transformation. Digital inclusive finance expands financial service coverage and can alleviate financing constraints and improve matching efficiency for construction enterprises [5]. Green finance directs capital toward energy conservation, emission reduction, green construction, and low-carbon technologies through environmental standards, green credit, and responsible investment [6]. The socio-technical deep transition framework emphasizes that high-quality industrial transformation is not merely the diffusion of a single technology. It is also a coordinated restructuring of capital flows, technological trajectories, institutional rules, and organizational practices [7]. This framework is particularly relevant to the construction industry, which is characterized by long project cycles, dispersed participants, and strong spatial externalities.
Existing studies provide an important foundation for this paper. Digital inclusive finance can relieve financing constraints, improve access to financial services, and strengthen information matching, thereby promoting enterprise innovation and industrial upgrading [8]. Green finance can facilitate green technological innovation and low-carbon transition through capital allocation, environmental regulation, and risk pricing [9]. The coordinated development of the two has also been used to explain improvements in emission reduction performance and resource allocation efficiency [10]. However, these discussions mainly focus on enterprise innovation, macro-level green transformation, or general industrial upgrading. They pay insufficient attention to the construction industry, which is characterized by high resource consumption, project-based organization, long industrial chains, and substantial spatial externalities. In particular, few studies have explained within a unified framework how digital inclusive finance, green finance, and their coordinated development become embedded in the production system of the construction industry and are further translated into new quality productive forces.
Building on this, this paper uses panel data from 30 provincial-level administrative regions in China from 2011 to 2022 to examine how digital inclusive finance, green finance, and their coordinated development affect new quality productive forces in the construction industry. The marginal contributions are threefold. First, while existing literature mainly examines manufacturing or provincial-level macro studies of new quality productive forces, this paper focuses on the construction industry. Drawing on the socio-technical deep transition framework from the transition investment perspective, it examines the effects of digital inclusive finance and green finance on new quality productive forces in the construction industry. This extends the theoretical understanding of industry heterogeneity and the dynamic evolution of financial effects. Second, instead of examining each financial form separately, this paper integrates them into a unified framework. It uses the perspective of coordinated development to reveal their complementary mechanism in fostering new quality productive forces in the construction industry. This mechanism depends on the institutional environment, including the level of economic development and financial regulation, and generates a spatial spillover effect across neighboring regions. Third, this paper identifies the conditional boundaries of the coordination effect and reveals the institutional and factor prerequisites for its effective realization.
The remainder of this paper is organized as follows. Section 2 reviews the literature and develops the theoretical hypotheses. Section 3 describes the measurement of variables and the data. Section 4 presents the dynamic impulse response analysis. Section 5 reports the baseline regression, endogeneity and robustness tests, heterogeneity analysis, moderating-effect analysis, threshold-effect analysis, and spatial econometric analysis. Section 6 discusses the findings, concludes the study, and provides policy recommendations.
2. Literature Review and Research Hypotheses
2.1. Literature Review
To organize the review clearly, this section is divided into three parts. The first part reviews studies on digital inclusive finance and new quality productive forces in the construction industry. The second part reviews studies on green finance and new quality productive forces in the construction industry. The third part reviews studies on the coordinated development of digital inclusive finance and green finance. This structure is adopted because the present study examines both the separate effects of the two financial instruments and their joint effect. It therefore follows a logical progression from individual financial mechanisms to coordinated financial governance, and it helps identify the gap that this study addresses.
2.1.1. Research on the Impact of Digital Inclusive Finance on New Quality Productive Forces in the Construction Industry
Digital inclusive finance expands the boundaries of financial services through big data, mobile internet, and platform technologies. It reduces information and transaction costs while improving financial accessibility, usage depth, and matching efficiency [11]. New quality productive forces in the construction industry refer to high-technology, high-efficiency, and high-quality productive forces formed by reorganizing construction workers, labor materials, and production organization modes under the combined forces of digitalization, greening, and intelligence [12]. As traditional finance integrates with innovative technologies, digital inclusive finance has broad effects on economic and social development. Taking the construction industry as an entry point, Yu et al. [13] find that digital inclusive finance can improve the financing environment of construction enterprises and enhance their financial performance through supply chain finance. Related studies provide complementary evidence from industrial upgrading and total factor productivity. Ren, Zeng, and Gozgor [14] find that digital finance can significantly promote urban industrial structure upgrading, and that digital finance and industrial structure upgrading both generate a positive spatial spillover effect. Cheng et al. [15] show that digital inclusive finance can significantly improve green total factor productivity by fostering green innovation and entrepreneurial activities. Overall, digital inclusive finance is closely associated with healthy industrial development, with positive effects across several key dimensions.
From the perspective of new quality productive forces, Cui Gengrui [16] finds that digital inclusive finance can significantly promote their development. This effect is more pronounced in regions where traditional financial development is relatively weak and financial regulation is stronger. Shi Dongkai [17] finds that digital inclusive finance promotes the development of new quality productive forces in manufacturing enterprises through information and financing effects.
2.1.2. Research on the Impact of Green Finance on New Quality Productive Forces in the Construction Industry
Green finance centers on environmental risk pricing, credit screening, and investment standards. It embeds ecological externalities into capital allocation and provides an important institutional arrangement for the green transformation of heavily polluting industries [18]. At present, relatively few studies directly examine the impact of green finance on the construction industry. However, existing research shows that green finance and related policies can accelerate the green transformation of enterprises in heavily polluting industries [19] and increase their green investment intensity [20]. The role of green finance also extends to deeper economic operating mechanisms. At the level of industrial structure, green finance directs resources toward green manufacturing and high-technology sectors, thereby promoting the upgrading of traditional industries [21]. However, when resource reallocation and industrial coordination are not properly aligned, it may inhibit the advancement of industrial structure [22]. At the level of technological innovation, green finance alleviates R&D financing constraints, improves expected returns from innovation, and strengthens environmental governance pressure. These effects facilitate green patents and the diffusion of low-carbon technologies [23]. At the level of production efficiency, green finance can significantly improve green total factor productivity. This effect strengthens over time and provides important support for the formation of new quality productive forces [24].
From the perspective of new quality productive forces, Gao et al. [25] integrate green finance, environmental pollution, and high-quality economic development into a unified framework. They confirm that regional green finance and high-quality economic development exhibit a significant spatial spillover effect and nonlinear characteristics. From the perspective of supply chain spillovers, Han Zhongxue and Zhao Jinpeng [26] find that customer-level green finance can significantly enhance suppliers’ new quality productive forces, forming a backward enabling effect along the supply chain.
Existing literature has largely examined the effects of digital inclusive finance and green finance on new quality productive forces from provincial or firm-level perspectives. Most studies focus on manufacturing or agriculture, while the construction industry remains relatively underexplored. Moreover, existing studies have not analyzed the dynamic effects of these two factors, which are important for relevant policy formulation.
2.1.3. Research on the Coordinated Development of Digital Inclusive Finance and Green Finance
Foreign scholars examined this issue relatively early from the perspective of the integration between inclusive green finance and financial technology. Muganyi et al. [27] demonstrate that green finance policies can significantly reduce industrial pollution emissions, while financial technology facilitates the expansion of environmental protection investment. This suggests that digital technologies can strengthen the environmental governance effectiveness of green finance policies. Wang et al. [28] argue that financial digitalization can effectively promote the development of green finance. Regarding the coordinated development of the two, Chen et al. [29] measure the coupling coordination degree between digital inclusive finance and green technological innovation. Their findings show that the coordination level continues to improve but remains at the stage of basic coordination, with significant regional differences and a spatial spillover effect. In recent years, related research has extended from the coordination between the digital economy and green finance to low-carbon transformation and the cultivation of new quality productive forces. Tang et al. [30] find that the coordination between green finance and the digital economy can promote urban low-carbon transformation through green technological innovation, industrial structure upgrading, and energy efficiency improvement.
In summary, existing studies have examined the economic effects of digital inclusive finance and green finance, but two limitations remain. First, relatively few studies explain how the two jointly act on industrial transformation from the perspective of coordinated development. Second, existing literature provides insufficient discussion of the formation mechanism of new quality productive forces in the construction industry. It has not fully revealed the systematic relationship among financial capital, green regulations, digital technologies, and the production system of the construction industry. To address these limitations, this paper introduces the socio-technical deep transition framework from the transition investment perspective [31] and interprets the improvement of new quality productive forces in the construction industry as the joint outcome of financial capital allocation, institutional support, technological innovation diffusion, and regional spillovers.
2.2. Theoretical Analysis and Hypothesis Development
The socio-technical deep transition framework holds that industrial transformation is not a simple technological substitution. It is the coordinated evolution of technological trajectories, institutions, market demand, and organizational practices within socio-technical systems. Its core lies in system linkage and directional reconstruction [32]. The transition investment perspective emphasizes that capital allocation not only expands investment scale but also shapes sustainable transition pathways by changing investment rules and capital flows [33]. Accordingly, digital inclusive finance improves capital access for innovation actors in the construction industry by reducing information asymmetry, easing financing constraints, and expanding service coverage. Green finance strengthens the green orientation of capital through environmental standards, green credit, and green investment mechanisms. The coordinated development of the two is embedded in financial supply, technological selection, and resource allocation rules, thereby promoting the reconstruction of production modes, technological pathways, and green governance systems in the construction industry.
2.2.1. The Impact of Digital Inclusive Finance on New Quality Productive Forces in the Construction Industry
From the perspective of the socio-technical deep transition framework, digital inclusive finance improves the accessibility and matching efficiency of financial resources entering the socio-technical system of the construction industry. It thereby provides foundational capital support for the formation of new quality productive forces. First, by relying on big data, cloud computing, and credit evaluation models, digital inclusive finance transforms enterprise operations, project performance, and transaction data into priceable credit assets. This alleviates financing constraints caused by information opacity and insufficient collateral among small and medium-sized construction enterprises, reduces financing costs, and stimulates R&D investment. Second, platform finance, supply chain finance, and online settlement mechanisms can improve project capital turnover and industrial-chain coordination efficiency. They reduce capital precipitation and resource misallocation and promote technological innovation, digital management, and industrialized construction upgrading in the construction industry [34]. Third, digital inclusive finance expands financing channels for green retrofitting and energy-saving and carbon-reduction projects. It improves the traceability of capital flows and environmental information, strengthens green investment incentives, and promotes the low-carbon transformation of the construction industry [35]. However, China exhibits significant regional differences in economic foundations, digital infrastructure, financial ecosystems, and human capital. The eastern region has taken the lead in forming a virtuous cycle between digital finance and industrial upgrading. The central region benefits from policy support and industrial transfer, whereas the western and northeastern regions are constrained by weak infrastructure and traditional industrial lock-in. The intensity of this effect therefore shows regional heterogeneity. Based on this, this paper proposes the following hypothesis:
Hypothesis H1.
Digital inclusive finance has a positive effect on new quality productive forces in the construction industry. Improvements in digital inclusive finance can promote the advancement of new quality productive forces in the construction industry, and this effect exhibits regional heterogeneity.
2.2.2. The Impact of Green Finance on New Quality Productive Forces in the Construction Industry
From the transition investment perspective, green finance directs capital flows toward low-carbon construction and green upgrading, thereby reshaping the evolutionary trajectory of technological selection and production modes in the construction industry. First, the green transformation of the construction industry entails large-scale investment, long cycles, and high uncertainty. Green credit, green bonds, and low-carbon building financing instruments can channel capital into green construction, energy conservation and emission reduction, and clean production processes, providing long-term support for productivity upgrading [36]. Second, green project certification, ESG evaluation, and environmental information disclosure can mitigate financing risks for green innovation. They improve financing access for projects such as building material R&D, energy-saving design, and smart operation and maintenance, and encourage enterprises to shift toward whole-process low-carbon innovation [37]. Third, green finance contains both incentive and constraint mechanisms. It enhances expected returns on green investment through interest-rate incentives and policy-based funds. At the same time, it restricts high-energy-consumption and high-emission production modes through financing thresholds, thereby promoting resource allocation optimization and green efficiency improvement [38]. Regional differences in economic foundations, technological capacity, financial supply, and ecological constraints are pronounced. The eastern region is more likely to establish a coupling between green finance and construction industry upgrading. By contrast, the northeastern region and parts of the western region are characterized by stronger policy dependence, technological backwardness, and ecological vulnerability. As a result, the effect of green finance exhibits regional heterogeneity. Based on this, this paper proposes the following hypothesis:
Hypothesis H2.
Green finance has a positive effect on new quality productive forces in the construction industry, and this effect exhibits regional heterogeneity.
2.2.3. The Impact of the Coordinated Development of Digital Inclusive Finance and Green Finance on New Quality Productive Forces in the Construction Industry
The effect of the coordinated development of digital inclusive finance and green finance does not arise from a simple superposition of two financial instruments. Rather, it reflects the coordination between digital technology-enabled identification capacity and the green capital orientation mechanism. Together, these mechanisms improve capital allocation efficiency and incentives for green innovation during the transformation of the construction industry. In the construction industry, the coordinated development of digital inclusive finance and green finance integrates digital identification, risk pricing, and green orientation. This complementarity provides integrated financial support for new quality productive forces [39]. In terms of high efficiency, digital technologies improve green project evaluation, capital monitoring, and supply chain settlement, while green standards guide capital allocation. Together, they address long project cycles, dispersed participation, and capital misallocation. They also direct capital more precisely toward green construction, smart operation and maintenance, and energy-saving renovation. In terms of high technology, digital inclusive finance broadens financing coverage for green innovation actors and reduces information asymmetry. Green finance improves access to financing and increases the attractiveness of green R&D investment. Together, they promote green technological innovation, smart construction applications, and the upgrading of production modes [40]. In terms of high quality, coordinated development embeds inclusiveness, greenness, and technological progress into the transformation of the construction industry. It balances economic performance, environmental performance, and social equity. It also shifts the industry from factor-driven expansion toward innovation-driven development and low-carbon governance. Based on this analysis, this paper proposes the following hypothesis:
Hypothesis H3.
The coordinated development of digital inclusive finance and green finance has a positive effect on new quality productive forces in the construction industry.
2.2.4. Mechanisms Through Which the Coordinated Development of Digital Inclusive Finance and Green Finance Affects New Quality Productive Forces in the Construction Industry
For the construction industry, the coordinated development of digital inclusive finance and green finance can alleviate financing constraints and strengthen the green orientation of capital. However, these effects are conditional on resource allocation efficiency and regional innovation capacity. First, capital misallocation constrains the effect of coordinated development. Construction projects have long cycles, opaque information, and risks that are difficult to identify. If financial resources continue to flow toward projects with high energy consumption, heavy pollution, or short-term returns, the functions of both financial instruments will be weakened. Digital inclusive finance becomes less effective in matching capital, while green finance exerts weaker directional constraints. Risk premiums and distortions in market signals may also be amplified [41]. Capital misallocation therefore reduces capital use efficiency and suppresses investment in smart construction and low-carbon retrofitting. Consequently, it weakens the positive effect of coordinated development on new quality productive forces in the construction industry. Second, regional innovation capacity can exert a positive moderating effect. Regions with stronger innovation capacity generally have more developed R&D foundations, digital infrastructure, and industrial collaboration networks. These conditions enable them to convert financial support more effectively into green technology applications and industrial-chain upgrading.
Moreover, the effect of coordinated development on new quality productive forces in the construction industry may exhibit nonlinear boundaries associated with human capital. When human capital is low, enterprises may struggle to absorb the financial resources provided by digital inclusive finance and green finance. The effect of coordinated development is therefore constrained. Once human capital exceeds a certain threshold, technological learning, project management, and green R&D capabilities improve. Financial resources can then be converted more fully into productive forces. Based on this analysis, this paper proposes the following hypotheses:
Hypothesis H4.
Capital misallocation negatively moderates the effect of the coordinated development of digital inclusive finance and green finance on new quality productive forces in the construction industry. By contrast, regional innovation capacity positively moderates the same effect.
Hypothesis H5.
Human capital produces a threshold effect on how the coordinated development of digital inclusive finance and green finance affects new quality productive forces in the construction industry.
2.2.5. The Spatial Spillover Effect of the Coordinated Development of Digital Inclusive Finance and Green Finance on New Quality Productive Forces in the Construction Industry
Regional economic and financial development exhibit spatial dependence and regional coordination. The coordinated development of digital inclusive finance and green finance in one region may therefore improve new quality productive forces in surrounding regions. First, from the perspective of capital flows, the development of the green building industry in core regions attracts capital from surrounding regions. These inflows promote the development of local construction and related industries. Second, in terms of risk sharing, financial institutions in core regions participate in projects in surrounding regions through syndicated loans and risk-sharing arrangements. This participation disperses risk and increases capital supply. Third, in terms of market linkages, digital platforms reduce geographical barriers. They strengthen linkages among regional green finance markets, support the formation of a unified market, and improve capital allocation efficiency. As digital technologies and the green and low-carbon transition continue to advance, coordinated development can provide stronger financial support for new quality productive forces in the construction industry. It can also support coordinated regional economic development. Based on this analysis, this paper proposes the following hypothesis:
Hypothesis H6.
The coordinated development of digital inclusive finance and green finance has a significant positive spatial spillover effect on new quality productive forces in the construction industry.
3. Measurement of Variables and Data Description
3.1. Measurement and Analysis of New Quality Productive Forces in the Construction Industry
Compared with traditional productive forces, the “new” in new quality productive forces lies in the integration of new factors, new business forms, and new technologies, whereas the “quality” highlights the characteristics of high efficiency, high technology, and high quality, achieving fundamental transformations at the levels of production modes, industrial development, and economic structure. Based on these characteristics and following the approach of Peng Qiao et al. [42], this paper constructs an indicator system to evaluate the development level of new quality productive forces in the construction industry. Taking industry-specific characteristics into account, the system is built along three dimensions—high efficiency, high technology, and high quality—covering 7 secondary indicators and 21 tertiary indicators, as shown in Table 1.
Table 1.
Comprehensive Evaluation Indicator System for New Quality Productive Forces in the Construction Industry.
The indicator selection in Table 1 corresponds to the theoretical characteristics of new quality productive forces in the construction industry. The high-technology dimension reflects the foundation and effectiveness of technology application mainly through the technical equipment rate, mechanization capacity, and labor productivity; the high-efficiency dimension reflects the industry’s production organization capacity and economic performance through production scale and operating performance; and the high-quality dimension is developed across four aspects—coordination, green development, openness, and shared development—represented respectively by indicators on the output value structure of enterprises under different forms of ownership, resource consumption and environmental governance, foreign capital participation, and public services and housing conditions, thereby comprehensively characterizing the development quality of the construction industry.
Few studies have measured new quality productive forces in the construction industry, and most use objective weighting methods. Because the selected indicators are numerous and highly correlated, this paper uses GPCA to calculate a composite score for China’s construction industry. First, the raw indicators are converted into dimensionless values. Principal components are then extracted from the full-sample correlation matrix after standardization, and their number is determined. Assuming that M principal components are retained, the score of the m-th principal component is , and its variance contribution rate is . The composite index of new quality productive forces in the construction industry is calculated as follows:
where denotes the level of new quality productive forces in the construction industry for the region in year , and is the weight assigned to the -th principal component. This paper first conducts the KMO test and Bartlett’s test of sphericity. Table S2 presents the results. The indicators are significantly correlated, indicating that the sample is suitable for global principal component analysis.
The number of principal components was determined from the cumulative variance contribution rate. As shown in Table 2, the first eight principal components were retained. The comprehensive score for new quality productive forces in the construction industry was then calculated by weighting each component according to its variance contribution rate.
Table 2.
Cumulative Variance Contribution Rates of the First 10 Principal Components.
Given that the composite principal component scores may be negative, this study applies a uniform coordinate shift based on the range of the original composite scores for the full sample: , where denotes the shifted value, and H represents the shift magnitude. A shift constant of (H = 2.25) is selected to offset all negative scores, ensuring that the composite index remains non-negative. This transformation changes only the numerical baseline of the index without altering the differences in scores or the relative rankings across observations.
Using global principal component analysis, this paper estimates new quality productive forces in the construction industry across 30 provinces in China from 2011 to 2022. The corresponding results are presented in Table 3; the national average increased from 1.7342 to 2.8224, equivalent to an average annual growth rate of 4.53%. Overall, new quality productive forces in China’s construction industry followed a pattern of “overall improvement, phased fluctuations, and regional divergence.” Regional differences nevertheless remained pronounced. The Eastern region had the highest average (3.0349), followed by the Central region (2.3897). The averages for the Northeast and Western regions were only 1.9096 and 1.6932, respectively, indicating clear stepwise disparities.
Table 3.
Assessment Results for New Quality Productive Forces in China’s Construction Industry by Region, 2011–2022.
3.2. Measurement and Analysis of Digital Inclusive Finance
This study uses the provincial digital inclusive finance index developed by the Centre for Digital Finance at Peking University to measure regional digital inclusive finance. The index comprises 33 indicators across multiple dimensions and addresses the limited coverage of digitalization in traditional financial indices. It has been widely used in academic research [43]. The detailed indicator system is presented in Table S3.
Using this index, this study estimates digital inclusive finance across China’s provinces from 2011 to 2022. As shown in Table 4, digital inclusive finance grew rapidly in the early years, but its growth slowed later. This pattern suggests that the digital inclusive finance market is gradually maturing. Digital inclusive finance increased year on year across all major regions, although regional differences remained pronounced. The Eastern region remained above the national average, whereas the Western and Northeast regions remained below it. After 2016, the Western region surpassed the Northeast region. The Central region remained broadly aligned with the national average (see Table S4 for provincial results for selected years).
Table 4.
Assessment Results for Digital Inclusive Finance in China by Region, 2011–2022.
3.3. Measurement and Analysis of Green Finance
The Green Finance Development Index measures the extent to which the financial sector supports green industries in a region. Following the core principle of green financial service coverage and the approach of Zhou et al. [44], this paper selects seven indicators to measure green finance. The indicators cover green credit, green investment, green insurance, green bonds, green support, green funds, and green equity. The entropy method is used to calculate a composite index of green finance. Table S5 presents the detailed indicator system, and Table 5 reports the calculation results.
Table 5.
Green Finance Development Index Results by Region in China, 2011–2022.
From 2011 to 2022, green finance in China developed unevenly but showed an overall upward trend, with an average growth rate of 13.66%. Green finance increased year on year across China’s four major regions, while regional disparities remained relatively modest. This pattern indicates interconnected regional development. The Central region lagged slightly, whereas the Western and Northeast regions developed more rapidly in recent years (see Table S6 for provincial results for selected years).
3.4. Measurement and Analysis of the Level of Coordinated Development Between Digital Inclusive Finance and Green Finance
To examine the level of coupled coordination between digital inclusive finance and green finance, this paper constructs a coupling coordination degree based on the indicator system developed above. The underlying indicators of the digital inclusive finance and green finance systems are identical to those used previously. To unify the measurement scales of the two subsystems, all indicators are first standardized and then aggregated separately using the entropy method to form dimensionless composite subsystem indices and . The coupling degree, comprehensive development index, and coupling coordination degree are then calculated as follows:
where and denote the composite indices of the digital inclusive finance and green finance subsystems after standardization and entropy-based aggregation, respectively. The calculation results of are detailed in Table S20. , , and denote the coupling degree, the comprehensive development index, and the coupling coordination degree, respectively. A larger value indicates a higher level of coordinated development between the two systems. Considering that neither subsystem is assigned a preset priority in the research framework of this paper, a symmetric equal-weight setting is adopted, i.e., = = 0.5.
The coupling coordination indices for China’s provinces and municipalities from 2011 to 2022 are reported in Table 6. Between 2011 and 2022, coordinated development between digital inclusive finance and green finance increased nationwide. The national average coupling coordination degree rose from 0.2797 to 0.5485, with an average annual growth rate of 6.31%.
Table 6.
Coupling Coordination Degree of Digital Inclusive Finance and Green Finance by Region in China, 2011–2022.
At the regional level, the coupling coordination indices in 2022 were 0.6476, 0.5453, 0.5023, and 0.4729 for the Eastern, Central, Northeast, and Western regions, respectively. This ranking reflects a pattern of “the East leading, the Central catching up, the Northeast in the middle, and the West lagging behind.” Regional disparities remained pronounced. This pattern suggests that the digital inclusive finance foundation and green finance service capacity continue to constrain improvements in regional coordination (see Table S7 for provincial results for selected years).
3.5. Variable Definitions and Data for Subsequent Empirical Analysis
To ensure consistent variable definitions in the subsequent empirical analysis, this section defines the variables based on the preceding calculations. Among these variables, the capital misallocation index is measured following the approaches of Chen Yongwei and Hu Weimin [45] and Bai Junhong and Liu Yuying [46], as the deviation of the actual capital allocation share from its theoretical share under the efficient allocation state:
denotes the actual capital allocation share of the region; denotes the output share; denotes the output elasticity of capital; and denotes the output-weighted capital contribution value. A larger value indicates a higher degree of capital misallocation, and the index is mean-centered in the regressions. The specific variable definitions are presented in Table 7.
Table 7.
Variable Definitions and Measurement Method.
This study uses a sample of 30 provincial-level administrative regions in China from 2011 to 2022, excluding the Tibet Autonomous Region, Hong Kong, Macao, and Taiwan. Data were obtained from the China Statistical Yearbook [47], China Statistical Yearbook on Construction [48], China Urban and Rural Construction Statistical Yearbook [49], and Almanac of China’s Finance and Banking [50]. Additional data were obtained from the CNRDS and CSMAR databases. Isolated missing observations were imputed using linear interpolation based on data from adjacent years within the same region. All continuous variables included in the empirical analysis were winsorized at the 1st and 99th percentiles, and natural logarithms were taken for selected indicators according to their characteristics. Descriptive statistics are reported in Table S8.Data processing and empirical analyses were conducted using Stata 17.0 (StataCorp LLC, College Station, TX, USA), MATLAB R2025b (The MathWorks, Inc., Natick, MA, USA), and IBM SPSS Statistics 31.0 (IBM Corp., Armonk, NY, USA).
4. Dynamic Impulse Response Analysis of New Quality Productive Forces in the Construction Industry to Digital Inclusive Finance and Green Finance
4.1. Model Specification
The socio-technical deep transition framework emphasizes the dynamic coevolution of financial capital and industrial production systems. This paper applies the panel vector autoregressive (PVAR) model proposed by Love and Zicchino [51] to examine interactions among digital inclusive finance, green finance, and new quality productive forces in the construction industry. The PVAR model combines dynamic VAR analysis with panel data controls for individual heterogeneity. It also mitigates the limited number of observations available in a single time series. The model is specified as follows:
Here, i denotes a region, and t denotes a year. is a column vector comprising the levels of new quality productive forces in the construction industry (), digital inclusive finance (), and green finance (). is the corresponding column vector for region i lagged by j periods. Here, p denotes the lag order, denotes the slope coefficient for the j-period lag, is the individual-effects vector, is the time-effects vector, and is the random disturbance term. For the subsequent GMM estimation, the forward orthogonal deviation transformation is applied to eliminate the individual effects. This transformation is used solely for model estimation and does not alter the level-based specification of the PVAR model.
4.2. Pvar Model Testing
4.2.1. Stationarity and Cointegration Tests
This study applied the IPS unit root test to assess the stationarity of each variable; the complete results are reported in Tables S9–S11. The level-based test results reveal heterogeneity in stationarity across variables and regions: GF rejects the unit root null hypothesis in the national sample, and in all four regional samples, NP in the Western Region and DIF in the Northeast Region likewise reject the null, whereas the remaining level series do not. It should be noted that the null hypothesis of the IPS test is that all cross-sections contain a unit root, so rejection does not imply that every cross-section is stationary. Consequently, the current evidence does not support classifying NP, DIF, and GF uniformly as first-order integrated series. After first differencing, all variables reject the unit root null hypothesis in the national and all four regional samples. Based on these results, this study does not rely on a uniform first-order integration assumption to conduct cointegration tests; instead, it focuses on the dynamic relationships among the variables through PVAR model selection, GMM diagnostics, and stability tests.
4.2.2. Lag-Order Selection and Pvar Estimation
Optimal lag orders were determined using the MAIC, MBIC, and MQIC criteria [52], as reported in Table 8. The optimal lag order was 2 for the national sample and 1 for each regional subsample. This study adopted the GMM approach proposed by Abrigo and Love to jointly estimate the PVAR model, treating NP, DIF, and GF as endogenous variables, constructing internal instrumental variables from their first- to fourth-order lags (12 instrument terms in total), and applying the forward orthogonal deviation transformation to eliminate individual effects. For each optimal model, the Hansen J test did not reject the null hypothesis that the instruments are jointly valid. The complete regression results are reported in Tables S12 and S13. Table 9 shows that, at the national level, lagged digital inclusive finance and green finance had significant positive effects on new quality productive forces in the construction industry. The effects had consistent directions across regions, although their magnitudes varied. The lagged values of digital inclusive finance and green finance also exhibited significant interdependence. Because PVAR lag coefficients alone do not fully characterize shock-transmission pathways, this study further used impulse response functions and variance decomposition to examine dynamic effects.
Table 8.
Optimal Lag-Order Selection.
Table 9.
Core PVAR Estimation Results.
4.2.3. Granger Causality and Model Stability Tests
To identify predictive relationships among the variables, this study conducted Granger causality tests. Table 10 shows bidirectional Granger causality between digital inclusive finance and green finance at the national and Central Region levels. At both levels, each financial variable also Granger-caused new quality productive forces in the construction industry. In the Eastern Region, both financial variables unidirectionally Granger-caused new quality productive forces in the construction industry. In the Western Region, green finance unidirectionally Granger-caused both new quality productive forces in the construction industry and digital inclusive finance. No significant Granger-causal relationships were detected in the Northeast Region. Figure 1 presents the AR roots of the national PVAR model. Full Granger causality results are reported in Table S14, while Figures S1 and S2 provide the national and four regional AR root plots. Taken together, the results of lag-order selection, the Hansen J Test, and the AR Roots Test indicate that the PVAR model is well specified overall and satisfies the stability condition.
Table 10.
Summary of Granger Causality Test Results.
Figure 1.
AR root graph of the PVAR model for the national sample.
4.3. Impulse Response Analysis
To examine the dynamic responses of new quality productive forces in the construction industry to shocks from digital inclusive finance and green finance, this study conducted impulse response analysis using the PVAR model. The analysis used 500 Monte Carlo simulations to construct 95% confidence intervals over a 10-period horizon.
4.3.1. Impulse Response of New Quality Productive Forces in the Construction Industry to a Digital Inclusive Finance Shock
Figure 2a shows that, at the national level, the contemporaneous response of new quality productive forces in the construction industry to a digital inclusive finance shock was not statistically significant; the response reached a positive peak in the first period and then gradually declined, approaching zero by approximately the sixth period, exhibiting a diminishing marginal pattern that is stronger in the short term and weaker in the long term. At the regional level, combined with the PVAR estimation results, the lagged terms of digital inclusive finance were significantly positive in the Eastern and Central regions, whereas the effects in the Western and Northeast regions were relatively weak and insignificant; the Granger test likewise indicated that the dynamic association in the Northeast Region was not significant. Overall, the national results and the dynamic responses of most regions indicate that digital inclusive finance can promote new quality productive forces in the construction industry, but its effect intensity is conditioned by regional development conditions, showing pronounced regional differences. Hypothesis H1 is generally supported.
Figure 2.
Impulse responses of NP to a one-standard-deviation shock in digital inclusive finance. Note: The subfigures represent (a) the national level; (b) the Eastern region; (c) the Central region; (d) the Western region; and (e) the Northeastern region. The red solid line represents the estimated impulse response function, while the red dashed line indicates the zero reference line. The blue and light green solid lines represent the upper and lower bounds of the 95% confidence interval based on GMM estimation, respectively.
4.3.2. Impulse Response of New Quality Productive Forces in the Construction Industry to Green Finance
Figure 3a indicates that, at the national level, new quality productive forces in the construction industry generally respond positively to a green finance shock; the response peaks in the first period and then gradually declines and converges, suggesting that the promoting effect of green finance exhibits a certain persistence. The regional results are shown in Figure 3b–e: the Eastern and Central regions maintain a relatively stable positive response, the Western Region turns positive after a short-term adjustment, and the Northeast Region shows a relatively weak response intensity. Combined with the PVAR estimation results, the lagged terms of green finance are significantly positive in the Eastern, Central, and Western regions, whereas the Northeast Region does not reach statistical significance, indicating regional differences in the transmission effect of green finance. Overall, green finance can generally promote the development of new quality productive forces in the construction industry, but regions differ in response intensity and adjustment paths. Hypothesis H2 is generally supported.
Figure 3.
Impulse response of NP to a one-standard-deviation shock from green finance. Note: The subfigures represent (a) the national level; (b) the Eastern region; (c) the Central region; (d) the Western region; and (e) the Northeastern region. The red solid line represents the estimated impulse response function, while the red dashed line indicates the zero reference line. The blue and light green solid lines represent the upper and lower bounds of the 95% confidence interval based on GMM estimation, respectively.
This paper reports only the impulse response results; details of the variance decomposition can be found in Table S15. Overall, digital inclusive finance offers a more stable explanation for fluctuations in new quality productive forces in the construction industry. The contribution of green finance exhibits significant regional heterogeneity.
5. Effects and Mechanisms of the Coordinated Development of Digital Inclusive Finance and Green Finance on New Quality Productive Forces in the Construction Industry
5.1. Baseline Regression
5.1.1. Baseline Model Construction
To empirically examine the effect of the coordinated development of digital inclusive finance and green finance () on new quality productive forces in the construction industry, this study specifies the following baseline econometric model:
In Equation (8), i denotes a province, and t denotes a year. is the dependent variable, representing new quality productive forces in the construction industry; is the core explanatory variable, representing the coordinated development of digital inclusive finance and green finance; is the vector of control variables; and denote province and year fixed effects, respectively; and is the random disturbance term.
5.1.2. Baseline Regression Analysis
Table 11 reports the baseline regression results for the effect of the coordinated development of digital inclusive finance and green finance on new quality productive forces in the construction industry. Columns (1) to (4) successively add control variables, province, and year fixed effects. The results show that the estimated coefficient of the core explanatory variable D is consistently positive and significant at the 1% level, indicating a significant positive relationship between the coordinated development of digital inclusive finance and green finance and the enhancement of new quality productive forces in the construction industry. Taking the two-way fixed-effects model in column (4) as the benchmark, after controlling for regional heterogeneity, time effects, and other factors, the estimated coefficient of D is 2.3807 and passes the 1% significance test, indicating that the findings are highly robust. The sample standard deviation of D is 0.1283; therefore, a one-standard-deviation increase in D corresponds to an increase in NP of approximately 0.3054 units, equivalent to about 32.41% of the sample standard deviation of NP (0.9424), indicating that the positive relationship between the two is also economically meaningful in terms of magnitude. Since D simultaneously incorporates the development levels and coupling states of the two subsystems, its coefficient reflects the influence of the overall level of coordinated development and does not separately identify a “pure coordination effect” independent of the development levels of the two subsystems. Hypothesis H3 is supported.
Table 11.
Baseline Regression Results.
5.2. Endogeneity and Robustness Tests
5.2.1. Addressing Endogeneity
To address endogeneity arising from reverse causality and omitted variables, this study used an instrumental variable approach. Following previous research [53], the interaction between the per capita volume of postal and telecommunications services in 1984 and the lagged number of internet users in each province was used as the instrumental variable. The model was estimated using two-stage least squares. This instrumental variable possesses both relevance and exogeneity. With respect to relevance, postal and telecommunications infrastructure served as the early foundation for the development of the internet and digital finance; regions with better historical communication conditions generally had a stronger foundation for network construction and information transmission, which, through path dependence, shaped the subsequent expansion of the internet, the diffusion of digital technologies, and the development of digital finance, thereby influencing the level of coupling coordination between digital inclusive finance and green finance. With respect to exogeneity, the volume of postal and telecommunications services in 1984 was formed before the sample period and was therefore not subject to reverse effects from contemporary new quality productive forces in the construction industry; after the iteration of communication technologies, the direct role of traditional postal and early telecommunications facilities had weakened, and their influence was more likely to be transmitted through internet penetration, digital infrastructure, and digital financial development rather than through an independent direct effect. Zhong et al. [54] likewise constructed instrumental variables for the digital economy using historical postal and telecommunications data. This study controls for province and year fixed effects to mitigate the confounding influence of regions’ long-term development foundations and contemporary economic and social characteristics. According to the results in Table 12, the first-stage instrumental variable coefficient is 0.0366 and positively significant, and the excluded-instrument F-statistic is 33.75, indicating that the instrumental variable has strong relevance. The second-stage coefficient on the coupling coordination degree is 1.1865 and significant at the 1% level, with a direction of influence consistent with the baseline regression results.
Table 12.
Instrumental Variable Regression Results.
5.2.2. Robustness Tests
To assess the robustness of the baseline regression results, this study conducted three tests involving the sample period, sample composition, and variable measurement. The results of these robustness tests are reported in Table 13. First, the model was re-estimated after excluding observations from the 2020–2022 pandemic period [55]. The coefficient on D remained positive at 1.2331 and significant at the 5% level. Thus, coordinated development continued to promote new quality productive forces in the construction industry after pandemic-related observations were excluded. Second, Beijing, Tianjin, Shanghai, and Chongqing were excluded because centrally administered municipalities have greater economic strength and distinct administrative status [56]. After their exclusion, the coefficient on D was 2.1829 and significant at the 1% level. This indicates that the baseline conclusion was not driven by these municipalities. Third, the level of new quality productive forces in the construction industry was remeasured using the entropy method to reduce potential bias from weighting differences. The coefficient on D was 1.2302 and significant at the 1% level, confirming that the conclusion remained valid.
Table 13.
Baseline Regression Robustness Tests.
5.3. Heterogeneity Analysis
From the transition investment perspective, the coordinated development of digital inclusive finance and green finance promotes the transformation of socio-technical systems in the construction industry. This process operates through optimized resource allocation, stronger innovation capacity, and an improved external institutional environment. Accordingly, this study divided the sample along two dimensions: economic development and financial regulation intensity. The analysis examines whether the effect of coordinated development on new quality productive forces in the construction industry differs across these groups. The results are reported in Table 14.
Table 14.
Heterogeneity Analysis Results.
For the economic development dimension, provinces were grouped using the median provincial per capita GDP. The effect of coordinated development was positive and significant at the 1% level in regions with high economic development but nonsignificant in regions with low economic development. More developed regions have stronger market institutions and more favorable financial conditions, which facilitate the conversion of financial resources into momentum for the green transformation of the construction industry. For the financial regulation dimension, provinces were grouped using the median ratio of financial regulatory expenditure to fiscal expenditure. In regions with high financial regulation, the estimated coefficient on D was 2.1687 and significant at the 1% level. In regions with low financial regulation, the coefficient was positive but not statistically significant. Stronger financial regulation helps standardize resource allocation, thereby strengthening the effect of coordinated development on new quality productive forces in the construction industry. The differences in coefficients between groups were further examined using a bootstrap procedure with 1000 resamples. Both comparisons were significant at the 5% level, confirming that the heterogeneity described above is statistically significant.
5.4. Moderating Effect Analysis
5.4.1. Moderating Effect Model Construction
To examine the moderating effects, this study augments the baseline model by including each moderating variable and its interaction term with coordinated development, as specified below:
Here, ‘’ denotes the moderating variable, operationalized as the capital misallocation index () or regional innovation capacity (). Before constructing the interaction term, and were mean-centered while retained its original scale. Consequently, represents the conditional effect of on new quality productive forces in the construction industry when the moderating variable is at its sample mean, and the interaction coefficient captures the moderating effect.
5.4.2. Moderating Effect Results
Column (1) of Table 15 reports the model using capital misallocation as the moderating variable. The estimated coefficient of D is 1.7258 and is positively significant, with and ; when capital misallocation is at low (−1SD), mean, and high (+1SD) levels, the marginal effects of D are 2.2099, 1.7258, and 1.2417, respectively, showing a continuous downward trend; the coefficient on Mis × D is −2.0591 and is significant at the 1% level. Thus, capital misallocation weakens the effect of coordinated development on new quality productive forces in the construction industry. In column (2) of Table 15, the estimated coefficient of D is 1.3681 and is positively significant, with and ; when regional innovation capacity is at low (−1SD), mean, and high (+1SD) levels, the marginal effects of D are 0.6831, 1.3681, and 2.0531, respectively, showing a continuous upward trend; the coefficient on Ric × D is 2.1452 and is significant at the 1% level. Thus, regional innovation capacity strengthens the effect of coordinated development on new quality productive forces in the construction industry. Together, these results support Hypothesis H4.
Table 15.
Moderating Effect Regression Results.
5.5. Threshold Effect Analysis
5.5.1. Threshold Effect Model Construction
To examine nonlinear variation in the effect of coordinated development on new quality productive forces in the construction industry, this study employs the panel threshold model proposed by Hansen [53]. The threshold variable, human capital level (Edu), is measured by the logarithm of the number of students enrolled in ordinary higher education institutions per 10,000 people and varies across regions and years. In the model, it is treated as a strictly exogenous threshold variable. When searching for the threshold values, the candidate range is restricted to the 1–99% quantiles of Edu, and 500 bootstrap replications are employed to test the threshold effect and the number of thresholds. The 95% confidence intervals for the threshold values are determined using the likelihood ratio statistic inversion method of Hansen (1999) [57]. Based on the test results reported below, the following econometric model is constructed:
where is the human capital threshold variable, represented by ; is the indicator function; and and are the threshold values to be estimated. A significant threshold effect implies that the coefficient on in the equation changes discretely across threshold intervals. This pattern captures the stage-dependent role of human capital in the effect of coordinated development.
5.5.2. Threshold Regression Results
Table 16 shows that the single- and double-threshold effects are significant at the 1% and 5% levels, respectively, with corresponding threshold estimates of 7.6411 and 8.0547. The complete test results are reported in Tables S17 and S18. Given that the double-threshold effect passed the significance test, this study further estimates a double-threshold regression model. Table 17 further indicates a positive human capital threshold effect. Below the first threshold, the effect of coordinated development on new quality productive forces in the construction industry is not statistically significant. After the first threshold is crossed, the effect becomes positive and significant, and it increases further above the second threshold. These findings indicate that human capital must reach a sufficient level before it strengthens the effect of coordinated development. Taken together, these threshold results provide support for Hypothesis H5.
Table 16.
Significance Tests and Confidence Intervals for Panel Threshold Estimates.
Table 17.
Parameter Estimates for the Panel Threshold Model.
5.6. Spatial Econometric Analysis
5.6.1. Spatial Autocorrelation Analysis
To assess spatial dependence in new quality productive forces in the construction industry, this study uses global Moran’s I and Moran’s scatter plots. The former measures overall spatial autocorrelation, whereas the latter depicts local spatial clustering. Global Moran’s I is calculated as follows:
Global Moran’s I remained positive and statistically significant in every year from 2011 to 2022, indicating persistent positive spatial autocorrelation at the provincial level. This pattern shows that new quality productive forces in the construction industry exhibit sustained spatial clustering. The complete annual test results are reported in Table S19. These findings support the use of spatial econometric models to identify the spatial spillover effect of digital inclusive finance, green finance, and their coordinated development.
5.6.2. Spatial Econometric Model Selection
Because new quality productive forces in the construction industry may depend on both local explanatory variables and those in neighboring regions, this study specifies the following spatial Durbin model (SDM):
In Equation (12), is the spatial weight matrix, and is the spatial autoregressive coefficient. The terms and are the spatial lags of NP and D, respectively; and is the random disturbance term. In this study, the geographic adjacency matrix () serves as the baseline weight matrix, in which a value of 1 is assigned if two provinces are adjacent and 0 otherwise. To examine the sensitivity of the results to the specification of the spatial weights, the economic distance matrix () and the spatial economic geography nested matrix () is further constructed. is defined as , where and denote the average per capita GDP of province and province over the sample period, respectively. The spatial economic geography nested matrix (W3) accounts for both geographic and economic distance and is constructed as , , where denotes the geographic distance between province and province . All spatial weight matrices are row-standardized.
Table 18 reports significant LM and Robust LM test results, indicating both spatial lag dependence and spatial error correlation in the sample. The Hausman test rejects the random-effects specification, supporting a fixed-effects model. The significant LR-Lag, LR-Err, Wald-Lag, and Wald-Err statistics indicate that the SDM cannot be reduced to either the SAR or SEM. Accordingly, the subsequent analysis uses a two-way fixed-effects SDM specification.
Table 18.
Results of Spatial Model Identification and Diagnostic Tests.
5.6.3. Spatial Econometric Regression Results
Column (1) of Table 19 reports the SDM estimates based on the geographic adjacency matrix (W1). The coefficient on D is positive and statistically significant, indicating a positive effect of coordinated development on new quality productive forces in the construction industry. The coefficient on W × D is also positive and statistically significant, indicating a positive spatial spillover effect of coordinated development. The spatial autoregressive coefficient (ρ) is likewise positive and statistically significant, showing that new quality productive forces in the construction industry exhibit spatial dependence. Together, these estimates indicate a “point-driven, area-wide” pattern under geographic adjacency, in which the local effect is accompanied by cross-regional spillovers. Taken together, these spatial results provide support for Hypothesis H6.
Table 19.
Spatial Durbin Model Estimation Results.
5.6.4. Spatial Effect Decomposition
As the parameters of the spatial Durbin model do not fully capture the actual spatial spillover effects, this section employs the partial differential method to decompose the spatial spillover effects into three components: direct effects, indirect effects, and total effects. The results are presented in Table 20. The results indicate that, under the geographical adjacency spatial weight matrix (W1), the direct, indirect, and total effects of D are all significantly positive. This suggests that the coordination effect exhibits distinct cross-regional diffusion characteristics. Hypothesis H6 is thus validated once again.
Table 20.
Decomposition of Spatial Spillover Effects.
5.6.5. Spatial Robustness Tests
To test the robustness of the spatial regression results, this paper further re-estimates the model using the economic distance matrix (W2) and the spatial economic geography nested matrix (W3) in place of the adjacency matrix (W1). The results in Table 19 and Table 20 indicate that, following the replacement of the spatial weighting matrix, the estimated coefficients for D and W × D, as well as the direct, indirect, and total effects in the spatial effect decomposition, all remain significantly positive. The magnitudes of the spatial lag term and the indirect effect, however, differ. Overall, the direction and statistical significance of the spatial spillover effects are consistent across different weighting matrices, whereas their strength exhibits some sensitivity to the specification of the spatial weights.
6. Discussion
The findings are best understood as evidence of a finance-enabled transformation rather than a simple expansion of financial inputs. From the perspective of socio-technical deep transitions and transformative investment [31], the relevant change involves the joint adjustment of capital allocation, technological choices, institutional rules, and production practices. This perspective is particularly pertinent to construction, where long project cycles, fragmented participants, and asset specificity can prevent additional financing from immediately becoming productive capacity. The contribution is therefore not merely to document a financial association but to explain how financing conditions interact with sector-specific production arrangements.
The dynamic results broadly support H1, but the effects of digital inclusive finance are not uniform. The national impulse response peaks in the first period before fading, while the relevant PVAR coefficients are significant in the Eastern and Central regions but not in the Western and Northeastern regions. Digital financial services may reduce information and transaction costs and improve financing access for dispersed construction enterprises, consistent with studies of innovation and industrial upgrading [8] and evidence from supply-chain finance in construction [13]. Regional differences may reflect how effectively firms and local institutions translate improved access into digital management and more efficient project coordination, rather than differences in access alone. Such conversion is especially relevant where subcontracting chains and uneven project information complicate credit assessment and technology adoption.
The results for green finance (H2) suggest a different adjustment process. The national response peaks in the first period, but regional adjustment paths differ, and the Northeast lacks a significant lagged PVAR effect. Green investment often requires changes in equipment, construction techniques, and environmental compliance before productivity benefits emerge. Unlike improvements in financial access, redirecting investment toward greener production can require up-front organizational and technical changes. For long-lived projects with substantial sunk costs, such adjustments may initially constrain performance even when the subsequent response turns positive. This interpretation is consistent with research linking green finance to innovation through financing conditions and environmental incentives [21,38], without implying a statistically significant effect in every region.
The main contribution associated with H3 is the complementarity between financial accessibility and investment direction. Digital inclusive finance can improve borrower identification and credit assessment, whereas green finance can steer funds toward environmentally oriented activities. Their combination may therefore address both whether capital reaches construction enterprises and how that capital is used. The coefficient on the coordination index D is positive and statistically significant in both the two-way fixed-effects model (2.3807) and the instrumental-variable model (1.1865), although the difference in magnitude calls for caution about the precise effect size. Bootstrap tests confirm significant between-group differences at the 5% level, with stronger associations in regions with higher economic development and stronger financial regulation. These findings extend research on digital–green financial coordination [10] by highlighting the institutional conditions under which complementarity is more readily realized in construction.
H4 and H5 help explain why financial coordination does not produce identical outcomes across settings. Capital misallocation weakens its association with new quality productive forces, while regional innovation capacity strengthens it, as reflected in interaction coefficients of −2.0591 and 2.1452, respectively. Access to finance must therefore be matched with efficient allocation and the capacity to absorb new technologies. Human capital adds a nonlinear constraint. The estimated thresholds of 7.6411 and 8.0547 indicate that the coordination effect becomes statistically significant only after the first threshold and strengthens after the second. Together, these results point to a sequence in which accessible, appropriately directed finance must be complemented by innovation capabilities and a sufficiently skilled workforce before it can support changes in construction practices.
The spatial results (H6) further indicate that these processes extend beyond provincial boundaries. Under the geographic adjacency matrix, the indirect effect is positive and significant (2.3487); it remains positive and significant under alternative spatial weights, although its magnitude changes. Digital platforms, green standards, knowledge exchanges, and cross-regional engineering networks are plausible channels through which local improvements may spread. These channels are especially relevant to construction supply chains that extend beyond provincial borders, although they are not identified separately in the spatial model. The variation across matrices nevertheless cautions against treating the estimated strength of spillovers as invariant to how regional proximity is defined. This finding adds an industry-specific dimension to evidence on spatial linkages in digital finance and coordinated development [14].
These analyses address different hypotheses, model diagnostics, and robustness questions, rather than one common family of tests. No study-wide multiple-comparison adjustment was applied; interpretation therefore rests on effect direction, statistical evidence, and consistency across specifications rather than isolated significance thresholds. Findings that are weak or sensitive to specification should be read cautiously.
Two limitations remain. First, X5–X7 and X20 are measured in absolute terms without adjustment for population or area. Consequently, interprovincial differences in the composite index may partly reflect differences in the scale of the construction industry and the area of land used for public administration and public services. In addition, X10–X12 represent interdependent ownership output shares, and assigning all three a positive direction lacks sufficient justification and does not directly capture coordination among ownership types. Future research could examine the sensitivity of the composite index to population- or area-adjusted indicators and alternative measures of ownership structure. Second, the coupling coordination index combines subsystem development levels with their degree of coordination and cannot identify a separate net coordination effect. This distinction matters because the index may rise as either subsystem develops even without an equivalent improvement in coordination. Equal weighting is also an index-construction assumption. Alternative weights, coupling measures, or interaction terms could help examine this distinction, while process-oriented models could better capture how financial coordination evolves over time.
7. Conclusions and Policy Recommendations
7.1. Main Conclusions
Using panel data from 30 Chinese provincial-level regions over 2011–2022, this study employs GPCA, PVAR, fixed-effects, moderation, panel threshold, and spatial Durbin models to examine the relationships between digital inclusive finance, green finance, their coupling coordination, and new quality productive forces (NQPF) in construction. Four main findings emerge. First, digital inclusive finance exhibits a relatively consistent positive relationship with NQPF, whereas green finance shows regional differences, with positive effects becoming more evident over time. Second, higher coupling coordination is significantly associated with greater NQPF. A one-standard-deviation increase in the coordination index corresponds to a 0.324-standard-deviation increase in NQPF. As this index incorporates both subsystem development and coordination, the estimate should not be interpreted as a separately identified pure coordination effect. Third, the positive relationship is more pronounced in regions with higher economic development and stronger financial regulation. Capital misallocation weakens this relationship, while regional innovation capacity strengthens it. Human capital exhibits a double-threshold pattern, with the relationship becoming significant and increasing beyond successive thresholds. Fourth, coupling coordination is associated with positive spatial spillovers whose direction and significance remain consistent across alternative spatial weight matrices, although their magnitudes vary. Overall, these findings suggest that improving both financial accessibility and the allocation of green capital can support innovation-driven, resource-efficient, and low-carbon upgrading in construction, particularly where institutional and innovation conditions are favorable.
7.2. Policy Recommendations
The empirical findings support the following four policy recommendations for the relevant stakeholders.
First, financial institutions should develop a financial service system that integrates “digital identification + green evaluation” to foster new quality productive forces in the construction industry. They should use data on project performance, supply chain transactions, energy consumption, and carbon emissions to establish green credit profiles. Financial institutions should also offer green credit, supply chain finance, and risk-sharing products for prefabricated buildings, green building materials, energy-saving renovation, and intelligent operation and maintenance projects.
Second, construction enterprises should convert coordinated financial support into the capacity to foster new quality productive forces. They should prioritize investment in BIM, intelligent construction, low-carbon materials, green construction, and whole-process energy consumption management. Enterprises should also improve environmental information disclosure and project carbon accounting. In parallel, they should strengthen the training of interdisciplinary professionals to improve their capacity to absorb digital and green technologies.
Third, governments should address capital misallocation when fostering new quality productive forces in the construction industry. They should improve green building certification, environmental information disclosure, and financial regulatory standards. Governments should also limit capital flows to low-efficiency and high-emission projects. In regions with weaker foundations, policy should prioritize digital infrastructure, vocational education, and the supply of green finance.
Fourth, cross-regional coordination should be strengthened to facilitate interregional diffusion. Eastern regions and central cities should be encouraged to promote the cross-regional application of green financial products, digital risk-control technologies, and green construction standards. Central, western, and northeastern regions should pursue technological diffusion and project cooperation according to their local conditions. These efforts can help realize the spatial spillover effect of new quality productive forces in the construction industry.
Supplementary Materials
The following supporting information can be downloaded at https://www.mdpi.com/article/10.3390/su182111068/s1. Table S1: Detailed indicator system for new quality productive forces in the construction industry; Table S2: KMO and Bartlett’s sphericity test; Table S3: Indicator system for digital inclusive finance; Table S4: Provincial digital inclusive finance assessment results for selected years, 2011–2022; Table S5: Indicator system for green finance; Table S6: Provincial green finance development index results for selected years, 2011–2022; Table S7: Provincial coupling coordination index results for selected years, 2011–2022; Table S8: Descriptive statistics of variables; Table S9: IPS unit root test for original series; Table S10: IPS unit root test for first-differenced series; Table S11: Pedroni cointegration test; Table S12: PVAR lag-order selection and GMM diagnostic results; Table S13: PVAR estimation results; Table S14: Full Granger causality test results; Table S15: Variance decomposition results; Table S16: Baseline regression results with control variables; Table S17: Significance tests and confidence intervals for panel threshold estimates; Table S18: Panel threshold regression estimates; Table S19: Global Moran’s I tests for provincial new quality productive forces in the construction industry, 2011–2022; Table S20: Digital inclusive finance subsystem index (U1) used in the coupling coordination calculation for selected years, 2011–2022; Figure S1: AR root plot of the national PVAR model; Figure S2: AR root plots of the PVAR models for the four major regions.
Author Contributions
Conceptualization, H.L.; Methodology, W.W. and X.Y.; Software, X.Y.; Validation, W.W. and X.Y.; Formal analysis, W.W. and X.Y.; Investigation, W.W. and X.Y.; Resources, H.L.; Data curation, X.Y.; Writing—original draft, W.W.; Writing—review & editing, H.L. and Y.G.; Visualization, W.W. and Y.G.; Supervision, H.L.; Project administration, H.L. All authors have read and agreed to the published version of the manuscript.
Funding
This research received no external funding.
Institutional Review Board Statement
Not applicable.
Informed Consent Statement
Not applicable.
Data Availability Statement
The datasets presented in this article are not readily available. The data used in this study were primarily obtained from the China Statistical Yearbook [https://www.stats.gov.cn/sj/ndsj/index.html] (accessed on 13 February 2026); China Statistical Yearbook on Construction [https://navi.cnki.net/knavi/detail?p=Ectg7PU2T8qCB_fM76xUl7VB1KVm-VOXbaPJBGMgybLgspwLngoKiUDJ7C8V-egX50q0p_5ipdNZzS4vaTvdRfxm_VFAiy4Mx6k2plbxlqA=] (accessed on 12 February 2026); China Urban-Rural Construction Statistical Yearbook [https://www.mohurd.gov.cn/gongkai/fdzdgknr/sjfb/tjxx/jstjnj/index.html] (accessed on 16 February 2026); Almanac of China’s Finance and Banking [https://navi.cnki.net/knavi/detail?p=Ectg7PU2T8qh7wAsOh0r2CNDjt8tBvG0NxNEiY7eVzHw1LqRUpUTZfpakKSisAJOlbJWnieKFZlMuHpsC-5Dau9c_JRL5hlP-3_EoPjNV6k=] (accessed on 17 February 2026); the Chinese Research Data Services Platform (CNRDS) [https://www.cnrds.com/] (accessed on 15 February 2026); the China Stock Market & Accounting Research (CSMAR) database [https://data.csmar.com/] (accessed on 14 February 2026). Some of the underlying data were obtained from CNRDS and CSMAR, which require institutional subscriptions or authorization, and their use and redistribution are subject to third-party licensing restrictions. Therefore, the authors cannot directly redistribute these restricted raw data to the public. Researchers seeking access to these restricted raw data may apply through the appropriate channels in accordance with the terms and conditions of the respective database providers. Further information regarding the data sources and access procedures is available from the corresponding author upon reasonable request.
Conflicts of Interest
The authors declare no conflict of interest.
References
- Liu, Y.; Gan, L.; Cai, W.; Li, R. Decomposition and Decoupling Analysis of Carbon Emissions in China’s Construction Industry Using the Generalized Divisia Index Method. Environ. Impact Assess. Rev. 2024, 104, 107321. [Google Scholar] [CrossRef] [Scilit]
- Zhang, L.; Li, Y.; Pan, Y.; Ding, L. Advanced Informatic Technologies for Intelligent Construction: A Review. Eng. Appl. Artif. Intell. 2024, 137, 109104. [Google Scholar] [CrossRef] [Scilit]
- Liu, W. Political Economy Discussion on Several Basic Theoretical Issues of New Quality Productive Forces. Econ. Res. J. 2025, 60, 5–17. (In Chinese) [Google Scholar]
- Ren, Y.; Gao, J.; Zhan, X.; Xu, Q. Banking Competition and the Enhancement of New Quality Productive Forces: Evidence from China. Int. Rev. Financ. Anal. 2025, 102, 104099. [Google Scholar] [CrossRef] [Scilit]
- Soni, G.; Kumar, S.; Mahto, R.V.; Mangla, S.K.; Mittal, M.L.; Lim, W.M. A Decision-Making Framework for Industry 4.0 Technology Implementation: The Case of FinTech and Sustainable Supply Chain Finance for SMEs. Technol. Forecast. Soc. Chang. 2022, 180, 121686. [Google Scholar] [CrossRef] [Scilit]
- Qian, S.; Yu, W. Green Finance and Environmental, Social, and Governance Performance. Int. Rev. Econ. Finance 2024, 89, 1185–1202. [Google Scholar] [CrossRef] [Scilit]
- Hadfield, P.; Coenen, L. Contemporary Financial Capitalism and Sustainability Transitions in Urban Built Environments. Environ. Innov. Soc. Transit. 2022, 42, 285–300. [Google Scholar] [CrossRef] [Scilit]
- Xiong, M.; Li, W.; Xian, B.T.S.; Yang, A. Digital Inclusive Finance and Enterprise Innovation—Empirical Evidence from Chinese Listed Companies. J. Innov. Knowl. 2023, 8, 100321. [Google Scholar] [CrossRef] [Scilit]
- Zhang, Y.; Wang, X.; Feng, N. The Path of Green Finance to Promote the Realization of Low-Carbon Economic Transformation under the Carbon Peaking and Carbon Neutrality Goals: Theoretical Model and Empirical Analysis. Int. Rev. Financ. Anal. 2024, 94, 103227. [Google Scholar] [CrossRef] [Scilit]
- Du, M.; Zhang, Y.-J. The Synergistic Carbon Emission Reduction Advantage of Green Finance and Digital Finance. Environ. Impact Assess. Rev. 2025, 112, 107795. [Google Scholar] [CrossRef] [Scilit]
- Liu, Y.; Luan, L.; Wu, W.; Zhang, Z.; Hsu, Y. Can Digital Financial Inclusion Promote China’s Economic Growth? Int. Rev. Financ. Anal. 2021, 78, 101889. [Google Scholar] [CrossRef] [Scilit]
- Liu, Y.; He, Z. Synergistic Industrial Agglomeration, New Quality Productive Forces and High-Quality Development of the Manufacturing Industry. Int. Rev. Econ. Finance 2024, 94, 103373. [Google Scholar] [CrossRef] [Scilit]
- Yu, W.; Huang, H.; Zhu, K. Enhancing Construction Enterprise Financial Performance through Digital Inclusive Finance: An Insight into Supply Chain Finance. Sustainability 2023, 15, 10360. [Google Scholar] [CrossRef] [Scilit]
- Ren, X.; Zeng, G.; Gozgor, G. How Does Digital Finance Affect Industrial Structure Upgrading? Evidence from Chinese Prefecture-Level Cities. J. Environ. Manag. 2023, 330, 117125. [Google Scholar] [CrossRef] [Scilit]
- Cheng, Y.; Lv, K.; Zhu, S. How Does Digital Financial Inclusion Promote Green Total Factor Productivity in China? An Empirical Analysis from the Perspectives of Innovation and Entrepreneurship. Process Saf. Environ. Prot. 2023, 174, 403–413. [Google Scholar] [CrossRef] [Scilit]
- Cui, G. Research on the Influence of Digital Inclusive Finance on New Quality Productive Forces. Collect. Essays Finance Econ. 2025, 41, 52–65. (In Chinese) [Google Scholar]
- Shi, D.-K. The Impact and Mechanism of Digital Inclusive Finance on the New Quality Productivity of Manufacturing Enterprises. Econ. Probl. 2024, 12, 78–87. (In Chinese) [Google Scholar] [CrossRef]
- Akomea-Frimpong, I.; Kukah, A.S.; Jin, X.; Osei-Kyei, R.; Pariafsai, F. Green Finance for Green Buildings: A Systematic Review and Conceptual Foundation. J. Clean. Prod. 2022, 356, 131869. [Google Scholar] [CrossRef] [Scilit]
- Zhang, Z.; Luo, X.; Du, J.; Xu, B. Does Green Credit Accelerate Green Transformation of Heavily Polluting Enterprises? Int. Rev. Financ. Anal. 2023, 98, 103895. [Google Scholar] [CrossRef] [Scilit]
- Cui, X.; Said, R.M.; Rahim, N.A.; Ni, M. Can Green Finance Lead to Green Investment? Evidence from Heavily Polluting Industries. Int. Rev. Financ. Anal. 2024, 95, 103445. [Google Scholar] [CrossRef] [Scilit]
- Wang, X.; Wang, Q. Research on the Impact of Green Finance on the Upgrading of China’s Regional Industrial Structure from the Perspective of Sustainable Development. Resour. Policy 2021, 74, 102436. [Google Scholar] [CrossRef] [Scilit]
- Hu, J.; Zhang, H. Has Green Finance Optimized the Industrial Structure in China? Environ. Sci. Pollut. Res. 2023, 30, 32926–32941. [Google Scholar] [CrossRef] [Scilit]
- Yu, C.-H.; Wu, X.; Zhang, D.; Chen, S.; Zhao, J. Demand for Green Finance: Resolving Financing Constraints on Green Innovation in China. Energy Policy 2021, 153, 112255. [Google Scholar] [CrossRef] [Scilit]
- Meng, Y.; Yu, J.; Yu, Y.; Ren, Y. Impact of Green Finance on Green Total Factor Productivity: New Evidence from Improved Synthetic Control Methods. J. Environ. Manag. 2024, 372, 123394. [Google Scholar] [CrossRef] [Scilit]
- Gao, J.; Wu, D.; Xiao, Q.; Randhawa, A.; Liu, Q.; Zhang, T. Green Finance, Environmental Pollution and High-Quality Economic Development—A Study Based on China’s Provincial Panel Data. Environ. Sci. Pollut. Res. 2023, 30, 31917–31939. [Google Scholar] [CrossRef] [Scilit]
- Han, Z.; Zhao, J. Green Finance Empowers New Quality Productive Forces: From the Perspective of Supply Chain Overflow. Financ. Theory Pract. 2025, 6, 64–78. (In Chinese) [Google Scholar]
- Muganyi, T.; Yan, L.; Sun, H.-P. Green Finance, Fintech and Environmental Protection: Evidence from China. Environ. Sci. Ecotechnol. 2021, 7, 100107. [Google Scholar] [CrossRef] [Scilit]
- Wang, K.; Sun, X.; Zhang, L.; Wang, F. Does Financial Digitization Promote the Development of Green Finance?—Based on the Empirical Research of Chinese Industrial Listed Companies. Collect. Essays Finance Econ. 2020, 36, 44–53. (In Chinese) [Google Scholar]
- Chen, F.; Zhang, L.; Wu, H.; Dong, Z. Evaluation of the Coupling Coordination Degree between Digital Inclusive Finance and Green Technology Innovation in China. Environ. Sci. Pollut. Res. 2024, 31, 1212–1225. [Google Scholar] [CrossRef] [Scilit]
- Tang, L.; Yu, H.; Huang, Y.; Ruan, J.; Qin, Z.; Wang, S. The Synergistic Impacts of Green Finance and the Digital Economy on Urban Low-Carbon Transition: Insights from 293 Chinese Cities. Energy Policy 2026, 208, 114928. [Google Scholar] [CrossRef] [Scilit]
- Kanger, L.; Schot, J. Deep Transitions: Theorizing the Long-Term Patterns of Socio-Technical Change. Environ. Innov. Soc. Transit. 2019, 32, 7–21. [Google Scholar] [CrossRef] [Scilit]
- Schot, J.; Kanger, L. Deep Transitions: Emergence, Acceleration, Stabilization and Directionality. Res. Policy 2018, 47, 1045–1059. [Google Scholar] [CrossRef] [Scilit]
- Penna, C.C.R.; Schot, J.; Steinmueller, W.E. Transformative Investment: New Rules for Investing in Sustainability Transitions. Environ. Innov. Soc. Transit. 2023, 49, 100782. [Google Scholar] [CrossRef] [Scilit]
- Li, Q.; Chen, H.; Chen, Y.; Xiao, T.; Wang, L. Digital Economy, Financing Constraints, and Corporate Innovation. Pac.-Basin Finance J. 2023, 80, 102081. [Google Scholar] [CrossRef] [Scilit]
- Fu, H.; Zheng, C.; Yang, P. Digital Inclusive Finance and Green Transformation of Manufacturing Enterprises: Empirical Analysis Based on the Dual Perspectives of Demand and Supply. Technol. Forecast. Soc. Chang. 2024, 200, 123152. [Google Scholar] [CrossRef] [Scilit]
- Akomea-Frimpong, I.; Tumpa, R.J.; Ofori, J.A.N.; Botchway, B.; Tetteh, P.A.; Jin, X. Critical Success Factors of Green Finance on Zero Carbon Buildings. Energy Build. 2025, 338, 115735. [Google Scholar] [CrossRef] [Scilit]
- Ma, L.; Iqbal, N.; Bouri, E.; Zhang, Y. How Good Is Green Finance for Green Innovation? Evidence from the Chinese High-Carbon Sector. Resour. Policy 2023, 85, 104047. [Google Scholar] [CrossRef] [Scilit]
- Zhang, G.; Wang, Y.; Zhang, Z.; Su, B. Can Green Finance Policy Promote Green Innovation in Cities? Evidence from Pilot Zones for Green Finance Reform and Innovation in China. J. Environ. Manag. 2024, 370, 122816. [Google Scholar] [CrossRef] [Scilit]
- Shi, Y.; Yang, B. How Digital Finance and Green Finance Can Synergize to Improve Urban Energy Use Efficiency? New Evidence from China. Energy Strategy Rev. 2024, 55, 101553. [Google Scholar] [CrossRef] [Scilit]
- Wu, F.; Hu, Y.; Shen, M. The Color of FinTech: FinTech and Corporate Green Transformation in China. Int. Rev. Financ. Anal. 2024, 94, 103254. [Google Scholar] [CrossRef] [Scilit]
- Deng, J.; Liu, Q. Good Finance, Bad Finance, and Resource Misallocation: Evidence from China. J. Bank. Finance 2024, 159, 107078. [Google Scholar] [CrossRef] [Scilit]
- Peng, Q.; Xiao, Y.; Yang, Y.; Yang, P. A Study on the Measurement, Dynamic Evolution and Driving Factors of New Quality Productivity Development in China. Soft Sci. 2025, 39, 25–34. (In Chinese) [Google Scholar] [CrossRef]
- Guo, F.; Wang, J.; Wang, F.; Kong, T.; Zhang, X.; Cheng, Z. Measuring China’s Digital Financial Inclusion: Index Compilation and Spatial Characteristics. China Econ. Q. 2020, 19, 1401–1418. (In Chinese) [Google Scholar]
- Zhou, X.; Tang, X.; Zhang, R. Impact of Green Finance on Economic Development and Environmental Quality: A Study Based on Provincial Panel Data from China. Environ. Sci. Pollut. Res. 2020, 27, 19915–19932. [Google Scholar] [CrossRef] [Scilit]
- Chen, Y.; Hu, W. Distortions, Misallocation and Losses: Theory and Application. China Econ. Q. 2011, 10, 1401–1422. (In Chinese) [Google Scholar]
- Bai, J.; Liu, Y. Can Outward Foreign Direct Investment Improve the Resource Misallocation of China. China Ind. Econ. 2018, 1, 60–78. (In Chinese) [Google Scholar]
- National Bureau of Statistics of China. China Statistical Yearbook; China Statistics Press: Beijing, China. Available online: https://www.stats.gov.cn/sj/ndsj/index.html (accessed on 13 February 2026).
- Department of Investment in Fixed Assets Statistics, National Bureau of Statistics of China. China Statistical Yearbook on Construction; China Statistics Press: Beijing, China. Available online: https://navi.cnki.net/knavi/detail?p=Ectg7PU2T8qCB_fM76xUl7VB1KVm-VOXbaPJBGMgybLgspwLngoKiUDJ7C8V-egX50q0p_5ipdNZzS4vaTvdRfxm_VFAiy4Mx6k2plbxlqA= (accessed on 12 February 2026).
- Ministry of Housing and Urban-Rural Development of the People’s Republic of China. China Urban-Rural Construction Statistical Yearbook; China Statistics Press: Beijing, China. Available online: https://www.mohurd.gov.cn/gongkai/fdzdgknr/sjfb/tjxx/jstjnj/index.html (accessed on 16 February 2026).
- Institute of Financial Research, People’s Bank of China. Almanac of China’s Finance and Banking; Almanac of China’s Finance and Banking Magazine Co.: Beijing, China. Available online: https://navi.cnki.net/knavi/detail?p=Ectg7PU2T8qh7wAsOh0r2CNDjt8tBvG0NxNEiY7eVzHw1LqRUpUTZfpakKSisAJOlbJWnieKFZlMuHpsC-5Dau9c_JRL5hlP-3_EoPjNV6k= (accessed on 17 February 2026).
- Love, I.; Zicchino, L. Financial Development and Dynamic Investment Behavior: Evidence from Panel VAR. Q. Rev. Econ. Finance 2006, 46, 190–210. [Google Scholar] [CrossRef] [Scilit]
- Shao, Q.; Guo, J.; Kang, P. Environmental Response to Growth in the Marine Economy and Urbanization: A Heterogeneity Analysis of 11 Chinese Coastal Regions Using a Panel Vector Autoregressive Model. Mar. Policy 2021, 124, 104350. [Google Scholar] [CrossRef] [Scilit]
- Zhang, R.; Yu, J. Digital Finance, Business Environment and Economic Growth. Mod. Econ. Res. 2021, 7, 1–9. (In Chinese) [Google Scholar]
- Zhong, S.; Zhang, X.; Zhang, L.; Zhao, C. How Does Digital Economy Influence Urban Common Prosperity? Evidence from China’s Demonstration Area for Common Prosperity. Int. Rev. Econ. Finance 2025, 104, 104629. [Google Scholar] [CrossRef] [Scilit]
- Li, W.; Zhang, K. The Effects of Air Pollution on Enterprises’ Productivity: Evidence from Chinese Industrial Enterprises. Manag. World 2019, 35, 95–112+119. (In Chinese) [Google Scholar]
- Hao, X.; Li, Y.; Wu, H. Ways to Improve the Efficiency of Clean Energy Utilization: Does Digitalization Matter? Energy Strategy Rev. 2023, 50, 101257. [Google Scholar] [CrossRef] [Scilit]
- Hansen, B.E. Threshold Effects in Non-Dynamic Panels: Estimation, Testing, and Inference. J. Econom. 1999, 93, 345–368. [Google Scholar] [CrossRef] [Scilit]
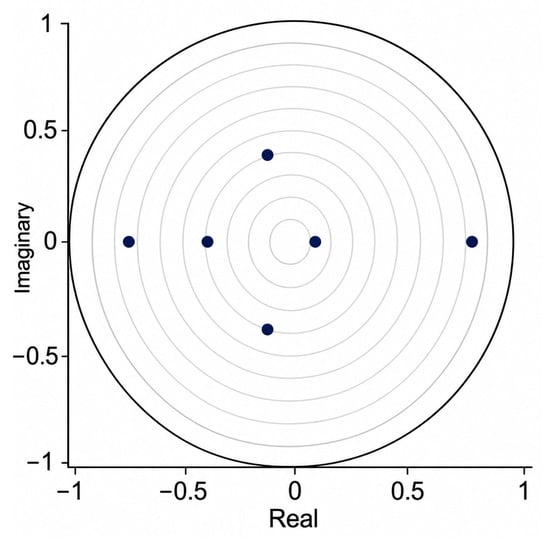
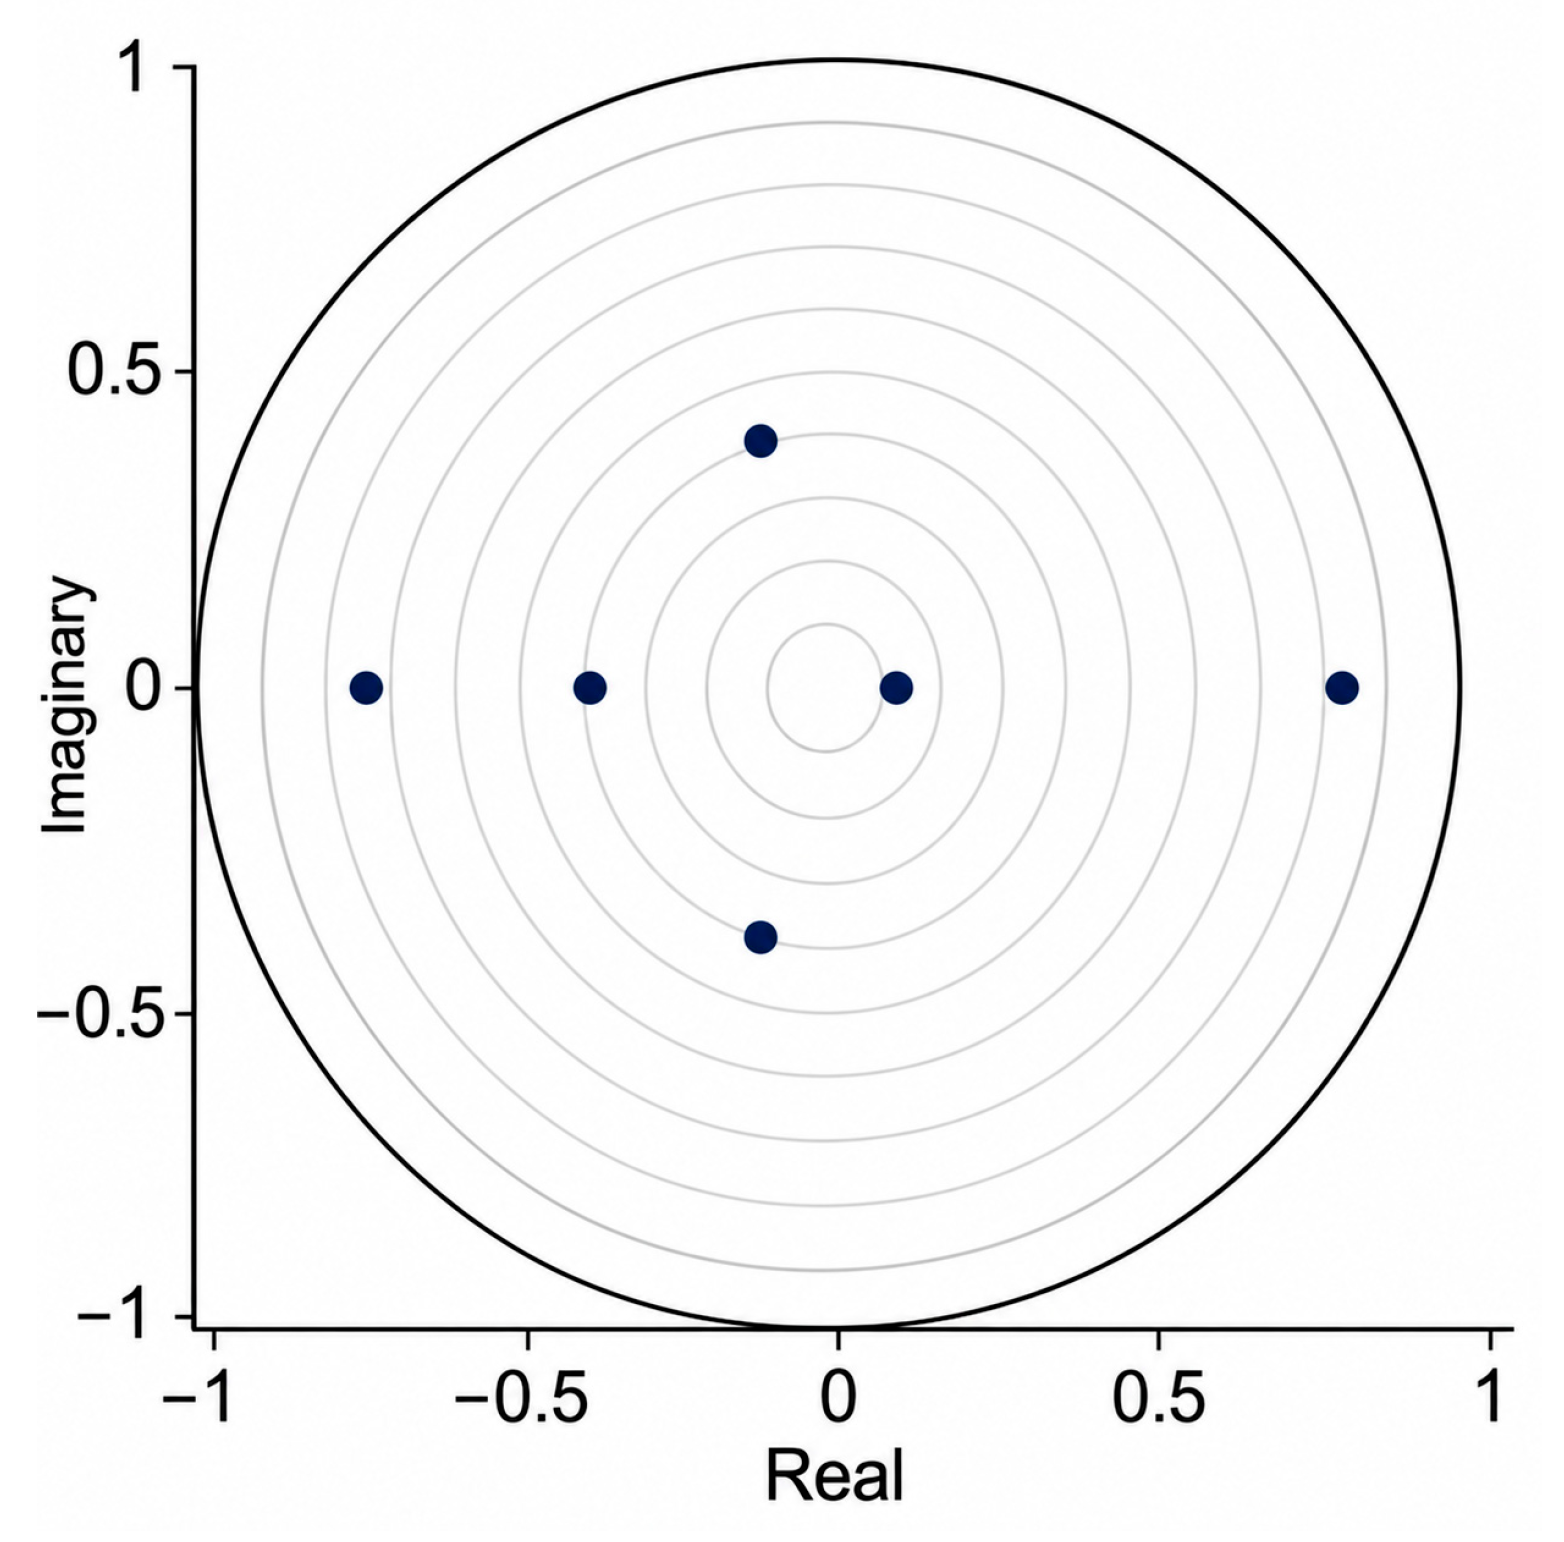
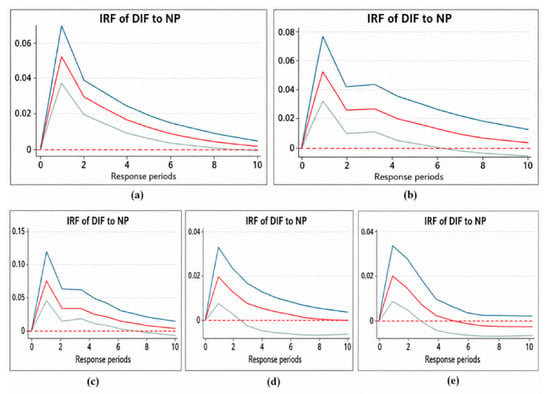
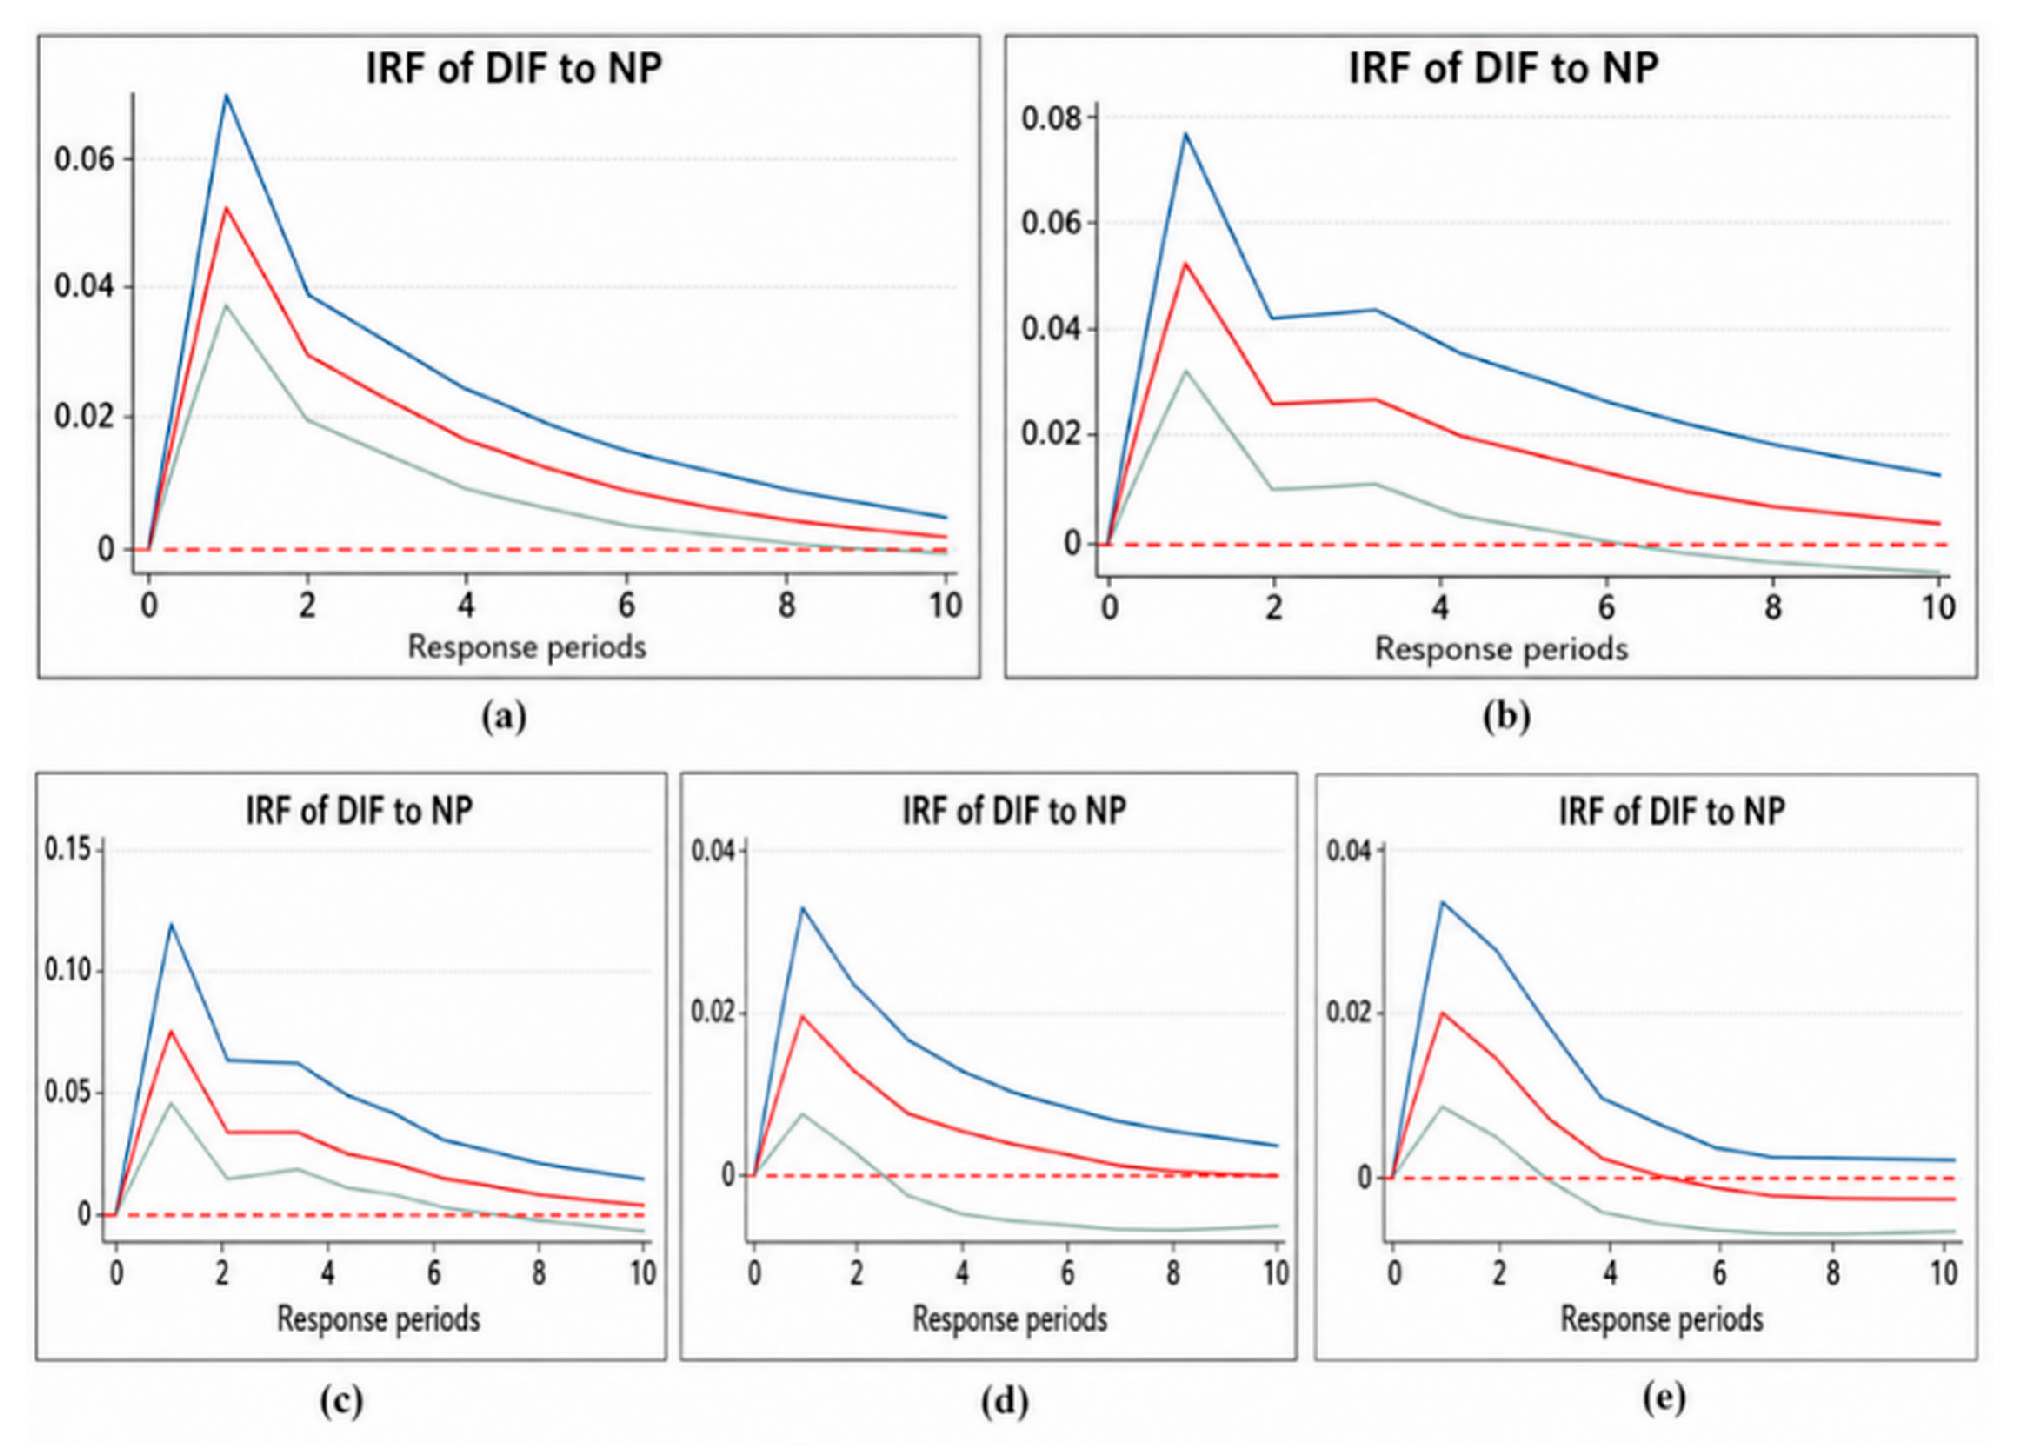
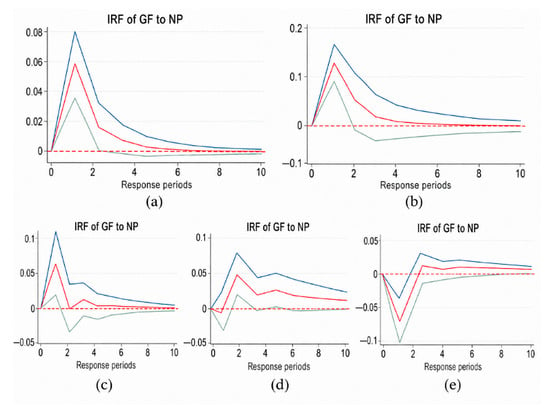
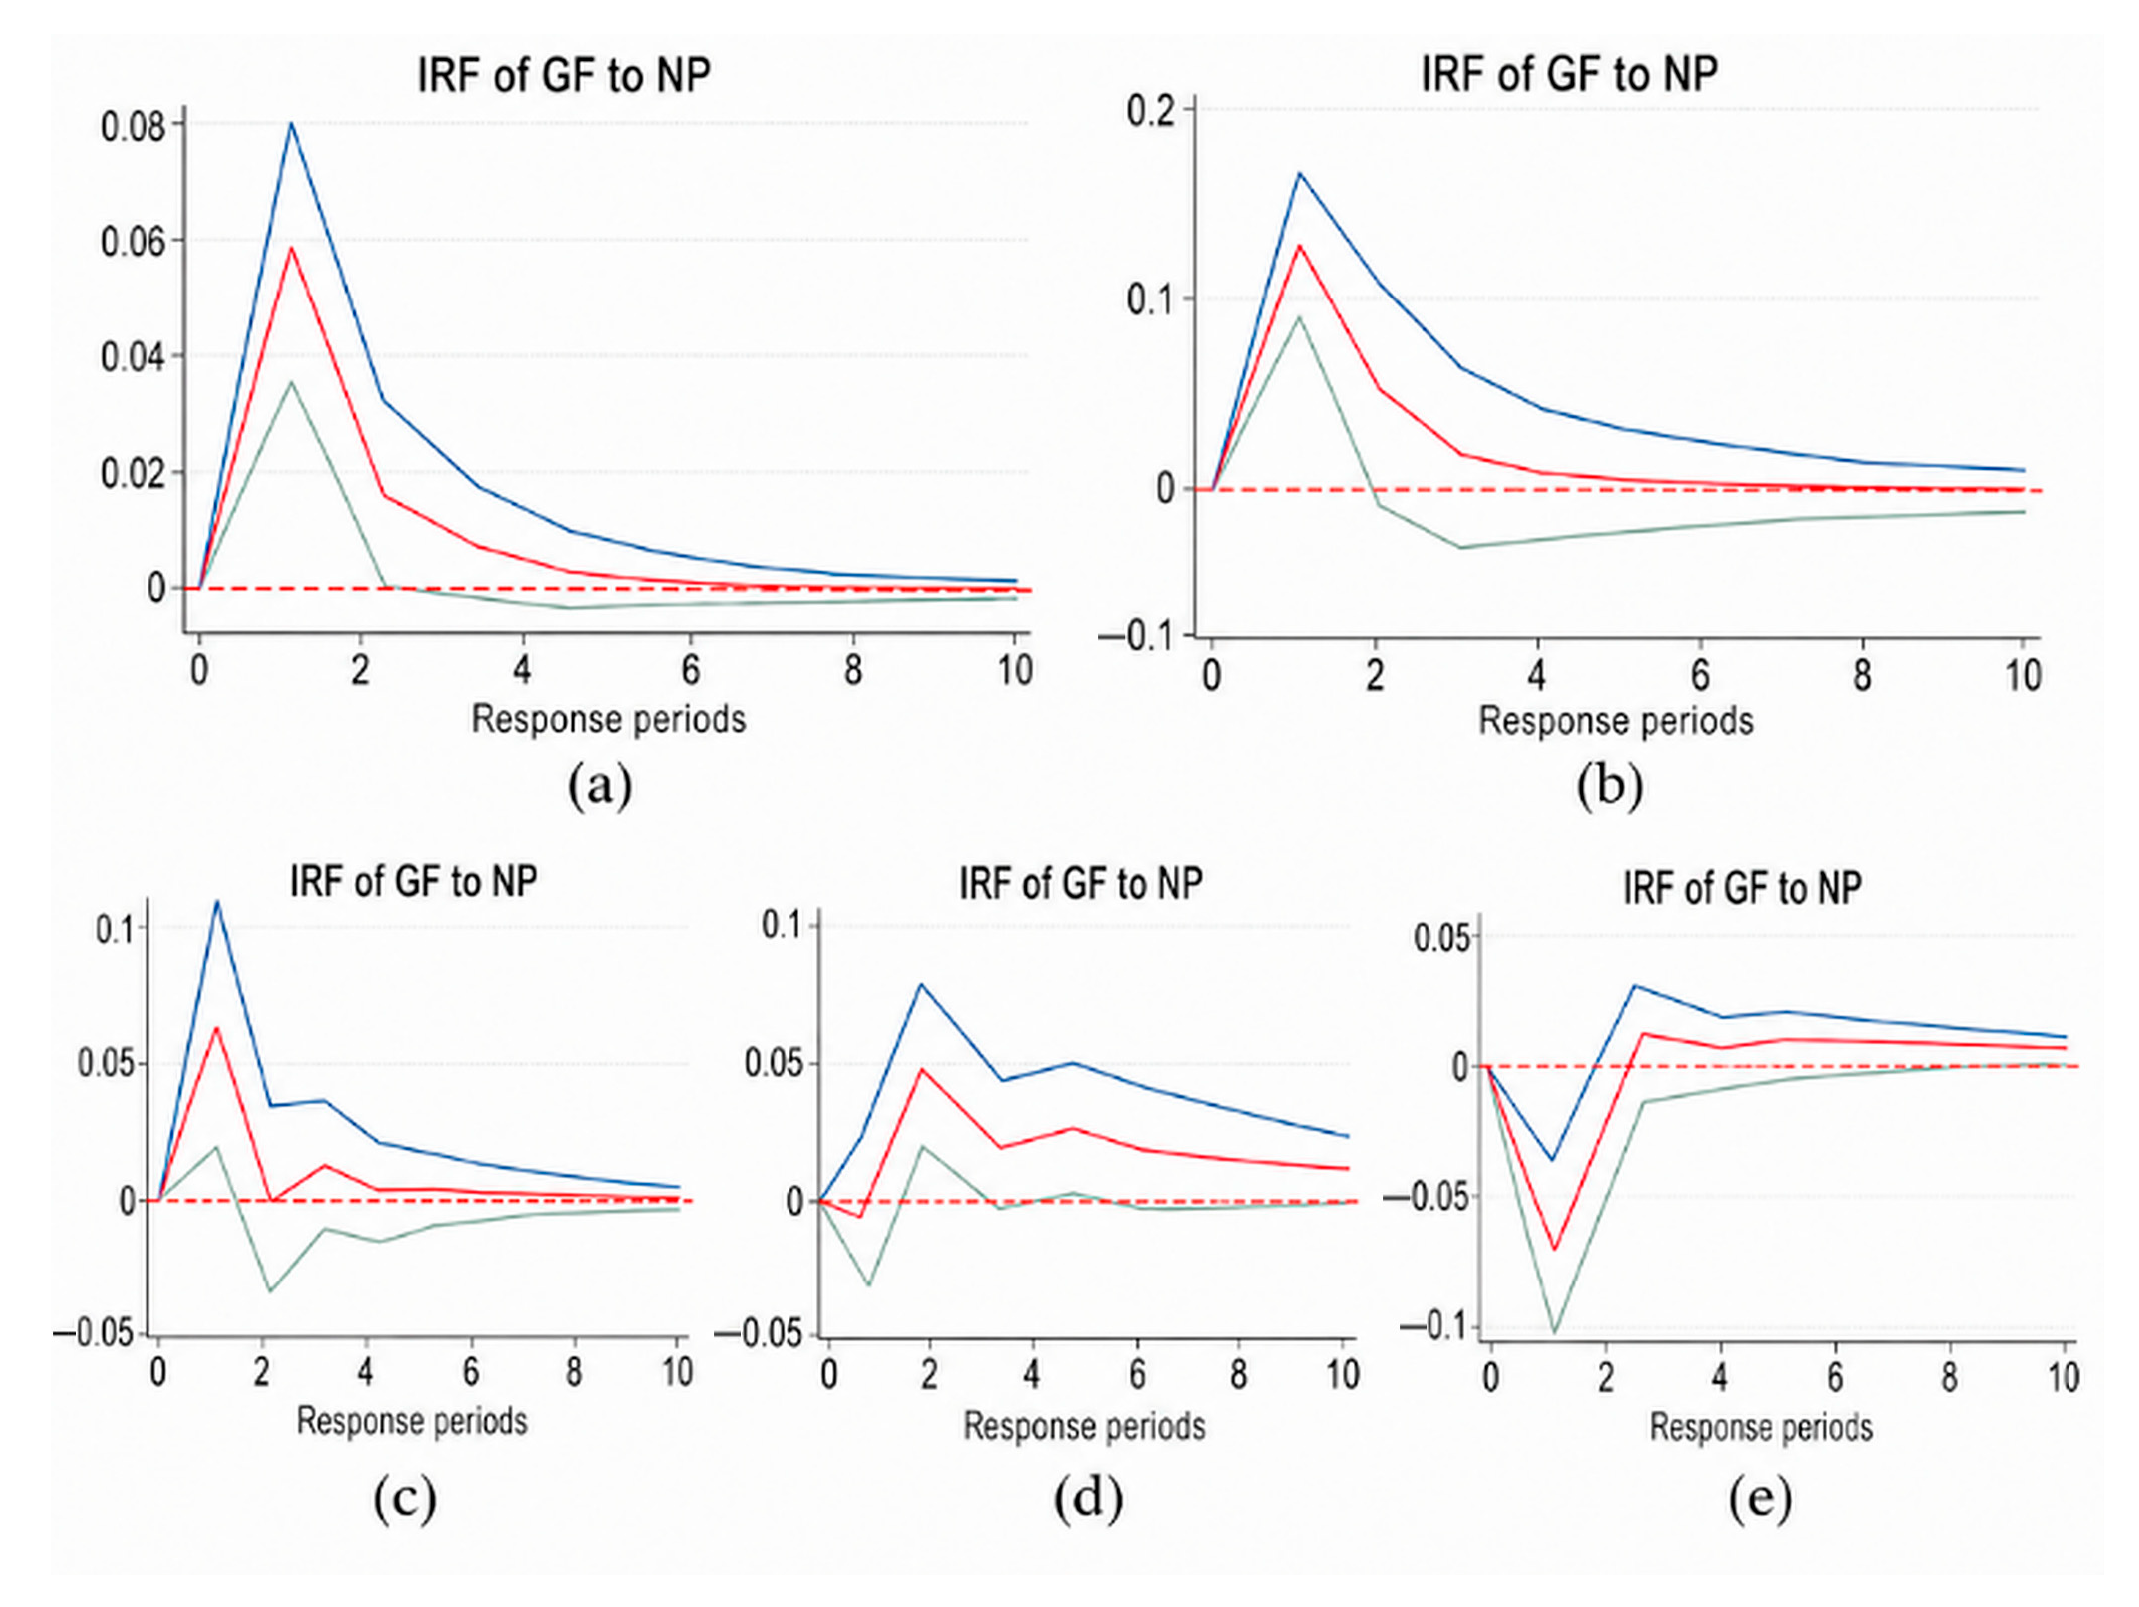

Disclaimer/Publisher’s Note: The statements, opinions and data contained in all publications are solely those of the individual author(s) and contributor(s) and not of MDPI and/or the editor(s). MDPI and/or the editor(s) disclaim responsibility for any injury to people or property resulting from any ideas, methods, instructions or products referred to in the content. |
© 2026 by the authors. Licensee MDPI, Basel, Switzerland. This article is an open access article distributed under the terms and conditions of the Creative Commons Attribution (CC BY) license.