


Abstract
Low-altitude tourism, which integrates the low-altitude economy with cultural tourism, is a key driver of the sustainable transformation of county-level tourism, offering a low-carbon alternative to ground-based travel in topographically constrained regions. Taking Huangling County, Shaanxi Province, as a case study, this research develops a systematic framework for siting takeoff and landing points and planning low-altitude tourism routes based on suitability analysis and the minimum cumulative resistance (MCR) model. Fourteen indicators across four dimensions—topography, land use, transportation accessibility, and scenic connectivity—were evaluated, with weights objectively determined by the entropy weight method. GIS-based spatial analysis identified six candidate points. The results show that safety-sensitive factors (distances to residential areas, schools, and hospitals) carry the highest combined weight (40.97%), followed by terrain factors (34.91%). An MCR model was then applied to extract preliminary spatial corridors via least-cost path analysis. The integrated ‘suitability evaluation–resistance modeling–network analysis’ approach offers a replicable framework for low-altitude tourism planning in similar regions.
1. Introduction
As global urbanization accelerates and ground traffic congestion intensifies, the low-altitude economy, represented by electric vertical takeoff and landing (eVTOL) aircraft and drones, is emerging as a key driver of regional economic growth and a catalyst for transforming transportation models [1,2].
In tourism contexts, low-altitude networks can shorten surface trips between scattered scenic spots and reduce ground-traffic pressure in ecologically and culturally sensitive areas, thereby contributing to low-carbon mobility and the sustainable development of county-level destinations. In this context, the rational planning of low-altitude takeoff/landing points and route networks, as well as the construction of a suitable low-altitude flight infrastructure network, has become a frontier topic of concern for governments and academia worldwide. China boasts abundant natural and cultural tourism resources. As a typical integrated format of “low-altitude economy + tourism,” low-altitude tourism can effectively expand the experiential dimensions of tourism, enhance the visitor experience, and create new economic growth opportunities for scenic areas [3]. However, the current development of low-altitude tourism still faces practical challenges such as weak infrastructure, complex airspace management, and a mismatch between route planning and tourist flow. Therefore, conducting research on the planning of low-altitude takeoff and landing points and route networks for specific tourist destinations holds significant theoretical value and offers practical guidance.
Huangling County, located in Yan’an City, Shaanxi Province, is the site of the Mausoleum of the Yellow Emperor (Xuanyuan), the legendary ancestor of the Chinese nation. It boasts numerous national and provincial key cultural relic protection sites, including the Mausoleum of the Yellow Emperor, the Thousand Buddha Temple Grottoes, and the Wan’an Zen Temple, with the annual number of tourists continuing to grow. However, the terrain of Huangling County is dominated by the hilly and gully landscape of the Loess Plateau, and the ground transportation network is significantly constrained by the topography. In particular, the efficiency of transportation connections between the core scenic areas and surrounding attractions needs improvement. This provides ample opportunities for the application of low-altitude transportation in scenarios such as tourist distribution, rapid interconnection between scenic spots, and aerial sightseeing experiences.
However, there is currently a lack of systematic vertiport layout and route network planning specifically for low-altitude tourism scenarios. Existing studies mostly discuss low-altitude economy policies or airspace management at a macro level, lacking refined planning schemes that target specific counties and integrate the characteristics of tourist demand with geographical constraints. Therefore, this study proposes the following core research questions: (1) How can the recommended spatial layout of low-altitude tourism takeoff and landing points in Huangling County be identified? (2) How can a recommended low-altitude route network that connects takeoff and landing points with the smallest cost of the tourism experience be constructed?
Based on the above questions, this study aims to construct a systematic planning methodology for low-altitude takeoff and landing points and route networks oriented toward tourism development, using Huangling County as a case study. The specific objectives include: (1) constructing an infrastructure accessibility and geospatial suitability evaluation model for Huangling County based on multi-source data; (2) identifying candidate locations and hierarchical levels of takeoff and landing points using spatial analysis algorithms; (3) designing preliminary spatial corridors; and (4) proposing planning implementation recommendations. The primary innovation of this study lies in its methodological integration: the factors influencing both takeoff/landing point siting and route alignment are incorporated into a single analytical system, and geographic suitability evaluation is innovatively coupled with network optimization algorithms in the planning of low-altitude takeoff/landing points and routes, thereby providing a replicable technical pathway for low-altitude tourism planning in terrain-constrained, tourism-oriented regions. It is important to note that the underlying mathematical structure of site selection and route planning is shared across urban, rural, and tourism contexts, where suitability and feasibility are governed by measurable spatial, operational, demand, and accessibility parameters. However, applying this common structure to county-level tourism planning requires non-trivial methodological adaptation due to two key challenges: (1) data scarcity, which necessitates the fusion of remote sensing imagery, POI data, road networks, tourism statistics, and field surveys; and (2) distinct demand and network characteristics, where tourism traffic is destination-clustered, seasonally fluctuating, and originates from dispersed entry points, and where low-altitude services serve as a gap-filling extension of a sparse ground network rather than a congestion-relief alternative. The proposed integrated framework addresses these specific challenges and offers a transferable methodology for similar regions.
The remainder of this paper is structured as follows: Section 2 presents the literature review; Section 3 introduces the study area; Section 4 elaborates on the research methodology and model construction; Section 5 presents the planning results and analysis; and Section 6 concludes the paper with conclusions and discussion.
2. Literature Review
2.1. Elements of Low-Altitude Transportation Planning
The low-altitude economy, which relies on low-altitude airspace resources, utilizes advanced aircraft as carriers, and is characterized by diverse application scenarios, is experiencing rapid growth globally. As an important strategic direction for reshaping urban transportation patterns and cultivating new drivers of economic growth, the low-altitude economy provides key support for alleviating the increasingly prominent issues of congestion, energy, and environmental constraints faced by traditional urban ground transportation systems, thereby contributing to the development of an efficient, green, and multi-dimensional urban transportation system. Within this context, Urban Air Mobility (UAM) constitutes the core industrial sector and key application scenario of the low-altitude economy. It aims to provide safe, efficient, and environmentally friendly transportation services in urban and suburban areas using new types of aircraft, such as electric Vertical Takeoff and Landing (eVTOL) vehicles [4,5]. Low-altitude passenger transportation offers several advantages, namely the use of small aircraft, short travel ranges, and high time efficiency, allowing it to serve as a specialized complement to the existing transportation system and meeting the intercity and intra-city travel needs of high-net-worth individuals, such as business travelers and cultural tourists.
The safe, orderly, and efficient operation of the UAM system depends on several fundamental elements, including low-altitude airspace, low-altitude routes, low-altitude infrastructure, low-altitude aircraft, and low-altitude air traffic control, which together constitute the UAM operational system. Among these elements, the siting of takeoff/landing points (as a key component of low-altitude infrastructure) and the planning of UAM route networks are two critical aspects of UAM operations.
Takeoff and landing points are the main nodes of the urban air mobility network, serving as the primary points for takeoff, landing, and passenger transfers within the UAM network. The layout of vertical takeoff and landing points has significant impacts on the arrangement and development direction of the public route network [1]. Brunelli [6] pointed out that vertiport siting and capacity planning are hot topics in current research, and their capacity design needs to meet demand with investment costs. Fadhil [7] analyzes the GIS-based siting of takeoff and landing points, evaluates the weights of factors influencing UAM infrastructure development, and conducts case studies of two major cities under three scenarios. The results indicate that city centers, airports, and intercity railway stations, which balance accessibility and operational efficiency, are suitable for initial UAM operations, thereby providing a reference for practical vertiport siting.
Low-altitude air routes serve as key links connecting network nodes such as takeoff and landing points. To ensure the safe and efficient operation of eVTOL aircraft between designated takeoff and landing points, it is essential to systematically design and plan air corridors [8]. Air corridors are pre-defined flight pathways within the three-dimensional urban space. They are designed to regulate flight routes and avoid high-rise buildings and sensitive areas, thereby ensuring the safe operation of aircraft and reducing the risk of collision [9]. Air corridors also help reduce noise disturbance to ground communities. Actual flight routes, in contrast, operate within the framework of air corridors to specifically connect takeoff and landing points. When determining the length, alignment, and redundancy design of these routes, factors such as flight efficiency, range limitations, weather adaptability, and emergency diversion capability need to be comprehensively considered.
2.2. Factors Influencing Low-Altitude Transportation Planning
The siting of takeoff and landing points is subject to a set of regulatory and technical guidelines issued by international aviation authorities, which collectively establish the fundamental requirements for vertiport site selection. At the international level, the International Civil Aviation Organization (ICAO) has not yet issued a dedicated standard for vertiports; instead, its siting requirements are primarily extrapolated from the existing heliport framework (Annex 14 and Doc 9261), which constrains site conditions through the technical specifications of the Final Approach and Takeoff Area (FATO), the Touchdown and Liftoff Area (TLOF), and the safety area. In Europe, the European Union Aviation Safety Agency (EASA) published the world’s first vertiport design guideline—the Prototype Technical Design Specifications for Vertiports (PTS-VPT-DSN)—in March 2022, which systematically specifies the physical characteristics, obstacle environment, visual aids, and lighting and marking requirements of vertiports, and introduces the innovative concept of the obstacle-free volume to address congested urban settings. In China, the Civil Aviation Administration of China (CAAC) issued the Technical Requirements for Civil Vertical Takeoff and Landing Points (Draft for Comments) in June 2024, which stipulates that site selection should comprehensively consider airspace conditions, obstacle clearance, meteorological conditions, and the electromagnetic environment and that vertiports should be coordinated with urban and land-use planning while maintaining a safe distance from military control zones, government institutions, and densely populated areas such as schools and hospitals that are difficult to evacuate. Taken together, these guidelines provide the regulatory foundation for the four categories of influencing factors examined below: while ICAO’s heliport framework establishes the baseline safety and physical constraints, the EASA and CAAC technical specifications further operationalize these requirements into the specific considerations of safety, environment, society, and economy that shape vertiport siting.
Taken together, these guidelines establish the regulatory foundation for the four categories of influencing factors: safety factors, environmental factors, social factors, as well as economic factors such as construction costs, operating costs, and expected revenue [10].
- (1)
- Safety Factors
Safety is critical to ensuring the normal operation of low-altitude transportation. This requires the siting of takeoff and landing points to comply with airspace classification and usage rules and to undergo rigorous airspace compatibility assessment to ensure that operating airspace does not conflict with civil aviation or general aviation airspace. The Technical Requirements for Civil Vertical Takeoff and Landing Points (Draft for Comments) issued by the Civil Aviation Administration of China (CAAC) stipulates that the siting of takeoff and landing points maintain a certain distance from important facilities. Specifically, they should be located away from military control zones, government departments, and scientific research facilities, while also avoiding areas such as schools and hospitals that are densely populated and difficult to evacuate. Using a GIS-based multi-criteria decision analysis framework, Fadhil [7] explored siting strategies for takeoff and landing ground infrastructure. The study pointed out that city centers, comprehensive transportation hubs, and high-income areas are relatively ideal locations for vertiport siting. However, it also emphasized that to reduce potential risks and negative social impacts during operation, these sites should be kept away from military restricted zones, government departments, and research institutions and should avoid densely populated areas that are difficult to evacuate.
- (2)
- Environmental Factors
Meteorological conditions and electromagnetic interference are important considerations for siting takeoff and landing points [11,12]. Additionally, the high-intensity noise generated during takeoff and landing is a key environmental concern. The site should be aligned with local spatial planning and should avoid noise-sensitive areas wherever possible. Therefore, sites should be located away from residential areas, schools, hospitals, and other noise-sensitive zones. Alternatively, measures such as installing noise barriers and optimizing flight routes can be adopted to mitigate the noise impact [10]. Jeong et al. [13] conducted a case study in Seoul. After screening potential sites using K-means clustering, they analyzed noise impacts using the Aviation Environmental Design Tool (AEDT) and a helicopter model. The results showed that a “noise-priority route” could reduce the population affected by high noise levels by 76.9%.
- (3)
- Social Factors
Convenient ground transportation transfer is key to integrating UAM into the urban multimodal transportation system. Lee et al. [14] compared Busan and Jeju Island in South Korea and proposed a three-stage geospatial analysis framework, identifying transportation hub areas as highly suitable locations for vertiport siting.
Beyond physical accessibility, social acceptance constitutes another critical dimension of social factors, as low-altitude tourism, while offering enhanced travel experiences may also induce psychological and physiological flight anxiety among passengers and impose negative externalities on local residents. Huang et al. [15] meta-analyzed 30 empirical studies from 2021 to 2025 and found that public attitudes toward UAM were only slightly positive, with social–emotional variables such as trust and enjoyment exerting stronger effects than instrumental variables such as perceived usefulness and with social influence, personal innovativeness, and environmental norms identified as the main drivers. At the European level, the EASA [16] survey ranked noise (18%) and safety (17%) as the two leading public concerns. Country-specific studies corroborate these findings: Mostofi et al. [17], based on a structural equation model of 819 German questionnaires, showed that the perceived pressure of new air traffic flow, noise, and skyline visual obstruction foster negative public attitudes; Chan et al. [18] examined the social acceptance of advanced air mobility among young and middle-aged groups in China’s Greater Bay Area and, through an affective regulation mechanism, suggested designing low-altitude tourism as a tourist-centered aerial experience—an effective way to familiarize some passengers with flight-related sensations. These findings underscore that social acceptance, rather than mere accessibility, must be a central consideration in vertiport siting [19].
Moreover, the demand for low-altitude tourism exhibits marked seasonal fluctuation, adding a temporal dimension to social and demand-side planning. Forecasting methods have shifted from econometric models toward machine learning and deep learning [20]. Accordingly, low-altitude tourism facility planning should fully account for seasonal demand variation, with particular emphasis on the dynamic scheduling and flexible configuration of facilities between peak and off-peak periods.
- (4)
- Economic Factors
Construction cost is a key economic indicator for siting takeoff and landing points. Zhao et al. [21] used a multi-objective optimization model to determine potential vertiport locations, aiming to maximize the total number of air taxi passengers while minimizing total facility costs and travel distances.
2.3. Research Methods for Low-Altitude Transportation Planning
The siting and layout of takeoff and landing points—which can be generally categorized into three main technical approaches, namely GIS-based spatial suitability analysis, data-driven identification based on travel demand clustering, and multi-objective optimization modeling—have become a critical prerequisite for the implementation of low-altitude transportation [10].
GIS was initially used to assess the spatial suitability of takeoff and landing points and identify potential construction areas. Fadhil [7] employed a GIS-based weighted linear combination method to analyze site suitability using indicators such as population density, transportation hubs, and noise-sensitive areas and found that city centers, airports, and major transportation hubs are suitable for initial low-altitude operations. Lu et al. [22] constructed an evaluation system across the dimensions of safety, economy, and society. Using GIS to screen candidate takeoff and landing points, they then integrated a demand coverage optimization model and validated its effectiveness through a case study of Shenzhen.
Methods based on travel demand clustering primarily aim to identify potential low-altitude users and understand travel demand patterns. Rajendran et al. [23] used taxi data to construct a demand distribution and employed a constrained clustering algorithm to identify potential vertiport locations. The results showed that airports and central parks require high-capacity vertiports, while standard vertiports can be deployed in city centers. Wang et al. [19] proposed a multi-criteria-based approach to generate candidate sets based on parameters such as rent, population density, and travel frequency, followed by K-means optimization for site selection. Multi-objective optimization is often incorporated into the analysis to achieve goals in areas such as economic efficiency, operational efficiency, and safety—for example, minimizing construction and operating costs [24], minimizing travel time [25], and reducing traffic congestion [26].
Route network planning primarily relies on optimization theory-based methods and simulation-based approaches [10]. The optimization theory-based methods mainly involve single-level and bi-level optimization algorithms [8,27,28,29,30]. In contrast to studies that construct and solve mathematical programming models using exact or heuristic algorithms, other scholars have adopted simulation methods to study the integration of low-altitude with existing urban ground transportation networks. Through simulation, researchers can test different scenarios in a virtual environment and analyze the impacts of UAM integration, such as using the MATSim 14.3 platform [31] and the MANTA simulation [32,33], among others.
2.4. Research Gaps and the Rationale for a Suitability-MCR Framework
Despite considerable progress in vertiport siting and low-altitude network planning, three gaps remain for county-level tourism contexts, and they jointly motivate the methodological choice of this study.
First, siting and routing are largely treated as separate problems. GIS-based multi-criteria suitability analysis can classify spatial constraints—terrain slope, vegetation cover, ecological redlines, cultural relic protection zones, and noise-sensitive areas—into prohibited, restricted, and suitable layers, yet it generally stops at a suitability map and offers little guidance on how the identified points should be connected [8,15]. Conversely, corridor and trajectory studies presuppose a given node set and optimize alignments under operational or airspace constraints without examining whether those nodes are spatially suitable [9,10]. Demand-clustering and multi-objective optimization approaches require an existing candidate site set and, for demand-driven methods, high-resolution mobility data such as mobile signaling records or OD matrices [14,24]—inputs seldom available in tourism-oriented counties of central and western China, where remote sensing imagery, DEM, and land use data are far more accessible. A framework is therefore needed in which the output of site selection becomes the direct input of route extraction.
Second, route alignment in terrain-constrained regions is not adequately represented by geometric or regulatory treatments. Existing studies often connect nodes by straight lines or delineate corridors mainly by airspace rules and obstacle clearance, overlooking the continuous, spatially varying cost imposed by terrain relief, surface cover, heritage protection zones, and ground-level disturbance [9,10]. The MCR model, originating in landscape ecology and widely validated in ecological and heritage corridor planning [34,35], instead represents the environment as a continuous resistance surface and identifies least-cost paths between sources. Transposing its “source identification–resistance surface construction–corridor extraction” paradigm to low-altitude tourism allows routes to follow low-resistance features such as river valleys while avoiding heritage cores, ecologically sensitive zones, and residential clusters—adaptability that geometric or rule-based delineation can hardly achieve and that matters most where route value is derived from aerial sightseeing and rapid inter-scenic connections.
Third, weighting and contextual transferability remain problematic. Earlier suitability studies often rely on expert judgement or the analytic hierarchy process, which is subjective and difficult to justify where local expertise is limited; this study therefore adopts the entropy weight method. Moreover, conclusions from metropolitan cases, where city centers, airports, and intercity rail stations dominate the suitable-site hierarchy [8], cannot be transferred to a Loess Plateau county with a hilly-gully terrain, sparse ground network, and destination-clustered, seasonally fluctuating tourist flows.
These considerations explain the coupling of suitability analysis with the MCR model: the two share a common mathematical structure, whereby the candidate points identified by the suitability evaluation serve as “sources” in the MCR model and the same indicator system and entropy-derived weights are reused to build the flight resistance surface, ensuring consistency between node identification and corridor extraction. The resulting “suitability evaluation–resistance modelling–network optimization” chain closes the three gaps simultaneously: it screens sites under hard spatial constraints, generates routes responding to continuous geographic resistance rather than geometric proximity, and does so with objective weights and county-scale attainable data.
Therefore, this study takes Huangling County as a case study and couples GIS-based suitability analysis with the MCR model to plan its low-altitude tourism takeoff/landing points and route network, validating the rationality and feasibility of the proposed framework at the county level. The results provide a scientific basis for low-altitude tourism infrastructure layout in Huangling and a replicable technical pathway for similar tourism-oriented counties.
3. Research Area and Variables
3.1. Study Area
3.1.1. Geographical Location and Topography
Huangling County is located in the southern part of Yan’an City, Shaanxi Province, China, with geographical coordinates ranging from 35°25′ N to 35°52′ N latitude and 108°30′ E to 109°07′ E longitude. The county covers a total area of approximately 2292 square kilometers, with a permanent population of about 130,000. Situated in the central Loess Plateau, the county features a typical loess hilly and gully terrain. Elevations range from 800 to 1500 m, with the highest point in the Qiaoshan Mountain Range reaching 1562 m. The overall terrain slopes downward from west to east, characterized by an intermixed distribution of loess ridges, mounds, gullies, and river valley plains. The Ju River, a tributary of the Wei River, flows from west to east through the county, forming a relatively flat alluvial plain along its banks, where the county seat and most agricultural activity are concentrated. Figure 1 shows the location of Huangling County in Shaanxi Province and a regional map of the county.
Figure 1.
Shannxi Province and study area.
The complex terrain—characterized by fragmented landscapes and steep slopes—poses significant challenges to the construction of traditional ground transportation infrastructure (see the DEM map in Figure 2). However, these terrain conditions also provide favorable conditions for low-altitude flight operations, as the relatively low population density in mountainous areas reduces the risk of ground casualties during emergencies.
3.1.2. Tourism Resources and Development Status
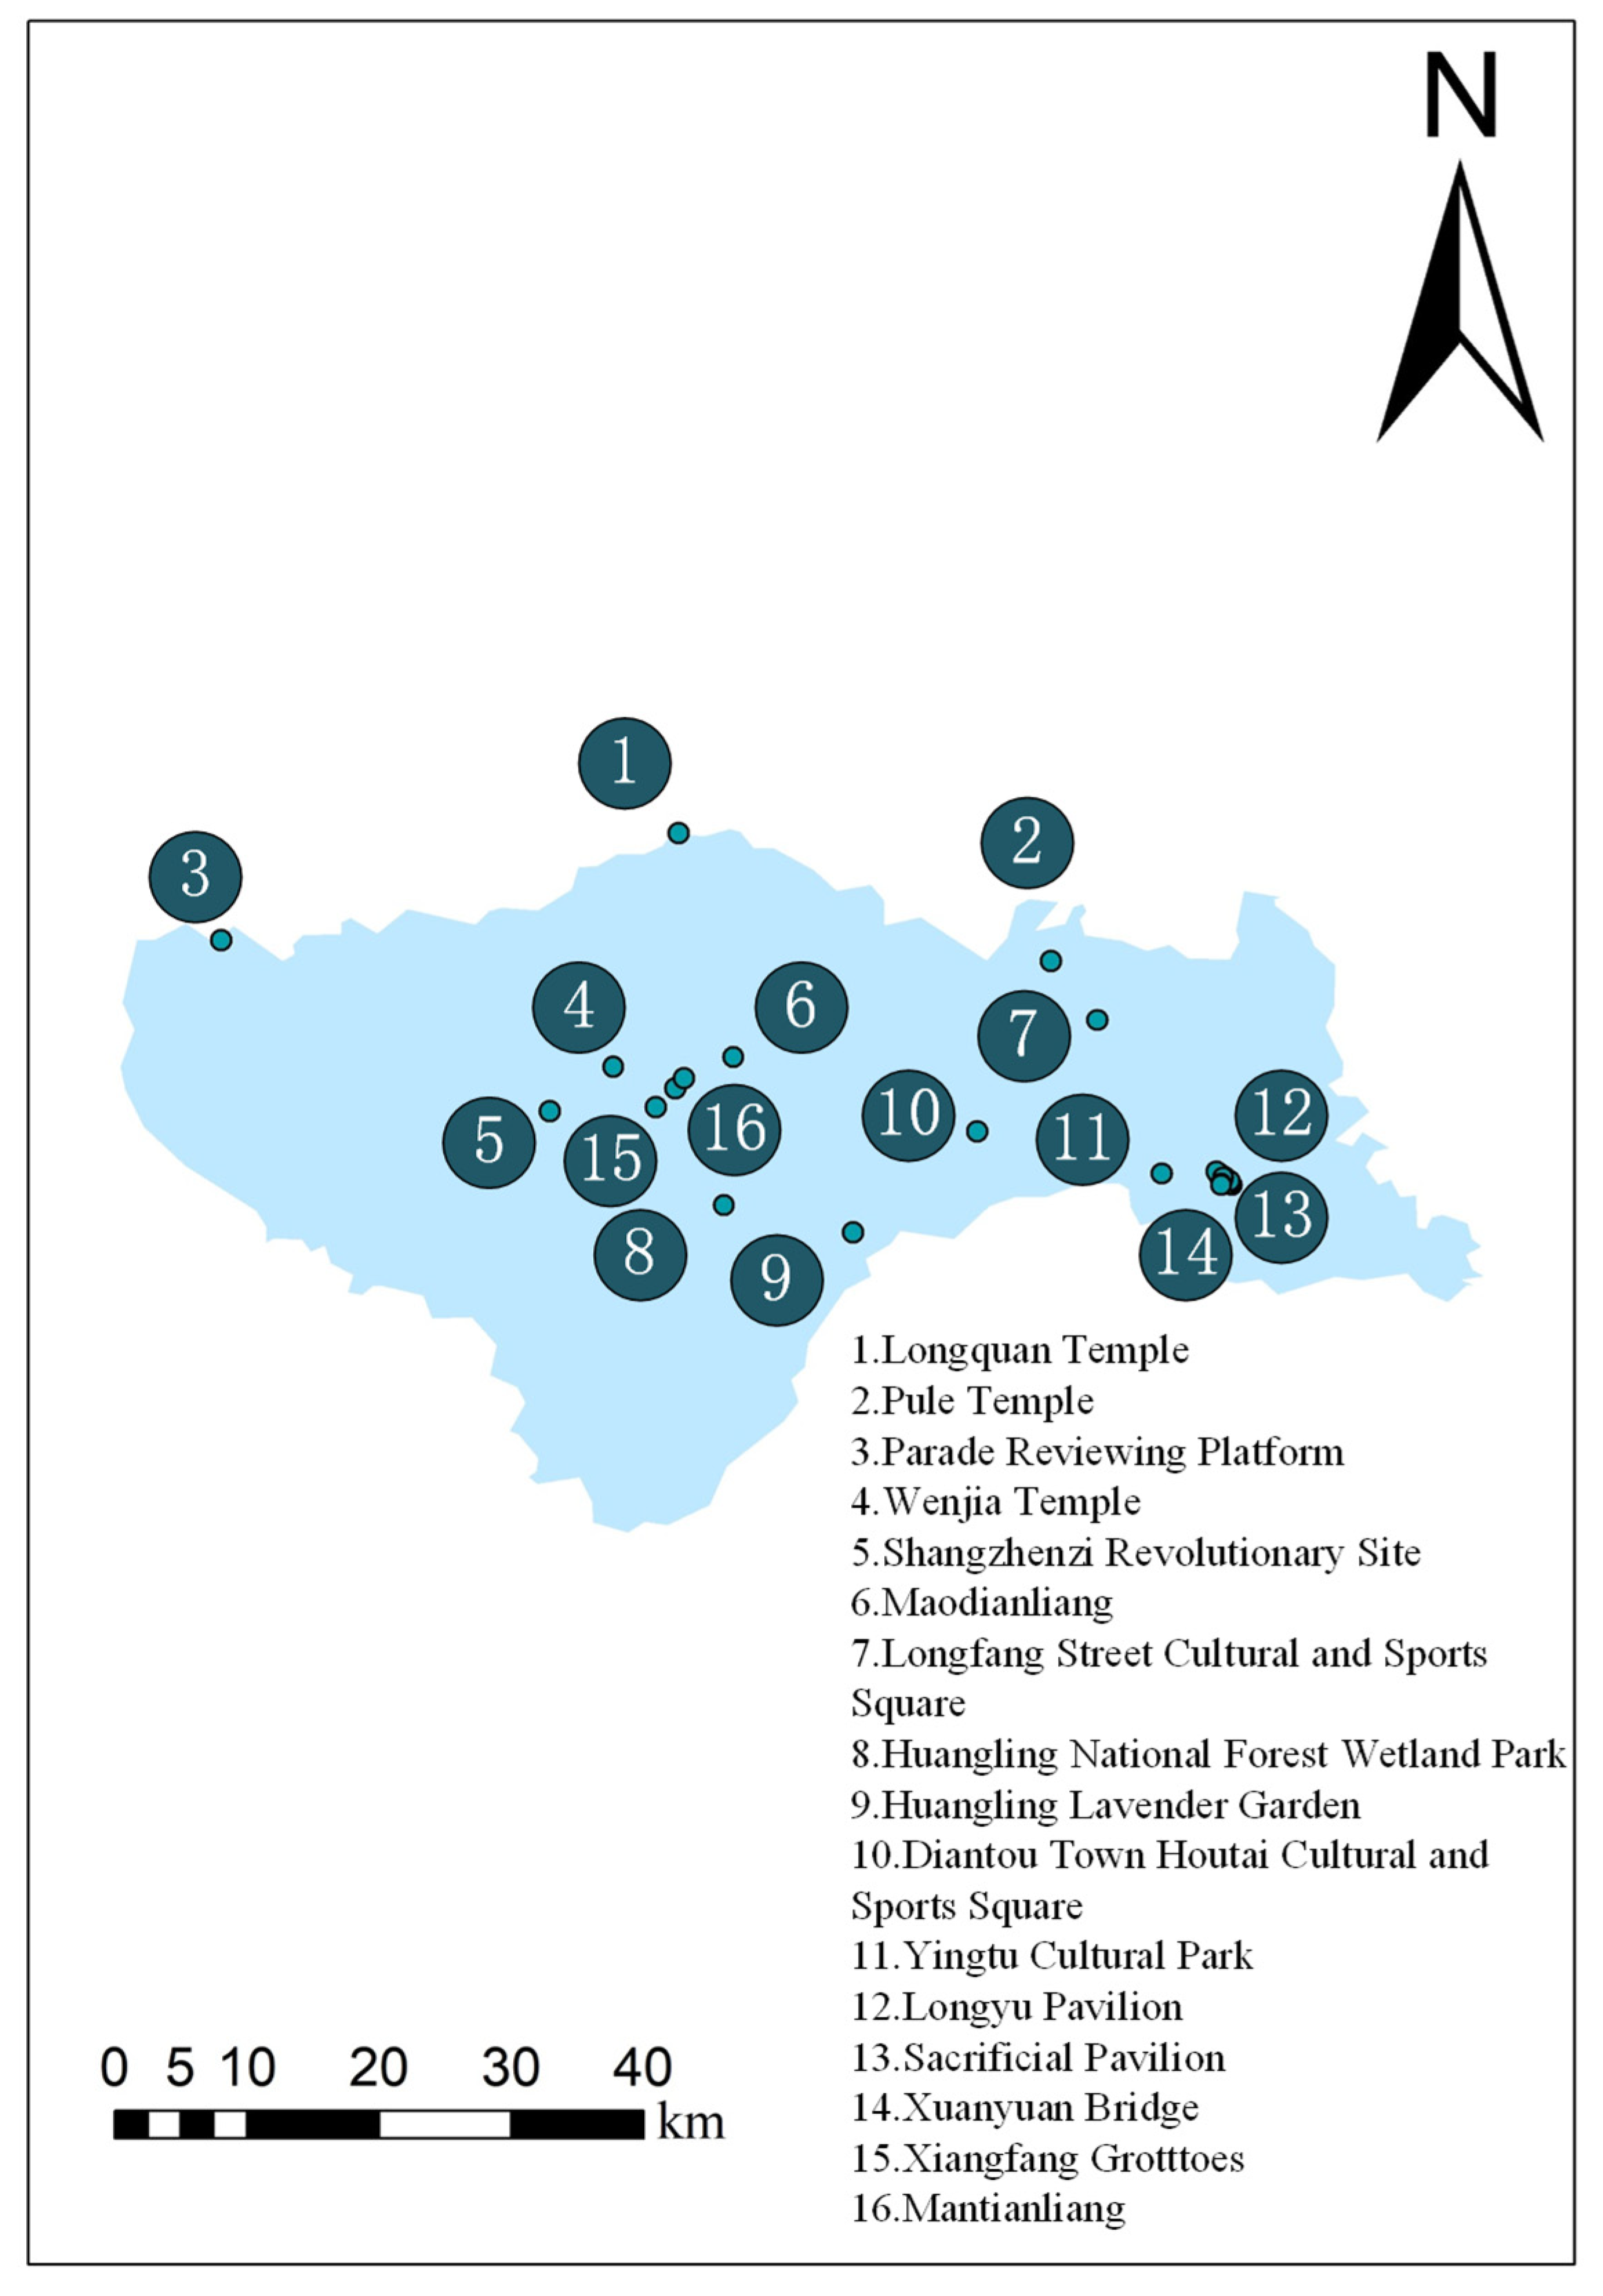
Huangling County is renowned as the resting place of Xuanyuan Huangdi (the Yellow Emperor), the legendary ancestor of the Chinese nation. The Huangdi Mausoleum, a national 5A-level tourist attraction and a site on the UNESCO World Heritage Tentative List, attracts millions of domestic and international tourists each year. Particularly during the Qingming Festival, the grand memorial ceremony attracts a large number of overseas Chinese to pay homage to their ancestors and trace their cultural roots. In addition to the Huangdi Mausoleum, Huangling County boasts a wealth of natural and cultural tourism resources, as shown in Figure 3. According to the Huangling County Tourism Development Master Plan (2021–2025), the county received over 3.5 million tourists in 2023, generating a total tourism revenue of approximately RMB 2.8 billion. During the 2025 holiday periods, the average daily visitor volumes for major scenic spots in Huangling County displayed a distinctly tiered distribution pattern. The Mausoleum of the Yellow Emperor (Huangdi Mausoleum) received the heaviest traffic, with an average daily attendance exceeding 20,000 visitors during holidays, accounting for over 70 percent of the county’s total holiday tourist flow and firmly establishing it as the absolute core of Huangling’s tourism. Peak congestion was particularly pronounced around the Spring Festival, the Qingming ancestral ceremony, and the May Day and National Day holidays. Huangling National Forest Park ranked second, drawing approximately 10,000 visitors per day during holiday periods and serving as the county’s second-largest tourist hub by virtue of its forest ecology and summer-resort offerings. Wan’an Chanyuan Grottoes formed the third tier, with holiday daily attendance reaching approximately 1000 visitors. In addition, attractions such as the Shangzhenzi Revolutionary Sites (comprising the Gaoyaoxi, Xiaoshiya, and Dashiya former revolutionary sites), Suoluowan Canyon Village, and the Huangling Lavender Garden each also welcomed over 1000 visitors per day during holidays, collectively providing multi-point support for Huangling’s all-for-one tourism (quanyu lüyou) development. In recent years, Huangling County has prioritized the cultural-tourism industry as its leading sector, continuously intensifying scenic-area development and promotional efforts while expediting the integration of the new “Hall–Temple–Mausoleum–City” tourism route and the construction of an all-for-one tourism pattern.
However, the spatial distribution of tourist attractions is relatively dispersed, with the average ground travel time between major scenic spots exceeding 30 min. The lack of efficient inter-scenic transportation has become a key bottleneck constraining the further development of the tourism industry.
Figure 2.
Elevation Map.
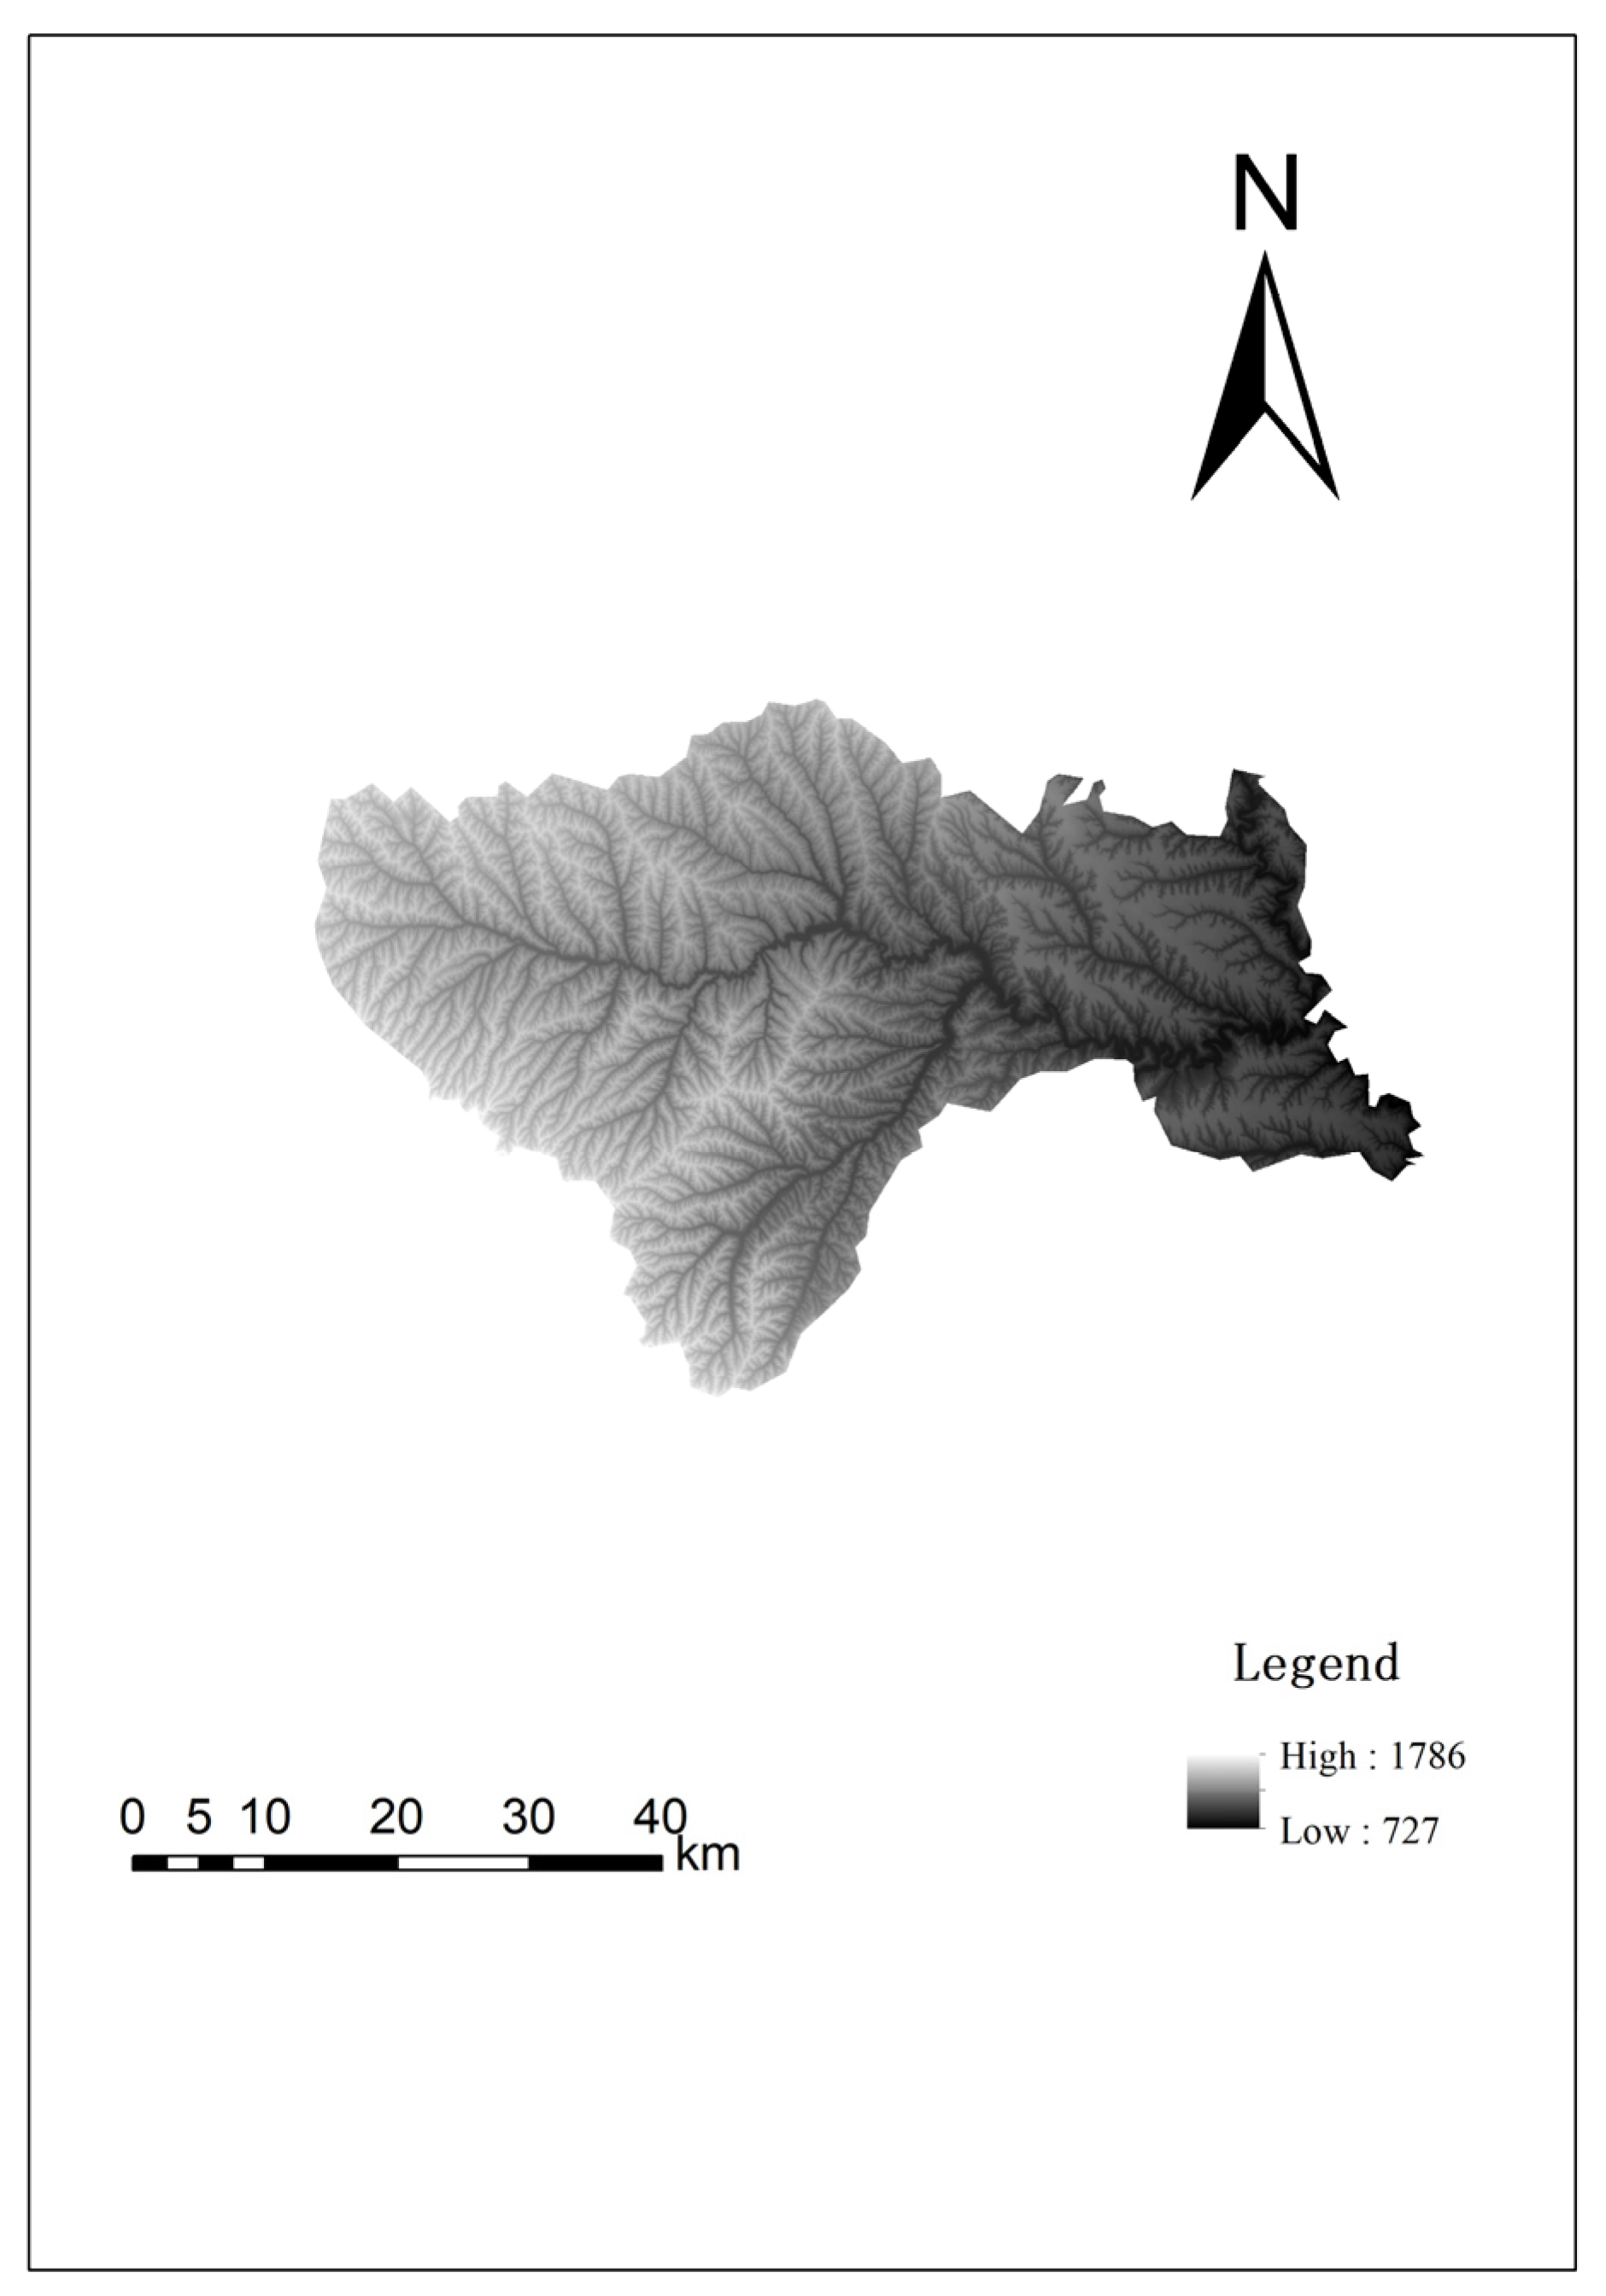
Figure 3.
Tourist attraction distribution map.
3.1.3. Current Status of Transportation Infrastructure
The existing ground transportation network in Huangling County mainly consists of the G65 Baotou-Maoming Expressway, G210 National Highway, and several provincial and county roads. Table 1 presents the actual road shortest distance matrix between major tourist nodes, indicating that the distances between scenic spots are long and travel times are relatively long, which significantly impacts visitor travel efficiency and the overall tourism experience. The poor connectivity of ground transportation and the lack of efficient point-to-point accessibility have become key bottlenecks constraining the transformation and upgrading of Huangling County’s tourism industry. Therefore, there is a pressing need to introduce low-altitude transportation to achieve efficient connectivity and rapid access between scenic spots, thereby enhancing visitor convenience and regional tourism competitiveness.
Table 1.
Actual road shortest distance between scenic spots (km).
3.1.4. Airspace and Meteorological Conditions
The low-altitude airspace (below 300 m above ground level) in Huangling is currently used primarily for general aviation activities, including agricultural spraying and aerial photography. There are no military airspace zones or civil airports within the county. The nearest controlled airspace is the Yan’an Nanniwan Airport, approximately 80 km to the north. The airspace below 300 m within the county is classified as Class G (uncontrolled airspace), providing favorable conditions for low-altitude flight operations.
Meteorologically, Huangling has a warm temperate continental monsoon climate, with an annual average temperature of 9.4 °C, an annual precipitation of 600 mm, and an annual wind speed of 2.3 m/s. In winter, the prevailing wind direction is northwest, while in summer, it is southeast. The annual number of foggy days is fewer than 15, and days with visibility exceeding 10 km exceed 300 per year. These meteorological conditions are generally suitable for safe low-altitude flight operations for most of the year. However, particular attention should be given to the period from July to September, when convective weather, including thunderstorms, is more frequent.
3.2. Data Collection
First, the evaluation factors are determined. The evaluation index system in this paper involves three categories—topography, ecology, and socio-economic as well as facility accessibility—comprising a total of 14 factors. To ensure spatial comparability of multi-source data, all raster and vector data are uniformly projected to WGS-1984 UTM Zone 49N, and raster data are resampled to a 30 m resolution, producing evaluation factor layers with a consistent spatial reference.
For topographic factors, elevation data are derived from the Copernicus Digital Elevation Model (GLO-30) dataset in 2025. Based on this DEM, surface analysis is performed in ArcGIS 10.8: slope and aspect are extracted in degrees; surface roughness is calculated as the reciprocal of the cosine of slope; and topographic relief is determined as the difference between the maximum and minimum elevation within a neighborhood statistical window.
For ecological factors, land use data are obtained from the dataset published on Zenodo in 2026 by Shuping Xiong et al. [34] from Peking University; vegetation coverage uses monthly vegetation coverage raster data at a 250 m resolution for China from the National Tibetan Plateau/Third Pole Environment Data Center.
For socio-economic and facility accessibility factors, population density is derived from the WorldPop 100 m population raster data for China (UN-adjusted constrained version), converting pixel population count to population density (persons/km2) by dividing by the corresponding pixel area. Data on tourism supporting service facilities, transportation hubs, schools, hospitals, etc., are collected through the Amap Open Platform POI search API by category code in paginated mode, after attribute cleaning, removal of closed points, and deduplication, the GCJ-02 encrypted coordinates were corrected to the WGS-1984 coordinate system; distances to transportation hubs, attractions, schools, and hospitals are generated as continuous distance rasters using the Euclidean distance method with the corresponding POI points as sources. The distance to residential areas is calculated using the centroids of CLCD construction land patches as sources to avoid omission of remote natural villages by POIs. The list of cultural tourism landscape resources is obtained from official documents published by the Ministry of Culture and Tourism, the National Cultural Heritage Administration, and the Ministry of Housing and Urban-Rural Development, and after coordinate extraction and digitization, distance rasters are also generated using the Euclidean distance method.
To facilitate subsequent multi-criteria weighted overlay analysis, each factor undergoes uniform standardization: continuous factors (distance, density, elevation, slope, relief, roughness, vegetation coverage, population density) are normalized using the Min-Max method or classified into five levels using the natural breaks (Jenks) method, thereby constructing 14 evaluation factor layers with consistent spatial reference and unified dimensions for the study area. The characteristics of the indicator data are shown in Table 2.
Table 2.
Evaluation indicators for the suitability of takeoff and landing points.
In the takeoff and landing route analysis, factors with relatively low relevance to route planning, such as cultural tourism landscape resources, transportation infrastructure, distance to transportation hubs, and tourism supporting service facilities, are removed.
4. Method
Unlike the conventional aviation operations, the low-altitude tourism flights in this study operate below 1000 m Above Ground Level (AGL) in continuous interaction with terrain, land use, and human settlements. At this altitude band, the dominant constraints on route location—population exposure, noise and visual disturbance, heritage and ecological protection, and emergency landing feasibility—are imposed by the ground environment rather than by aeronautical parameters. Ground-based suitability factors therefore constitute the first-order screening criterion for low-altitude facility siting and corridor alignment, which justifies the surface-based framework adopted in this study. This study adopts a Geographic Information System (GIS)-based (Arcgis 10.8) suitability analysis approach to identify takeoff and landing points and flight routes, primarily for the following reasons:
First, spatial constraint screening is a prerequisite for any subsequent analyses. The core issue in planning low-altitude tourism takeoff and landing points in Huangling is not “where the demand is greatest” or “how to achieve optimal efficiency,” but rather “where takeoff and landing points can be safely and legally constructed.” GIS-based spatial suitability analysis can classify spatial constraints, such as terrain slope, vegetation cover, ecological redlines, cultural relic protection zones, and noise-sensitive areas, into prohibited, restricted, and suitable layers, thereby directly answering the question of “whether construction is feasible.” In contrast, demand clustering methods require “existing feasible sites,” and multi-objective optimization also requires “candidate site sets” as input. Neither can replace the spatial constraint screening function of GIS.
Second, the complex terrain and sensitive ecological and cultural relics inherent to Huangling necessitate the prioritization of spatial constraints. Huangling is located in the hilly and gully region of the Loess Plateau, characterized by significant topographic relief, geological disaster risks, and numerous national and provincial key cultural relic protection units, such as the Mausoleum of the Yellow Emperor, the Thousand-Buddha Grotto Temple, and the Wan’an Meditation Temple, as well as ecologically sensitive areas in the Yellow River Basin. The GIS method can effectively integrate constraints such as terrain, which are spatial constraints that the other two methods find difficult to quantify. At the same time, the data required by the GIS method, such as remote sensing imagery, digital elevation models (DEM), and land use classification data, are relatively accessible at the county level, whereas the mobile signaling data and travel OD data required for demand clustering are often unavailable for tourism-oriented counties in central and western China, such as Huangling.
Third, the experience-oriented nature and spatial dispersion of tourism scenarios require site selection to consider multi-dimensional spatial factors. The core value of low-altitude tourism lies in aerial sightseeing and rapid connections between scenic spots. The siting of takeoff and landing points needs to consider experience-related attributes such as landscape distribution, noise control, and distance to core scenic areas. GIS-based suitability analysis can incorporate these factors into a unified evaluation framework through a multi-criteria weighted evaluation model, generating a suitability classification map oriented toward the tourism experience. Through spatial overlay and buffer analysis, potential locations for takeoff and landing points that connect various scenic spots while balancing safety and experience can be identified.
4.1. Suitability Analysis
4.1.1. Construction of Evaluation Index System and Determination of Weights
The site suitability of low-altitude takeoff and landing points [36] is influenced by multiple factors. An evaluation index system is first constructed. Subsequently, this study adopts the entropy weight method for weighting. The entropy weight method [37] is an objective weighting approach that determines indicator weights based on the information entropy of the original data of each evaluation indicator. It can effectively avoid the human bias introduced by subjective weighting methods such as the Analytic Hierarchy Process (AHP) and the Delphi method. Information entropy reflects the degree of dispersion of indicator data: the smaller the entropy value of an indicator, the higher the degree of data dispersion, the more effective information it contains, and thus the greater the corresponding weight. Conversely, the larger the entropy value, the less effective information it contains, and the smaller the weight. The calculation steps of the entropy weight method are as follows:
- (1)
- Construct the original evaluation matrix
Assuming there are evaluation objects and evaluation indicators, an original evaluation matrix is constructed. Let be the original value of the indicator for the i-th evaluation object, where ; .
- (2)
- Standardization of indicators
There are significant differences in the dimensions and magnitudes of the evaluation indicators. To address this, positive indicators and negative indicators are distinguished, and the extreme value standardization method is used to eliminate dimensional interference.
Positive indicators (the larger the indicator value, the better the evaluation result):
Negative indicators (the smaller the indicator value, the better the evaluation result):
In the formula: is the standardized indicator value; are the maximum and minimum values of the original sequence of the indicator, respectively.
After standardization, some values may equal zero, which would render subsequent logarithmic calculations meaningless. Therefore, a very small value is generally introduced for translation correction:
Usually, is taken to obtain the standardized matrix .
- (3)
- Calculate the indicator proportion matrix
Calculate the proportion of the sample under the indicator relative to the total sum of that indicator:
- (4)
- Calculate the information entropy ej of each indicator
It is stipulated that when = 0, . The information entropy ranges from .
- (5)
- Calculate the information utility value (coefficient of variation)
The information utility value reflects the distinguishing ability of an indicator. The larger the , the stronger the distinguishing role of that indicator in the comprehensive evaluation.
- (6)
- Calculate the entropy weight of each indicator
The weights satisfy the normalization condition: .
- (7)
- Calculate the comprehensive score of each sample
The standardized indicator values are weighted and summed with the entropy weights to obtain the comprehensive score of the evaluation object:
The evaluation objects are ranked according to their comprehensive scores.
4.1.2. Suitability Zoning Results
Using the above model, raster calculation and reclassification were performed in ArcGIS 10.8 to generate a spatial distribution map of site suitability for low-altitude takeoff and landing points in Huangling. The high-suitability and medium-suitability zones were extracted and, in combination with tourism hotspot analysis, were used to preliminarily identify candidate takeoff and landing point locations as input nodes for the subsequent MCR model analysis.
4.1.3. Points Screening Procedure
The transformation from the composite suitability surface to discrete candidate points followed five sequential rules.
- (1)
- Exclusion of prohibited zones. Prior to point identification, a Boolean exclusion mask was applied. Cells intersecting the following areas were removed from the candidate pool irrespective of their suitability score: the protection and construction-control zones of cultural relic protection units (including the Mausoleum of the Yellow Emperor, the Thousand Buddha Temple Grottoes and the Wan’an Zen Temple) plus a 500 m buffer; ecological redlines; permanent prime farmland; first-grade drinking-water source reserves; military control zones; and government and scientific research facilities.
- (2)
- Suitability threshold. The composite suitability surface was classified into five levels (I–V) using the natural breaks (Jenks) method, where class V represents the highest suitability. Only grid cells classified as class V, and where necessary, class IV cells adjacent to core scenic spots were retained as candidate cells.
- (3)
- Upgrade of class-IV cells adjacent to core scenic spots. Class-IV patches were admitted only where the retained class-V patches failed to provide service coverage for a core scenic spot—specifically, where no class-V patch lay within D_scenic of that spot. Such class-IV patches had to satisfy rules (1) and (2), and the resulting points were designated as secondary/feeder nodes, distinguished from the primary nodes derived from class-V patches.
- (4)
- Minimum inter-point spacing. Where the distance between two selected points was below 500 m, only the higher-scoring point was retained, so as to avoid redundant coverage by closely spaced facilities.
4.2. Minimum Cumulative Resistance Model (MCR)
4.2.1. Model Principle
The Minimum Cumulative Resistance (MCR) model [34] originated from the study of species dispersal and landscape connectivity in landscape ecology and has since been widely applied in fields such as transportation network planning and ecological corridor construction. The MCR model has given rise to a basic “source identification–resistance surface construction–corridor extraction” paradigm, which has been extensively used in ecological security pattern development, biodiversity corridor site selection, and green infrastructure network planning [38,39]. The core idea of this model is: starting from a “source” point, the total resistance overcome when passing through different landscape units to reach a target point represents the “cost” or “expense” of that path. Its mathematical expression is:
where MCR is the minimum cumulative resistance value; represents the function of the minimum cumulative resistance among all paths between a given landscape unit and the source point; represents the spatial distance from source point j to landscape unit i; and represents the resistance coefficient of landscape unit i. This value was determined with reference to the weight calculation method described in Section 4.1.1. In this study, low-altitude aircraft are regarded as the “dispersal subject,” takeoff and landing points are regarded as “source points,” and different geographical environment units are regarded as “landscape units.” An MCR model suitable for low-altitude route planning is constructed to identify the recommended low-altitude routes connecting each takeoff and landing point. This method includes an objective function that minimizes the total cumulative cost of the path, as well as spatial and topological constraints, cost accumulation and distance constraints, among others.
4.2.2. Construction of the Resistance Factor System
The flight resistance of low-altitude aircraft differs from that of ground transportation and is mainly influenced by factors such as terrain conditions, population density, and landscape attractiveness. The weight of each resistance factor is determined using the entropy weight method, as detailed in Section 4.1.2. A comprehensive value is calculated for each raster cell through weighted summation, generating a low-altitude flight resistance surface for Huangling County, which serves as the basis for the subsequent least-cost path analysis.
4.2.3. Preliminary Spatial Corridors Identification
Using the candidate takeoff and landing points identified in the suitability analysis as source and target points, we employ the Cost Path tool in ArcGIS to calculate the minimum cumulative resistance path between any two points based on the comprehensive resistance surface. This path represents the theoretically recommended low-altitude route. The specific calculation process is as follows:
- (1)
- Use the Cost Distance tool to calculate the minimum cumulative resistance value from each raster cell to a given source point.
- (2)
- Use the Cost Back Link tool to record the recommended path direction from each raster cell to the source point.
- (3)
- Use the Cost Path tool, based on the cost distance and back link results, to extract the least-cost path from the source point to the target point.
- (4)
- Repeat the above steps for all pairs of takeoff and landing points to generate a candidate set of preliminary spatial corridors.
5. Results
5.1. Determination of Indicator Weights for Takeoff and Landing Points
We used suitability analysis and the minimum cumulative resistance model to identify low-altitude tourism takeoff and landing points and routes in Huangling. The suitability analysis first constructed a multi-criteria evaluation framework with fourteen key factors, including slope gradient, slope aspect, land use type, distance to residential areas, distance to scenic spots, and elevation. The entropy weight method was then employed to determine the weight of each factor. The calculated weight of each indicator is shown in Table 3.
Table 3.
Weights of suitability evaluation indicators for low-altitude tourism takeoff and landing points.
The results show that safety-sensitive zone-related indicators (distance to residential area: 10.40%, distance to school: 15.26%, distance to hospital: 15.31%) have a combined weight of 40.97%, the highest among all factor categories. Residential areas, schools, and hospitals are highly sensitive to the noise and safety hazards of low-altitude flights. The closer the distance to these areas, the stricter the operational restrictions (e.g., noise complaints from residents, safety risks to students, and interference with medical emergency helicopter routes). Therefore, in the planning of low-altitude takeoff and landing points, it is necessary to protect residents’ living environment, campus safety, and the normal operation of medical institutions.
Terrain-related indicators (relief amplitude: 8.32%, slope gradient: 8.51%, slope aspect: 0.81%, roughness: 8.09%, elevation: 9.18%) have a combined weight of 34.91%, accounting for the second-largest proportion. Huangling is located in the Loess Plateau hilly-gully region, with fragmented terrain, crisscrossing gullies, and significant topographic relief. Relief amplitude and slope gradient directly determine site flatness and engineering modification difficulty (e.g., slopes steeper than 5° require large-scale earthwork). Slope aspect and roughness affect flight clearance and takeoff/landing safety (e.g., rough terrain with dense vegetation increases turbulence risks).
Tourism function-related indicators (cultural tourism landscape resources distance: 3.78%, tourism supporting service facilities: 3.86%, distance to transportation hub: 6.82%) have a combined weight of 14.46%. Takeoff and landing points should be close to core scenic areas (e.g., Mausoleum of Huangdi, Huangling National Forest Park) to shorten the transfer time and enhance the tourism experience. Proximity to tourism service facilities reduces ground transfer costs, while closeness to transportation hubs (e.g., Huangling South Railway Station) enables “air–ground intermodal transport” to expand the passenger source range (e.g., Xi’an tourists reaching scenic areas via high—speed rail + short-haul flights).
5.2. Spatial Distribution of Takeoff and Landing Point Suitability
Based on the weights and GIS spatial overlay analysis described in Section 4, a comprehensive suitability distribution map of low-altitude tourism takeoff and landing points in Huangling was generated (Figure 4). Using the natural breaks method, the suitability was classified into five levels. Here, “V” represents the highest suitability.
Figure 4.
Suitability of takeoff and landing points.
From a spatial distribution perspective, the high-suitability areas for low-altitude tourism takeoff and landing points in Huangling (green areas in the figure, including dark green and light green) are concentrated in the western and southwestern parts of the county. In contrast, the middle parts of the county are the most unsuitable areas, with relatively low suitability scores. These areas cover the core built-up urban areas of Huangling, characterized by high population density, complex airspace environments (dense high-rise buildings and obstacles), and a concentration of noise-sensitive targets (interwoven distribution of schools, hospitals, and residential areas). The safety risks, noise complaints, and social management costs associated with takeoff and landing operations in these areas are significantly higher than in other regions, leading the model to classify them as low suitability.
Unlike the traditional airport site selection logic of “being close to population centers and relying on the urban economy,” the suitability distribution of low-altitude takeoff and landing points in Huangling exhibits a characteristic of “moving away from urban areas and clustering toward ecological fringe zones.” This result confirms that the suitability evaluation model places a strong emphasis on constraining factors such as safety control, land use conflict, and environmental sensitivity-high population density, high development intensity, and complex airspace environments in urban centers are assigned negative weights, while the low-interference, low-conflict characteristics of the western ecological fringe zones receive positive evaluations.
5.3. Screening of Takeoff and Landing Points
Taking into account the spatial distribution of these attractions, their visitor flow volumes, and the suitability of the areas in which they are located, the optimal takeoff and landing points were determined from among the six candidates. They are the Mausoleum of the Yellow Emperor, Huangling National Forest Park, Wan’an Chan Temple, and Suoluowan Gorge Stockade Scenic Area. The grid cells where the six candidate takeoff and landing points are located were screened out, as shown in Figure 5.
Figure 5.
Layout of candidate takeoff and landing points for low-altitude tourism in Huangling.
Based on the screening results of low-altitude tourism takeoff and landing points in Huangling and the spatial distribution pattern of county-level scenic spots, the results show that scenic spots are concentrated in the eastern part with a corresponding concentration of takeoff and landing points, while the western part has sparse scenic spots and a lack of takeoff and landing points. In terms of overall layout, this study balances both tourism service accessibility and ecological protection requirements. Specifically, two takeoff and landing points screened in the eastern green high-suitability area are adjacent to core scenic spots such as the Mausoleum of the Yellow Emperor and the Chinese Ancestor Hall, making them suitable as major tourism transfer nodes responsible for passenger flow connection, scenic area material distribution, and emergency rescue missions. Among these, considering the surge in visitor numbers during the annual ancestor worship activities at the Mausoleum of the Yellow Emperor, two takeoff and landing points are proposed in this area to address the passenger flow diversion pressure and emergency support needs during the peak worship period, ensuring low-altitude transportation efficiency and safety redundancy under high passenger flow conditions.
Three takeoff and landing points screened in the central area are distributed around scenic spots such as Huangling National Forest Park, Suoluowan Ancient Village, Wan’an Chan Temple, and the Huangling Lavender Garden. These can serve as flexible supplementary nodes for ecotourism, agricultural-tourism integration, and peak-season passenger flow diversion. The takeoff and landing points in this area adopt a modular design, allowing flexible adjustment of transport capacity according to tourism peak and off-peak seasons. During peak periods such as the National Day and Qingming Festival, temporary equipment additions can enhance reception capacity, alleviating ground traffic pressure on core scenic areas. One takeoff and landing point screened in the southwestern area is adjacent to a revolutionary site, making it suitable as a dedicated node for tourism sightseeing branch routes and historical and cultural heritage monitoring.
In the future, dynamic optimization of takeoff and landing point capacity configuration should be carried out based on scenic area passenger flow data. A flexible scheduling mechanism should be established in response to seasonal passenger flow peaks such as ancestor worship activities. Meanwhile, the coordination between airspace management and scenic area operations should be strengthened to build a new low-altitude tourism format for the “Aerial Tour of Huangling,” achieving a multi-objective win–win situation, encompassing cultural heritage protection, ecotourism development, and low-altitude transportation services.
5.4. Integration of the Proposed Vertiports
To ensure that the six selected tourism nodes can be served in a multimodal manner rather than as isolated aerial points, we evaluated the ground-access condition of each proposed takeoff and landing point with respect to five system components: (i) the road network, (ii) public and tourist transit services, (iii) parking and park-and-ride facilities, (iv) external transport hubs, and (v) first/last-mile feeder solutions. Table 4 presents the resulting integration matrix, and Figure 6 shows the six nodes on the road and transit network derived from GIS network analysis.
Table 4.
Relationship between takeoff and landing points and the ground transportation collection and distribution system.
Figure 6.
Spatial distribution map of takeoff and landing points and ground transportation collection and distribution system.
First, the two nodes at the Mausoleum of the Yellow Emperor exhibit strong multimodal connectivity, being within 200 m of National Highway G210 and within 10 km of the Huangling high-speed railway station. Their proximity to major bus stops (146 m and 3071 m, respectively) and nearby parking facilities enables efficient “high-speed rail + shuttle + low-altitude flight” intermodal transfers, making them suitable as gateway nodes for external tourists.
Second, nodes such as the Shangzhenzi Revolutionary Sites, Huangling Lavender Garden, and Wan’an Chan Temple are located far from public transit stops (11.5–26.1 km) and railway stations (30–52 km), relying primarily on on-site shuttles, electric carts, or demand-responsive transport (DRT) for last-mile connectivity. In particular, the Shangzhenzi node—the westernmost point—has no fixed public transit coverage and is reachable only by a long road detour along county road X318. This confirms that low-altitude services in these areas function as a gap-filling extension of the ground network rather than a substitute, which is precisely the functional rationale for including these nodes in the proposed route network.
Based on these findings, a two-level feeder strategy is recommended: (1) gateway-level transfer at the railway stations and county hub for the two Mausoleum of the Yellow Emperor nodes, and (2) node-level feeder within the scenic cluster, with demand-responsive shuttles reserved for low-frequency, remote nodes. This integrated air–ground approach ensures that the proposed low-altitude network is not isolated but serves as a complementary layer within the county’s multimodal transportation system.
5.5. Route Suitability Analysis
The entropy weight method was used to calculate the indicator weights, as shown in Table 5. The route suitability was calculated using the selected indicators, as shown in Figure 7, and ArcGIS’s Feature to Raster tool was used for route planning.
Table 5.
Weights of suitability evaluation indicators for low-altitude tourism routes.
Figure 7.
Suitability of low-altitude tourism routes.
The cost distance from one takeoff–landing point (origin O) to each of the other takeoff–landing points (Di) is calculated separately, yielding a cost distance raster and a back-link raster for every destination. The cost distance raster acts as a “path-finding” tool: with suitability (or, equivalently, the reciprocal of cost) used as the friction measure, it determines where the most suitable path from O to Di lies. The back-link raster then serves as the interface for “extracting path cells”: by tracing backward from Di to O, the cost field stored in the raster is converted into a concrete route, thereby identifying the cells and areas that each candidate route traverses. Based on these extracted routes, the Route Suitability Index (RSI) is defined as the weighted sum of the values of the element (factor) layers over the areas traversed by each candidate route. A higher RSI value indicates a more suitable route, and the route with the maximum RSI is selected as the final route. In this way, the cost distance value between O and each Di provides the basic input for deriving the candidate routes, while the RSI, computed on the traversed areas, quantifies the relative merit of each potential route.
5.6. Route Network Planning
Based on the comprehensive suitability analysis of takeoff and landing points and routes, a low-altitude tourism route network structure for Huangling County was constructed, as shown in Figure 8. The route distances between nodes are shown in Table 6.
Figure 8.
Low-altitude route planning map.
Table 6.
Low-altitude tourism route lengths (km).
As shown in Figure 8, the planned low-altitude tourism network in Huangling County consists of six takeoff/landing points connected by fifteen route segments, forming a fully connected topology in which every pair of points is served by a direct least-cost corridor. Structurally, the network attains an average degree of 5.00, a density of 1.000, a cyclomatic number of 10, and a redundancy coefficient of 3.00; its diameter and average path length both contract to 1 hop, while the global network efficiency (1.000), the average clustering coefficient (1.000), and the algebraic connectivity (6.000, the theoretical maximum for a six-node graph) all reach their upper bounds, indicating maximum topological compactness and the absence of any structural bottleneck. Assuming independent segment operation with a reliability of p = 0.95 and perfectly reliable nodes, the all-terminal reliability reaches 0.99, and the two-terminal reliability is identical at 0.99 for all fifteen OD pairs, since each pair is served by one direct corridor plus four single-intermediate alternatives; the sensitivity test shows that the all-terminal reliability remains as high as 0.99 at p = 0.90 and approaches 1.00 at p = 0.99, confirming that end-to-end service quality is no longer governed by any single segment. With respect to safety, the network exhibits full redundancy: node connectivity and edge connectivity both equal 5, there are no cut vertices and no bridges, all six points share an identical degree centrality of 1.00 and a betweenness centrality of zero, and the network passes 100% of both node-level and segment-level checks, tolerating the simultaneous failure of any four points or any four segments without disconnection; even under the worst single-segment failure, the largest connected component still covers 100% of the points, and global efficiency is retained at 96.7%. These results indicate that the all-pairs MCR corridor set provides a highly robust topological skeleton for low-altitude tourism operations, and that the remaining planning task therefore shifts from supplementing redundancy to selecting and phasing a cost-efficient subset of the fifteen corridors without degrading the required connectivity and safety margins.
The network morphology directly reflects its functional service zoning, as specifically manifested in the following aspects: In the eastern area, as a World Cultural Heritage site, the Mausoleum of the Yellow Emperor needs to support scenarios such as the rapid assembly and dispersal of large tour groups and cultural-themed flight experiences (e.g., “Aerial Ancestral Worship”). In the central area, medium-density “main line + branch line” routes serve eco-tourism. Huangling National Forest Park focuses on nature sightseeing and hiking study tours, with relatively stable tourist flow, but it needs to cover dispersed attractions (such as Suoluowan Ancient Village). Therefore, the route design adopts a “main line (Forest Park-Ancient Village) + short branch lines (connecting surrounding small attractions)” approach, striking a balance between efficiency and flexibility. In the western area, a single route extends to the revolutionary heritage site, reflecting a “special function orientation.” As linear cultural heritage, it needs to support low-frequency but high-value demands, such as archaeological monitoring and culturally dedicated routes. Therefore, this route is independently established to avoid conflicts with flights in the core area while reducing environmental interference to the sensitive area.
In summary, the low-altitude route network planning for Huangling proposes a hierarchical goal of core nodes covering cultural scenic areas, auxiliary nodes serving eco-tourism, and edge nodes supporting special functions. Future research should further introduce dynamic tourist flow data, climate adaptability indicators, and stakeholder opinions to establish an iterative optimization mechanism for route network planning, providing scientific support for Huangling to build a new low-altitude tourism format of the “Aerial Tour of Huangling.”
6. Discussion and Conclusions
This study takes Huangling County in Shaanxi Province as the research object and, focusing on the site selection of low-altitude tourism takeoff and landing points and route planning, constructs a comprehensive analysis framework based on “suitability evaluation-optimization of takeoff and landing points and route networks.” The research results show that social-related factors (including public service accessibility, residential environment protection, and land-use regulation, with a combined weight of approximately 40.97%) are the primary controlling factors affecting the suitability of takeoff and landing points, followed by terrain factors (elevation, relief amplitude, slope gradient, roughness, and slope aspect, with a combined weight of approximately 34.91%), cultural tourism resources and supporting service factors (7.64%), vegetation coverage (7.74%), distance to transportation hub (6.82%), and population density (0.35%). This weight structure reflects the comprehensive decision-making logic of “social constraints as the top priority and terrain safety as the core” in the site selection of low-altitude tourism takeoff and landing points in Huangling County. Previous studies have also demonstrated the scientific validity of using suitability analysis to determine takeoff and landing points [40]; however, they have mainly focused on conventional travel demand. This study further extends its application to county-level takeoff and landing point planning. Existing studies have employed multi-objective optimization methods [30]; however, these studies fail to adequately account for multiple constraints, such as topography, ecological sensitivity, and the spatial distribution of tourism resources, and are unable to identify the degree of suitability across different spatial scales. Compared with simple buffer analysis or single-factor overlay, the multi-criteria weighted framework integrates heterogeneous factors—such as topography, regulatory (social) control, and land use—into a unified decision surface, making the trade-offs among factors clearly discernible and avoiding arbitrary exclusions caused by a single threshold.
Based on the “suitability-scenic spot” constraints, this study screened out six candidate takeoff and landing points, achieving full low-altitude transportation coverage of the main scenic areas of Huangling County’s “one core (Mausoleum of the Yellow Emperor) and two wings (Forest Park and Wan’an Chan Temple).” Based on the Minimum Cumulative Resistance (MCR) model, this study completed the cost distance and cost path analysis between each takeoff and landing point, generating cost distance rasters and back-link rasters. The results show that low-resistance corridors (such as the Ju River) have become the main directions for cost distance extension, and the minimum cost paths between each takeoff and landing point provide a spatial framework and data foundation for subsequent route network optimization. The average straight-line distance between takeoff and landing points is approximately 12 km. With ground vehicles operating at 30–40 km/h, a 30-min trip covers 15–20 km. At an eVTOL speed of 130 km/h, the same distance can be covered in 7–9 min, reducing in-vehicle travel time between scenic areas from over 30 min to under 9 min. The in-vehicle travel time for the roads between the takeoff and landing points is shown in Table 7. The in-vehicle travel time for the routes was determined based on the route distances, as shown in Table 8. According to Table 7 and Table 8, we can find that low-altitude travel remains less time-consuming than road travel even when in-station processing time for boarding and alighting is taken into account. Reported processing times are approximately 5 min for combined boarding and deplaning [41] and 5–15 min for full in-station processing excluding access and egress [42]. This advantage is not uniform across the study area: it is most pronounced on OD pairs where the hilly and gully terrain of the Loess Plateau produces a high road detour ratio. More importantly, for low-altitude tourism, travel-time saving is not the whole of its value. Its core appeal lies in offering passengers an aerial viewing perspective and a travel experience that ground transport cannot provide, consistent with the “tourist-centered aerial experience” design orientation. The low-altitude routes in Huangling County are therefore not merely fast corridors, but composite products that combine gap-filling transport function with tourism experience value.
Table 7.
In-vehicle travel time for roads between takeoff and landing points (h).
Table 8.
In-vehicle travel time for low-altitude travelling between takeoff and landing points (h).
Compared with the straight-line connections or purely airspace-constrained delineation commonly adopted in existing low-altitude network research, the MCR (Minimum Cumulative Resistance) model transforms constraints of terrain, vegetation, and social interference into a continuous resistance surface. The resulting minimum cumulative cost path can naturally extend along low-resistance corridors such as the Ju River, while actively avoiding heritage core areas, ecologically sensitive zones, and residential clusters, demonstrating spatial adaptability that is difficult to achieve with geometric or regulatory methods. However, existing studies mostly plan routes based on obstacle avoidance and cost considerations [35]; incorporating social, topographic, and compound impacts can provide more comprehensive support for route planning.
This study not only provides a scientific basis for the development of low-altitude tourism in Huangling but also offers a methodological reference for the planning of low-altitude infrastructure at cultural heritage sites and ecological function areas on the Loess Plateau. In the future, it can be further extended to multi-county coordinated low-altitude tourism network planning, exploring pathways for regional collaborative development. However, the method still has certain limitations: the spatiotemporal dynamics of indicator weights are insufficient, failing to fully consider the impact of seasonal changes on suitability; the accuracy of the resistance surface in depicting local micro-terrain obstacles (such as high-voltage transmission towers and communication towers) is limited; and the quantification of social acceptance and policy constraints is inadequate, as residents’ perception differences regarding low-altitude flight noise and community participation willingness have not yet been incorporated into the evaluation system. The analysis of multimodal transportation connectivity is lacking. Additionally, this study acknowledges the lack of sensitivity testing as well as empirical or field validation, which may affect the robustness and generalizability of the results.
Future research can combine time-series data, high-resolution remote sensing imagery, and questionnaire surveys to further enhance the dynamic nature and precision of the model. Future research can be further expanded in the following directions: first, integrating multi-source data such as mobile signaling data and social media check-in data to track tourist spatiotemporal behavior in real time, optimizing the layout of takeoff and landing points and dynamic route scheduling; second, expanding the research scope from the county scale to Yan’an City and even Shaanxi Province, exploring the networked layout of cross-county low-altitude tourism routes to achieve the linkage development of regional tourism resources; third, conducting comprehensive benefit assessments of low-altitude tourism takeoff and landing points and route planning from multiple dimensions such as economic benefits, social benefits, and ecological benefits, providing a quantitative basis for policy formulation.
Author Contributions
Conceptualization, W.L.; Methodology, W.L.; Software, W.L. and Y.Z.; Validation, W.L. and Y.Z.; Investigation, W.L.; Data curation, W.L., Y.Z. and X.J.; Writing—original draft, W.L., Y.Z. and X.J.; Writing—review & editing, W.L., Y.Z. and X.J.; Supervision, W.L. and X.J. All authors have read and agreed to the published version of the manuscript.
Funding
The authors gratefully acknowledge financial support from the Philosophy and Social Science Research Project in Shaanxi [grant number 2026HZ1202].
Institutional Review Board Statement
Not applicable.
Informed Consent Statement
Not applicable.
Data Availability Statement
The original contributions presented in this study are included in the article. Further inquiries can be directed to the corresponding author.
Conflicts of Interest
The authors declare no conflict of interest.
References
- Xu, J.H.; Guan, C.X.; Wang, Y.P.; Zhuang, J.J.; Gan, W.B. A Systematic Review of Urban Air Mobility Development: eVTOL Drones’ Technological Challenges and Low-Altitude Policies of Shenzhen. Drones 2025, 9, 842. [Google Scholar] [CrossRef] [Scilit]
- Fan, Z.Y.; Pei, M.Y.; Chen, P.F.; Wei, Z.Y.; Zhong, L.S. Optimizing urban transport: An optimization framework for urban air mobility site selection and route operation under real-world travel demand. Transp. Res. Part E Logist. Transp. Rev. 2026, 209, 104758. [Google Scholar] [CrossRef] [Scilit]
- Huang, J.D.; Chen, Y.H.; Pan, W.Y. Evaluation and Development Path Optimization of Rural Low-Altitude Tourism Using a Triangular Fuzzy TOPSIS Approach. Sustainability 2026, 18, 5534. [Google Scholar] [CrossRef] [Scilit]
- Lee, Y.; Lee, J.; Lee, J.W. Holding Area Conceptual Design and Validation for Various Urban Air Mobility (UAM) Operations: A Case Study in Seoul-GyungIn Area. App Sci. 2021, 11, 10707. [Google Scholar] [CrossRef] [Scilit]
- Qu, W.Q.; Huang, J.; Li, C.L.; Liao, X.H. A demand forecasting model for urban air mobility in Chengdu, China. Green Energy Intell. Transp. 2024, 3, 100173. [Google Scholar] [CrossRef] [Scilit]
- Brunelli, M.; Ditta, C.C.; Postorino, M.N. New infrastructures for Urban Air Mobility systems: A systematic review on vertiport location and capacity. J. Air Transp. Manag. 2023, 112, 102460. [Google Scholar] [CrossRef] [Scilit]
- Fadhil, D.N. A GIS-Based Analysis for Selecting Ground Infrastructure Locations for Urban Air Mobility. Master’s Thesis, Technical University of Munich, Munich, Germany, 2018; p. 31. [Google Scholar]
- Tang, H.L.; Zhang, Y.; Mohmoodian, V.; Charkhgard, H. Automated flight planning of high-density urban air mobility. Transp. Res. Part C Emerg. Technol. 2021, 131, 103324. [Google Scholar] [CrossRef] [Scilit]
- Kim, S.; Harris, C.; Justin, C.Y.; Mavris, D. Optimal Trajectory and En-Route Contingency Planning for Urban Air Mobility Considering Battery Energy Levels. In Proceedings of the AIAA Aviation Forum, Electr Network, Chicago, IL, USA, 27 June–1 July 2022. [Google Scholar]
- Jiang, Y.; Yang, L.; Wang, H.W.; Xue, Q.W.; Yuang, Y. Research review on the vertiport location and network planning of UAM. J. Traffic Transp. Eng. 2026, 1–28. [Google Scholar] [CrossRef]
- Gray, N.H.; Shin, S.; Yoon, S.; Park, Y.; Chai, H.; Lee, K.; Kim, H.J.; Jung, S.Y. Safety and Capacity Analysis Framework for Integrated UAM Operation in Airports. In Proceedings of the IEEE/AIAA 42nd Digital Avionics Systems Conference (DASC), Barcelona, Spain, 1–5 October 2023. [Google Scholar]
- Chen, W.T.; Tian, Y.Y.; Sun, S.G.; Liu, R.H. Safety Assessment for Full Flight between Beidou Radio Determination Satellite Service Airborne Equipment and 5G System. Electronics 2023, 12, 3350. [Google Scholar] [CrossRef] [Scilit]
- Jeong, J.; So, M.; Hwang, H.Y. Selection of Vertiports Using K-Means Algorithm and Noise Analyses for Urban Air Mobility (UAM) in the Seoul Metropolitan Area. Appl. Sci. 2021, 11, 5729. [Google Scholar] [CrossRef] [Scilit]
- Lee, S.; Cho, N. Optimal Location of Urban Air Mobility (UAM) Vertiport Using a Three-Stage Geospatial Analysis Framework. Future Transp. 2025, 5, 58. [Google Scholar] [CrossRef] [Scilit]
- Huang, J.Y.; Pervez, A.; Qu, X.D.; Zhang, T.R. Flying into the future: A systematic review and meta-analysis of urban air mobility acceptance and its determinants. Transp. Res. Part A Policy Pract. 2026, 213, 105198. [Google Scholar] [CrossRef] [Scilit]
- EASA. Study on the Societal Acceptance of Urban Air Mobility in Europe; European Union Aviation Safety Agency: Cologne, Germany, 2021. [Google Scholar]
- Mostofi, H.; Biehle, T.; Kellermann, R.; Dienel, H.L. Modelling public attitude towards air taxis in Germany. Transp. Res. Interdiscip. Perspect. 2024, 24, 101045. [Google Scholar] [CrossRef] [Scilit]
- Chan, E.T.H.; Li, T.E.; Schwanen, T. Societal acceptance of advanced aerial mobility in China’s Greater Bay Area among young- and middle-aged adults. Transp. Res. Part F Traffic Psychol. Behav. 2025, 110, 88–103. [Google Scholar] [CrossRef] [Scilit]
- Wang, H.; Han, E.J.; Jittithavorn, C. Taking Flight: How Low-Altitude Tourism Shapes Flight Anxiety. Int. J. Tour. Res. 2026, 28, e70410. [Google Scholar] [CrossRef] [Scilit]
- Song, H.Y.; Qiu, R.T.R.; Park, J. A review of research on tourism demand forecasting. Ann. Tour. Res. 2019, 75, 338–362. [Google Scholar] [CrossRef] [Scilit]
- Zhao, Y.; Feng, T. Strategic integration of vertiport planning in multimodal transportation for urban air mobility: A case study in Beijing, China. J. Clean. Prod. 2024, 467, 142988. [Google Scholar] [CrossRef] [Scilit]
- Lu, Y.N.; Zeng, W.L.; Wei, W.B.; Wu, W.W.; Jiang, H. Vertiport Location Selection and Optimization for Urban Air Mobility in Complex Urban Scenes. Aerospace 2025, 12, 709. [Google Scholar] [CrossRef] [Scilit]
- Rajendran, S.; Zack, J. Insights on strategic air taxi network infrastructure locations using an iterative constrained clustering approach. Transp. Res. Part E Logist. Transp. Rev. 2019, 128, 470–505. [Google Scholar] [CrossRef] [Scilit]
- Herniczek, M.T.K.; German, B.J. Scalable Combinatorial Vertiport Placement Method for an Urban Air Mobility Commuting Service. Transp. Res. Rec. 2024, 2678, 1624–1641. [Google Scholar] [CrossRef] [Scilit]
- Wu, Z.Q.; Zhang, Y. Integrated Network Design and Demand Forecast for On-Demand Urban Air Mobility. Engineering 2021, 7, 473–487. [Google Scholar] [CrossRef] [Scilit]
- Yu, Y.; Wang, M.Y.; Mesbahi, M.; Topcu, U. Vertiport Selection in Hybrid Air–Ground Transportation Networks via Mathematical Programs with Equilibrium Constraints. IEEE Trans. Control Netw. Syst. 2023, 10, 2108–2119. [Google Scholar] [CrossRef] [Scilit]
- Rath, S.; Chow, J.Y.J. Air taxi skyport location problem with single-allocation choice-constrained elastic demand for airport access. J. Air Transp. Manag. 2022, 105, 102294. [Google Scholar] [CrossRef] [Scilit]
- Zhang, H.G.; Huo, J.B.; Chen, C.R.; Liu, Z.Y. A composite transportation network design problem with land-air coordinated operations. Transp. Res. Part C Emerg. Technol. 2025, 171, 104967. [Google Scholar] [CrossRef] [Scilit]
- Wang, Z.Y.; Lv, D.; Jia, S.; Wang, K.; Qu, X.B. Urban air mobility network design and operations strategy in an urban agglomeration. Transp. Res. Part E Logist. Transp. Rev. 2025, 203, 104316. [Google Scholar] [CrossRef] [Scilit]
- Wu, H.; Zame, S.I.; Guo, T.; Lu, Q.L.; Antoniou, C. A sustainable multi-objective framework for multi-phased, capacitated vertiport siting with land use integration. Commun. Transp. Res. 2025, 5, 100186. [Google Scholar] [CrossRef] [Scilit]
- Fu, M.Y.; Straubinger, A.; Schaumeier, J. Scenario-based Demand Assessment of Urban Air Mobility in the Greater Munich Area. In Proceedings of the AIAA Aviation Forum, Electr Network, Virtual, 15–19 June 2020. [Google Scholar]
- Yedavalli, P.; Kumar, K.; Waddell, P. Microsimulation analysis for network traffic assignment (MANTA) at metropolitan-scale for agile transportation planning. Transp. A Transp. Sci. 2022, 18, 1278–1299. [Google Scholar] [CrossRef] [Scilit]
- Yedavalli, P.; Onat, E.B.; Peng, X.; Sengupta, R.; Waddell, P.; Bulusu, V.; Xue, M. SimUAM: A Comprehensive Microsimulation Toolchain to Evaluate the Impact of Urban Air Mobility in Metropolitan Areas. In Proceedings of the AIAA Aviation Forum, Electr Network, Chicago, IL, USA, 27 June–1 July 2022. [Google Scholar]
- Xiong, S.P.; Zhang, X.Y.; Wang, H.Y.; Meng, Q.Y.; Du, S.H. 40-year (1984–2024) mapping of urban land use dynamics in China. Sci. Bull. 2026, 71, 1474–1485. [Google Scholar] [CrossRef] [Scilit]
- Zhang, H.H.; Tian, T.; Feng, O.G.; Wu, S.X.; Zhong, G. Research on Public Air Route Network Planning of Urban Low-Altitude Logistics Unmanned Aerial Vehicles. Sustainability 2023, 15, 12021. [Google Scholar] [CrossRef] [Scilit]
- Xia, J.S.; Dong, P.L.; Zhao, Z.F. Selecting Inter-city Transportation Routes in Complex Terrains Using Quantitative Tive Methods—A Case Study From Northern Yunnan, China. Promet-Traffic Transp. 2020, 32, 269–277. [Google Scholar] [CrossRef] [Scilit]
- Li, Z.; Luo, Z.J.; Wang, Y.; Fan, G.Y.; Zhang, J.M. Suitability evaluation system for the shallow geothermal energy implementation in region by Entropy Weight Method and TOPSIS method. Renew. Energ. 2022, 184, 564–576. [Google Scholar] [CrossRef] [Scilit]
- Cheng, Y.L.; Liu, H.X.; Yi, Y.J. Constructing ecological corridors in response to extensive rural sprawl in a highly developed urban agglomeration. Urban Ecosyst. 2024, 27, 335–347. [Google Scholar] [CrossRef] [Scilit]
- Li, H.M.; Qing, D.S.; Deng, Q.L.; Peng, J.X.; Zhou, R.M. Evolution and optimization of potential ecological corridors among forest patches in China’s Hunan Province from 2000 to 2019. Appl. Ecol. Environ. Res. 2025, 23, 2393–2410. [Google Scholar] [CrossRef] [Scilit]
- Liu, J.Y.; Zhu, G.R.; Yang, L.T.; Shen, Y.L. Suitability Assessment and Route Network Planning for Low-Altitude Transportation in Urban Agglomerations Using Multi-Source Data. Aerospace 2025, 12, 777. [Google Scholar] [CrossRef] [Scilit]
- Al Haddad, C.; Chaniotakis, E.; Straubinger, A.; Plötner, K.; Antoniou, C. Factors affecting the adoption and use of urban air mobility. Transp. Res. Part A Policy Pract. 2020, 132, 696–712. [Google Scholar] [CrossRef] [Scilit]
- Bulusu, V.; Onat, E.B.; Sengupta, R.; Yedavalli, P.; Macfarlane, J. A Traffic Demand Analysis Method for Urban Air Mobility. IEEE Trans. Intell. Transp. Syst. 2021, 22, 6039–6047. [Google Scholar] [CrossRef] [Scilit]
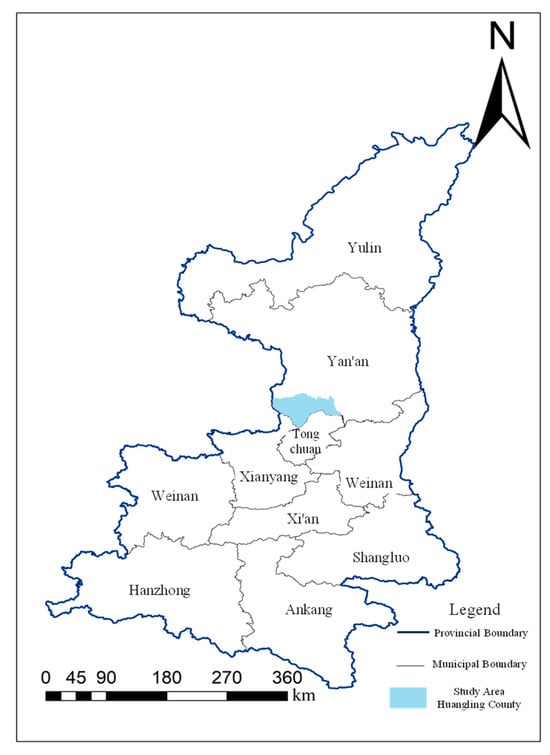
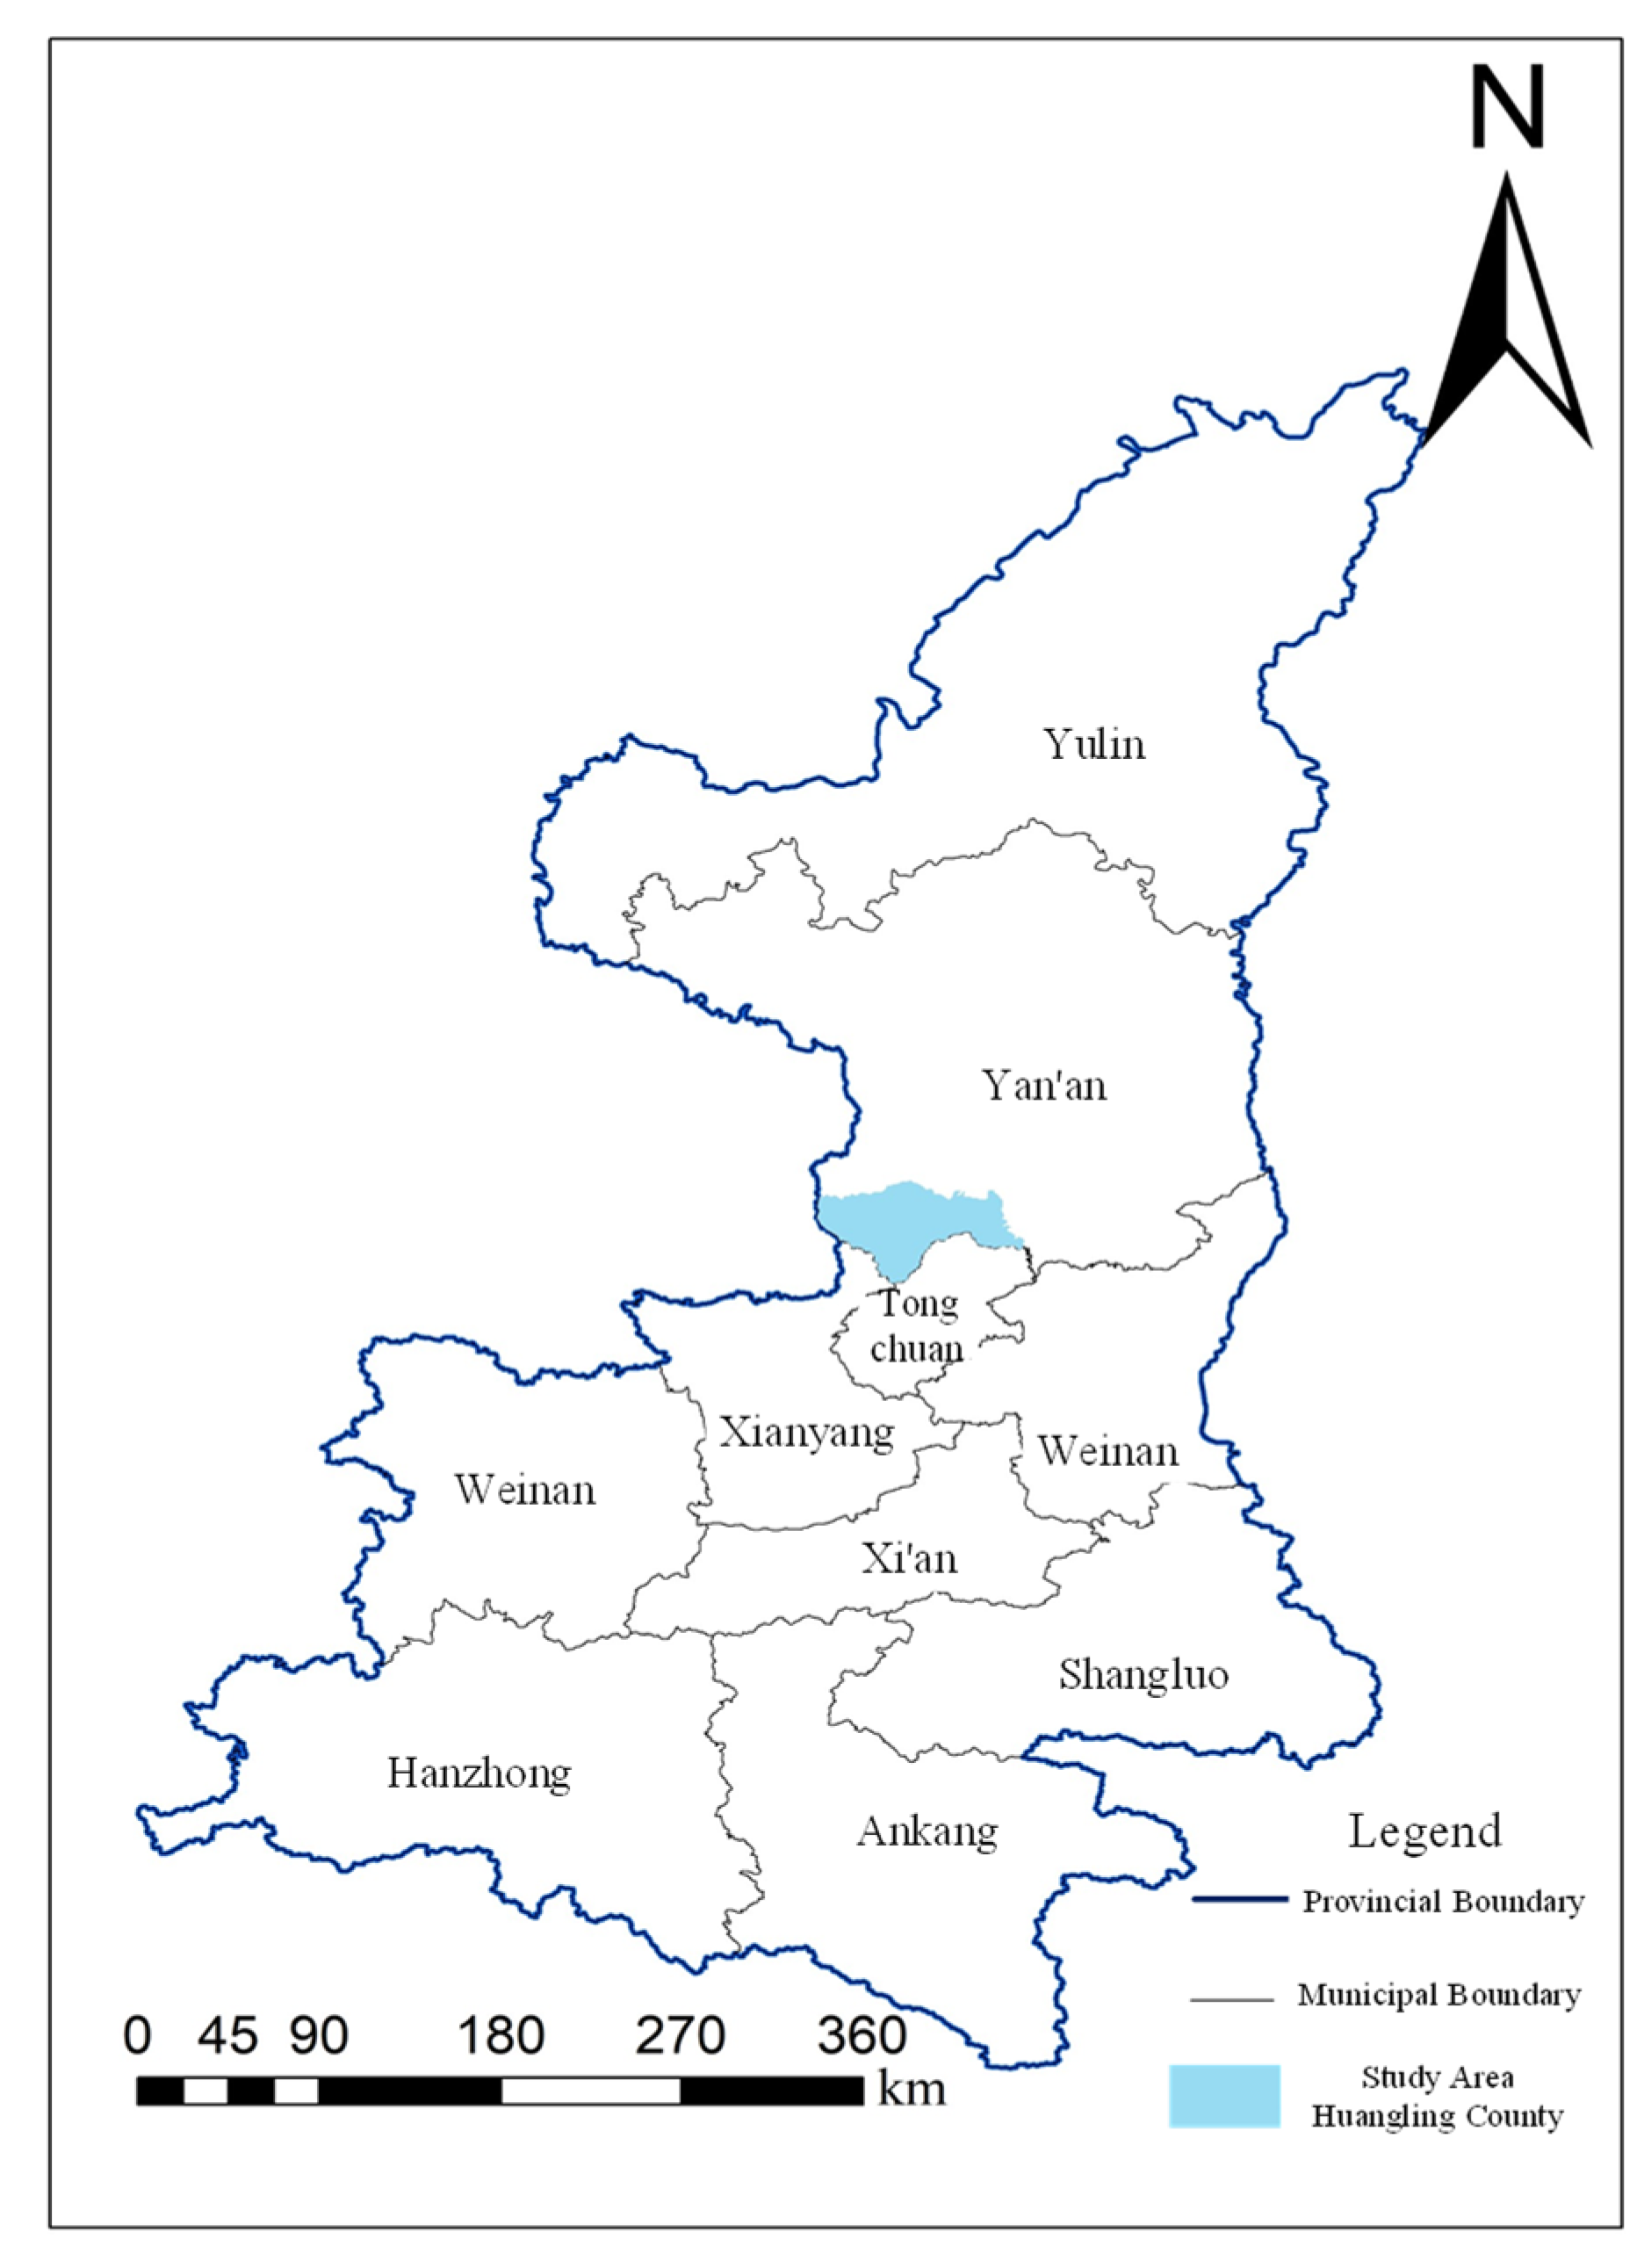
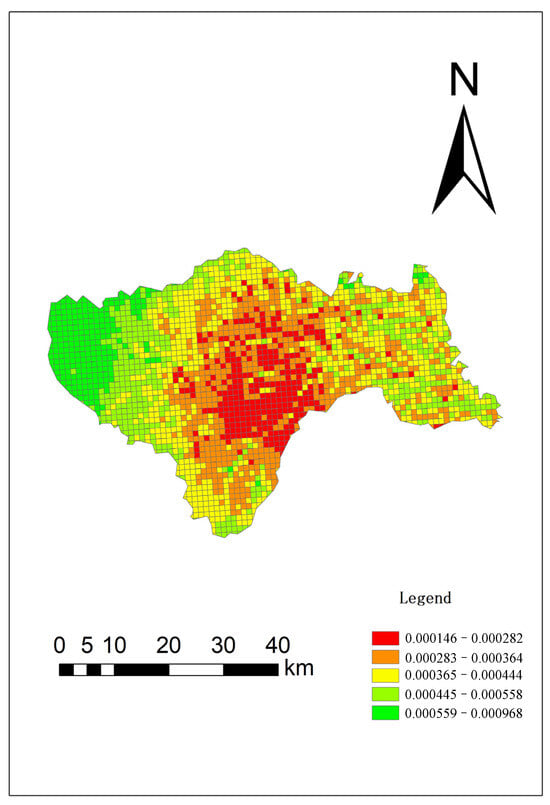
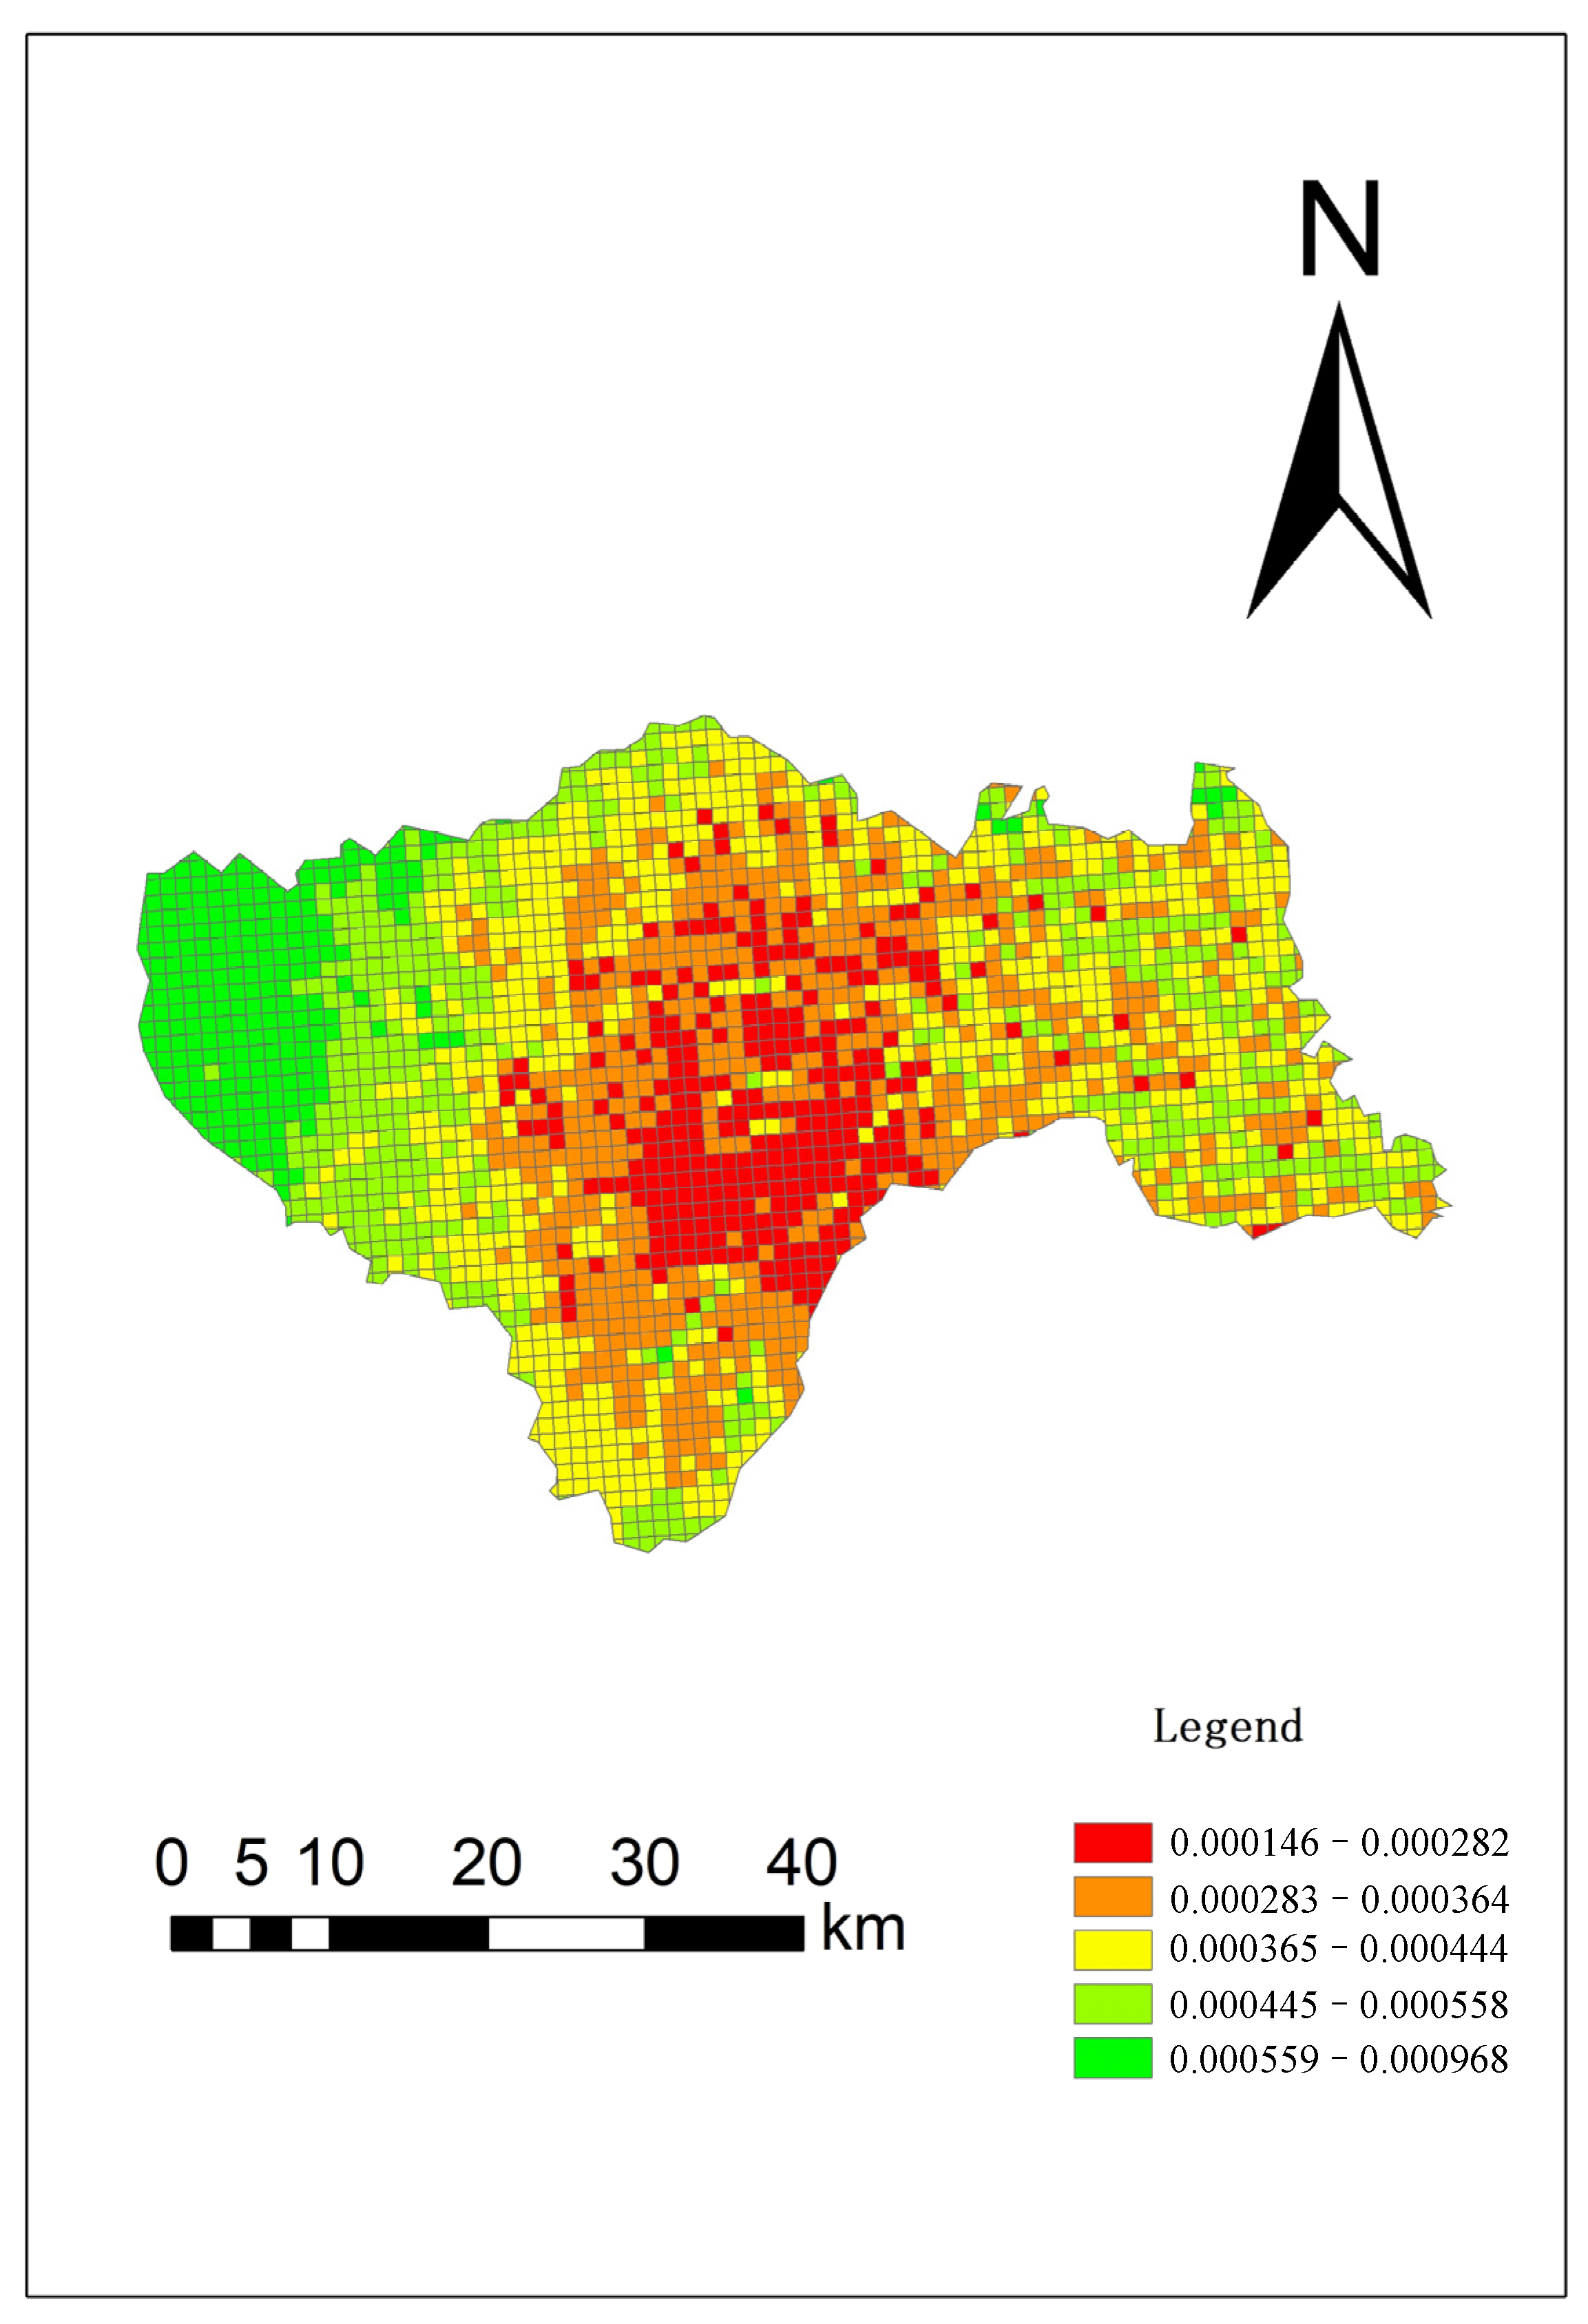
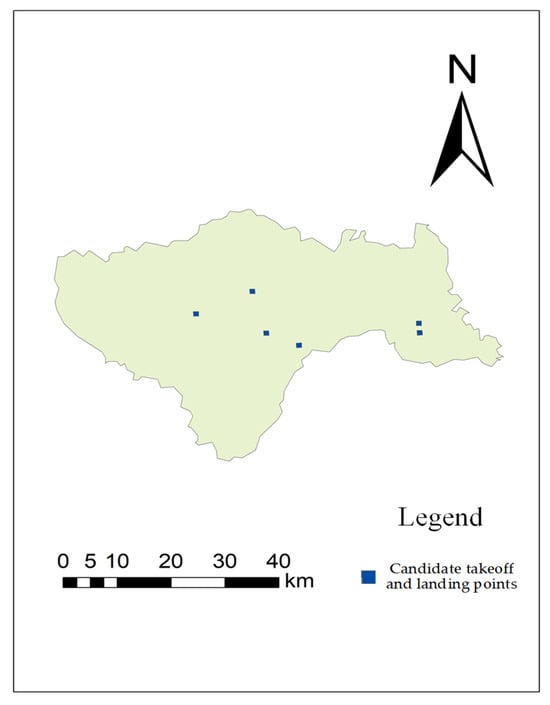
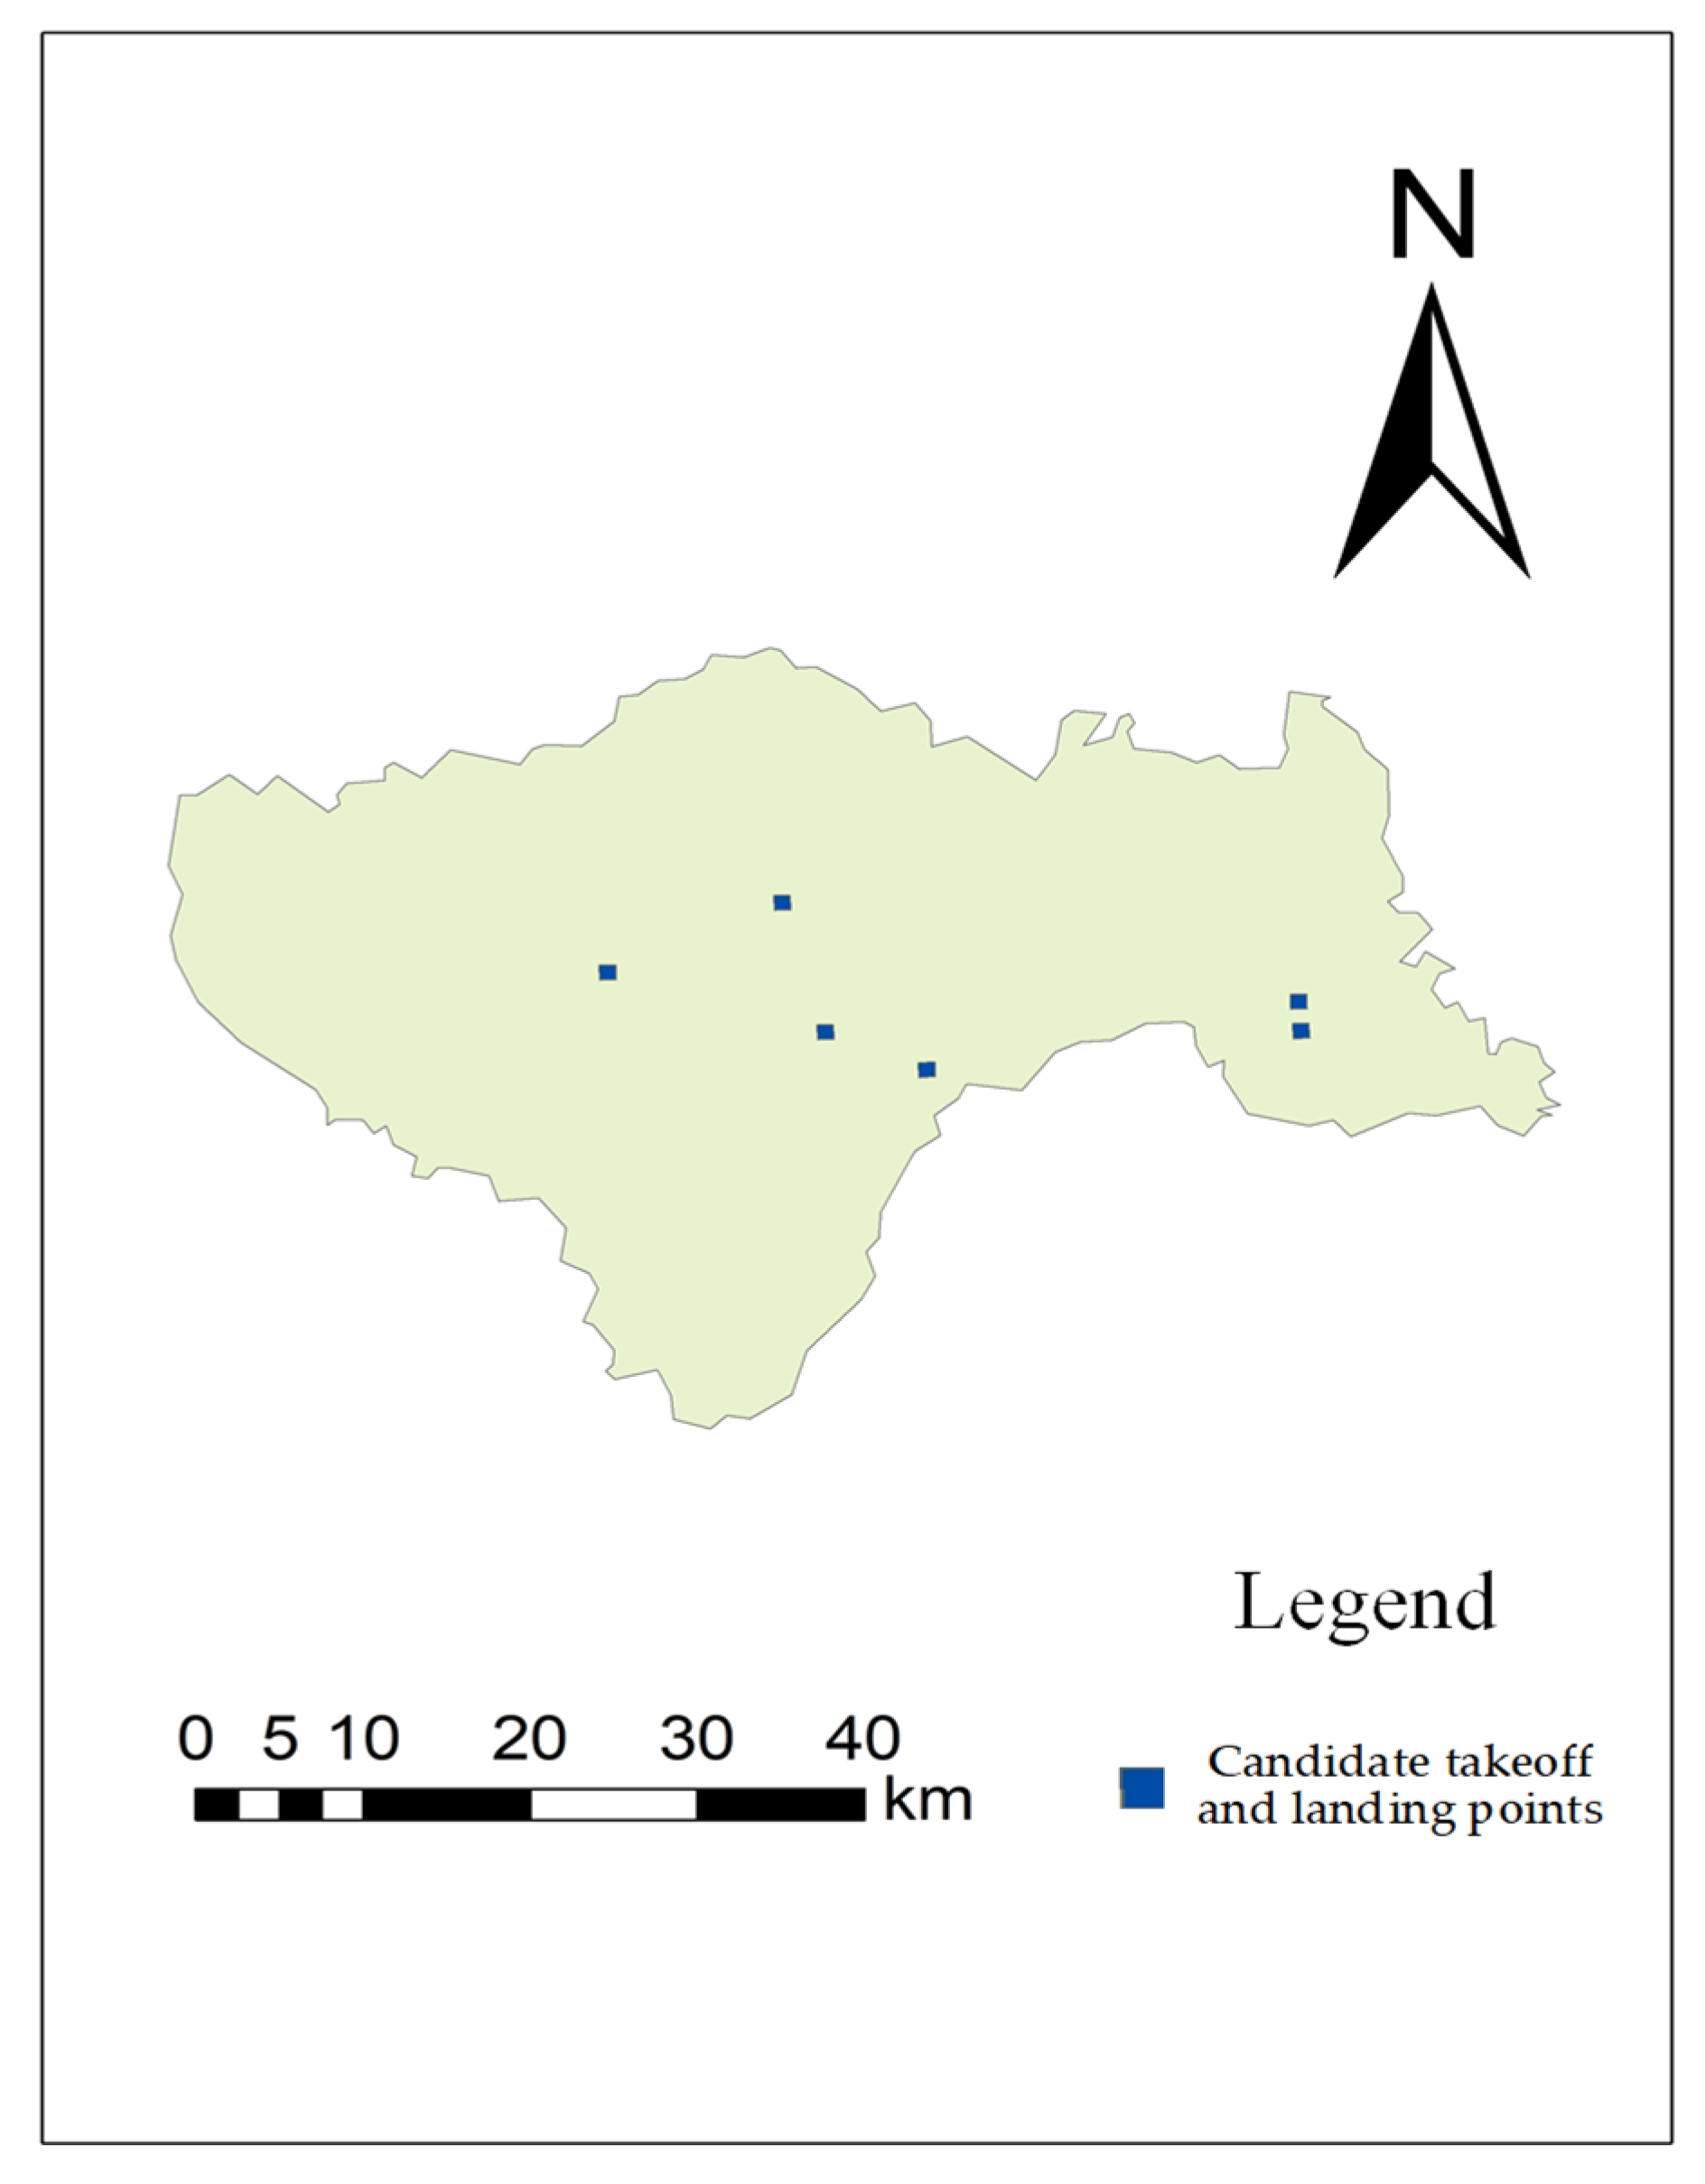
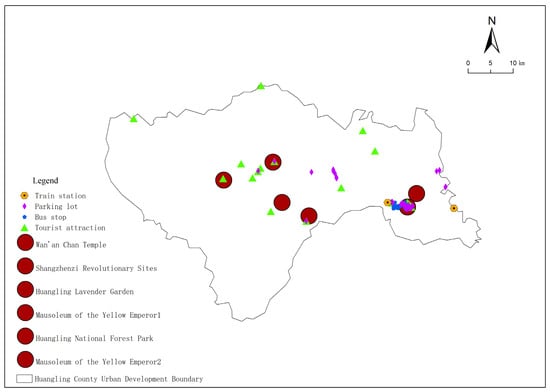
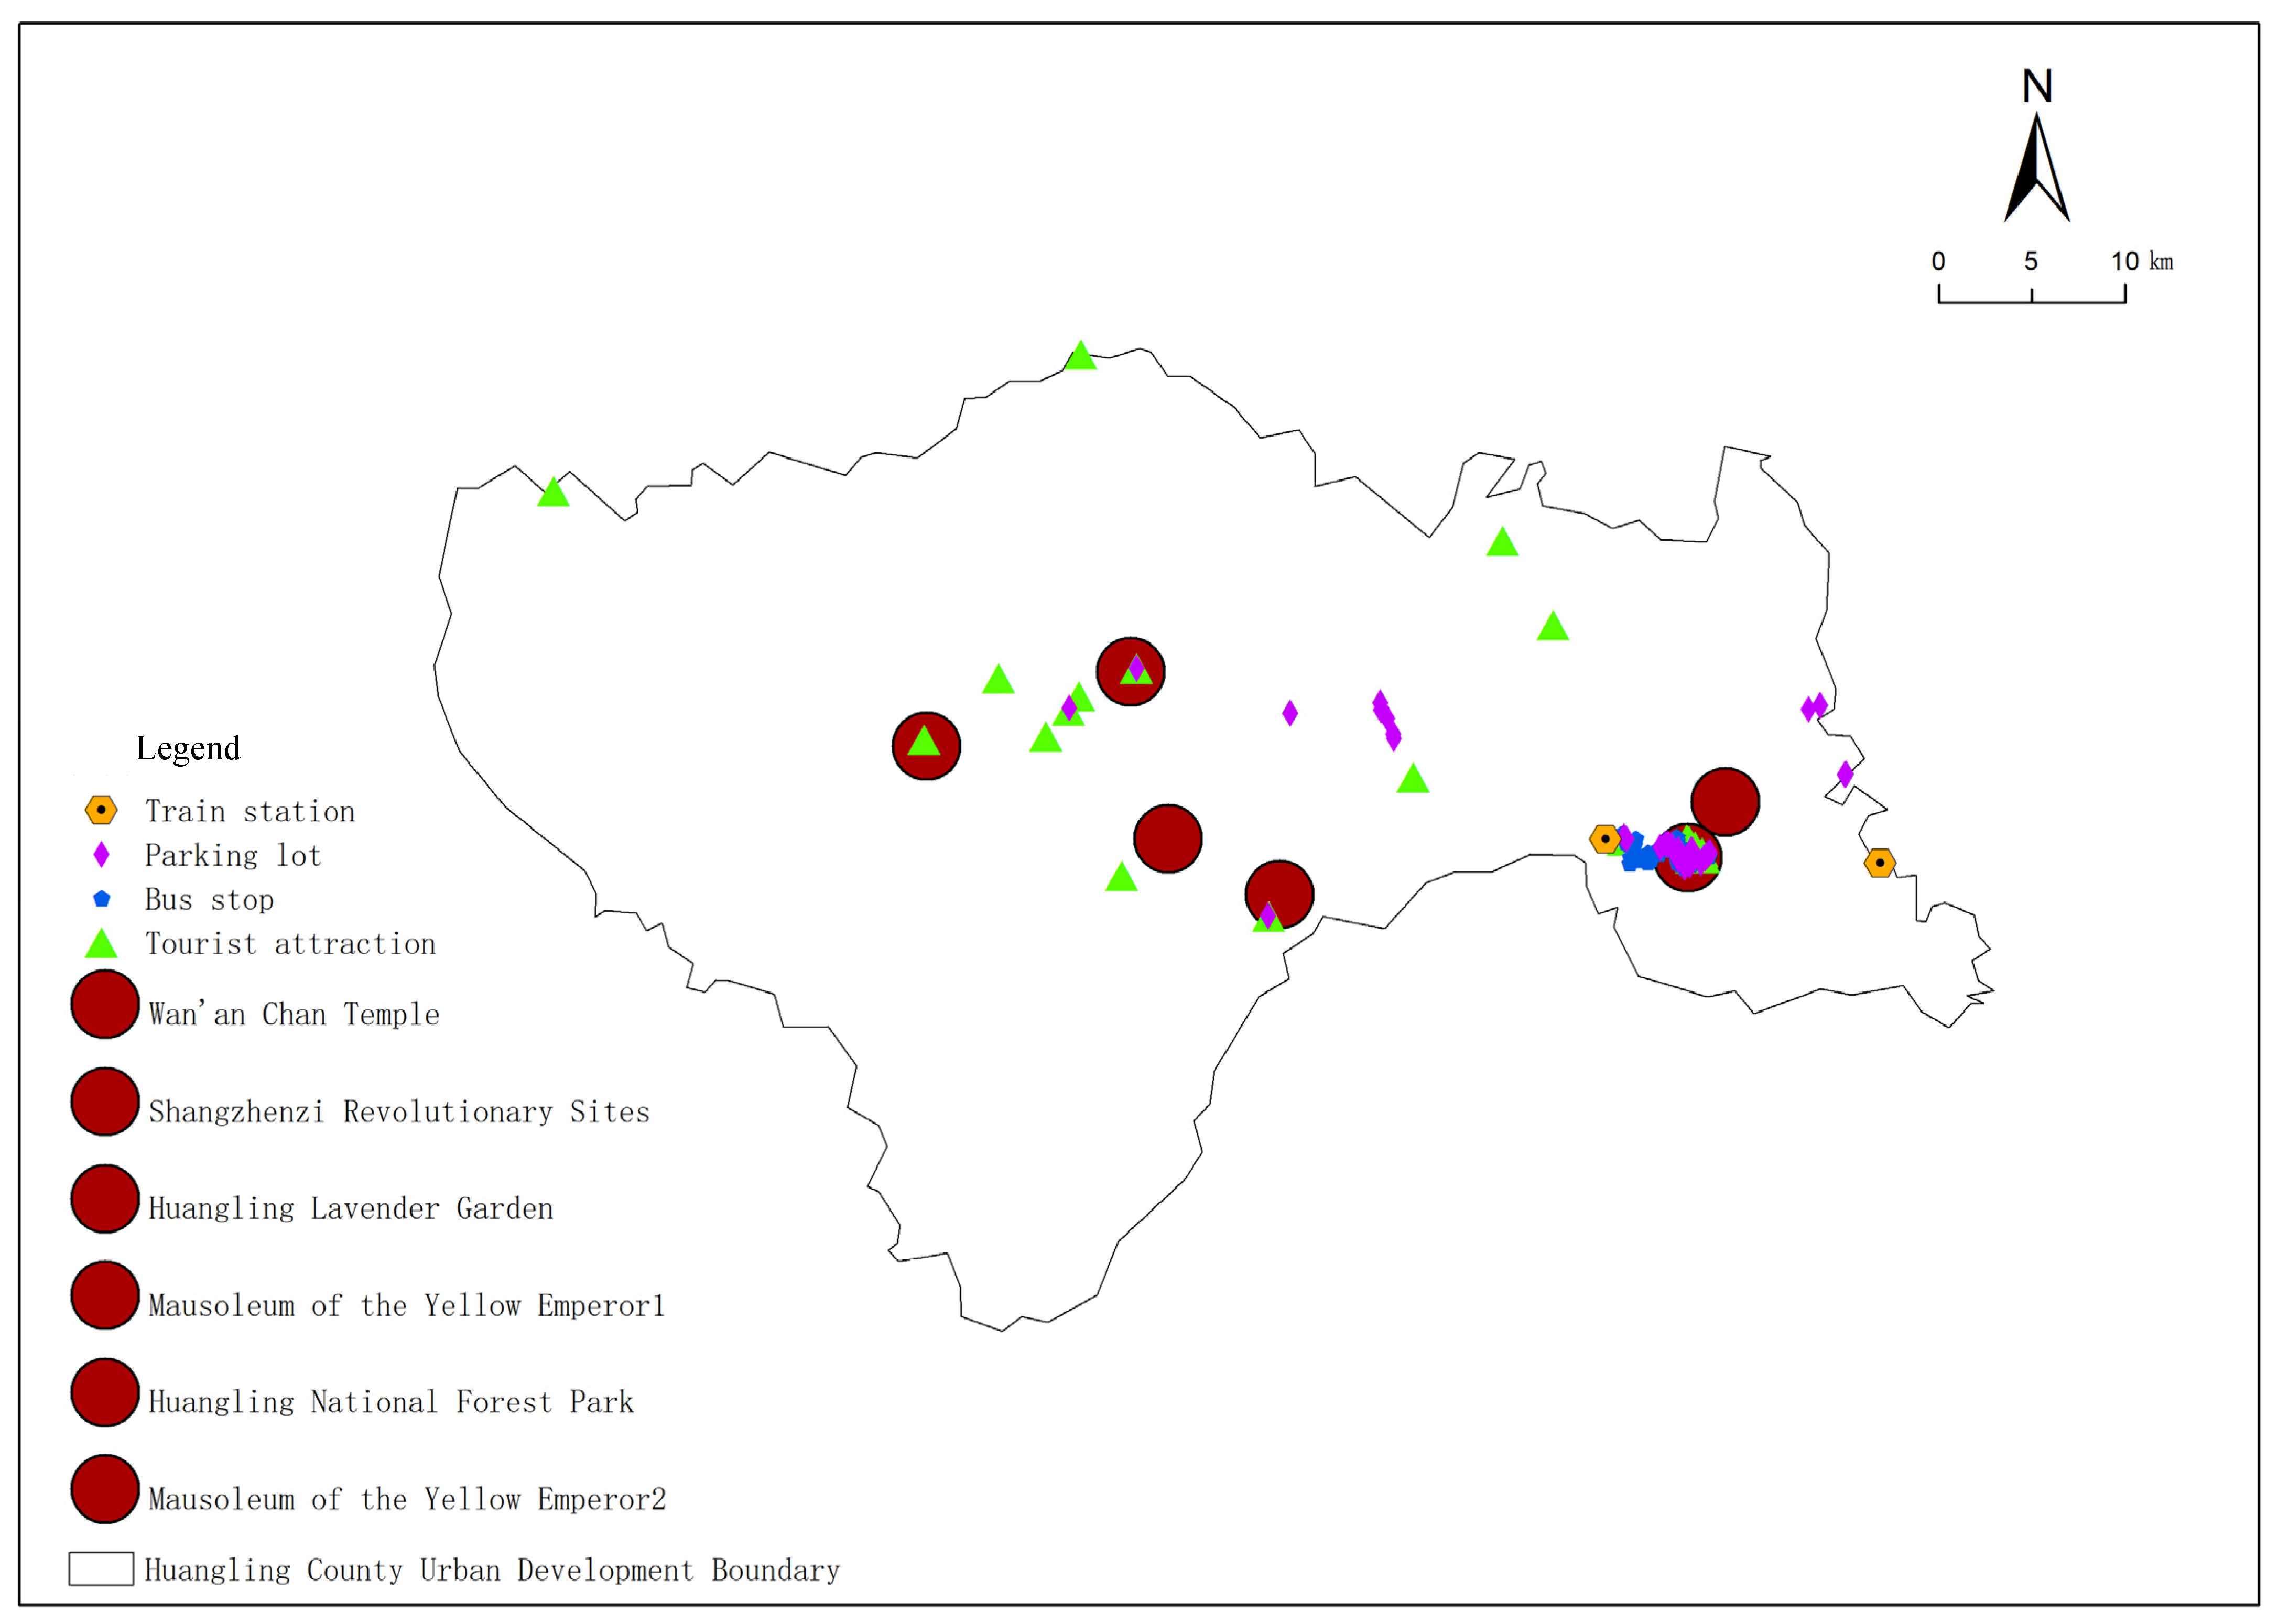
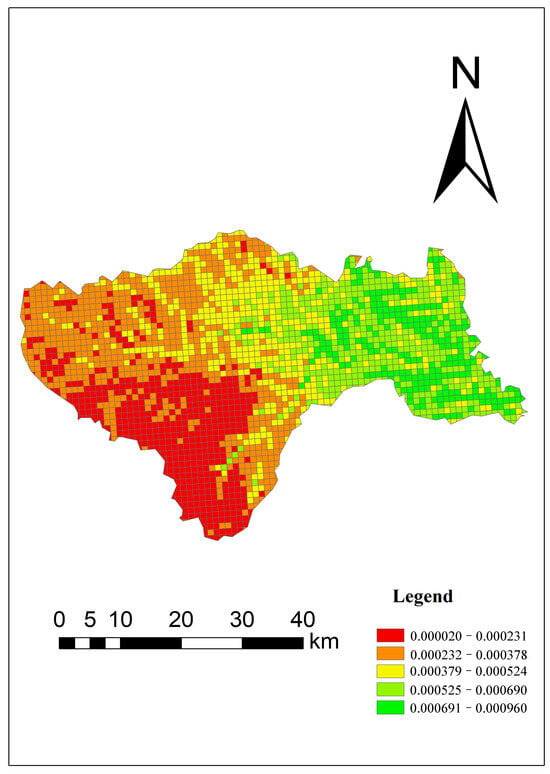
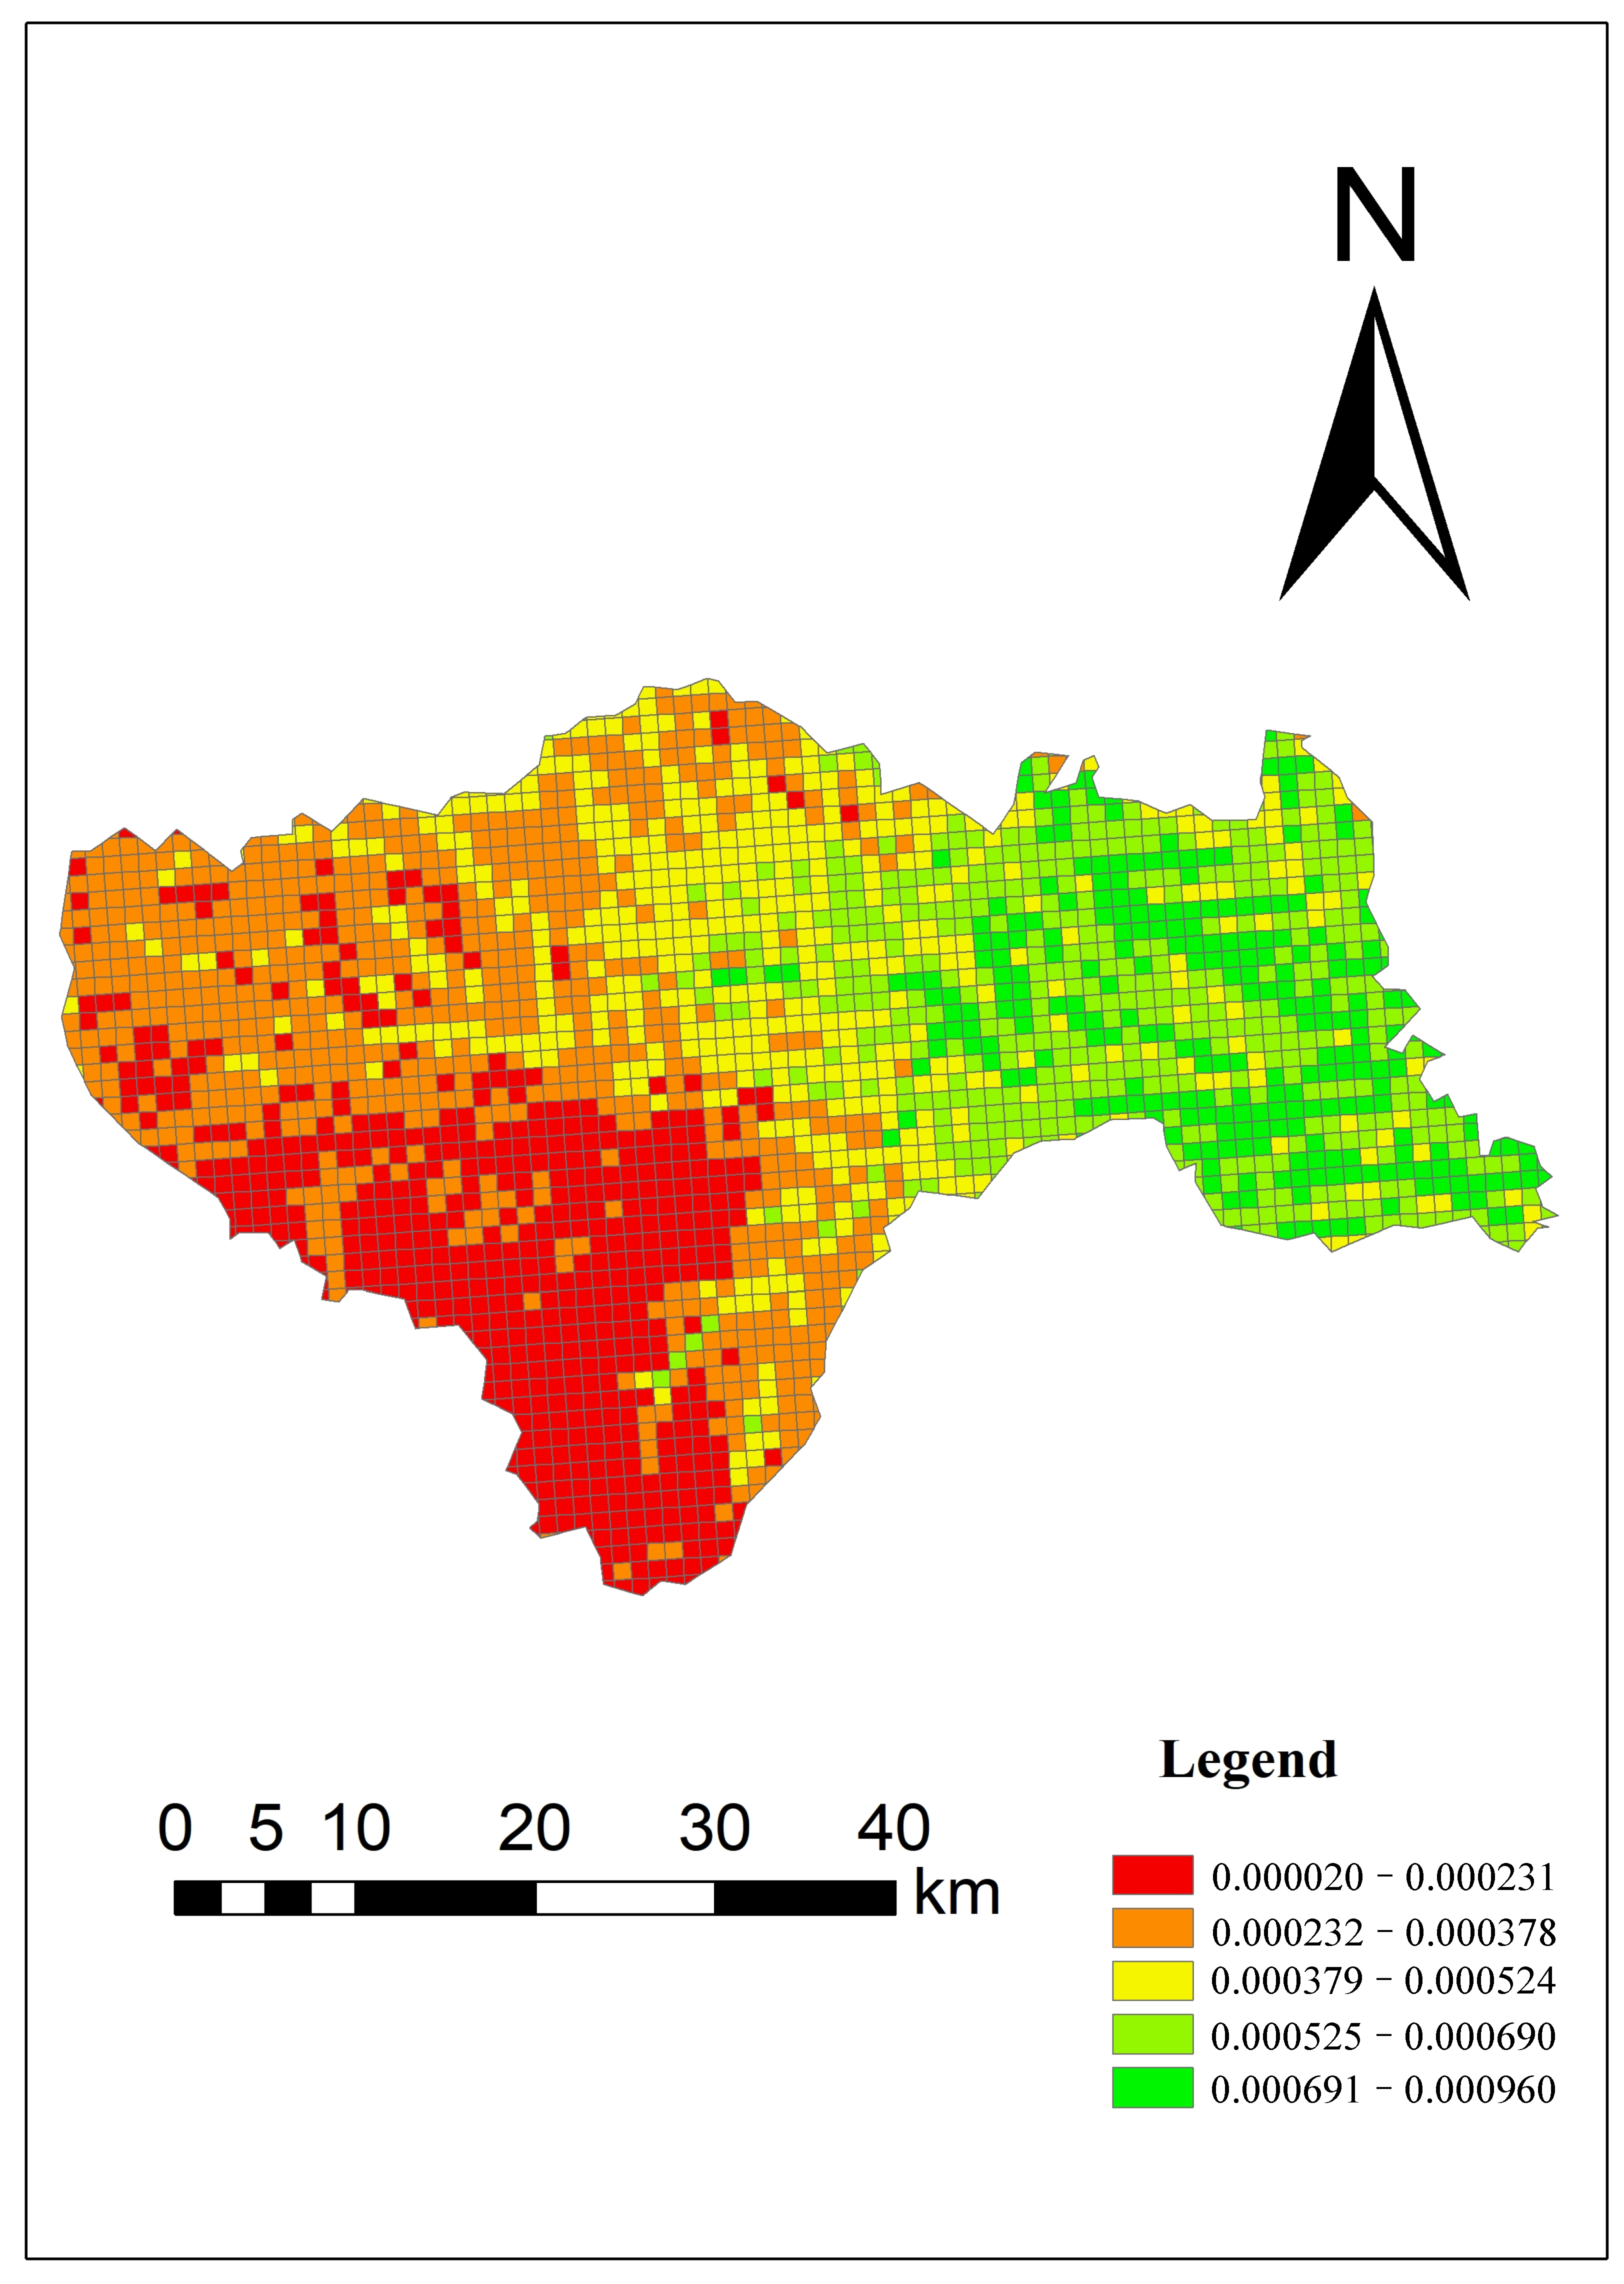
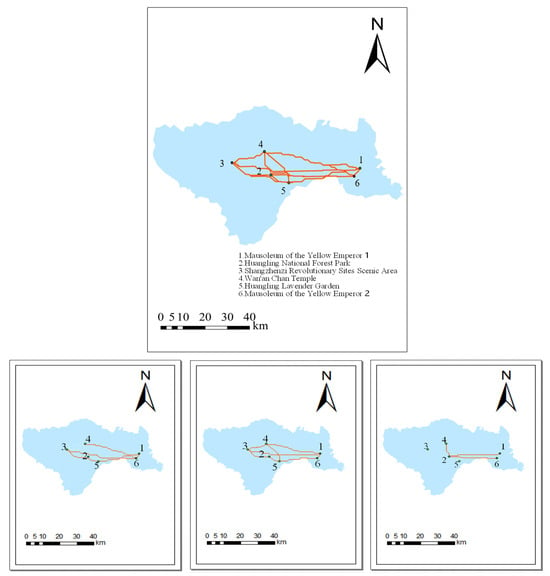
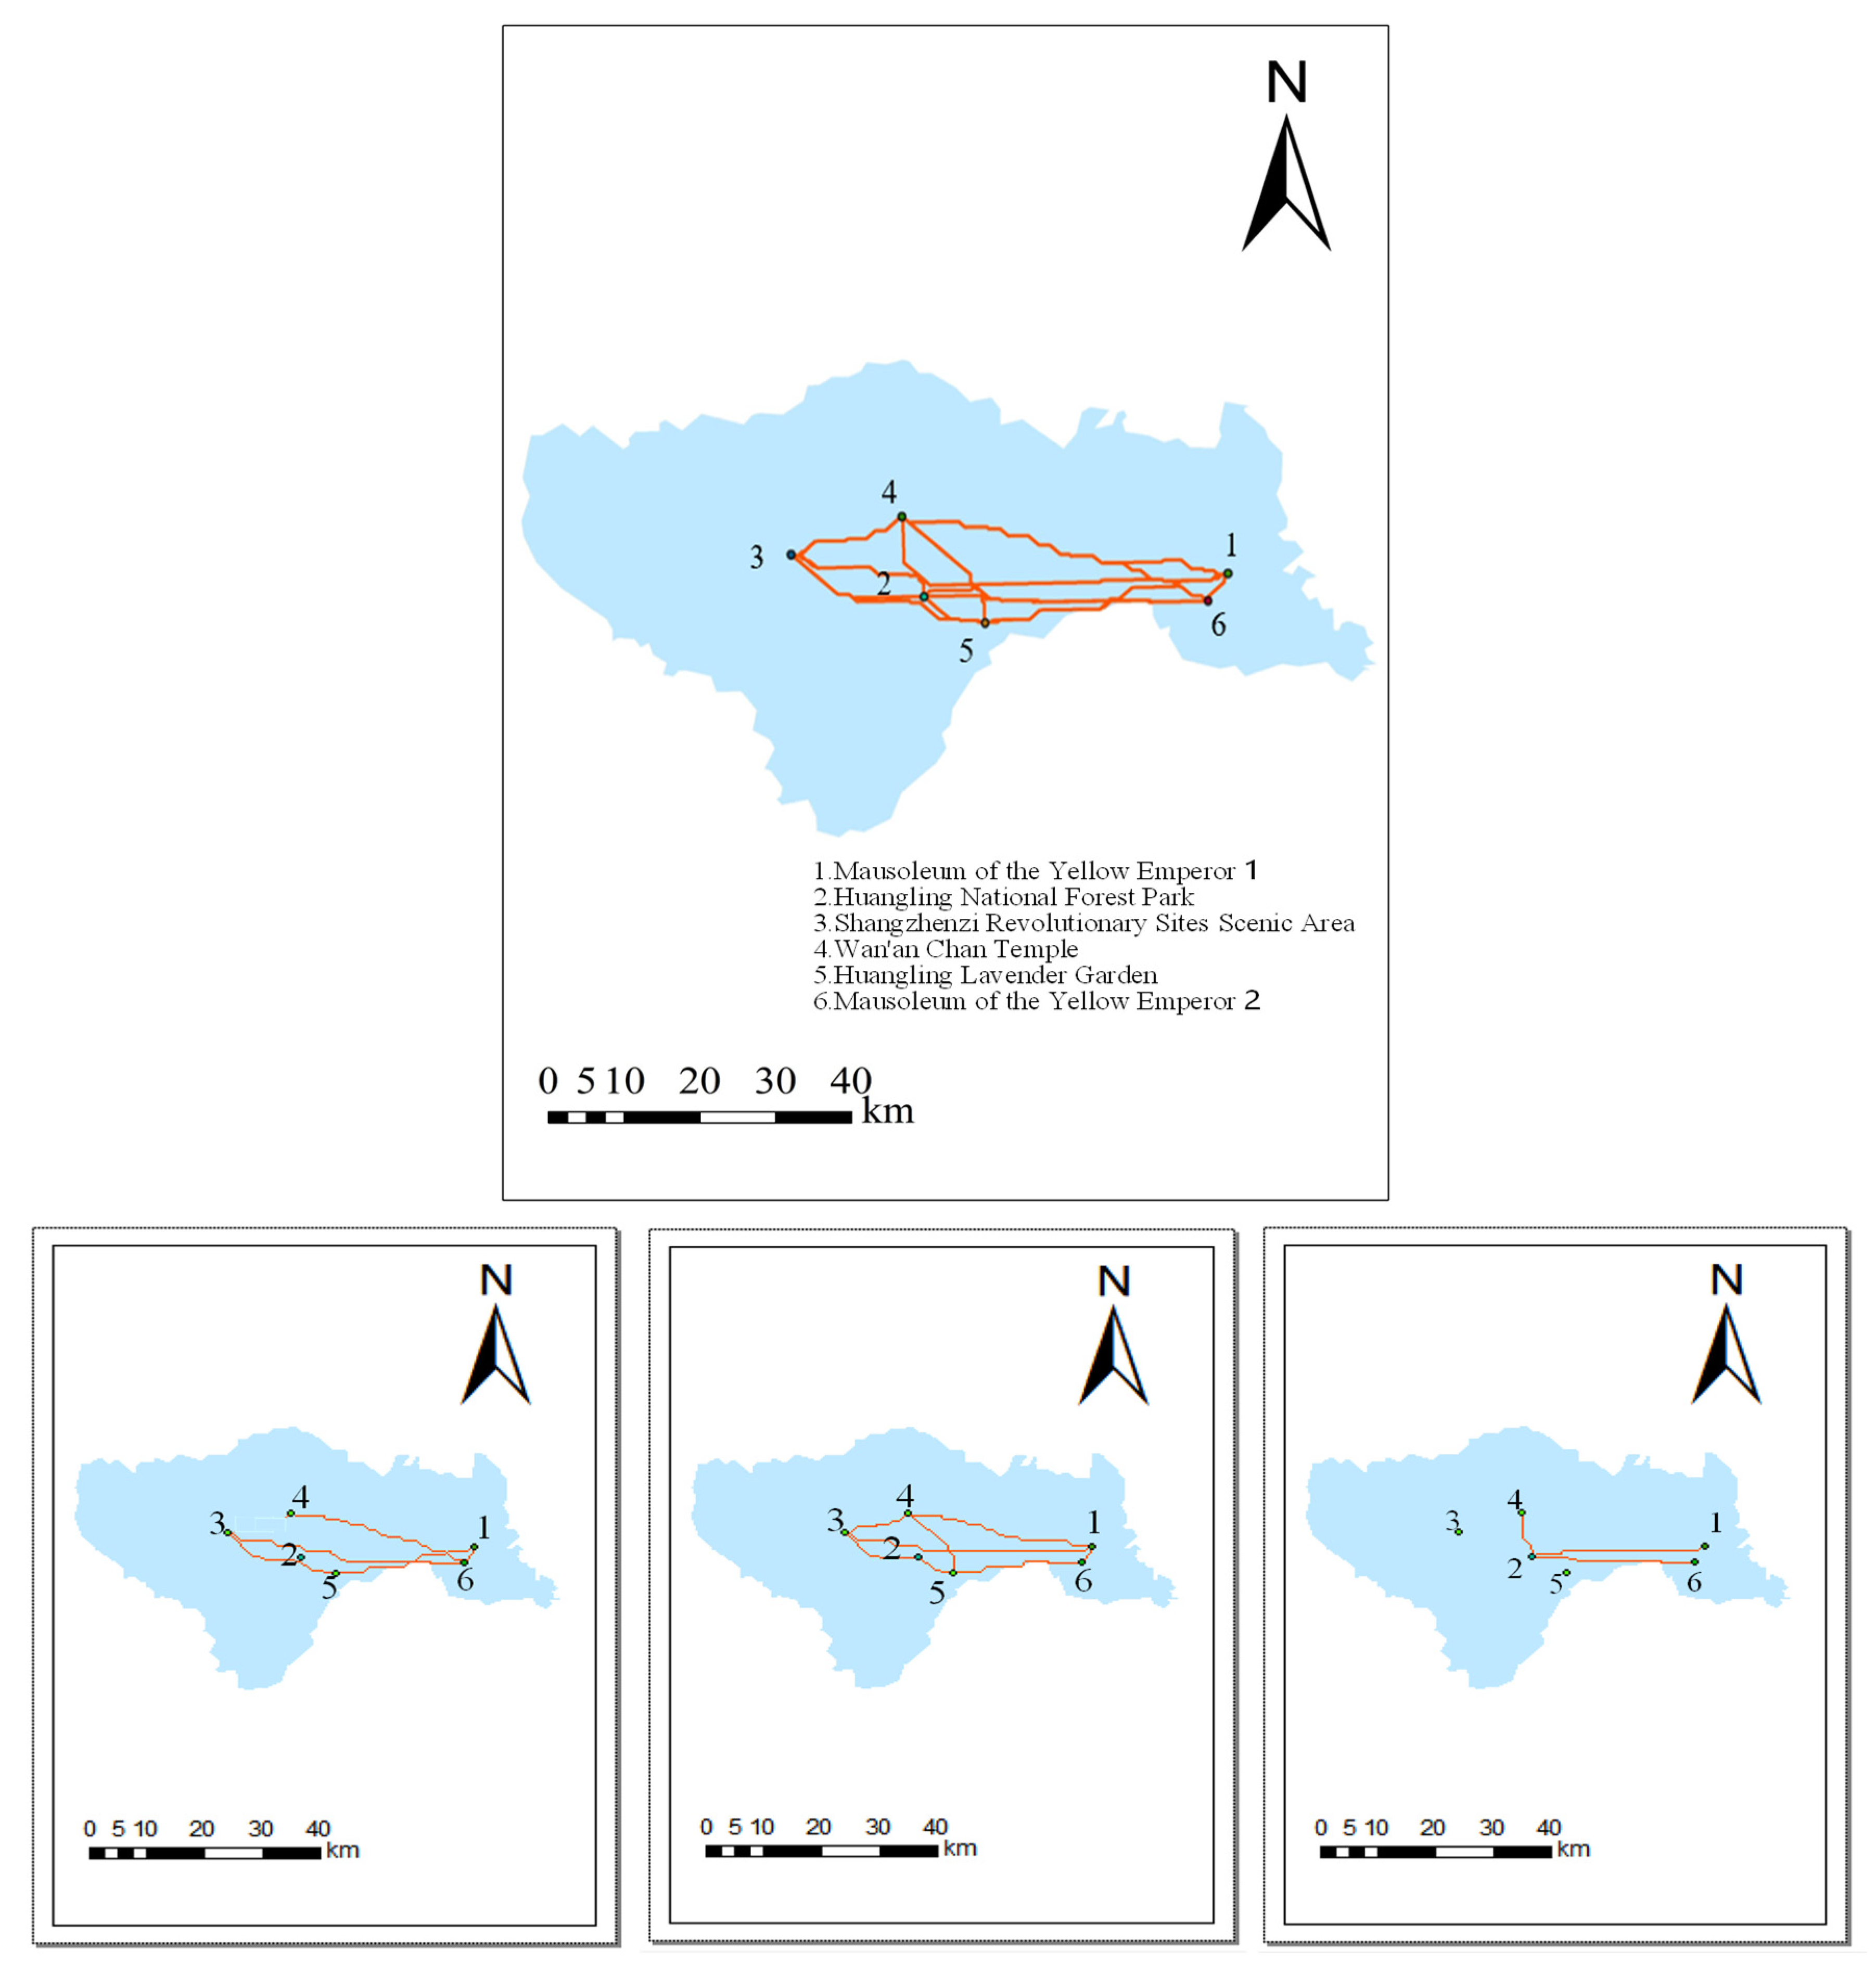

Disclaimer/Publisher’s Note: The statements, opinions and data contained in all publications are solely those of the individual author(s) and contributor(s) and not of MDPI and/or the editor(s). MDPI and/or the editor(s) disclaim responsibility for any injury to people or property resulting from any ideas, methods, instructions or products referred to in the content. |
© 2026 by the authors. Licensee MDPI, Basel, Switzerland. This article is an open access article distributed under the terms and conditions of the Creative Commons Attribution (CC BY) license.