


Abstract
This paper examines the influence of sustainable service quality dimensions on customer satisfaction within ISO/IEC 17025-accredited calibration laboratories in Saudi Arabia and Bahrain. The study addresses the ongoing challenge of ensuring high levels of customer satisfaction while simultaneously enhancing competitive advantage through the provision of sustainable calibration services. Anchored in the stimulus–organism–response (S-O-R) theoretical framework, the research employs a quantitative methodology, utilizing SmartPLS 4 to assess the proposed measurement model. Data were collected from 494 valid respondents representing users of ISO/IEC 17025-accredited calibration and testing laboratories in Saudi Arabia and Bahrain through a structured questionnaire and purposive sampling approach. The measurement and structural models were assessed using partial least squares structural equation modeling (PLS-SEM) with SmartPLS 4. The measurement model satisfied the required reliability and convergent validity criteria. The structural model results revealed that, Revenue, E-Waste Reduction, Resolving Customer Complaint and Work Transparency, and Service Innovation had significant direct relationships with both Sustainable Service Quality and Customer Optimum Satisfaction. In contrast, Feedback Assessment and Social CRM, did not demonstrate significant direct relationships with either outcome, while Environmental Concern and Service Digitalization Management had significant direct relationships only with Customer Optimum Satisfaction. The hypothesised positive relationships between Cost Saving and both outcomes were not supported because the estimated coefficients were negative. Furthermore, the mediation analysis confirmed that Sustainable Service Quality significantly mediated the relationships of, E-Waste Reduction, Resolving Customer Complaint and Work Transparency, and Service Innovation with Customer Optimum Satisfaction. However, its mediating effects were not significant for Environmental Concern, Feedback Assessment and Social CRM, Revenue, and Service Digitalization Management. The hypothesised positive indirect relationship involving Cost Saving was also not supported because its coefficient was negative. These findings provide empirical and practical insights for strengthening sustainable service quality and customer satisfaction in ISO/IEC 17025-accredited laboratory contexts.
1. Introduction
The main issues/challenges faced by the ISO/IEC 17025-accredited testing/calibration laboratories are the higher cost of establishing the traceability chain for reference standards, delay in testing/calibrating an item and transportation of reference standards to the National Metrology Institute, lack of competency in comprehending customer needs, and maintaining accreditation status [1]. Thus, quality managers must act as facilitators in support of the research’s efforts (and not the other way around). Researchers will be able to focus on their research efforts thanks to this arrangement while still adhering to management policies. The goal is to establish a quality management system (QM) according to ISO/IEC 17025 for this high-containment facility while simultaneously considering future biohazard needs and fundamental research ethical principles [2]. In general, a shift from selling items to selling solutions has been defined by the holistic nature of service functions, new technical tools, and their influence on organizations’ profitability [3].
There are not many studies that specifically address digitalization and sustainability, digitalization and CSR, or sustainability and corporate social responsibility (CSR). All of this research found an empirical connection between CSR and digitalization or sustainability and an improvement in performance [4].
While sustainable service quality (SSQ) has been widely studied across different industries, its effect on customer satisfaction in ISO/IEC 17025-accredited calibration laboratories especially in Saudi Arabia and Bahrain remains largely unexplored. Understanding this dynamic is vital for addressing key industry challenges, such as high competition and the need for effective resolution of customer complaints.
This research seeks to bridge this gap by exploring the role of sustainable service quality (SSQ) in enhancing operational efficiency within calibration laboratories. It extends the existing academic literature by investigating the link between sustainable service quality (SSQ) and customer satisfaction, offering actionable strategies for labs to adopt sustainable service models. Additionally, it equips policymakers with practical recommendations to improve service delivery and customer satisfaction in the calibration sector.
The study is expected to reveal a positive relationship between sustainable service quality (SSQ) and customer satisfaction, particularly in areas like complaint handling, operational clarity, and environmental efficiency. Enhanced customer satisfaction is likely to foster greater loyalty, ultimately driving improved business outcomes for calibration laboratories.
By connecting sustainable service quality (SSQ) practices in ISO/IEC 17025 calibration laboratories with more general environmental, economic, and social consequences, this study promotes sustainability. While quality management systems improve productivity and accuracy [5], incorporating sustainability expands these advantages to include increased stakeholder trust, waste reduction, and resource efficiency. Organizations must reduce environmental effects, increase economic efficiency, and bolster social responsibility practices in accordance with the three sustainability dimensions, environmental, economic, and social, identified in the Saudi industry [6].
This study shows how transparent services and efficient complaint handling can lower operating costs, minimize environmental impact, and strengthen social responsibility in calibration laboratories. The research gap on sustainable product–service systems in lab settings is filled by this study [7].
This study presents a full empirical investigation that examines the relationship between sustainable service quality (SSQ) and customer satisfaction in ISO/IEC 17025 calibration laboratories.
- Theoretical Background: The Stimulus–Organism–Response (S-O-R) Framework
The stimulus–organism–response (S-O-R) model was created in order to recognize the relationship between behavior and the psychological process, which includes internal elements like attitudes, views, and cognitive capacities. The results confirmed that the stimulus–organism–response (S-O-R) paradigm, which combines safety leadership, knowledge, motivation, and behavior, can effectively manage laboratory safety. As per [8], individual acts are mostly influenced by internal influences. The authors asserted that internal influences had impacted people to act logically. The S-O-R theory was expanded to consider both internal (service quality) and external (reputation) sources of information as stimuli that influence purchase intention (response) through customers’ (organisms’) cognition and emotion [9]. Additionally, several studies have used the expanded S-O-R model to predict customer behavior by including other factors like cognition and perceived service quality; also the S-O-R model has successfully predicted user behavior in general [10]. The socio-technical dimensions are not sufficiently covered in the current literature. By offering a stimulus–organism–response (S-O-R) framework conceptualized from a socio-technical standpoint, this study closes the gap [11].
- Justification for Applying the S-O-R Model in This Study
The S-O-R framework is an appropriate choice for this study, as it facilitates the exploration of both external stimuli and internal psychological responses influencing behavior. The study aims to evaluate how sustainable service quality (SSQ) affects customer satisfaction within calibration laboratories. Utilizing the S-O-R model enables the investigation of how external factors like the quality of service and transparency in operations impact internal responses, such as customer perceptions and levels of satisfaction. This theoretical approach offers deeper insight into the mechanisms through which sustainable service quality (SSQ) contributes to customer satisfaction, thereby reinforcing the rationale for adopting the S-O-R model in this context. Accordingly [9] observed that the S-O-R theory was expanded to take into account both internal (service quality) and external (reputation) sources of information as stimuli that influence purchase intention (response) through customers’ (organisms’) cognition and emotion.
Although SERVQUAL focuses primarily on service quality dimensions such as reliability, responsiveness, assurance, empathy, and tangibility [12] and TQM emphasizes organization-wide quality improvement and operational excellence [13], ISO/IEC 17025-accredited laboratories require a framework capable of explaining how sustainable service quality dimensions influence customer perceptions and behavioral responses. The S-O-R framework provides stronger explanatory capability by illustrating how laboratory service stimuli influence internal customer evaluations and satisfaction outcomes [14]. Therefore, the S-O-R framework was selected because it aligns more effectively with accredited laboratory environments where technical compliance requirements coexist with customer service quality expectations.
2. Proposed Theoretical Framework
The research model designed to enhance customer satisfaction through sustainable service quality in ISO/IEC 17025 calibration laboratories is built upon the stimulus–organism–response (S-O-R) theoretical framework. As illustrated in Figure 1, the model organizes the independent variables into four primary sustainability-driven categories: perceived economic benefits, perceived environmental benefits, perceived socio-cultural factors, and perceived digital transformation and innovation.
Figure 1.
Proposed conceptual framework.
These variables serve as key drivers influencing two dependent outcomes: the perceived value of sustainable service quality (SSQ) and the level of customer satisfaction. The framework proposes that economic benefits (e.g., cost efficiency and financial gain) and environmental benefits (e.g., reduction in electronic waste and environmental responsibility) play a direct role in improving both SSQ perception and customer satisfaction. Likewise, socio-cultural elements (such as customer feedback handling and complaint resolution) and technological progress (including digital services and innovations) positively impact these dependent variables.
Moreover, the model highlights a mediating role for SSQ value, suggesting that it channels the effects of the independent factors toward achieving optimal customer satisfaction. This holistic framework emphasizes how sustainability and innovation practices are central to enhancing service quality and customer satisfaction in ISO/IEC 17025-certified calibration environments.
2.1. Factors Affecting Laboratory Customer Optimum Satisfaction
2.1.1. Factors Related to Perceived Economic Advantages
Cost Reduction Through Digitalizing Calibration Processes
Digital technologies streamline calibration services, cutting operational costs for both labs and clients. This efficiency allows providers to offer services at competitive prices while maintaining high standards. Such cost optimization becomes a critical factor in enhancing value perception. The economic incentive not only pleases clients but also strengthens service quality perception [15]. A digital data management technique is the subject of this study. It is suggested to use a smart contract that can be traced back to the primary standard to increase the accuracy and dependability of calibration testing. This confirms that end users may get traceability information immediately [16].
Digital Calibration Certificates (DCCs) mark a transformative step in metrology, promising improved efficiency, traceability, and trust, yet they face challenges in societal acceptance and implementation. This article explores the benefits and barriers to fully adopting DCCs in calibration practices [17]. Future research should explore improving dynamic task execution, prioritization, and real-time responsiveness in algorithms to better manage dependencies and enhance their performance [18].
Digitalization within calibration laboratories contributes to reducing turnaround time, minimizing operational errors, improving certificate traceability, and increasing service accessibility. From a customer perspective, these improvements reduce indirect costs associated with delays, repeated work, and process inefficiencies while improving service reliability and customer satisfaction [19,20]. Therefore, the following hypotheses related to perceived economic advantages can be proposed:
H1.
Perceived economic advantages, such as cost savings in ISO/IEC 17025 laboratories, have a direct positive effect on customer satisfaction.
H1a,b.
Cost savings in ISO/IEC 17025 laboratories positively impact sustainable service quality, mediating the relationship with customer satisfaction.
Revenue Through Economic, Environmental, and Sustainability Concerns
Innovative management strategies and sustainable resource usage improve profitability in calibration services. Emphasizing digitized operations and efficient information handling strengthens competitive advantage and attracts clients seeking eco-conscious partnerships. This financial success contributes to both perceived value and satisfaction [21].
If it can draw in outside clients, it may be able to generate income by calibrating measuring tools and equipment [16]. Information technology is therefore used by digital servitization to create new value-adding income sources [22]. The following hypotheses are proposed:
H2.
Perceived economic advantages, such as revenue generated from sustainable calibration services, have a direct positive effect on customer satisfaction.
H2a,b.
Revenue from sustainable calibration services positively impacts sustainable service quality, mediating the relationship with customer satisfaction.
2.2. Factors Related to Perceived Environmental Advantages
2.2.1. E-Waste Reduction
Preventative maintenance and efficient calibration reduce equipment failures, minimizing e-waste. ISO/IEC 17025 compliance fosters service efficiency and environmental responsibility, aligning with modern clients’ eco-values. Less waste means better sustainability perception, directly influencing satisfaction [15].
Effective e-waste management is vital for sustainability and public health, yet research lacks consistent focus on analytical techniques for inorganic content characterization. This review (2013–2023) evaluates methods, elements analyzed, and sample preparation practices, underscoring the need for standardized procedures [23].
The calibration labs urgently require an improved system to optimize space and enhance workflow efficiency during peak periods. Technicians restore incomplete toolkits by replacing faulty or missing parts and then recalibrate and tag them green when ready for use [24]. The following hypotheses are formulated:
H3.
Electronic waste reduction positively affects customer satisfaction.
H3a,b.
Electronic waste reduction positively impacts sustainable service quality, mediating the relationship with customer satisfaction.
2.2.2. Environmental Care in Lab Operations
Clean production, renewable energy, and environmental oversight are key to sustainable lab practices. Despite existing limitations in monitoring aspects like chemical storage or lab conditions, adopting greener processes still contributes to positive client perception and builds trust in service quality [15].
The authors advocate for global adoption of Digital TransformationDX-based documents by standardization bodies to enable fully digital, eco-friendly calibration practices [25].
This study outlines a comprehensive strategy to enhance sustainability in an ISO/IEC 17025-accredited electrical calibration lab, aligning operations with Sustainable Development Goals (SDGs) as part of the 2030 Agenda for Sustainable Development through risk-based analysis and measurable indicators. Implemented measures at the Laboratory for Electrical Measurements (LEM) aim to reduce environmental impact while maintaining quality assurance [26].
Although calibration laboratories operate primarily within compliance-driven technical environments, environmental sustainability practices increasingly influence customer perceptions and institutional reputation. Resource optimization, energy efficiency initiatives, and waste reduction activities improve organizational image and strengthen customer trust, thereby contributing positively to customer satisfaction [27,28]. Furthermore, sustainable operational practices align with continual improvement principles emphasized within ISO/IEC 17025 management systems. The following hypotheses are proposed:
H4.
Environmental concern positively affects customer satisfaction.
H4a,b.
Environmental concern positively impacts sustainable service quality, mediating the relationship with customer satisfaction.
2.3. Factors Related to Social and Customer Relationship Management
2.3.1. Feedback Assessment and Social CRM
Feedback assessment and social CRM focus on proactive customer engagement activities including customer feedback collection, interaction management, and service improvement mechanisms. In contrast, resolving customer complaints and work transparency emphasize operational issue resolution and transparency during service delivery. Although conceptually related, both dimensions represent distinct customer experience mechanisms and therefore were treated independently within the conceptual framework [29].
- Periodicity of Assessing Customer Feedback
Minimize customer process expenses to increase value. Asking for feedback from customers and relevant stakeholders is how a firm manages the customer life cycle as well as the performance of customer service and other linked divisions in maintaining effective communication ties with consumers. Also, conduct reviews of the company’s choice of lucrative customers both internally across all departments and outside [30].
- 2.
- Strategic Assessment of Customer Feedback
The significance of considering the Informational System for Social Services (ISSS) lies not only in its role as a tool for gathering information describing reality but, more importantly, in its role as a tool for its users to advance their knowledge and build relationships with their clients and one another. ISSS is used by social workers across all the region’s social services [31].
Customer relationship management (CRM) is a cutting-edge system that aims to increase stakeholder interactions and profitability while also increasing stakeholder happiness, loyalty, and profitability [32].
Many studies on CRM have advanced significantly in a variety of industries, including telecommunications, finance, and manufacturing, but there has been relatively little research done specifically on authorized biomedical laboratories based on ISO/IEC 17025 or the healthcare setting [32]. Accordingly, the following hypotheses are proposed:
H5.
Feedback assessment and social CRM positively affect customer satisfaction.
H5a,b.
Feedback assessment and social CRM positively impact sustainable service quality, mediating the relationship with customer satisfaction.
2.3.2. Resolving Customer Complaints and Work Transparency
Resolving customer issues effectively and being transparent in lab operations foster loyalty. Enhanced traceability via digital records (e.g., audit logs) builds client trust. This openness reflects a professional commitment to customer-centric service [21]. Accordingly, any nonconforming work and any complaints will be brought to management’s attention along with the necessary remedial/correction action for future process improvements [1]. The following hypotheses are formulated:
H6.
Resolving customer complaints and enhancing work transparency positively affect customer satisfaction.
H6a,b.
Resolving customer complaints and improving transparency positively impact sustainable service quality, mediating the relationship with customer satisfaction.
2.4. Factors Related to Perceived Digitalization and Innovation
2.4.1. Serv-Digitalization and Digitized Document Control
Automation in calibration boosts traceability, reduces human error, and accelerates service delivery. Digitized documentation systems enhance efficiency and provide clarity, which reassures clients of the lab’s operational reliability and innovation [21]. As metrology evolves digitally, this study proposes using Blockchain as a secure platform for sharing Digital Calibration Certificates (DCCs) and Digital Test Reports (DTR) in compliance with ISO/IEC 17025. It outlines required content for DCC/DTR and offers implementation suggestions for Blockchain integration in metrological data exchange [33].
Digital Calibration Certificates (DCCs) mark a transformative step in metrology, promising improved efficiency, traceability, and trust, yet they face challenges in societal acceptance and implementation. Accordingly, the aim is to explore the benefits and barriers to fully adopting DCCs in calibration practices [17]. Based on that the following hypotheses are proposed:
H7.
Serv-digitalization and digitized document control positively affect customer satisfaction.
H7a,b.
Serv-digitalization and digitized document control positively impact sustainable service quality, mediating the relationship with customer satisfaction.
2.4.2. Serv-Innovation
Value creation is connected to a company’s concern with increasing productivity, operating and services costs, and the production of goods that satisfy customers’ needs while also taking into account socio-environmental issues, sustainable innovation, and the presence of sustainable practices that satisfy suppliers and customers’ expectations [26]. Furthermore, the typology of product/service developments has a favorable effect on the pillars. On the other hand, eco-innovations behave differently, showing a stronger positive link with the environmental pillar before moving on to the social and subsequently economic pillars [34]. Therefore, the following hypotheses are proposed:
H8.
Serv-innovation positively affects customer satisfaction.
H8a,b.
Serv-innovation positively impacts sustainable service quality, mediating the relationship with customer satisfaction.
2.5. Customer’s Perceived Sustainable Service Quality (SSQ)
The overall perception of quality when sustainability is integrated into lab practices serves as a powerful mediating variable. Customers are more likely to express satisfaction when they perceive that the service quality is not just technically proficient but also socially and environmentally responsible [21] Long-term sustainability performance in laboratories can be assessed annually by integrating sustainability indicators into regular reviews. The proposed universal methodology offers a practical framework for labs to conduct gap analyses and improve environmental performance [26]. The following hypothesis is formulated:
H9.
Sustainable service quality (SSQ) has a positive effect on customer satisfaction and mediates the relationship between all independent variables and customer satisfaction.
3. Research Methodology and Data Analysis
This research adopts a quantitative empirical approach to test the proposed conceptual framework. Data were collected from ISO/IEC 17025-accredited laboratories, and the analysis was conducted using SmartPLS to evaluate both the measurement and structural models. The study provides final empirical results, offering statistically supported relationships between the variables.
This study is designed as a full empirical analysis aimed at examining the impact of sustainable service quality on customer satisfaction within ISO/IEC 17025-accredited laboratories. The data were collected from 494 respondents representing customers of accredited laboratories in Saudi Arabia and Bahrain. A purposive sampling technique was employed because respondents required direct professional experience with ISO/IEC 17025-accredited calibration and testing laboratory services.
A purposive sampling technique was employed to recruit eligible respondents with direct professional experience of accredited calibration and testing laboratory services. The questionnaire was developed based on measurement items adapted from prior studies and aligned with the study constructs. All items were measured using a five-point Likert scale ranging from strongly disagree to strongly agree.
The constructs included economic, environmental, and socio-cultural dimensions as stimuli, sustainable service quality (SSQ) as the organism, and customer satisfaction as the response, based on the stimulus–organism–response (S-O-R) model.
For data analysis, the study adopted the PLS-SEM measurement and structural two stages approach using Smart PLS 4. Construct reliability and validity were assessed using Cronbach’s alpha, composite reliability (CR), and Average Variance Extracted (AVE).
Details of data collection, sample size calculation using G*Power 3.1, and data collection locations are provided at the end of this paper.
3.1. Measurement Model Test and Initial Results for Construct Reliability
In this study, confirmatory factor analysis (CFA) was utilized within the reflective measurement model to investigate the factors that contribute to achieving optimal customer satisfaction in calibration laboratories accredited under ISO/IEC 17025. This approach enabled the assessment of factor loadings, which reflect how strongly each indicator represents its corresponding latent variable. Figure 2 displays the reflective measurement model, showing the factor loadings associated with constructs linked to sustainable service quality and customer satisfaction. This figure provides a key reference point for evaluating the reliability and validity of the measurement items used in the study.
Figure 2.
Reflective measurement model of constructs influencing optimal customer satisfaction of ISO/IEC 17025-accredited calibration laboratories.
Statistical analyses demonstrated that the measurement model possessed strong validity and reliability, confirming the model’s adequacy for supporting its intended purpose. Consequently, the study proceeded to the next phase, which involves evaluating the structural model. To ensure the reliability of the measurement, both convergent and discriminant validity assessments were conducted. Typically, assessing the measurement model involves verifying its accuracy and consistency.
This evaluation process includes the following key steps:
- Indicator reliability is assessed by examining the factor loadings of the observed variables. Loadings must exceed 0.5, though it is generally recommended—according to established guidelines—that standardized loadings in reflective models should be above 0.70. For exploratory research, a minimum loading of 0.40 is still acceptable.
- Composite reliability and Cronbach’s alpha are also used to evaluate the model’s internal consistency. A reliability threshold of 0.70 or higher is considered standard and acceptable.
Cronbach’s alpha measures internal consistency, indicating how closely related a group of items are within a scale. It is commonly used to assess scale reliability. The final measurement model was assessed using the main study sample of 494 valid responses. Additionally, the results indicate acceptable internal consistency for most constructs. The final Cronbach’s alpha values ranged from 0.642 to 0.917, as presented in Table 2. Values below 0.70 should be interpreted cautiously alongside other reliability and validity measures. Construct reliability and validity were assessed using Cronbach’s alpha, composite reliability (CR), and Average Variance Extracted (AVE). The analysis was conducted using the PLS-SEM approach.
To achieve a satisfactory model fit in CFA, it is essential to identify and address measurement items that do not meaningfully contribute to their respective constructs [35]. This process involves evaluating each item’s performance and eliminating those that fail to meet the required standards of statistical significance and contribution to construct validity. A key requirement in CFA is the attainment of unidimensionality, meaning that each construct should be represented by a coherent set of indicators that measure a single underlying concept. To satisfy this criterion, the factor loading of individual items must generally meet a minimum threshold, commonly set at 0.60 [36]. Factor loadings below this threshold suggest that the item has a weak relationship with its associated latent variable and may introduce noise or distort the measurement model [29,31]. Therefore, such items are typically removed to enhance the model’s reliability and validity. These items include COS1, COS2, ENC1, EWR3, EWR4, SIN3, SDM5, SDM6, FS1, and FS2.
The justification for item deletion has been added in the measurement model section. Items with low factor loadings below the acceptable threshold were removed to improve construct reliability and convergent validity, in line with established PLS-SEM guidelines.
Accordingly, all the retained items in this study demonstrated satisfactory factor loadings, with values equal to or exceeding the commonly accepted threshold of 0.60. No items fell below this cut-off, indicating that each contributes meaningfully to its respective constructs. To ensure the stability and reliability of the results, the PLS-SEM analysis was rerun following the removal of any weak items (COS1, COS2, ENC1, EWR3, EWR4, SIN3, SDM5, SDM6, FS1, and FS2) identified during the initial assessment. This reanalysis confirmed that the revised measurement model continued to meet the required standards for indicator reliability. Specifically, all remaining items maintained factor loading values above the 0.60 threshold, affirming their adequacy for representing the latent constructs under investigation. The final factor loading results, which demonstrate the strength of the relationships between each observed indicator and its underlying constructs, are presented in Figure 2 and detailed in Table 1. These findings provide further evidence supporting the internal consistency and construct validity of the reflective measurement model for the influencing factors of optimal customer satisfaction.
Table 1.
Factor loading of the reflective measurement model.
3.1.1. Internal Consistency
Internal consistency refers to the extent to which items within a construct are interrelated and collectively measure the same underlying concept [37]. It serves as a critical indicator for evaluating the reliability of measurement instruments, particularly when assessing a single latent construct. In this study, both Cronbach’s alpha and composite reliability were utilized to examine the reliability and internal consistency of the constructs. These reliability metrics help determine whether the items consistently reflect the intended constructs. The results of these analyses are presented and discussed in the following sections to ensure the robustness and validity of the measurement model.
Strategic Assessment of Customer Feedback
To assess the internal consistency of the constructs in the measurement model, Cronbach’s alpha coefficient was employed, as it is widely recognized as a fundamental measure for evaluating the reliability of instruments that involve multiple items [34,38]. This coefficient estimates the degree to which items within a construct are correlated, thus reflecting how well they collectively measure a single underlying concept. The alpha coefficient ranges from 0 to 1, where values closer to 1 indicate stronger internal consistency [39]. In this study, the constructs evaluated include Cost Saving, Revenue, E-Waste Reduction, Environmental Concern, Feedback Assessment and Social CRM, Resolving Customer Complaint and Work Transparency, Service Digitalization Management, Service Innovation, Sustainable Service Quality, and Customer Optimum Satisfaction. Cronbach’s alpha values for these constructs range from 0.642 to 0.917, indicating an overall acceptable to high level of internal consistency.
According to the literature, a Cronbach’s alpha value above 0.60 is generally considered acceptable for exploratory studies [29,31]. While a threshold of 0.70 is often recommended, some researchers argue that slightly lower values may still be acceptable in certain contexts, especially when dealing with multidimensional constructs or small item sets [40]. In particular, lower alpha values may still reflect meaningful internal consistency if the items demonstrate strong theoretical justification and content validity. Hence, Table 2 below presents the Cronbach’s alpha values for all constructs in this study. The results confirm that the instrument used is reliable and that the items for each construct are sufficiently correlated, thus validating their inclusion in the measurement model.
Table 2.
Cronbach’s alpha reliability.
Cronbach’s alpha values approaching 0.70 may remain acceptable in exploratory studies, particularly when constructs involve multidimensional characteristics or limited indicators [41,42]. Additionally, COS1, ENC1, and EWR3 were excluded because their factor loading values did not satisfy the recommended measurement model criteria and contributed minimally to construct reliability and convergent validity. Therefore, these indicators were removed to improve measurement quality and strengthen the reliability and validity of the construct assessment, consistent with established PLS-SEM measurement model evaluation guidelines [43].
Composite Reliability
In addition to Cronbach’s alpha, composite reliability (CR) was employed to further evaluate the internal consistency of the measurement items. Composite reliability provides a more robust estimate of reliability than Cronbach’s alpha because it takes into account the actual factor loadings of the items rather than assuming equal weightings [44] It is widely regarded as a preferable alternative in structural equation modeling, particularly in PLS-SEM, due to its ability to account for differing item contributions. According to established guidelines, a CR value of 0.60 or higher is generally considered acceptable for demonstrating adequate internal consistency and construct reliability [37,45] Values above this threshold suggest that the items within a construct are reliably measuring the same underlying latent variable.
In this study, all the constructs, including Customer Optimum Satisfaction, Cost Saving, Environmental Concern, E-Waste Reduction, Feedback Assessment and Social CRM, Resolving Customer Complaint and Work Transparency, Revenue, Service Digitalization Management, Service Innovation, and Sustainable Service Quality, achieved composite reliability values above the recommended minimum of 0.6, thereby affirming the consistency and reliability of the measurement model. Table 3 presents the CR values in terms of both rho_A (Dijkstra–Henseler’s reliability coefficient) and rho_C (conventional composite reliability).
Table 3.
Composite reliability (CR).
Although rho_a for E-Waste Reduction remained relatively lower, composite reliability exceeded recommended thresholds, indicating acceptable construct reliability. Differences between rho_a and composite reliability may occur due to indicator characteristics and measurement structure complexity within PLS-SEM applications [41,46].
Average Variance Extracted (AVE)
To further validate the measurement model, Average Variance Extracted (AVE) was employed to assess the convergent validity of each construct. AVE represents the average amount of variance that a latent construct is able to explain in its observed indicators and is considered a key metric in evaluating the validity of reflective measurement models [36]. It provides a quantitative estimate of how well the indicators reflect their respective latent constructs. Hence, AVE is closely associated with factor loadings, as it is derived from the squared loadings of the items. In essence, the AVE indicates the extent to which the indicators of a construct converge or share a high proportion of variance in common [29,31].
According to [35], an AVE value of 0.50 or higher is considered the minimum threshold, as it implies that at least 50% of the variance in the indicators is explained by the underlying latent variable. When this criterion is met, it provides evidence of construct validity, confirming that the indicators appropriately represent the intended construct. In this study, all the latent variables, namely Customer Optimum Satisfaction, Cost Saving, Environmental Concern, E-Waste Reduction, Feedback Assessment and Social CRM, Resolving Customer Complaint and Work Transparency, Revenue, Service Digitalization Management, Service Innovation, and Sustainable Service Quality, achieved AVE values above the 0.50 threshold. This outcome confirms that the measurement model exhibits adequate convergent validity. Accordingly, Table 4 presents the AVE values for each construct.
Table 4.
Construct validity.
3.1.2. Discriminant Validity
Discriminant validity assesses the extent to which a construct is truly distinct from other constructs within the same model [44]. In other words, it determines whether a latent variable captures a phenomenon that is not represented by other variables in the model. This type of validity ensures that each construct measures a unique concept and that the indicators of one construct do not significantly overlap with those of another [45,47,48]. Hence, the primary goal of evaluating discriminant validity is to confirm that the constructs under investigation exhibit low intercorrelations and are statistically distinguishable. This is critical in establishing the conceptual uniqueness of each latent variable, thereby reinforcing the integrity of the measurement model in this study.
Fornell–Larcker
To evaluate the discriminant validity of the constructs, this study employed two widely accepted methods: the Fornell–Larcker criterion and cross-loading assessment [44,46] The Fornell–Larcker criterion, introduced by Fornell and Larcker [44], is a traditional yet robust approach that determines whether each construct shares more variance with its own indicators than with other constructs in the model. According to this criterion, the square root of the Average Variance Extracted (AVE) for each construct should be greater than the correlations between that construct and all other constructs in the model. This condition confirms that a latent variable is more strongly related to its own measurement items than to those of other latent variables, thereby supporting discriminant validity.
Table 5 presents the Fornell–Larcker matrix, where the diagonal elements (bolded or italicized in standard presentations) represent the square root of the AVE for each construct, while the off-diagonal elements show the inter-construct correlations. The results clearly indicate that all constructs satisfy the Fornell–Larcker criterion, as each construct’s diagonal value exceeds its correlations with other constructs. This confirms that the model achieves an acceptable level of discriminant validity.
Table 5.
Fornell–Larcker criterion.
Cross-Loading
In addition to the Fornell–Larcker criterion, cross-loading analysis is another commonly used approach to assessing discriminant validity in structural equation modeling. This method ensures that each measurement item (indicator) is more strongly associated with its assigned latent variable than with any other construct in the model [39,45,47]. Specifically, discriminant validity is confirmed when an indicator’s loading on its corresponding construct exceeds its loadings on all other constructs. If an item exhibits a higher correlation with a different construct than with the one it is intended to measure, it may indicate an overlap in conceptual meaning, thus violating discriminant validity. Accordingly, the results of the cross-loading analysis for this study’s measurement model are presented in Table 6. As shown, all items load highest on their respective constructs, demonstrating acceptable discriminant validity across the model.
Table 6.
Cross-loading of the measurement model.
Accordingly, the results of the discriminant validity assessment indicate that each latent construct meets the required criteria. In the Fornell–Larcker criterion table (refer to Table 5), the diagonal values (representing the square roots of the AVE) are consistently higher than the corresponding off-diagonal values in both their respective rows and columns. This confirms that each constructor shares more variance with its own indicators than with other constructors in the model. Furthermore, the cross-loading analysis reinforces this outcome. All indicators demonstrated higher loadings on their respective constructs (highlighted in green) than on any other constructs, affirming their unique contribution. This clearly indicates that, while the constructs may be conceptually related, they are statistically distinct and measure different aspects of the underlying theoretical model. Hence, the measurement model exhibits strong discriminant validity across all constructs.
Heterotrait–Monotrait Ratio of Correlations (HTMT)
The Heterotrait–Monotrait Ratio of Correlations (HTMT) is a robust and widely accepted method for assessing discriminant validity in PLS-SEM models [49,50]. Unlike the Fornell–Larcker criterion, which relies on comparing square roots of AVE with inter-construct correlations, HTMT evaluates the ratio of between-construct correlations (heterotrait) to within-construct correlations (monotrait). This provides a more sensitive measure for identifying lack of discriminant validity. Following the guidelines proposed by [49], HTMT values below the conservative threshold of 0.85 are considered indicative of sufficient discriminant validity. Following the guidelines proposed by Henseler et al. [49] and Franke and Sarstedt [51], HTMT values below the conservative threshold of 0.85 are considered indicative of sufficient discriminant validity.
In this study, all HTMT values fall below this recommended threshold (see Table 7), confirming that each latent construct is statistically distinct from the others. Moreover, the HTMT analysis complements the earlier results from the Fornell–Larcker criterion and cross-loading assessments. Together, these findings robustly support the discriminant validity of the measurement model, suggesting that the latent constructs, while theoretically related, capture conceptually unique phenomena.
Table 7.
Discriminant validity of the measurement model through HTMT criteria.
3.2. Structural Equation Model (SEM)
The term model refers to a set of statistical techniques used to examine the relationships between independent variables (IVs) and dependent variables, which may be either observed variables or latent constructs [29,52,53]. Structural equation modeling (SEM) encompasses a range of methods, including path analysis, confirmatory factor analysis, multiple regression analysis, causal analysis, and model fit assessment [29,43,52]. Accordingly, this study employed several key statistical indicators, namely, multicollinearity (collinearity statistics), path coefficients, coefficient of determination (R2), F-Square, and model fit indices, to evaluate the structural model of the factors affecting laboratory customer optimal satisfaction. The results of this structural model assessment are presented in the subsequent sections.
3.2.1. Collinearity Statistics Through Variance Inflation Factor (VIF)
The multicollinearity test is commonly employed to assess the degree of intercorrelation among independent variables in relation to a dependent variable, which can significantly affect the reliability of regression estimates [54]. Detecting multicollinearity is essential, as the presence of high correlations between predictor variables can inflate the standard errors of regression coefficients, leading to unreliable statistical inferences and reducing the overall interpretability of the model [43,53]. One of the most widely used indices for identifying multicollinearity is the Variance Inflation Factor (VIF), which quantifies the extent to which the variance of a regression coefficient is increased due to collinearity among predictors. According to [29], a VIF value exceeding 10 is generally regarded as a sign of severe multicollinearity. However, several researchers advocate for more conservative thresholds, suggesting that VIF values above 5 or even 8 may already pose potential concerns depending on the study design and context [55].
In the present study, VIF values were calculated for each indicator to examine the extent of collinearity among the constructs in the measurement model. The results, displayed in Table 8, reveal that all VIF values are below the conservative threshold of 5. This finding indicates that none of the independent variables exhibit problematic levels of multicollinearity. Therefore, the regression coefficients can be interpreted with confidence, and the structural model is not adversely affected by collinearity issues. The absence of significant multicollinearity further strengthens the validity and robustness of the model’s explanatory power and its subsequent statistical conclusions.
Table 8.
Collinearity statistics.
3.2.2. Path Coefficients
Path coefficients are typically used to identify correlations between variables and to assist researchers in assessing how strong those relationships are [29,43,53]. Accordingly, to investigate the significance of factors affecting laboratory customers optimal satisfaction, the path coefficients output is examined, and the results are shown in Table 9, which presents the standardized beta coefficients (β), standard deviations (SD), t-statistics, and p-values for the hypothesized direct effects within the structural model.
Table 9.
Path coefficient of the direct effects of factors affecting laboratory Sustainable Service Quality and Customer Optimal Satisfaction.
The findings reveal that several paths exhibit statistically significant relationships at the 0.05 level or better. Notably, Service Innovation has the strongest positive effect on both Sustainable Service Quality (SSQ) (β = 0.502, p = 0.000) and Customer Optimum Satisfaction (COS) (β = 0.272, p = 0.000), suggesting that service innovation is a critical driver of both quality and satisfaction outcomes. This highlights the role of innovation in fostering sustainability and enhancing customer experiences. Secondly, Resolving Customer Complaint and Work Transparency also shows a significant positive influence on both COS (β = 0.191, p = 0.000) and SSQ (β = 0.163, p = 0.009), underscoring the importance of responsiveness and transparency in building customer trust and service quality. Similarly, Revenue positively affects both COS (β = 0.193, p = 0.000) and SSQ (β = 0.115, p = 0.033), indicating that financial performance correlates with perceived customer satisfaction and service quality.
Moreover, E-Waste Reduction is another significant predictor of COS (β = 0.130, p = 0.004) and SSQ (β = 0.145, p = 0.006), highlighting the increasing importance of environmental sustainability in shaping customer perceptions. Environmental Concern significantly influences COS (β = 0.074, p = 0.041) but not SSQ (p = 0.196), suggesting that while environmental concern affects customer satisfaction, it may not directly translate into perceived service quality. Contrary to the hypothesised positive relationships, Cost Saving exhibited negative direct associations with COS (β = −0.136) and SSQ (β = −0.125). Therefore, H1 and H1a were not supported. The CST indicators capture cost-saving preferences and expectations rather than realised savings or excessive cost-cutting practices. The mechanisms underlying these unexpected associations remain to be investigated.
On the other hand, Feedback Assessment and Social CRM shows no significant direct relationships with either COS or SSQ. Service Digitalization Management has a statistically significant positive direct relationship with COS (β = 0.082, p = 0.037), but its direct relationship with SSQ and its indirect relationship with COS through SSQ are not statistically significant. Finally, Sustainable Service Quality significantly predicts Customer Optimum Satisfaction (β = 0.171, p < 0.001), supporting its direct relationship with customer satisfaction; its mediating role is supported specifically for SIN, EWR, and RCW. Overall, these results support several hypothesized relationships and underscore the relevance of innovation, responsiveness, environmental initiatives, and quality to customer satisfaction. The negative CST coefficients contradict the hypothesised positive relationships but do not establish that cost reduction itself harms service quality or customer satisfaction.
3.2.3. R Square
The R Square (R2) value is a commonly used measure to assess the explanatory power of a model, indicating the proportion of variance in the dependent variable that can be predicted from the independent variables [56,57]. In the context of PLS-SEM, [46] suggests that R2 values of 0.19, 0.33, and 0.67 can be interpreted as weak, moderate, and substantial, respectively. As shown in Table 10, the R2 values obtained in this study are 0.489 for Sustainable Service Quality (SSQ) and 0.386 for Customer Optimum Satisfaction (COS), with adjusted values of 0.481 and 0.375, respectively. These values suggest that the model demonstrates moderate predictive accuracy for both dependent constructs.
Table 10.
R Square for predictive model for factors affecting laboratory Sustainable Service Quality and Customer Optimal Satisfaction.
Specifically, the results imply that approximately 48.9% of the variance in SSQ can be explained by the independent variables: Cost Saving (CST), Revenue (RVN), E-Waste Reduction (EWR), Environmental Concern (ENC), Feedback Assessment and Social CRM (FS), Resolving Customer Complaint and Work Transparency (RCW), Service Digitalization Management (SDM), and Service Innovation (SIN). This reflects the degree to which these organizational and environmental factors contribute to the perceived sustainability of service quality within calibration laboratories in Saudi Arabia and Bahrain. Likewise, the model explains about 38.6% (adjusted to 37.5%) of the variance in COS, indicating that customer satisfaction outcomes can be moderately predicted by the combined effects of Sustainable Service Quality and the aforementioned independent constructs. This level of explanatory power supports the model’s relevance and applicability in understanding customer-oriented outcomes in service industries focused on sustainability. Hence, these findings confirm that the structural model has adequate predictive power, particularly in relation to Sustainable Service Quality, while still offering useful insights into the determinants of Customer Optimum Satisfaction.
3.2.4. Effect Size (f2) Assessment
A critical part of the structural assessment involves evaluating the effect size (f2), which quantifies the contribution of each exogenous construct to the R2 value of the endogenous construct(s). Unlike p-values, which merely test significance, the f2 effect size provides insight into the practical relevance or strength of each predictor variable [58]. According to [58] ’s guidelines, f2 values of 0.02, 0.15, and 0.35 are interpreted as small, medium, and large effects, respectively.
As displayed in Table 11, the effect size of the constructs on Customer Optimum Satisfaction and Sustainable Service Quality reveals several noteworthy findings. For example, Service Innovation exhibited the most substantial effect on SSQ with an f2 of 0.277, indicating a large effect size, suggesting that innovation in services is a key driver of sustainability perceptions. For Customer Optimum Satisfaction, the most influential predictors were Service Innovation (0.025), Revenue (0.022), and Sustainable Service Quality (0.024), all of which reflect small but meaningful effects. Other constructs such as Resolving Customer Complaint and Work Transparency and E-Waste Reduction also contributed small effect sizes to both dependent variables.
Table 11.
Effect size (f2) of the model showing factors affecting laboratory Sustainable Service Quality and Customer Optimal Satisfaction.
On the contrary, constructs like Feedback Assessment and Social CRM, Environmental Concern, and Service Digitalization Management showed very small or negligible effects, with values close to zero in some cases (e.g., FS–COS: 0.000). Hence, these results suggest that Service Innovation is the most impactful factor in enhancing Sustainable Service Quality and, indirectly, Customer Satisfaction. Thus, organizations, particularly in the calibration laboratory and broader service sectors, should prioritize innovation-driven strategies when aiming to enhance service sustainability and satisfaction outcomes. This insight holds important implications for strategic planning and policy development in service-oriented sectors, such as calibration in Saudi and Bahrain, where service delivery can be effectively guided by focusing on the variables with the greatest impact.
3.2.5. Model Fit
The assessment of model fit is essential to determine how well the proposed model reflects the data and the relationships between the constructs. Several indices are commonly used to evaluate model fit, including the Tucker–Lewis Index (TLI), also referred to as the Non-Normed Fit Index (NNFI), Normed Fit Index (NFI), and Standardized Root Mean Square Residual (SRMR) [29,32,59]. These indices provide a comprehensive view of the model’s fit to the data by measuring the extent of misfit or inconsistencies between the theoretical and observed relationships.
Model fit was assessed using the Standardized Root Mean Square Residual (SRMR) and Normed Fit Index (NFI). Following the PLS-SEM reporting guidelines of Hair et al. [56], the SRMR value of 0.078 for both the saturated and estimated models is below the commonly applied threshold of 0.10, indicating an acceptable approximate model fit. The NFI value was 0.672 for both models, as presented in Table 12. However, this NFI value should be interpreted cautiously and does not independently establish adequate model fit.
Table 12.
Model fit of the factors affecting laboratory Customer Optimal Satisfaction.
In addition to SRMR and NFI, other model fit indices, including d_ULS, d_G, and Chi-square, were examined. As presented in Table 12, the d_ULS and d_G values were 6.866 and 2.011, respectively, while the Chi-square value was 5268.310. These statistics are reported as supplementary model fit information; however, their values alone do not establish acceptable model fit without appropriate reference criteria. Overall, the SRMR value of 0.078 suggests an acceptable approximate fit, whereas the NFI value of 0.672 warrants cautious interpretation. Therefore, model adequacy should be assessed alongside the measurement and structural model results rather than relying solely on global fit indices.
3.2.6. Mediating Effects
The results of the mediation analysis were achieved by determining whether Sustainable Service Quality mediates the relationships between each antecedent construct and Customer Optimum Satisfaction. The analysis utilized the Bias-Corrected and Accelerated (BCa) confidence interval at the 97.5% level, ensuring robustness in evaluating the significance of indirect effects. The results, presented in Table 13, reveal a mix of significant and non-significant mediating relationships.
Table 13.
Specific indirect effects on Customer Optimum Satisfaction through Sustainable Service Quality.
Among the significant mediations, Service Innovation exhibited the strongest indirect effect on COS via SSQ (β = 0.086, p = 0.001), suggesting that SSQ plays a crucial mediating role in translating innovation efforts into enhanced customer satisfaction. This highlights the importance of ensuring that innovative practices are aligned with sustainable quality standards to achieve optimal customer outcomes. Similarly, Resolving Customer Complaint and Work Transparency showed a significant positive indirect effect on COS (β = 0.028, p = 0.036), indicating that transparency and responsiveness influence satisfaction when mediated through SSQ. In the same vein, E-Waste Reduction was found to significantly influence COS indirectly through SSQ (β = 0.025, p = 0.024), further supporting the role of environmentally sustainable practices in driving customer satisfaction.
The estimated indirect association between CST and COS through SSQ was negative (β = −0.021), contrary to the hypothesised positive direction. Therefore, the positive indirect hypothesis was not supported. The mechanisms underlying this unexpected association remain to be investigated. On the other hand, several constructs did not exhibit significant mediating effects through SSQ. These include Environmental Concern (β = 0.007, p = 0.215), Feedback Assessment and Social CRM (β = −0.007, p = 0.276), Revenue (β = 0.020, p = 0.061), and Service Digitalization Management (β = 0.006, p = 0.283). While these constructs may influence SSQ or COS directly, the mediation through SSQ is not statistically supported in this model.
In summary, the results indicate that SSQ partially mediates the relationships between COS and key constructs such as SIN, RCW and EWR, while no mediating effect is observed for CST, ENC, FS, RVN, and SDM. This highlights the selective role of sustainable service quality as a conduit through which certain organizational factors influence customer satisfaction.
4. Results Summary of the Hypotheses
This section summarizes the findings of the hypothesis testing conducted through the bootstrapping technique using 10,000 resamples. One-tailed tests at α = 0.05 were used because the hypotheses specified expected directions of association. Bootstrapping, widely regarded for its robustness and minimal statistical assumptions, was employed to assess the direct and mediating relationships were developed. As shown in Table 14, the results revealed that, out of the 17 hypotheses, 11 were supported and 6 were not supported, indicating statistically significant relationships between most constructs and the dependent variables. Notably, constructs such as, Revenue, E-Waste Reduction, Resolving Customer Complaint and Work Transparency, and Service Innovation showed strong and significant positive effects on either Customer Optimum Satisfaction or Sustainable Service Quality. Furthermore, the mediation analysis confirmed that Sustainable Service Quality significantly mediated the relationships of, E-Waste Reduction, Resolving Customer Complaint and Work Transparency, and Service Innovation with Customer Optimum Satisfaction. However, its mediating effects were not significant for Environmental Concern, Feedback Assessment and Social CRM, Revenue, and Service Digitalization Management. These findings provide empirical and practical insights for strengthening sustainable service quality and customer satisfaction in ISO/IEC 17025-accredited laboratory contexts.
Table 14.
Summary of hypotheses.
The results represent final empirical findings, confirming the hypothesized relationships and demonstrating the significant impact of sustainable service quality (SSQ) on customer satisfaction.
The negative relationship between cost saving and customer satisfaction suggests that excessive emphasis on cost reduction may adversely affect service quality. In ISO/IEC 17025 laboratories, maintaining high levels of accuracy and reliability requires adequate resources. Therefore, reducing costs beyond a certain level may weaken service performance and negatively influence customer satisfaction.
5. Conclusions
The results of this study, offer a comprehensive analysis of the relationships between key constructs influencing Sustainable Service Quality and Customer Optimum Satisfaction within calibration laboratories in Saudi Arabia and Bahrain. The model evaluation included path coefficients, coefficient of determination (R2), effect size (f2), mediating effects, and model fit indices. The findings demonstrated that several constructs, such as Service Innovation, E-Waste Reduction, Revenue, and Resolving Customer Complaint and Work Transparency, had significant direct relationships with both SSQ and COS. However, Feedback Assessment/Social CRM showed no statistically significant direct relationship with either SSQ or COS. Service Digitalization Management showed a significant direct relationship with COS, but not with SSQ. The mediating role of SSQ was supported in multiple relationships, notably between SIN, EWR, and RCW with COS, underscoring its importance in these specific relationships. The indirect relationships involving Feedback Assessment/Social CRM and Service Digitalization Management were not statistically significant. The hypothesised positive direct and indirect relationships involving Cost Saving were not supported, as the estimated coefficients were negative. The R2 values of 0.489 for SSQ and 0.375 for COS indicate that the independent variables explained 48.9% and 37.5% of the variance in the respective dependent constructs. The effect size analysis further clarified the relative impact of each construct, with Service Innovation exhibiting the largest effect on SSQ. Finally, the model fit indices, particularly SRMR (0.078) and NFI (0.672), provided mixed evidence of model fit and should be interpreted cautiously rather than as confirmation of structural soundness and theoretical consistency. Overall, the results provide valuable insights into the dynamics of sustainable service delivery and customer satisfaction in technical service environments. These findings inform the study’s practical implications. By dentifying relationships between selected sustainability-related practices, SSQ, and customer satisfaction in ISO/IEC 17025 laboratories can improve customer satisfaction while promoting environmental preservation, cost effectiveness, and social accountability, this study offers useful sustainability contributions. The highlight the relevance of service innovation, e-waste reduction, and open complaint handling to service quality and customer satisfaction, without directly establishing improvements in resource use or customer confidence. As a result, including sustainability in laboratory operations may support long-term corporate success and is consistent with sustainable development objectives.
The findings of this study indicate that selected sustainable service quality dimensions are significantly associated withcustomer satisfaction within ISO/IEC 17025-accredited calibration and testing laboratories. These dimensions include digitalization, innovation, transparency, environmental sustainability and complaint management, However, the evidence for digitalization was limited to its direct relationship with COS, while the proposed direct and indirect relationships involving customer feedback management/Social CRM were not supported. The findings further suggest that integrating empirically supported dimensionsinto laboratory quality systems may help improve customer satisfaction; potential benefits for operational efficiency, competitiveness, and long-term sustainability performance require further investigation. The study recommends that laboratory managers adopt sustainability-oriented strategies, digital transformation initiatives, and continuous improvement practices guided by the specific relationships supported in this study, while evaluating rather than assuming their benefits for both service quality and customer satisfaction.
6. Research Implications
6.1. Practical Implications
This study provides practical implications for ISO/IEC 17025-accredited calibration and testing laboratories by supporting digital transformation implementation, strengthening innovation practices, improving transparency, enhancing complaint and customer feedback management systems, promoting environmental sustainability practices, improving responsiveness to customer requirements, and strengthening sustainable operational practices. The findings also support quality managers and decision-makers in developing sustainability-oriented operational strategies that improve service quality, customer satisfaction, and long-term operational performance.
6.2. Theoretical Contribution
This study contributes to the literature by extending the stimulus–organism–response (S-O-R) model into the context of ISO/IEC 17025-accredited laboratories. It integrates sustainability dimensions as external stimuli influencing sustainable service quality (SSQ), which in turn affects customer satisfaction. This provides a novel perspective on linking sustainability practices with customer outcomes in technical service environments.
7. Limitations and Planning for Future Research
A primary limitation of ISO/IEC 17025 is its narrow focus on technical competence, which often overlooks broader service quality dimensions and customer satisfaction. This limited scope restricts the adoption of holistic frameworks that incorporate customer-centered and sustainability-focused performance measures.
Additionally, the study was geographically limited to Saudi Arabia and Bahrain, which may affect result generalizability. Additionally, the cross-sectional design limits the ability to capture changes over time. Access to accredited laboratories is challenging due to strict privacy policies, reducing the depth and generalizability of research findings. Lab-specific processes and customer demographics further limit the applicability of results across different contexts.
Integrating sustainability into calibration services adds complexity, as labs must balance cost, efficiency, and client satisfaction. These trade-offs can obscure critical aspects of service quality, especially those linked to environmental and social performance, making it difficult to evaluate customer experiences comprehensively.
To overcome these challenges, future research should extend beyond ISO/IEC 17025 by incorporating other quality and sustainability standards. Longitudinal and cross-industry studies could offer valuable insights into the long-term effects of sustainable practices. Comparing labs based on their adoption of sustainability initiatives may also reveal effective strategies.
Moreover, using advanced models that explicitly account for sustainability-related factors can improve the accuracy of customer satisfaction assessments. Engaging stakeholders such as clients, regulators, and sustainability experts can enhance data access and contextual understanding. Finally, exploring technologies like AI and IoT may provide real-time tools for enhancing service quality and customer satisfaction in calibration laboratories.
- Data Collection
The survey was developed based on measurement items adapted from prior studies. All items were measured using a five-point Likert scale ranging from strongly disagree to strongly agree.
A total of 1200 survey invitations were distributed to employees across 851 companies in Saudi Arabia and Bahrain. As a result, 494 completed and valid responses were received, yielding a response rate of approximately 41.2%. This rate is considered satisfactory and above average for online survey research, particularly in organizational contexts, where access and engagement can be challenging.
Purposive sampling of customers of ISO/IEC 17025-accredited calibration/testing labs in the Kingdom of Saudi Arabia and Bahrain was conducted. A total of sample size of a sampling frame of 851 organizations was used; 1200 questionnaires were distributed and 494 valid responses were retained, comprising 301 respondents with a percentage of 60.93% in the Kingdom of Saudi Arabia and 193 respondents with a percentage of 39.06% in Bahrain.
A purposive sampling approach was employed to ensure representation across different categories of ISO/IEC 17025 laboratory users in Saudi Arabia and Bahrain. Data collection was conducted from July 2024 to January 2025. A total of 851 companies were targeted, resulting in 494 valid responses including 301 respondents from Saudi Arabia and 193 respondents from Bahrain.
In partial least squares structural equation modeling (PLS-SEM), determining an appropriate sample size is crucial, particularly when mediation is involved [56,60,61]. A mediator variable explains the relationship between an independent variable (IV) and a dependent variable (DV). The required sample size depends on factors such as the number of indicators per construct, effect sizes between variables, and the desired statistical power [56]. A common rule of thumb suggests at least 10 times the largest number of incoming structural paths or formative indicators [56]. However, detecting smaller effect sizes requires larger samples. According to [58], According to Cohen [58], a medium effect size (f2 = 0.15) can be used in statistical power analysis. In this study, a significance level of 0.05 and a statistical power of 0.95 were selected to determine the minimum required sample size.
In this study, GPower software version 3.1 was used to estimate the appropriate sample size for assessing perceived economic benefits, environmental sustainability, socio-cultural factors, and digital transformation, mediated by sustainable service quality (SSQ), on customer satisfaction due to its extensive application in the literature to determine the sample size for PLS-SEM-based analysis [62,63]. Therefore, based on GPower analysis, a minimum of 166 participants were required for this study [62,63]. As shown in Figure 3, the F-test was selected under the test family for multiple linear regression (fixed model, R2 deviation from zero). The analysis was conducted a priori using a medium effect size (0.15), a significance level of 0.05, and a statistical power of 0.95 (higher than the commonly accepted 0.80 threshold) to ensure robustness.
Figure 3.
Sample size calculation setting.
- Respondent Demographic Profile
This section presents a detailed analysis of the demographic characteristics of the respondents based on the data collected from the survey. The demographic variables provide insights into the background and context of the participants, which are essential for interpreting the study’s findings and ensuring the representativeness of the sample. Specifically, the analysis covers multiple dimensions, including the location of the company, the respondent’s position or designation, nationality, years of work experience, and the company’s field or sector. Additional information was also gathered regarding company classification, the level of sustainable service implementation (either calibration or testing laboratories), satisfaction with sustainable service practices (based on ISO/IEC 17025 compliance), and a self-reported sustainable service performance score on a scale from 1 to 5. Moreover, the type of calibration and maintenance services offered by each company was documented to contextualize the operational environment. Hence, the following subsections offer a comprehensive breakdown of each demographic attribute, supported by descriptive statistics such as frequencies and percentages. Where appropriate, data are presented in tabular or figure format to enhance clarity. These demographic insights not only establish the relevance of the sample population but also form a basis for interpreting relationships among key variables in the study.
- Company Base/Location
The dataset includes responses from individuals working in companies based in two Gulf Cooperation Council (GCC) countries: the Kingdom of Saudi Arabia and the Kingdom of Bahrain. As shown in Table 15, out of the total 494 respondents, the majority, 301 individuals (60.93%), were from Saudi, while 193 respondents (39.06%) were from Bahrain. This distribution reflects a fairly balanced geographical representation, providing a robust basis for obtaining insights from these two nations in the context of calibration and testing service sustainability.
Table 15.
Company location of the study respondents.
- Respondent Position/Designation
The respondents hold a variety of professional roles within their respective organizations, reflecting a diverse range of operational perspectives, as presented in Figure 4. The most common roles are Technician (15.18%), Quality Controller (14.37%), and Quality Manager (13.97%), followed closely by Engineers (13.77%). These top positions collectively represent over half (57.29%) of the entire respondent pool, suggesting that the responses are heavily informed by individuals with technical and quality assurance expertise.
Figure 4.
Respondent position or designation.
Author Contributions
Conceptualization, M.W.D.D. and M.D.; methodology, M.W.D.D.; SPSS. Version 24 and Smart PLS 0.4 software analyzing process, N.M.Y.; Analytical and statics validation process, M.D., N.H.A.-k. and H.S.; formal analysis, M.D.; investigation, N.H.A.-k.; resources, M.W.D.D.; data curation, M.D.; writing—original draft preparation, M.W.D.D.; writing—review and editing, N.H.A.-k., N.M.Y. and M.N.A.-A.; visualization, M.N.A.-A.; supervision, M.D.; project administration, M.D.; funding acquisition, M.N.A.-A. All authors have read and agreed to the published version of the manuscript.
Funding
Research Management Center (RMC), Multimedia University (MMU).
Institutional Review Board Statement
Ethical review and approval were waived for this study by the Institution Committee as per the Guidelines for Ethical Review of Clinical Research or Research Involving Human Subjects (available online: https://mohre.um.edu.my/img/files/Guidelines%20For%20Ethical%20Review%20Of%20Clinical%20Research%20Or%20Research%20Involving%20Human%20Subjects.pdf, accessed on 1 July 2026).
Informed Consent Statement
Informed consent for participation was obtained from all subjects involved in the study.
Data Availability Statement
The original contributions presented in this study are included in the article. Further inquiries can be directed to the corresponding authors.
Acknowledgments
The authors express their gratitude to the Research Management Centre (RMC), Multimedia University (MMU) and Universiti Teknikal Malaysia (UTeM) for their valuable support in this research.
Conflicts of Interest
The authors declare no conflict of interest.
References
- Karthiyayini, N.; Rajendran, C. An Approach for Benchmarking Service Excellence in Accredited Services of Indian Calibration and Testing Laboratories. In Proceedings of the Materials Today: Proceedings; Elsevier Ltd.: Amsterdam, The Netherlands, 2021; Volume 46, pp. 8218–8225. [Google Scholar]
- Hou, M.; Song, D.L.; Shi, Z.L.; Yuan, Z.M. Quality Management in a High-Containment Laboratory. J. Biosaf. Biosecur. 2019, 1, 34–38. [Google Scholar] [CrossRef] [Scilit]
- Cobelli, N.; Chiarini, A. Improving Customer Satisfaction and Loyalty through MHealth Service Digitalization: New Challenges for Italian Pharmacists. TQM J. 2020, 32, 1541–1560. [Google Scholar] [CrossRef] [Scilit]
- Kumar Jena, S.; Singhal, D. Optimizing the Competitive Sustainable Process and Pricing Decision of Digital Supply Chain: A Power-Balance Perspective. Comput. Ind. Eng. 2023, 177, 109054. [Google Scholar] [CrossRef] [Scilit]
- Mahdi, A.M.; Alomari, K.; Naser, I.H. Development the Quality Management System in Construction Central Laboratory of the Engineering Consulting Bureau in Engineering College/Thi-Qar University According to International Standard (ISO 17025). Solid State Technol. 2021, 64, 1752–1765. [Google Scholar]
- Al-Alqam, M.S.; Rehman, A.U.; Alsultan, M. Sustainability Indexing Model for Saudi Manufacturing Organizations. Sustainability 2023, 15, 953. [Google Scholar] [CrossRef] [Scilit]
- Tseng, M.L.; Wu, K.J.; Chiu, A.S.; Lim, M.K.; Tan, K. Reprint of: Service Innovation in Sustainable Product Service Systems: Improving Performance under Linguistic Preferences. Int. J. Prod. Econ. 2019, 217, 159–170. [Google Scholar] [CrossRef] [Scilit]
- Abdullah, K.H.; Abd Aziz, F.S. Safety Behaviour in the Laboratory among Chemical Engineering Students: An S-O-R Paradigm. Test Eng. Manag. 2020, 83, 22330–22346. [Google Scholar]
- Yu, Z.; Klongthong, W.; Thavorn, J.; Ngamkroeckjoti, C. Understanding Rural Chinese Consumers’ Behavior: A Stimulus–Organism–Response (S-O-R) Perspective on Huawei’s Brand Loyalty in China. Cogent Bus. Manag. 2021, 8, 1880679. [Google Scholar] [CrossRef] [Scilit]
- Kim, S.; Choi, B.; Lew, Y. Where Is the Age of Digitalization Heading? The Meaning, Characteristics and Implications of Contemporary Digital Transformation. Sustainability 2021, 13, 8909. [Google Scholar] [CrossRef] [Scilit]
- Min, Y.; Tan, C.C. A Stimulus-Organism-Response (S-O-R) Framework for Live Streaming Commerce with a Socio-Technical Perspective. Int. J. Arts Soc. Sci. 2022, 5, 118–140. [Google Scholar]
- Nadella, G.S.; Pillai, S.E.V.S. Examining the Indirect Impact of Information and System Quality on the Overall Educators’ Use of E-Learning Tools: A PLS-SEM Analysis. In Proceedings of the SoutheastCon 2024; IEEE: New York, NY, USA, 2024; pp. 360–366. [Google Scholar]
- Oakland, J.S. Total Quality Management and Operational Excellence: Text with Cases; Routledge: London, UK, 2014; ISBN 1315815729. [Google Scholar]
- Mehrabian, A.; Russell, J.A. The Basic Emotional Impact of Environments. Percept. Mot. Ski. 1974, 38, 283–301. [Google Scholar] [CrossRef] [Scilit] [PubMed]
- Parasuraman, A.; Zeithaml, V.A.; Berry, L. SERVQUAL: A Multiple-Item Scale for Measuring Consumer Perceptions of Service Quality. J. Retail. 1988, 64, 12–40. [Google Scholar]
- Takegawa, N.; Furuichi, N. Traceability Management System Using Blockchain Technology and Cost Estimation in the Metrology Field. Sensors 2023, 23, 1673. [Google Scholar] [CrossRef] [Scilit] [PubMed]
- Koval, M.; Tesař, J.; Schönhals, S.; Sharma, A.; Balslev-Harder, D.; Galvan-Hernandez, C.; Baumann, H.; Mahovský, D. Digital Calibration Certificates (DCC): Benefits and Challenges to Overcome for Implementation. In Proceedings of the EPJ Web of Conferences; EDP Sciences: Les Ulis, France, 2025; Volume 323. [Google Scholar]
- Zha, Z.; Ge, H.; Zou, C.; Long, F.; He, X.; Wu, G.; Dong, C.; Deng, T.; Xu, J. Synchronous Remote Calibration for Electricity Meters: Application and Optimization. Appl. Sci. 2025, 15, 1259. [Google Scholar] [CrossRef] [Scilit]
- Verhoef, P.C.; Broekhuizen, T.; Bart, Y.; Bhattacharya, A.; Qi Dong, J.; Fabian, N.; Haenlein, M. Digital Transformation: A Multidisciplinary Reflection and Research Agenda. J. Bus. Res. 2021, 122, 889–901. [Google Scholar] [CrossRef] [Scilit]
- Vial, G. Understanding Digital Transformation: A Review and a Research Agenda. J. Strateg. Inf. Syst. 2019, 28, 118–144. [Google Scholar] [CrossRef] [Scilit]
- Darwish, M.W.D.; Doheir, M.; Al-Kumaim, N.H.S.; Saleh, H.; Yaacob, N.M. Optimizing Customer Satisfaction Through Sustainable Service Quality in ISO 17025 Accredited Calibration Laboratories. Int. J. Sustain. Dev. Plan. 2024, 19, 4843–4849. [Google Scholar] [CrossRef] [Scilit]
- Manser Payne, E.H.; Dahl, A.J.; Peltier, J. Digital Servitization Value Co-Creation Framework for AI Services: A Research Agenda for Digital Transformation in Financial Service Ecosystems. J. Res. Interact. Mark. 2021, 15, 200–222. [Google Scholar] [CrossRef] [Scilit]
- Agbim, A.; Schumacher, K.A.; Sharp, N.; Paul, R.; Corzo, R. Elemental Characterization of Electronic Waste: A Review of Research Methodologies and Applicability to the Practice of e-Waste Recycling. Waste Manag. 2024, 187, 91–100. [Google Scholar] [CrossRef] [Scilit] [PubMed]
- Alshareef, H. Space Optimization and Process Improvement; Edustream Academic Publishers: Johor Bahru, Malaysia, 2019. [Google Scholar]
- Engel, T.; Popescu, A. GEMIMEG—Digitalization of Calibration Processes in Metrology. In Proceedings of the Measurement: Sensors; Elsevier Ltd.: Amsterdam, The Netherlands, 2025. [Google Scholar]
- Cundeva-Blajer, M.; Nakova, M.; Cundeva, S. A Contribution to Sustainability—Towards Green Calibration Laboratory for Electrical Instruments. Meas. Sens. 2025, 38, 101619. [Google Scholar] [CrossRef] [Scilit]
- Yıldırım, N.; Karaca, A.; Cangur, S.; Acıkgoz, F.; Akkus, D. The Relationship between Educational Stress, Stress Coping, Self-Esteem, Social Support, and Health Status among Nursing Students in Turkey: A Structural Equation Modeling Approach. Nurse Educ. Today 2017, 48, 33–39. [Google Scholar] [CrossRef] [Scilit] [PubMed]
- Ringle, C.M.; Sarstedt, M.; Mitchell, R.; Gudergan, S.P. Partial Least Squares Structural Equation Modeling in HRM Research. Int. J. Hum. Resour. Manag. 2020, 31, 1617–1643. [Google Scholar] [CrossRef] [Scilit]
- Trainor, K.J.; Andzulis, J.M.; Rapp, A.; Agnihotri, R. Social Media Technology Usage and Customer Relationship Performance: A Capabilities-Based Examination of Social CRM. J. Bus. Res. 2014, 67, 1201–1208. [Google Scholar] [CrossRef] [Scilit]
- Paramita, I.; El Adawiyah, S. Model Customer Relationship Management Dalam Komunikasi Bisnis pt Kalibrasi Instrumen Bersama. Perspekt. Komun. J. Ilmu Komun. Polit. Dan Komun. 2021, 5, 140–152. [Google Scholar] [CrossRef] [Scilit]
- Zenarolla, A. Italian Sociological Review National Plan of Recovery and Resilience and Digitalization of Public Administrations: New Opportunities for Old Challenges for Social Work. Ital. Sociol. Rev. 2023, 2023, 51–68. [Google Scholar] [CrossRef]
- Baashar, Y.; Alhussian, H.; Patel, A.; Alkawsi, G.; Alzahrani, A.I.; Alfarraj, O.; Hayder, G. Customer Relationship Management Systems (CRMS) in the Healthcare Environment: A Systematic Literature Review. Comput. Stand. Interfaces 2020, 71, 103442. [Google Scholar] [CrossRef] [Scilit] [PubMed]
- Danacı, E.; Aydemir, B. Investigation of Digital Calibration Certificate-Digital Test Report Sharing in Metrology Network. Sak. Univ. J. Comput. Inf. Sci. 2024, 7, 314–324. [Google Scholar]
- Oliveira Ruggi, M.; Cavalcante Nascimento, T. Innovation in Companies with Sustainability Certification: Elements of Its Convergence; International Development Research Centre (IDRC): Ottawa, ON, Canada, 2020. [Google Scholar]
- Shau, T.V. The Confirmatory Factor Analysis (CFA) of Preschool Management Model in Sarawak. Int. J. Acad. Res. Bus. Soc. Sci. 2017, 7, 221–231. [Google Scholar] [CrossRef] [Scilit] [PubMed]
- Hair, J.F., Jr.; Babin, B.J.; Krey, N. Covariance-Based Structural Equation Modeling in the Journal of Advertising: Review and Recommendations. J. Advert. 2017, 46, 163–177. [Google Scholar] [CrossRef] [Scilit]
- Tang, W.; Cui, Y.; Babenko, O. Internal Consistency: Do We Really Know What It Is and How to Assess It. J. Psychol. Behav. Sci. 2014, 2, 205–220. [Google Scholar]
- Costa, A.J.; Curi, D.; Bandeira, A.M.; Ferreira, A.; Tomé, B.; Joaquim, C.; Santos, C.; Góis, C.; Meira, D.; Azevedo, G. Literature Review and Theoretical Framework of the Evolution and Interconnectedness of Corporate Sustainability Constructs. Sustainability 2022, 14, 4413. [Google Scholar] [CrossRef] [Scilit]
- Heale, R.; Twycross, A. Validity and Reliability in Quantitative Studies. Evid. Based. Nurs. 2015, 18, 66–67. [Google Scholar] [CrossRef] [Scilit] [PubMed]
- Zalma, A.R.; Safiah, M.Y.; Ajau, D.; Khairil Anuar, M.I. Reliability and Validity of Television Food Advertising Questionnaire in Malaysia. Health Promot. Int. 2015, 30, 523–530. [Google Scholar] [CrossRef] [Scilit] [PubMed][Green Version]
- Cho, G.; Hwang, H.; Sarstedt, M.; Ringle, C.M. Cutoff Criteria for Overall Model Fit Indexes in Generalized Structured Component Analysis. J. Mark. Anal. 2020, 8, 189–202. [Google Scholar] [CrossRef] [Scilit]
- Memon, A.H.; Rahman, I.A. SEM-PLS Analysis of Inhibiting Factors of Cost Performance for Large Construction Projects in Malaysia: Perspective of Clients and Consultants. Sci. World J. 2014, 2014, 165158. [Google Scholar] [CrossRef] [Scilit] [PubMed]
- Sarstedt, M.; Ringle, C.M.; Hair, J.F. Partial Least Squares Structural Equation Modeling. In Handbook of Market Research; Springer: Berlin/Heidelberg, Germany, 2021; pp. 587–632. [Google Scholar]
- Fornell, C.; Larcker, D.F. Structural Equation Models with Unobservable Variables and Measurement Error: Algebra and Statistics. J. Mark. Res. 1981, 18, 39–50. [Google Scholar] [CrossRef] [Scilit]
- Batterton, K.A.; Hale, K.N. The Likert Scale What It Is and How to Use It. Phalanx 2017, 50, 32–39. [Google Scholar]
- Henseler, J.; Ringle, C.M.; Sinkovics, R.R. The Use of Partial Least Squares Path Modeling in International Marketing. In New Challenges to International Marketing; Emerald Group Publishing Limited: Leeds, UK, 2009; Volume 20, pp. 277–319. ISBN 1848554680. [Google Scholar]
- Tsang Chi Chung, R.; Lau Sau Ying, J.; Kwong So Fong, S.; So Ming Loi, E.; Law Ka Yee, R.; Wong Fu Yan, T.; Lee Wai Chi, E. Reliability, Construct and Predictive Validity of the Hong Kong Chinese Orebro Musculoskeletal Pain Screening Questionnaire. J. Occup. Rehabil. 2017, 27, 584–592. [Google Scholar] [CrossRef] [Scilit] [PubMed]
- Wong, F.K.Y.; Ng, A.Y.M.; Lee, P.H.; Lam, P.; Ng, J.S.C.; Ng, N.H.Y.; Sham, M.M.K. Effects of a Transitional Palliative Care Model on Patients with End-Stage Heart Failure: A Randomised Controlled Trial. Heart 2016, 102, 1100–1108. [Google Scholar] [CrossRef] [Scilit] [PubMed]
- Henseler, J.; Ringle, C.M.; Sarstedt, M. A New Criterion for Assessing Discriminant Validity in Variance-Based Structural Equation Modeling. J. Acad. Mark. Sci. 2015, 43, 115–135. [Google Scholar] [CrossRef] [Scilit]
- Henseler, J.; Dijkstra, T.K.; Sarstedt, M.; Ringle, C.M.; Diamantopoulos, A.; Straub, D.W.; Ketchen, D.J., Jr.; Hair, J.F.; Hult, G.T.M.; Calantone, R.J. Common Beliefs and Reality about PLS: Comments on Rönkkö and Evermann (2013). Organ. Res. Methods 2014, 17, 182–209. [Google Scholar]
- Franke, G.; Sarstedt, M. Heuristics versus Statistics in Discriminant Validity Testing: A Comparison of Four Procedures. Internet Res. 2019, 29, 430–447. [Google Scholar] [CrossRef] [Scilit]
- Hair, J.; Alamer, A. Partial Least Squares Structural Equation Modeling (PLS-SEM) in Second Language and Education Research: Guidelines Using an Applied Example. Res. Methods Appl. Linguist. 2022, 1, 100027. [Google Scholar] [CrossRef] [Scilit]
- Nunnally, J.C.; Bernstein, I.H. Psychometric Theory, 3rd ed.; McGraw-Hill: New York, NY, USA, 1994; ISBN 9780070478497. [Google Scholar]
- Ullman, J.B.; Bentler, P.M. Structural Equation Modeling. In Handbook of Psychology, Second Edition; John Wiley & Sons: Hoboken, NJ, USA, 2012; Volume 2. [Google Scholar]
- Vatcheva, K.P.; Lee, M.; McCormick, J.B.; Rahbar, M.H. Multicollinearity in Regression Analyses Conducted in Epidemiologic Studies. Epidemiology 2016, 6, 227. [Google Scholar] [CrossRef] [PubMed]
- Hair, J.F.; Risher, J.J.; Sarstedt, M.; Ringle, C.M. When to Use and How to Report the Results of PLS-SEM. Eur. Bus. Rev. 2019, 31, 2–24. [Google Scholar] [CrossRef] [Scilit]
- Nagelkerke, N.J.D. A Note on a General Definition of the Coefficient of Determination. Biometrika 1991, 78, 691–692. [Google Scholar] [CrossRef]
- Cohen, J. Statistical Power Analysis for the Behavioral Sciences, 2nd ed.; Routledge: New York, NY, USA, 2013; ISBN 0203771583. [Google Scholar]
- Dash, G.; Paul, J. CB-SEM vs. PLS-SEM Methods for Research in Social Sciences and Technology Forecasting. Technol. Forecast. Soc. Change 2021, 173, 121092. [Google Scholar] [CrossRef] [Scilit]
- Hooper, D.; Coughlan, J.; Mullen, M. Evaluating Model Fit: A Synthesis of the Structural Equation Modelling Literature. In Proceedings of the 7th European Conference on Research Methodology for Business and Management Studies, London, UK, 19–20 June 2008; Volume 2008, pp. 195–200. [Google Scholar]
- Ahmed, S.; Bahram, B.; Razzaq, S.; Dost, D.; Ali, M. Developing a PLS-SEM Model to Identify Risk Management Strategies in Construction Contracts: A Case Study in Public Sector Construction of Pakistan. Constr. Technol. Archit. 2025, 17, 205–211. [Google Scholar] [CrossRef] [Scilit]
- Faul, F.; Erdfelder, E.; Lang, A.-G.; Buchner, A. G* Power 3: A Flexible Statistical Power Analysis Program for the Social, Behavioral, and Biomedical Sciences. Behav. Res. Methods 2007, 39, 175–191. [Google Scholar] [CrossRef] [Scilit] [PubMed]
- Faul, F.; Erdfelder, E.; Buchner, A.; Lang, A.-G. Statistical Power Analyses Using G* Power 3.1: Tests for Correlation and Regression Analyses. Behav. Res. Methods 2009, 41, 1149–1160. [Google Scholar] [CrossRef] [Scilit] [PubMed]
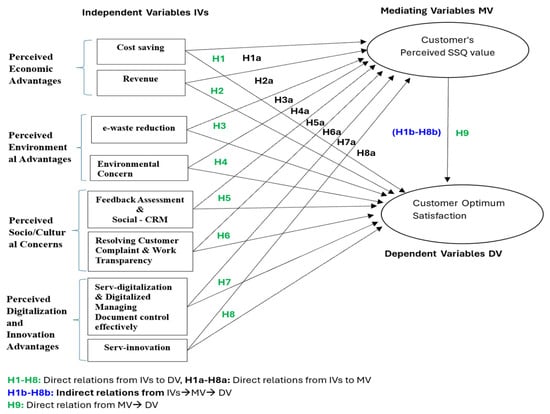
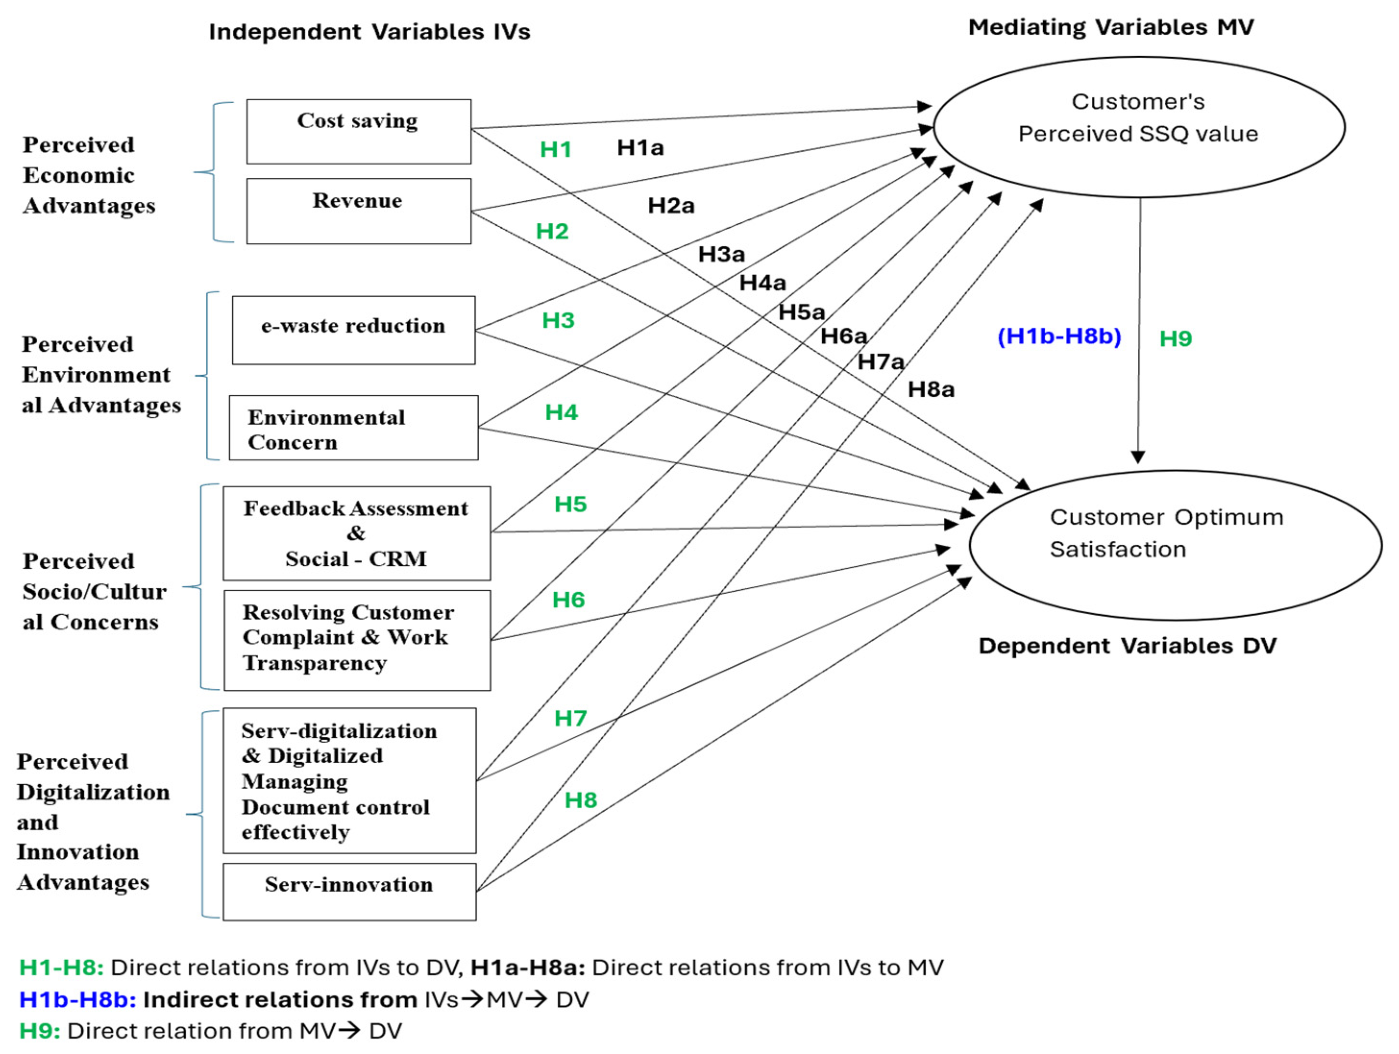
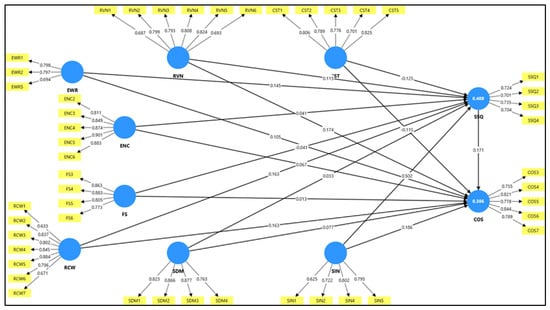
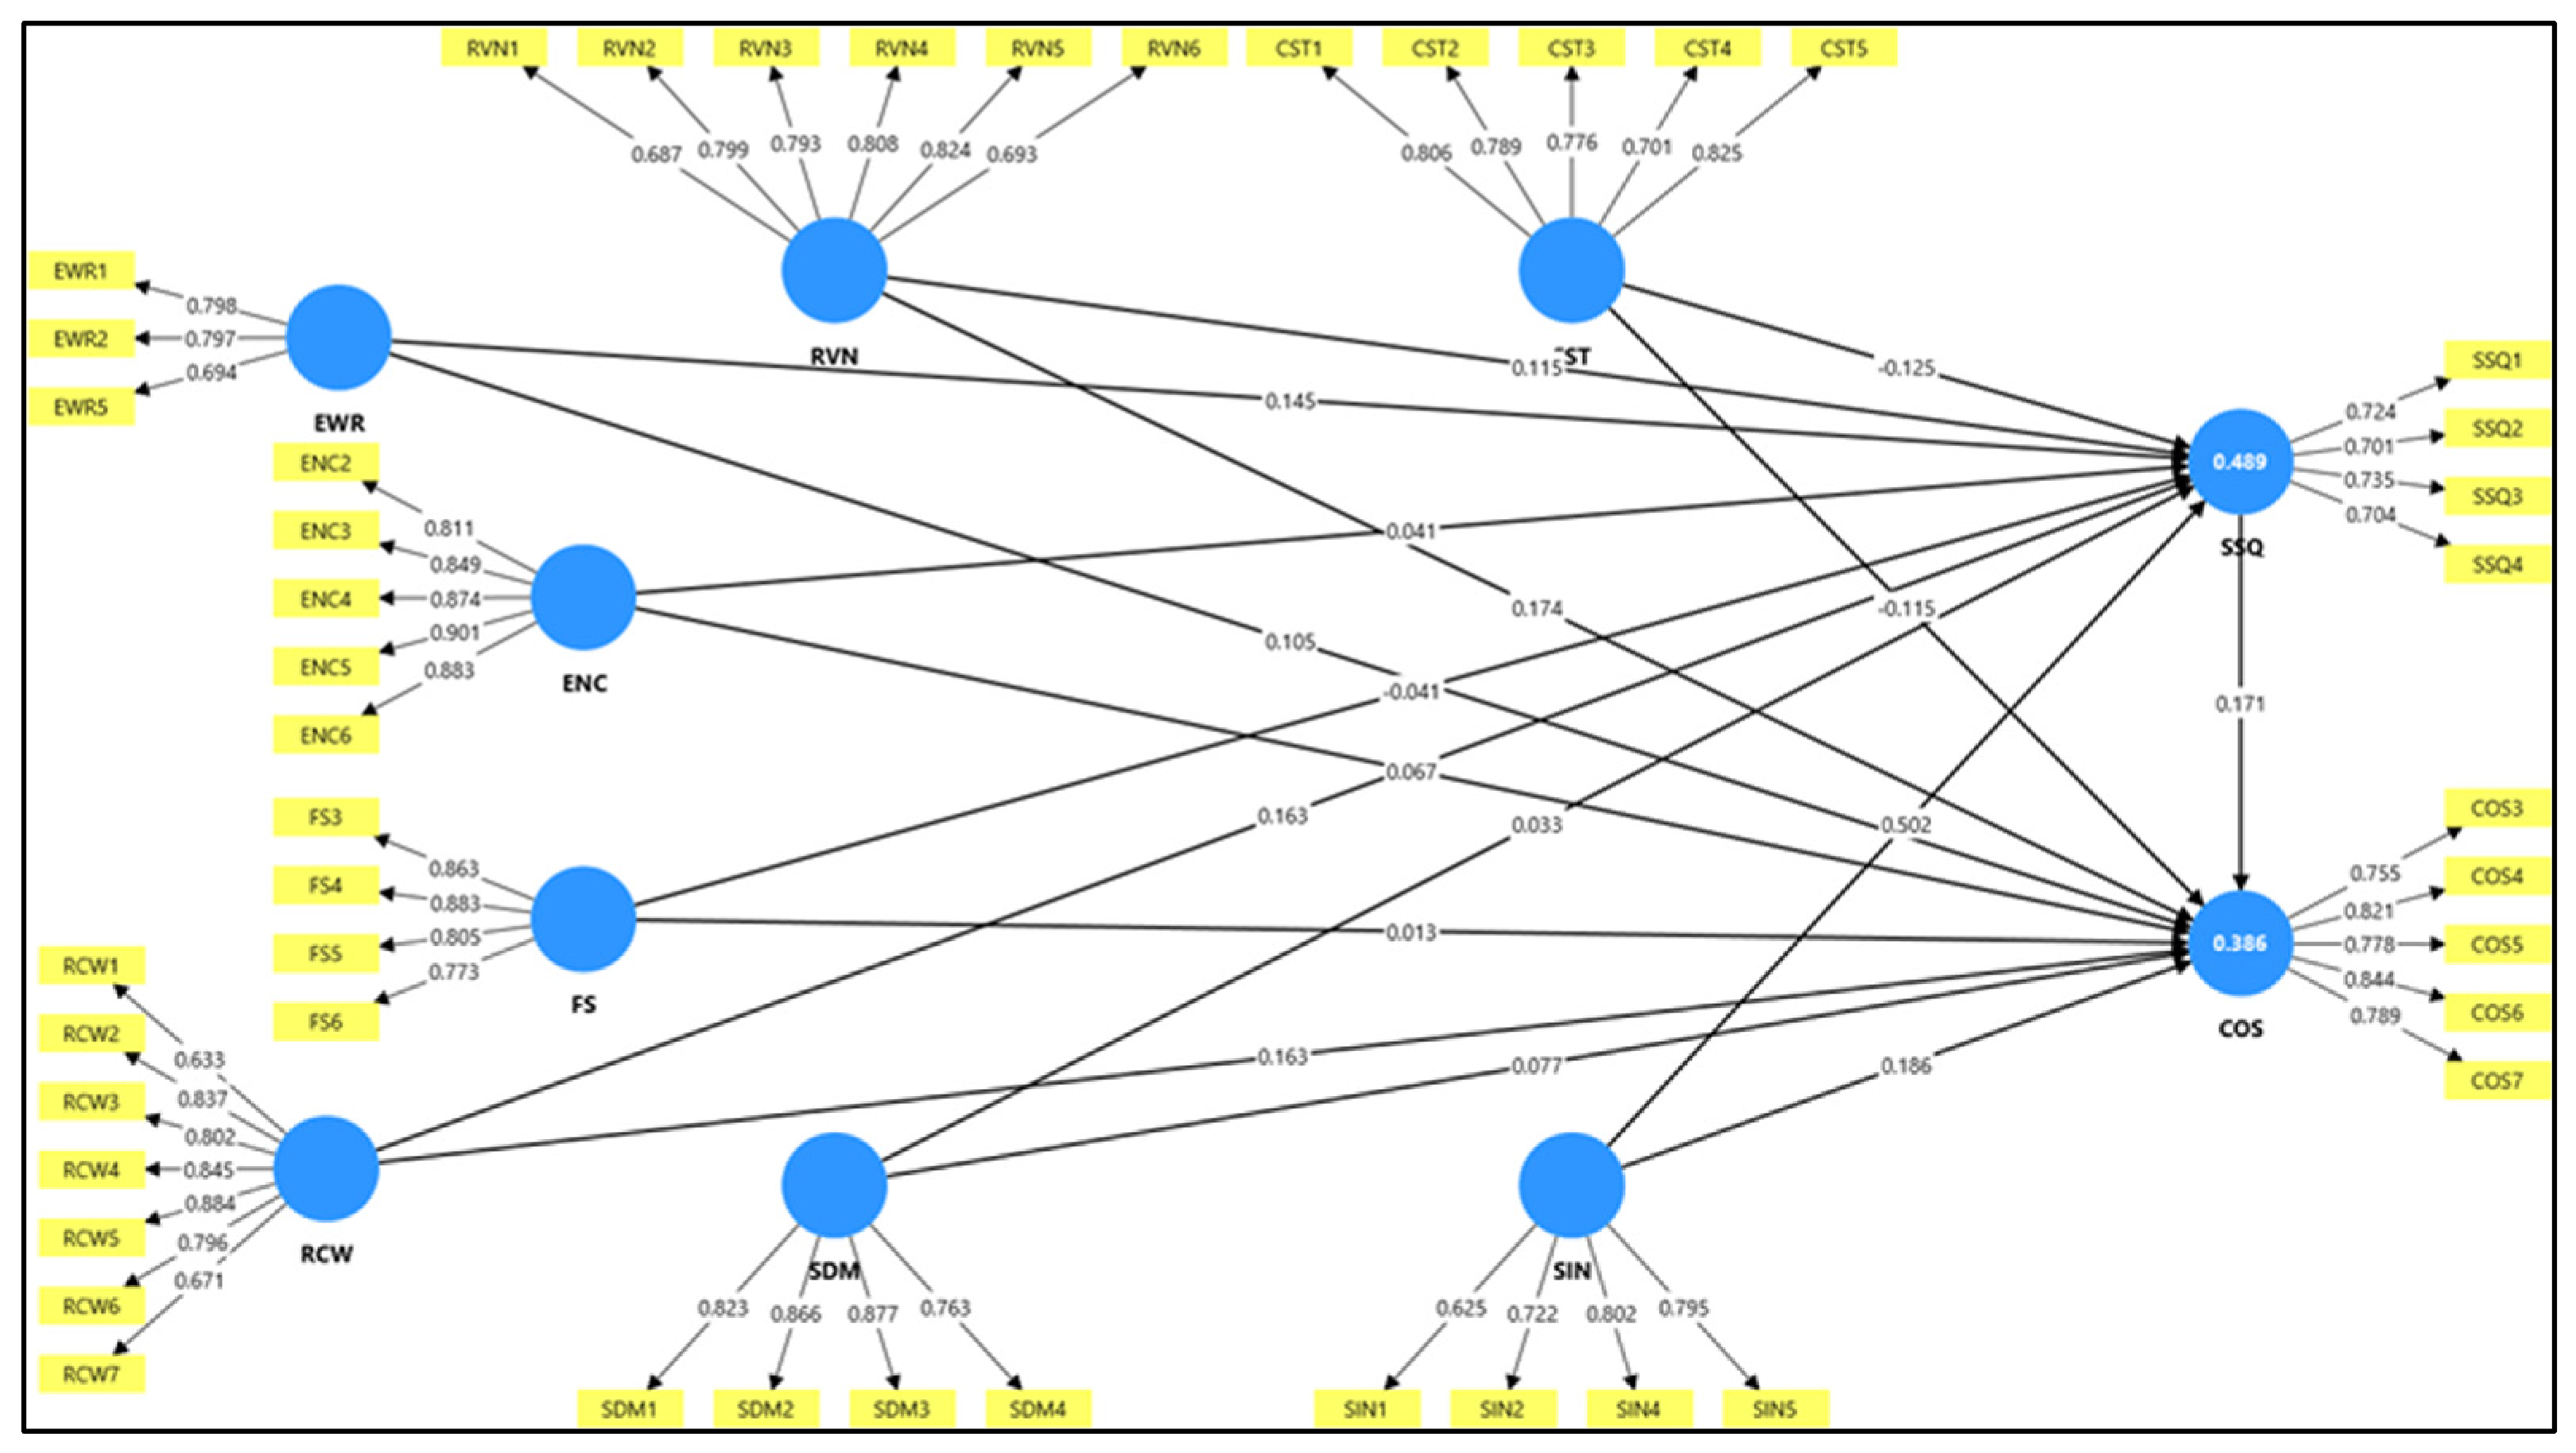
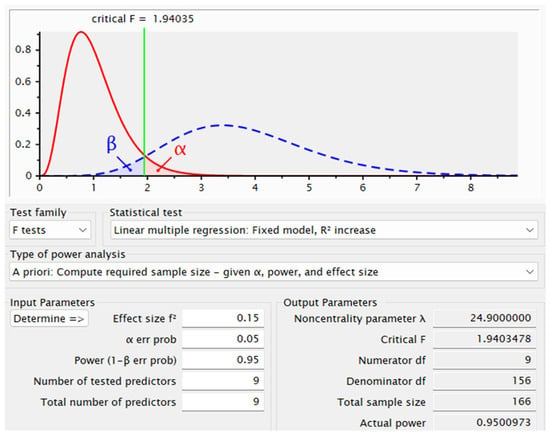
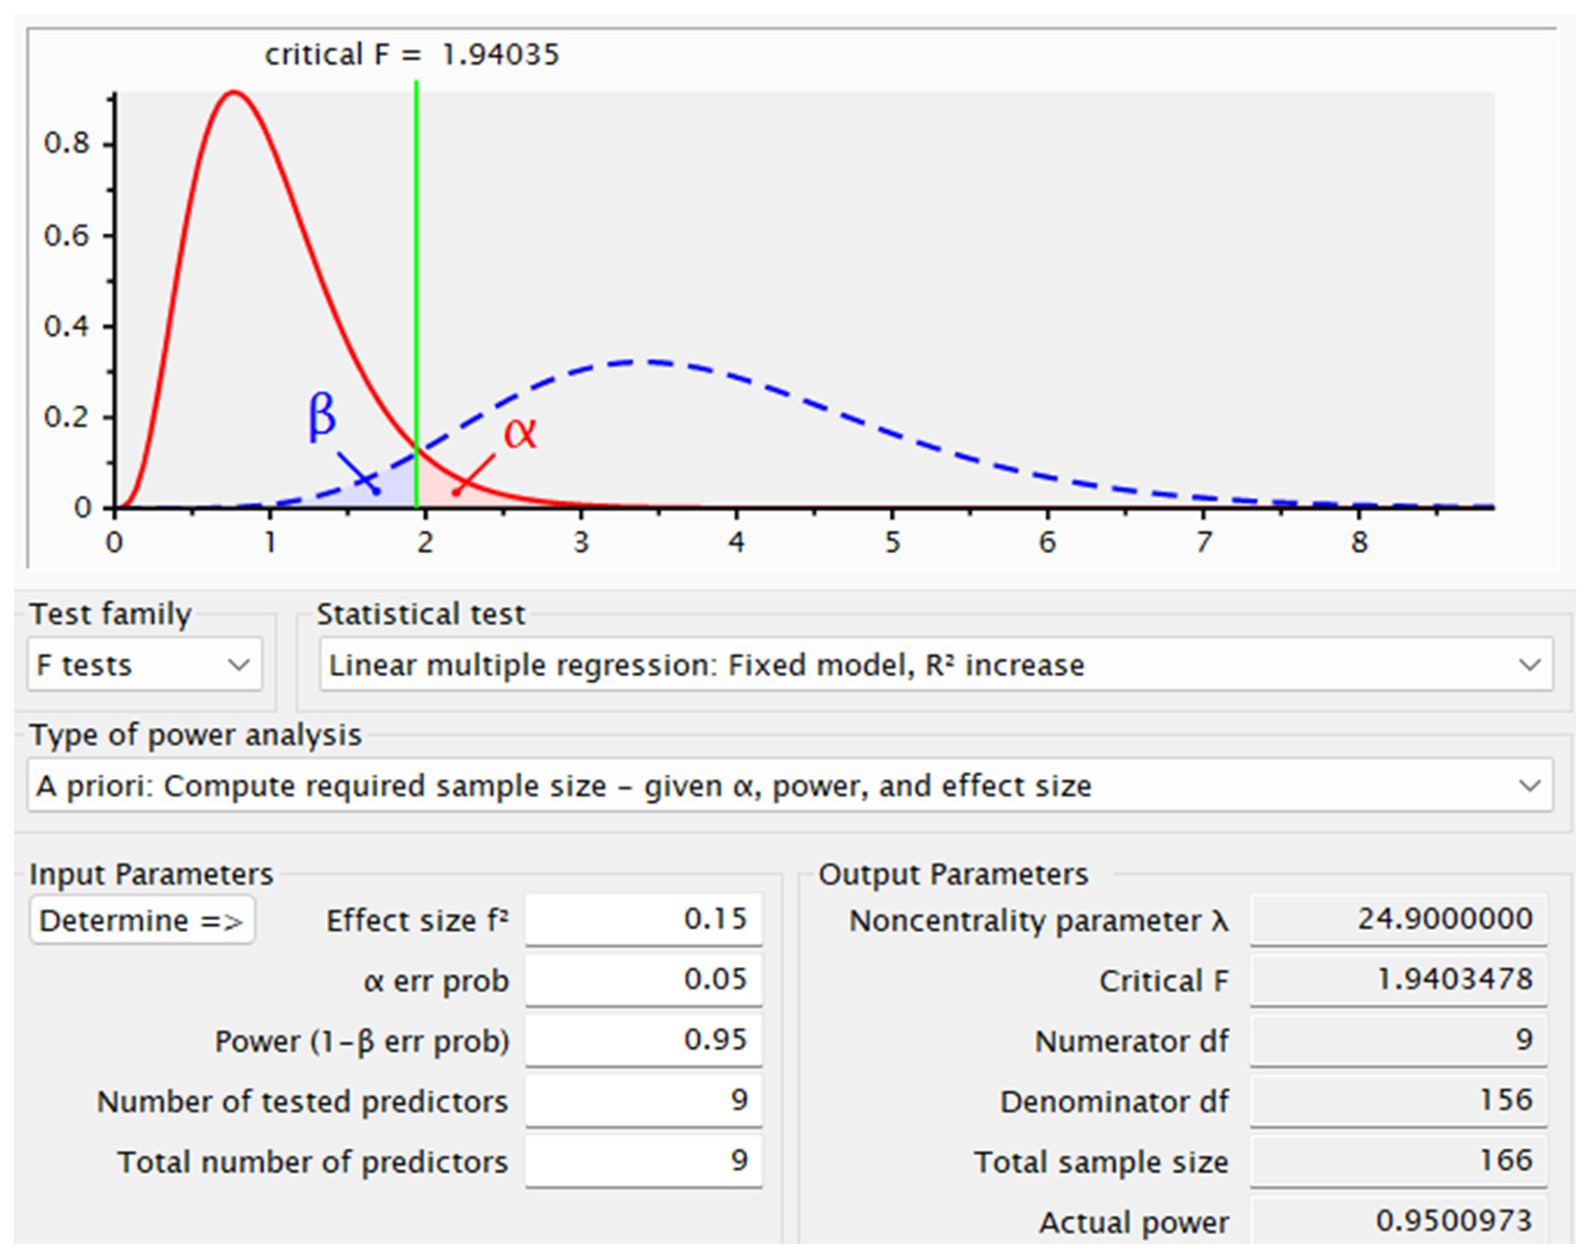
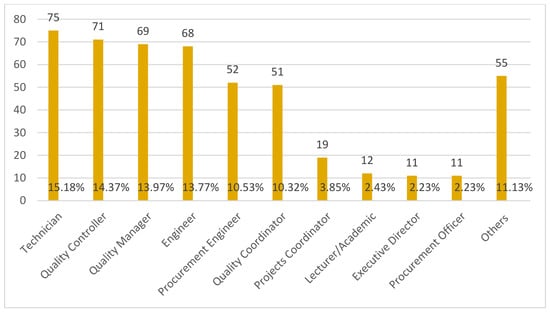
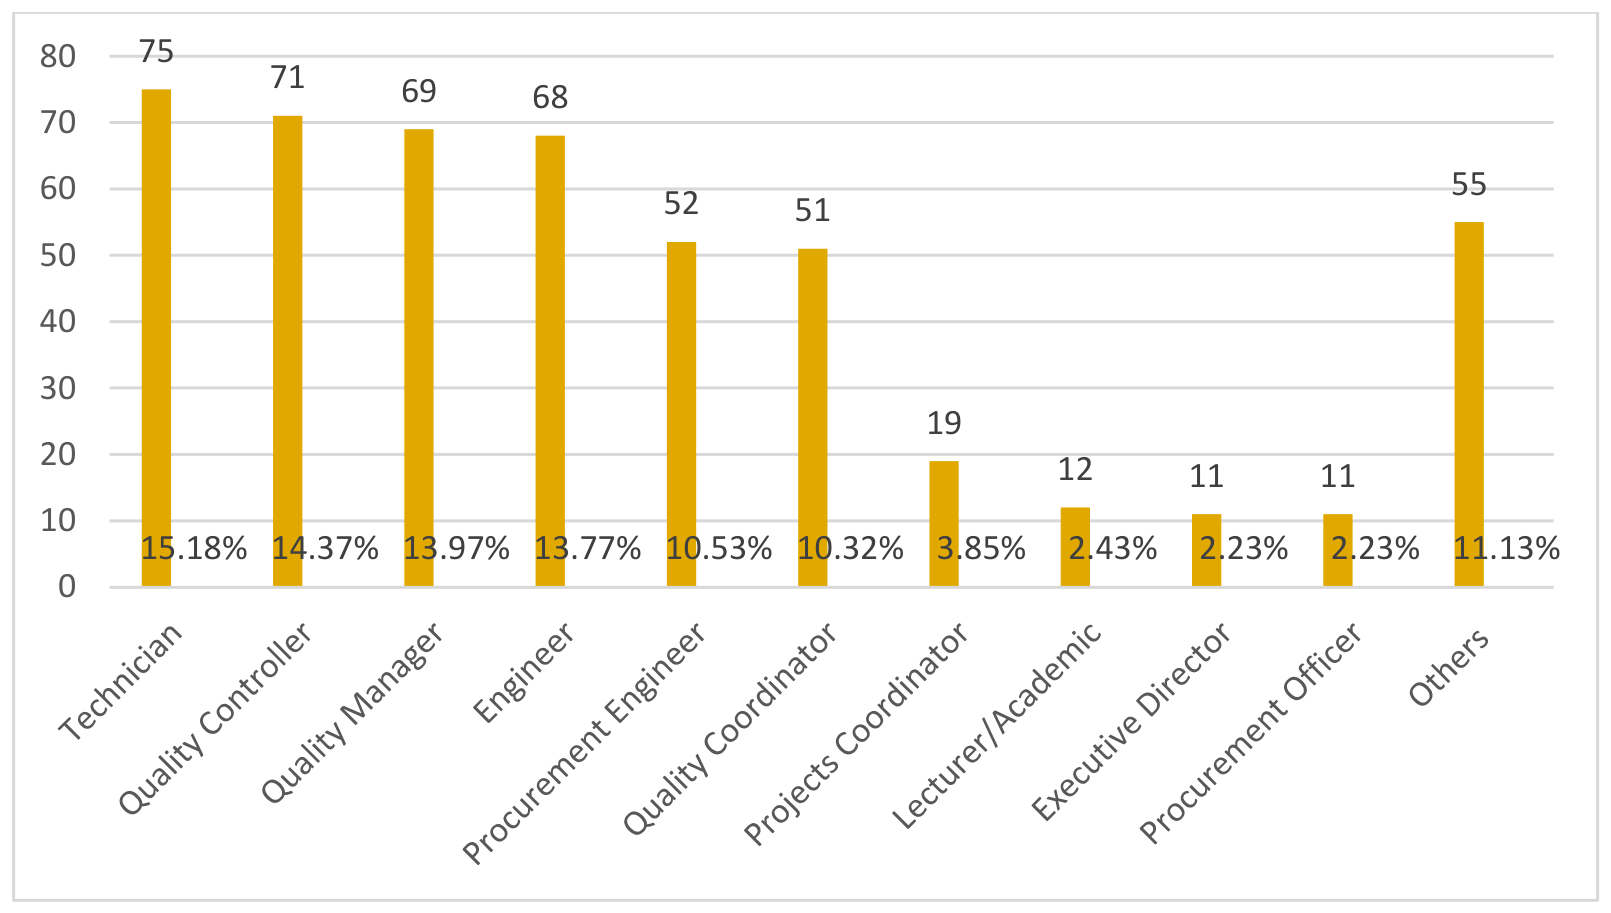

Disclaimer/Publisher’s Note: The statements, opinions and data contained in all publications are solely those of the individual author(s) and contributor(s) and not of MDPI and/or the editor(s). MDPI and/or the editor(s) disclaim responsibility for any injury to people or property resulting from any ideas, methods, instructions or products referred to in the content. |
© 2026 by the authors. Licensee MDPI, Basel, Switzerland. This article is an open access article distributed under the terms and conditions of the Creative Commons Attribution (CC BY) license.