


Abstract
Shared energy storage can improve the economic and operational sustainability of renewable energy stations through coordinated management of forecast deviations and enhanced integration of green-power in the grid. However, independent deviation management may overestimate storage rental demand, fixed contracts have uncertain ex-post performance, and benefit allocation may not reflect realized settlement. This paper proposes a day-ahead shared energy storage rental and benefit allocation framework integrating deviation netting and ex-post settlement. Expected station-level deviations are first netted, and rented power and energy capacities are optimized against the residual deviations. A Stackelberg game then determines the operator’s rental prices and the alliance’s capacity response, thereby forming a fixed day-ahead contract. Cooperative incremental benefits are calculated from out-of-sample ex-post operating costs and allocated using a Shapley method with individual-rationality constraints. Under the examined case study settings, expected deviation netting reduces the rented power capacity by 43.50%, increases the rented energy capacity by 33.87%, and decreases the alliance’s expected total cost by 12.84%. In the independent 1000-day out-of-sample evaluation, the S2 contract reduces the mean cost relative to the S1 contract by 5.97% and is less costly than S1 on 94.90% of the test days. The resulting Shapley allocation satisfies efficiency, budget balance, individual rationality, and the core constraints under the examined conditions, supporting sustainable resource utilization in renewable power systems.
1. Introduction
As wind and photovoltaic penetration continues to increase, renewable energy producers are becoming active market participants by submitting day-ahead schedules and assuming financial responsibility for deviations between scheduled and realized generation [1,2]. Weather-driven forecast errors make such deviations unavoidable, exposing renewable producers to imbalance penalties, costly electricity purchases for generation shortfalls, and discounted sales of surplus electricity [3,4]. Energy storage can mitigate this exposure through fast power regulation and intertemporal energy shifting. However, station-level storage deployment requires substantial investment and may fail to exploit complementary deviation patterns across geographically and technologically diverse renewable plants [5]. Shared energy storage (SES) pools storage resources and provides multiple users with power and energy capacity services, thereby lowering access costs, improving asset utilization, and facilitating the integration of variable renewable generation [6,7].
Research on the market-oriented operation of SES has primarily addressed capacity configuration, rental pricing, coordinated operation, and benefit allocation [8,9]. Stackelberg games have been widely used to characterize the leader–follower relationship between an SES operator and renewable producers. In such models, the operator determines the rental price, while users optimize their rented capacity and operating strategies in response to that price [10,11]. Recent studies have incorporated multiple pricing packages and two-part tariffs for power and energy capacity into SES rental models [12]. Other models have considered storage degradation, multi-market participation, and renewable-generation uncertainty [13]. Commercial operating mechanisms have also been developed to coordinate SES services with the electricity transactions of renewable energy stations [14], while multi-microgrid studies have examined the economic, social, and environmental effects of storage sharing under supply–demand uncertainty [15]. An hourly-resolution capacity-sharing market has been proposed to coordinate day-ahead SES rental and real-time dispatch for clustered renewable-storage plants [16]. A two-stage market-oriented leasing strategy has also been developed to account for the rental demand of wind farm clusters and multiple uncertainties [17]. These studies establish an important foundation for modelling the interaction between rental prices and storage demand. Nevertheless, representative studies have either allowed individual renewable plants to determine their own storage capacity bids within a shared rental market [16] or coordinated multiple renewable generators through a centralized aggregate planning model [18]. Although these studies have considered renewable generation uncertainty and aggregation benefits, neither explicitly embeds the simultaneous netting of positive and negative station-level forecast deviations into the alliance’s price-responsive rental decision. Consequently, simultaneously occurring surpluses and shortfalls may be treated as separate storage requirements, thereby overstating the alliance’s rented power and energy capacities. This overestimation may further distort the SES operator’s two-part pricing response and cause the resulting day-ahead contract to be formed on an inflated rental demand basis. The alliance may therefore incur unnecessary rental expenditure, while the economic value of SES may be inaccurately assessed. This is how deviation netting propagates through the alliance’s rental response to the operator’s pricing decision, and the resulting Stackelberg equilibrium remains unresolved.
Deviation netting also has a distinct temporal dimension. At the day-ahead stage, actual generation is unavailable; therefore, the potential for deviation netting can only be estimated from historical joint deviation samples and their spatial and temporal dependence. This expected netting determines the residual deviations that need to be managed by rented storage. However, during actual operation, realized netting and storage dispatch need to be calculated from the deviations between actual output and the day-ahead schedule, which creates a mismatch between the day-ahead rental decision and the storage capacity actually required during operation. Two-stage and robust optimization models have been developed for renewable-energy clusters that lease SES and participate in electricity or green-power markets [19,20]. Related studies have considered the coordinated participation of storage in day-ahead and real-time balancing markets [21]. Dynamic rental mechanisms have also been proposed to revise storage capacity decisions when updated information becomes available [22]. A recent study integrated consortium-level day-ahead bidding, real-time deviation correction, SES leasing, and post-settlement revenue allocation for a wind farm consortium; however, the storage service price was prescribed, and the leasing cost was calculated from realized charging and discharging services [23]. Consequently, that framework did not investigate the interaction between an SES operator’s two-part pricing decision and an alliance’s power and energy capacity rental response. Moreover, adaptive or service-based rental arrangements differ from a fixed day-ahead contract in which the rental prices and quantities are determined before delivery and remain unchanged throughout actual operation [24]. Whether the imbalance cost savings produced by such a fixed contract are sufficient to cover its rental cost needs to therefore be examined using out-of-sample operating days that are independent of the scenarios used to make the day-ahead decision.
Beyond contract formation and operational execution, the allocation of cooperative benefits is essential for maintaining the stability of a renewable energy station alliance. Shapley value-based methods have been used to allocate the profits generated by SES-assisted virtual power plants and shared energy assets [25,26]. Cooperative game methods have also been applied to renewable energy distribution and internal energy trading in energy communities [27,28]. Contribution-related indicators have been introduced to account for differences among alliance members when allocating the benefits produced by renewable energy and SES cooperation [29]. Related research has optimized the coordinated scheduling of demand response and SES in smart community energy systems [30]. These studies demonstrate that coordinated operation can generate positive cooperative value. Efficiency, budget balance, and individual rationality are key criteria for evaluating the resulting allocation. Nevertheless, existing characteristic functions are commonly constructed from expected day-ahead profits, scheduled operating costs, or representative operating scenarios. Such formulations may not capture the value actually realized when a fixed rental contract is exposed to out-of-sample generation deviations and imbalance settlement. Moreover, calculating the Shapley allocation from expected benefits and subsequently distributing storage costs using a separate rule differs from constructing every coalition’s value directly from its coalition-specific ex-post operating cost. When expected and realized deviations differ, an allocation based only on expected results may therefore fail to ensure that every station remains better off than under independent operation. Recent work on energy demand forecasting has shown that hybrid statistical–machine learning models can improve predictive accuracy across different temporal resolutions [31,32], while adaptive-filtering research has emphasized convergence behavior and error-based performance evaluation [33]. These studies provide useful guidance for structured forecasting evaluation; however, they do not examine how multi-station forecast deviations propagate into SES rental equilibria, fixed-contract settlement, and cooperative benefit allocation.
To address these issues, this study proposes an SES rental game and benefit allocation framework for renewable energy station alliances that integrate forecast-deviation netting and ex-post settlement. The key contributions of this paper are threefold.
First, a joint deviation model incorporating spatial correlation and temporal continuity is developed to generate representative day-ahead scenarios. Expected deviation netting is distinguished from realized netting, and the alliance’s rental demand is determined from the residual deviations after expected netting. This avoids counting simultaneously occurring station-level surpluses and shortfalls as separate charging and discharging requirements.
Second, expected deviation netting is embedded in the lower-level rental response of a Stackelberg game. The SES operator determines the power and energy capacity prices, while the alliance responds by optimizing its rented power, rented energy capacity, and scenario-based storage operation, thereby forming a fixed day-ahead contract. During actual operation, the contract prices and rental quantities remain unchanged, and deviations are managed sequentially through internal netting, SES dispatch, imbalance charges, and real-time electricity transactions. Compared with adaptive or service-based rental arrangements, this fixed contract avoids ex-post revisions to the agreed prices and quantities and enables its economic performance to be evaluated under realized deviations.
Finally, the characteristic function of each coalition is constructed from its out-of-sample ex-post settlement cost under the common equilibrium rental prices. The resulting cooperative incremental benefit is allocated using a Shapley-based method with individual rationality testing and correction. Compared with allocations based on expected benefits, this approach links the allocation to each station’s realized marginal contribution and evaluates individual rationality under actual operating conditions. The framework thus links day-ahead contract formation, actual contract execution, and ex-post benefit allocation within a consistent analytical setting.
2. System Models
2.1. System Structure and Trading Process
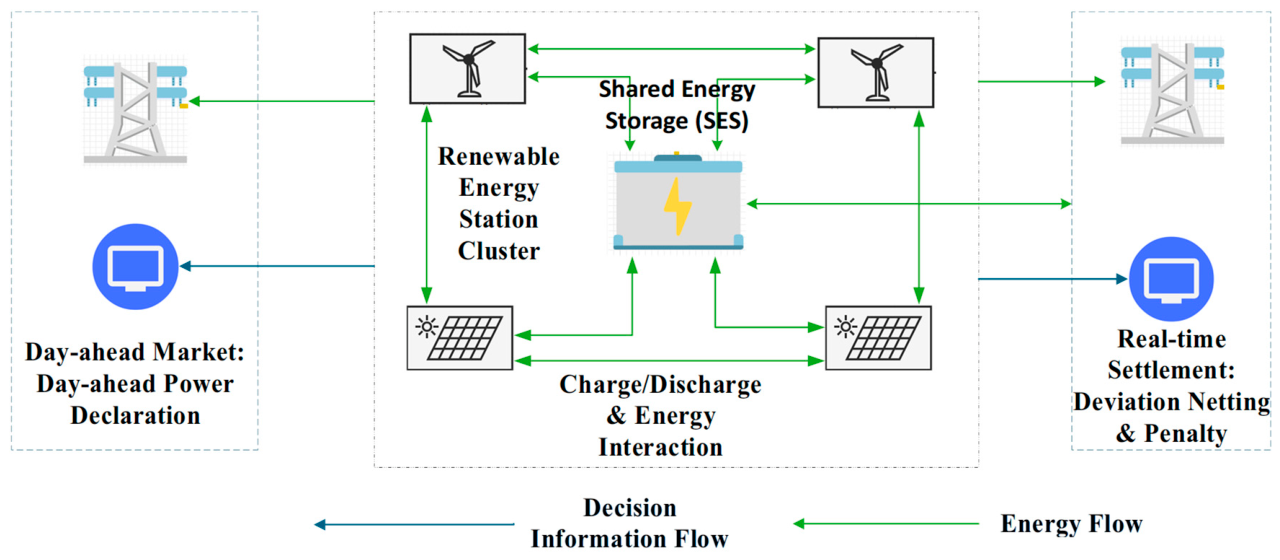
This study considers a shared energy storage rental system comprising a shared energy storage operator (SESO), a renewable energy station alliance (RESA), and the electricity market. The RESA consists of multiple wind farms and photovoltaic stations. Each station independently submits its day-ahead energy schedule, while deviations are internally netted through alliance-level coordination. The SESO generates revenue by leasing storage power and energy capacity to the alliance, as illustrated in Figure 1.
Figure 1.
Structure of the shared energy storage rental system for a renewable energy station alliance.
Deviation netting is modeled at the alliance and settlement level under a copper-plate assumption. Nodal topology, transmission constraints, network losses, congestion, and locational price differences are not explicitly represented. The resulting netting should therefore be interpreted as a settlement-level offset.
At the day-ahead stage, each station submits its forecast output as its day-ahead schedule. The alliance uses joint deviation scenarios to evaluate expected deviation netting among the stations and determine the residual storage demand after netting. On this basis, the shared energy storage operator acts as the leader and sets the rental prices for power and energy capacity, while the station alliance acts as the follower and determines the corresponding rental quantities. Their interactions yield a fixed day-ahead rental contract through a Stackelberg game.
During actual operation, deviations between actual output and day-ahead schedules are first netted within the alliance, and the remaining deviations are preferentially regulated by the shared energy storage system. Any residual deviations that cannot be eliminated by storage are settled according to the imbalance penalty and real-time electricity-trading rules. Finally, cooperative incremental benefits are calculated from the ex-post settlement results of the grand coalition and all coalitions and allocated using a Shapley-based method subject to individual-rationality constraints.
2.2. Day-Ahead Scheduling and Expected Deviation Netting
Let = {1,…,N}, = {1,…,T}, = {1,…,S} denote the sets of renewable energy stations, operating periods, and joint deviation scenarios, respectively. The day-ahead forecast output of station i during period t is denoted by . To explicitly characterize the relationship between deviation netting and shared energy storage rental, the forecast deviation, its positive and negative components, and the alliance-level deviation netting results under scenario s are formulated as follows:
where denotes the day-ahead scheduled power; denotes the output under scenario; and denote the surplus and shortfall deviations, respectively; denotes the power internally netted within the alliance; and and denote the residual surplus and shortfall deviations after netting, respectively.
As indicated by Equation (1), after deviation netting, at most one direction of residual deviation can exist in any period, that is,
2.3. Shared Energy Storage Rental and Operation Model
The renewable energy station alliance rents shared energy storage under a two-part power and energy capacity pricing scheme. The rented power and energy capacity are determined at the day-ahead stage and remain unchanged throughout all operating periods of the following day. The rental limits and fixed rental cost are formulated as follows:
where Prent and Erent denote the rented power and energy capacity, respectively; and are the maximum power and energy capacity available for rental; λP and λE denote the unit rental prices for power and energy capacity, respectively; and Crent is the fixed day-ahead rental cost.
The shared energy storage system is used exclusively to manage the residual deviations after internal netting within the alliance. Residual surplus deviations are preferentially absorbed by charging the storage system, whereas residual shortfall deviations are preferentially compensated through storage discharging. The shared energy storage operation model is formulated as follows:
where and denote the charging and discharging power, respectively; Et,s denotes the stored energy; ηch and ηdis are the charging and discharging efficiencies; and denote the lower and upper state-of-charge limits; SOC0 is the initial state of charge; and are the maximum power and energy capacity available for rental; and ut,s is a binary charging/discharging-state variable. Charging is permitted when ut,s = 1, whereas discharging is permitted when ut,s = 0, thereby preventing simultaneous charging and discharging within the same period.
The degradation cost incurred by cycling the shared energy storage system is calculated based on its total charging and discharging throughput:
where denotes the storage degradation cost under scenario s, and cdeg denotes the degradation cost per unit of charging and discharging throughput.
2.4. Imbalance Settlement Model After Storage Regulation
After internal deviation netting and shared energy storage regulation, the remaining positive and negative deviations correspond to surplus and shortfall energy, respectively. The residual deviations and the associated real-time electricity transactions are expressed as
where and denote the residual surplus and shortfall deviations after storage regulation, respectively, and and denote the quantities of electricity sold to and purchased from the real-time market, respectively.
The residual deviations are subject to imbalance penalties, while the corresponding energy imbalances are settled through real-time electricity trading. The imbalance management cost under scenario s is formulated as
where , , and denote the imbalance penalty cost, the net real-time electricity settlement cost, and the total imbalance management cost, respectively; c+ and c− denote the unit penalty rates for surplus and shortfall deviations; and and denote the real-time purchase price for covering a shortfall and the real-time selling price of disposing of surplus energy, respectively.
To ensure that both residual surplus and shortfall deviations incur positive marginal management costs after storage regulation, the following conditions are imposed:
Imbalance penalties represent the contractual liability incurred when a station deviates from its day-ahead schedule, whereas real-time electricity trading is used to resolve the remaining energy imbalance after storage regulation. These two components therefore have distinct economic interpretations. To prevent additional arbitrage, the shared energy storage system is used exclusively to manage the residual deviations after internal netting within the alliance.
3. Methodology and Mechanism Design
3.1. Generation and Reduction of Joint Deviation Scenarios
To capture the spatial correlations and temporal continuity of forecast deviations across renewable energy stations, full-day joint deviation samples are generated using spatially correlated random variables and a first-order autoregressive process.
Let Σ denote the target spatial correlation matrix of station-level forecast deviations. The spatially correlated random disturbances and hourly forecast errors are generated as
where L is the Cholesky factor of the target spatial correlation matrix Σ; qd,t is a vector of mutually independent standard normal random variables; ud,t denotes the spatially correlated random disturbances across stations; zd,t is the standardized error vector incorporating both spatial correlation and temporal continuity; ρ is the first-order autoregressive coefficient; σt is the vector of forecast-error standard deviations for all stations during period t; εd,t is the forecast deviation vector; and ⊙ denotes the Hadamard product.
The standard deviation of the forecast error at each station varies with its day-ahead forecast output and is calculated as , where αi is the relative forecast error coefficient of station i. For photovoltaic stations, the forecast error is set to zero during nighttime periods when the forecast output is zero.
The d-th full-day joint deviation sample and its corresponding scenario output are expressed as
where εi,d denotes the hourly forecast deviation sequence of station i on simulated day d, and denotes the installed capacity of the station. For photovoltaic stations, the output is set to zero during nighttime periods.
To reduce the computational burden of the Stackelberg game, the deviations are first normalized by the installed capacity of each station. The K-medoids method is then applied to reduce the original full-day scenarios. The cluster medoids are retained as representative scenarios, and their probabilities are calculated as
where ns is the number of original scenarios assigned to representative scenario s, and Nraw is the total number of original scenarios. The principal statistical characteristics and correlation coefficients of the forecast deviations are examined before and after scenario reduction to ensure that the deviation netting characteristics among the stations are adequately preserved.
3.2. Day-Ahead Stackelberg Game for Shared Energy Storage Rental
The shared energy storage operator and the renewable energy station alliance form a leader–follower Stackelberg game. Acting as the leader, the shared energy storage operator sets the unit rental prices for power and energy capacity. The renewable energy station alliance acts as the follower and, given these prices, determines the rented power, rented energy capacity, and scenario-dependent operating strategies according to the residual deviations after expected deviation netting.
3.2.1. Lower-Level Model of the Renewable Energy Station Alliance
For given rental prices (λP,λE), the renewable energy station alliance minimizes the sum of the fixed day-ahead rental cost and the expected imbalance management cost. The set of decision variables for the alliance is given by
Let denote the feasible region for the alliance’s rental decisions and storage operation defined by Equations (3), (4) and (6). To obtain a consistent lower-level response, a negligibly weighted expected charging and discharging throughput term is added to the primary objective of the alliance during numerical optimization. The lower-level model of the renewable energy station alliance is formulated as
where ps is the probability of representative scenario s, and ϵ is a positive coefficient that is substantially smaller than the principal economic cost coefficients. Increasing the rented power and energy capacity raises the fixed day-ahead rental cost but reduces the residual deviations after internal netting, thereby lowering the imbalance penalties and real-time electricity trading costs. Expected deviation netting affects the alliance’s optimal rental demand by changing the residual deviations defined in Equation (1).
3.2.2. Upper-Level Model of the Shared Energy Storage Operator
The shared energy storage operator influences the alliance’s rental response by adjusting the rental prices for power and energy capacity. Its objective is to maximize the profit obtained from rental revenue after deducting the fixed operation and maintenance cost and the expected storage degradation cost. The operator’s expected profit is formulated as
where Com denotes the daily fixed operation and maintenance cost of the shared energy storage system.
Accounting for the optimal response of the renewable energy station alliance, the upper-level pricing model of the operator is formulated as
where , , , and denote the lower and upper bounds of the power and energy capacity rental prices, respectively. The operator cannot directly determine the power and energy capacity rented by the alliance; instead, it influences the alliance’s optimal response by adjusting the two-part rental prices. The operator must therefore balance the unit rental revenue against the alliance’s rental demand.
3.2.3. Stackelberg Equilibrium and Solution Procedure
A Stackelberg equilibrium rental contract is reached when the operator cannot further increase its profit by unilaterally adjusting the rental prices and the alliance cannot further reduce its expected cost under the given prices:
Because the upper-level model contains only two decision variables, namely the rental prices for power and energy capacity, the bi-level model is solved using a two-stage price-grid search combined with an inner-level mixed-integer linear programming model. First, a coarse search grid is constructed within the prescribed bounds of the power and energy capacity rental prices. For each candidate price combination, the alliance’s lower-level mixed-integer linear programming model in Equation (13) is solved, and the corresponding profit of the shared energy storage operator is calculated using Equation (14). A refined local grid is then constructed around the optimal price combination identified by the coarse search to obtain a higher-resolution numerical equilibrium. The solution procedure is expressed as follows:
where and denote the coarse search grids for the power and energy capacity rental prices, respectively; and denote the corresponding refined local grids around the coarse-grid optimum; and is the optimal price combination obtained from the coarse-grid search.
For each candidate price combination, Equation (13) is first solved to obtain the alliance’s optimal rental response, after which the operator’s profit is calculated using Equation (14). All feasible price combinations in the coarse and refined grids are then compared. The price combination that maximizes the operator’s profit, together with the corresponding optimal response of the alliance, constitutes the numerical Stackelberg equilibrium defined in Equation (16).
3.3. Actual Operation and Settlement Under a Fixed Rental Contract
Once the day-ahead Stackelberg game has been solved, the equilibrium rental prices, rented power, and rented energy capacity remain unchanged during actual operation. For each out-of-sample test day, the deviations of individual stations and the realized deviation netting quantities are recalculated using their actual outputs.
The realized deviations are substituted into Equation (1). Under the fixed rental contract Ω∗, the feasible region for out-of-sample operation, denoted Ƶact(Ω∗), is then constructed according to Equations (4), (6) and (7). The set of actual operational decision variables is given by
The actual operation model under the fixed rental contract is formulated as
where the realized imbalance penalty cost and the net electricity trading settlement cost are calculated as
The actual total cost of the alliance under the fixed rental contract and its realized incremental benefit relative to the no-storage-rental case are calculated as
When ΔΠfixed > 0, the fixed day-ahead rental contract reduces the alliance’s actual imbalance-management cost. Because all schemes use the same day-ahead schedules and receive the same day-ahead electricity sales revenue, the cost saving defined in Equation (21) is equivalent to the net incremental benefit generated by the fixed rental contract. The out-of-sample test days are used exclusively for evaluating actual operation and do not participate in day-ahead scenario reduction or rental decision-making.
3.4. Shapley Allocation Based on Realized Incremental Benefits
To avoid discrepancies between expected day-ahead benefits and realized cooperative benefits, the characteristic function of the cooperative game is constructed from the ex-post settlement results of each coalition over the out-of-sample test days. To ensure comparability among the cooperative values of different coalitions, all coalitions adopt the equilibrium power rental price and equilibrium energy capacity rental price obtained from the Stackelberg game for the grand coalition under scenario S2. For each coalition, only the rented power, rented energy capacity, and storage operating strategy are reoptimized according to the residual deviations after expected deviation netting; the pricing game of the shared energy storage operator is not repeated.
The independent operating cost of station i is defined as its average ex-post settlement cost when it operates as a single-member coalition, redetermines its storage rental demand under the unified rental prices, and completes out-of-sample settlement. denotes the average cost incurred by coalition when its members perform deviation netting, jointly rent shared energy storage, and complete ex-post settlement using the same rental prices and out-of-sample test data. For any non-empty coalition ⊆ , its cooperative incremental benefit is defined as
The standard Shapley allocation of station i is calculated as
The standard Shapley value satisfies the efficiency condition
The cooperative incremental benefit of the grand coalition is allocated only when v() > 0. If ϕi ≥ 0 for every station, the standard Shapley allocation is adopted directly. If any station receives a negative allocation, the following correction model subject to individual-rationality constraints is applied:
where x∗ denotes the final cooperative incremental benefit allocated to station i. The actual cost of station i after benefit allocation is calculated as
This allocation mechanism ensures that the cooperative incremental benefit is fully allocated and that the cost incurred by each station after cooperation does not exceed its independent operating cost. However, it does not necessarily ensure that the resulting allocation lies in the core of the cooperative game. The Shapley-based method allocates only the incremental benefit generated through cooperation; the original day-ahead electricity sales revenue of each station is not redistributed.
4. Case Study
4.1. System Configuration
A renewable energy station alliance comprising two wind farms and two photovoltaic stations is considered. The structure of the system is illustrated in Figure 1. The four renewable energy stations are denoted W1, W2, PV1, and PV2, with installed capacities of 100, 200, 100, and 200 MW, respectively. The maximum rentable power and energy capacity of the shared energy storage system are set to 30 MW and 60 MWh. Both the charging and discharging efficiencies are set to 0.95. The lower limit, upper limit, and initial value of the state of charge (SOC) are set to 0.10, 0.90, and 0.50, respectively, and the terminal SOC is required to return to its initial value at the end of each day. The case study adopts a 1 h temporal resolution and a 24 h day-ahead scheduling and ex-post settlement cycle. The main parameters are listed in Table 1. For the daily rental and operating model, the SES is treated as an existing facility; therefore, the reported operator profit accounts for fixed operation and maintenance and degradation costs but excludes initial investment, financing, and capital recovery costs.
Table 1.
Main model and solution parameters.
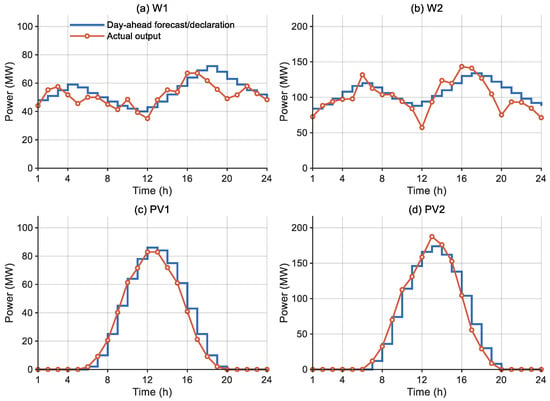
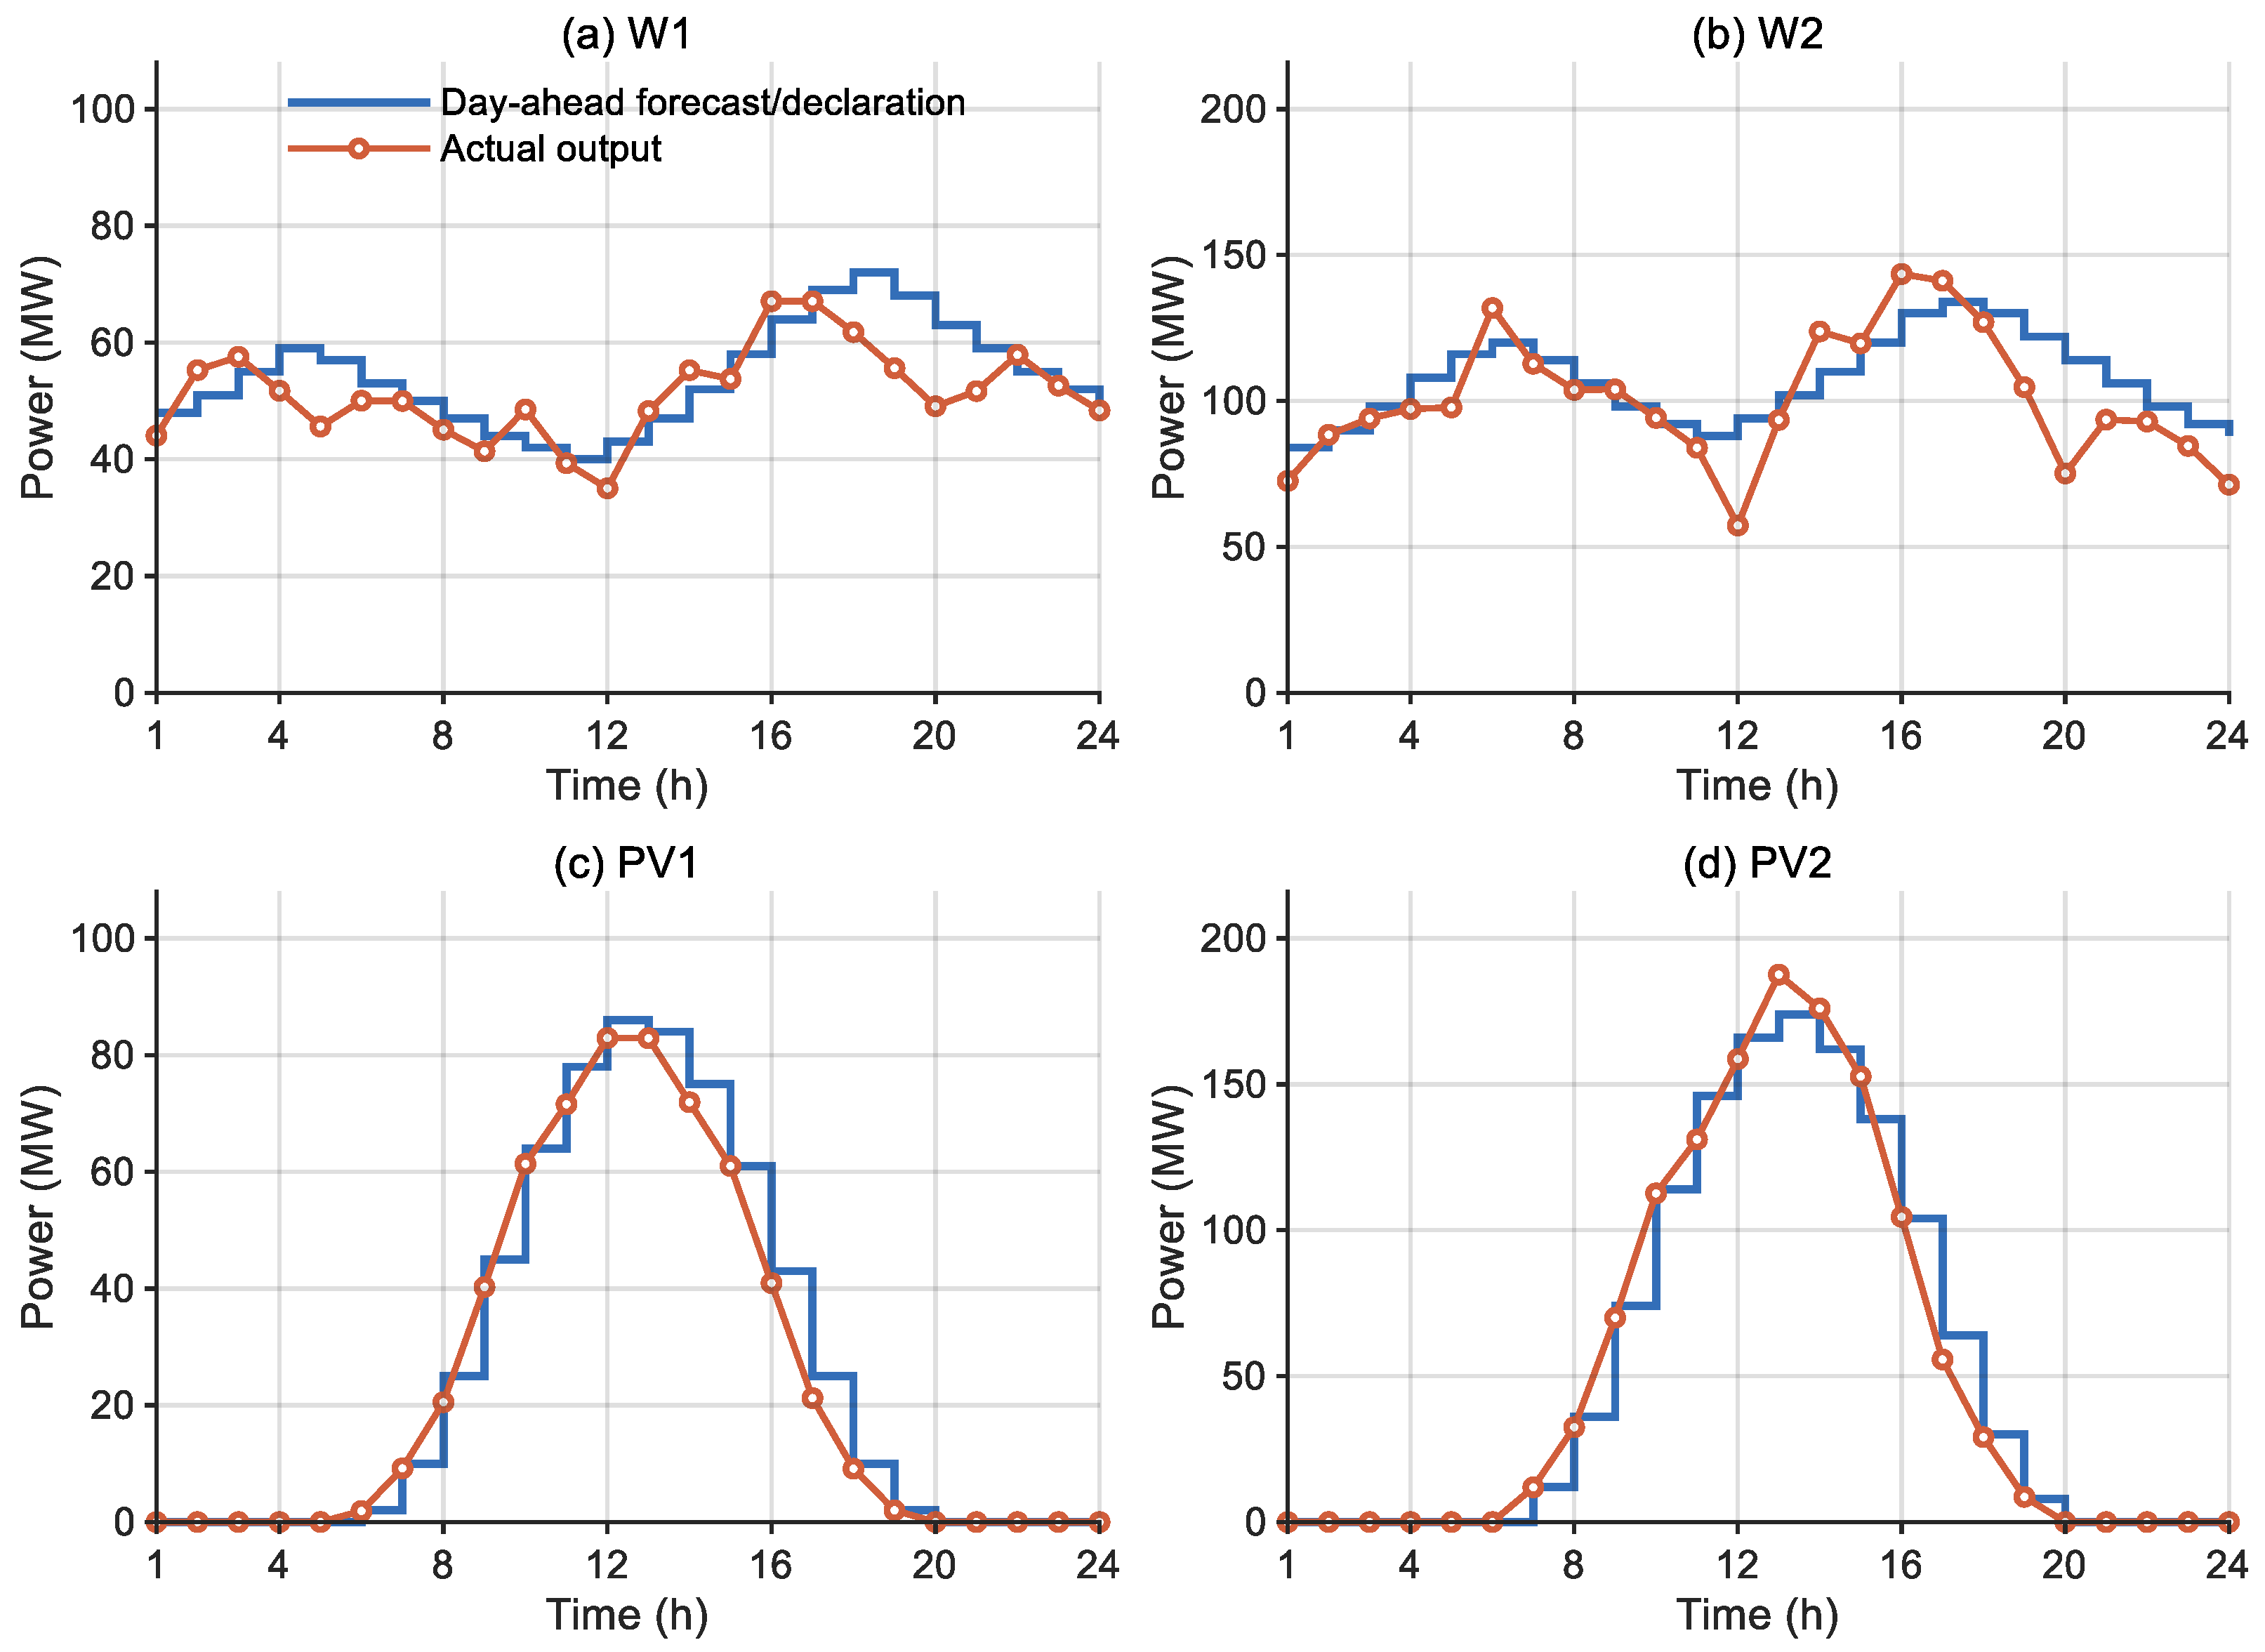
The shared energy storage configuration and the baseline wind and photovoltaic generation profiles are adopted with reference to Ref. [20]. Specifically, the storage power is set to approximately 5% of the total installed renewable generation capacity, with a storage duration of 2 h. The baseline profiles follow the representative wind and photovoltaic output patterns reported in the cited study. Amplitude adjustments and temporal shifts are subsequently applied to represent differences in resource availability among the stations. The reference is used only to determine the storage configuration principle and the general shapes of the renewable generation profiles. All forecast deviations and simulated actual outputs are generated using the error model developed in this study. Each station submits its day-ahead forecast output as its day-ahead schedule. Figure 2 presents the day-ahead schedules and actual outputs of the four stations on a representative test day.
Figure 2.
Day-ahead schedules (blue lines) and out-of-sample actual outputs (orange lines) of the renewable energy stations on a representative test day.
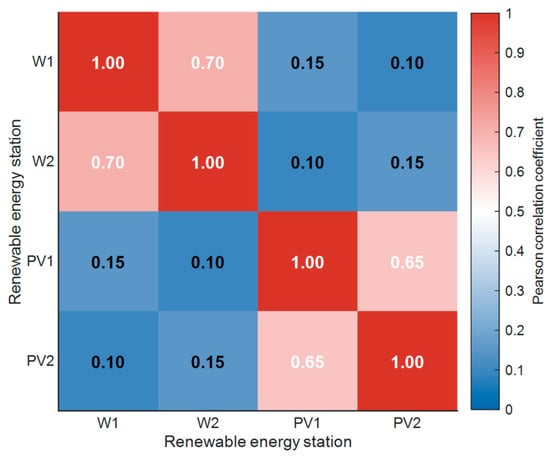
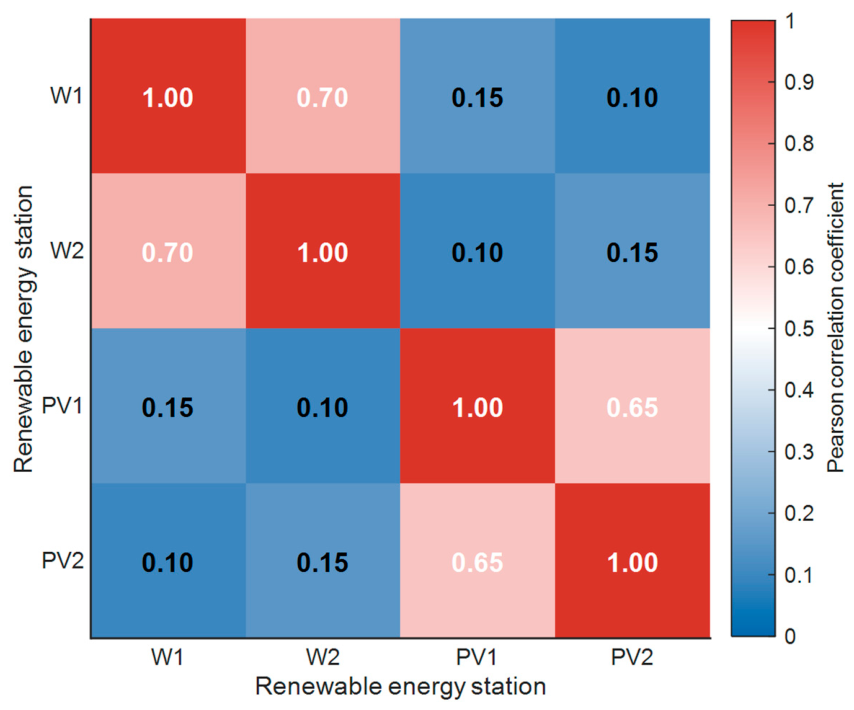
To account for the spatial correlations and temporal continuity of station-level forecast deviations, the joint error model described in Section 3.1 is used to generate 1000 full-day joint deviation scenarios. Relatively strong within-type error correlations are specified between the two wind farms and between the two photovoltaic stations, whereas weaker cross-type correlations are specified between the wind farms and photovoltaic stations. The first-order autoregressive coefficient is set to 0.60. The relative forecast-error levels of W1, W2, PV1, and PV2 are set to 0.12, 0.15, 0.08, and 0.10, respectively. The target spatial correlation matrix of the forecast deviations is shown in Figure 3. The spatial correlation coefficients, the common AR(1) coefficient, and the station-specific forecast error levels are assumed baseline case study parameters rather than estimates derived from measured multi-station forecast error data.
Figure 3.
Target spatial correlation matrix of forecast deviations among the renewable energy stations.
Based on a combined clustering space comprising normalized deviation trajectories and decision-relevant summary features, a netting-aware K-medoids method is used to reduce the 1000 original scenarios to 10 representative scenarios. Some 4 candidate summary-feature weights are screened using 15 starts per weight, giving 60 starts for each value of K. The baseline K = 10 set uses a summary-feature weight of 4. The representative set is selected using a prespecified comprehensive representation score that does not include the S1 or S2 economic outcomes. The selected set yields expected netting of 51.29 MWh/day, compared with 52.32 MWh/day for the original scenarios, corresponding to a signed error of −1.96%. The probability of each representative scenario is determined by the proportion of original samples assigned to the corresponding cluster. These representative scenarios and their probability weights are used to evaluate expected day-ahead deviation netting and solve the shared energy storage rental game. To prevent the same samples from being used for both day-ahead decision-making and actual operation evaluation, an independent 1000-day out-of-sample dataset is generated separately from the 1000 day-ahead scenarios. The simulated realized outputs are obtained by superimposing independently generated test errors on the day-ahead forecast outputs. This dataset is used exclusively for actual operation and settlement; it does not participate in day-ahead scenario reduction or rental decision-making.
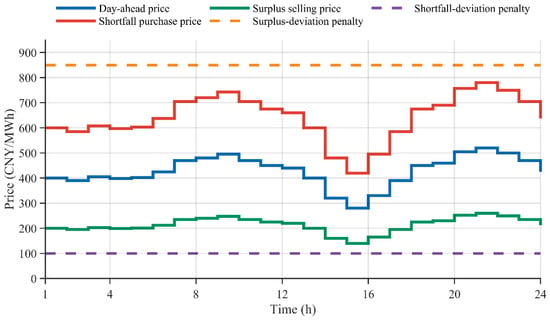
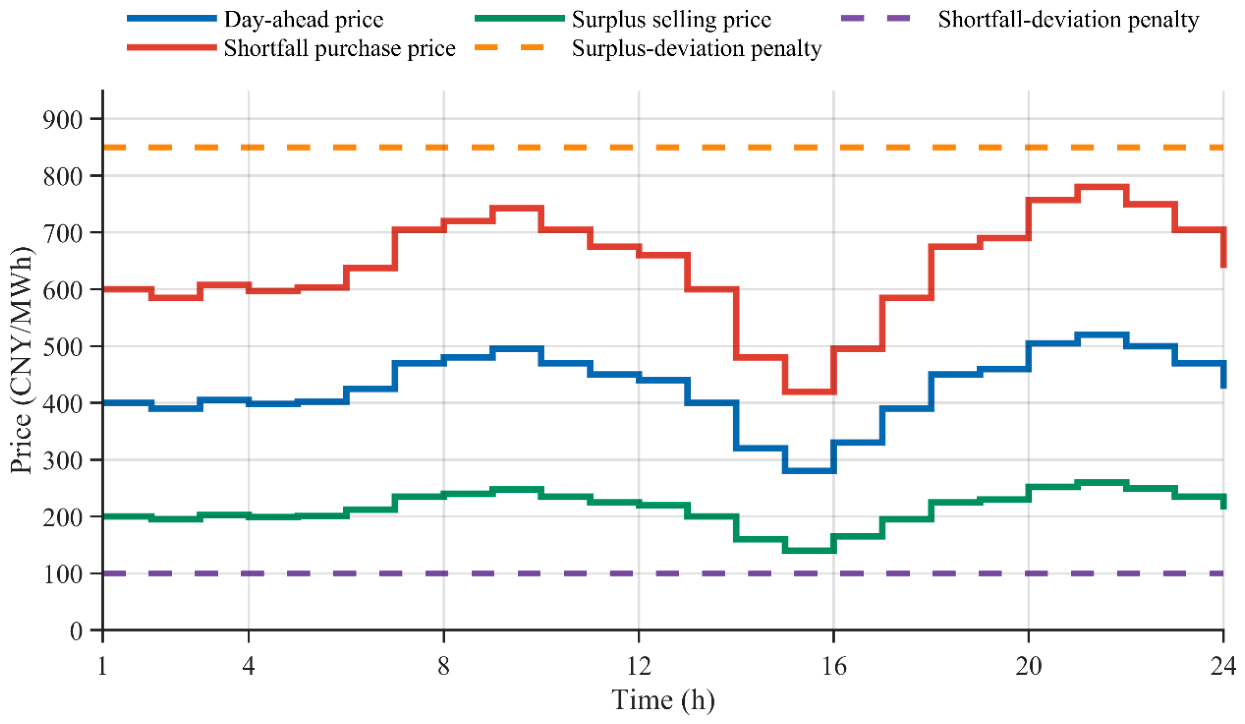
The day-ahead market prices are adopted from the representative day-ahead price profile of the Gansu spot electricity market reported in Ref. [19]. The shortfall purchase price and surplus selling price are set to 1.5 and 0.5 times the corresponding day-ahead electricity price, respectively. The unit penalty rates for surplus and shortfall deviations are set to 850 and 100 CNY/MWh, respectively. These price multipliers and deviation-penalty rates are treated as baseline case study assumptions rather than as a complete representation of current market settlement rules. The day-ahead electricity price, shortfall purchase price, surplus selling price, and deviation penalty rates are shown in Figure 4.
Figure 4.
Day-ahead electricity price, imbalance purchase and selling prices, and imbalance penalty rates.
All numerical experiments were implemented in MATLAB R2023b using YALMIP and solved with CPLEX 12.8 on a on a Lenovo Xiaoxin Pro 13 2020 laptop (Lenovo Group Limited, Beijing, China) equipped with an AMD Ryzen 7 4800U processor and 16 GB of RAM. Fixed random seeds were used for scenario generation to ensure reproducibility, and the resulting datasets were retained unchanged throughout all subsequent analyses.
Four comparative scenarios are established to evaluate the effects of expected deviation netting and fixed SES rental, detailed as follows.
Scenario S1: Expected deviation netting is not considered during day-ahead contract formation. The positive and negative deviations of the individual stations are aggregated separately, and the rented power and energy capacity are determined through the Stackelberg game according to the deviation requirements before netting.
Scenario S2: Expected deviation netting is considered during day-ahead contract formation. Oppositely directed station-level deviations in the same period are first offset, after which the alliance participates in the Stackelberg rental game according to the residual deviations after netting. S1 and S2 use identical scenario data, market parameters, common tariff domain, price-search procedure, and SES operating constraints. They differ only in whether expected deviation netting is considered before rental demand is determined.
Scenario S3: During out-of-sample operation, realized station-level deviations are internally netted, but no SES capacity is rented. S3 provides the no-storage benchmark for evaluating the realized performance of the fixed rental contract.
Scenario S4: The fixed day-ahead rental prices and quantities obtained under S2 are implemented without ex-post adjustment. Realized deviations are sequentially managed through internal deviation netting, SES regulation, deviation penalties, and real-time electricity transactions. S3 and S4 use the same out-of-sample outputs and market prices.
In addition, the fixed contracts obtained under S1 and S2 are implemented over the same 1000 out-of-sample days. To isolate the effect of expected day-ahead deviation netting on contract formation, both fixed contracts are evaluated using identical realized internal netting, SES dispatch, and settlement rules. These controlled cases are denoted by S1-RN and S2-RN, respectively. Under these definitions, S2-RN is numerically identical to S4, whereas S1-RN provides the controlled S1 benchmark. The paired results are used to compare the realized alliance costs and SES operator profits under the two fixed contracts.
4.2. Effect of Deviation Netting on the Day-Ahead Rental Equilibrium
Scenarios S1 and S2 are compared to evaluate how expected deviation netting affects day-ahead SES rental demand and the resulting Stackelberg equilibrium. In S1, the positive and negative expected deviations are aggregated separately across the four stations, and rental demand is determined before netting. In S2, oppositely directed station-level expected deviations in each period are first offset, after which rental demand is determined from the residual deviations. The two scenarios use the same joint deviation scenarios and probability weights, market and economic parameters, price-search ranges, SES technical and operating constraints, imbalance settlement rules, and numerical solution procedure. Therefore, the differences between S1 and S2 can be attributed to whether expected deviation netting is incorporated before the rental decision is made.
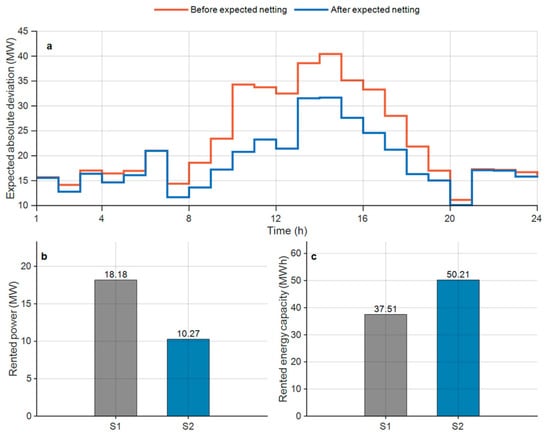
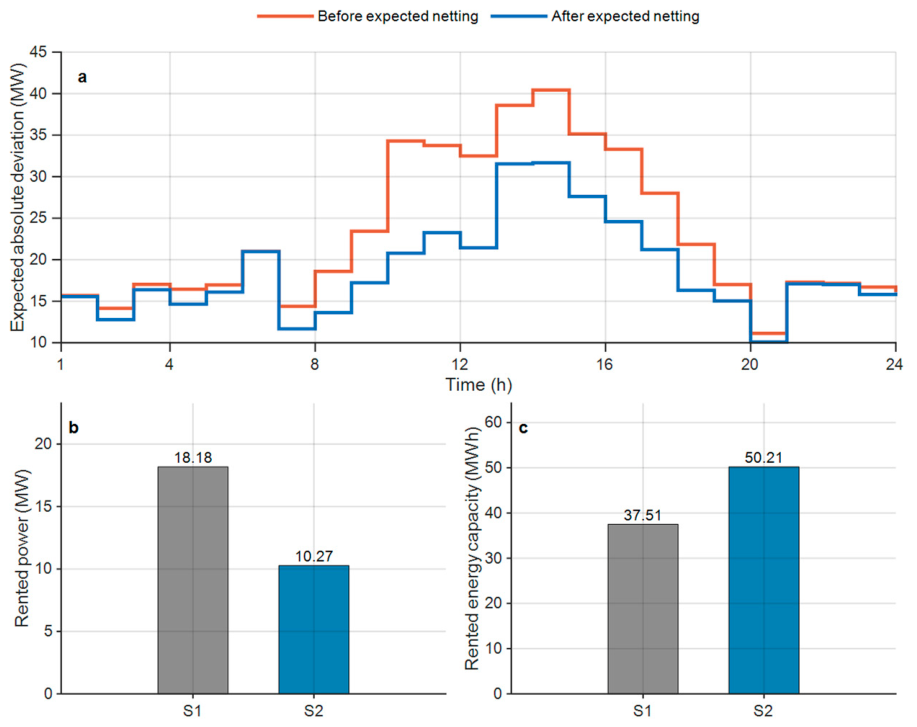
Figure 5a compares the expected absolute deviations before and after deviation netting across the 24 one-hour scheduling periods. The selected K = 10 representative set yields expected deviation netting of 51.29 MWh/day. Consequently, the total expected absolute deviation decreases from 550.96 to 448.38 MWh/day, corresponding to a reduction of 18.62%. The maximum expected hourly absolute deviation also decreases from 40.44 to 31.68 MW, a reduction of 21.66%. These results show that the simultaneous occurrence of station-level surpluses and shortfalls provides measurable internal netting potential before SES rental demand is determined.
Figure 5.
Impacts of expected deviation netting: (a) expected absolute deviations before and after netting; (b) equilibrium rented power; and (c) equilibrium rented energy capacity. The grey bar represents Scenario S1 and the blue bar represents Scenario S2.
The reduction in residual deviations is further transmitted to the alliance’s equilibrium SES rental demand. As shown in Figure 5b,c, the equilibrium rented power and energy capacity under S1 are 18.18 MW and 37.51 MWh, respectively. After expected deviation netting is incorporated under S2, the rented power decreases to 10.27 MW, corresponding to a reduction of 43.50%. In contrast, the rented energy capacity increases to 50.21 MWh, corresponding to an increase of 33.87%. This difference reflects the endogenous adjustment of the two-part rental tariff. Expected deviation netting reduces the instantaneous power requirement, while the lower equilibrium energy capacity price under S2 encourages the alliance to rent more energy capacity. Therefore, the equilibrium rental quantities should be interpreted jointly with the corresponding rental prices.
The change in rental demand is further transmitted to the price equilibrium of the Stackelberg game. Within the common tariff domain, the equilibrium power and energy capacity rental prices under S1 are 1320 CNY/(MW·day) and 1560 CNY/(MWh·day), respectively, compared with 2827.50 CNY/(MW·day) and 670 CNY/(MWh·day) under S2. Relative to S1, the power rental price under S2 increases by 114.20%, whereas the energy capacity rental price decreases by 57.05%. This change indicates a rebalancing of the two-part rental tariff after expected deviation netting alters the alliance’s demand for power and energy capacity. The economic performance of each scheme must therefore be evaluated in terms of rental quantities, rental expenditure, and imbalance management costs rather than either rental price alone.
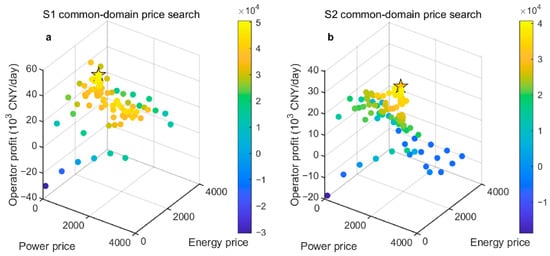
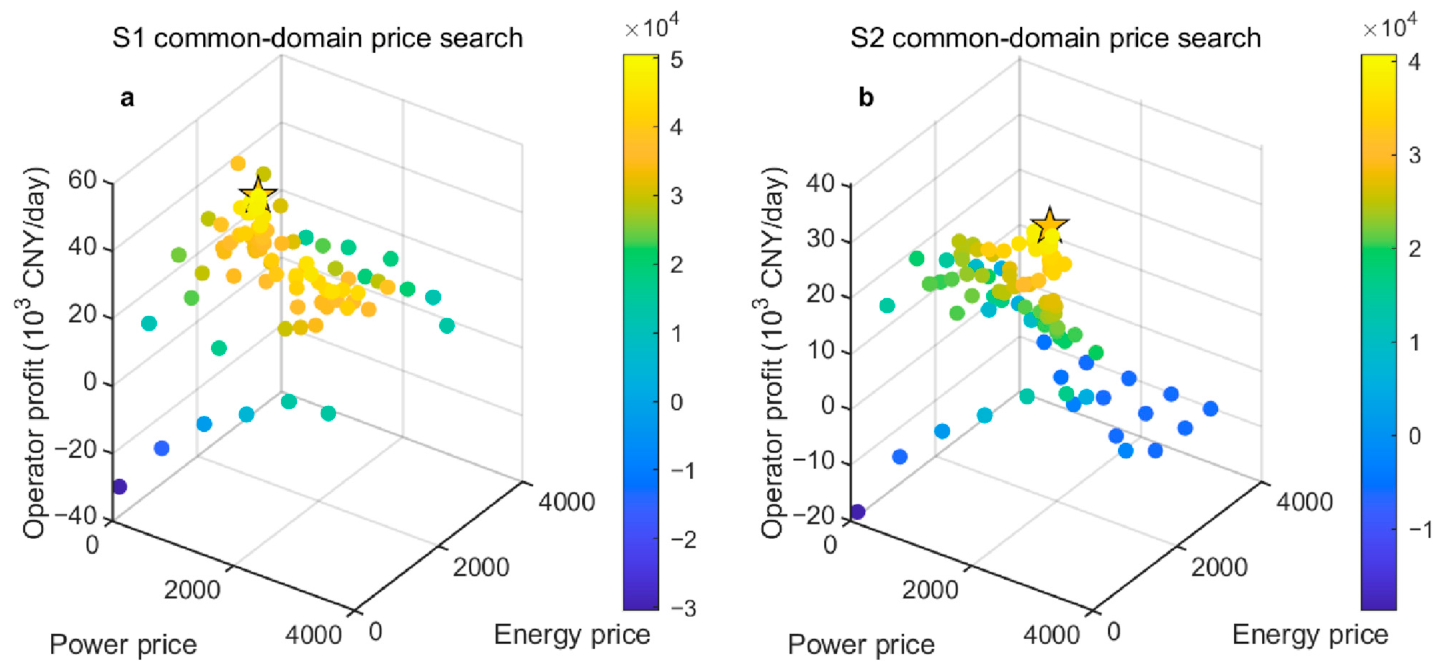
Figure 6 presents the shared energy storage operator’s expected-profit search over the common tariff domain for S1 and S2, with the stars indicating the selected equilibrium price combinations. For each candidate price combination, the alliance reoptimizes its rented power, rented energy capacity, and scenario-dependent operating strategies, after which the operator calculates its expected profit from the alliance’s optimal response. The resulting profit landscape and its optimum directly illustrate the coupling between the operator’s upper-level pricing decision and the alliance’s lower-level rental response, confirming that the equilibrium rental contract is jointly determined by the decisions of both parties.
Figure 6.
Expected profit of the shared energy storage operator under different rental price combinations: (a) S1 and (b) S2. Stars indicate the selected equilibrium price combinations.
From the alliance perspective, expected deviation netting reduces the daily rental expenditure from 82,514.75 CNY under S1 to 62,690.70 CNY under S2, corresponding to a reduction of 24.02%. The expected imbalance management cost also decreases from 257,216.64 to 233,429.56 CNY/day, a reduction of 9.25%. Consequently, the alliance’s expected total cost decreases from 339,731.38 to 296,120.26 CNY/day, corresponding to a reduction of 12.84%. Expected deviation netting therefore improves the alliance’s day-ahead economic performance by reducing both rental expenditure and expected imbalance management cost.
From the SES operator’s perspective, the expected storage degradation cost decreases from 26,181.70 CNY/day under S1 to 16,149.48 CNY/day under S2, corresponding to a reduction of 38.32%. The expected operating profit decreases from 50,413.05 to 40,621.23 CNY/day, a reduction of 19.42%, but remains positive under S2. This decrease occurs because expected deviation netting reduces storage throughput and rental revenue, although the equilibrium rented energy capacity increases under the rebalanced tariff. Thus, expected deviation netting lowers the alliance’s expected total cost while preserving a positive expected profit for the SES operator.
Overall, incorporating expected deviation netting reduces the alliance’s expected absolute deviation by 18.62% and the equilibrium rented power by 43.50%. Under the rebalanced two-part tariff, the equilibrium rented energy capacity increases by 33.87%. The alliance’s expected total cost decreases by 12.84%, while the SES operator retains a positive expected operating profit of 40,621.23 CNY/day. These results show that the value of expected deviation netting is transmitted to the two-part rental tariff and the day-ahead Stackelberg equilibrium through the alliance’s price-responsive rental decision.
4.3. Actual Operation and Settlement of the Fixed Rental Contract
To evaluate the effectiveness of the fixed day-ahead rental contract during actual operation, scenarios S3 and S4 are compared using 1000 out-of-sample days that are excluded from day-ahead scenario generation, scenario reduction, and rental decision-making. S3 allows realized deviation netting among the stations but does not involve SES rental. S4 implements the equilibrium day-ahead contract obtained under S2, with a power rental price of 2827.5 CNY/(MW·day), an energy capacity rental price of 670 CNY/(MWh·day), rented power of 10.27 MW, and rented energy capacity of 50.21 MWh. These contract terms remain unchanged throughout actual operation. Both scenarios use the same realized outputs and market prices, and the realized deviations are managed sequentially through internal alliance netting, SES regulation where applicable, imbalance penalties, and real-time electricity trading.
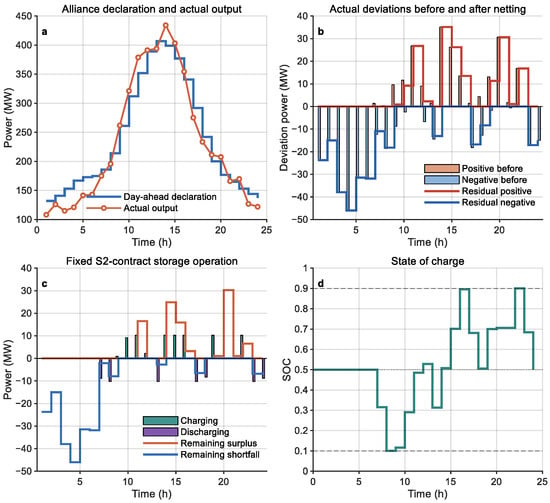
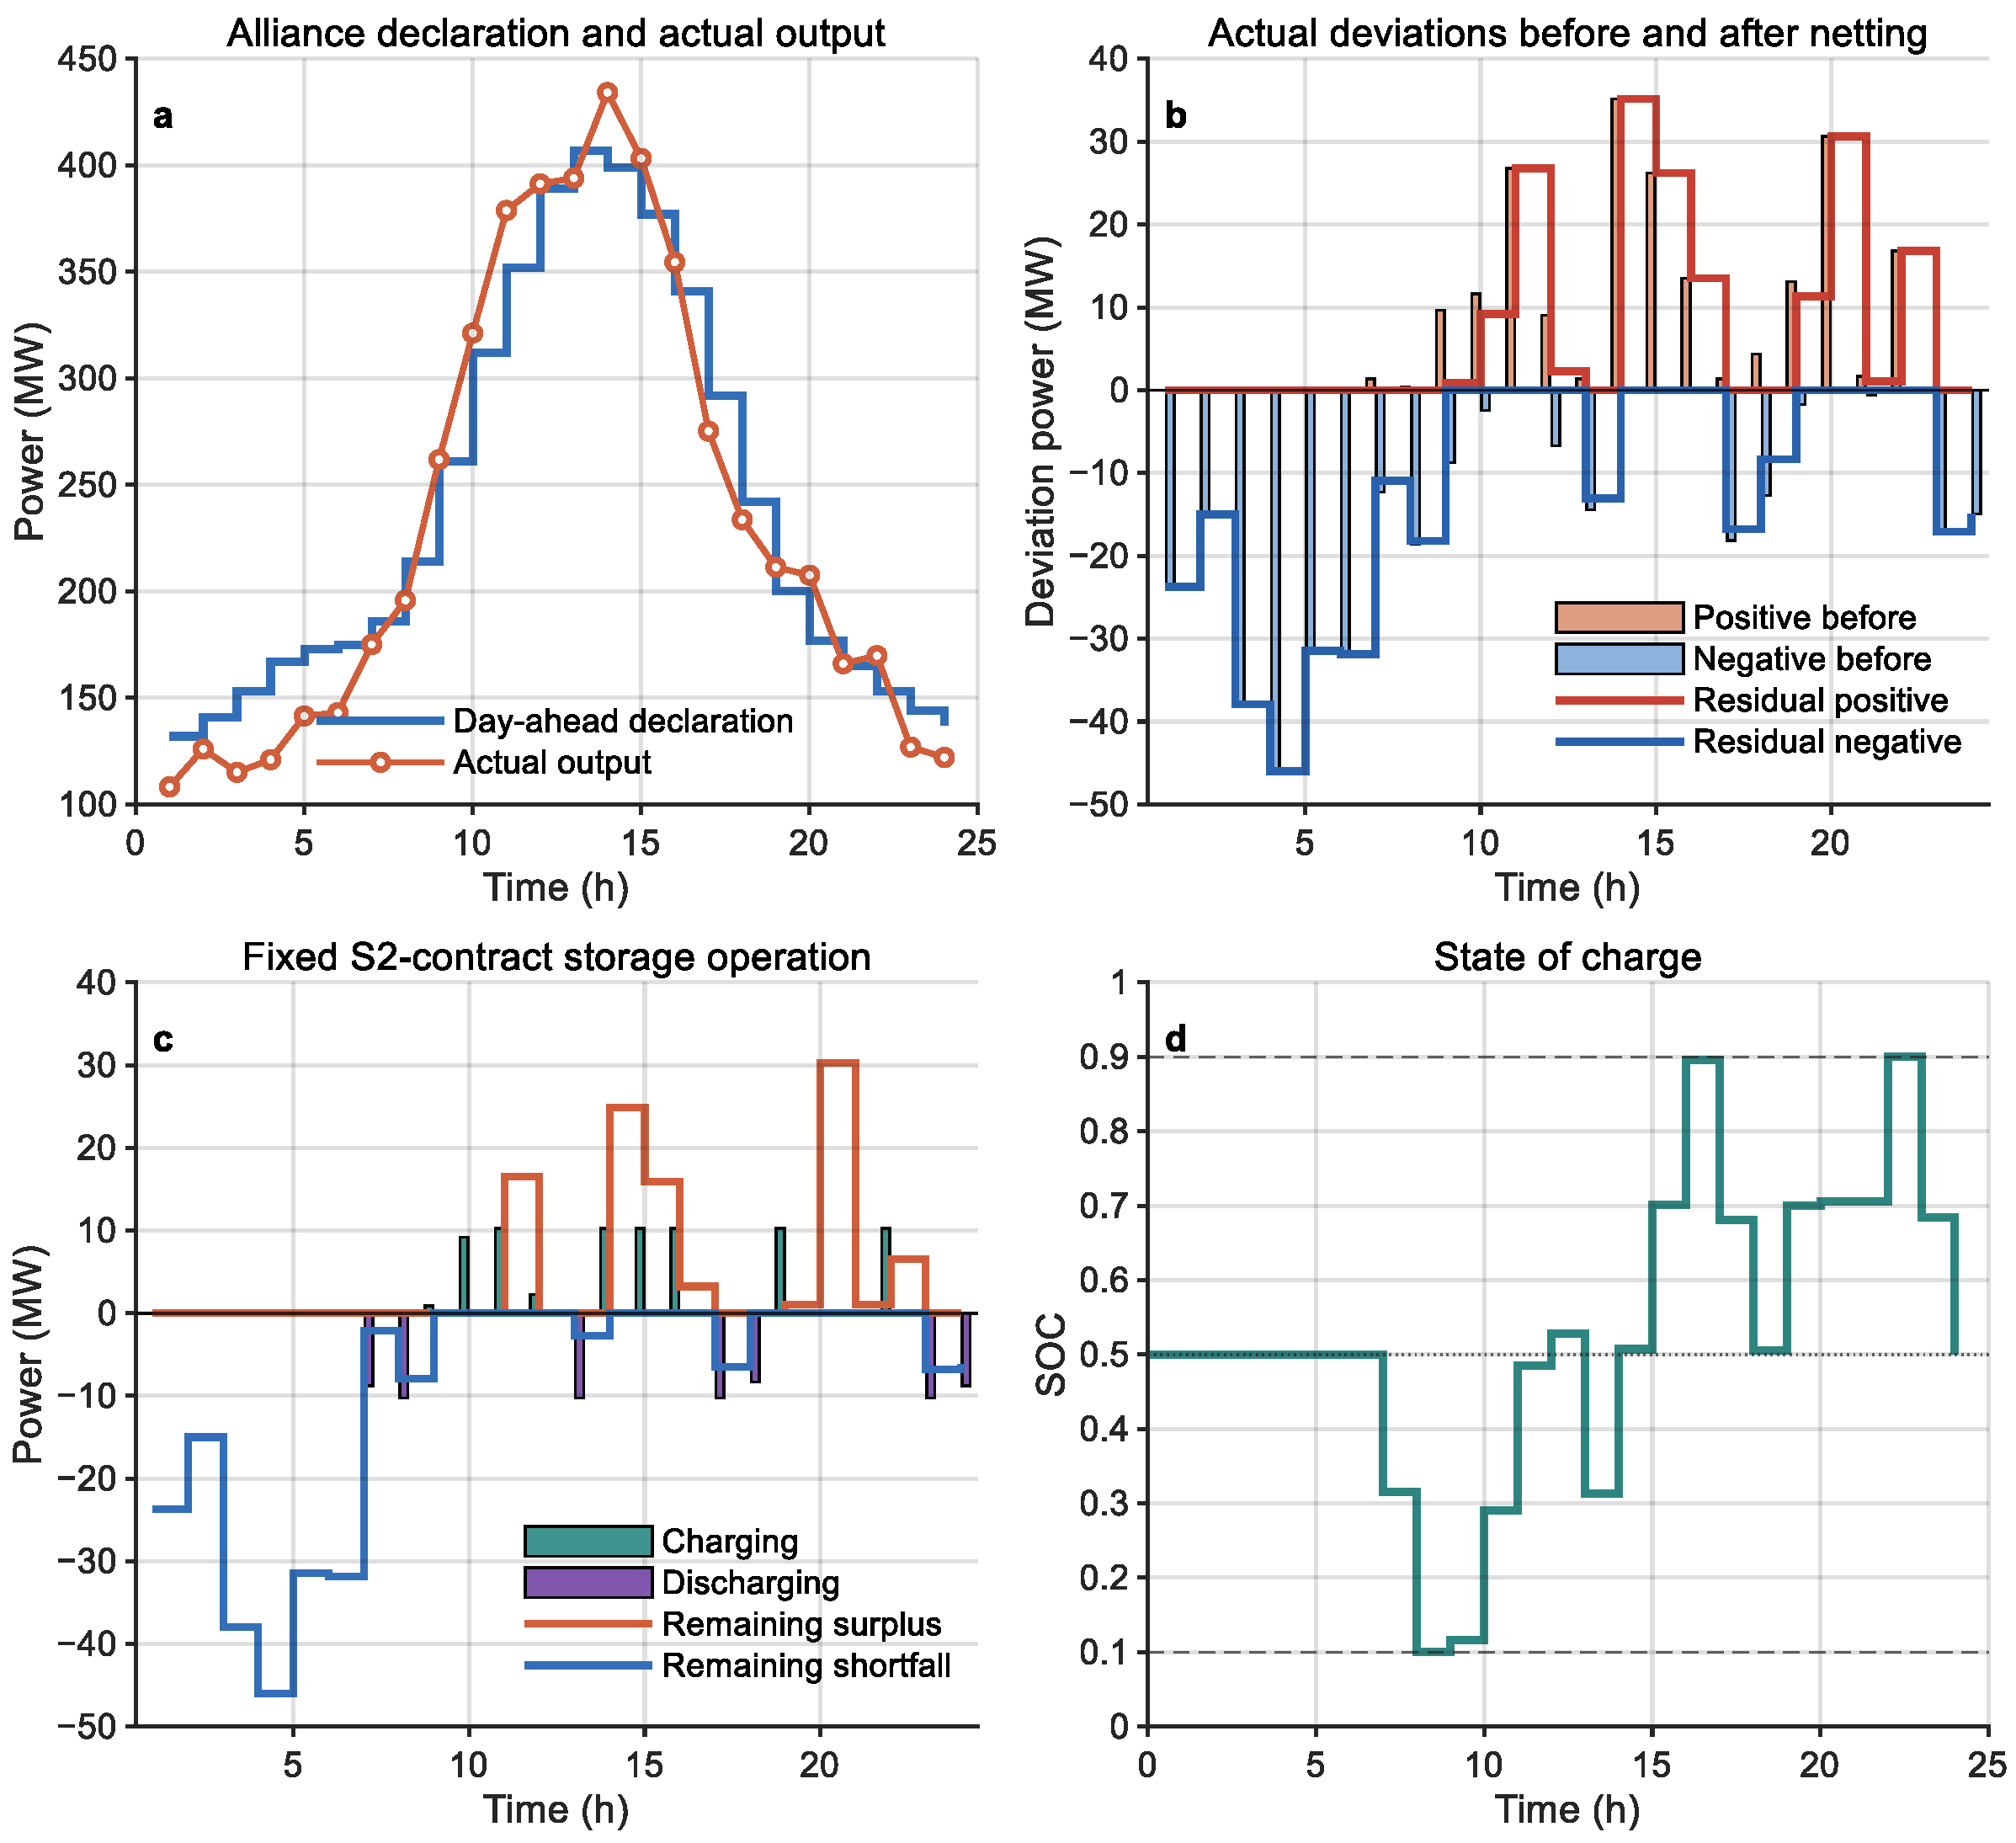
Figure 7 presents the implementation of the fixed rental contract on a representative out-of-sample day. As shown in Figure 7a, hourly deviations in both directions occur between the alliance’s realized output and its day-ahead declaration. During actual operation, the positive and negative deviations of the individual stations are first offset within the alliance. Figure 7b shows that the residual positive and negative deviations after netting do not exceed their corresponding values before netting, indicating that oppositely directed deviations among the wind and photovoltaic stations provide a degree of realized complementarity.
Figure 7.
Operation of the fixed rental contract on a representative out-of-sample day: (a) alliance day-ahead declaration and actual output; (b) actual deviations before and after netting; (c) SES charging/discharging power and remaining imbalances; and (d) battery state of charge (SOC). The solid curve in subplot (d) denotes the time-varying SOC of the shared energy storage, and the dashed lines in subplot (d) represent the upper and lower bounds of SOC.
Across the 1000 out-of-sample days, the mean realized deviation netting energy is 51.69 MWh/day, which is close to the expected value of 51.29 MWh/day represented by the improved K = 10 scenario set and the 52.32 MWh/day reference obtained from the original 1000 day-ahead scenarios. Expected deviation netting is used only to determine the day-ahead rental contract, whereas actual storage dispatch and imbalance settlement are calculated from the realized outputs. This separation prevents realized operating information from entering the day-ahead rental decision.
Figure 7c presents the hourly operation of the SES under the fixed contract. Residual positive deviations after netting are preferentially absorbed through charging, whereas residual negative deviations are preferentially compensated through discharging. The charging and discharging power is limited by the contracted power capacity of 10.27 MW. When the residual deviations exceed this limit or storage operation is constrained by the available energy state, the portion not managed by the SES remains subject to imbalance penalties and is settled by selling surplus electricity at a lower price or purchasing shortfall electricity at a higher price. The fixed rental contract therefore reduces the deviations entering the subsequent settlement stage but does not completely eliminate the realized surplus and shortfall energy.
As shown in Figure 7d, the SOC remains within its allowable range of 0.10–0.90 throughout the operating cycle and returns to its initial value of 0.50 at the end of the day. The SOC reaches both its lower and upper limits during the representative day, indicating that the available SOC range associated with the rented energy capacity of 50.21 MWh is fully used during several operating periods. This result also shows that the fixed contract places effective power and energy constraints on the realized regulation capability of the SES.
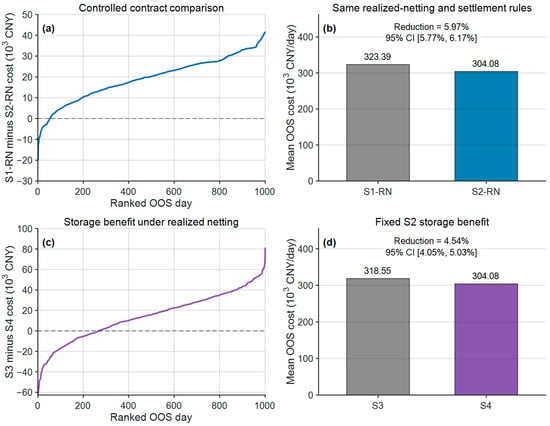
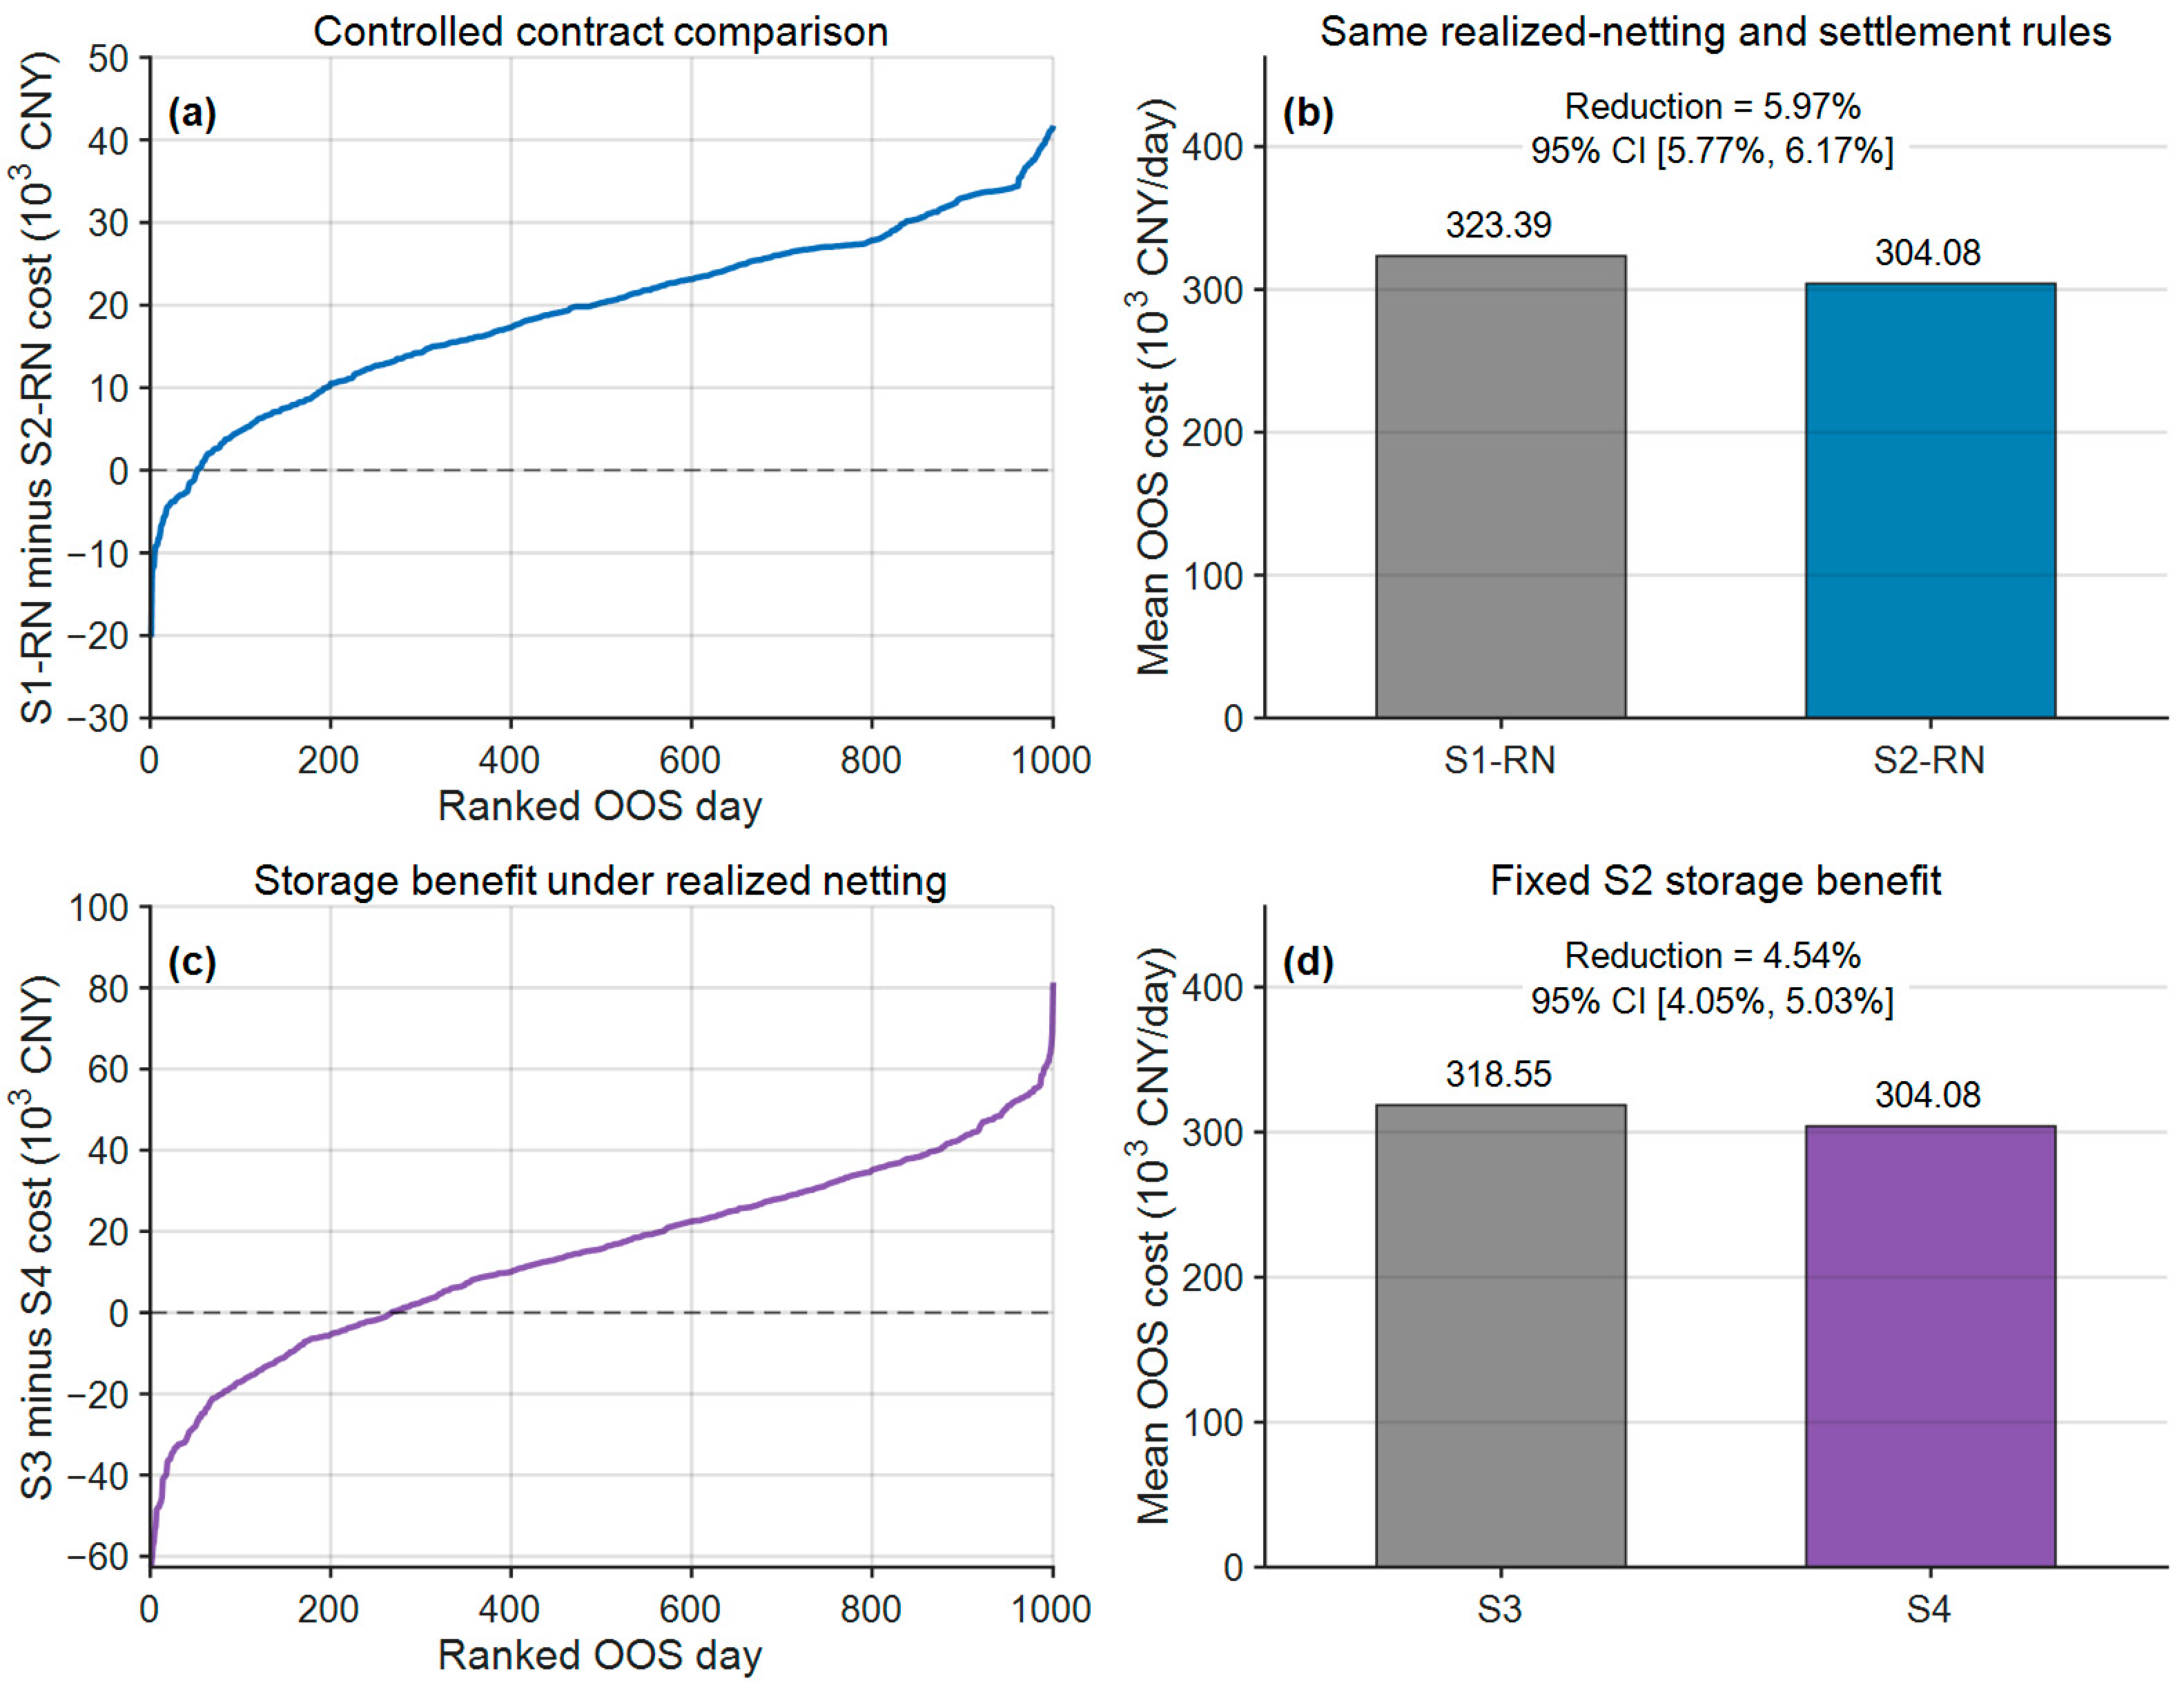
Over the 1000 out-of-sample days, the mean alliance cost under S3 is 318,553.36 CNY/day, whereas the mean cost under S4 is 304,077.54 CNY/day. The fixed S2 contract therefore yields an average saving of 14,475.82 CNY/day and an aggregate cost reduction of 4.54%. The paired bootstrap 95% confidence interval for the reduction is 4.05–5.03%, and S4 achieves a lower cost on 734 of the 1000 days. Thus, although the fixed contract reduces the aggregate cost, it does not guarantee a cost saving on every operating day.
Figure 8 further reports a controlled comparison of the S1 and S2 fixed contracts. Here, S1-RN and S2-RN denote the S1 and S2 contracts, respectively, operated under the same realized netting and settlement rules. The mean costs under S1-RN and S2-RN are 323,393.36 and 304,077.54 CNY/day, respectively. The S2 contract yields an average saving of 19,315.82 CNY/day and a cost reduction of 5.97%, with a paired-bootstrap 95% confidence interval of 5.77–6.17%. S2-RN has a lower cost on 949 of the 1000 out-of-sample days. Because the operating and settlement rules are identical, this comparison isolates the cost difference associated with the fixed contracts obtained with and without expected day-ahead deviation netting. Panels (c,d) additionally present the S3–S4 comparison, which isolates the ex-post contribution of storage under realized netting.
Figure 8.
Controlled out-of-sample comparisons over 1000 test days: (a) ranked daily cost differences between S1-RN and S2-RN; (b) mean costs under S1-RN and S2-RN, where the grey and blue bars represent S1-RN and S2-RN, respectively; (c) ranked daily cost differences between S3 and S4; and (d) mean costs under S3 and S4, where the grey and purple bars represent S3 and S4, respectively. In subplots (a,c), the dashed lines indicate zero cost difference, and the solid curves show the ranked daily cost differences.
From the perspective of the shared energy storage operator, the fixed S2 contract provides rental revenue of 62,690.70 CNY/day. After accounting for the fixed operation and maintenance cost and the degradation cost associated with realized storage dispatch, the mean out-of-sample operating profit is 40,456.43 CNY/day. The operator therefore retains a positive average operating profit under the fixed contract over the tested 1000-day sample.
Overall, over the 1000 independent out-of-sample days, implementing the fixed S2 contract under realized deviation netting reduces the alliance’s aggregate cost by 4.54% relative to S3 without storage. More importantly, when the S1 and S2 fixed contracts are operated under identical realized netting and settlement rules, the S2 contract reduces the aggregate cost by 5.97%, with the paired-bootstrap confidence interval remaining above zero. These results distinguish the effect of expected day-ahead deviation netting on contract formation from the ex-post contribution of realized netting and storage operation. The results also provide the data basis for allocating realized cooperative benefits among the different coalitions in the following section.
4.4. Allocation Results Based on Realized Incremental Benefits
To analyze the allocation of cooperative incremental benefits among the renewable energy stations, the 15 non-empty coalitions formed by the 4 stations are evaluated through ex-post settlement using the equilibrium rental prices of the grand coalition obtained under S2 in Section 4.2. The power and energy capacity rental prices are fixed at 2827.50 CNY/(MW·day) and 670 CNY/(MWh·day), respectively. Each coalition does not repeat the pricing game but independently optimizes its rented power and energy capacity using the frozen K = 10 representative scenarios and their probabilities. Once the rental scheme has been determined, the same 1000 out-of-sample days used in Section 4.3 are adopted to calculate the mean actual cost of each coalition following realized deviation netting, shared energy storage regulation, imbalance penalties, and real-time electricity trading.
Each individual station independently optimizes its storage rental quantities under the unified rental prices, and its mean actual cost is treated as the outside option when it does not participate in a larger coalition. The independent operating costs of W1, W2, PV1, and PV2 are 82,394.39, 201,051.03, 26,453.89, and 66,175.22 CNY/day, respectively, yielding a total of 376,074.55 CNY/day. Because the costs of the single-member coalitions are defined as the independent-operation baselines, their characteristic-function values are all zero.
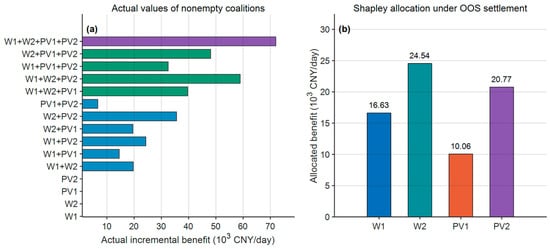
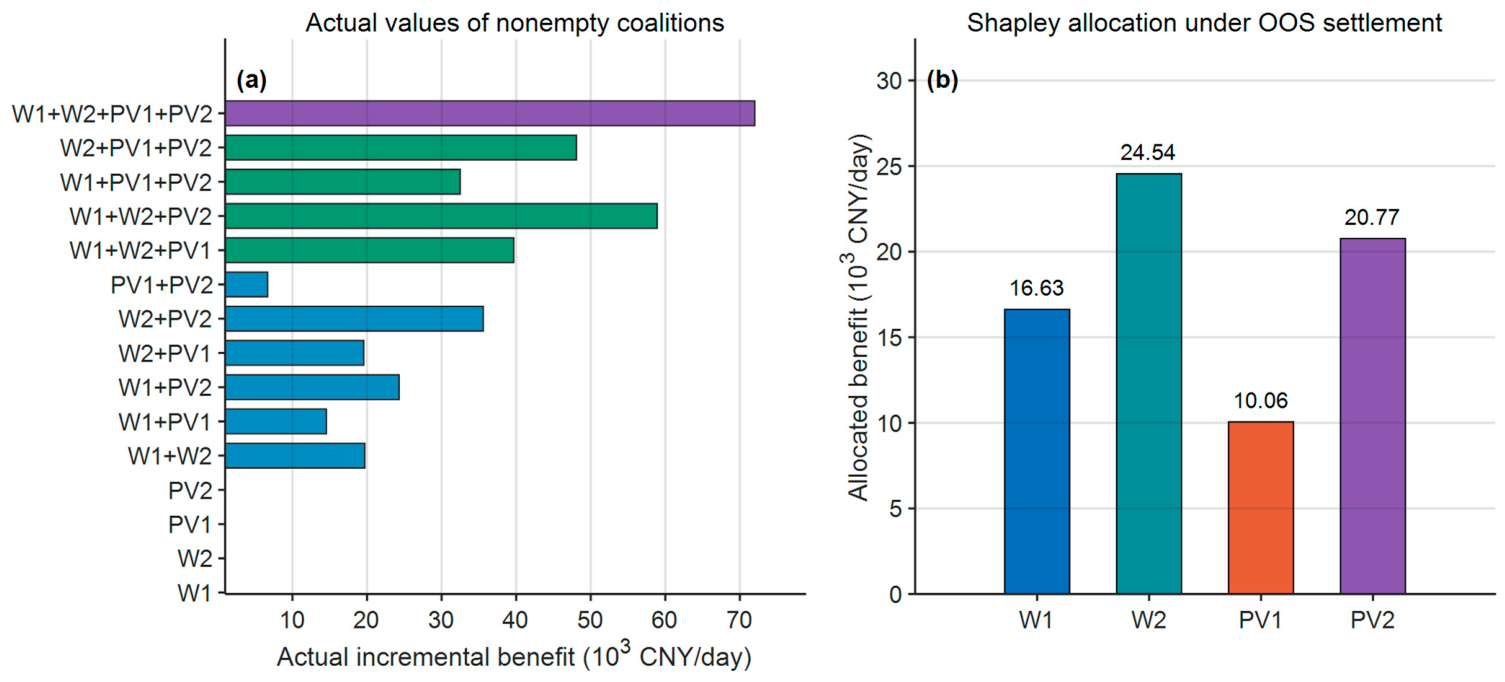
Figure 9a presents the realized cooperative incremental benefits of the 15 non-empty coalitions. All coalitions containing two or more stations generate positive incremental benefits, indicating that, under the specified deviation correlations, rental prices, and market-settlement conditions, every station combination can reduce its actual cost through internal deviation netting and coordinated storage rental. Among the two-station coalitions, W1 + W2, W1 + PV1, W2 + PV1, W1 + PV2, W2 + PV2, and PV1 + PV2 achieve incremental benefits of 19,703.79, 14,545.96, 19,560.26, 24,298.75, 35,584.52, and 6672.92 CNY/day, respectively. W2 + PV2 yields the highest incremental benefit among the two-station coalitions, whereas PV1 + PV2 yields the lowest. These results indicate that coalition value is not determined solely by installed capacity or renewable energy type but is also related to the directions of station-level deviations and their marginal netting capability.
Figure 9.
Realized incremental benefits and Shapley allocation based on the 1000-day out-of-sample settlement: (a) realized incremental benefits of the 15 non-empty coalitions; and (b) Shapley allocations of the grand coalition benefit.
As the coalition size increases, more combinations of deviations become available for internal netting. The incremental benefits of W1 + W2 + PV1, W1 + PV1 + PV2, W2 + PV1 + PV2, and W1 + W2 + PV2 are 39,671.88, 32,490.40, 48,083.03, and 58,916.01 CNY/day, respectively. The grand coalition comprising all four stations has a mean actual cost of 304,077.54 CNY/day and generates a realized cooperative incremental benefit of 71,997.01 CNY/day relative to the sum of the independent operating costs. This is the highest value among all coalition structures considered. Under the examined conditions, these results indicate that expanding the coalition generally increases the scope for deviation netting and produces positive scale effects.
The standard Shapley values calculated from the realized incremental benefits of the 15 coalitions are shown in Figure 9b. W1, W2, PV1, and PV2 are allocated 16,629.25, 24,543.47, 10,056.70, and 20,767.58 CNY/day, respectively. Their sum is 71,997.01 CNY/day, which is exactly equal to the realized incremental benefit of the grand coalition, thereby satisfying the efficiency condition. W2 receives the largest allocation, followed by PV2, indicating that these two stations make relatively high mean marginal contributions when joining different coalitions. Although PV1 receives a smaller absolute allocation, its lower independent operating cost results in a substantial relative cost improvement.
The standard Shapley values of all four stations are positive and satisfy the individual-rationality constraints; therefore, the correction procedure is not activated in this case study. After benefit allocation, the equivalent actual costs of W1, W2, PV1, and PV2 decrease to 65,765.14, 176,507.56, 16,397.20, and 45,407.64 CNY/day, corresponding to reductions of 20.18%, 12.21%, 38.02%, and 31.38% relative to independent operation. The equivalent cost of each station after allocation does not exceed its independent operating cost, and the sum of the final costs is exactly equal to the actual cost of the grand coalition, namely 304,077.54 CNY/day. The allocation therefore satisfies efficiency, budget balance, and individual rationality. Moreover, the Shapley allocation satisfies all 14 proper-coalition constraints, with no core violation. The most vulnerable proper coalition is W1+W2+PV2, whose core margin remains positive at 3024.30 CNY/day. Therefore, the allocation lies in the core under the examined conditions.
Overall, the characteristic function constructed from the out-of-sample ex-post settlement results captures the combined effects of coalition composition on deviation netting capability, shared energy storage rental demand, and actual operating costs. The Shapley method allocates the cooperative incremental benefit of the grand coalition according to the average marginal contribution of each station across different coalitions. In this case study, all stations receive positive allocated benefits, and the resulting allocation remains within the core.
4.5. Robustness Checks and Discussion
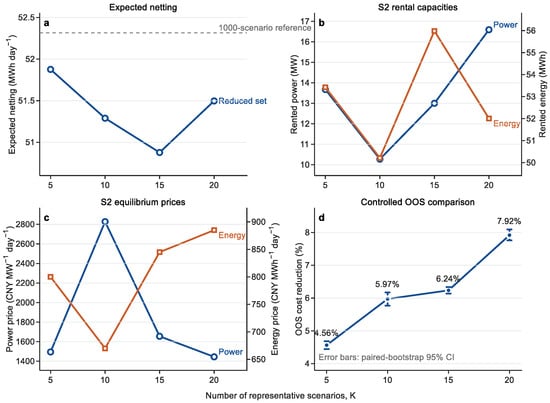
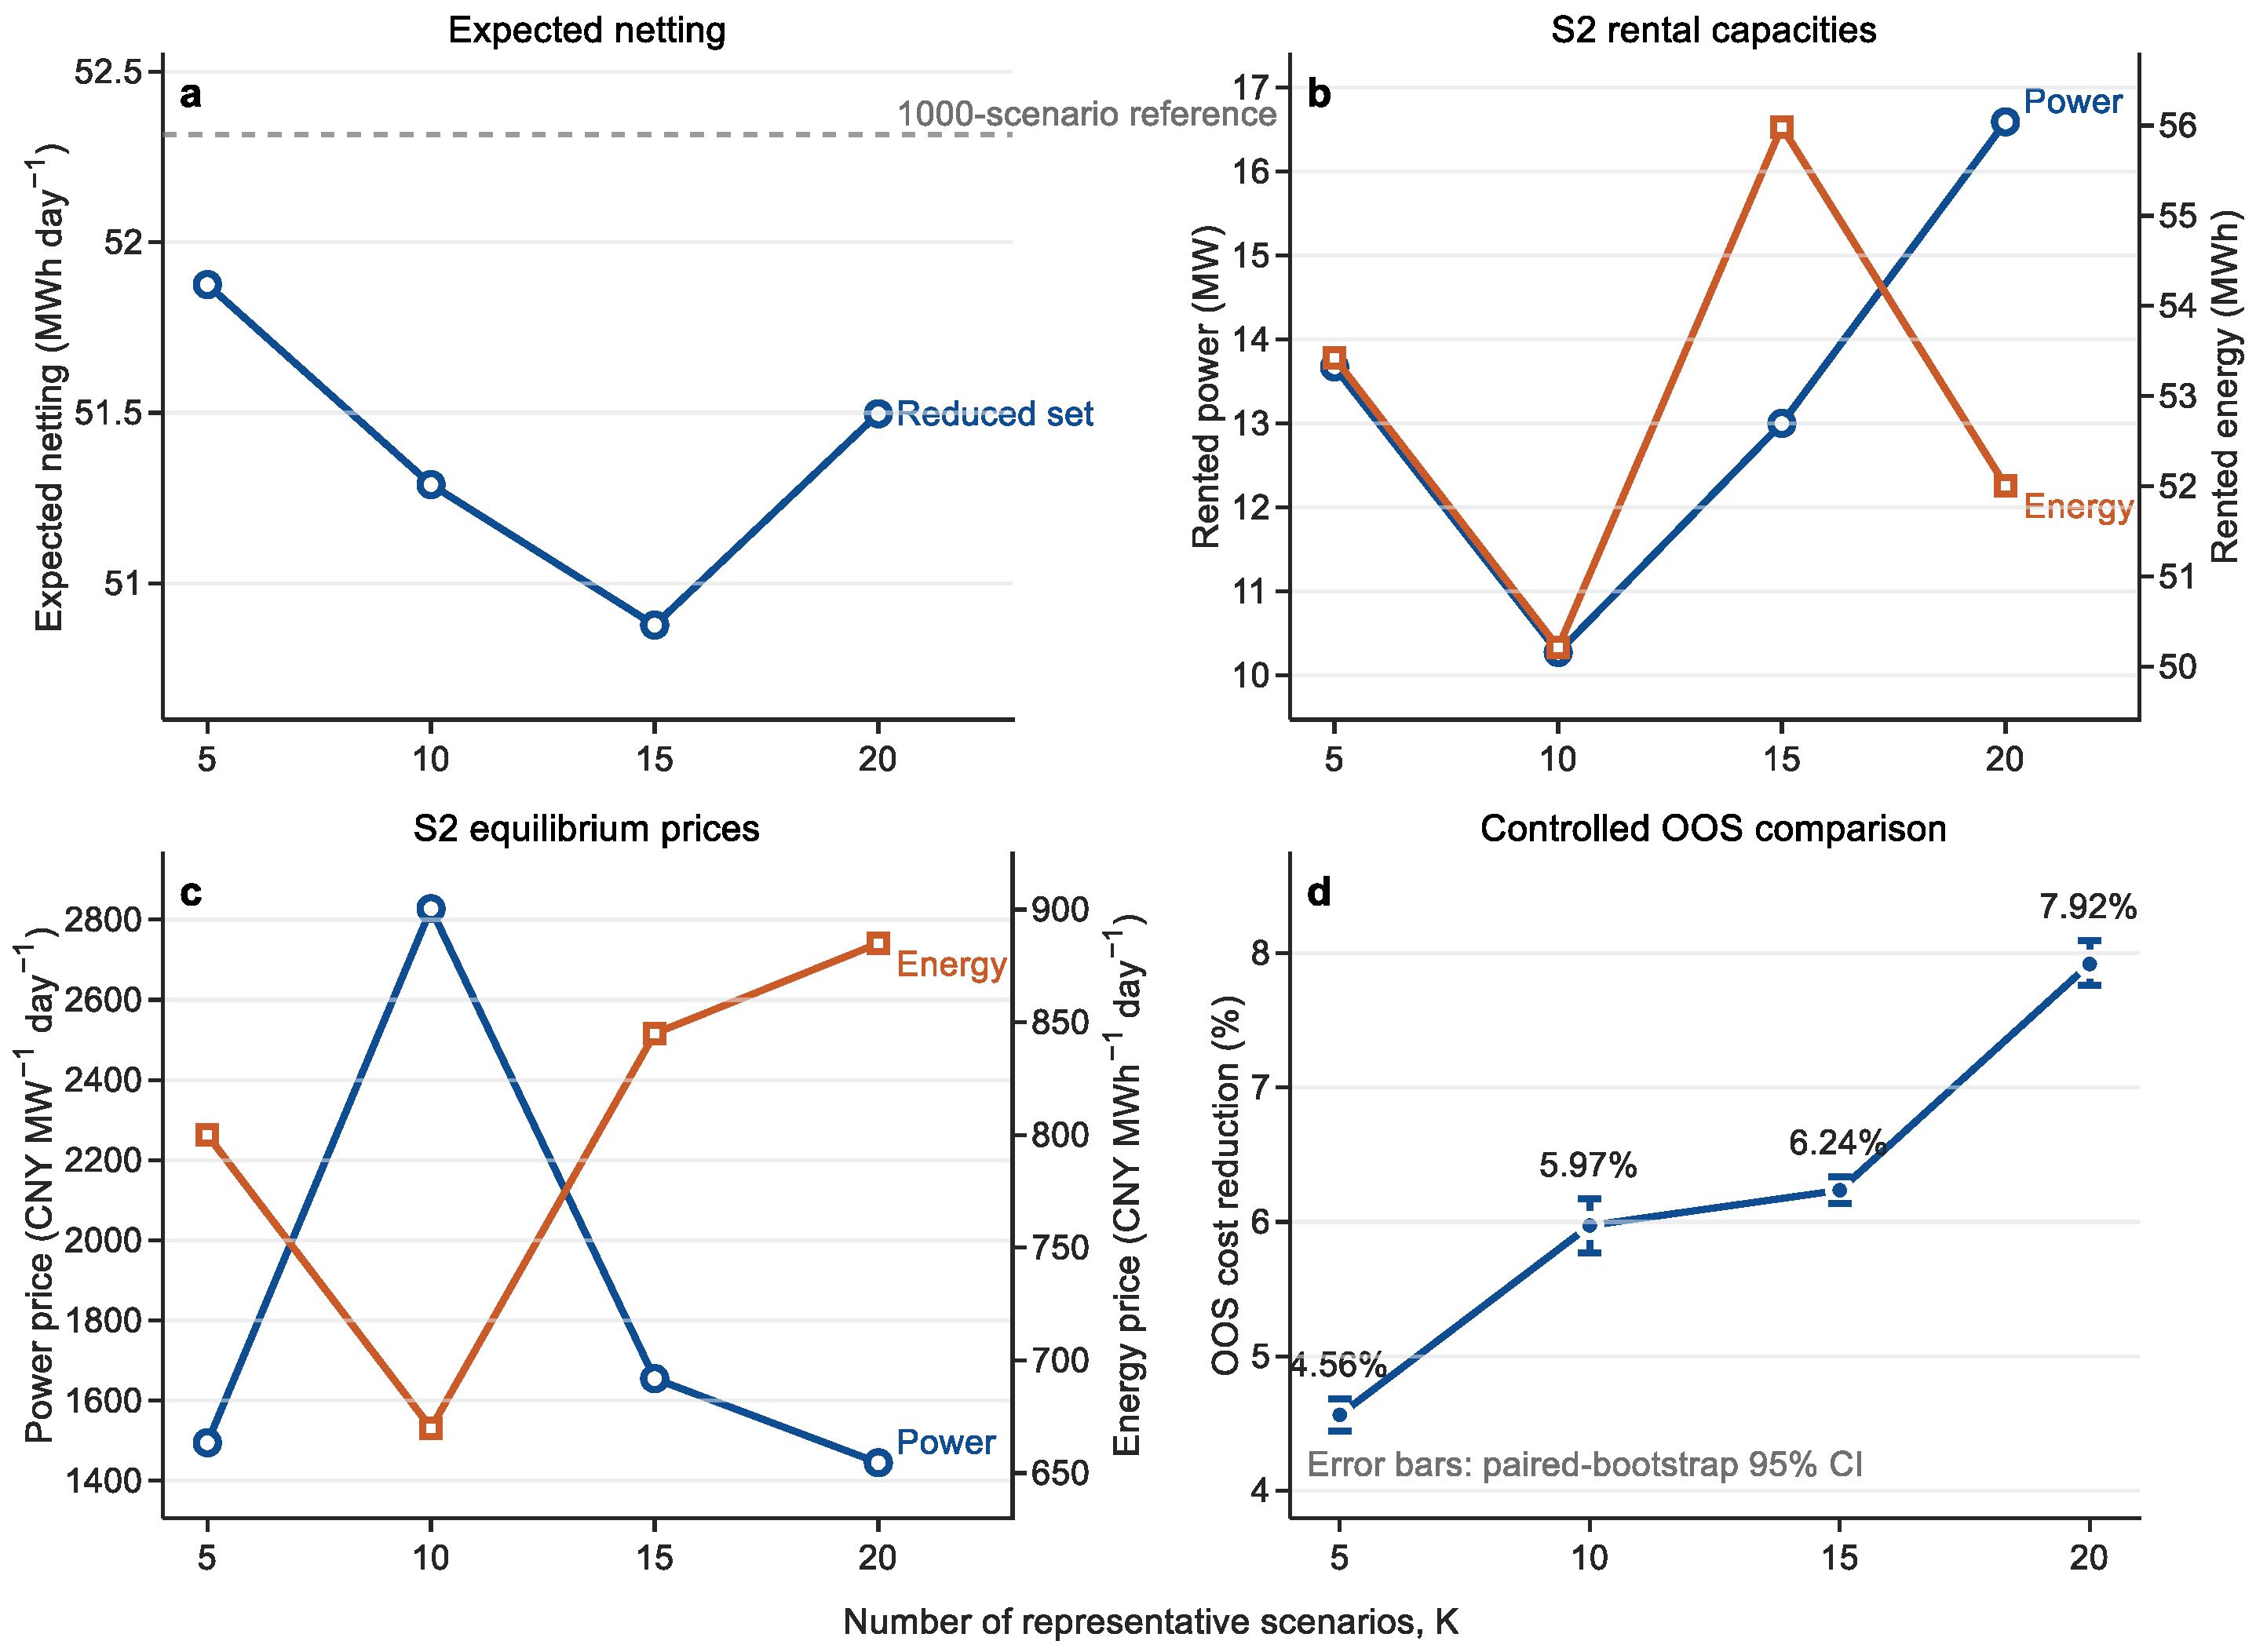
To assess sensitivity to scenario reduction, the complete Stackelberg equilibrium was reoptimized for K = 5, 10, 15, and 20. Each case used the same netting-aware scenario reduction distance, summary-feature weight of 4, and tariff search domain. The resulting S1 and S2 fixed contracts were then evaluated over the same 1000 out-of-sample days using identical realized netting and settlement rules.
Figure 10a compares the expected netting energy retained by the representative scenarios. The values for K = 5, 10, 15, and 20 are 51.88, 51.29, 50.88, and 51.50 MWh/day, respectively, compared with 52.32 MWh/day for the original 1000 scenarios. The corresponding absolute errors are 0.84%, 1.96%, 2.75%, and 1.57%. Although K = 5 most closely reproduces the mean netting energy, its weighted standard-deviation and quantile errors are 23.28% and 15.52%, respectively. The corresponding errors for K = 10 are 13.66% and 10.83%. Therefore, matching the mean netting energy alone does not establish the overall representativeness of a reduced scenario set.
Figure 10.
Sensitivity of the reoptimized Stackelberg equilibrium to K: (a) expected netting; (b) S2 rental capacities; (c) S2 equilibrium prices; and (d) S2-RN cost reduction relative to S1-RN.
Figure 10b,c show the reoptimized S2 rental decisions and equilibrium prices. Across the tested values of K, rented power ranges from 10.27 to 16.59 MW, while rented energy capacity ranges from 50.21 to 55.99 MWh. The equilibrium power and energy capacity rental prices range from 1445 to 2827.5 CNY/(MW·day) and from 670 to 885 CNY/(MWh·day), respectively. Their non-monotonic variation confirms that scenario reduction affects both rental demand and the resulting Stackelberg equilibrium.
Figure 10d reports the controlled out-of-sample comparison between S1-RN and S2-RN. For K = 5, 10, 15, and 20, S2-RN reduces mean out-of-sample cost relative to S1-RN by 4.56%, 5.97%, 6.24%, and 7.92%, respectively. The corresponding paired-bootstrap 95% confidence intervals are 4.45–4.68%, 5.77–6.17%, 6.13–6.34%, and 7.76–8.09%. All intervals exclude zero, supporting the qualitative conclusion that S2-RN is less costly under every tested value of K. However, the equilibrium prices and rental quantities do not numerically converge as K increases. At K = 20, the S1 power price reaches the prespecified upper search bound, so this result is interpreted cautiously. Accordingly, K = 10 was retained as the baseline because it satisfies the prespecified scenario-representation criteria while maintaining a moderate computational burden. This selection was made independently of the observed economic savings.
Several limitations remain. First, the stochastic parameters and market settings are treated as case study assumptions rather than universally applicable values. Second, the copper-plate representation omits transmission constraints, network losses, congestion, and market-specific restrictions on cross-station deviation netting. These factors may reduce feasible netting and its economic benefits in practice. Third, the equilibrium sensitivity analysis is restricted to the tested values of K. Finally, the coalition allocation uses the common grand-coalition tariff and remains conditional on the adopted prices, deviation model, and 1000-day settlement sample. Accordingly, the reported conclusions are limited to the tested conditions. Future research should estimate the dependence structure from measured operating data, incorporate explicit network and market constraints, and assess additional scenario numbers and market settings.
5. Conclusions
This study investigated how deviation netting among renewable energy stations affects day-ahead shared energy storage rental demand, the Stackelberg equilibrium, and the realized benefits of a fixed rental contract. A Shapley-based method was also developed to allocate the realized incremental benefits derived from the ex-post settlement results of different coalitions.
Within the assumptions and parameter settings of the case study, the results show that the correlations among station-level deviations and their netting potential affect the day-ahead shared energy storage equilibrium through the alliance’s rental response. After expected deviation netting was considered, the expected absolute deviation decreased from 550.96 to 448.38 MWh/day, representing a reduction of 18.62%, while the maximum expected hourly deviation decreased by 21.66%. Correspondingly, the equilibrium rented power decreased by 43.50%, whereas the rented energy capacity increased by 33.87%, and the alliance’s expected total cost decreased by 12.84%. Characterizing storage demand using the residual deviations after netting avoids directly aggregating offsetting station-level deviations, although the final rental quantities also depend on the endogenous power and energy prices. Under the examined conditions, the results also support a link between station-level deviation complementarity, the operator’s pricing decision, and the resulting rental equilibrium.
The fixed day-ahead rental contract exhibited overall economic effectiveness within the examined out-of-sample dataset. Under identical realized netting and settlement rules, the mean total cost decreased from 323,393.36 CNY/day for S1-RN to 304,077.54 CNY/day for S2-RN, corresponding to a reduction of 5.97% with a paired-bootstrap 95% confidence interval of 5.77–6.17%. Relative to no-storage operation under realized netting, the fixed S2 contract reduced the mean total cost from 318,553.36 CNY/day for S3 to 304,077.54 CNY/day for S4, corresponding to a reduction of 4.54% with a paired-bootstrap 95% confidence interval of 4.05–5.03%. S2-RN was less costly than S1-RN on 949 of the 1000 out-of-sample days, while S4 was less costly than S3 on 734 days. These results support the average economic effectiveness of the fixed contract but do not imply guaranteed savings on every operating day.
Constructing coalition values from ex-post settlement results rather than expected day-ahead benefits aligns benefit allocation with the realized marginal contributions of the stations. Relative to independent operation, the grand coalition generated a realized cooperative incremental benefit of 71,997.01 CNY/day. The Shapley allocations to W1, W2, PV1, and PV2 were 16,629.25, 24,543.47, 10,056.70, and 20,767.58 CNY/day, respectively. After allocation, the equivalent costs of the four stations decreased by 20.18%, 12.21%, 38.02%, and 31.38%, respectively. The allocation satisfied efficiency, budget balance, and individual rationality. It also satisfied all 14 proper-coalition constraints, with no core violation; therefore, the individual-rationality correction procedure was not triggered.
Overall, the case study evidence indicates that deviation netting affects both the actual use of shared energy storage and the day-ahead rental equilibrium by changing the alliance’s residual deviations and rental demand. By integrating rental decisions based on expected deviation netting, actual imbalance management under a fixed contract, and cooperative benefit allocation based on ex-post settlement, the proposed framework provides a consistent basis for evaluating shared energy storage rental schemes. These findings are established for the datasets, parameter settings, and market assumptions examined in this study. Their applicability to other renewable portfolios, market rules, and deviation distributions remains to be established.
Future research should investigate the emerging possibilities of using real market operational data, rolling contract adjustment mechanisms, and larger renewable energy station alliances. These extensions could clarify how changes in deviation distributions, market conditions, and coalition membership affect rental equilibria, contract risk, and benefit stability.
Author Contributions
Conceptualization, N.S. and H.D.; methodology, X.Y.; software, X.Y.; validation, N.S. and H.D.; formal analysis, X.Y.; investigation, Q.Q.; resources, H.H.; data curation, Q.Q.; writing—original draft preparation, X.Y.; writing—review and editing, N.S., H.D. and H.H.; supervision, N.S. and Q.Q.; project administration, N.S.; funding acquisition, N.S. All authors have read and agreed to the published version of the manuscript.
Funding
This research was funded by the Jiayuguan Science and Technology Bureau through the Major Science and Technology Special Project of Jiayuguan City, grant number QKJ25-05, and the Key Research and Development Program of Jiayuguan City, grant number 24-31, and by the Gansu Provincial Science and Technology Department through the Key Research and Development Program of Gansu Province, grant number 26YFGA021.
Institutional Review Board Statement
Not applicable.
Informed Consent Statement
Not applicable.
Data Availability Statement
The original contributions presented in this study are included in the article. Further inquiries can be directed to the corresponding author.
Conflicts of Interest
Author Qingfu Qi is employed by Jiayuguan Hongsheng Electric Heating Co., Ltd. The other authors declare no conflicts of interest.
References
- Silva-Rodriguez, L.; Sanjab, A.; Fumagalli, E.; Gibescu, M. Strategic bidding of variable renewable energy sources in light-robust day-ahead electricity markets. Appl. Energy 2025, 381, 125056. [Google Scholar] [CrossRef] [Scilit]
- Visser, L.R.; AlSkaif, T.A.; Khurram, A.; Kleissl, J.; van Sark, W.G.J.H.M. Probabilistic solar power forecasting: An economic and technical evaluation of an optimal market bidding strategy. Appl. Energy 2024, 370, 123573. [Google Scholar] [CrossRef] [Scilit]
- Yang, X.; Fan, L.; Li, X.; Meng, L. Day-ahead and real-time market bidding and scheduling strategy for wind power participation based on shared energy storage. Electr. Power Syst. Res. 2023, 214, 108903. [Google Scholar] [CrossRef] [Scilit]
- Thomaidis, N.S.; Christodoulou, T.; Santos-Alamillos, F.J. Handling the risk dimensions of wind energy generation. Appl. Energy 2023, 339, 120925. [Google Scholar] [CrossRef] [Scilit]
- Li, X.; Chen, L.; Sun, F.; Hao, Y.; Du, X.; Mei, S. Share or not share, the analysis of energy storage interaction of multiple renewable energy stations based on the evolution game. Renew. Energy 2023, 208, 679–692. [Google Scholar] [CrossRef] [Scilit]
- Pei, N.; Song, X.; Zhang, Z.; Peña-Mora, F. Optimizing the operation and allocating the cost of shared energy storage for multiple renewable energy stations in power generation side. Energy Convers. Manag. 2024, 302, 118148. [Google Scholar] [CrossRef] [Scilit]
- Talihati, B.; Tao, S.; Fu, S.; Zhang, B.; Fan, H.; Li, Q.; Lv, X.; Sun, Y.; Wang, Y. Energy storage sharing in residential communities with controllable loads for enhanced operational efficiency and profitability. Appl. Energy 2024, 373, 123880. [Google Scholar] [CrossRef] [Scilit]
- Kong, S.; Wang, Y.; Xie, D. Battery energy scheduling and benefit distribution models under shared energy storage: A mini review. Front. Energy Res. 2023, 11, 1100214. [Google Scholar] [CrossRef] [Scilit]
- Li, L.; Peng, K.; Yang, X.; Liu, K. Coordinated design of multi-stakeholder community energy systems and shared energy storage under uncertain supply and demand: A game theoretical approach. Sustain. Cities Soc. 2024, 100, 105028. [Google Scholar] [CrossRef] [Scilit]
- Xu, C.; Zhang, T.; Si, L.; Yang, J.; Yu, H.; Wen, B.; Chen, G.; Qiu, W. Stackelberg game-based three-stage optimal pricing and planning strategy of hybrid shared energy storage. Front. Energy Res. 2023, 11, 1273929. [Google Scholar] [CrossRef] [Scilit]
- Han, X.; Fang, X.; Tan, B.; Li, Z.; Luo, R. Two-stage operation strategy for leasing shared energy storage to renewable power producers with bounded rationality. J. Energy Storage 2025, 123, 116729. [Google Scholar] [CrossRef] [Scilit]
- Li, J.; Zhao, Z.; Wang, X.; Zhu, X.; Liu, H.; Zhao, Z.; Zhou, H.; Li, Z.; Li, C. Optimized configuration of shared energy storage in renewable energy power plants considering multiple master–slave game pricing modes. J. Energy Storage 2025, 115, 116012. [Google Scholar] [CrossRef] [Scilit]
- Zhu, X.; Zhao, G.; Li, J.; Liu, H.; Zhao, Z.; Li, C.; Li, Z.; Zhou, H. Stackelberg game for shared energy storage and wind farm bilateral trading with multi-market participation. Energy 2025, 326, 136238. [Google Scholar] [CrossRef] [Scilit]
- Yang, H.; Yang, Z.; Gong, M.; Tang, K.; Shen, Y.; Zhang, D. Commercial operation mode of shared energy storage system considering power transaction satisfaction of renewable energy power plants. J. Energy Storage 2025, 105, 114738. [Google Scholar] [CrossRef] [Scilit]
- Yang, X.; Yi, X.; Wang, H.; Li, L. Shared energy storage with multi-microgrids: Coordinated development and economic–social–environmental comprehensive assessment under supply–demand uncertainties. Renew. Energy 2025, 249, 123101. [Google Scholar] [CrossRef] [Scilit]
- Wang, C.; Wei, W.; Chen, L.; Gong, Y.; Mei, S. An hourly-resolution capacity sharing market for generation-side clustered renewable-storage plants. Appl. Energy 2025, 380, 124964. [Google Scholar] [CrossRef] [Scilit]
- Liu, J.; Wu, J.; Lei, Z. Two-stage optimization strategy for market-oriented lease of shared energy storage in wind farm clusters. Energies 2025, 18, 2697. [Google Scholar] [CrossRef] [Scilit]
- Song, X.; Zhang, H.; Fan, L.; Zhang, Z.; Peña-Mora, F. Planning shared energy storage systems for the spatio-temporal coordination of multi-site renewable energy sources on the power generation side. Energy 2023, 282, 128976. [Google Scholar] [CrossRef] [Scilit]
- Ju, L.; Bai, X.; Li, G.; Gan, W.; Qi, X.; Ye, F. Two-stage robust transaction optimization model and benefit allocation strategy for new energy power stations with shared energy storage considering green certificate and virtual energy storage mode. Appl. Energy 2024, 362, 122996. [Google Scholar] [CrossRef] [Scilit]
- Gui, Y.; Wang, J.; Zhao, Y.; Wang, L.; Jiang, C. Two-stage robust optimization operation strategy for clustered renewable energy stations and shared energy storage considering green power trading. J. Shanghai Jiao Tong Univ. 2025; Advance online publication. (In Chinese) [CrossRef]
- Wessel, E.; Smets, R.; Delarue, E. Risk-aware participation in day-ahead and real-time balancing markets for energy storage systems. Electr. Power Syst. Res. 2024, 235, 110741. [Google Scholar] [CrossRef] [Scilit]
- He, Y.; Xiao, J.-W.; Wang, Y.-W.; Liu, Z.-W.; He, S.-Y. Subjective-uncertainty-oriented dynamic renting framework for energy storage sharing. Appl. Energy 2025, 378, 124765. [Google Scholar] [CrossRef] [Scilit]
- Yang, F.; Xu, T.; Li, Y.; Ying, F.; He, Z. Two-stage coordinated bidding and revenue sharing strategies for wind farm consortia. Energies 2026, 19, 3509. [Google Scholar] [CrossRef] [Scilit]
- Lu, Q.; Yang, Y.; Xie, P.; Chen, Y.; Wu, J.; Lei, Z. Two-stage optimal operation strategy of wind farm cluster leasing shared energy storage. Power Syst. Technol. 2024, 48, 1146–1159. (In Chinese) [Google Scholar] [CrossRef]
- Zhang, T.; Qiu, W.; Zhang, Z.; Lin, Z.; Ding, Y.; Wang, Y.; Wang, L.; Yang, L. Optimal bidding strategy and profit allocation method for shared energy storage-assisted VPP in joint energy and regulation markets. Appl. Energy 2023, 329, 120158. [Google Scholar] [CrossRef] [Scilit]
- Cremers, S.; Robu, V.; Zhang, P.; Andoni, M.; Norbu, S.; Flynn, D. Efficient methods for approximating the Shapley value for asset sharing in energy communities. Appl. Energy 2023, 331, 120328. [Google Scholar] [CrossRef] [Scilit]
- Gomes, L.; Vale, Z. Costless renewable energy distribution model based on cooperative game theory for energy communities considering its members’ active contributions. Sustain. Cities Soc. 2024, 101, 105060. [Google Scholar] [CrossRef] [Scilit]
- Kong, X.; Mu, H.; Wang, H.; Li, N. Independence enhancement of distributed generation systems by integrating shared energy storage system and energy community with internal market. Int. J. Electr. Power Energy Syst. 2023, 153, 109361. [Google Scholar] [CrossRef] [Scilit]
- Hao, J.; Yan, G.; Pei, H.; Zhao, Y.; Hao, J. Revenue allocation strategy for cooperation alliance of distributed new energies and shared energy storage in the distribution network based on contribution degree. Energy Storage Sci. Technol. 2025, 14, 2462–2472. (In Chinese) [Google Scholar] [CrossRef]
- Hou, L.; Tong, X.; Chen, H.; Fan, L.; Liu, T.; Liu, W.; Liu, T. Optimized scheduling of smart community energy systems considering demand response and shared energy storage. Energy 2024, 295, 131066. [Google Scholar] [CrossRef] [Scilit]
- Kachalla, I.A.; Ghiaus, C. Forecasting hot water consumption demand for residential dwellings using hybrid regression technique. In Proceedings of the 2024 IEEE International Conference on Green Energy and Smart Systems (GESS); IEEE: Piscataway, NJ, USA, 2024; pp. 1–6. [Google Scholar] [CrossRef] [Scilit]
- Kachalla, I.A.; Ghiaus, C.; Ademuwagun, A. Energy management in residential dwellings: Forecasting hot water demand with hybrid machine learning models. In Proceedings of the 2024 9th IEEE Workshop on the Electronic Grid (eGRID); IEEE: Piscataway, NJ, USA, 2024; pp. 1–6. [Google Scholar] [CrossRef] [Scilit]
- Momoh, M.O.; Ubadike, O.C.; Kachalla, I.A.; Isa-Bello, M.A.; Chinedu, P.U.; Abdullahi, M.B. VSS-LMS: LMS algorithm experimental approach. Mekatronika 2021, 3, 31–36. [Google Scholar] [CrossRef] [Scilit]

Disclaimer/Publisher’s Note: The statements, opinions and data contained in all publications are solely those of the individual author(s) and contributor(s) and not of MDPI and/or the editor(s). MDPI and/or the editor(s) disclaim responsibility for any injury to people or property resulting from any ideas, methods, instructions or products referred to in the content. |
© 2026 by the authors. Licensee MDPI, Basel, Switzerland. This article is an open access article distributed under the terms and conditions of the Creative Commons Attribution (CC BY) license.