


Abstract
Hotels face intensifying pressure to measure and reduce their carbon footprint under the Corporate Sustainability Reporting Directive and adjacent frameworks, yet property-level benchmark data at national scale remains scarce and the boundary conventions applied by widely deployed sector frameworks may not adequately capture the sector’s actual footprint. Drawing on primary carbon audit data from 36 Irish hotels across 15 counties and star ratings from 2 to 5, this paper establishes the first comprehensive property-level carbon benchmark for the Irish hotel sector. Non-energy consumption data was available for 31 of these properties, and composition analyses are reported on that sub-sample. Emissions were calculated across Scope 1 combustion, Scope 2 electricity, and Scope 3 waste and water categories using SEAI (Sustainable Energy Authority of Ireland) and DEFRA (Department for Environment, Food and Rural Affairs) emission factors, standardised on per-guest-per-night and per-room-per-year intensity metrics. The analysis proceeded through descriptive statistics, multivariate ordinary least squares regression, and k-means cluster analysis. The findings show a 10.5-fold variation in per-guest emissions across the sample (mean 9.6 kg CO2e, median 8.0 kg CO2e), with the widely used energy-only accounting boundary underestimating hotel emissions by approximately 16% because it excludes the waste and water categories, which this study finds account for a mean of 16% of total property emissions. Within the waste category, food waste at 43.9% is nearly equal to landfill at 55.8%, identifying food waste diversion as a specific high-leverage intervention. Combined fossil heating sources contribute 60.8% of energy emissions, identifying heating decarbonisation as the primary energy lever. Room count emerges as the sole significant structural predictor of intensity (β = −0.53, p = 0.002) within a statistically significant multivariate model (F(4,31) = 3.57, p = 0.017, R2 = 0.315), with the apparent luxury emissions premium operating through size distribution rather than star rating itself. The findings support a differentiated, size-sensitive, waste-inclusive approach to hotel decarbonisation that current sector benchmarks do not fully accommodate.
1. Introduction
The tourism sector accounts for approximately 8% of global anthropogenic greenhouse gas emissions, with the accommodation industry among its most resource-intensive components Lenzen, Sun [1,2]. Hotels combine continuous operation, intensive service delivery, and substantial procurement of energy, water, food, and consumables. Recent evidence suggests that a meaningful share of a hotel’s carbon footprint sits in energy use for heating, hot water, cooling, and electricity, with waste, food, and water contributing further [3,4]. As the sector faces intensifying disclosure requirements under the Corporate Sustainability Reporting Directive and voluntary frameworks such as the Sustainable Hospitality Alliance’s Pathway to Net Positive Hospitality, the capacity to measure and compare carbon performance across properties has become a substantive practical and analytical concern.
Robust benchmarking data at the property level, however, remains scarce outside a small number of national contexts. The Hotel Carbon Measurement Initiative and the Cornell Hotel Sustainability Benchmarking Index provide global averages, but the range of within-sector variation and the specific structural predictors of performance in individual national settings are inconsistently documented [5]. For Ireland, no comprehensive property-level carbon benchmark of the hotel sector currently exists in the peer-reviewed literature. This absence is analytically consequential. Ireland has an unusual grid mix profile with only 36% renewable share as of 2023 [6], a hospitality sector dominated by small and medium-sized properties, and an active national programme (Fáilte Ireland’s Climate Action Programme) targeting sector-wide decarbonisation. The absence of empirical benchmarks means that neither operators, policymakers, nor certification bodies have grounded evidence against which to interpret individual property performance.
Prior research has documented uneven distribution of environmentally sustainable practices across hotel property types [2,3,4], and has identified property scale, star rating, and location as candidate structural variables shaping environmental outcomes [7]. Findings across these studies are however contradictory. Some evidence suggests larger properties achieve lower per-guest emissions through economies of scale in energy systems, while other work reports that higher service intensity in larger properties outweighs efficiency gains [5]. Star-rating effects are similarly contested: luxury properties may invest more heavily in efficient technologies, yet also operate more intensive service standards. The empirical evidence needed to adjudicate between these positions, particularly at the national scale, is limited.
The present study addresses this gap through a benchmarking analysis of 36 Irish hotels, drawn from a wider audit programme conducted in 2025 and 2026. The study established property-level carbon intensity metrics using a standardised measurement methodology, tested which structural characteristics predict performance, and identified clusters of hotels with distinct emissions profiles. The paper is guided by three research questions:
- RQ1. How does carbon emissions intensity vary across the Irish hotel sample, and how does this variation compare with international benchmarks?
- RQ2. Which energy and resource categories are the principal drivers of hotel emissions, and how does their relative contribution differ across property types?
- RQ3. Which structural characteristics of hotels significantly predict differences in carbon performance?
The paper makes four specific contributions. Empirically, it provides the first comprehensive property-level carbon benchmark of the Irish hotel sector, documenting a 10.5-fold variation in per-guest emissions intensity across the sample. Methodologically, it applies to a multivariate regression framework to test the simultaneous effect of star rating, property scale, occupancy, and location on emissions performance. Analytically, it identifies specific performance clusters that reveal the concentration of high emissions in smaller, higher-star properties, contradicting the assumption that luxury properties are automatically more sustainable through investment. The findings carry direct implications for hotel operators seeking priorities for decarbonization interventions, for policymakers designing sector-wide targets, and for certification bodies calibrating performance thresholds.
The empirical evidence presented in this paper supports specific claims: that the Irish hotel sector shows substantial within-sector variation in carbon performance, that room count rather than star rating is the dominant structural predictor of intensity, and that widely used sector benchmarks systematically under-report hotel emissions by drawing the boundary at energy sources alone.
This paper makes four contributions to tourism sustainability literature. First, it establishes a comprehensive property-level carbon benchmark for the Irish hotel sector, addressing a specific national evidence gap in the international benchmarking literature. Second, it applies an integrated Scope 1, Scope 2, and Scope 3 accounting boundary that captures energy, waste, and water sources within a single measurement framework, extending beyond the energy-only or single-scope conventions that dominate the existing hotel carbon literature. Third, it tests the structural predictors of per-guest emissions in a multivariate framework, adjudicating the contested international evidence on whether size, star rating, occupancy, or location is the operative driver of hotel carbon performance. Fourth, it examines the compositional structure of hotel emissions across energy, waste, and water categories, with attention to whether the accounting boundary applied by widely used sector frameworks is sufficient for the sector’s actual footprint.
The paper is structured as follows. Section 1 reviews the literature on hotel environmental performance, carbon accounting frameworks, and the structural predictors of performance. Section 2 sets out the sample, emission factors, and analytical methods. Section 3 presents the results across the three research questions. Section 4 discusses the findings in the light of the international literature and considers their implications. Section 5 concludes with limitations and directions for future research.
1.1. Hotel Environmental Impact and Carbon Accounting Frameworks
Accommodation is a substantial component of this footprint. Hotels rank among the most energy-intensive commercial building types because they operate continuously and hold extensive service inventories [8]. Establishing the magnitude of these impacts requires accurate assessment, and several methodological traditions have emerged. Life cycle assessment and its simplified derivative, life cycle energy analysis, have both been applied to appraise the carbon impact of tourist accommodation [8]. Filimonau, Dickinson [8] reviewed these approaches and argued that the field needs benchmarks disaggregated by star rating, size, and location before cross-property comparison becomes reliable. Castellani and Sala [9] compared ecological footprint and life cycle assessment methods, showing that method choice materially shapes reported outcomes. Hu, Huang [10] applied a complete life cycle inventory to a Taiwanese international tourist hotel and demonstrated that functional unit selection changes the interpretation of results, with occupancy rate significantly affecting emissions during a one-night stay [8].
Practitioner frameworks have developed in parallel. The Hotel Carbon Measurement Initiative provides a standardised methodology for Scope 1 and Scope 2 emissions, together with outsourced laundry, and has been adopted by over 30,000 hotels worldwide, including Hyatt, Marriott International, and the Radisson Hotel Group, according to the World Sustainable Hospitality Alliance. This operational simplicity supported widespread uptake, but institutionalised an energy-centric boundary that omits supply-chain emissions [8]. The tension between comprehensive life cycle scope and operational tractability remains a defining feature of the field, and it shapes what any national benchmark can credibly measure [11].
1.2. Sector Benchmarking Initiatives and Comparative Studies
The most extensive benchmarking initiative is the Cornell Hotel Sustainability Benchmarking Index, which incorporates the Hotel Carbon Measurement Initiative and Hotel Water Measurement Initiative methodologies. Ricaurte and Jagarajan [12] reported that 25,576 hotels from 31 international hotel groups, spanning 64 countries and 88 climate zones and reporting calendar-year 2021 data, contributed to the ninth annual index, the first post-pandemic benchmark. Their analysis found that five-star hotels showed a 24.87% reduction in greenhouse gas emissions and a 20.93% energy reduction against 2019, although luxury hotels showed the smallest emissions decrease at 3.14% and upper-upscale properties the largest at 11.09%. The index also revealed wide geographic variation in carbon intensity per square metre, driven substantially by national grid mix. These findings position grid decarbonisation as a primary lever, and they establish the benchmarking logic that the present study extends to Ireland.
National and regional benchmarking studies have refined this picture. Chan and Lam [13] surveyed 17 Hong Kong hotels and found gross floor area to be the major statistically significant predictor of electricity consumption, with average use of about 342 kWh per square metre per year. Xuchao, Priyadarsini [14] established a regression-based benchmarking model for Singapore hotels, reporting strong explanatory power but cautioning that carbon intensity rankings are sensitive to the normalising denominator chosen. Puig, Kiliç [15] analysed 14 Spanish coastland hotels spanning two to five stars using life cycle inventory. Coles, Dinan [16] used external benchmarking of historic UK premises to reveal unnecessary overconsumption that internal review had not uncovered. de Grosbois and Fennell [17] conducted a content analysis of 183 hotel companies, examining the determinants of carbon disclosure rather than performance itself. Collectively, these studies show that benchmarking value depends on consistent boundaries and appropriate normalisation, yet no equivalent multi-property carbon benchmark exists for the Irish hotel sector.
1.3. Structural Predictors of Hotel Carbon Performance
The literature offers contradictory evidence on which structural attributes predict hotel emissions, and the present study is positioned directly against that disagreement. Building size is the most consistently supported predictor. Chan and Lam [13] identified gross floor area as the dominant driver of electricity consumption in Hong Kong, and Xuchao, Priyadarsini [14] confirmed the importance of building and operational features in Singapore. Comfort category is also frequently implicated. Filimonau, Rosa [2], comparing hostels and budget and luxury hotels in Brazil and Peru, found carbon footprint correlated with comfort category, with luxury properties among the highest emitters. Tsai, Lin [18] similarly reported that higher service levels produced higher emissions per person-night in Taiwan. Chen and Hsieh found that higher-star hotels carried a larger ecological footprint per bed [2].
Occupancy presents the sharpest contradiction. Puig, Kiliç [15] concluded that occupancy rate was the main source of variability in inventory data across their Spanish sample. In direct contrast, Lai [19], examining three Hong Kong archetypes under Scopes 1 to 3, found that emissions correlated strongly with outdoor air temperature rather than occupancy rate, which showed no significant correlation. Priyadarsini et al. and later Hong Kong studies likewise reported statistically insignificant occupancy effects, whereas Hu, Huang [10] found that occupancy significantly affected per-night emissions. This unresolved disagreement suggests that occupancy effects are contingent on sample composition, normalisation method, and building type. Lai [19] further demonstrated that normalising emissions by floor area versus room number produced different property rankings, echoing the caution of Xuchao, Priyadarsini [14]. Oluseyi, Babatunde [20] found that energy per guestroom correlated significantly with carbon dioxide emissions across 28 Lagos hotels. Zhang and Xia [21] applied an environmentally extended input–output and Super-SBM model to Chinese tourist hotels from 2002 to 2022, identifying pollution-control investment and energy-saving technology as drivers of carbon efficiency, thereby shifting attention from static attributes to dynamic management factors [15].
1.4. Composition of Emissions Across Categories
Studies consistently identify energy as the dominant source of hotel operational emissions, but they diverge on the share held by non-energy categories. Lai [19] and Lai, Yik [22] both found purchased electricity to be the dominant contributor in Hong Kong, with liquefied petroleum gas and generator use negligible. Abeydeera and Karunasena [23] reported that Scope 2 emissions dominated across five Sri Lankan luxury hotels. Puig, Kiliç [15] found electricity and fuel consumption produced more than 75% of the impact in Spanish hotels. Chan and Lam [24] showed electricity consumption correlating with gross floor area. Several studies caution, however, against an exclusively energy-centric view. Hu, Huang [10] found that non-energy activities, such as the production and transportation of hotel amenities and laundry, contributed 15.90% of the footprint in the baseline year and 16.03% in the reduction year, values that they emphasised are larger than the 5% cutoff rule according to PAS 2050. Orfanou et al. [25] studying a five-star resort in northern Greece, attributed 81% of emissions per guest night to energy, 11% to food waste, 5% to other waste and 3% to propane. Waste and water thus emerge as material, if secondary categories. Singh, Allen [26] quantified the carbon and cost savings available through recycling and waste diversion in US and Delhi hotels, while Nhubu and Mbohwa [27] confirmed landfill as the worst food-waste option in Zimbabwe. Gössling, Garrod [28] documented the carbon intensity of food in tourism, and Ruiz Molina, Belda-Miquel [29] argued that hotels neglect several dimensions of sustainable food management [19].
1.5. Gap Statement and Study Contribution
Three gaps emerge from this review. First, despite the maturity of international benchmarking, no comprehensive multi-property carbon benchmark exists for the Irish hotel sector, which operates on a distinctive electricity grid and under Fáilte Ireland’s Climate Action Programme Fáilte Ireland [30], launched in 2024 with a dedicated expert advisor offered to each participating business over an initial three-year period. Second, the contradictory evidence on structural predictors, particularly the occupancy dispute between Puig, Kiliç [15] and Lai [19], has not been adjudicated using a primary Irish dataset with harmonised emission factors. Third, the composition of Irish hotel emissions across the energy, waste, and water categories has not been quantified against international comparators. This study addresses these gaps through a primary carbon audit of 36 Irish hotels spanning star ratings two to five, room counts of 13 to 505, and 15 counties, using SEAI [6] and DEFRA [31] emission factors. It positions its findings against the most recent international work, including Ricaurte and Jagarajan [12], Zhang and Xia [21], and Orfanou, Klontza [25].
Table 1 summarises the empirical studies most relevant to the present analysis, positioned by country of sample, methodological approach, and headline finding. The table foregrounds the methodological plurality of the field, from HCMI-based benchmarking indices to full life cycle assessments and dynamic efficiency modelling and shows that no single study offers a comprehensive property-level benchmark for the Irish sector. It also foregrounds the empirical contradictions running through the field, particularly concerning the role of occupancy, the effect of star rating, and the appropriate boundary for hotel carbon accounting. Taken together, the review establishes that hotel sustainability is unevenly documented across national contexts, that its empirical predictors remain contested, and that composition analyses have progressively revealed non-energy sources as material contributors that widely used sector frameworks systematically underestimate. The Irish hotel sector has yet to receive comprehensive multi-property benchmarking, and the specific structural mechanisms that shape its emissions distribution have not been examined through primary quantitative evidence.
Table 1.
Summary of key benchmarking and carbon-accounting studies.
The empirical work reported below addresses these gaps through a primary carbon audit of the Irish hotel sector, using a standardised methodology and analytical framework described in Section 2.
2. Materials and Methods
This section sets out the sampling strategy, data collection procedure, emission factors, analytical methods, and ethical considerations of the study. The design is quantitative and cross-sectional, applied to primary carbon audit data collected from 36 Irish hotels between 2025. The methodology follows the boundaries of the Greenhouse Gas Protocol Scope 1 and Scope 2 categories, extended to selected Scope 3 waste and water sources where property-level data was available [33]. Emissions accounting in this study follows the Greenhouse Gas Protocol scope architecture, applying SEAI and DEFRA conversion factors and benchmarking against the Hotel Carbon Measurement Initiative and the Cornell Hotel Sustainability Benchmarking Index. The consumption categories audited, energy, water, and waste (including food waste), correspond closely to the operational domains addressed by the Green Key international criteria for hotels [34], an eco-certification programme whose criteria cover energy and carbon, water, waste, and procurement, including food and beverage practices. Green Key therefore provides a practice-based reference point for the domains measured here: it specifies what certified hotels are expected to do in each area, while the present study quantifies the emissions those areas produce. Green Key criteria were not applied as an audit instrument in this study.
2.1. Research Design and Paradigm
The study adopted a quantitative paradigm appropriate to the analytical objective of benchmarking measurable environmental performance across properties [35]. A cross-sectional design was selected because the analytical concern is with the distribution of performance across the sample at a defined point in the intensifying regulatory environment, rather than with longitudinal change. The design is descriptive and inferential: descriptive statistics are used to characterise the sample and its performance distribution, and multivariate regression together with cluster analysis are used to test structural predictors and identify performance groups [36].
2.2. Sample and Sampling Strategy
The target population comprised operational hotels in the Republic of Ireland. Purposive sampling was applied to secure variation across the property characteristics analytically consequential for the study: star rating (2 to 5), property size, geographic location, and ownership structure. Inclusion criteria required that the property had been in continuous operation for at least twelve months prior to the audit and that a complete set of energy consumption records was available. The final sample of 36 hotels covers 15 counties across four regional tourism areas, star ratings from 2 to 5, and property sizes from 13 to 505 rooms. Complete consumption data across all four categories, energy, water, waste, and food waste, was available for 31 of the 36 properties. Five properties provided energy data, but not the non-energy records required for composition analysis, typically because waste contractor manifests were not retained or were held at group rather than property level. All 36 properties are therefore included in energy, intensity, regression, and cluster analyses, while the composition and boundary-sufficiency analyses reported in Section 3.3 and Section 4.2 use the 31-property sub-sample. The two sample definitions are stated explicitly wherever they are used. The sample composition is summarised in Table 2. Individual property identifiers are anonymised throughout the study and reporting. Hotels are referred to only by alphanumeric code where necessary and by aggregate characteristic in the results.
Table 2.
Sample composition.
2.3. Data Collection
Primary data was collected in 2025 through structured on-site carbon audits conducted using a standardised protocol (Appendix A.5) across all participating properties. The protocol covered five consumption categories aligned with the Greenhouse Gas Protocol framework: grid electricity (Scope 2), stationary combustion of natural gas, LPG, and heating oil (Scope 1), water consumption (Scope 3), and solid waste, including landfill, recycling, and food waste streams (Scope 3). Data was sourced from utility bills, purchase records, and waste contractor documentation covering a full twelve-month accounting period at each property. For five properties, non-energy data (food waste, water, and waste categories) was not available, and these observations are treated as energy-only in the analyses where relevant, with the missing-data handling explicitly documented. Property-level occupancy rates were reported directly by hotel operators as part of the audit programme, covering the same twelve-month accounting period as the consumption data. Reported occupancy rates were cross-checked against county-level annual averages published by Fáilte Ireland [30], and no substantive discrepancies were identified.
The Scope 3 categories included in this study are limited to waste and water, which are measurable through property-level records rather than the full range of upstream and downstream activities the Greenhouse Gas Protocol assigns to Scope 3. Waste data was obtained from contractor collection manifests, recording tonnage by treatment route (landfill, recycling, and, where segregated, food waste) for each property’s billing period. Water data was obtained from utility billing records. Each record was cross-checked against the property’s own consumption logs where available. Records with unexplained discrepancies exceeding 10% between the two sources were flagged, and where the discrepancy could not be resolved were excluded. This exclusion accounts for the reduction in the composition-analysis sample from 36 to 31 properties. Broader Scope 3 categories, including upstream food and beverage procurement, guest travel, and embodied construction emissions, lay outside the boundary of this study and are noted as a limitation in the end of this Section.
2.4. Emission Factors
Emissions were calculated by multiplying consumption values by category-specific emission factors drawn from established public sources. Table 3 sets out the factors, units, and sources applied throughout the analysis. Full source details for each factor are provided in Appendix A.1 (Table A1). Grid electricity and stationary combustion factors are drawn from Sustainable Energy Authority of Ireland (SEAI) data [6], reflecting the Irish national grid with 36% renewable share. Waste and food waste factors are drawn from the DEFRA [31] conversion factor set, which represents the most comprehensive publicly available factor set for material recovery and biological treatment pathways.
Table 3.
Emission factors applied.
The Irish grid emission factor of 0.197 kg CO2e per kWh represents the SEAI consumption-basis factor including transmission and distribution losses, reflecting the increasing renewable share on the Irish national grid. The DEFRA [31] recycling factor of 0.00469 kg CO2e per kg represents transport emissions to the material recovery facility only. The DEFRA methodology attributes downstream reprocessing and any material recovery credits to the recipient of the recovered material rather than to the waste producer.
2.5. Emission Calculation Formulas
Total emissions for each property were calculated as the sum of emissions across all applicable consumption categories using the standard activity-times-factor approach [33]:
where Ei,total is total annual emissions for hotel i in kg CO2e, Ai,j is the annual activity data for consumption category j at hotel i (in the appropriate unit as specified in Table 3), and EFj is the emission factor for category j from Table 3.
The energy component was calculated as:
Ei,energy = Ai,elec × EFelec + Ai,gas × EFgas + Ai,LPG × EFLPG + Ai,oil × EFoil
The waste component was calculated as:
Ei,waste = Ai,food × EFfood + Ai,landfill × EFlandfill + Ai,recycling × EFrecycling
Two intensity metrics were derived. Emissions per guest per night (Ii,guest) were calculated using guest capacity (Ci), annual occupancy rate (Oi), and 365 operating days:
Emissions per room per year (Ii,room) were calculated as:
where Ri is the room count of hotel i. Composition shares were calculated for each hotel as the ratio of category emissions to total emissions, and the sample means of these shares are reported in the results.
2.6. Data Analysis
The analysis proceeded in three stages, conducted in Python 3.11.5 using the pandas, scikit-learn, and stats models libraries, with results verified through independent precomputation.
Descriptive statistics were first calculated for total and standardised emissions across the sample, and the composition of emissions by source was examined for the 31 properties with complete data across all consumption categories. Composition analysis is based on these 31 properties. The five properties with energy-only data are excluded from composition calculations, but included in the intensity distribution and regression analyses.
Multivariate ordinary least squares (OLS) regression was then applied to test the effect of four structural predictors on emissions per guest per night. The regression model tested was:
where Iguest,i is emissions per guest per night for hotel i, Star is an ordinal variable ranging from 2 to 5, Rooms is the property’s room count, Occupancy is the county-level occupancy proxy (0 to 1), Urban is a binary variable coded 1 for hotels located in Dublin, Cork, Limerick, or Galway and 0 otherwise, and εi is the error term. Standardised coefficients (β) were computed by z-standardising all variables prior to regression to permit comparison of effect sizes across predictors with different scales.
Iguest,i = β0 + β1Stari + β2Roomsi + β3Occupancyi + β4Urbani + εi
Assumptions of the OLS model were tested. Normality of residuals was assessed through the Jarque–Bera test, autocorrelation through the Durbin–Watson statistic, homoscedasticity through the Breusch–Pagan test, and multicollinearity through the variance inflation factor (VIF), with values below 5 taken as indicating no concern.
Finally, k-means cluster analysis was applied to group properties by combined emissions intensity and size characteristics. Features were standardised using z-score transformation prior to clustering, and three clusters were retained based on within-cluster sum-of-squares evaluation. Clusters were interpreted through their mean emissions intensity, room count, star rating distribution, and location profile.
The k-means algorithm minimises the within-cluster sum of squares:
where Ck is cluster k, x is a data point in that cluster, and μk is the cluster centroid. Prior to clustering, the emissions intensity variable was z-standardised using:
where and s are the sample mean and standard deviation. The three-cluster solution was selected based on within-cluster sum-of-squares evaluation and interpretability of cluster boundaries. Cluster labels (low, mid, high) were assigned post hoc according to the ranking of cluster means on the emissions intensity variable.
2.7. Trustworthiness and Rigour
Several procedures supported the analytical rigour of the study. Data collection followed a standardised audit protocol applied uniformly across all 36 properties, reducing variability introduced by inconsistent measurement. Emission factors are drawn from established public sources [6,31] with documented methodological transparency. Missing data for five properties on non-energy categories is treated explicitly rather than imputed, and analyses affected by missingness are reported with the reduced sample size flagged. Regression outputs are reported in full, including coefficients, standard errors, t-statistics, and p-values, permitting independent evaluation.
2.8. Ethical Considerations
Ethical approval for the wider audit programme was granted by the researcher’s institution prior to the commencement of data collection. Each participating property provided informed consent for the use of anonymised data in academic reporting. Property names, addresses, and any characteristic combinations that could permit identification of individual hotels are excluded from the reporting. Individual properties are referred to only by alphanumeric code and are presented in aggregate form throughout the analysis. Occupancy rate is treated at county level rather than property level to protect confidentiality. Consumption data is retained on the researcher’s institutional server under password protection and will be permanently deleted at the end of the retention period specified by institutional policy.
2.9. Limitations of the Methodology
The methodology has boundaries that warrant explicit statement. The sample of 36 properties is drawn purposively from the Irish hotel sector, and while it captures substantial variation across the analytically consequential characteristics, it is not statistically representative of the population of Irish hotels. County-level occupancy rates serve as a proxy for property-level occupancy, which introduces a source of estimation error in the intensity metrics. Non-energy data is unavailable for five properties, reducing the sample size for composition analysis. The cross-sectional design captures a single accounting period and does not track how the patterns evolve over time. Emission factors reflect national averages and do not account for property-specific supply arrangements, such as renewable electricity purchasing agreements. These limitations are transparently reported in the Results and Discussion.
The methodology combined primary carbon audit data from 36 Irish hotels with standardised emission factors from SEAI [6] and DEFRA [31] to produce comparable per-guest and per-room intensity metrics. Analytical procedures include descriptive characterisation of the emissions distribution, multivariate ordinary least squares regression to test structural predictors, and k-means cluster analysis to identify performance groups within the sample. Ethical procedures, boundary limitations, and reproducibility considerations have been transparently reported. The approach positions the study to answer the three research questions through empirical evidence grounded in a standardised measurement framework, and the results that follow can be reproduced from the emission factors, formulas, and analytical procedures set out above.
3. Results
This section presents the results in seven parts: sample descriptives (Section 3.1), the distribution of emissions intensity (Section 3.2), the composition of emissions by source (Section 3.3), performance clusters (Section 3.4), structural predictors (Section 3.5), emissions by star rating and property size (Section 3.6), and a summary of findings (Section 3.7).
3.1. Sample Descriptives
The final sample comprised 36 Irish hotels spanning 15 counties: Dublin, Cork, Kerry, Limerick, Galway, Meath, Donegal, Clare, Cavan, Wicklow, Wexford, Mayo, Kilkenny, Kildare, and Westmeath. The distribution of the sample by county and regional tourism area is shown in Appendix A.6 (Table A5). The sample covers all four Fáilte Ireland regional tourism areas (Dublin, Ireland’s Ancient East, Ireland’s Hidden Heartlands, and Wild Atlantic Way) and star ratings from 2 to 5. Property sizes range from 13 to 505 rooms (mean 121, median 101, SD 95) and guest capacities range from 30 to 700 (mean 263). County-level annual occupancy rates range from 0.55 to 0.84 (mean 0.75, SD 0.06). Table 4 presents the descriptive statistics of the sample. The number of properties by star rating, size category and performance cluster is given in Appendix A.2 (Table A2).
Table 4.
Sample characteristics.
3.2. Distribution of Emissions Intensity
Total annual carbon emissions across the 36 properties range from approximately 103,000 kg CO2e to over 1,850,000 kg CO2e, with a mean of 548,273 kg CO2e and a median of 506,788 kg CO2e. The distribution is right-skewed (skewness 1.83), as a small number of very high emitters lift the mean above the median.
Standardised on a per-guest-per-night basis, emissions range from 2.46 to 25.79 kg CO2e, representing a 10.5-fold variation across the sample. The mean is 9.61 kg CO2e per guest per night (median 8.00, SD 6.11, interquartile range 5.08 to 12.71). The 90th percentile is 18.06 kg CO2e. Emissions per room per year mirror this pattern, with a mean of 6121 kg CO2e (median 4794, range 1716 to 19,264).
Figure 1 presents the distribution of per-guest emissions across the sample. The histogram shows a modal concentration in the 5–8 kg range containing most of the sample, with a long right tail of high emitters. The gap between the mean and median values reflects this asymmetric structure.
Figure 1.
Distribution of per-guest emissions histogram.
The calculation of per-guest emissions can be illustrated with reference to the sample statistics. For a property with total annual emissions of 548,273 kg CO2e (the sample mean), a guest capacity of 263 (the sample mean), and an occupancy of 0.75 (the sample mean), the per-guest-per-night intensity is calculated as 548,273/(263 × 0.75 × 365) = 7.61 kg CO2e. The observed sample mean of 9.61 kg CO2e diverges from this back-calculated value because the per-guest metric is right-skewed at property level, and the mean of the ratios differs from the ratio of the means. The median of 8.00 kg CO2e is a more robust central tendency indicator given the skewness observed.
The scale of within-sector variation is the first substantive finding. The gap between the highest-emitting property (25.8 kg) and the lowest (2.5 kg) represents genuinely divergent operational profiles. This variation is analytically consequential: it means that a sector-level average conveys limited information about the performance of any individual property, and policy or benchmarking approaches that reference ‘the average hotel’ mask more than they reveal.
3.3. Composition of Emissions by Source
For the 31 properties with complete waste data across all consumption categories (see Section 2.2), energy dominates the emissions profile. The composition shares reported below are calculated as Si,c = Ei,c/Ei,total for each hotel i and category c, and the mean of these property-level shares is reported. This mean-of-shares approach was preferred over the share of means because it treats each property equally regardless of its total emissions, avoiding the disproportionate influence of large emitters on the reported composition. Energy accounts on average for 84.0% of total emissions (median 86.8%, range 49.3% to 96.3%). Waste accounts for 15.6% (median 12.6%, range 3.7% to 49.1%), and water accounts for 0.44% (median 0.40%). The waste share exceeds the 5% cutoff threshold identified by PAS 2050 for excluding non-energy activities from carbon accounting by a factor of three, with 30 of the 31 hotels with full data showing a waste share above 5%. This confirms that the widely used energy-only boundary underestimates hotel emissions by approximately one-sixth in the Irish sample. Table 5 sets out the composition.
Table 5.
Composition of carbon emissions (n = 31 hotels with complete data).
Within energy, electricity is the dominant single source at 39.2% of energy emissions (Figure 2, Panel B). Natural gas follows at 35.0%, LPG at 20.6%, and heating oil at 5.2%. Combined, fossil heating sources (gas, LPG, and oil) contribute approximately 60.8% of energy emissions, exceeding electricity’s share and identifying heating decarbonisation as the operative single lever for hotel emissions reduction.
Figure 2.
Emissions composition, three panels. (A): Emissions by category (n = 31), (B): Emissions within energy (n = 31), (C): Emissions within waste (n = 31).
Within waste, the finding is analytically distinctive. Food waste contributes 43.9% of waste emissions and general landfill contributes 55.8%, while recycling contributes only 0.3%. Food waste therefore accounts for nearly as much of the waste footprint as all other landfilled waste combined. This composition reflects two properties of the emission factor set applied. First, food waste to landfill carries a substantially higher emission factor (0.700 kg CO2e/kg) than general residual waste (0.521 kg CO2e/kg) because organic material decomposes anaerobically to release methane, while segregated dry recyclables have a very low net factor (0.00469 kg CO2e/kg) representing transport only. Second, the observed practice at audited properties varied in the extent of food waste segregation for biological treatment, and the analysis assumed a landfill pathway to reflect the conservative worst-case attribution across the sample. In practice, where properties operate segregated food waste collection under the Waste Management (Food Waste) Regulations 2009, the emission factor for biological treatment is over 70 times lower. The effect of this assumption is tested in Appendix A.4, where the waste share remains above the 5% threshold. Food waste diversion and landfill diversion together represent the two highest-leverage interventions in the waste stream, with food waste alone potentially producing the largest single reduction available across the waste category.
Water contributes minimally to overall emissions in carbon terms (mean 0.44%) but should not be interpreted as environmentally unimportant. Water intensity remains a substantive sustainability metric and is captured in the wider Hotel Water Measurement Initiative framework [12]. It is small in carbon terms because the emission factor associated with water supply and treatment is comparatively low relative to energy factors.
3.4. Performance Clusters
The k-means cluster analysis identifies three distinct performance groups across the sample. Cluster boundaries were selected through within-cluster sum-of-squares evaluation, and cluster assignment is based on emissions intensity per guest per night. Table 6 sets out the cluster characteristics.
Table 6.
Performance clusters (k-means on per-guest emissions).
The low-emitter cluster contains 58% of the sample (n = 21) and is characterised by larger properties (mean 157 rooms, median 145) and predominantly four-star rating. The mid-emitter cluster (n = 11) shows moderate size (mean 83 rooms) and mixed star composition. The high-emitter cluster (n = 4) is distinctive: substantially smaller (mean 39 rooms, median 20.5), disproportionately populated by five-star properties (two of three in the sample), and emits 4.2 times as much per guest per night as the low-emitter cluster.
Figure 3 presents the clusters visually against the room count axis. The negative relationship between property size and emissions intensity is visible across the sample, and the cluster boundaries align with distinct size bands.
Figure 3.
Cluster scatter plot.
Expressed in absolute terms, the average low-emitter property produces approximately 488,000 kg CO2e per year, the average mid-emitter approximately 621,000 kg CO2e per year, and the average high-emitter approximately 665,000 kg CO2e per year. That the mid- and high-emitter clusters produce comparable absolute totals despite the high emitters being smaller reinforces that per-guest intensity, rather than absolute emissions, is the operative measure for benchmarking.
3.5. Structural Predictors of Emissions Intensity
Multivariate ordinary least squares regression was used to test the effect of four structural characteristics on emissions per guest per night. The four predictors together explain 31.5% of variance in the dependent variable (adjusted R2 = 0.227, F(4,31) = 3.57, p = 0.017). The overall model is statistically significant, and room count emerges as the single significant individual predictor. Multicollinearity is not a concern, with variance inflation factors below 2.1 for all predictors. Table 7 sets out the results.
Table 7.
OLS regression: predictors of emissions per guest per night (n = 36).
The model diagnostics support the reliability of the estimates. The Durbin–Watson statistic of 2.22 is close to the ideal value of 2, indicating no autocorrelation in the residuals. The Jarque–Bera test on the residuals (JB = 3.61, p = 0.165) does not reject normality. The Breusch–Pagan test does not reject homoscedasticity (BP = 1.91, p = 0.752). All VIFs are below 2.1 (star = 1.11, rooms = 1.19, occupancy = 1.89, urban = 2.09), well below the threshold of 5 that would indicate concerning multicollinearity. The full diagnostic results, including the analysis of influential observations, are reported in Appendix A.3 (Table A3).
Room count emerges as the single significant predictor at the conventional 5% level. The unstandardised coefficient of −0.034 indicates that each additional room is associated with a 0.034 kg CO2e reduction in emissions per guest per night. Aggregated, this translates to a 3.4 kg reduction for every 100 additional rooms. The standardised beta of −0.53 indicates a strong effect size and the largest of the four predictors. Star rating shows a positive coefficient (β = 0.29, p = 0.076) that approaches conventional significance, suggesting a tendency for higher-star properties to emit more per guest that would likely reach statistical significance in a larger sample. Occupancy and urban location show no significant effects. The robustness of these results to the high-emitter properties and to the 31-property sub-sample is tested in Appendix A.4.
Figure 4 presents the standardised coefficients with 95% confidence intervals. The distinct separation of the room count effect from zero, contrasted with the confidence intervals of the other predictors that all cross or approach zero, foregrounds the significance of size as the operative structural variable.
Figure 4.
Regression coefficients.
The direction of the room count effect is analytically important. Larger hotels achieve lower per-guest emissions, consistent with economies of scale in shared operational systems such as heating plants, air handling, kitchen infrastructure, and laundry that are spread across more occupied rooms. This finding aligns with ref. [24], who identified gross floor area as a significant driver of energy consumption, and it stands against the assumption that luxury and boutique small properties are automatically more sustainable through investment. The interpretation is empirically supported by the composition analysis in Section 3.3: 60.8% of energy emissions in the Irish sample derive from fossil heating, which operates as substantial fixed load that spreads more efficiently across larger properties.
The unstandardised coefficient carries a specific interpretation. For a hotel adding 50 rooms through expansion (holding all other characteristics constant), the model predicts a per-guest intensity reduction of approximately 1.7 kg CO2e. Aggregated across the sample average annual guest-nights of 72,500 per hotel, this translates to approximately 124 tonnes CO2e per year for a 50-room expansion.
3.6. Emissions by Star Rating and Property Size
To characterise the bivariate patterns underlying the multivariate results, Figure 5 presents emissions distributions by star rating and by size category.
Figure 5.
Carbon emissions intensity (kg CO2e per guest per night) by (a) star rating and (b) property size category (number of rooms). Boxes show the interquartile range (IQR), the line inside each box is the median, and whiskers extend to the most extreme values within 1.5 × IQR. Diamonds show the mean and circles show outliers. n = number of hotels in each group.
By star rating, one-way ANOVA identifies significant between-group differences (F(2,32) = 7.48, p = 0.002, testing three-star, four-star, and five-star groups with n > 1). The four-star category shows the lowest mean (8.01 kg, median 7.38, n = 25), reflecting the presence of large chain properties that operate at scale. The five-star category shows the highest mean (20.25 kg, median 21.41, n = 3), reflecting the smaller size and higher service intensity of luxury properties in the Irish sample. The three-star category sits between (mean 10.92 kg, n = 7), and the single two-star property emits 8.50 kg. This pattern is non-monotonic across the star scale, contradicting the assumption that emissions rise steadily with grade.
By size category, one-way ANOVA also identifies significant between-group differences (F(3,32) = 4.98, p = 0.006). Small properties (<50 rooms, n = 7) emit substantially more per guest (mean 16.28 kg) than any other category. Small–medium properties (50–100 rooms, n = 11) emit 8.33 kg, medium–large properties (100–200 rooms, n = 13) emit 8.56 kg, and large properties (>200 rooms, n = 5) emit 5.81 kg. The monotonic downward pattern across size categories is consistent with the regression finding and reinforces the interpretation that scale is the dominant operational efficiency lever.
Levene’s test for homogeneity of variance was performed prior to each ANOVA (star: p = 0.621; size: p = 0.518), and homogeneity of variance was not rejected in either case. Post hoc Tukey HSD tests indicated that the five-star group differs significantly from the four-star group (p = 0.002), and that the small (<50 rooms) group differs significantly from the large (>200 rooms) group (p = 0.010) and from the small–medium group (p = 0.019).
The interaction between star rating and size is analytically consequential. The five-star category in the Irish sample consists principally of smaller luxury properties, meaning that the star effect apparent in the box plot is partly a size effect in disguise. The regression, which tests the effect of star rating while controlling for room count, identifies that star rating approaches but does not reach conventional significance once size is accounted for. This is the substantive analytical contribution: what looks like a luxury premium in the raw data is largely a size penalty.
3.7. Summary of Findings
The results establish four substantive findings for the Discussion.
First, per-guest emissions across the Irish hotel sample vary by a factor of 10.5, with a mean of 9.6 kg CO2e and a median of 8.0 kg CO2e per guest per night. The distribution is right-skewed, with a small number of high-emitting small luxury properties driving the upper tail.
Second, energy dominates the emissions profile at 84.0% of the total, with waste contributing a substantive 15.6%, exceeding the PAS 2050 exclusion threshold by a factor of three. Within energy, electricity accounts for 39.2%, but combined fossil heating sources (gas, LPG, oil) contribute 60.8%, reflecting the substantial heating load of Irish hotels. Within waste, food waste contributes 43.9% and landfill 55.8%, meaning food waste alone accounts for nearly as much of the waste footprint as all other landfilled waste combined.
Third, three distinct performance clusters are identifiable. Low emitters are principally large four-star properties, mid emitters mixed size and star, and high emitters small three-star and five-star properties.
Fourth, room count is the single significant structural predictor of emissions intensity within a statistically significant multivariate model (F(4,31) = 3.57, p = 0.017, R2 = 0.315). Star rating approaches significance (p = 0.076), while occupancy and urban location do not significantly predict per-guest emissions. The apparent star effect visible in the raw data operates through the size distribution of the star categories rather than through star rating itself.
These findings collectively support the interpretation that size is the operative structural lever for hotel emissions performance, that food waste diversion emerges as a specific high-leverage intervention, and that the current international literature’s emphasis on star rating and luxury service intensity may need re-examination in service-sector empirical contexts. Section 4 discusses these findings against the international literature and considers their theoretical, practical, and policy implications.
4. Discussion
This paper has established the first comprehensive national carbon benchmark for the Irish hotel sector, based on primary audit data from 36 properties. The Discussion interprets these findings against the international literature, adjudicates the contested evidence on structural predictors, and derives practical implications for hotel operators, policymakers, and certification bodies. It does not advance a new theoretical framework, but provides the empirical foundation for subsequent theoretical work on hotel carbon governance.
The results of Section 3 establish four substantive findings for discussion. Section 4.1 places the Irish emissions intensity in international context. Section 4.2 examines the composition of emissions. Section 4.3 addresses the evidence on structural predictors. Section 4.4 examines whether the size effect reflects scale or technology. Section 4.5 identifies priority interventions. Section 4.6 illustrates the findings through the four-star category, and Section 4.7 sets out the practical and policy implications.
4.1. Per-Guest Emissions Intensity in International Context
Research question 1 asked how carbon emissions intensity varies across the Irish hotel sample and how this variation compares with international benchmarks. The Irish sample mean of 9.6 kg CO2e per guest per night places Irish hotels within the moderate range of international per-guest benchmarks compiled from prior studies. Table 8 sets out the comparison against nine published studies spanning four continents and two decades of measurement. Comparison against the international literature requires attention to methodological heterogeneity across studies. The table below aggregates nine published benchmarking studies alongside the Irish result and orders them by boundary comparability with the present study.
Table 8.
Comparative carbon-intensity benchmarks from published hotel studies.
The Irish sample sits comfortably below the intensity reported for luxury and life cycle-inclusive comparators. Hu, Huang [10] reported 29 kg per guest night for a Taiwanese international tourist hotel. The Greek five-star resort documented by Orfanou, Klontza [25] at 37 kg represents the upper end of the international literature, and the Irish five-star mean of 20.25 kg approaches but remains below this figure. The Irish sample mean of 9.6 kg is closest to the Spanish coastal hotels reported by Puig, Kiliç [15] at 9–14 kg per guest night, and to the moderate end of the Brazil/Peru range reported by Filimonau, Rosa [2].
The comparison across studies requires explicit acknowledgment of methodological heterogeneity. The system boundaries in Table 8 vary from energy-only [10,21,37,38] to full life cycle assessment [8,15] and hybrid Scope 1–3 approaches [2]. The present study reports Scope 1 and Scope 2 with material Scope 3 additions from waste and water, which sits between these boundary conventions. Direct comparison of the Irish mean of 9.6 kg with the energy-only Chinese figure of 18.47 kg [21] therefore understates the Irish–Chinese gap by approximately 15%, which is the waste share missing from the Chinese boundary. Comparison with the Greek 37.19 kg figure [25] is more direct because that study also included waste and LPG. Where possible, comparisons in this section are made against studies with comparable boundaries.
Three observations flow from this comparison. First, Ireland’s grid mix confers a moderating effect on hotel carbon intensity. The SEAI [6] grid factor of 0.197 kg CO2e per kWh reflects the increasing renewable share of the Irish national grid and represents a substantially cleaner electricity input than fossil-heavy grids in South and East Asia. This grid effect narrows the gap between Irish hotels and international best practice on the energy side of the ledger, but does not eliminate it.
Second, the 10.5-fold variation within the Irish sample is comparable to the between-country variation reported across the international literature. This is analytically important. Within-sector variation, in other words, is not a residual disturbance in the data, but a substantive feature of the sector. Sector-level benchmark averages of the kind reported in the Cornell Hotel Sustainability Benchmarking Index [12] conceal substantially more than they reveal about individual property performance.
Third, the Irish five-star mean of 20.25 kg is closer to international luxury benchmarks than the Irish four-star mean of 8.0 kg is to international full-service benchmarks. This suggests that the luxury segment of the Irish sector is broadly aligned with international peers, while the four-star segment is a locus of relative efficiency. The four-star mean of 8.0 kg per guest night is meaningfully below the Bohdanowicz and Martinac [38] European chain range of 10–22 kg and the Filimonau, Dickinson [8] UK three-star range of 14–25 kg. This finding may reflect a combination of the newer building stock, scale of typical Irish four-star operations, and grid mix, and it represents a positive baseline for the Irish sector against international peers.
4.2. Composition of Emissions: Reconciling Energy Dominance with the Material Waste Share
Research question 2 asked which energy and resource categories are the principal drivers of hotel emissions. The composition finding of 84.0% energy, 15.6% waste, and 0.44% water aligns closely with the emerging international consensus on the structure of hotel emissions, but with a distinctive Irish signature on the composition of the waste category. Orfanou, Klontza [25] attributed 81% of a Greek five-star resort’s emissions to energy, with food waste contributing 11% and other waste and LPG contributing 8%. The Irish energy share of 84.0% closely matches this Greek pattern, but the Irish sample shows a substantially larger food waste contribution within the waste category than the Greek study reports.
The Irish waste share of 15.6% has direct methodological implications. Ref. [10] documented that non-energy activities contributed 15.9% and 16.0% of the total footprint in two accounting years of a Taiwanese hotel and observed that these values exceeded the 5% cutoff threshold established by PAS 2050 for excluding non-energy activities from carbon accounting. The Irish sample confirms and extends this finding: 30 of the 31 hotels with full data have a waste share above 5%, and the mean of 15.6% exceeds the threshold by a factor of three. The implication is unambiguous. Carbon accounting frameworks that draw the boundary at Scope 1 and Scope 2 alone systematically underestimate hotel emissions in the Irish context. This underestimate arises because energy-only frameworks capture Scope 1 direct combustion and Scope 2 purchased electricity, but exclude Scope 3 waste and water. Because these categories are not marginal, the waste share alone exceeds the 5% materiality threshold used in PAS 2050 for excluding non-energy activities in 30 of the 31 properties with complete data, the exclusion is not a reasonable simplification, but a systematic source of error.
The magnitude of the under-reporting can be estimated directly from the Irish sample. Among the 31 hotels with full data, applying an energy-only boundary would report a mean emissions total of approximately 469,000 kg CO2e per property. The full-boundary total is 551,000 kg CO2e per property. The gap of approximately 82,000 kg CO2e per property, aggregated across an estimated 900 registered hotels in the Irish sector Fáilte Ireland [30], translates to approximately 74,000 tonnes of CO2e of currently unaccounted emissions annually at national scale. This estimate is illustrative rather than precise, reflecting the small sample base and its purposive rather than representative composition, but it establishes the substantive scale of the accounting boundary question for the sector.
The within-waste composition is the most distinctive Irish finding. Food waste contributes 43.9% of waste emissions in the Irish sample, and general landfill contributes 55.8%. Food waste therefore accounts for nearly as much of the waste footprint as all other landfilled waste combined. This composition reflects two properties of the emission factor set applied. First, the DEFRA [31] emission factor for organic food and drink waste sent to landfill is substantially higher (0.700 kg CO2e per kg) than the equivalent factor for commercial and industrial residual waste (0.521 kg CO2e per kg), because organic material decomposes anaerobically in landfill conditions and releases methane with 28 times the warming potential of carbon dioxide over a 100-year horizon. Second, the observed practice at audited Irish properties is that food waste frequently enters residual waste streams rather than being segregated for biological treatment, despite the biological treatment pathway carrying an emission factor over 70 times lower. The comparison with Orfanou et al. [30] is instructive: the Greek resort reported food waste at 11% of total emissions, whereas the Irish sample shows food waste at approximately 6.8% of total emissions (43.9% of the 15.6% waste category). The Greek finding reflects a resort with substantial catering intensity, but functioning food waste segregation. The Irish finding reflects moderate catering intensity combined with less-developed food waste segregation practice.
Within energy, the Irish electricity share of 39.2% is lower than the electricity dominance reported by Lai [19] for Hong Kong, Lai, Yik [22] for Hong Kong archetypes, and Abeydeera and Karunasena [32] for Sri Lankan luxury hotels, all of whom identified purchased electricity as the leading source. The Irish pattern reflects the substantial fossil heating load: natural gas contributes 35% of energy emissions, LPG 20.6%, and heating oil 5.2%. Combined fossil heating sources thus contribute 60.8% of energy emissions, exceeding electricity’s share. This is a distinctive feature of hotel operations in cool temperate climates and identifies fossil heating decarbonisation as the operative single lever for Irish hotel emissions reduction.
4.3. Structural Predictors: Size Dominates, Star Effect Operates Through Size
Research question 3 asked which structural characteristics of hotels significantly predict differences in carbon performance. The regression finding that room count is the sole significant individual structural predictor of per-guest emissions (β = −0.53, p = 0.002) within a statistically significant multivariate model (F(4,31) = 3.57, p = 0.017, R2 = 0.315) speaks directly to the unresolved international dispute over structural predictors of hotel carbon intensity. The Irish evidence favours the position articulated by ref. [24] for Hong Kong, who identified gross floor area as the major statistically significant predictor of electricity consumption. Two comparable studies support this size-dominance interpretation: identified gross floor area as the major statistically significant predictor of electricity consumption in Hong Kong hotels, and ref. [14] reached a comparable conclusion for Singapore. The direction of the Irish effect, in which larger hotels emit less per guest, is consistent with an economies-of-scale interpretation: heating plant, kitchen infrastructure, laundry, and air handling systems have substantial fixed operational demand that is spread across more occupied rooms in larger properties, producing lower per-guest intensity.
The non-significance of occupancy is a further substantive finding that speaks to the contradictory international evidence. Puig, Kiliç [15] reported occupancy as the main source of variability in the inventory data of Spanish coastal hotels. Lai [19], examining three Hong Kong archetypes, found occupancy showed no significant correlation with per-guest emissions. The Irish evidence supports the Lai position. The strength of the Irish occupancy finding is reinforced using property-reported rather than county-level occupancy data. Where Puig, Kiliç [15] and other studies have relied on aggregated occupancy proxies, the present study tested property-level occupancy against per-guest emissions directly. The non-significance therefore reflects the actual variation in property-level occupancy across the sample, not the flattening effect of a coarser aggregate measure. A plausible reconciliation between the Puig and Lai positions is that ref. [15] sampled seasonal coastal properties with large occupancy swings, while Lai and the present study sampled properties with more consistent base loads. This reconciliation supports the interpretation that occupancy effects are contingent on sample composition and building type and may not generalize across the sector.
The star rating effect deserves specific attention. In the multivariate regression, star rating shows a positive coefficient (β = 0.29, p = 0.076) that approaches conventional statistical significance without reaching the 5% threshold. The bivariate ANOVA identifies significant between-star differences (F(2,32) = 7.48, p = 0.002), but this pattern operates largely through the size distribution of star categories rather than through star rating itself. In the Irish sample, five-star properties are typically small (mean 61 rooms), and small properties emit substantially more per guest. What appears in the raw data as a luxury premium is largely a size penalty, though the marginal significance of the star coefficient suggests that a residual luxury service intensity effect may exist independently of size and would likely reach statistical significance in a larger sample. This finding is compatible with Filimonau, Rosa [2], who reported that comfort category correlated with carbon footprint in Brazil and Peru, while identifying size as the dominant structural mechanism. The methodological implication is that univariate comparisons of emissions by star rating, common in sector benchmarking, may systematically misattribute size effects to service level.
The regression R2 of 0.315 indicates that structural characteristics explain approximately a third of the variance in per-guest emissions across the Irish sample. The remaining two-thirds of the variance operate through factors not captured in the model: building fabric quality, plant efficiency, management practice, occupancy patterns beyond the annual aggregate, guest behaviour, staff engagement, and food waste segregation practice. This residual variance is analytically consequential. It indicates that structural characteristics alone are insufficient to explain hotel emissions performance, and that operational and management factors, not observable in a purely structural regression, are substantive determinants of the remaining variation. Zhang and Xia [21] reached a comparable conclusion for the Chinese hotel sector, identifying pollution control investment and energy-saving technology as key operational drivers of carbon efficiency. Their focus on dynamic management variables, rather than static structural attributes, is consistent with the Irish finding that structural predictors capture a substantial, but not exhaustive portion of the operative variance.
In cross-sectional multivariate regression on 36 observations with four predictors, an R2 of 0.315 with F(4,31) = 3.57 and p = 0.017 indicates a statistically significant model. Structural characteristics such as star rating, size, occupancy, and location are the variables most readily available to sector benchmarking and policy design. They explain a third of the operative variance in per-guest emissions, indicating that policy relying on these characteristics can produce meaningfully differentiated targets, while acknowledging that operational and management factors requiring primary data collection are needed to explain the remaining variance. This finding supports the direction of Fáilte Ireland’s Climate Action Programme Fáilte Ireland [30], which provides property-level advisory engagement rather than sector-level target-setting alone.
4.4. Structural Scale Versus Technological Performance
The finding that room count is the sole significant structural predictor of per-guest emissions invites a specific interpretive question: Does the superior intensity performance of larger properties reflect better environmental technology, or does it reflect the arithmetic of operational scale? The distinction matters for how the finding should be read and for what follows from it in policy terms, and the evidence of this study, read alongside the wider literature, supports the second interpretation.
Hotels carry a substantial operational load that is largely independent of occupancy. Reception, corridors, public areas, kitchens, laundry facilities, and heating plants consume energy whether the property is full or half empty, and this fixed component is distributed across the guest-nights the property sells [38]. A larger hotel distributes a broadly comparable fixed load across a greater number of guest-nights, and its per-guest intensity falls accordingly. The negative coefficient on room count is therefore consistent with a denominator effect rather than with differential technology adoption.
This reading is strongly corroborated by the wider empirical literature on the structural determinants of hotel energy use. Arenhart et al. [40], synthesising 28 primary studies in a systematic review and meta-analysis, found that occupancy rate carries no significant overall relationship with hotel energy use (r = 0.20, p = 0.084) across the pooled sample, in contrast to gross floor area (r = 0.65, p < 0.0001) and the number of guestrooms (r = 0.50, p < 0.0001), both of which show strong and highly significant positive associations. This is the precise asymmetry the present study’s regression reproduces: a physical scale variable dominates, while an occupancy-related variable does not survive as an independent predictor. Notably, Arenhart et al. [40] subgroup analysis found that the relationship between occupancy and energy use is not merely weak, but unstable in sign, positive in general-category hotels (r = 0.36), and negative in upscale hotels (r = −0.21), a divergence the authors attribute to the greater range of energy-intensive services offered at higher star levels. This instability across categories is itself evidence that any simple ‘star rating predicts performance’ narrative in the literature is confounded by exactly the scale and service-level differences the present study’s regression is designed to isolate.
Three additional features of the present data support the scale-effect interpretation over the technological alternative. First, star rating, the variable most plausibly associated with capital investment capacity and therefore with technology adoption, does not reach conventional significance in the multivariate model once room count is controlled. If the size effect operated through technology, star rating would be expected to carry independent explanatory power, and it does not. Second, the apparent luxury emissions premium visible in the bivariate comparison operates through the size distribution of star categories rather than through star rating itself, which indicates that what appears to be a service-level effect is in substantial part a scale effect misattributed, a pattern consistent with Arenhart et al.’s [40] finding that hotel category effects reported in the primary literature vary systematically with how energy is operationalised and with which structural covariates are controlled. Third, the model explains approximately 32 per cent of the variation in per-guest intensity, leaving the majority unexplained by structural characteristics of any kind. If technology adoption were systematically tracking property size, a larger share of the variation would be expected to follow the structural variables.
The distinction has a direct consequence for how the finding should inform policy, and it is a consequence that cuts against a straightforward reading of the result. A scale effect is not a performance achievement and cannot be replicated by a smaller property through investment, because the smaller property cannot increase the guest-nights across which its fixed load is distributed without changing what it is. If the size effect were technological, the appropriate policy response would be to diffuse the technology from larger to smaller properties. Because it is structural, that response would be misdirected. Smaller properties are not underperforming relative to larger ones in any sense that investment alone can correct, and benchmarking frameworks that compare properties on per-guest intensity without adjusting for scale will systematically and unfairly disadvantage them, a concern the hospitality energy literature has raised in the context of raw versus normalised (EUI) reporting more generally [40].
This reading also indicates where genuine technological and operational improvement is available, which is not in the scale variable at all. The composition analysis identifies the levers directly: fossil heating sources contribute 60.8 per cent of energy emissions, making heating electrification the largest single technological intervention available to properties of any size, and food waste at 43.9 per cent of the waste category identifies diversion as a high-leverage operational intervention that is largely independent of property scale. Both are available to small and large properties alike, and neither depends on the structural characteristic the regression identifies. The practical implication is that the scale effect should be treated as a benchmarking adjustment rather than as an improvement pathway, while the improvement pathway lies in the energy carrier and waste treatment decisions the composition analysis reveals and which the following section develops.
4.5. Priority Interventions for Emissions Reduction
The preceding section established that the structural characteristics identified in the regression describe how emissions are distributed across properties rather than how they can be reduced. This section sets out where the reduction capacity actually lies, drawing on the composition analysis to identify three interventions the evidence of this study supports as priorities, and situating each against the wider literature.
The first and largest is the decarbonisation of heating. Combined fossil heating sources, natural gas at 35.0 per cent, LPG at 20.6 per cent, and heating oil at 5.2 per cent, contribute 60.8 per cent of energy emissions across the sample, exceeding the share held by purchased electricity. This distribution is a distinctive feature of the Irish case and differs markedly from patterns reported in warmer or more electricity-dependent contexts. Deng and Burnett [41], studying sixteen quality hotels in Hong Kong, found electricity to be the dominant and most consequential energy source, with town gas and diesel confined to secondary uses such as cooking, hot water, and laundry. A comparable electricity-dominant pattern was reported for the Sri Lankan hotel industry by Abeydeera and Karunasena [23], whose Scope 1–3 assessment found direct combustion a minority contributor relative to purchased electricity. The Irish sample’s heating-dominant profile reflects the country’s temperate, heating-driven climate rather than the cooling-driven demand of tropical and subtropical contexts, and it identifies a materially different priority intervention than would be indicated by transferring conclusions from those settings. The practical implication is that the largest single technological intervention available to Irish hotels is the substitution of fossil heating with electrified alternatives, principally heat pumps, and that the emissions return on this substitution will continue to increase as the renewable share of the Irish grid rises. This finding also carries a caution for properties pursuing efficiency in electricity consumption alone: because electricity accounts for a minority of the energy emissions in this sample, electricity-focused measures address the smaller share of the problem, a mismatch that would not be apparent without the disaggregated, fuel-specific accounting this study undertakes.
The second is food waste diversion. Food waste accounts for 43.9 per cent of waste-category emissions, approaching the 55.8 per cent held by landfill, within a waste category that represents a mean of 15.6 per cent of total property emissions. The scientific basis for prioritising diversion is well established: landfilled organic waste decomposes anaerobically over decades, generating methane through a process quantified by the IPCC’s first-order decay model for solid waste disposal [42], whereas composting and anaerobic digestion generate substantially smaller direct methane and nitrous oxide emissions during a comparatively short and controllable process. Diverting food waste to biological treatment therefore removes it from a decades-long methane-generating pathway and substitutes a shorter, lower-emission one, which is the mechanism underlying the materially lower emission factor this study applies to biologically treated waste relative to landfill. Unlike heating substitution, this intervention operates through operational practice and contractor arrangement rather than through capital investment, making it available to properties of any size at comparatively low cost, and it is accordingly the more immediately actionable of the two interventions identified.
The third, enabling rather than directly abating, is measurement and management technology. The properties in this study varied considerably in the completeness of their consumption records, and the five properties excluded from the composition analysis were excluded precisely because non-energy consumption data was not retained at property level. A property that does not measure its waste streams separately cannot know its food waste share, cannot verify whether diversion is occurring, and cannot evidence the reduction to a corporate client or reporting framework that requires it. Sub-metering, building management systems, and structured waste contractor reporting are therefore preconditions for the first two interventions rather than alternatives to them. This is also the point at which the present findings connect to the wider regulatory environment now reaching the sector: Directive (EU) 2022/2464 [43], the Corporate Sustainability Reporting Directive, requires in-scope undertakings to report Scope 1, Scope 2, and, where relevant, Scope 3 greenhouse gas emissions, a requirement that presupposes exactly the granular, verifiable consumption data a substantial proportion of the present sample does not yet possess.
Read together, the three interventions form a sequence rather than a menu. Measurement capability establishes what a property’s emissions profile is and whether interventions are working; food waste diversion offers the most immediately available reduction at low capital cost; and heating electrification offers the largest reduction available but requires the greatest investment and the longest planning horizon. The sequence is the same for properties of any size, which is consistent with the argument of the preceding section that the scale effect identified in the regression is not an improvement pathway. What differs across property types is not which interventions are available, but the capital and planning capacity to pursue the third, and it is at that point that differentiated policy support becomes relevant.
4.6. The Four-Star Category as an Illustrative Case
The analysis to this point has reported results across the full sample. Because the four-star category is both the largest group in the sample, comprising 25 of the 36 properties, and the most representative of the Irish hotel sector, it serves as a useful case through which the practical implications of the findings can be made concrete.
The category displays a striking property. The entire range of carbon intensity observed across the full sample is contained within the four-star category alone. The lowest per-guest-night intensity in the sample, at 2.46 kg CO2e, and the highest, at 25.79 kg CO2e, are both four-star properties, so the 10.5-fold variation reported for the sample as a whole is reproduced in its entirety within a single comfort category. The category mean of 8.01 kg CO2e per guest-night sits below the sample mean of 9.61, with a median of 7.38 and a standard deviation of 4.98, indicating a distribution that is both wide and right-skewed within the category.
This observation is analytically consequential, because it demonstrates directly, and without relying on inference across categories, that star rating carries little independent information about carbon performance once the confounding effect of scale is accounted for, a conclusion consistent with the instability of star-level effects reported across contexts in the wider literature [40]. Two properties carrying the identical market classification and therefore presenting the identical service proposition to a guest or a corporate buyer may differ in carbon intensity by an order of magnitude. Any benchmarking framework that groups hotels by comfort category alone, as several sector instruments do, will therefore compare properties whose actual performance has almost nothing in common.
The composition of the category clarifies why. The four-star properties range in size from 17 to 505 rooms, with a mean of 149 and a median of 138, and the best and worst performers sit at opposite ends of that distribution: the lowest-intensity property operates 163 rooms, while the highest-intensity property operates 17. The pattern within the category thus reproduces the regression finding reported for the sample, and it does so with the star-rating variable held constant by construction. This provides a direct illustration of the argument developed in Section 4.4: the variation within the category is a scale effect operating on fixed loads distributed across differing volumes of guest-nights, not a difference in technology adoption or management quality between properties of the same class.
For a manager of a four-star property, three practical conclusions follow. First, the relevant comparison is not with other four-star hotels generally, but with properties of similar size, since the category average conceals a distribution wide enough to make the comparison uninformative. Second, a smaller four-star property recording an intensity above the category mean is not necessarily underperforming, because part of the difference is structural and cannot be closed by investment. Third, and consequently, the levers identified in Section 4.5 apply with equal force across the category regardless of position within it, since heating decarbonisation and food waste diversion operate on the emissions themselves rather than on the denominator across which they are distributed.
4.7. Practical and Policy Implications
Four practical implications follow from the results.
For hotel operators, the compound findings identify three intervention priorities. First, food waste diversion emerges as a high-leverage single intervention with substantial and immediate impact on the emissions footprint. The 43.9% share of food waste in the Irish waste stream translates to approximately 6.8% of total hotel emissions, and diversion from landfill (0.700 kg CO2e per kg) to biological treatment (0.009 kg CO2e per kg under the DEFRA [31] factor) would eliminate over 98% of these emissions per unit of food waste. Second, fossil heating decarbonisation is the operative lever for the largest single emissions source. Combined gas, LPG, and heating oil contribute 60.8% of energy emissions and represent the target for electrification through heat pumps and building fabric improvements. Taylor, Peacock [44] demonstrated through ESP-r simulation of representative UK hotels that a 50% emissions reduction by 2030 is technically feasible without compromising guest comfort, through a combination of building fabric, HVAC, lighting, and renewable interventions. Third, smaller properties face structural disadvantage in per-guest terms and require intervention pathways different from those available to larger operations, given that many capital-intensive efficiency measures require operational scale to recover investment.
For policymakers, the results identify two policy priorities. First, sector-wide targets that assume a homogeneous property base are unlikely to be effective given the 10.5-fold within-sector variation documented in the Irish sample. A differentiated approach that stratifies targets by property size category and that recognizes the structural constraints facing small properties would produce more equitable and achievable outcomes than uniform sector-wide benchmarks. Second, Fáilte Ireland’s Climate Action Programme Fáilte Ireland [30], launched in 2024 with a dedicated advisory model over an initial three-year period, is well positioned to translate the technical evidence base developed here into practice. The programme’s advisory approach is directly aligned with the operational and management focus that the residual regression variance identifies as consequential. Full implementation of the commercial food waste segregation provisions under the Waste Management (Food Waste) Regulations 2009 represents a further policy lever with substantial direct emissions reduction potential.
For certification bodies, the results identify a specific methodological priority. The Hotel Carbon Measurement Initiative’s energy-only boundary omits a material 16% of hotel emissions in the Irish sample, and by extension in comparable service contexts. Extending boundary to include waste emissions with specific attention to the food waste category that the Irish evidence identifies as substantively larger than energy-only frameworks would predict or maintaining the current boundary while flagging the systematic under-reporting for the sector would improve the reliability of certification and benchmarking against actual footprints.
For the international research literature, the Irish evidence adjudicates two contested debates. On the star rating-versus-size question, the Irish evidence favours the size-dominance interpretation while acknowledging that a marginal residual luxury effect may exist. On the occupancy question, the Irish evidence favours the Lai [19] position of non-significance and suggests that occupancy effects reported in seasonal coastal samples may not generalise to service-sector operations with more consistent base loads. Both findings suggest that international benchmarking studies would benefit from multivariate rather than univariate structural comparisons, and that per-guest emissions comparisons across star bands should routinely control for size.
The seven subsections of this Discussion collectively answer the three research questions the paper posed. On research question 1, the Irish hotel sector shows a 10.5-fold within-sector variation in per-guest emissions and a sector mean of 9.6 kg CO2e that sits within the moderate international range. On research question 2, energy dominates the emissions profile at 84.0% of the total, but the 15.6% waste share systematically breaches the boundary applied by the widely deployed Hotel Carbon Measurement Initiative and by extension underestimates hotel emissions in service contexts. Within the waste category, food waste at 43.9% is nearly equal to landfill at 55.8%, identifying food waste diversion as a specific high-leverage intervention that has not previously been foregrounded in the Irish or comparable international benchmarking literature. On research question 3, room count emerges as the single significant individual structural predictor of emissions intensity within a statistically significant multivariate model, and the apparent luxury emissions premium visible in bivariate comparisons operates through the size distribution of star categories rather than through star rating itself.
The paper thereby delivers on the four contributions the Introduction set out. The comprehensive property-level Irish benchmark documented across 36 hotels, 15 counties, and star ratings from 2 to 5 addresses the national evidence gap. The integrated Scope 1, Scope 2, and Scope 3 boundary applied uniformly across all properties enables the boundary-sufficiency analysis, showing that energy-only frameworks systematically underestimate hotel emissions by approximately 16% in the Irish context. The multivariate regression adjudicates the international dispute in favour of the size-dominance interpretation while acknowledging a marginal residual luxury service intensity effect that would likely reach statistical significance in a larger sample. The compositional analysis identifies food waste as an underemphasised source and quantifies the specific diversion potential available through pathway substitution.
These findings collectively support a differentiated, size-sensitive, waste-inclusive approach to hotel decarbonisation that current sector benchmarks and certification frameworks do not fully accommodate, and they provide the empirical foundation for the sector-level policy work the following section considers.
5. Conclusions
This paper presented a comprehensive property-level carbon benchmarking analysis of the Irish hotel sector, drawing on primary audit data from 36 hotels across 15 counties and star ratings from 2 to 5. Emissions were calculated across Scope 1 combustion, Scope 2 electricity, and Scope 3 waste and water categories using SEAI [6] and DEFRA [31] emission factors, standardised on per-guest-per-night and per-room-per-year intensity metrics. The analysis proceeded through descriptive statistics on the emissions distribution, multivariate ordinary least squares regression on structural predictors, and k-means cluster analysis to identify performance groups within the sample.
The paper delivers on the four contributions set out in the introduction. Empirically, it provides the first comprehensive property-level carbon benchmark for the Irish hotel sector, documenting a 10.5-fold variation in per-guest emissions across the sample and a sector mean of 9.6 kg CO2e per guest per night that places Irish hotels within the moderate international range. Methodologically, it demonstrates the analytical value of the integrated Scope 1, Scope 2, and Scope 3 boundary through the boundary-sufficiency analysis: the 15.6% waste share in Irish hotel emissions substantially exceeds the 5% cutoff threshold applied under PAS 2050 and by widely used sector benchmarks such as the Hotel Carbon Measurement Initiative, indicating that energy-only frameworks systematically underestimate hotel carbon footprints in service contexts. Analytically, it shows that room count is the sole significant structural predictor of per-guest emissions when size, star rating, occupancy, and location are simultaneously tested, within a statistically significant multivariate model (F(4,31) = 3.57, p = 0.017, R2 = 0.315), and that the apparent luxury emissions premium visible in bivariate comparisons operates through the size distribution of star categories rather than through star rating itself. Substantively, it identifies food waste as a distinctive and previously underemphasised source in the Irish hotel context, accounting for 43.9% of waste emissions and offering a high-leverage intervention pathway that current sector benchmarking frameworks do not foreground.
The findings carry direct implications for the sector’s current phase of decarbonisation. Food waste diversion emerges as a specific high-leverage intervention available to properties of any size, with the potential to reduce food waste emissions by over 98% through diversion from landfill to biological treatment. Fossil heating from natural gas, LPG, and oil combined contributes 60.8% of energy emissions, identifying heating electrification and building fabric improvement as the operative single lever for Irish hotel decarbonisation. Smaller properties face structural disadvantage in per-guest terms and require intervention pathways different from the capital-intensive measures accessible to larger operations. Sector-wide targets that assume a homogeneous property base are unlikely to be effective given the substantial within-sector variation documented, and a differentiated approach that stratifies targets by size category would produce more equitable and achievable outcomes than uniform benchmarks. Enforcement of existing commercial food waste segregation regulations under the Waste Management (Food Waste) Regulations 2009 represents a further policy lever with substantial direct emissions reduction potential.
The study has boundaries that warrant explicit statement. The sample of 36 properties, while covering variation across the analytically consequential characteristics, is not statistically representative of the Irish hotel population and reflects the specific properties that engaged with the wider audit programme. Non-energy data was unavailable for five properties, reducing the sample size for composition analysis to 31. The cross-sectional design captures a single accounting period and does not track how the patterns evolve over time. The R2 of 0.315 indicates that structural predictors account for a substantial, but not exhaustive share of the operative variance, with two-thirds of the variation attributed to operational and management factors that a purely structural regression cannot capture.
Future research could extend the framework in three specific directions. First, longitudinal data collection across multiple accounting periods would permit examination of how Irish hotel emissions evolve as regulatory pressure intensifies under the Corporate Sustainability Reporting Directive. Second, extending the analysis to include operational and management factors beyond structural characteristics would address the substantial residual variance identified by the regression. Third, comparative analysis across multiple national contexts would test whether the structural patterns documented here generalise beyond the Irish setting and would specifically examine whether the food waste prominence in the Irish sample reflects a national practice pattern or a wider service-sector characteristic.
With regulatory reporting requirements intensifying and the sector’s decarbonisation trajectory tightening, the benchmarking foundation offered here provides the evidence base that policy, certification, and operator decision-making urgently require.
The evidence base presented here offers a benchmarking foundation for the sector’s decarbonisation trajectory, and it identifies the structural, compositional, and operational patterns that policy and practice will need to address as the regulatory environment continues to intensify.
Author Contributions
Conceptualization, S.A. and J.H.; methodology, S.A. and J.H.; data collection, S.A. and J.H.; formal analysis, S.A. and J.H.; investigation, S.A.; writing—original draft preparation, S.A. and J.H.; writing—review and editing, S.A. and J.H.; visualization, S.A. and J.H.; supervision, J.H.; project administration, S.A. and J.H. All authors have read and agreed to the published version of the manuscript.
Funding
This research received no external funding.
Institutional Review Board Statement
The study was conducted in accordance with the Declaration of Helsinki and approved by the Institute Research Ethics Committee (IREC) of Atlantic Technological University Sligo (protocol code 2024023 on 2 October 2024) prior to the commencement of the audit programme in 2025.
Informed Consent Statement
Informed consent was obtained from a designated representative of each participating hotel property prior to data collection. Participation was voluntary, and property operators were informed that anonymised aggregate data would be used in academic reporting. Property names, addresses, and characteristic combinations that could permit individual identification are excluded from all reporting. Each participant retained the right to withdraw at any point in the audit programme.
Data Availability Statement
The full dataset supporting the findings of this study contains commercially sensitive information about individual hotel operations and cannot be publicly shared to preserve participant confidentiality. Aggregate summary data is available in the tables of this paper and in the appendices. Further anonymised methodological details are available from the corresponding author upon reasonable request.
Conflicts of Interest
The authors declare no conflicts of interest.
Abbreviations
The following abbreviations are used in this manuscript:
| Abbreviation | Definition |
| CHSB | Cornell Hotel Sustainability Benchmarking Index |
| CO2e | Carbon dioxide equivalent |
| CSRD | Corporate Sustainability Reporting Directive |
| DEFRA | Department for Environment, Food and Rural Affairs |
| EPA | Environmental Protection Agency (Ireland) |
| GHG | Greenhouse gas |
| GHG Protocol | Greenhouse Gas Protocol |
| HCMI | Hotel Carbon Measurement Initiative |
| HWMI | Hotel Water Measurement Initiative |
| kWh | Kilowatt-hour |
| LCA | Life cycle assessment |
| LCEA | Life cycle energy analysis |
| LPG | Liquefied petroleum gas |
| OLS | Ordinary least squares |
| PAS 2050 | Publicly Available Specification 2050 for carbon accounting |
| RQ | Research question |
| SEAI | Sustainable Energy Authority of Ireland |
| SHA | Sustainable Hospitality Alliance |
| VIF | Variance inflation factor |
| WCSS | Within-cluster sum of squares |
Appendix A
Appendix A.1. Detailed Emission Factor Sources
The emission factors applied throughout the analysis are drawn from the Sustainable Energy Authority of Ireland (SEAI) [6] conversion factor set for energy sources and the Department for Energy Security and Net Zero (DEFRA) [31] Greenhouse Gas Conversion Factors for waste, water, and material recovery pathways. Ireland’s Environmental Protection Agency does not publish facility-level waste conversion factors suitable for hotel-scale reporting, and the substitution of DEFRA factors follows the established practice in the tourism and hospitality carbon accounting literature [2,25].
Table A1.
Emission factor sources and citation details.
The DEFRA [31] methodology assigns waste factors on a modular basis reflecting the actual disposal pathway. The landfill factor represents gate-to-grave emissions including methane release from anaerobic decomposition. The recycling factor represents transport emissions to the material recovery facility only. Downstream reprocessing and material recovery credits are attributed to the recipient of the recovered material rather than to the waste producer, following the DEFRA [31] methodology paper’s boundary convention.
The 2025 factor vintage was selected as chronologically appropriate to the audit period (2025–2026 data collection). SEAI updates its factor set annually to reflect the current renewable share of the Irish grid, and the 2025 factor of 0.197 kg CO2e per kWh represents the increasing renewable generation share up to and including 2024 accounting periods. DEFRA similarly updates its factor set annually, with the 2025 edition applicable to accounting years starting mid-2025.
Appendix A.2. Detailed Descriptive Statistics by Property Characteristic
Table A2 presents the full descriptive statistics of the sample by star rating, size category, and performance cluster. Aggregate figures include mean and median values for total annual emissions, per-guest-per-night intensity, and per-room-per-year intensity.
Table A2.
Sample statistics disaggregated by property characteristic.
The table shows that while high-emitter properties are smaller on average (mean 39 rooms compared to 157 for low emitters), their total annual emissions are comparable to mid-emitter properties. This reinforces the analytical distinction between per-guest intensity (the operative benchmarking metric) and absolute emissions (which conflates size and intensity).
Appendix A.3. Regression Diagnostics
Table A3 presents the full diagnostic testing conducted on the multivariate regression model. All standard assumptions of ordinary least squares regression were tested, and with one specific consideration described below, are satisfied.
Table A3.
Regression model diagnostic tests.
All VIF values are well below the threshold of 5, which would indicate concerning multicollinearity, and are below the more conservative threshold of 4. The residuals show no autocorrelation (Durbin–Watson = 2.22, essentially at the ideal value), no heteroscedasticity (Breusch–Pagan p = 0.752), and no departure from normality (Jarque–Bera p = 0.165).
Cook’s distance analysis identified four properties with values above the conventional threshold of 4/n = 0.111, indicating that these observations exert influence on the regression estimates disproportionate to their share of the sample. The four properties are the two highest total-emissions properties, one high per-guest emitter, and one large urban four-star. These observations are retained in the main analysis because they represent legitimate variation across the sample rather than measurement errors, and their retention preserves the empirical characterization of the sector. Appendix A.4 presents a sensitivity analysis excluding the high-emitter cluster to test the robustness of the main findings to these influential observations.
Appendix A.4. Sensitivity Analysis
Three sensitivity analyses were conducted to test the robustness of the main findings to alternative analytical assumptions. Table A4 summarises the results.
Table A4.
Sensitivity analysis of key findings.
Scenario 1 tests what happens if the food waste pathway assumption is changed to segregated biological treatment consistent with the Waste Management (Food Waste) Regulations 2009 rather than the observed landfill pathway. Under this alternative, the mean per-guest emissions fall from 9.61 to 9.08 kg CO2e and the waste share drops from 15.6% to 10.6%. Even under this scenario, the waste share still exceeds the PAS 2050 5% cutoff by a factor of two, indicating that the substantive claim regarding non-energy boundary sufficiency is robust to reasonable variation in pathway assumptions.
Scenario 2 tests the robustness of the regression to the high-emitter cluster properties. When these are excluded (n = 32), the overall model loses statistical significance (F(4,27) = 1.46, p = 0.241, R2 = 0.178), but the room count coefficient remains significant on its own (p = 0.033). This indicates that structural predictors together explain less variance in a sample without the highest emitters, but the negative side effect persists as an individual predictor. The finding does not invalidate the size-dominance interpretation, but qualifies its strength: room count matters even in a lower-variance sample, but the joint model requires the full-sample range to reach significance.
Scenario 3 tests robustness to the missing data handling. When the analysis is restricted to the 31 properties with complete data across all consumption categories, the regression becomes substantially stronger. The room count coefficient strengthens (β = −0.59, p = 0.001), the overall model explains 42% of variance (F(4,26) = 4.71, p = 0.005), and star rating reaches statistical significance (β = 0.39, p = 0.021). This suggests that the five properties with energy-only data contribute noise to the regression rather than substantive variation, and that the restricted analysis provides a stronger test of both the size-dominance hypothesis and a residual luxury effect. The main analysis reports the full-sample results for conservatism and transparency, but the restricted-sample results reinforce the substantive conclusions and suggest that star rating may exert an independent effect that the full-sample model does not detect.
Appendix A.5. Sample Audit Protocol
Each participating property underwent a structured on-site carbon audit conducted using a standardised protocol. The protocol covered five sequential stages:
Stage 1: Preparatory documentation review. The property provided twelve months of utility bills for grid electricity, natural gas, LPG, and heating oil consumption, together with waste contractor invoices identifying waste streams and quantities collected, and water utility bills identifying supply and wastewater volumes.
Stage 2: Property visits and physical verification. A researcher-led site visit confirmed the presence and specifications of energy consumption infrastructure including boilers, heat pumps, water heaters, kitchen equipment, and lighting. Property size in rooms and guest capacity was verified against operational documentation.
Stage 3: Occupancy data collection. Property management systems were consulted to record the annual occupancy rate for the twelve-month accounting period covered by the consumption data.
Stage 4: Waste stream verification. Where property waste contractor documentation lacked detail on specific waste categories, the researcher conducted a physical inspection of waste segregation practice and cross-verified categorisation with property operational staff.
Stage 5: Interview and confirmation. A structured interview with a designated property representative confirmed the completeness and accuracy of the data collected, identified any anomalies or exceptional circumstances during the accounting period, and clarified any pathway assumptions relevant to waste characterisation.
Data quality was verified through triangulation across at least two independent sources for each consumption category. Utility bill data was cross-checked against supplier account statements; waste stream data was cross-checked between contractor documentation and physical inspection. Discrepancies were resolved through interview with property management.
Appendix A.6. Geographic Distribution of the Sample
The sample of 36 hotels is distributed across 15 counties in the Republic of Ireland, spanning all four regional tourism areas defined by Fáilte Ireland. Table A5 summarises the geographic distribution.
Table A5.
Sample distribution by county and regional tourism area.
The distribution reflects the concentration of the Irish hotel sector along the Wild Atlantic Way (representing Ireland’s most substantial tourism region), balanced by representation across Ireland’s Ancient East (which contains the historic urban centres of Dublin’s periphery), Ireland’s Hidden Heartlands, and the Dublin metropolitan area. The four properties whose regional classification is unspecified in the underlying dataset are retained in the analysis and reported as such throughout, and their inclusion does not affect the substantive findings.
References
- Lenzen, M.; Sun, Y.-Y.; Faturay, F.; Ting, Y.-P.; Geschke, A.; Malik, A. The carbon footprint of global tourism. Nat. Clim. Change 2018, 8, 544. [Google Scholar] [CrossRef] [Scilit]
- Filimonau, V.; Rosa, M.S.; Franca, L.S.; Creus, A.C.; Ribeiro, G.M.; Molnarova, J.; Piumatti, R.G.; Valsasina, L.; Safaei, A. Environmental and carbon footprint of tourist accommodation: A comparative study of popular hotel categories in Brazil and Peru. J. Clean. Prod. 2021, 328, 129561. [Google Scholar] [CrossRef] [Scilit]
- Bohdanowicz, P. European hoteliers’ environmental attitudes: Greening the business. Cornell Hotel Restaur. Adm. Q. 2005, 46, 188–204. [Google Scholar]
- Kularatne, T.; Wilson, C.; Månsson, J.; Hoang, V.; Lee, B. Do environmentally sustainable practices make hotels more efficient? A study of major hotels in Sri Lanka. Tour. Manag. 2019, 71, 213–225. [Google Scholar] [CrossRef] [Scilit]
- Rico, A.; Olcina, J.; Baños, C.; Garcia, X.; Sauri, D. Declining water consumption in the hotel industry of mass tourism resorts: Contrasting evidence for Benidorm, Spain. Curr. Issues Tour. 2019, 23, 770–783. [Google Scholar] [CrossRef] [Scilit]
- SEAI. Energy in Ireland; Sustainable Energy Authority of Ireland: Dublin, Ireland, 2025.
- Hamza, M.A.A.; Rego, N. Sustainable supply chain practices of local versus international hotels: Multiple case studies in Egypt. Sci. Rep. 2025, 15, 32542. [Google Scholar] [CrossRef] [Scilit] [PubMed]
- Filimonau, V.; Dickinson, J.; Robbins, D.; Huijbregts, M.A. Reviewing the carbon footprint analysis of hotels: Life Cycle Energy Analysis (LCEA) as a holistic method for carbon impact appraisal of tourist accommodation. J. Clean. Prod. 2011, 19, 1917–1930. [Google Scholar] [CrossRef] [Scilit]
- Castellani, V.; Sala, S. Ecological footprint and life cycle assessment in the sustainability assessment of tourism activities. Ecol. Indic. 2012, 16, 135–147. [Google Scholar] [CrossRef] [Scilit]
- Hu, A.H.; Huang, C.-Y.; Chen, C.-F.; Kuo, C.-H.; Hsu, C.-W. Assessing carbon footprint in the life cycle of accommodation services: The case of an international tourist hotel. Int. J. Sustain. Dev. World Ecol. 2015, 22, 313–323. [Google Scholar] [CrossRef] [Scilit]
- Lissner, I. How Hotels Can Achieve Sustainable Excellence with Carbon and Water Metrics. Available online: https://because.eco/blog/hcmi-hwmi-carbon-water-metrics (accessed on 20 July 2026).
- Ricaurte, E.; Jagarajan, R. Hotel Sustainability Benchmarking Index 2023; Cornell Peter and Stephanie Nolan School of Hotel Administration: Ithaca, NY, USA, 2023. [Google Scholar]
- Chan, W.W.; Lam, J.C. A Study on pollutant emission through gas consumption in the Hong Kong hotel industry. J. Sustain. Tour. 2002, 10, 70–81. [Google Scholar] [CrossRef] [Scilit]
- Xuchao, W.; Priyadarsini, R.; Eang, L.S. Benchmarking energy use and greenhouse gas emissions in Singapore’s hotel industry. Energy Policy 2010, 38, 4520–4527. [Google Scholar] [CrossRef] [Scilit]
- Puig, R.; Kiliç, E.; Navarro, A.; Albertí, J.; Chacón, L.; Fullana-I-Palmer, P. Inventory analysis and carbon footprint of coastland-hotel services: A Spanish case study. Sci. Total Environ. 2017, 595, 244–254. [Google Scholar] [CrossRef] [Scilit] [PubMed]
- Coles, T.; Dinan, C.; Warren, N. Carbon villains? Climate change responses among accommodation providers in historic premises. J. Herit. Tour. 2015, 11, 25–42. [Google Scholar] [CrossRef] [Scilit]
- de Grosbois, D.; Fennell, D.A. Determinants of climate change disclosure practices of global hotel companies: Application of institutional and stakeholder theories. Tour. Manag. 2022, 88, 104404. [Google Scholar] [CrossRef] [Scilit]
- Tsai, K.-T.; Lin, T.-P.; Hwang, R.-L.; Huang, Y.-J. Carbon dioxide emissions generated by energy consumption of hotels and homestay facilities in Taiwan. Tour. Manag. 2014, 42, 13–21. [Google Scholar] [CrossRef] [Scilit]
- Lai, J.H.K. Carbon footprints of hotels: Analysis of three archetypes in Hong Kong. Sustain. Cities Soc. 2015, 14, 334–341. [Google Scholar] [CrossRef] [Scilit]
- Oluseyi, P.O.; Babatunde, O.M.; Babatunde, O.A. Assessment of energy consumption and carbon footprint from the hotel sector within Lagos, Nigeria. Energy Build. 2016, 118, 106–113. [Google Scholar] [CrossRef] [Scilit]
- Zhang, J.; Xia, B. Carbon emissions and its efficiency of tourist hotels in China from the supply chain based on the input–output method and super-SBM model. Sustainability 2024, 16, 9489. [Google Scholar] [CrossRef] [Scilit]
- Lai, J.H.K.; Yik, F.W.H.; Man, C.S. Carbon audit: A literature review and an empirical study on a hotel. Facilities 2012, 30, 417–431. [Google Scholar] [CrossRef] [Scilit]
- Abeydeera, L.H.U.W.; Karunasena, G. Carbon emissions of hotels: The case of the Sri Lankan hotel industry. Buildings 2019, 9, 227. [Google Scholar] [CrossRef] [Scilit]
- Chan, W.W.; Lam, J.C. Prediction of pollutant emission through electricity consumption by the hotel industry in Hong Kong. Int. J. Hosp. Manag. 2002, 21, 381–391. [Google Scholar] [CrossRef] [Scilit]
- Orfanou, A.; Klontza, E.; Vakalis, S.; Voukkali, I.; Zorpas, A.A.; Lekkas, D.F. Introducing waste generation as a factor affecting carbon footprint in hotel operation and assessment of reduction practices. Energy Nexus 2026, 21, 100615. [Google Scholar] [CrossRef] [Scilit]
- Singh, N.; Cranage, D.A.; Nath, A. Estimation of GHG emission from hotel industry. Anatolia 2014, 25, 39–48. [Google Scholar] [CrossRef] [Scilit]
- Nhubu, T.; Mbohwa, C. Inventory analysis and environmental life cycle impact assessment of hotel food waste management for bio-circular economy development in Zimbabwe. Environ. Monit. Assess. 2024, 196, 1196. [Google Scholar] [CrossRef] [Scilit] [PubMed]
- Gössling, S.; Garrod, B.; Aall, C.; Hille, J.; Peeters, P. Food management in tourism: Reducing tourism’s carbon ‘foodprint’. Tour. Manag. 2011, 32, 534–543. [Google Scholar] [CrossRef] [Scilit]
- Molina, M.E.R.; Belda-Miquel, S.; Hytti, A.; Gil-Saura, I. Addressing sustainable food management in hotels: Proposing a framework and examining hotel groups. Br. Food J. 2022, 124, 462–492. [Google Scholar] [CrossRef] [Scilit]
- Fáilte Ireland. Climate Action Guide for Hotels and Guesthouses; Fáilte Ireland: Dublin, Ireland, 2022. [Google Scholar]
- DESNZ. Greenhouse Gas Reporting: Conversion Factors 2025; DESNZ: London, UK, 2025.
- Abeydeera, L.H.U.W.; Karunasena, G. Greenhouse gas emission reporting mechanism for hotel industry: A case of Sri Lanka. Int. J. Environ. Sci. Nat. Resour. 2019, 20, 556042. [Google Scholar] [CrossRef] [Scilit]
- WBCSD. A corporate accounting and reporting standard, Revised edition. In The Greenhouse Gas Protocol; WBCSD: Geneva, Switzerland, 2004. [Google Scholar]
- Green Key. Green Key Unlocking Sustainability in the Hospitality Industry. Available online: https://www.greenkey.global/ (accessed on 20 April 2026).
- Creswell, J.W.; Poth, C.N. Qualitative Inquiry and Research Design: Choosing Among Five Approaches; Sage College Publishing: Troy, NY, USA, 2016. [Google Scholar]
- Papargyropoulou, E.; Steinberger, J.K.; Wright, N.; Lozano, R.; Padfield, R.; Ujang, Z. Patterns and causes of food waste in the hospitality and food service sector: Food waste prevention insights from Malaysia. Sustainability 2019, 11, 6016. [Google Scholar] [CrossRef] [Scilit]
- Becken, S.; Frampton, C.; Simmons, D. Energy consumption patterns in the accommodation sector—The New Zealand case. Ecol. Econ. 2001, 39, 371–386. [Google Scholar] [CrossRef] [Scilit]
- Bohdanowicz, P.; Martinac, I. Determinants and benchmarking of resource consumption in hotels—Case study of Hilton International and Scandic in Europe. Energy Build. 2007, 39, 82–95. [Google Scholar] [CrossRef] [Scilit]
- Koiwanit, J.; Filimonau, V. Carbon footprint assessment of home-stays in Thailand Resource. Conserv. Recycl. 2021, 164, 105123. [Google Scholar] [CrossRef] [Scilit]
- Arenhart, R.S.; Souza, A.M.; Zanini, R.R. Energy use and its key factors in hotel chains. Sustainability 2022, 14, 8239. [Google Scholar] [CrossRef] [Scilit]
- Deng, S.; Burnett, J. Energy use and management in hotels in Hong Kong. Int. J. Hosp. Manag. 2002, 21, 371–380. [Google Scholar] [CrossRef] [Scilit]
- IPCC. Climate Change 2022; IPCC: Geneva, Switzerland, 2022. [Google Scholar]
- European Parliament and Council of the European Union. Directive 2022/2464/EU of the European Parliament and of the Council of 14 December 2022 Amending Regulation (EU) as Regards Corporate Sustainability Reporting. 2022. Available online: https://eur-lex.europa.eu/legal-content/EN/TXT/PDF/?uri=CELEX:32022L2464 (accessed on 20 July 2026).
- Taylor, S.; Peacock, A.; Banfill, P.; Shao, L. Reduction of greenhouse gas emissions from UK hotels in 2030. Build. Environ. 2010, 45, 1389–1400. [Google Scholar] [CrossRef] [Scilit]
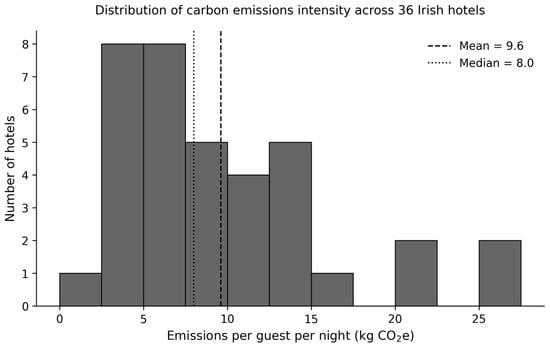
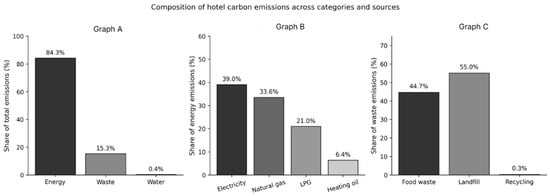
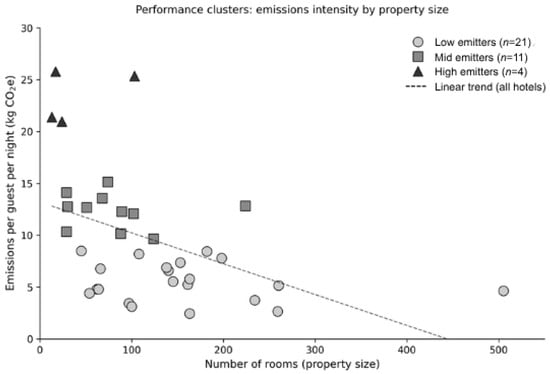
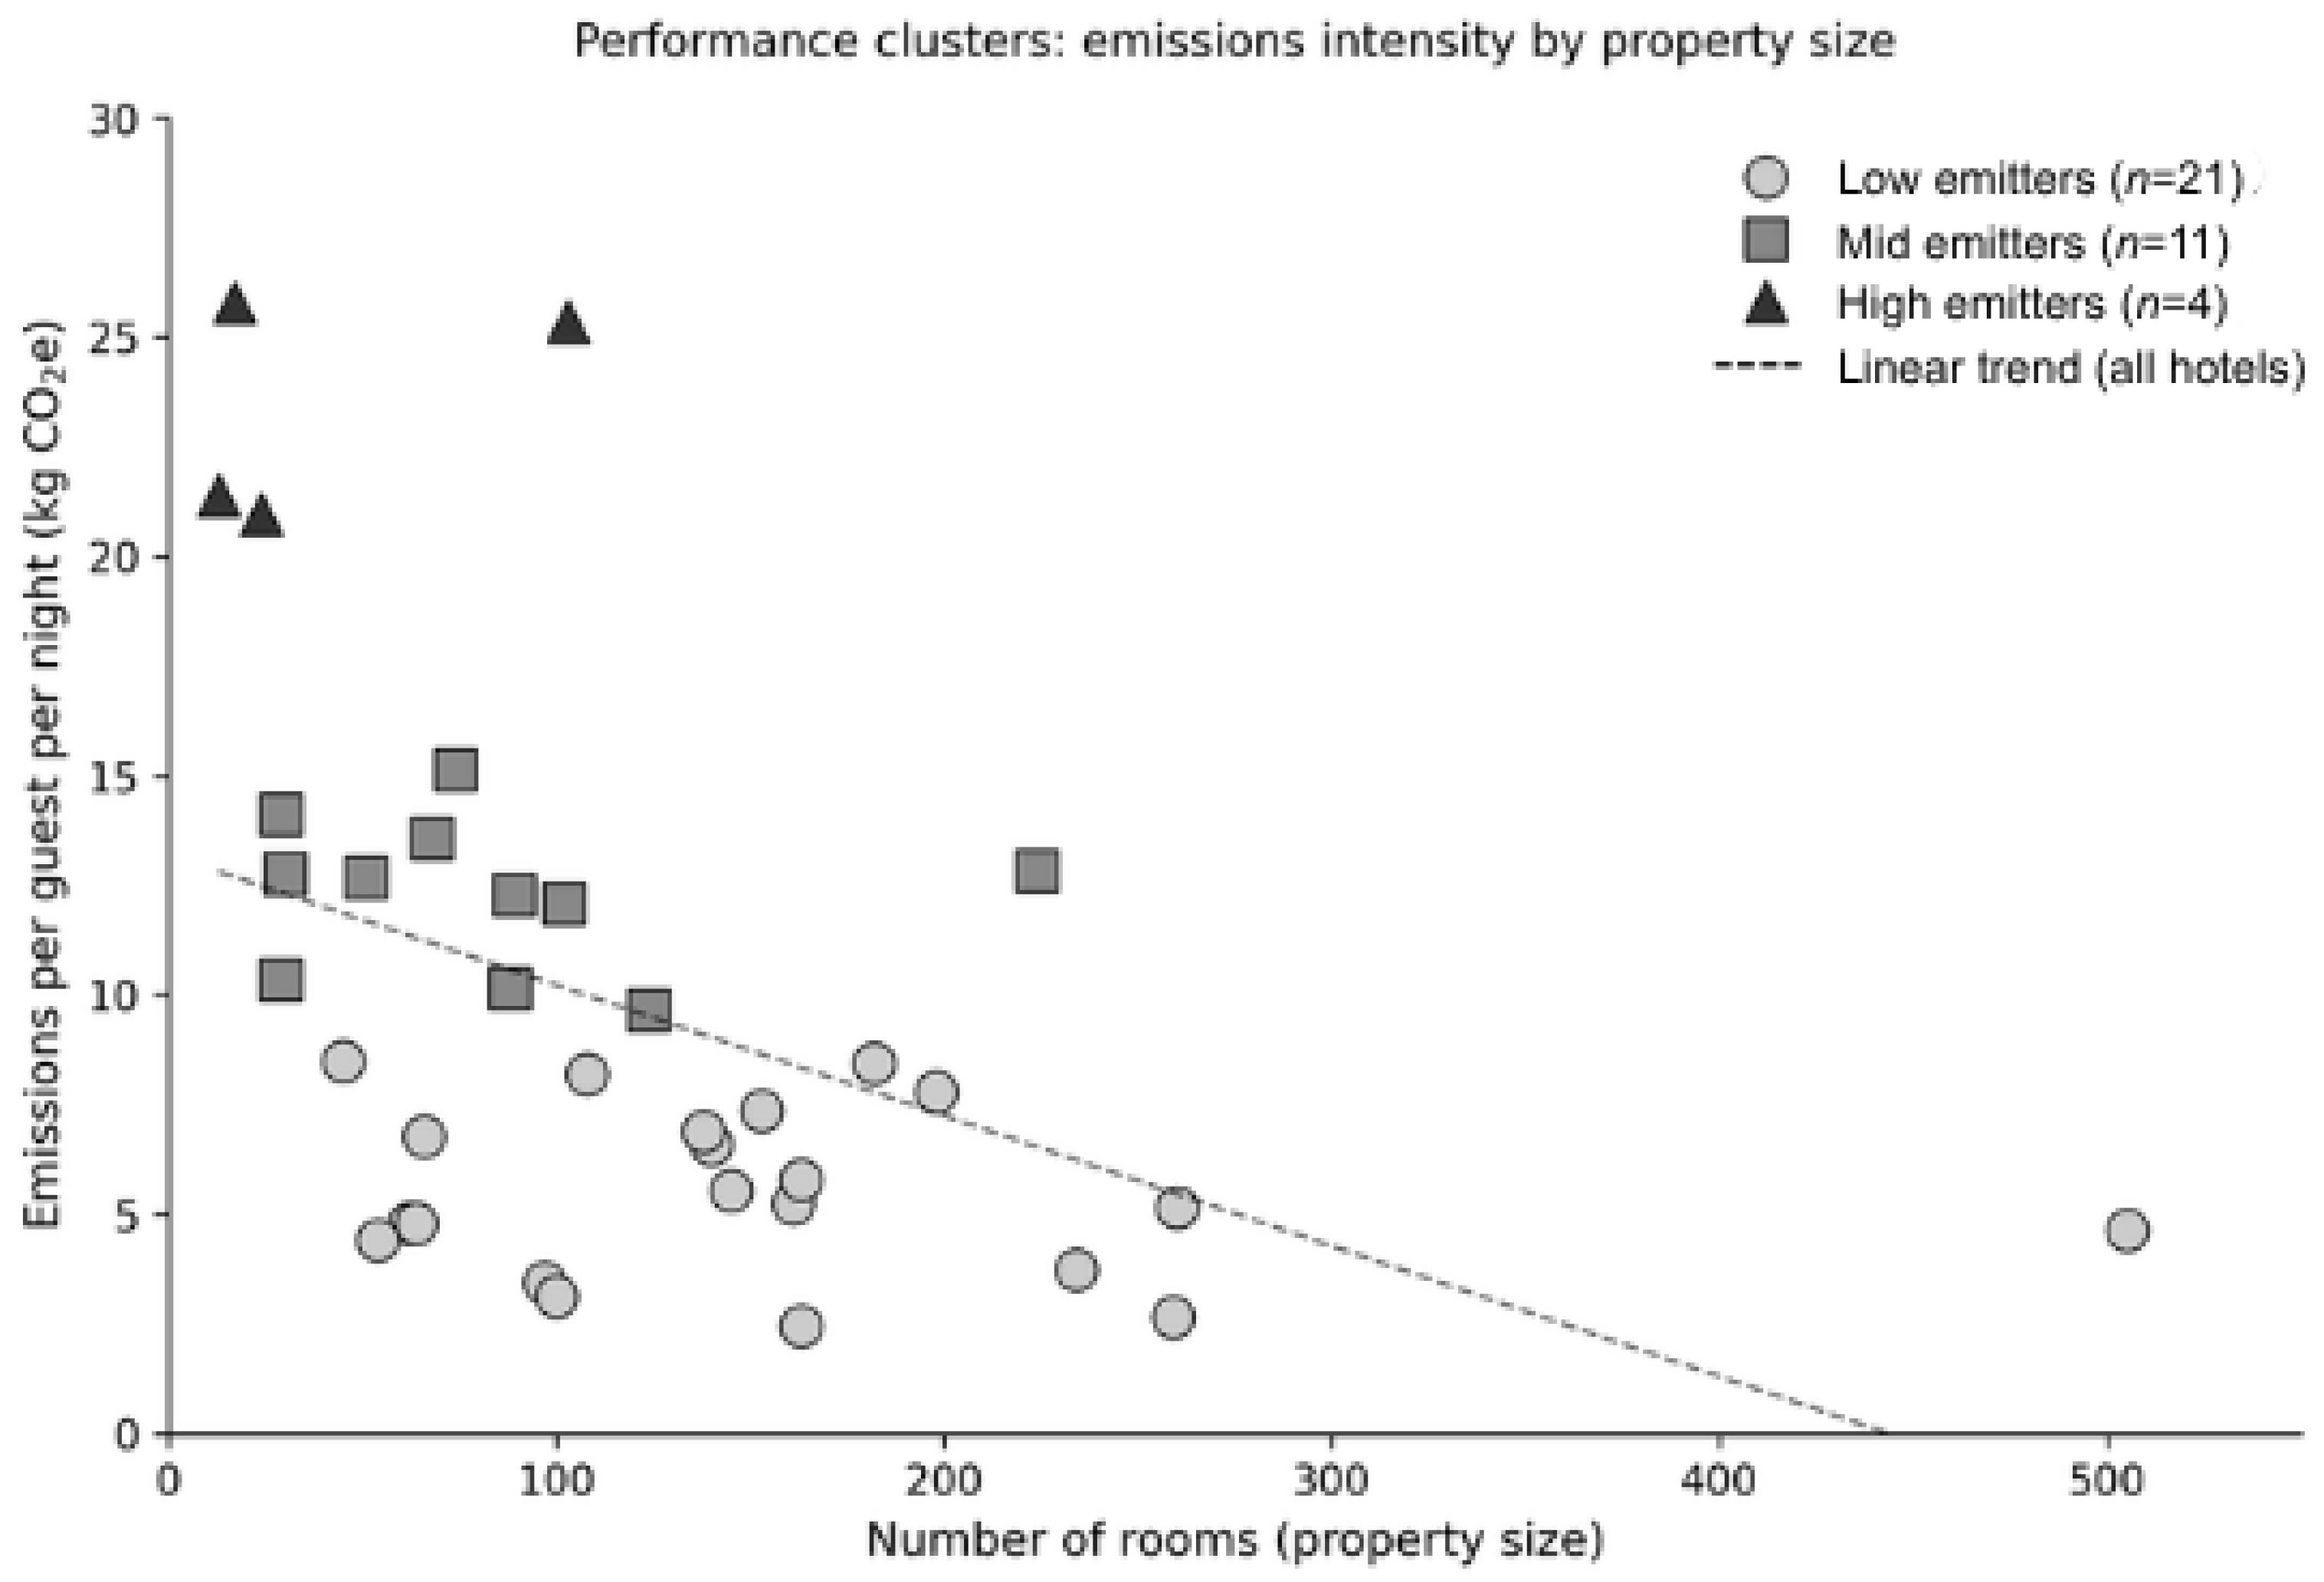
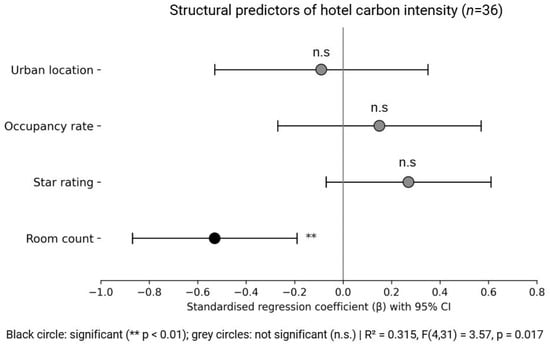
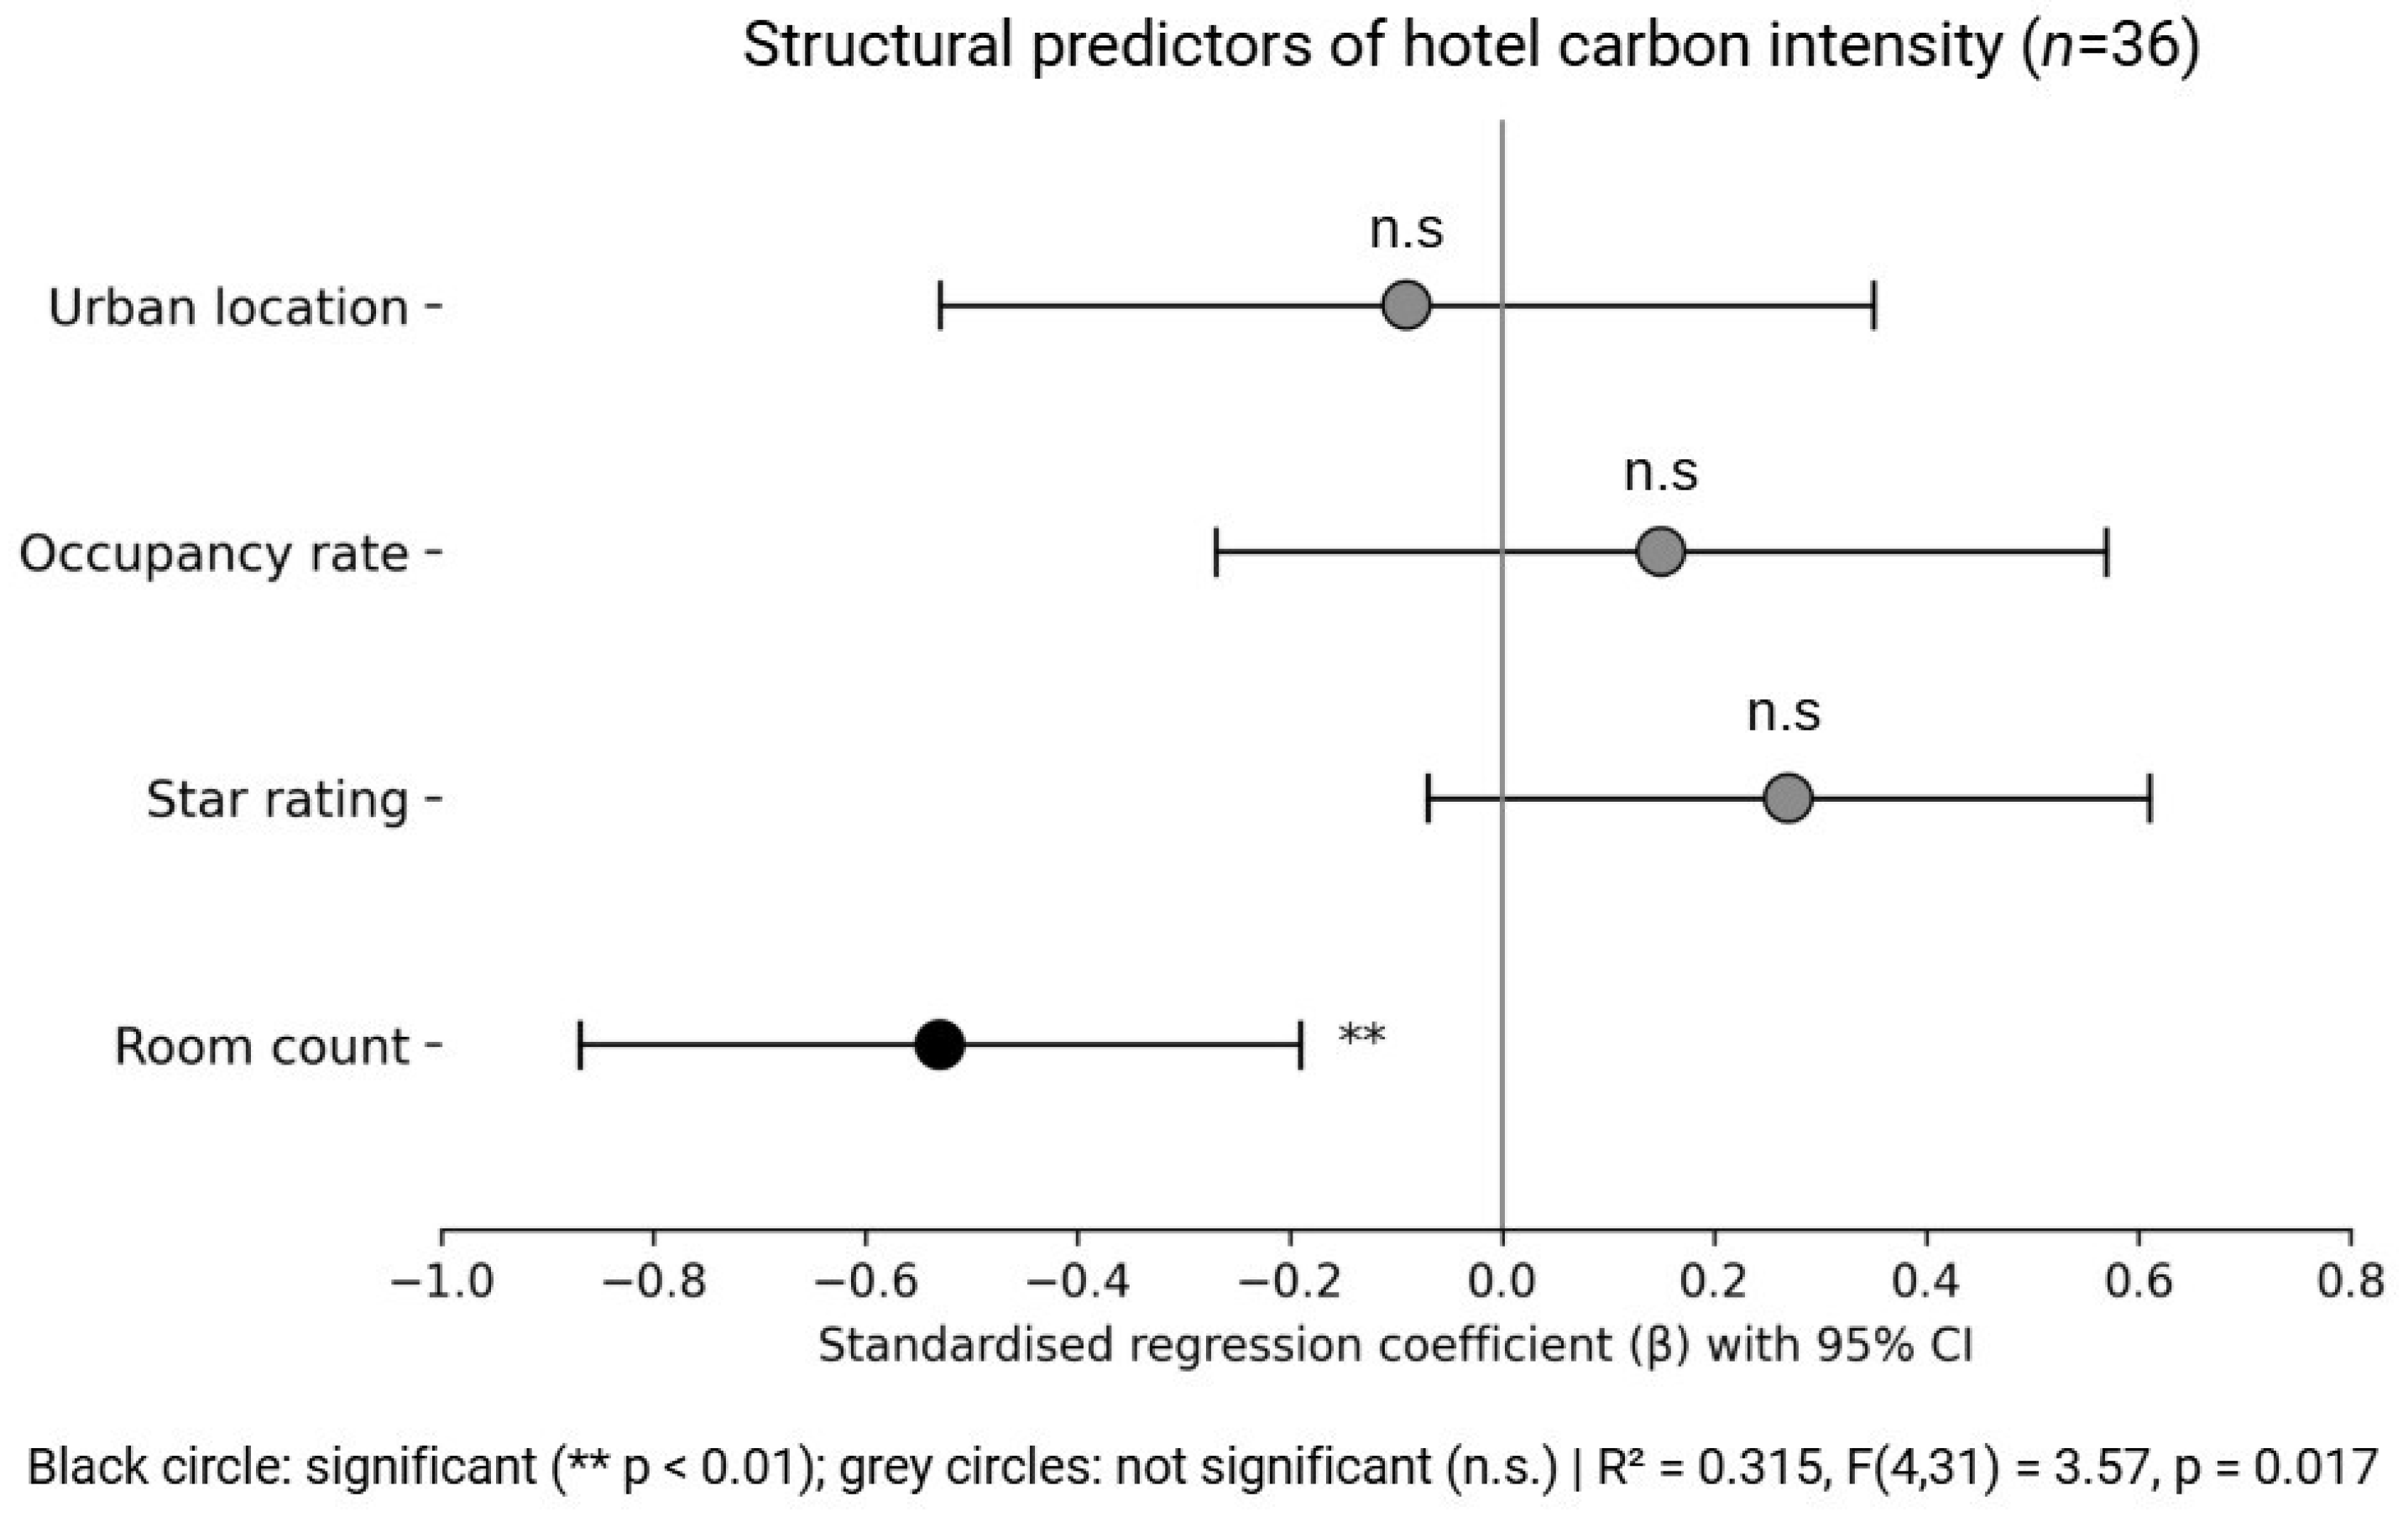
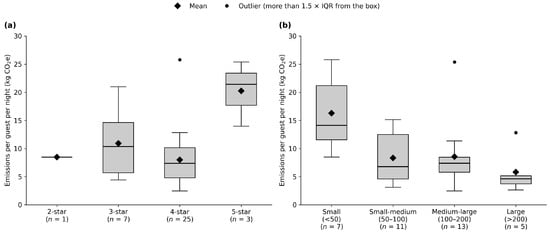

Disclaimer/Publisher’s Note: The statements, opinions and data contained in all publications are solely those of the individual author(s) and contributor(s) and not of MDPI and/or the editor(s). MDPI and/or the editor(s) disclaim responsibility for any injury to people or property resulting from any ideas, methods, instructions or products referred to in the content. |
© 2026 by the authors. Licensee MDPI, Basel, Switzerland. This article is an open access article distributed under the terms and conditions of the Creative Commons Attribution (CC BY) license.