


Abstract
Onshore oil extraction is a major source of atmospheric pollution in terrestrial ecosystems, yet its spatial impacts on biological communities and pollutant-deposition gradients remain poorly quantified, particularly in ecologically sensitive landscapes. The Centro Olio Val d’Agri (COVA), located in the municipality of Viggiano (Basilicata, southern Italy), is the largest onshore oil pre-treatment facility in Italy and operates within a landscape of high conservation value encompassing multiple Natura 2000 protected areas and the Pertusillo drinking water reservoir. In this study, we applied an integrated lichen biomonitoring approach, combining biodiversity-based sustainability bioindication with chemical bioaccumulation, to characterise the spatial extent and ecological significance of atmospheric pollution originating from COVA across the Val d’Agri basin. Lichen thalli were collected from oak trees (Quercus spp.) at sampling stations distributed along a gradient of increasing distance from the facility and analysed for the concentrations of 28 heavy metals and 22 polycyclic aromatic hydrocarbons (PAHs). Lichen community composition was simultaneously assessed using the Lichen Biodiversity Index (LBI), calculated separately for total, nitrophilous, and non-nitrophilous species. Pearson correlation analysis revealed significant negative relationships between distance from COVA and the concentrations of manganese (r = −0.656, p < 0.001) and chrysene (r = −0.423, p = 0.006), identifying these compounds as clear chemical fingerprints of industrial pollution associated with the facility. Conversely, aluminium, iron, titanium, vanadium, and selenium showed significant positive correlations with distance (p < 0.05), reflecting the predominance of geogenic crustal dust and agricultural sources in the rural landscape surrounding COVA. No significant correlation was detected between LBI values and distance from COVA for any of the three community metrics examined. This finding is likely attributable to the high ecological background variability generated by coppice forest management, heterogeneity in bark chemistry, and the limited sensitivity of community-based lichen indices to the specific emission profile of the facility. These findings demonstrate that chemical bioaccumulation is a more sensitive diagnostic tool than community-based bioindication for detecting the spatial footprint of oil extraction facilities and highlight the need for integrated, multi-method sustainability biomonitoring frameworks for the environmental surveillance of onshore hydrocarbon production sites.
1. Introduction
The global expansion of onshore hydrocarbon extraction has made oil and gas production one of the most pervasive sources of environmental contamination across terrestrial ecosystems [1]. Oil extraction activities release a broad spectrum of pollutants into the atmosphere, soil, and water through multiple pathways: combustion of associated gas in turbines and boilers, routine gas flaring, evaporative losses from storage and processing equipment, resuspension of metal-enriched drill cuttings and produced water, and diffuse fugitive emissions from wellheads and pipeline infrastructure [2,3]. The resulting pollutant cocktail includes heavy metals such as manganese, vanadium, chromium, and nickel—whose concentrations in crude oil and formation waters reflect the geochemistry of the reservoir rock—as well as polycyclic aromatic hydrocarbons (PAHs), volatile organic compounds (VOCs), sulphur dioxide (SO2), and nitrogen oxides (NOx) generated during processing and incomplete combustion [4,5]. Heavy metals are of particular concern due to their persistence, non-biodegradability, and propensity to bioaccumulate through food webs, causing toxic effects at multiple levels of biological organisation [6]. PAHs, many of which are classified as probable or possible human carcinogens by the International Agency for Research on Cancer (IARC), are released both as petrogenic compounds inherent in crude oil and as pyrogenic by-products of flaring and fuel combustion [7,8]. Residential proximity to active oil extraction sites has been associated with elevated risks of cancer, respiratory disease, neurological impairment, and liver damage, particularly in communities where chronic, low-level exposure to these mixed pollutants has been documented over years to decades [9,10].
Among the environmental indicators used to monitor atmospheric pollution, lichens have long been considered valuable/effective bioindicators owing to their unique set of ecological and physiological characteristics. Lichens are symbiotic organisms formed by a fungal partner (mycobiont) associated with one or more photosynthetic partners—typically green algae or cyanobacteria—and more recently recognised to also harbour a diverse community of bacteria and lichenicolous fungi within the thallus [11,12]. Lichens are sensitive to atmospheric quality, from which they depend for mineral nutrition. Moreover, lichens lack both a protective waxy cuticle and active root systems, meaning that gases, aerosols, and particulate matter are absorbed directly and passively across the entire thallus surface from both wet and dry atmospheric deposition [13,14].
Lichen-based environmental biomonitoring relies on two main approaches that provide complementary information. Bioindication uses lichens as indirect indicators of air quality by assessing the composition, richness, and abundance of naturally occurring epiphytic lichen communities. Because lichen species differ in their sensitivity to atmospheric pollutants—with highly sensitive species disappearing in polluted zones and tolerant or nitrophilous species colonising disturbed sites—changes in community composition provide an integrated biological response to long-term environmental conditions. Community-level metrics, such as the Lichen Diversity Value (LDV), quantify these changes and provide spatially integrated indicators of environmental quality that cannot be easily captured by spot chemical measurements [15,16,17]. A European standardised protocol (EN 16413:2014) formalised this approach by using lichen species diversity as a proxy for environmental quality, with higher diversity generally associated with lower levels of atmospheric pollution and/or disturbance [18]. The bioaccumulation approach is based on the analysis of pollutant concentrations within the lichen thallus, exploiting the ability of lichens to efficiently intercept and retain atmospheric deposition over time, such as particulate metals, semi-volatile organic compounds, and inorganic gases. Unlike vascular plants, lichens accumulate metals through both extracellular and intracellular mechanisms and absorb lipophilic compounds such as PAHs through interactions with the lipid metabolites present on the thallus surface [13,19,20].
The Val d’Agri basin (Basilicata, southern Italy) represents one of the most significant onshore oil and gas production areas in Western Europe and offers a compelling case study for the environmental monitoring of industrial atmospheric pollution in a sensitive ecological context. The basin hosts the “Centro Oli Val d’Agri” (COVA), operated by ENI S.p.A. in the municipality of Viggiano, which functions as the primary pre-treatment facility for the largest Italian onshore oilfield. Crude oil, natural gas, and formation water are extracted from more than 25 active wells, distributed across the Alta Val d’Agri, and conveyed by pipeline to COVA, where they are separated, processed, and prepared for transport to downstream refineries [21]. The facility has been operational since 2001 and occupies approximately 171,700 m2 within the industrial zone of Viggiano. Emissions from COVA include SO2, NOx, CO, VOCs, and a range of trace metals, all of which are dispersed into the Val d’Agri atmosphere and modulated by the complex topography and prevailing south-westerly wind regimes of the Apennine valley [22,23]. The industrial character of COVA coexists with a landscape of high ecological and legal conservation value: the surrounding territory encompasses the Appennino Lucano, Val d’Agri, Lagonegrese National Park, multiple Sites of Community Importance (SCI), Special Conservation Zones (SCZs), and Special Protection Areas (SPAs). Among them, the Pertusillo Lake reservoir SCI/SCZ (IT9210143), the primary drinking water supply for much of Basilicata and Puglia, receives the waters of the Agri River and its tributaries, including several watercourses draining the industrial zone, and has been the subject of hydrocarbon contamination studies [24]. The environmental pressure exerted by COVA on this dual industrial-natural landscape has prompted several monitoring studies [23,25], including a lichen bag biomonitoring campaign that measured trace element deposition across 59 points throughout the valley over a 12-month period [25], and a Health Impact Assessment (HIA) conducted in 2015–2017 in the municipalities of Viggiano and Grumento Nova that identified associations between COVA emission exposure and elevated mortality and hospitalisation rates among local residents [23]. However, despite these efforts, a spatially explicit and integrated assessment combining lichen biodiversity with the bioaccumulation of heavy metals and PAHs along a distance gradient from COVA is still lacking.
In this study, we address this gap by analysing lichen biodiversity as sustainability indicators of overall atmospheric quality and ecosystem integrity, together with the concentrations of heavy metals and PAHs accumulated in lichen thalli collected from trees at increasing distances from COVA. By simultaneously integrating bioindication and bioaccumulation approaches, we aimed to provide a comprehensive characterisation of the spatial extent and ecological significance of industrial pollution from COVA across the Val d’Agri landscape. We hypothesised that heavy metals and PAHs accumulated in lichen thalli should decrease with increasing distance from COVA, reflecting atmospheric dilution and deposition of industrial emissions. Conversely, we expected that lichen biodiversity should increase with distance from the facility, as the influence of atmospheric pollutants, which suppress sensitive species and reduce community richness in areas closest to the facility, progressively declines. Together, these approaches are expected to characterise the pollution gradient radiating from COVA and to provide scientific evidence to support environmental management and public health protection in the Val d’Agri.
2. Materials and Methods
2.1. Study Area
The study area is located in the Alta Val d’Agri basin (Basilicata, southern Italy) and covers a total surface of approximately 262 km2, distributed across eight municipalities: Viggiano (53.3 km2, 20.3% of the study area), Grumento Nova (66.1 km2, 25.2%), Moliterno (37.5 km2, 14.3%), Tramutola (34.9 km2, 13.3%), Montemurro (34.5 km2, 13.2%), Marsicovetere (17.3 km2, 6.6%), Spinoso (13.9 km2, 5.3%), and Sarconi (4.5 km2, 1.7%) (Table 1). The area falls primarily within the hydrographic catchment of the Agri River, the main tributary of the Pertusillo reservoir—an artificial lake covering approximately 5.8 km2 with a storage capacity of around 155 million m3—which represents a primary drinking water source for both Basilicata and the adjacent Puglia region. Additional tributaries feeding the reservoir include the Maglie River in the municipality of Grumento Nova and the Vella stream, flowing between the municipalities of Grumento Nova and Spinoso [26].
Table 1.
List of sampling points and their coordinates, altitude, and distance from COVA.
The study area is characterised by the coexistence of intense anthropogenic pressure and high ecological value. The industrial core is represented by the Centro Olio Val d’Agri (COVA), located in the municipality of Viggiano, which constitutes the primary processing facility of the largest onshore oilfield in Italy. At the same time, large portions of the study area fall within legally protected zones under European and national conservation frameworks, including Sites of Community Importance (SCI), Special Conservation Zones (SCZ), and Special Protection Areas (SPA): the Lago del Pertusillo SCI/SCZ (IT9210143), the Faggeta di Moliterno SCI/SCZ (IT9210110), the Monte della Madonna di Viggiano SCI/SCZ (IT9210180), the Appennino Lucano, Valle Agri, Monte Sirino, Monte Raparo SPA (IT9210271), and the Appennino Lucano, Monte Volturino SPA (IT9210270) [26].
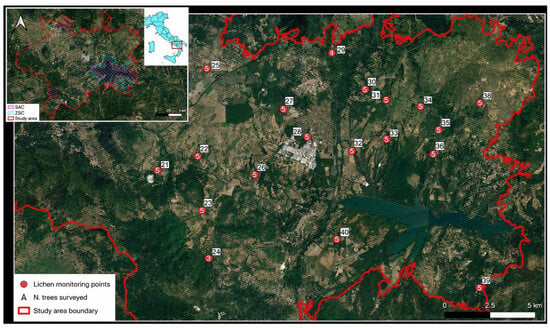
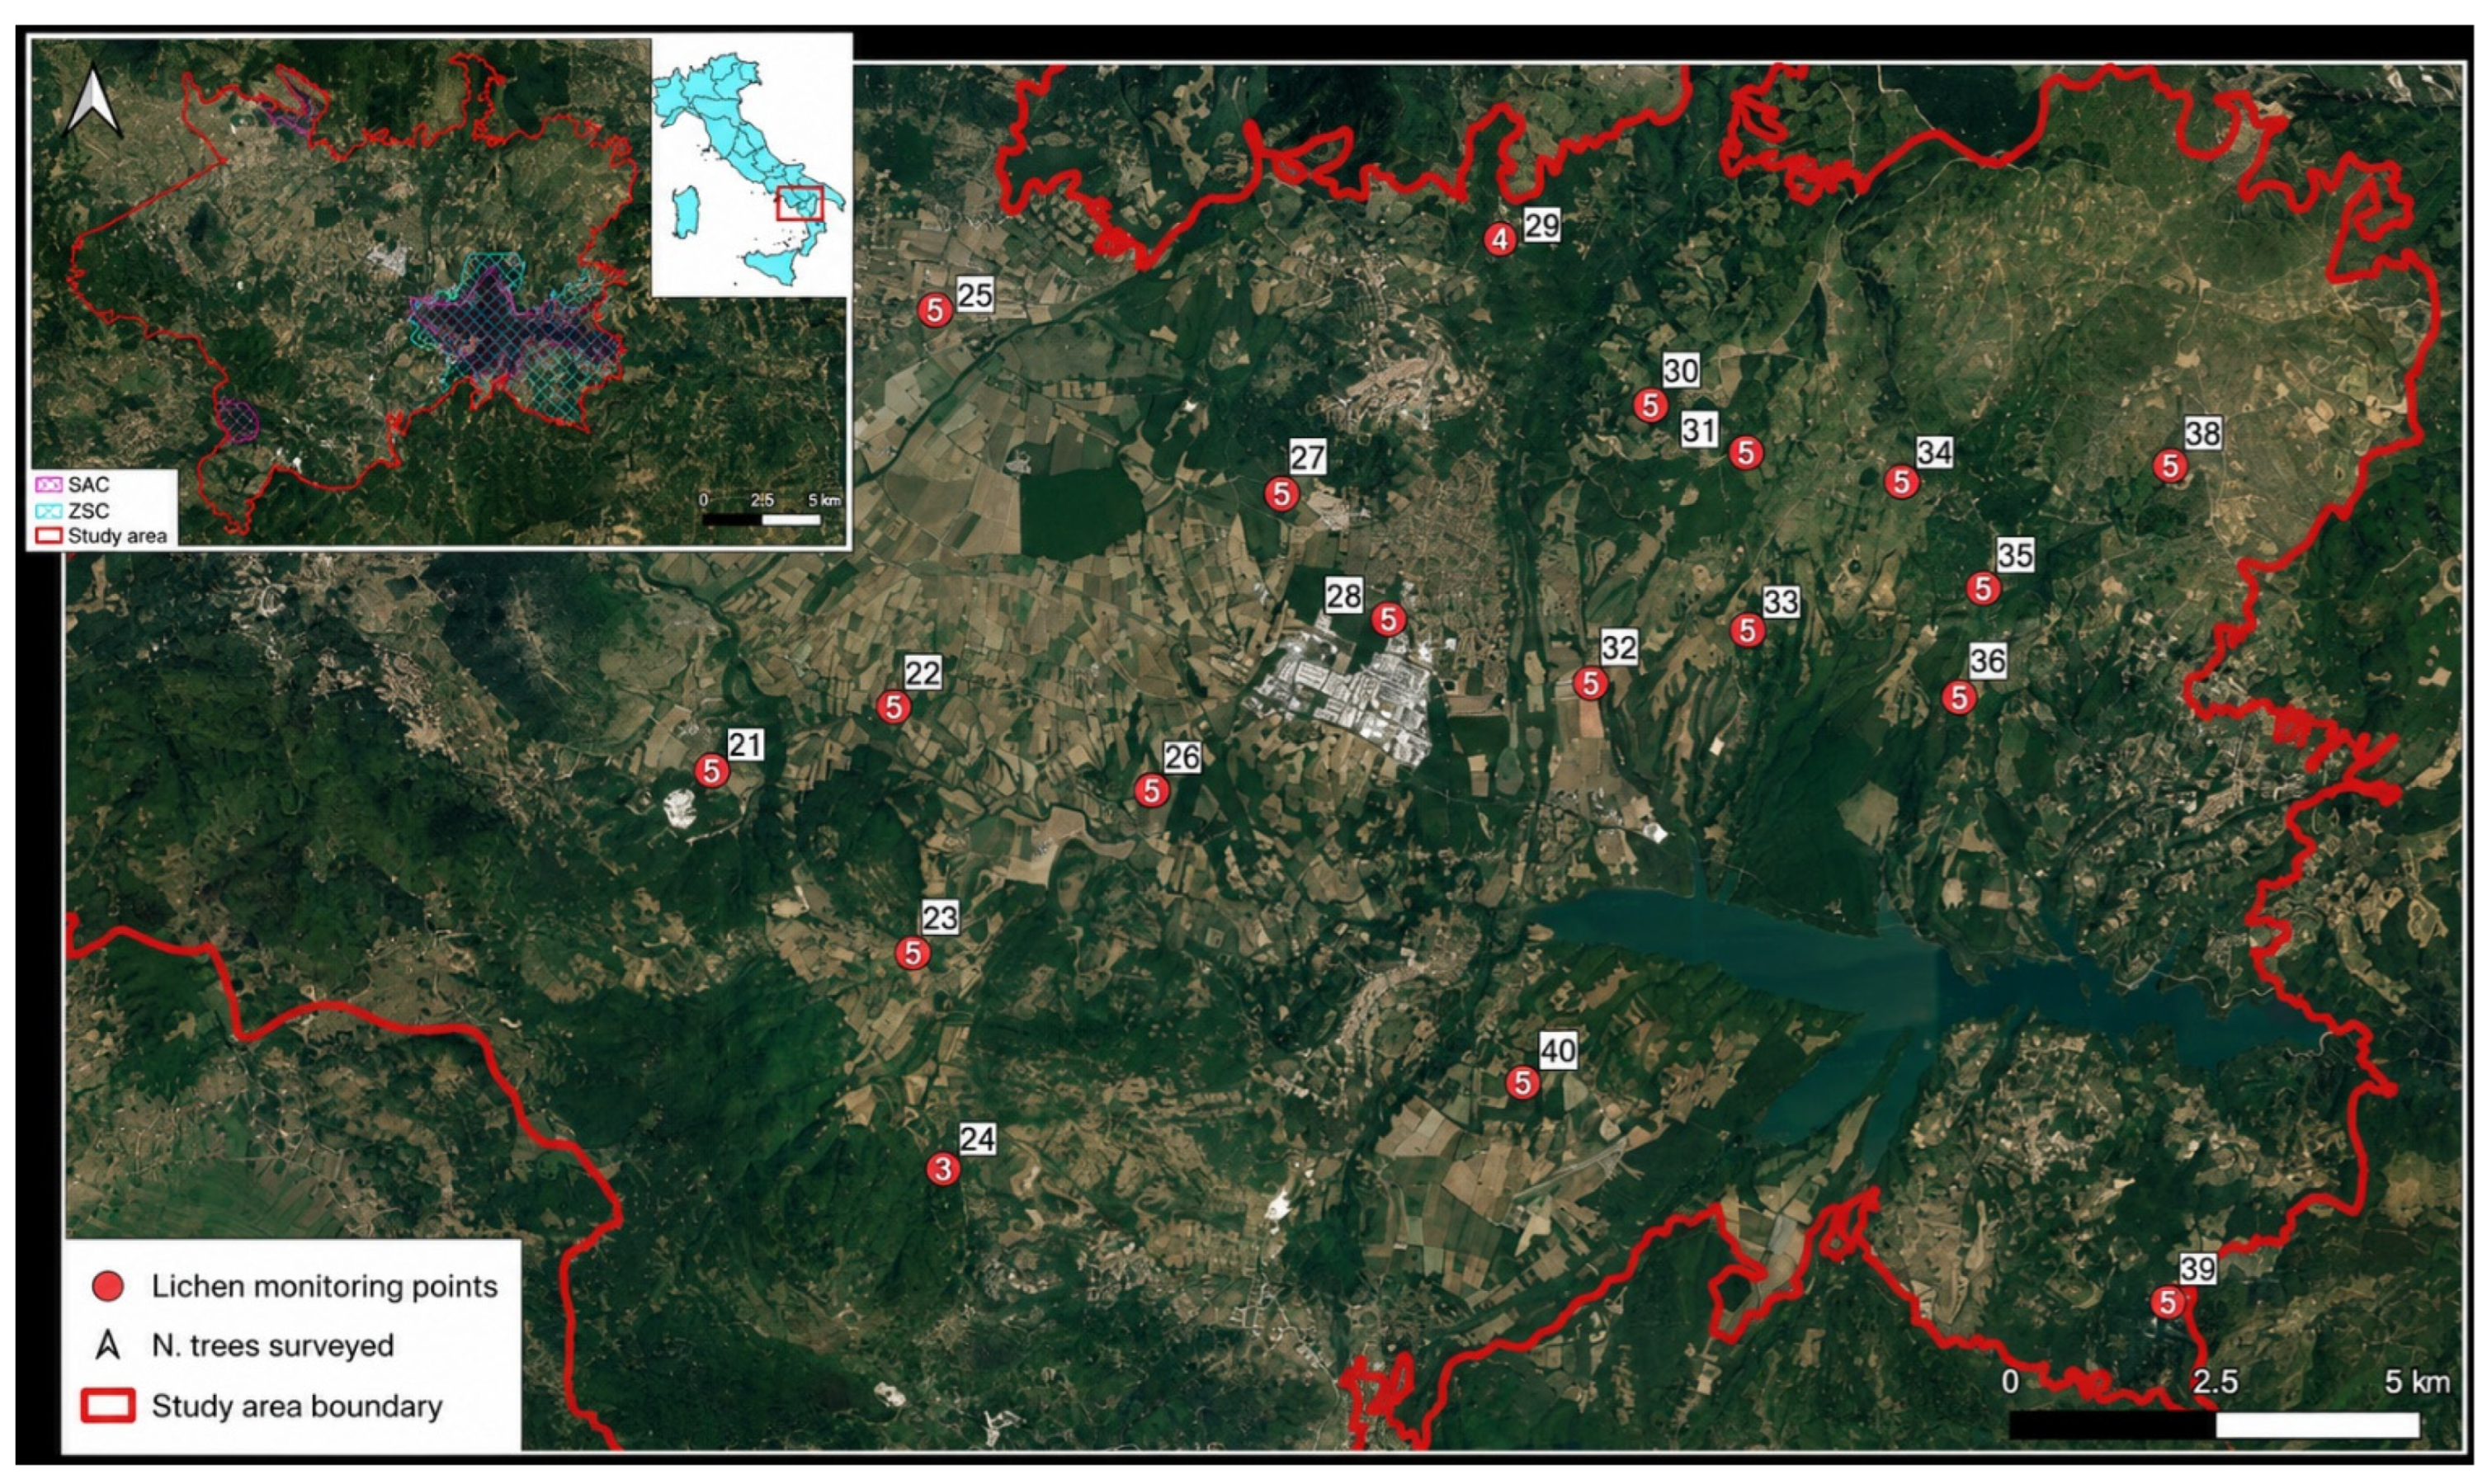
The landscape of the study area is predominantly covered by deciduous oak woodlands, mainly southern Italian Turkey oak (Quercus cerris) coppice forests. These woodlands alternate with traditional agricultural land uses, including extensive non-irrigated arable land dominated by autumn-winter cereals and complex agricultural mosaics characterised by low-intensity management. Less frequent vegetation types include mixed southern Italian forests with Turkey oak (Q. cerris) and Hungarian oak (Quercus frainetto), the latter co-dominant with field maple (Acer campestre) and Oriental hornbeam (Carpinus orientalis), as well as mesic grasslands of the hill belt and montane grasslands typical of the central and southern Apennines (Corine Biotopes classification) [27,28]. This vegetation structure, with widespread oak woodland providing abundant suitable phorophytes for epiphytic lichen communities, made the area particularly appropriate for a lichen-based biomonitoring study. Within the study area, 20 sampling points were selected along a distance gradient from the COVA facility (Figure 1 and Table 1).
Figure 1.
Location of sampling points within the study area. The red numbers indicate the number of trees surveyed at each site.
2.2. Sampling Methods
2.2.1. Lichen Monitoring
Lichen diversity was monitored following the guidelines provided by ANPA [29], calculating the Lichen Biodiversity Index (LBI) at each sampling site.
Since it was decided to maintain the same sampling locations for all study groups involved in the monitoring programme [30], the procedure for identifying Permanent Sampling Units (UCP) and Sampling Cells (UCS) described in ANPA [29] was not applied.
At each sampling site, five trees of the same species (Turkey oak, Quercus cerris) were selected, choosing, whenever possible, the first five suitable Turkey oak trees closest to the previously established sampling point. Trees had to meet the following criteria: (1) circumference at 1.25 m above ground greater than 60 cm; (2) minimum distance of 10 m between trees; and (3) trunk inclination less than 10°. Following a preliminary survey of the selected sites, Quercus cerris was chosen as the host tree species for lichen analyses because of its widespread and consistent occurrence throughout most of the study area. When no Q. cerris individuals meeting the sampling criteria were available at a site, analyses were conducted on the most common tree species present within the same pH group, provided that suitable individuals were available.
For each selected tree, a vertical grid measuring 10 × 50 cm, divided into five 10 × 10 cm squares, was applied at a height of one metre above ground in each of the four cardinal directions. This resulted in a total of 20 sampling quadrats per tree. Geographic coordinates and trunk circumference measured at 1.25 m above ground were recorded for each tree. Within each cardinal direction, the occurrence of lichen species was recorded within the grid quadrats, along with their frequency, expressed on a scale from 1 to 5 according to the number of occupied quadrats.
For specimens that could not be identified in the field, a small sample was collected for subsequent laboratory identification, while minimising the removal of lichen thalli. Identification of lichen species generally requires the use of a stereomicroscope and a compound light microscope, which allow observation of diagnostic features essential for accurate identification. Routine chemical reagents in Lichenology were also employed to detect the presence or absence of specific secondary metabolites. For taxa that are particularly difficult to identify based solely on morphological characteristics and require additional analytical techniques, such as thin-layer chromatography (TLC) or molecular analyses, identification was limited to the corresponding species group.
Species identification was based on the online identification keys available in ITALIC (version 07) [31]. Lichenicolous fungi, although not lichenized, were also identified whenever an identification key was available in ITALIC.
For the qualitative analysis of the species, ecological indicator values reported in ITALIC [31] were used. In particular, nitrophilous species (eutrophication index equal to 4 or 5), indicative of degraded environments and anthropogenic influence, and species requiring highly natural conditions (poleotolerance index equal to 0) were considered. The Red List of Italian epiphytic lichens [32], developed according to the IUCN [33] criteria, was also consulted. Fieldwork was carried out in the period June–September 2022.
2.2.2. Lichen Sampling for Chemical Lab Analysis
As a complementary analysis to lichen biodiversity monitoring, we conducted bioaccumulation analyses on native thalli of Evernia prunastri (L.) Ach., a fruticose lichen species commonly found across the study area. Lichens were collected in the same sampling sites used for bioindication. In each site, we collected up to three replicates of lichen samples, separately for metals and hydrocarbons. Each sample was constituted by 3–5 lichen specimens longer than 3 cm.
Samples for metal analyses were stored in paper bags at room temperature, whereas samples for hydrocarbon analyses were stored in paper bags covered by aluminium foil at freezer temperature.
2.3. Lab Methodology
Lichen thalli were collected using standard biomonitoring protocols to avoid metal contamination (nitrile gloves, plastic tools, no metal instruments in contact with samples). Only the outer, actively growing portions of the thalli were retained, since these parts best reflect recent atmospheric deposition [13,34]. Samples were oven-dried at 40–45 °C to constant weight, then homogenised using a plastic or agate mill to avoid trace metal contamination from metal grinding surfaces [35]. Approximately 0.5 g (dry weight) of homogenised lichen material was accurately weighed into digestion vessels. Samples were digested with 5 mL of freshly prepared aqua regia (HCl:HNO3, 3:1 v/v), following a microwave/hot-block acid digestion of sediments, sludges, and biological matrices [36]. Digestion was carried out at 90 °C for 2 h in a heating block or water bath under a fume hood, with vessels loosely capped to allow venting while minimising analyte loss. After digestion, samples were allowed to cool to room temperature, filtered (0.45 μm membrane filter) to remove undigested particulate, and the residue rinsed with ultrapure (Milli-Q, 18.2 MΩ·cm) water. The filtrate was quantitatively transferred to a volumetric flask and brought to a final volume of 50 mL with ultrapure water, yielding a dilution suitable for direct introduction into the ICP-MS. Metal concentrations were determined by inductively coupled plasma mass spectrometry (ICP-MS) using an Agilent 7700 Series instrument (Agilent Technologies, Santa Clara, CA, USA). Typical operating parameters include an RF power of ~1550 W, plasma gas flow ~15 L/min, carrier gas flow ~1.0 L/min, and use of the Octopole Reaction System (ORS) in helium collision mode to reduce polyatomic interferences. Procedural blanks: at least one reagent blank (aqua regia only, no lichen material) processed per digestion batch to correct for background contamination. Instrumental detection limits (IDLs) were calculated as 3× the standard deviation of repeated blank measurements.
For the analysis of hydrocarbons, approximately 5 g of dried, homogenised lichen thalli were weighed and extracted with 20 mL of a hexane:acetone mixture (80:20, v/v) (Ultrasonic Extraction) [37]. Samples were subjected to ultrasonic-assisted extraction (sonication bath) for 1 h to promote efficient release of lipophilic organic compounds, including both aliphatic hydrocarbons and PAHs, from the lichen matrix. Extracts were purified using a glass clean-up column packed with 0.5 g of Florisil (activated magnesium silicate) and 0.25 g of anhydrous sodium sulfate, the latter serving to remove residual moisture from the extract. This adsorption clean-up step (Silica Gel/Florisil Clean-up) [38], was used to separate the sample into two fractions of differing polarity: (a) Aliphatic/heavy hydrocarbon fraction (C10–C40): The full 20 mL volume of the hexane:acetone extract was eluted through the Florisil column, and the eluate was concentrated under a gentle nitrogen stream to a final volume of 1 mL. This fraction was analysed for total petroleum hydrocarbons in the C10–C40 range (Nonhalogenated Organics Using GC-FID) [39]; (b) PAH fraction: A further 20 mL of dichloromethane (DCM), a more polar solvent, was subsequently passed through the same clean-up column to elute the retained polycyclic aromatic hydrocarbons. This fraction was likewise concentrated to a final volume of 1 mL under a gentle nitrogen stream. The PAH fraction was analysed by gas chromatography coupled with triple quadrupole mass spectrometry (GC-MS/MS; Agilent Technologies, Santa Clara, CA, USA) operating in multiple reaction monitoring (MRM) mode, which provides high selectivity and sensitivity for trace-level PAH quantification [40]. Chromatographic separation was achieved using a DB-5MS/HP-5MS, 30 m × 0.25 mm i.d., 0.25 μm film thickness capillary column. Helium was used as the carrier gas at a constant flow rate of 1.0–1.2 mL min−1. Samples of 1 μL were injected in splitless mode at an injector temperature of 280–300 °C. The mass spectrometer was operated in EI mode at 70 eV, with the ion source and transfer line maintained at approximately 230 °C and 280–300 °C, respectively. Target analytes were quantified using compound-specific MRM transitions and collision energies.
22 PAHs (Naphthalene, Acenaphthylene, Acenaphthene, Fluorene, Phenanthrene, Fluoranthene, Pyrene, Benzo(a)anthracene, Chrysene, Benzo(b)fluoranthene, Benzo(k)fluoranthene, Benzo(j)fluoranthene, Benzo(e)pyrene, Benzo(a)pyrene, Perylene, Indeno[1,2,3-cd]pyrene, Dibenzo(a,h)anthracene, Benzo(ghi)perylene, Dibenzo(a,l)pyrene, Dibenzo(a,e)pyrene, Dibenzo(a,i)pyrene, Dibenzo(a,h)pyrene) were targeted (Semivolatile Organic Compounds by GC/MS) [41]. Procedural blanks (solvent only, carried through the full extraction and clean-up procedure) were analysed with each batch to assess background contamination. Recovery efficiency was evaluated using surrogate standards (e.g., deuterated PAHs such as naphthalene-d8, acenaphthene-d10, phenanthrene-d10, chrysene-d12, and perylene-d12) spiked into samples prior to extraction, with acceptable recoveries typically in the 70–130% range. Instrument calibration was performed using a certified PAH standard mixture across a multi-point calibration curve (typically 5–8 points), with correlation coefficients (R2) ≥ 0.995 required for acceptance. Method detection limits (MDLs) were calculated from repeated analysis of low-level spiked samples [42].
2.4. Statistical Methods
To calculate the Lichen Biodiversity Index, species frequencies recorded in the four cardinal directions were summed to obtain an LBI value for each sampled tree. The LBI value of each site was then calculated as the mean of the values obtained for all sampled trees within each site:
The degree of environmental alteration at each site was evaluated using the interpretation grid developed by Giordani [43]. Because the LBI considers only species richness and frequency and does not account for species ecological characteristics, two additional indices were calculated following the same procedure: one excluding nitrophilous species and another considering only nitrophilous species. Pearson’s correlation coefficient (r) was calculated to assess the linear relationship between distance from COVA (in metres) and the concentration of each heavy metal and PAH measured in lichen thalli (dependent variables). Prior to analysis, all variables were inspected for variance; compounds exhibiting zero or near-zero variance across all sampling sites (i.e., PAH congeners below detection limits throughout the dataset) were excluded from correlation analysis as statistically uninformative. Pearson’s r was computed for all remaining variables (28 heavy metals and 6 PAHs) using pairwise complete observations to maximise sample size in the presence of missing values. Statistical significance, with the Benjamini–Hochberg FDR correction applied to the p-values, was evaluated at three conventional thresholds: p < 0.05 (*), p < 0.01 (**), and p < 0.001 (***). To contextualise effect sizes, correlation coefficients were interpreted following standard benchmarks: |r| ≥ 0.30 as a moderate effect and |r| ≥ 0.50 as a strong effect. To summarise and visualise the relative importance of each variable with respect to distance from COVA, variables were ranked by their absolute Pearson r value and represented in a horizontal bar chart, with the direction of the bar indicating the sign of the correlation (positive or negative) and colour coding distinguishing statistically significant from non-significant associations. For variables showing statistically significant correlations, scatter plots with fitted ordinary least squares regression lines and 95% confidence bands were produced to illustrate the nature and strength of the distance-concentration relationship. All analyses were performed in RStudio IDE 2026.09.0 [44].
3. Results
3.1. Lichen Diversity
Lichen sampling for the calculation of the Lichen Biodiversity Index (LBI) was successfully conducted at 19 of the 20 selected sites. Site 37 was excluded due to the absence of suitable Quercus sp. individuals and difficulties in accessing the site. At site 24, only three trees were surveyed instead of five because of the scarcity of individuals meeting the sampling criteria.
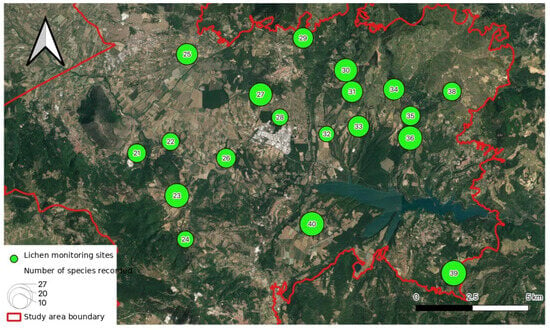
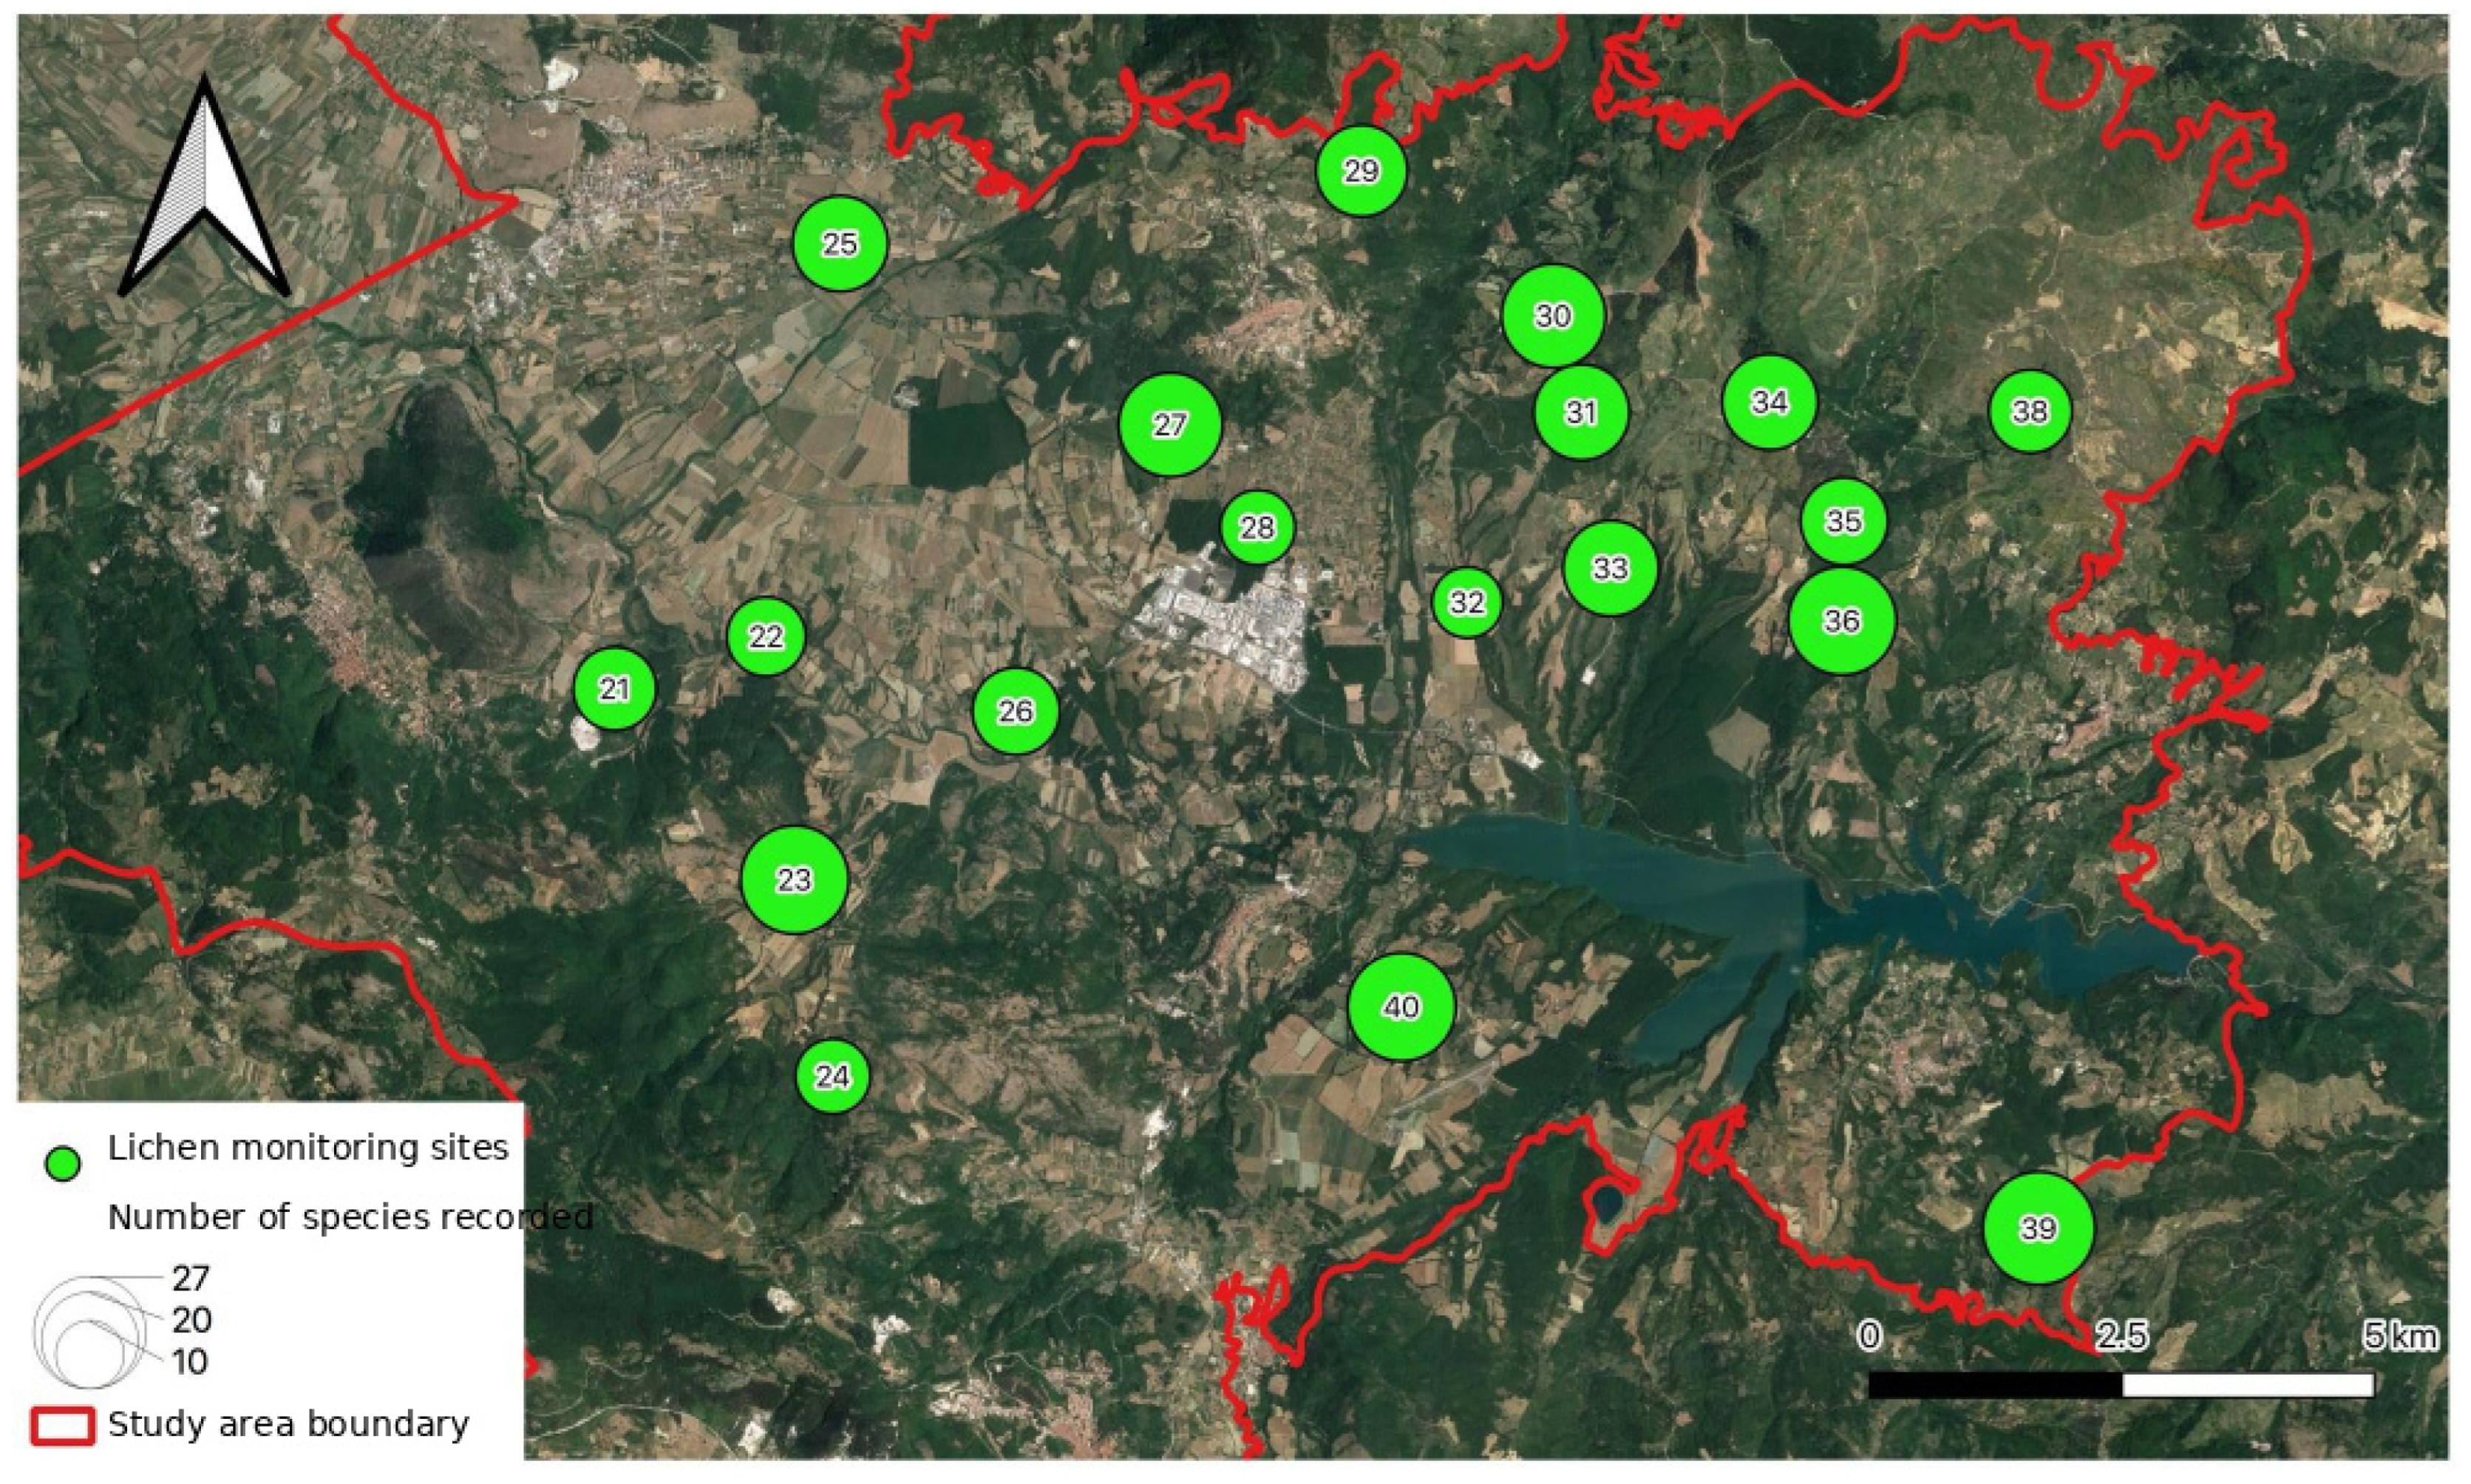
Species richness at the sampling sites ranged from 17 taxa (site 32) to 27 taxa (site 39; Figure 2). At the individual tree level, the number of recorded taxa ranged from a minimum of 5 (site 26, tree 1) to a maximum of 22 (site 27, tree 2), with an average of 13.24 taxa per tree.
Figure 2.
Representation of the number of taxa detected at each site. The size of the circle is proportional to the number of taxa, while the numbers indicate the site number.
A total of 62 taxa were identified at the species or subspecies level, while four taxa were identified only to genus level (Supplementary Table S3). Physconia was the genus with the highest number of taxa (five). Lecanora chlarotera subsp. chlarotera, Lecidella elaeochroma var. elaeochroma, and Parmelia sulcata were recorded in all surveyed sites. Graphis pulverulenta and Opegrapha niveoatra, both found at site 23, represent new records for the Basilicata region. Sphinctrina turbinata, recorded at sites 30 and 39 growing on thalli of Pertusaria pertusa, was the only lichenicolous fungus identified during the study. Records attributed to Lecanora expallens should be considered as belonging to the morphologically similar species complex; more detailed laboratory investigations, not performed during the present study, will be necessary to achieve reliable species-level identification.
Among the recorded taxa, crustose lichens were the most common growth form (53.0%), followed by foliose lichens (37.9%) and fruticose lichens (7.6%). Lichenicolous fungi were represented by a single species (1.5%).
No significant linear relationship was observed between tree circumference and species richness (correlation coefficient = 0.0967, p = 0.356). In contrast, a significant positive correlation was found between altitude and species richness (correlation coefficient = 0.256, p = 0.0131). To disentangle whether the relationships between lichen diversity and distance from the industrial site were influenced by altitude, I conducted a partial correlation analysis that showed no significant relationships (r = 0.01, p = 0.074).
Only at 4 sampling points out of 20 (Supplementary Figure S4) did we find species included in the Red List of Italian epiphytic lichens [32]. Two species of conservation concern were recorded: Buellia triseptata and Eopyrenula leucoplaca. The former, classified as Critically Endangered (CR), was found at sites 30 and 36, on a single tree at each site. The latter, classified as Near Threatened (NT), was recorded on two trees at site 40. Both species had already been reported during the previous lichen monitoring survey conducted in the Val d’Agri area [45], although at different sites. Eopyrenula leucoplaca is also considered an indicator of well-preserved natural conditions (poleotolerance index = 0), as well as Thelenella modesta, which was recorded on two different trees at site 21 (Figure 2).
Nitrophilous species were recorded (Supplementary Table S2). Across sampling sites, the number of these species ranged from a minimum of 2 (site 32) to a maximum of 8 (sites 25 and 29).
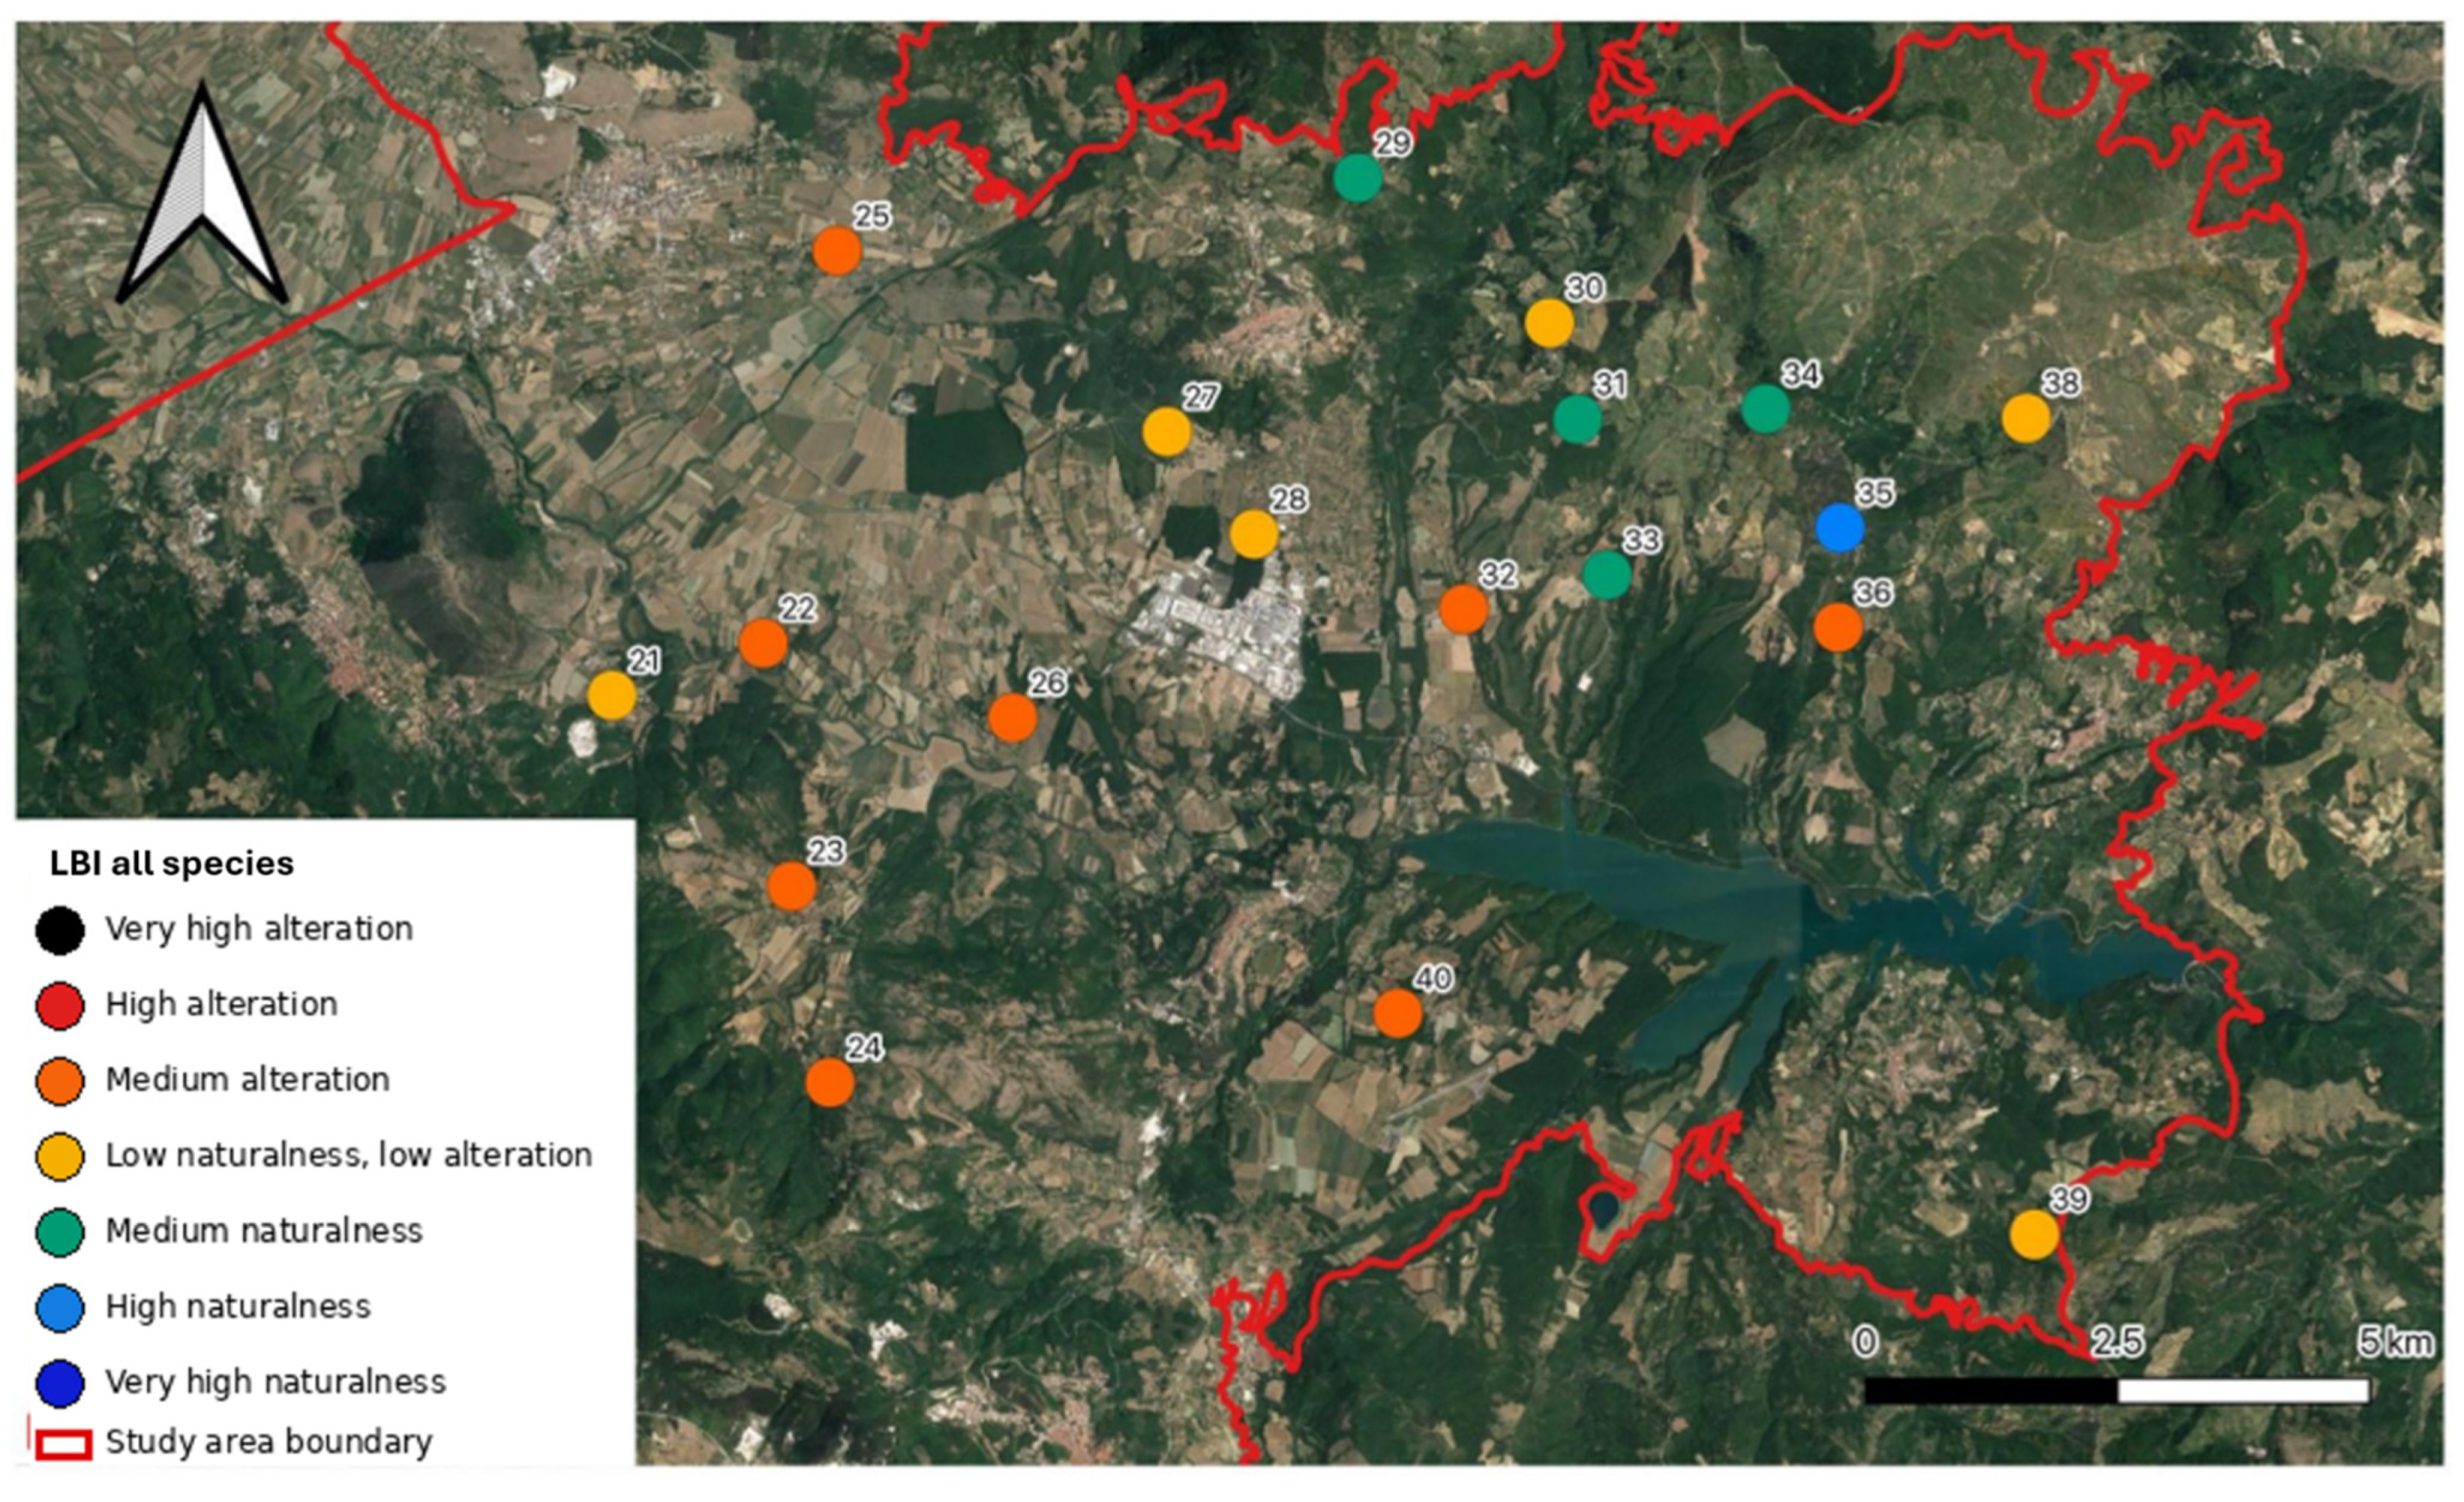
The LBI values, including all lichen species (Figure 3, Supplementary Figure S1, and Table 2), belong to “Medium disturbance” (8 sites), “Low naturalness, low alteration” (6 sites), “Medium naturalness” (4 sites), and „High naturalness” (1 site) classes (for classification, see Supplementary Table S1).
Figure 3.
Representation of LBI classes at sampling sites, considering all lichen species.
Table 2.
Summary, for each site, of the LBI values calculated considering all species, only non-nitrophilous species, and only nitrophilous species, respectively and their correlations with the distance from COVA.
Excluding nitrophilous species, the most frequent LBI class is “Low naturalness, Low disturbance” (7 sites), followed by “Medium alteration” and “Medium naturalness” (both 5 sites); “High alteration” and “High naturalness” were found at only one site (Table 2 and Supplementary Figure S2).
Considering only nitrophilous species, the most frequent LBI class is “Medium naturalness“ (7 sites), followed by “Medium alteration” and “High naturalness” (both 4 sites), “Low naturalness, low alteration” (3 sites), and “High alteration” (1 site; Table 2 and Supplementary Figure S3).
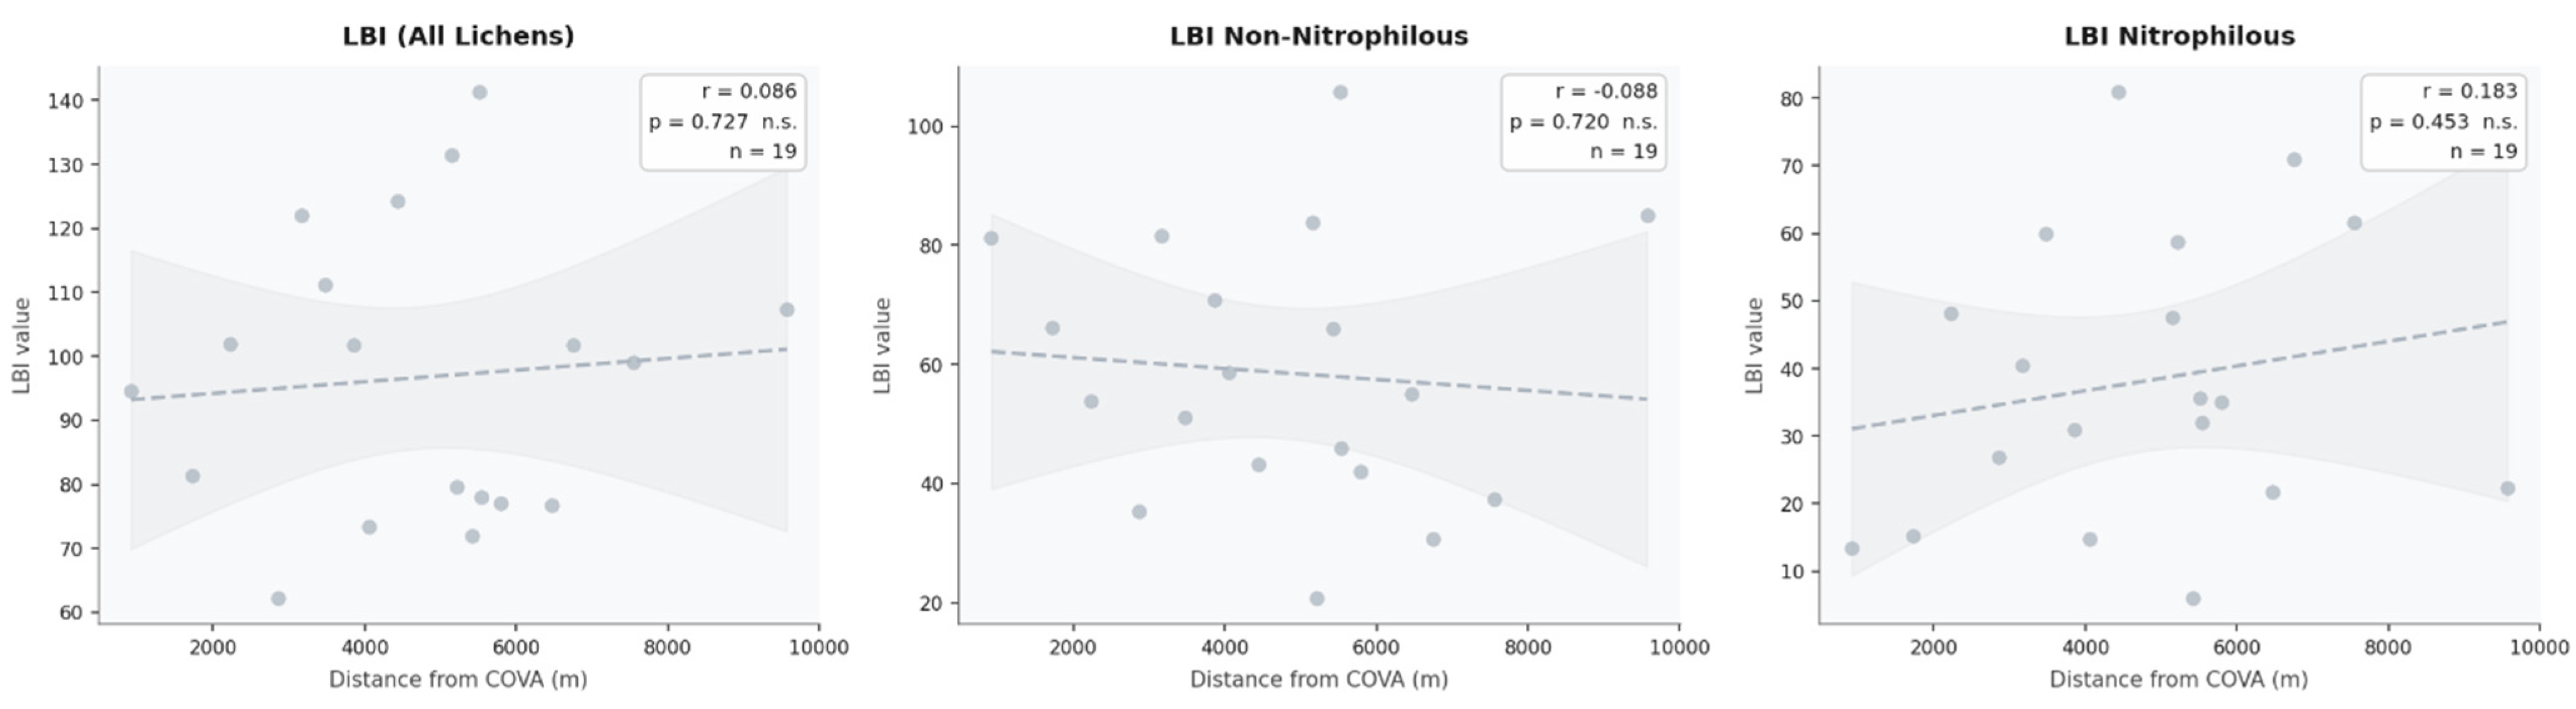
None of the three versions of LBI showed a statistically significant correlation with distance from COVA (Pearson’s p-values= 0.727, 0.720, 0.453, respectively; Figure 4).
Figure 4.
Correlation between Lichen Biodiversity Index (LBI) and the distance from COVA. r and p values reported in the inset are calculated as Pearson correlation.
3.2. Heavy Metals and PAHs
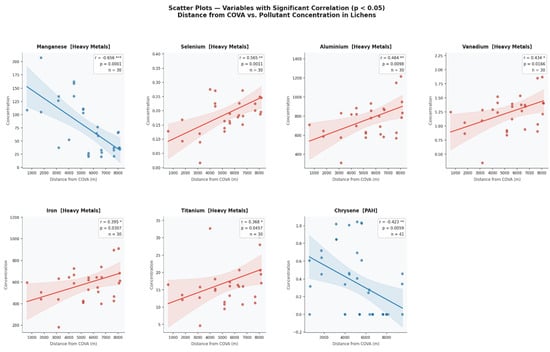
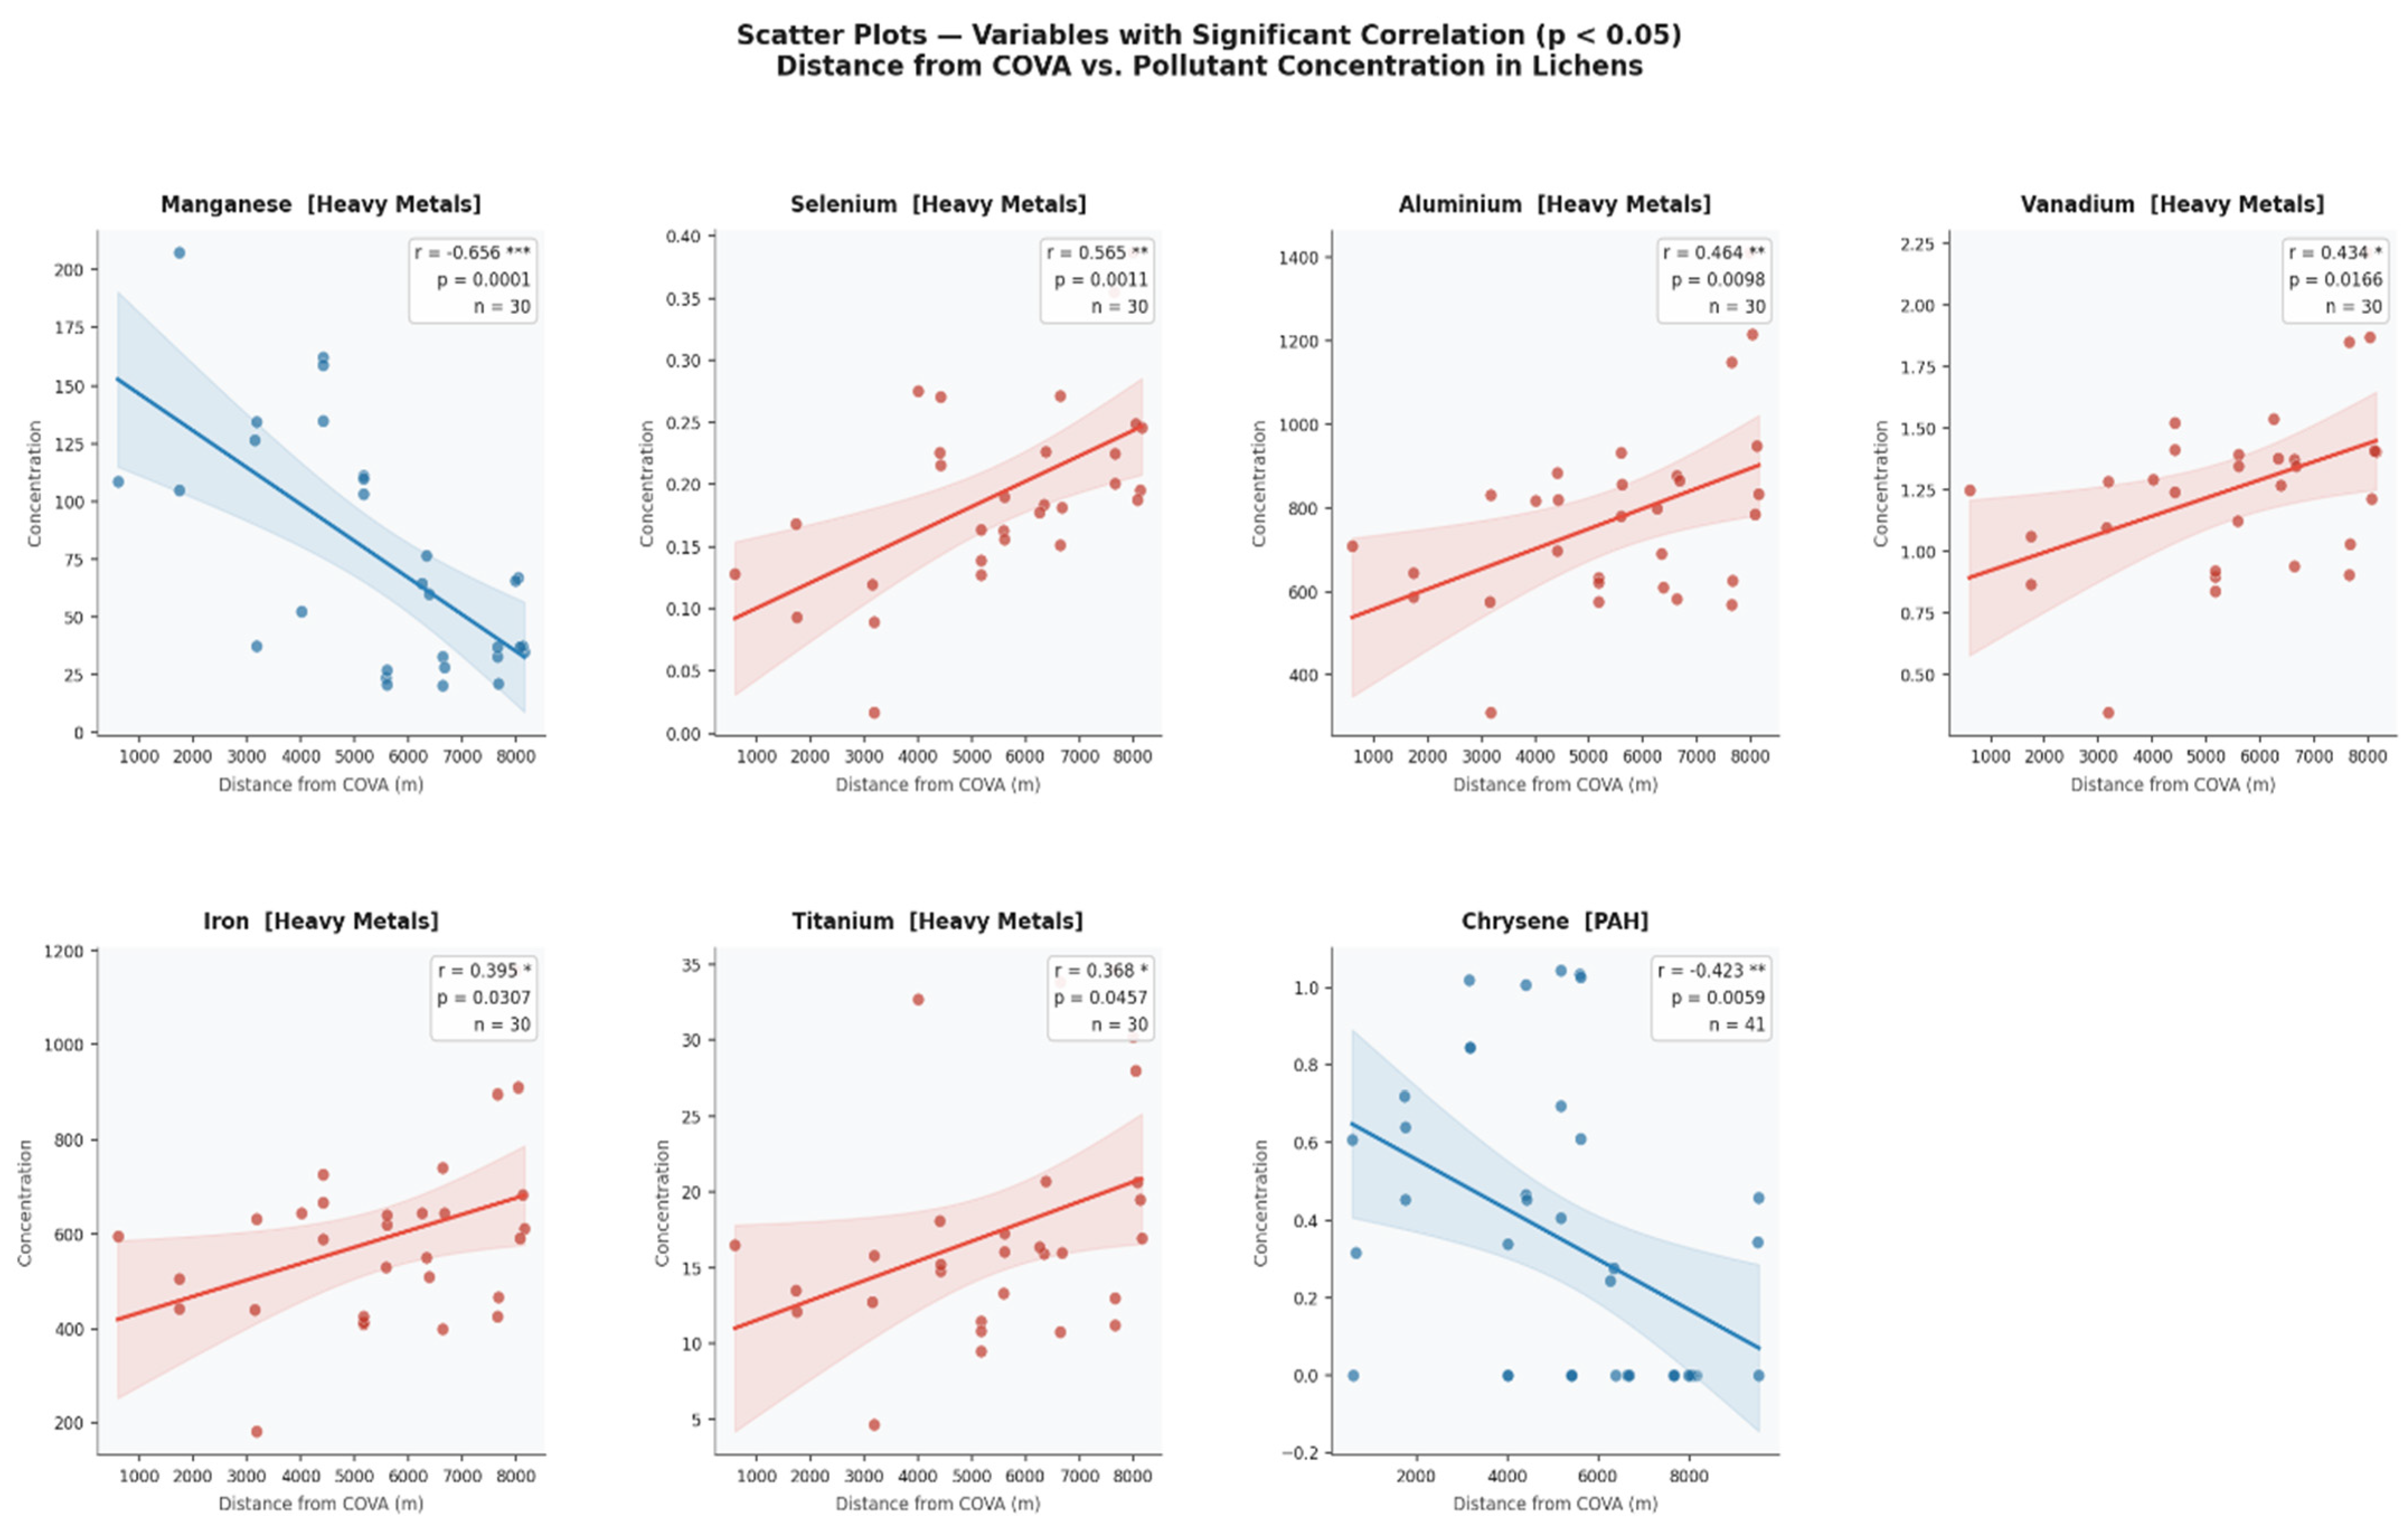
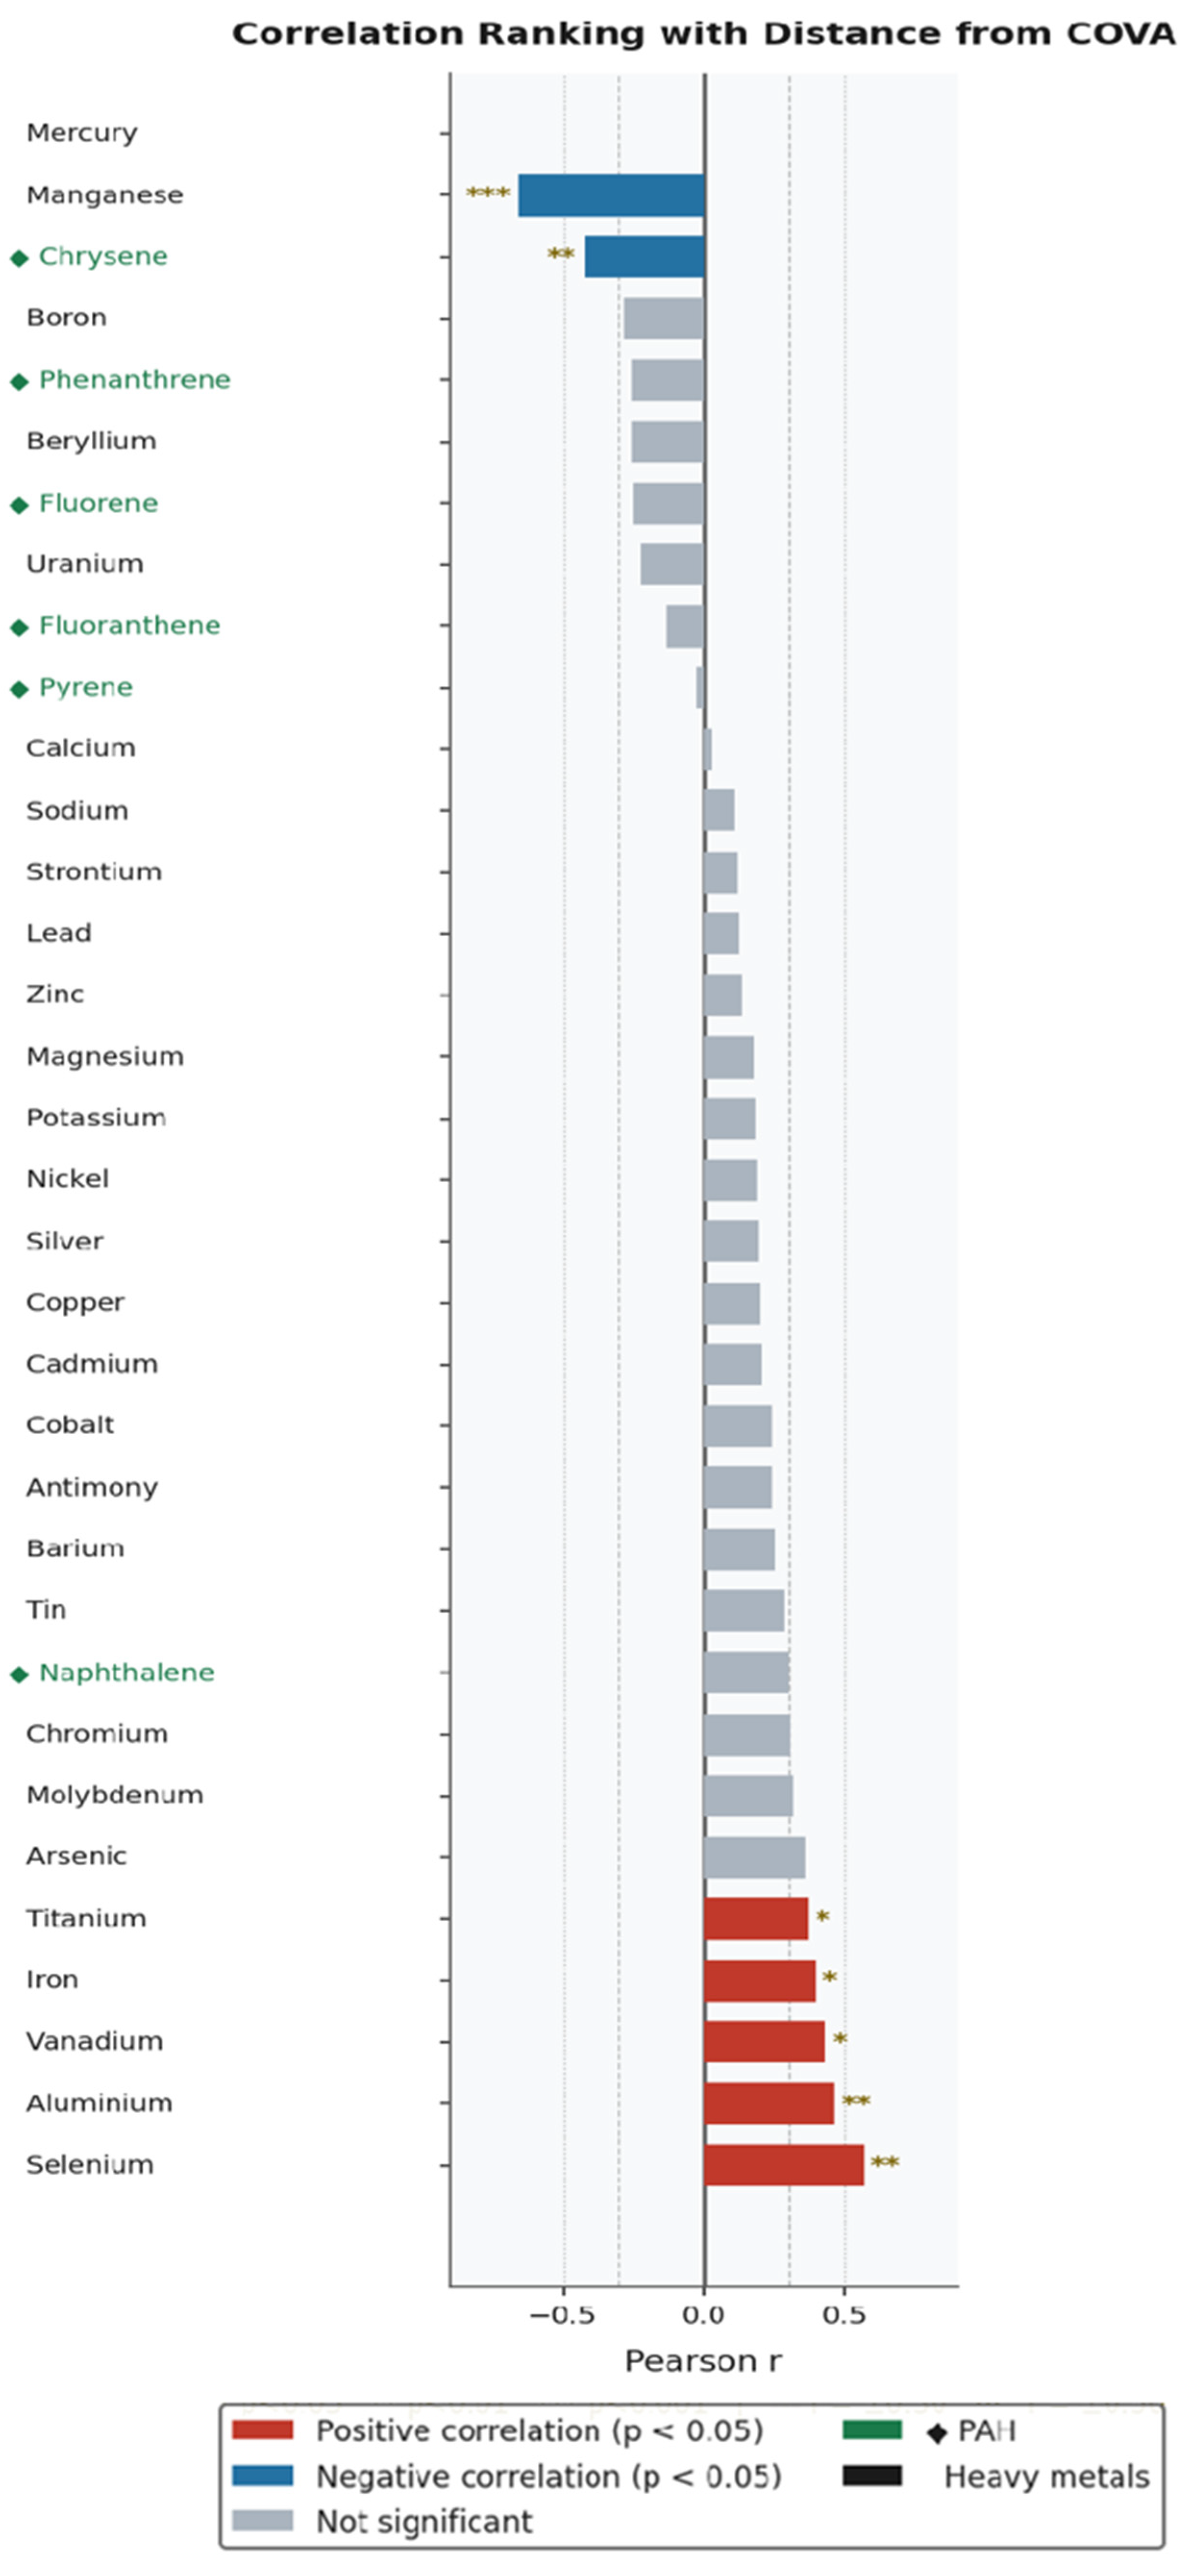
Twenty-eight heavy metals and six PAHs were included in the analysis. Manganese showed the strongest signal: its concentration in lichens decreases with increasing distance from COVA (Figure 5). Chrysene (PAH) follows the same pattern: greater contamination near the plant (Figure 6). Metals such as selenium, aluminium, vanadium, iron, and titanium, on the other hand, show an increase with distance (Figure 5).
Figure 5.
Correlation of variables with significance <0.05 among the Heavy Metals and Polycyclic Aromatic Hydrocarbons (PAHs) found in the lichens collected at incremental distances from the COVA oil extraction centre. r- and p-values reported in the inset are calculated as Pearson’s correlation. p < 0.05 (*), p < 0.01 (**), and p < 0.001 (***).
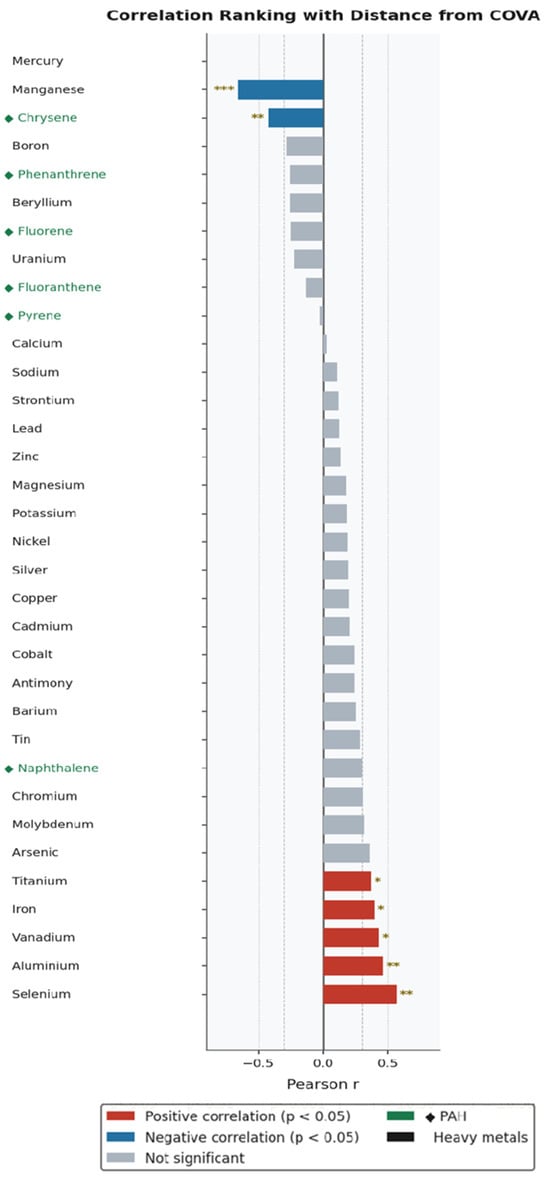
Figure 6.
Correlation of all heavy metals (black) and Polycyclic Aromatic Hydrocarbons (PAHs; green) found in the lichens sampled, ranked in relation to the distance from the COVA oil extraction centre. Correlations are expressed as positive (red bars), negative (blue bars), and non-significant (grey bars), with a probability of p < 0.05 = *, p < 0.01 = **, p < 0.001 = ***.
4. Discussion
4.1. Lichen Diversity Does Not Detect Pollution Gradients
The absence of a statistically significant correlation between the LBI, whether computed for total, non-nitrophilous, or nitrophilous lichen species, and distance from COVA can be attributed to several non-exclusive mechanisms that collectively illustrate the inherent complexity of deploying community-based bioindication in forested, mixed land-use landscapes.
Unlike chemical concentrations in lichen thalli, which respond directly and quantitatively to atmospheric deposition fluxes, community composition and species richness indices such as the LBI integrate the simultaneous effects of a broad range of abiotic and biotic drivers, many of which vary independently of any industrial pollution gradient. Bark pH, tree species identity, trunk diameter, canopy openness, local humidity, and microclimate have all been identified as primary determinants of epiphytic lichen community structure, often explaining more variance than air quality variables alone [46,47]. In forested areas specifically, harvesting and forest fires have been shown to exert a predominant effect on lichen diversity, suggesting the need to develop a more defined sampling protocol to estimate atmospheric pollution in such ecosystems [48]. In the Val d’Agri study area, the dominant vegetation is Turkey oak (Quercus cerris) coppice, a forest type subject to periodic cutting cycles. Epiphytic lichens represent one of the most suitable indicators of forest continuity and management, and coppicing—the traditional management system covering more than 10% of European forests—has been shown to significantly affect lichen diversity through its effects on trunk age, bark characteristics, and canopy structure [47]. The pervasive and spatially heterogeneous disturbance generated by coppice management throughout the study area could therefore mask or override any pollution-driven signal in the LBI, rendering a distance-from-COVA gradient statistically undetectable.
The bioindication approach, and the LBI specifically, was originally developed and calibrated against SO2 gradients—the dominant industrial air pollutant of the twentieth century—and the most well-established lichen community responses are to sulphur and nitrogen deposition [15,17]. In urban and industrial areas, air pollutants, mainly SO2, are still the main limiting factor for lichen diversity; however, as SO2 concentrations have declined under emission controls, the relationship between lichen diversity and distance from industrial sources becomes progressively less significant [48]. COVA is an oil pre-treatment plant operating under formal emission controls, with SO2 and NOx emissions that, while documented, are not of the magnitude associated with the lichen deserts historically recorded around smelters, coal-fired power plants, or heavy chemical industries. The facility emits a complex mixture of hydrocarbons, VOCs, and trace metals rather than the high-SO2 plumes to which the LBI framework is most sensitive. This mismatch between pollutant type and index sensitivity may substantially reduce the bioindication power of the LBI in this specific industrial context.
A further critical limitation of a distance-based LBI analysis is the implicit assumption that pollution disperses radially from COVA in all directions equally. We also acknowledge that other sources of chemicals in the industrial hub may partially influence the emissions in the area. However, these do not seem to be major sources of oil-refining pollutants compared to COVA [49,50,51]. Pollution levels around an oil refinery are significantly influenced not only by distance but also by direction-specific wind patterns, underscoring the need to include these meteorological variables in biomonitoring studies [52]. In the Val d’Agri, the complex Apennine topography channels airflows predominantly along the valley axis, meaning that sampling stations at equivalent distances from COVA may receive substantially different pollutant deposition loads depending on their directional position relative to prevailing winds. In future studies, reanalysing the LBI data in a wind-direction-corrected framework—for instance, by separating downwind from upwind stations—could potentially reveal community-level responses not detectable through a purely radial distance approach.
Taken together, these considerations suggest that the absence of a significant LBI –distance correlation does not imply that COVA exerts no influence on lichen communities in the Val d’Agri, but rather that community-level bioindication, as captured by the LBI, is an insufficiently sensitive instrument to resolve the specific and spatially diffuse character of this industrial pollution signal against the high ecological background variability of a managed oak forest landscape.
4.2. Manganese and Chrysene as Industrial Pollutants
Of the 34 HM and PAH elements for which statistical analysis was possible (i.e., variables with non-zero variance and adequate sample size), seven showed statistically significant correlations with distance (p < 0.05). The results reveal a spatially structured pollution landscape consistent with two superimposed source domains: a localised industrial plume likely attributable to the industrial site, and a diffuse, rural-geogenic background that dominates the chemistry of more distal sampling sites. It is worth noting that the majority of PAH congeners measured in this study—including all higher-molecular-weight compounds from Benzo(a)anthracene to Dibenzo(a,h)pyrene—exhibited zero or near-zero concentrations across all sampling sites and were therefore excluded from correlation analysis owing to lack of variance. This near-universal absence most likely reflects a combination of lichen species-specific lipid content limitations, analytical detection thresholds, and genuine low abundance of pyrogenic high-molecular-weight PAH deposition at the sampled sites. Only six PAH compounds (Naphthalene, Fluorene, Phenanthrene, Fluoranthene, Pyrene, and Chrysene) showed measurable variation and were retained in the analysis.
4.2.1. Manganese
Manganese (Mn) exhibited the strongest and most statistically robust correlation with distance from COVA (r = −0.656, p < 0.001, n = 30), with concentrations declining sharply as sampling distance increased. This gradient is consistent with a point emission pattern and aligns with the known geochemistry of oil extraction. Manganese is a natural trace constituent of crude oil and associated formation waters, and its atmospheric release occurs through multiple pathways inherent to oil processing [53]: combustion of associated gas and residual fuels in turbines and boilers operating within the COVA perimeter; fugitive emissions from produced-water handling, which concentrates dissolved metals including Mn from deep geological strata; and resuspension of Mn-enriched drill cuttings and process dust. Additionally, Mn-based fuel additives such as methylcyclopentadienyl manganese tricarbonyl (MMT), used historically as an antiknock agent in gasoline, further contribute to atmospheric Mn loading in the vicinity of operational facilities [54]. The combustion of Mn-containing compounds produces manganese oxides—predominantly Mn3O4—which partition onto fine particulate matter and are efficiently intercepted by lichen thalli [13].
The observed negative distance gradient is coherent with the atmospheric dilution and gravitational deposition of Mn-bearing particles, which follow a logarithmic decay with distance characteristic of industrial sources [55]. The finding is further supported by a prior lichen biomonitoring campaign conducted in the Agri Valley by Loperte et al. [25], who measured Al, Fe, Mn, Ti, and Zn in transplanted lichen bags at 59 monitoring points over a 12-month exposure period and identified significant industrial and geogenic source contributions. The present study’s independent dataset thus corroborates the potential identification of COVA as a significant proximal emitter of Mn in the Val d’Agri atmospheric environment.
Regarding health implications, the proximity gradient documented here is of direct public health relevance. Inhalation is the primary route of concern for airborne Mn exposure, as inhaled particles bypass hepatic homeostatic regulation and accumulate in the central nervous system [56]. Environmental epidemiological studies in communities near Mn-emitting facilities have documented measurable neurological impairments in adult residents with chronic exposure [57]. The municipalities of Viggiano and Grumento Nova, the settlements closest to the industrial site, are the communities most directly exposed according to the gradient identified here; this is consistent with the Health Impact Assessment (HIA) conducted in 2015–2017 in these same municipalities, which documented associations between proximity to COVA (estimated via NOx dispersion modelling as an emission tracer) and elevated mortality and hospitalisation rates [23].
4.2.2. Chrysene
Among the six PAH compounds for which meaningful data were available, Chrysene was the only one to exhibit a statistically significant negative correlation with distance from COVA (r = −0.423, p = 0.006, n = 41), corroborating its potential association with the industrial source. Chrysene (C18H12) is a four-ring PAH that occurs as a consistent and relatively abundant constituent of crude oil; quantitative analyses of crude oils from multiple global reservoirs have confirmed chrysene among the most abundant PAHs in the petrogenic fraction, alongside naphthalene, phenanthrene, and fluorene [58]. At COVA, chrysene may enter the atmosphere through gas flaring—a routine operational practice at oil processing facilities—through evaporative losses from open storage or handling systems, and through the atmospheric oxidation of volatile precursor compounds [59].
The dominance of Chrysene among the PAHs showing a significant gradient is chemically informative. Chrysene’s role as a petrogenic rather than exclusively pyrogenic marker is recognised in the literature: the benzo(a)anthracene/chrysene (BaA/C) diagnostic ratio, with values below 0.2 indicative of crude oil contamination, has been applied in multiple environmental forensics studies to distinguish petrogenic from pyrogenic PAH sources [60]. Furthermore, a good linear correlation between chrysene concentration and total EPA-priority PAH burden in sediments has been proposed as a broader indicator of petrogenic PAH pollution [61]. The significant negative correlation of chrysene with distance from COVA is therefore not only statistically robust but mechanistically coherent with a petroleum-derived source.
In terms of toxicological significance, chrysene is classified as a Group 2B possible human carcinogen by the International Agency for Research on Cancer [7]. While its intrinsic carcinogenic potency is estimated at approximately 1% of that of benzo(a)pyrene, chrysene is rarely encountered in isolation; in the environmental matrix, it co-occurs with a complex mixture of PAHs, and mixture effects may substantially increase the overall genotoxic burden [8]. Atmospheric oxidation of chrysene produces oxygenated (OPAHs) and nitrated (NPAHs) derivatives, including nitro-chrysene and hydroxychrysene, which carry their own acute toxicity and mutagenicity [62]. Furthermore, chrysene and its derivatives are persistent in both the atmosphere and soil: their high molecular weight confers low volatility and resistance to microbial degradation, meaning that the spatial deposition gradient documented here may translate into a long-term soil contamination gradient extending outward from the industrial site.
4.3. Geogenic and Agricultural Sources: Elements Increasing with Distance from COVA
4.3.1. Aluminium, Iron, and Titanium: Crustal Signature of a Rural-Agricultural Matrix
In apparent contrast with the COVA-dominated gradient of Mn and Chrysene, three elements—Aluminium (r = +0.464, p = 0.010), Iron (r = +0.395, p = 0.031), and Titanium (r = +0.368, p = 0.046)—showed statistically significant positive correlations with distance from COVA, implying higher concentrations in lichens in the rural periphery of the valley. These three elements are among the most abundant constituents of the Earth’s continental crust (Al: ~8.1%, Fe: ~5.0%, Ti: ~0.6% by weight), and their presence in lichens reflects predominantly geogenic inputs via wind-resuspended mineral dust, soil particles, and crustal aerosols [14]. Multiple lichen biomonitoring studies have consistently assigned Al, Fe, and Ti to a crustal-geogenic source factor, characterised by low atmospheric enrichment factors (EF < 5 relative to upper continental crust), which distinguishes them from anthropogenically enriched elements such as Cd, Pb, and Zn (EF > 10–100) [63,64]. A study found that Fe concentrations in lichens correlated strongly (r ≥ 0.8) with both Al and Ti across all sampled species, confirming their common crustal source [65].
In the Val d’Agri context, this pattern implies that the rural-agricultural landscape surrounding COVA—characterised by ploughed fields, bare soils in dry seasons, unpaved rural roads, and the open terrain of the Appennino Lucano foothills—generates substantially more soil-derived mineral dust than the immediate industrial perimeter of the facility, which features sealed surfaces, compacted ground, and reduced open-soil exposure. The positive distance gradient of Al, Fe, and Ti therefore reflects a rural-industrial land-use contrast rather than any industrial emission from the facility itself.
4.3.2. Vanadium: A Mixed Geogenic-Anthropogenic Signal
Vanadium (r = +0.434, p = 0.017) follows the same positive distance trend as the crustal elements, a finding that at first appears paradoxical given that V is a well-documented component of crude oil and a recognised tracer of petroleum combustion in atmospheric research. Fuel oils may contain vanadium at concentrations of 1–1400 ppm depending on origin, and the combustion of residual petroleum in industrial boilers and oil-fired power plants is the dominant anthropogenic V emission pathway globally [66]. The positive gradient observed here suggests that, in the specific context of Val d’Agri, the background geogenic signal—V being co-distributed with Fe and Ti in soil-forming minerals and mafic lithologies common in the Southern Apennines—prevails over any direct COVA-sourced contribution to lichen V accumulation. This interpretation is consistent with the strong co-correlation between Fe, Ti, and V concentrations reported in multi-site lichen surveys [65], and with Sicilian lichen biomonitoring studies that classified Ti, Fe, and a portion of V within a geogenic crustal factor [64]. It is plausible that in the Val d’Agri, COVA’s contribution to atmospheric V loading is not quantitatively sufficient to override the stronger geogenic signal from the extensive agricultural soils and lithologies of the surrounding landscape, particularly given the complex terrain and variable wind regimes of the valley that may limit the spatial footprint of any directional COVA emission plume.
4.3.3. Selenium: Agricultural and Biogeochemical Sources
Selenium (r = +0.565, p = 0.001) exhibits the second-strongest significant correlation in the dataset and the strongest positive signal overall, with concentrations rising markedly with distance from COVA. Unlike the crustal metals, Se does not derive primarily from lithogenic mineral dust but is mobilised through a combination of agricultural activities and biogeochemical cycling. Se enters soils as a trace constituent of phosphate fertilisers, which are widely applied in the agricultural areas of the Val d’Agri; phosphate rock used in fertiliser production contains between 1 and 178 ppm Se, which is partially transferred to soil and subsequently volatilised or resuspended as fine aerosol [67,68]. The Se biogeochemical cycle also involves biogenic emission of volatile Se compounds—predominantly dimethylselenide—from soil microorganisms and plant roots, which enter the atmosphere and are redeposited via wet and dry deposition onto lichen surfaces [69]. In Mediterranean contexts, atmospheric enrichment coefficients for Se in fine particulate matter have been reported to be 25–480 times the continental crustal average, indicating substantial enrichment above geogenic background levels [70] (as cited in [71]).
The positive distance gradient observed in this study is consistent with a greater exposure of distal lichen sampling sites to agriculturally mobilised Se aerosol from the cropland matrix of the wider Val d’Agri catchment, while the area immediately surrounding COVA may experience a degree of Se bioavailability suppression due to the acidic-oxidising microclimate near the facility or to simple competition between the dominant industrial particulate loading and the weaker agricultural aerosol signal.
4.4. Non-Significant Correlations and the Multisource Nature of Val d’Agri Contamination
The majority of measured elements—21 of 34—did not exhibit statistically significant correlations with distance from COVA. This finding could reflect the complexity of elemental source attribution in a landscape where multiple, spatially overlapping emission sources operate simultaneously. Elements such as Nickel, Chromium, and Lead are influenced by dispersed traffic and combustion sources throughout the valley and are not exclusively associated with the industrial facility. Similarly, several PAH compounds may be influenced by agricultural burning practices (stubble burning and biomass combustion are common in rural Basilicata), which would disperse PAH input diffusely rather than concentrating it near COVA.
The absence of a distance signal for many elements also reflects inherent limitations of Pearson correlation analysis in this environmental setting. The relationship between atmospheric deposition and lichen elemental concentration is modulated by lichen physiology, morphology, exposure duration, rainfall patterns, and prevailing wind direction [13,25]. A purely distance-based approach cannot account for directional deposition patterns (the dominant wind direction in the Val d’Agri is channelled SW-NE by the valley topography), seasonal variability in emission rates, or differential physiological suppression of lichen uptake in compromised thalli. Future studies that include additional ecological, geological, and epidemiological variables would permit a more quantitative source apportionment and a more robust delineation of the spatial extent of the COVA pollution footprint.
4.5. Environmental and Public Health Implications
Taken collectively, the results of this study document two spatially distinct pollution domains in the Val d’Agri with different but complementary implications for ecosystem and human health. In the industrial near-field of COVA, the evidence points to elevated atmospheric loading of Mn and chrysene, both with a clear proximity-dependent fingerprint. The negative gradient of Mn is of particular concern given its neurotoxic potential via inhalation, well-established in environmental epidemiology [57,66], and is consistent with the elevated health risks reported by the Val d’Agri HIA [23]. The chrysene gradient reinforces concern about PAH exposure in proximity to the facility, particularly given the potential for mixture effects with other organic pollutants—VOCs, BTEX compounds, and alkylated PAHs—whose ambient concentrations in the valley have been documented by both satellite-based and ground-level monitoring [22,23].
I acknowledge that the attribution of manganese and chrysene to COVA as point-source tracers rests on a univariate distance-correlation approach, and that it was not supported by enrichment factor calculations, multivariate source apportionment, or wind-direction correction. Other sources, including traffic, biomass burning, crustal dust, and agricultural activity, may overlap across the valley and cannot be fully excluded [72,73]. Site-specific meteorological and wind data were not available for the study area, which further limited the resolution of source attribution. Even so, given the difficulty of collecting biomonitoring data in this region, this study provides a novel, if preliminary, baseline: the datasets, species lists, and methodological framework presented here can support future studies incorporating higher-resolution data and additional variables.
In the distal rural zone, the dominant environmental signal shifts to geogenic and agricultural sources (Al, Fe, Ti, V, Se). While these elements do not carry the acute industrial toxicological profile of Mn or chrysene, they are not without consequences. The positive Se gradient, in particular, is noteworthy in the context of dietary exposure: Se-enriched agricultural soils can translate into elevated Se in locally produced crops and animal products, with dose–response effects ranging from beneficial (antioxidant properties at nutritional doses) to toxic (selenosis at elevated chronic doses). Furthermore, potential Se-V toxicological interactions in biological systems—both antagonistic and synergistic depending on concentration and speciation—warrant consideration given the co-occurrence of both positive gradients in the distal Val d’Agri landscape [74].
A critical integrative observation is that the Val d’Agri presents a situation in which industrial and rural pollution are not spatially additive but are partly antagonistic: COVA’s industrial plume may suppress or mask the geogenic and agricultural elemental signal in the near-field, while in the far-field the industrial signal attenuates and background environmental chemistry reasserts itself. This spatial structure, if confirmed by formal source apportionment analyses, would have direct implications for environmental and sustainability monitoring design: a network focused exclusively on the industrial perimeter would underestimate rural-derived Se, Al, and dust metal exposure, while a network deployed only in the rural background would miss the Mn and chrysene impacts concentrated near COVA. Environmental conditions in which the lichens occur and the links between habitat characteristics, environmental stress, biological response, and other ecological pressures may affect lichen communities and contaminant accumulation similar to other species, such as fish, exposure [75]. Unfortunately, not much data on how habitat quality, vegetation structure, and local environmental conditions are available for the region, except for an initial study we conducted in the area [30]. Future research should try to fill this gap to have a broader understanding of the associations with pollution.
Finally, the multi-pollutant nature of the contamination landscape of the Val d’Agri calls for regulatory and monitoring frameworks that move beyond single-substance assessments to increase ecological sustainability of the area. Current Italian and EU regulatory provisions for air quality (D.Lgs. 155/2010, transposing Directive 2008/50/EC) establish limit values for Mn in PM10 and for PAHs as benzo(a)pyrene, but do not address cumulative risk from co-exposures to the complex mixture of pollutants generated by onshore oil extraction and processing. Lichen biomonitoring, as demonstrated by this and the prior Agri Valley campaign [25], provides an integrative, cost-effective, and ecologically meaningful complement to standard instrumental monitoring and should be considered a component of the systematic environmental surveillance required under Italian and European impact assessment legislation for facilities of COVA’s scale and environmental sensitivity.
Supplementary Materials
The following supporting information can be downloaded at: https://www.mdpi.com/article/10.3390/su182110867/s1. Figure S1: Distribution of species belonging to the Red List of Italian epiphytic lichens [32] within the survey points; Figure S2: Representation of LBI classes for non-nitrophilic species only at the sampling sites; Figure S3: Representation of LBI classes for nitrophilic species only at the sampling sites; Figure S4: Distribution of species belonging to the Red List of Italian epiphytic lichens [32] within the sampling points; Table S1: Reference values for global LBI; Table S2: List of nitrophilic taxa (eutrophication index = 4 or 5), with indication of the number of sites of discovery; Table S3: List of the lichen species collected and their frequencies.
Funding
This work was partially funded (for the LBI analysis) by ISPRA, the Italian National Institute for Environmental Protection, with a Research Agreement with UNIBO on Ecosystems Monitoring through innovative indicators.
Institutional Review Board Statement
Not applicable.
Informed Consent Statement
Not applicable.
Data Availability Statement
The original contributions presented in this study are included in the article/supplementary material. Further inquiries can be directed to the corresponding author(s).
Acknowledgments
We thank Piero Masiello and the Centro di analisi chimiche srl (Pisticci MT) for the support in heavy metals and hydrocarbons analyses.
Conflicts of Interest
The authors declare no conflict of interest.
References
- Johnston, J.E.; Lim, E.; Roh, H. Impact of upstream oil extraction and environmental public health: A review of the evidence. Sci. Total Environ. 2019, 657, 187–199. [Google Scholar] [CrossRef] [Scilit] [PubMed]
- Gilman, J.B.; Lerner, B.M.; Kuster, W.C.; de Gouw, J.A. Source signature of volatile organic compounds from oil and natural gas operations in northeastern Colorado. Environ. Sci. Technol. 2013, 47, 1297–1305, Correction in Environ. Sci. Technol. 2013, 47, 10094. [Google Scholar] [CrossRef] [Scilit] [PubMed]
- Maguire-Boyle, S.J.; Barron, A.R. Organic compounds in produced waters from shale gas wells. Environ. Sci. Process. Impacts 2014, 16, 2237–2248. [Google Scholar] [CrossRef] [Scilit] [PubMed]
- Abam, F.I.; Unachukwu, G.O. Vehicular emissions and air quality standards in Nigeria. Eur. J. Sci. Res. 2009, 34, 550–560. [Google Scholar]
- Lusweti, E.; Kanda, E.K.; Obando, J.; Makokha, M. Effects of oil exploration on surface water quality—A review. Water Pract. Technol. 2022, 17, 2171–2185. [Google Scholar] [CrossRef] [Scilit]
- Ali, H.; Khan, E.; Ilahi, I. Environmental chemistry and ecotoxicology of hazardous heavy metals: Environmental persistence, toxicity, and bioaccumulation. J. Chem. 2019, 2019, 6730305. [Google Scholar] [CrossRef] [Scilit]
- International Agency for Research on Cancer (IARC). Some Non-Heterocyclic Polycyclic Aromatic Hydrocarbons and Some Related Exposures; IARC Monographs on the Evaluation of Carcinogenic Risks to Humans; IARC: Lyon, France, 2010; Volume 92. [Google Scholar]
- Agency for Toxic Substances and Disease Registry (ATSDR). Toxicological Profile for Polycyclic Aromatic Hydrocarbons; ATSDR: Atlanta, GA, USA, 1995. [Google Scholar]
- Goldstein, B.D.; Brooks, B.W.; Cohen, S.D.; Gates, A.E.; Honeycutt, M.E.; Morris, J.B.; Orme-Zavaleta, J.; Penning, T.M.; Snawder, J. The role of toxicological science in meeting the challenge of hydraulic fracturing. Toxicol. Sci. 2014, 139, 271–283. [Google Scholar] [CrossRef] [Scilit] [PubMed]
- O’Rourke, D.; Connolly, S. Just oil? The distribution of environmental and social impacts of oil production and consumption. Annu. Rev. Environ. Resour. 2003, 28, 587–617. [Google Scholar] [CrossRef] [Scilit]
- Hawksworth, D.L.; Grube, M. Lichens redefined as complex ecosystems. New Phytol. 2020, 227, 1281–1283. [Google Scholar] [CrossRef] [Scilit] [PubMed]
- Grimm, M.; Grube, M.; Schiefelbein, U.; Zuhlke, D.; Riedel, K. The lichens’ microbiota, still a mystery? Front. Microbiol. 2021, 12, 623986. [Google Scholar] [CrossRef] [Scilit] [PubMed]
- Garty, J. Biomonitoring atmospheric heavy metals with lichens: Theory and application. Crit. Rev. Plant Sci. 2001, 20, 309–371. [Google Scholar] [CrossRef] [Scilit]
- Nimis, P.L.; Castello, M.; Perotti, M. Lichens as bioindicators of heavy metal pollution. In Plants as Biomonitors; Markert, B., Ed.; VHC Publishers: New York, NY, USA, 1993. [Google Scholar]
- Hawksworth, D.L.; Rose, F. Qualitative scale for estimating sulphur dioxide air pollution in England and Wales using epiphytic lichens. Nature 1970, 227, 145–148. [Google Scholar] [CrossRef] [Scilit] [PubMed]
- Conti, M.E.; Cecchetti, G. Biological monitoring: Lichens as bioindicators of air pollution assessment—A review. Environ. Pollut. 2001, 114, 471–492. [Google Scholar] [CrossRef] [Scilit] [PubMed]
- Nimis, P.L.; Scheidegger, C.; Wolseley, P.A. (Eds.) Monitoring with Lichens—Monitoring Lichens; Kluwer Academic Publishers: Dordrecht, The Netherlands, 2002. [Google Scholar]
- EN 16413:2014; Ambient Air—Biomonitoring with Lichens—Assessing Epiphytic Lichen Diversity. European Committee for Standardization (CEN): Brussels, Belgium, 2014.
- Branquinho, C.; Brown, D.H.; Maguas, C.; Catarino, F. Lead (Pb) uptake and its effects on membrane integrity and chlorophyll fluorescence in different lichen species. Environ. Exp. Bot. 1997, 37, 95–105. [Google Scholar] [CrossRef] [Scilit]
- Augusto, S.; Máguas, C.; Matos, J.; Pereira, M.J.; Branquinho, C. Lichens as an integrating tool for monitoring PAH atmospheric deposition: A comparison with soil, air and pine needles. Environ. Pollut. 2009, 157, 483–489. [Google Scholar] [CrossRef] [Scilit] [PubMed]
- Loperte, S.; Cosmi, C. The environmental balance of the Alta Val d’Agri: A contribution to the evaluation of the industrial risk and strategic sustainable development. Nat. Hazards Earth Syst. Sci. 2015, 15, 1941–1955. [Google Scholar] [CrossRef] [Scilit]
- Faruolo, M.; Coviello, I.; Filizzola, C.; Lacava, T.; Pergola, N.; Tramutoli, V. A satellite-based analysis of the Val d’Agri oil center gas flaring emissions. Nat. Hazards Earth Syst. Sci. 2014, 14, 2783–2793. [Google Scholar] [CrossRef] [Scilit]
- Martuzzi, M.; Mitis, F.; Biggeri, A. Studies in val d’Agri (Basilicata Region, Southern Italy) improve knowledge and participation and require prevention interventions. Epidemiol. Prev. 2019, 43, 79–82. [Google Scholar] [CrossRef] [Scilit] [PubMed]
- Colella, A.; D’Orsogna, M.R. Hydrocarbon pollution in the Pertusillo freshwater reservoir, Val d’Agri, Basilicata. Fresenius Environ. Bull. 2014, 23, 3286–3295. [Google Scholar]
- Loperte, S.; Tarantino, E.; Scalercio, S.; Caserta, A. Biomonitoring of atmospheric pollution: A novel approach for the evaluation of natural and anthropogenic contribution to atmospheric aerosol particles. Environ. Sci. Pollut. Res. 2017, 24, 7677–7691. [Google Scholar] [CrossRef] [Scilit] [PubMed]
- Regione Basilicata—RSDI. Osservatorio Ambientale della Val d’Agri; Regione Basilicata: Potenza, Italy, 2015; Available online: https://rsdi.regione.basilicata.it (accessed on 20 July 2026).
- Moss, D.; Wyatt, B.K. The CORINE biotopes project: A database for conservation of nature and wildlife in the European community. Appl. Geogr. 1994, 14, 327–349. [Google Scholar] [CrossRef] [Scilit]
- ISPRA Istituto Superiore per la Protezione e la Ricerca Ambientale. Available online: https://www.isprambiente.gov.it (accessed on 15 July 2026).
- ANPA. I.B.L. Indice di Biodiversità Lichenica; Manuali e Linee Guida 2/2001; Agenzia Nazionale per la Protezione dell’Ambiente (ANPA): Roma, Italy, 2001. [Google Scholar]
- Cassola, F.M.; Iaria, J.; Martini, M.; Santi, F.; De Silvestri, M.; Lattarulo, D.; Rossin, J.; Carli, E.; Angelini, P.; Casella, L.; et al. Assessing the effects of anthropogenic pressures on biodiversity: A multi-taxonomic approach in Basilicata, Italy. Environ. Sci. Pollut. Res. 2025, 32, 4879–4893. [Google Scholar] [CrossRef] [Scilit] [PubMed]
- Nimis, P.L.; Martellos, S. ITALIC—The Information System on Italian Lichens, Version 7.0; Department of Biology, University of Trieste: Trieste, Italy, 2022; Available online: http://italic.units.it/ (accessed on 15 July 2026).
- Nascimbene, J.; Nimis, P.L.; Ravera, S. Evaluating the conservation status of epiphytic lichens of Italy: A red list. Plant Biosyst. 2013, 147, 898–904. [Google Scholar] [CrossRef] [Scilit]
- IUCN. IUCN Red List Categories and Criteria: Version 3.1; IUCN Species Survival Commission: Gland, Switzerland; Cambridge, UK, 2001. [Google Scholar]
- Loppi, S.; Pirintsos, S.A. Epiphytic lichens as sentinels for heavy metal pollution at forest ecosystems (central Italy). Environ. Pollut. 2003, 121, 327–332. [Google Scholar] [CrossRef] [Scilit] [PubMed]
- Bajpai, S.; Sahoo, P.K.; Das, L.M. Feasibility of blending karanja vegetable oil in petro-diesel and utilization in a direct injection diesel engine. Fuel 2009, 88, 705–711. [Google Scholar] [CrossRef] [Scilit]
- USEPA Tennessee NPL/NPL Caliber Cleanup Site Summaries. 2007. Available online: https://www.epa.gov/ (accessed on 15 July 2026).
- US Environmental Protection Agency (USEPA). Method 3550C: Ultrasonic Extraction; USEPA: Washington, DC, USA, 1996. [Google Scholar]
- US Environmental Protection Agency (USEPA). Method 3630C: Silica Gel Clean-Up; USEPA: Washington, DC, USA, 1996. [Google Scholar]
- US Environmental Protection Agency (USEPA). Method 8015D: Nonhalogenated Organics Using GC/FID; USEPA: Washington, DC, USA, 2003. [Google Scholar]
- Wang, Z.; Yang, C.; Parrott, J.L.; Frank, R.A.; Yang, Z.; Brown, C.E.; Hollebone, B.P.; Landriault, M.; Fieldhouse, B.; Liu, Y.; et al. Forensic source differentiation of petrogenic, pyrogenic, and biogenic hydrocarbons in Canadian oil sands environmental samples. J. Hazard. Mater. 2009, 271, 166–177. [Google Scholar]
- US Environmental Protection Agency (USEPA). Method 8270D: Semivolatile Organic Compounds by Gas Chromatography/Mass Spectrometry (GC/MS); USEPA: Washington, DC, USA, 1996. [Google Scholar]
- US Environmental Protection Agency (USEPA). Definition and Procedure for the Determination of the Method Detection Limit; Revision 1.11, 40 CFR Part 136, Appendix B; USEPA: Washington, DC, USA, 1992. [Google Scholar]
- Giordani, P. Licheni Epifiti come Biomonitors dell’Alterazione Ambientale. Influenza delle Variabili Ecologiche sulla Diversità Lichenica. Ph.D. Dissertation, Università di Trieste, Trieste, Italy, 2004. [Google Scholar]
- R Core Team. R: A Language and Environment for Statistical Computing; R Foundation for Statistical Computing: Vienna, Austria, 2024; Available online: https://www.R-project.org/ (accessed on 15 July 2026).
- Loppi, S. Lichens as sentinels for air pollution at remote alpine areas (Italy). Environ. Sci. Pollut. Res. 2014, 21, 2563–2571. [Google Scholar] [CrossRef] [Scilit] [PubMed]
- Spier, L.; Van Dobben, H.; Van Dort, K. Is bark pH more important than tree species in determining the composition of nitrophytic or acidophytic lichen floras? Environ. Pollut. 2010, 158, 3607–3611. [Google Scholar] [CrossRef] [Scilit] [PubMed]
- Nascimbene, J.; Benesperi, R.; Casazza, G.; Chiarucci, A.; Giordani, P. Range shifts of native and invasive trees exacerbate the impact of climate change on epiphyte distribution: The case of lung lichen and black locust in Italy. Sci. Total Environ. 2020, 735, 139537. [Google Scholar] [CrossRef] [Scilit] [PubMed]
- Giordani, P. Is the diversity of epiphytic lichens a reliable indicator of air pollution? A case study from Italy. Environ. Pollut. 2007, 146, 317–323. [Google Scholar] [CrossRef] [Scilit] [PubMed]
- CovaContro. Oltre soglia: Idrocarburi nell’aria a Montemurro e Metalli nelle Falde a Viggiano; Colpa del Sahara e dei Camini Secondo Arpab. 2016. Available online: https://covacontro.org/laria-di-viggiano-come-quella-di-una-metropoli-il-particolato-tossico-che-il-cnr-ha-studiato-del-quale-nessuno-parla/ (accessed on 15 July 2026).
- CovaContro. L’aria di Viggiano Come Quella di una Metropoli: Il Particolato Tossico che il CNR ha Studiato, del quale Nessuno parla. 2016. Available online: https://covacontro.org/oltre-soglia-idrocarburi-nellaria-a-montemurro-e-metalli-nelle-falde-a-viggiano-colpa-del-sahara-e-dei-camini-secondo-arpab/ (accessed on 15 July 2026).
- Source International. Indagine Ambientale sulla Qualità dell’Aria in Val d’Agri, 2021. Available online: https://www.source-international.org/reports/indagine-ambientale-sulla-qualita-dellaria-in-val-dagri.
- Maslać Mikulec, M.; Likić, S.; Antonić, O.; Tkalec, M. Any way the wind blows does really matter in lichen response to air pollution from an oil refinery. Toxics 2025, 13, 160. [Google Scholar] [CrossRef] [Scilit] [PubMed]
- Robbins, W.K. Analysis of petroleum for trace metals. Determination of trace quantities of manganese in petroleum and petroleum products by heated vaporization atomic absorption. Anal. Chem. 1974, 46, 2177–2182. [Google Scholar] [CrossRef] [Scilit]
- Loranger, S.; Zayed, J. Environmental contamination and human exposure to airborne total and respirable manganese in Montreal. J. Air Waste Manag. Assoc. 1997, 47, 983–989. [Google Scholar] [CrossRef] [Scilit] [PubMed]
- Nieboer, E.; Richardson, D.H.S.; Tomassini, F.D. Mineral uptake and release by lichens: An overview. Bryologist 1978, 81, 226–246. [Google Scholar] [CrossRef] [Scilit]
- Aschner, M.; Erikson, K.M.; Hernandez, E.H.; Tjalkens, R. Manganese and its role in Parkinson’s disease: From transport to neuropathology. NeuroMolecular Med. 2009, 11, 252–266. [Google Scholar] [CrossRef] [Scilit] [PubMed]
- Bowler, R.M.; Gysens, S.; Diamond, E.; Nakagawa, S.; Drezgic, M.; Roels, H. Environmental exposure to manganese in air: Associations with tremor and motor function. Sci. Total Environ. 2016, 541, 646–654. [Google Scholar] [CrossRef] [Scilit] [PubMed]
- Wang, Z.; Fingas, M.; Page, D.S. Development of oil hydrocarbon fingerprinting and identification techniques. Mar. Pollut. Bull. 2003, 47, 423–452. [Google Scholar] [CrossRef] [Scilit] [PubMed]
- Olaguer, E.P. Atmospheric Impacts of the Oil and Gas Industry; Academic Press: Cambridge, MA, USA, 2016. [Google Scholar]
- Tobiszewski, M.; Namiesnik, J. PAH diagnostic ratios for the identification of pollution emission sources. Environ. Pollut. 2012, 162, 110–119. [Google Scholar] [CrossRef] [Scilit] [PubMed]
- De Luca, G.; Furesi, A.; Micera, G.; Panzanelli, A. Nature, distribution and origin of polycyclic aromatic hydrocarbons (PAHs) in the sediments of Porto Torres Harbor (Northern Sardinia, Italy). Mar. Pollut. Bull. 2004, 48, 1071–1081. [Google Scholar] [CrossRef] [Scilit] [PubMed]
- Ding, Z.; Yi, Y.; Wang, W.; Zhang, Q. Atmospheric degradation of chrysene initiated by OH radical: A quantum chemical investigation. Chemosphere 2021, 263, 128267. [Google Scholar] [CrossRef] [Scilit] [PubMed]
- Wu, L.; Isley, C.F.; Handley, H.K.; Taylor, M.P. Atmospheric sources of anthropogenic and geogenic trace metals in Australian lichen and fungi. Anthropocene 2021, 33, 100279. [Google Scholar] [CrossRef] [Scilit]
- Scerbo, R.; Ristori, T.; Possenti, L.; Lampugnani, L.; Barale, R.; Baini, R. Lichen (Xanthoria parietina) biomonitoring of trace element contamination and air quality assessment in Pisa Province (Tuscany, Italy). Sci. Total Environ. 2002, 286, 27–40. [Google Scholar] [CrossRef] [Scilit] [PubMed]
- Naeth, M.A.; Wilkinson, S.R. Lichens as biomonitors of air quality around a diamond mine, Northwest Territories, Canada. J. Environ. Qual. 2008, 37, 1625–1684. [Google Scholar] [CrossRef] [Scilit] [PubMed]
- Agency for Toxic Substances and Disease Registry (ATSDR). Toxicological Profile for Manganese; ATSDR: Atlanta, GA, USA, 2012. [Google Scholar]
- Robbins, C.W.; Carter, D.L. Selenium concentration in phosphorus fertilizer materials and associated uptake by plants. Soil Sci. Soc. Am. J. 1970, 34, 506–509. [Google Scholar] [CrossRef] [Scilit][Green Version]
- NCBI. Distribution of Selenium in Nutrition. In Selenium in Nutrition; National Academies Press: Washington, DC, USA, 1983. [Google Scholar]
- Ross, H.B. An atmospheric selenium budget for the region 30 degrees N to 90 degrees N. Tellus B 1985, 37, 78–90. [Google Scholar] [CrossRef] [Scilit]
- Olmez, I.; Gullu, G.; Tuncel, G.; Balkas, T.I. Enrichment of selenium in fine particles of atmospheric aerosol. In Proceedings of the SETAC Europe Meeting; SETAC Europe: Brussels, Belgium, 2004. [Google Scholar]
- Chiou, K.Y.; Manuel, O.K. Tellurium and selenium in aerosols. Environ. Sci. Technol. 1986, 20, 987–991. [Google Scholar] [CrossRef] [Scilit] [PubMed]
- He, Q.; Zhang, L.; Cui, Y.; Cheng, M.; Guo, L.; Liu, M.; Chen, L. Particle dry deposition of polycyclic aromatic hydrocarbons and its risk assessment in a typical coal-polluted and basin city, northern China. Atmos. Pollut. Res. 2017, 8, 1081–1089. [Google Scholar] [CrossRef] [Scilit]
- Tian, X.; Ye, A.; He, Q.; Wang, Z.; Guo, L.; Chen, L.; Liu, M.; Wang, Y. A three-year investigation of metals in the atmospheric wet deposition of a basin region, north China: Pollution characteristics and source apportionment. Atmos. Pollut. Res. 2020, 11, 793–802. [Google Scholar] [CrossRef] [Scilit]
- Zwolak, I. Vanadium carcinogenic, immunotoxic and neurotoxic effects: A review of in vitro studies. Toxicol. Mech. Methods 2014, 24, 1–12. [Google Scholar] [CrossRef] [Scilit] [PubMed]
- Biedunkova, O.; Kuznietsov, P.; Korbutiak, V.; Petruk, A.; Gabrielyan, B.; Andreji, J.; Grokhovska, Y.; Konontsev, S. Dominant meristic traits of fish and their association with habitat water quality parameters: A case study. Fishes 2025, 10, 561. [Google Scholar] [CrossRef] [Scilit]

Disclaimer/Publisher’s Note: The statements, opinions and data contained in all publications are solely those of the individual author(s) and contributor(s) and not of MDPI and/or the editor(s). MDPI and/or the editor(s) disclaim responsibility for any injury to people or property resulting from any ideas, methods, instructions or products referred to in the content. |
© 2026 by the author. Licensee MDPI, Basel, Switzerland. This article is an open access article distributed under the terms and conditions of the Creative Commons Attribution (CC BY) license.