


Abstract
The increasing urgency of climate change amid a rapidly evolving digital transformation underscores the need for integrated fiscal and technological policy to mitigate environmental degradation. This study examines the association between taxes on goods and services (TGS) and ecological footprint (EFP), and evaluates the moderating role of digitalization. Using a newly compiled dataset for 96 countries over the period 2000–2022, the analysis employs a cross-sectionally augmented autoregressive distributed lag (CS-ARDL). The results reveal a significant negative long-run association between TGS and EFP, suggesting a potentially important link between TGS and ecological pressure. Digitalization is positively associated with EFP, while the interaction results indicate that greater digitalization is associated with a stronger negative relationship between TGS and EFP. However, heterogeneity analysis reveals that these relationships are more noticeable in higher-income economies, while they remain weaker in lower-income countries. Complementary estimations using Common Correlated Effects Mean Group (CCEMG) and Augmented Mean Group (AMG) estimators, along with an alternative measure of the key explanatory variable, yield consistent findings. Overall, the study highlights the potential importance of considering digitalization within fiscal policy frameworks aimed at supporting ecological sustainability.
1. Introduction
Environmental quality has become a critical global priority as countries deal with the dual challenges of climate change and resource depletion. In response, governments are employing various fiscal policies to mitigate these issues, with taxation standing out as a key policy tool [1,2,3]. As a fundamental component of fiscal policy, taxation influences both economic behavior and environmental outcomes by shaping production and consumption patterns [4,5]. Taxes can promote the adoption of cleaner technologies, disincentivize environmentally harmful activities, and finance public investments in sustainable infrastructure [6,7]. Moreover, taxation serves as a mechanism to internalize the external costs of pollution, making producers and consumers accountable for the real ecological impacts of their activities [8,9,10].
While substantial research has studied the environmental effects of carbon taxes, the role of Taxes on Goods and Services (TGS) on environmental quality remains underexplored. Goods and services taxes, encompassing sales taxes, production taxes, and value-added taxes (VAT), represent a significant source of government revenue and have wide-ranging implications for economic activities [11,12]. These taxes not only generate fiscal resources but also influence consumption and consequently affect ecological quality [13,14]. However, despite their macroeconomic relevance, the environmental consequences of TGS have received limited scholarly attention, particularly when considering broader ecological indicators such as the ecological footprint (EFP). Therefore, understanding the environmental implications of TGS is essential for policymakers aiming to balance fiscal objectives with sustainable development goals.
The environmental consequences of TGS vary across countries because their effectiveness depends on institutional, regulatory, and technological conditions [15,16]. On the one hand, higher taxes on goods and services may be associated with changes in the consumption of environmentally harmful products by changing relative prices. On the other hand, the environmental benefits of TGS depend on governments’ capacity to allocate tax revenues toward environmental protection and enforce effective environmental regulations. This concern is particularly relevant for low-income countries, where resource-intensive sectors dominate, and environmental institutions remain weak. Conversely, advanced economies with stronger regulatory systems and greater digital capacity may be better positioned to leverage TGS revenues to support ecological innovation and clean energy transitions. Despite these differences, cross-country evidence on how development levels shape the relationship between TGS and environmental sustainability remains limited, particularly when environmental performance is measured by EFP.
Moreover, digitalization plays a central role in shaping the effectiveness of taxation systems [17,18]. Digital technologies, ranging from e-government platforms and internet penetration to data analytics, enhance monitoring, improve compliance, and strengthen enforcement [19]. In this context, digitalization can amplify the environmental impact of TGS by reducing tax evasion, enabling more precise targeting of harmful consumption, and improving the efficiency of tax-supported environmental programs. Conversely, countries with weak digital infrastructure often experience inefficiencies in tax collection and revenue management [20,21], thereby limiting the ability of TGS to generate environmental improvements. These contrasting dynamics suggest that digitalization may moderate the link between TGS and EFP, a mechanism largely overlooked in prior literature.
This paper offers several significant contributions to the literature. First, it provides important empirical evidence on the association between TGS and EFP, addressing a critical gap in the environmental taxation literature. Second, the study incorporates digitalization as a moderating factor, measured using a comprehensive index, thereby providing valuable insights into how digital capacity influences the environmental effectiveness of taxation. Third, the study compares lower- and higher-income economies, revealing how income heterogeneity affects the TGS-EFP nexus. Finally, the study employs advanced second-generation panel techniques, including CS-ARDL, CCEMG, and AMG estimators, to assess the consistency of the findings in the presence of cross-sectional dependence and slope heterogeneity.
We organize this paper as follows: Section 2 reviews the literature on the relationship between TGS, digitalization, and environmental quality. Section 3 outlines the analytical methods and data. The empirical outcomes are presented in Section 4. Finally, Section 5 ends with remarks and policy recommendations.
2. Theoretical and Empirical Literature
2.1. Theoretical Nexus Between Taxation and Environmental Sustainability
The nexus between taxation and environmental quality can be understood through various economic and environmental theories. Many existing theories emphasize that taxation policies play a pivotal role in affecting environmental quality. For instance, the Pigouvian taxation introduced by Pigou [22] suggests that imposing taxes on activities that produce detrimental externalities (e.g., pollution) can internalize the external costs, thereby improving environmental quality [10,23]. A notable example is the carbon tax, which encourages producers and consumers to minimize their negative environmental impact. In addition, the Double Dividend Hypothesis, developed by Tullock [24], postulates that environmental taxes can yield twofold benefits: improving ecological quality and generating revenue for governments. These revenues can be utilized to fund climate-friendly projects, such as clean energy initiatives [25,26].
These theoretical arguments, however, mainly apply to environmentally motivated taxes. TGS is a broader fiscal category that includes VAT, sales taxes, and other taxes on goods and services, and is not specifically designed to address environmental problems. Its relationship with environmental outcomes may therefore operate through several indirect channels. For example, by affecting prices and household purchasing power, TGS may influence consumption patterns and demand for energy- and resource-intensive goods. It may also be associated with environmental outcomes through government revenue and spending, changes in economic activity, and improved tax compliance and enforcement. Therefore, unlike environmental taxes, the environmental implications of TGS are not straightforward and warrant empirical examination.
Moreover, the Environmental Kuznets Curve (EKC) hypothesis proposes a reversed U-shaped connection between environment and economy [27,28,29]. Initially, economic development increases environmental degradation, but after surpassing a certain income turning point, further development promotes ecological improvements. Thus, taxation can shift economies toward the downward-sloping side of the EKC by discouraging resource-intensive consumption. However, the EKC remains contested: while some studies confirm the inverted-U relationship [30,31], others suggest that the transition toward environmental quality depends on institutional quality, policy design, and technological innovation rather than occurring automatically with economic development [32,33].
Furthermore, Porter’s hypothesis [34] argues that stringent environmental regulations, including taxes, can spur innovation and competitiveness. In this context, changes in TGS may shape production decisions, consumption patterns, and resource use, although their environmental effects may vary across countries and contexts. Together, these theoretical perspectives help to explain the link between taxation and ecological sustainability, while the environmental implications of TGS need to be determined empirically.
2.2. Taxes and Ecological Footprint: An Empirical Perspective
The link between taxation and environmental sustainability has received substantial research attention. While earlier studies concentrated on CO2 emissions, recent work increasingly employs EFP as a broader indicator of environmental demand and resource use. EFP captures multiple dimensions of ecological pressure, including cropland use, forest demand, energy footprint, fisheries, and built-up land [35,36]. Unlike CO2 emissions, which primarily capture carbon-related environmental pressure, EFP reflects broader resource demand and ecological pressure across several dimensions.
Empirical evidence on environmental taxes and other fiscal policies generally suggests that their environmental effects depend on the specific tax instrument and policy context. For example, Nathaniel [37] demonstrated that environmental taxes reduce EFP in OECD countries by promoting green innovation. Similarly, Destek and Sinha [38] showed that fiscal measures influence EFP through energy efficiency, renewable energy deployment, and structural economic shifts.
While carbon taxes have attracted considerable attention, the environmental implications of broader tax categories, such as TGS, remain relatively understudied. TGS can influence consumer prices, disposable income, and consumption behavior [13,14]. However, the existing evidence on broader indirect taxation remains limited. For example, Ebaidalla [39] examined the environmental effects of indirect taxes using data from 143 countries over 1996–2019 and found that their effects differ across country groups. Specifically, higher indirect taxation is associated with lower CO2 emissions in developing countries, whereas it is associated with higher emissions in developed countries.
Building on this literature, the present study examines a more specific component of indirect taxation, taxes on goods and services, and considers its implications for EFP. Unlike Ebaidalla [39], which focuses on CO2 emissions as the environmental outcome and examines indirect taxes more broadly, this study uses EFP as a broader measure of environmental pressure and investigates whether digitalization moderates the relationship between TGS and EFP. Drawing on the preceding discussion, this study formulates the following hypothesis:
H1.
Taxes on goods and services are negatively associated with EFP.
2.3. Digitalization and Tax Effectiveness
Digitalization significantly affects tax effectiveness by influencing both tax administration and corporate tax behavior. Research shows that digitalization of tax systems can reduce tax stickiness, improve tax collection efficiency, and decrease tax evasion [40,41,42]. E-government initiatives and technology adoption strengthen these effects, especially in countries with higher levels of digital technology adoption, thereby increasing tax compliance and revenue [41,43].
At the corporate level, digitalization enhances oversight, transparency, and internal controls, reducing opportunities for tax evasion [18,44]. Hence, effective digital fiscal systems may enhance governments’ capacity to mobilize revenues, allocate public spending, and implement environmental policies, with potential implications for EFP [42].
Digitalization has increasingly been studied as a key determinant of tax effectiveness, with findings pointing to both opportunities and caveats. For example, Bellon, Dabla-Norris, Khalid, and Lima [45] analyze the staggered introduction of VAT e-invoicing in Peru and reveal that switching from paper to digital invoices raised reported purchases and sales by over 5% during the first year of implementation. The gains were most pronounced among smaller firms and industries with historically weak compliance, indicating that digital invoices improve compliance. Kitsios, Jalles, and Verdier [46] provides cross-country evidence that public-sector digitalization reduces tax evasion by strengthening fraud detection and improving transparency. Okunogbe and Santoro [47] argue that ICT diffusion enhances revenue mobilization by lowering transaction costs and improving information flows. However, the benefits remain uneven across income groups. Kochanova, Hasnain, and Larson [48] show that adopting e-filing systems lessens firms’ compliance costs, audit frequency, and perceptions of tax administration as a barrier. However, their study finds modest fiscal gains, with only a moderate rise in tax revenues, underscoring the limits of fragmented digital reforms. At the firm level, Chen, Zhao, and Jin [44] report that digitalization reduces opportunities for tax evasion by enhancing oversight and increasing the transparency of financial activities. Nevertheless, Xiao and Shao [49] caution that digital tax administration can impose operational and technological burdens on firms, leading some to cut investment in core technologies and reallocate resources toward compliance, thereby slowing their broader digital development. Overall, the evidence suggests that the effects of digitalization on tax compliance and revenue mobilization depend on institutional and economic conditions, with potentially larger gains where baseline tax administration and enforcement capacity are relatively weak [50,51]. Recent evidence shows that digitalization is associated with improved ecological quality, while digitalized tax administration can strengthen environmental sustainability and support firms’ green transformation [52,53]. Accordingly, digitalization may be associated with lower EFP and condition the relationship between TGS and ecological pressure. This discussion provides the basis for the following hypotheses:
H2.
Digitalization is negatively associated with EFP.
H3.
Digitalization strengthens the negative association between TGS and EFP.
2.4. Research Gap
Although existing studies examine the environmental effects of several tax instruments, including environmental and carbon taxes, relatively less attention has been paid to TGS and its relationship with EFP. Most prior studies focus on environmental taxes, leaving broader tax instruments, such as TGS, relatively unexplored, particularly in relation to multidimensional indicators such as EFP. This study addresses this gap by utilizing the novel tax dataset released by UNU-WIDER [54] to examine the relationship between TGS and EFP. More importantly, while previous research has largely examined taxation and digitalization as separate determinants of environmental outcomes, limited attention has been given to whether digitalization conditions the relationship between TGS and EFP. This gap is particularly relevant given substantial cross-country differences in digital and fiscal capacity. By incorporating digitalization as a moderating factor, this study provides new insights into whether digital capacity amplifies or constrains the association between TGS and EFP. Finally, existing studies have paid limited attention to whether this relationship varies across countries at different stages of development. Examining the relationship across income groups provides useful evidence on whether the TGS-EFP association varies across different levels of economic development.
3. Methodology
3.1. Model
Drawing on the existing studies on the factors influencing EFP, such as [8,55,56], we examine the association between TGS and EFP through the following model:
The model links EFP to TGS and four control variables: GDP, energy use (ENU), population size (POP), and foreign direct investment (FDI). We selected these controls based on their theoretical relevance, their use in the literature, and consistent data availability across the sample. These variables capture key dimensions of economic activity, energy demand, and demographic pressure that are relevant to ecological pressure [57,58]. We also acknowledge that other factors, including institutional quality, trade openness, renewable-energy use, and technological innovation, may influence ecological outcomes.
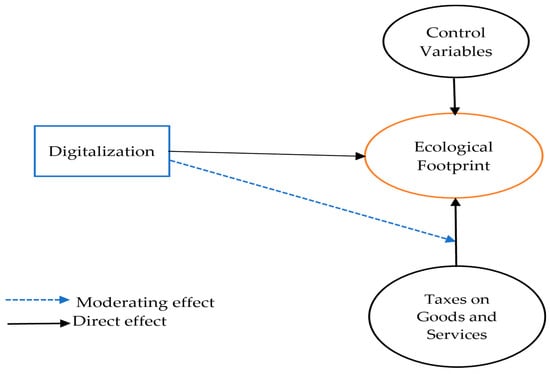
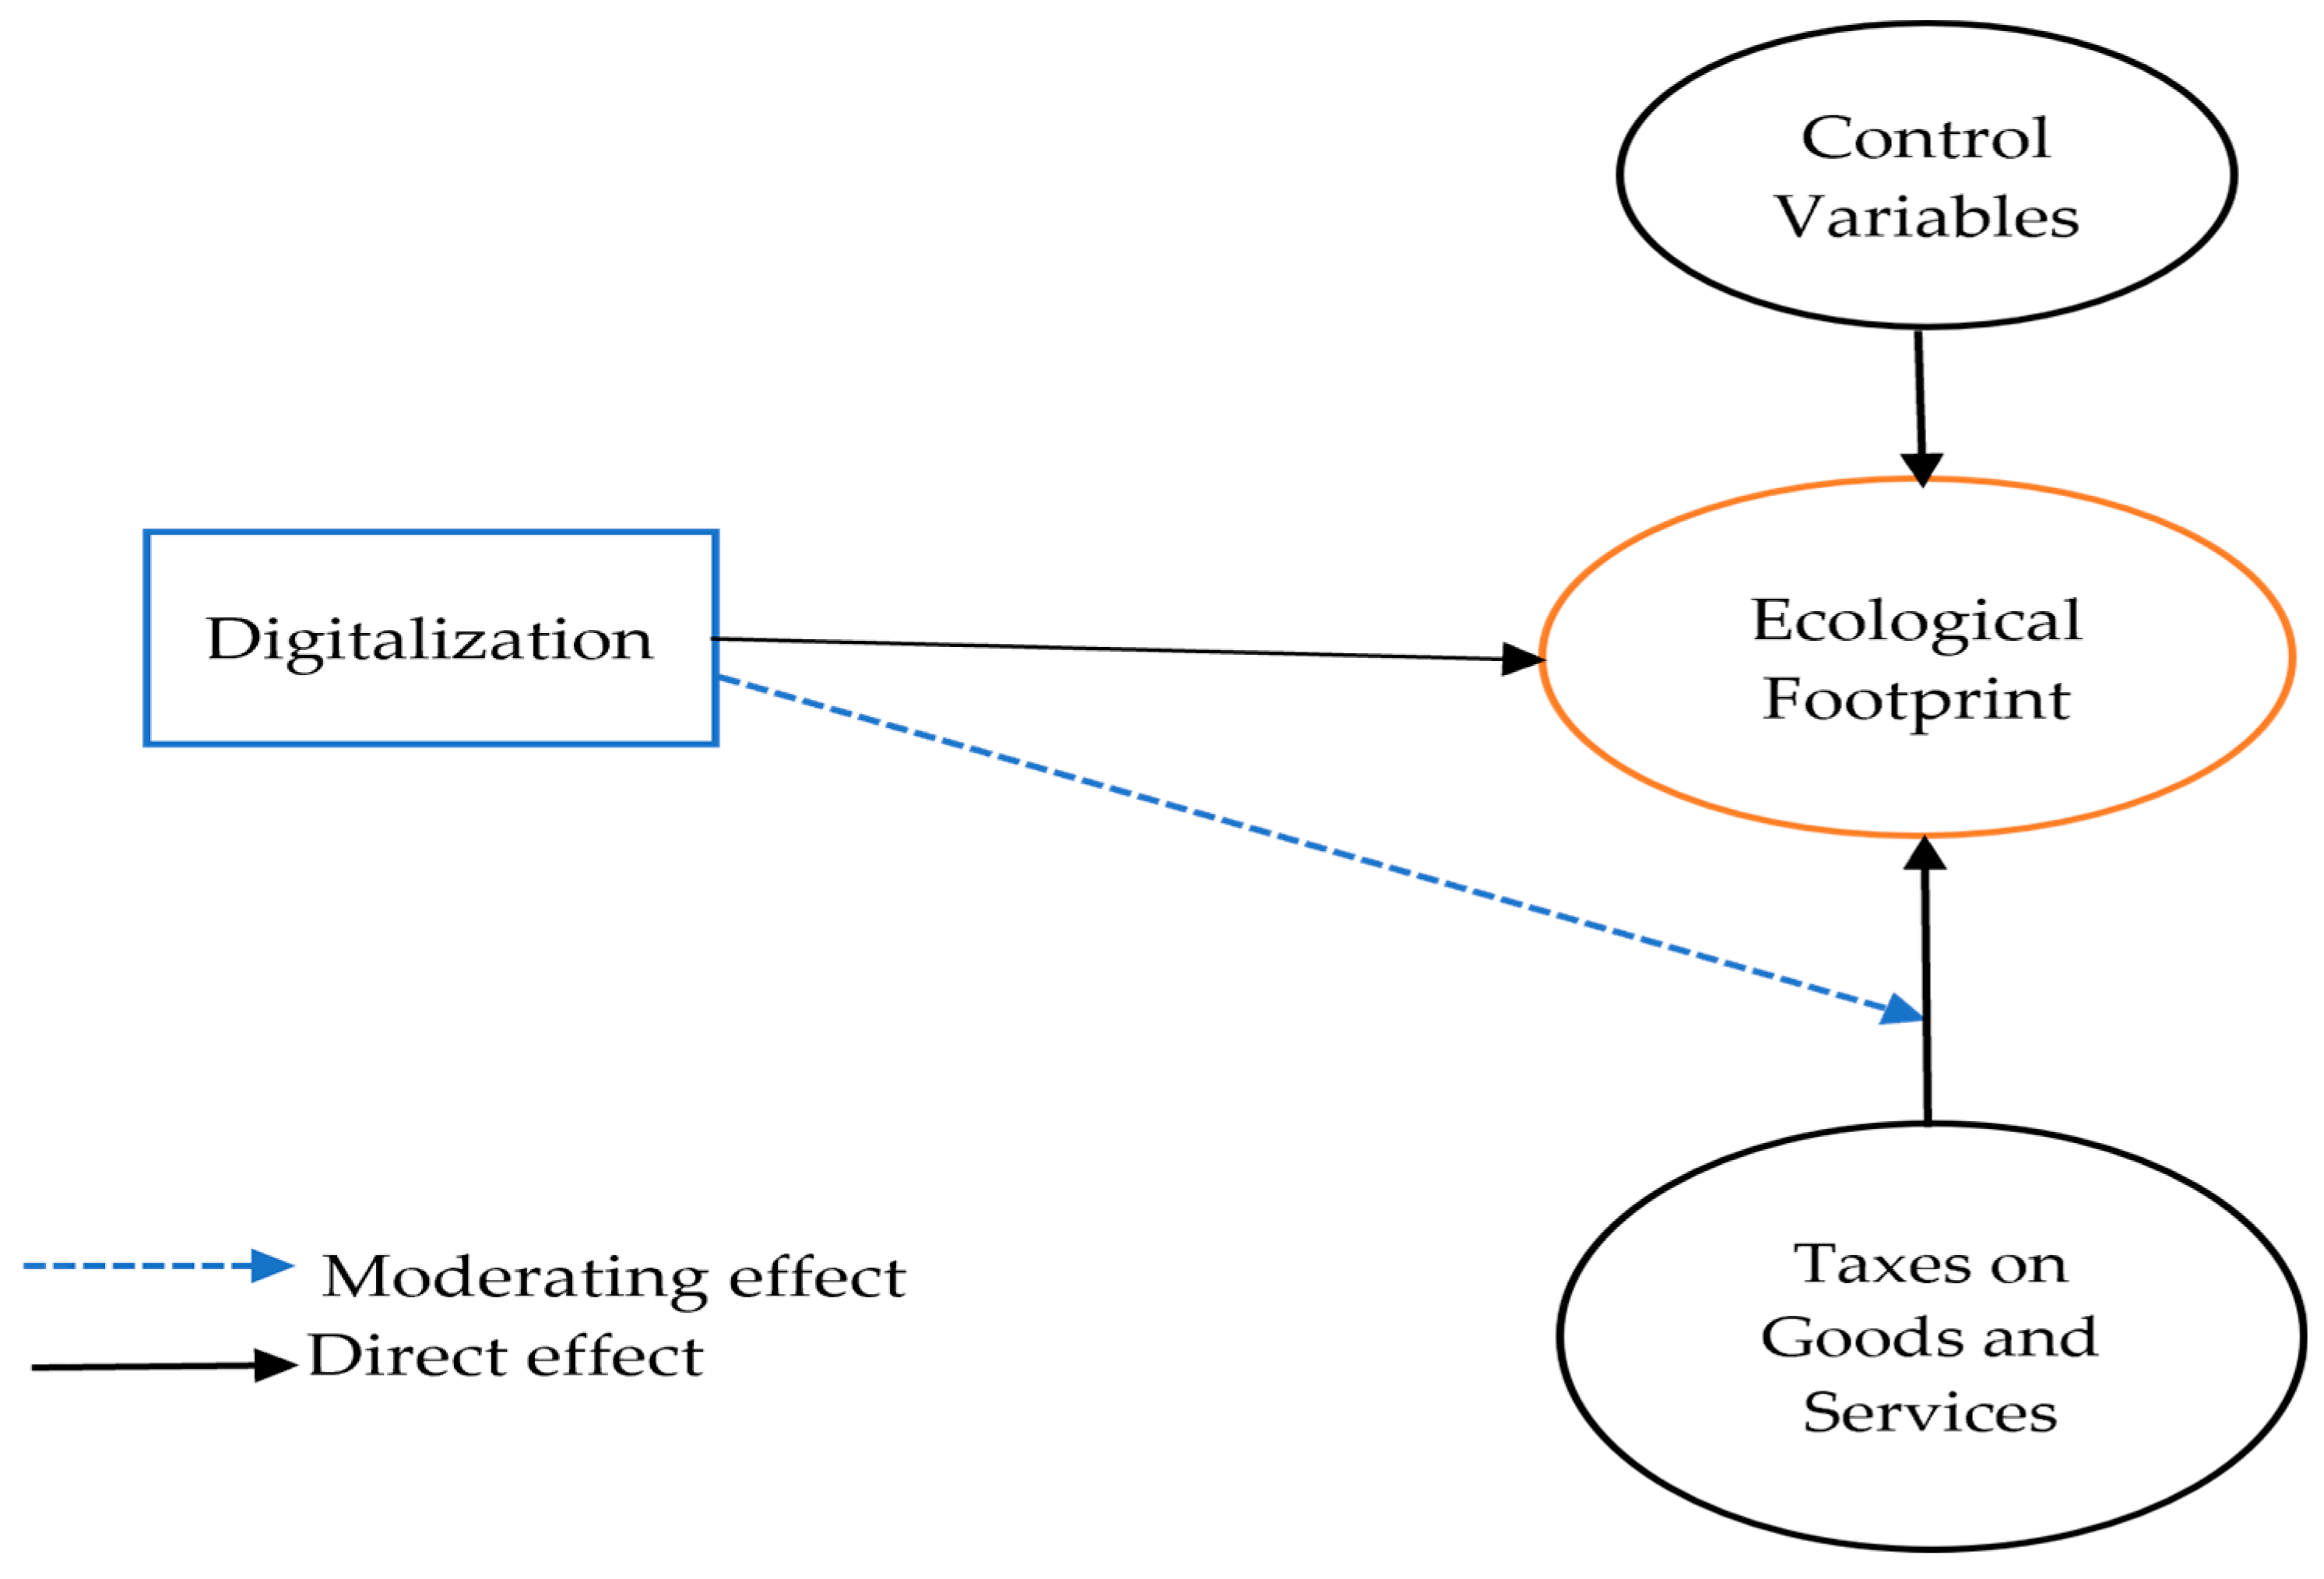
Consistent with the existing literature on ecological degradation, such as [59,60,61], the associations of GDP, ENU, and POP with EFP are expected to be positive. The association of FDI is ambiguous, as some studies, such as [62,63], indicate that FDI has a positive influence on emissions, while other studies find a negative relationship between FDI and the environmental outcomes [64,65]. TGS is the core independent variable, expected to be negatively associated with EFP, as stated in H1. Following the UNU-WIDER definition, TGS is measured as “tax revenue from goods and services, including sales taxes, value-added taxes, and excise duties, divided by the country’s GDP” [54]. Digitalization (Digit) is also hypothesized to be negatively associated with EFP, consistent with H2. Finally, is the error term. To improve interpretability and mitigate scale effects and heteroskedasticity, we use all continuous variables in logarithmic form. Figure 1 depicts the theoretical model.
Figure 1.
Theoretical framework.
To investigate whether digitalization shapes the relationship between TGS and EFP, we augment Equation (1) with the interaction term (DIGT*TGS). Therefore, the second-stage specification is:
Digitalization Measurement
In measuring digitalization, the literature employs various approaches. These include the construction of composite digital economy indices [66,67,68], the use of international measurements such as the World Bank’s Digital Adoption Index and the OECD’s Digital Economy Measurement Toolkit [69,70], as well as measuring digitalization based on the contribution of the digital economy to GDP [71]. Building on [67,72,73], we construct a multidimensional digitalization index using a two-stage Principal Component Analysis (PCA) approach. This multidimensional approach recognizes that digitalization encompasses technological, economic, and social dimensions rather than a single observable characteristic. In the first stage, we construct three pillar-specific indices. The digital infrastructure index comprises fixed telephone subscriptions, mobile cellular subscriptions, and fixed broadband subscriptions. The digital trade index comprises ICT goods exports and ICT goods imports as shares of total exports and imports, respectively. The social impact index comprises internet use and medium- and high-tech manufacturing value added, to capture the technological and productive dimensions of digital transformation [67,73]. The three-dimensional structure reflects data availability across countries and over time. Although some studies, such as [67], include additional dimensions, like the Online Services Index and E-Participation Index, these indicators are unavailable for many countries in our sample.
The indicators within each pillar are standardized and combined using PCA, with the first principal component retained based on the eigenvalue greater than one criterion. We use a two-stage PCA procedure: first, correlated indicators are summarized within conceptually related pillars; second, the resulting pillar-level indices are standardized and combined using PCA to construct the overall digitalization index (DIGT). This approach reduces the influence of any single indicator while preserving the multidimensional structure of digitalization. The first principal component of the final PCA has an eigenvalue of 1.971 and explains 65.70% of the total variance. The retained component has positive loadings for digital infrastructure (0.888), digital trade (0.510), and social impact (0.961), indicating that higher values of DIGT consistently represent greater digitalization. The variation in the magnitude of the loadings reflects the relative contribution of each pillar to the common component rather than indicating that the pillars measure identical aspects of digitalization.
Appendix A reports the complete PCA results, including the underlying indicators, component loadings, eigenvalues, and explained variance. Across all four PCA procedures, the retained first principal component has an eigenvalue greater than one, and all underlying indicators exhibit positive loadings on the retained component. The resulting DIGT index ranges from −2.842 to 4.159 in the sample.
3.2. Estimation Strategy
To estimate our models, we employ the Cross-Sectionally Augmented Autoregressive Distributed Lag (CS-ARDL) model pioneered by Chudik and Pesaran [74]. The CS-ARDL method is designed to estimate both short- and long-run associations in panel datasets while explicitly accounting for cross-sectional dependence (CSD), a mutual feature in macroeconomic and environmental data, where shocks in one country may spill over to others. By augmenting the standard ARDL specification with cross-sectional means of the outcome and explanatory variables, the approach accounts for unobserved common factors and helps reduce bias arising from cross-sectional correlation in errors. The inclusion of lagged variables also helps mitigate concerns related to dynamic endogeneity. Nevertheless, CS-ARDL does not fully eliminate potential endogeneity arising from reverse causality, omitted variables, or measurement error. Accordingly, the study interprets the estimates as associations rather than causal effects.
Potential endogeneity remains a consideration in interpreting the estimated associations. First, reverse causality cannot be completely ruled out, as environmental performance may itself influence taxation, institutional development, or digitalization. Second, omitted-variable bias may arise if unobserved country-specific factors affect both the explanatory variables and environmental performance. Third, measurement error may affect the estimated coefficients when the variables are imperfect proxies for the underlying concepts.
Unlike traditional panel estimators, CS-ARDL allows for heterogeneity in both intercepts and slope coefficients, enabling each country to exhibit its own dynamic adjustment path while still identifying a shared long-run association. The model is flexible with respect to the order of integration and can be applied when variables are I(0), I(1), or a combination of both, provided none are I(2). Owing to these advantages, CS-ARDL has become a widely used method in recent empirical work in environmental economics and is well-suited to our setting, where the dependent variable is EFP and unobserved global shocks (e.g., technology, policy, energy prices) may jointly affect countries. Consequently, the CS-ARDL model can be specified in the following form:
where is the outcome variable, is the vector of regressors (TGS, GDP, ENU, POP, FDI, and DIGT). CS presents the cross-sectional mean, and p, q, and r denote the lag lengths of the outcome variable, regressors, and cross-sectional averages, respectively.
For the baseline specification (Equation (1)), the initial sample comprises 2208 observations, with no missing values in the variables included in the estimation. The final CS-ARDL estimation uses 2012 observations, with the reduction attributable to the lag requirements of the model rather than missing-data deletion. A maximum lag order of 2 was considered. We selected the preferred specification, CS-ARDL(1,0,0,2,0,0,1), using the Akaike Information Criterion (AIC) and Bayesian Information Criterion (BIC), which identified the same specification (Appendix B). The model includes seven contemporaneous cross-sectional averages corresponding to the variables under study, with no lags of the cross-sectional averages specified.
For the interaction specification, the final estimation comprises 1985 observations after accounting for the lag requirements. A maximum lag of 1 was considered, and the preferred specification, CS-ARDL(1,0,0,1,0,0,1,0), was selected using the AIC and BIC. The interaction specification includes eight cross-sectional averages corresponding to the variables included in the model, with no lags of the cross-sectional averages specified.
For both specifications, the model includes an intercept but no deterministic time trend. Estimation was conducted using Stata version 19.1, with robust standard errors reported. We also considered alternative lag structures during lag selection, and report their corresponding AIC and BIC values in Appendix B. For the LLMEs and UMHEs subsample analyses, a maximum lag order of one was adopted because of the smaller sample sizes.
To assess the consistency of the CS-ARDL analysis, the study applies two complementary estimators: “the Common Correlated Effects Mean Group (CCEMG)” developed by Pesaran [75] and “the Augmented Mean Group (AMG)” estimator introduced by Eberhardt and Bond [76]. Both approaches address key econometric challenges, including unobserved common shocks and heterogeneity in slope coefficients across countries. The CCEMG method addresses CSD by incorporating cross-sectional means of the outcome variable and regressors. In contrast, the AMG estimator adds a common dynamic component into the panel model, allowing it to reflect shared time-varying influences across countries. However, these estimators do not by themselves resolve potential endogeneity. As an additional sensitivity analysis, we use an alternative measure of the key independent variable, expressed as a share of total government revenue rather than as a ratio to GDP.
3.2.1. Cross-Sectional Dependence Test
Prior to estimating the models, we assess whether CSD is present in the panel. Addressing this issue is a prerequisite for selecting appropriate unit-root and cointegration tests as well as for choosing second-generation estimators [77,78]. Specifically, we implement three complementary tests: (i) Pesaran’s CD test, (ii) Pesaran’s scaled LM test, and (iii) the Breusch–Pagan LM test. All three evaluate the null hypothesis of CSD; rejection of the null indicates the presence of common shocks or spillovers across countries, warranting second-generation procedures in subsequent analysis.
3.2.2. Unit Root and Cointegration Test
After assessing CSD, we inspect the stationarity properties of the panel series. The choice of unit-root tests is contingent on the CSD outcome. If CSD is present, we employ second-generation unit-root tests, precisely the “Cross-Sectionally Augmented IPS” (CIPS) and “Cross-Sectionally Augmented Dickey–Fuller” (CADF) tests. For panel cointegration, we adopt the Westerlund [79] test, which accommodates CSD and heterogeneous dynamics across countries.
3.3. Data
The data span 2000–2022 and include 96 countries (listed in Appendix C). The cross-country sample is determined by the availability of complete data for all variables required for the analysis over the study period. Consistent with the World Bank’s [80] income classification, the countries are classified into two broad income categories: low- and lower-middle-income economies (LLMEs) and upper-middle- and high-income economies (UMHEs). The LLMEs group comprises 31 countries, while the UMHEs group comprises 65 countries. EFP data is sourced from the Global Footprint Network (GFN), macroeconomic data from the World Bank (WDI), and taxation data from UNU-WIDER [54]. Variable definitions and summary statistics appear in Table 1.
Table 1.
Measures and Descriptive Statistics.
The descriptive statistics in Table 1 show that EFP exhibits a relatively high mean and noticeable variation over time. GDP exhibits high variation, reflecting fluctuations in economic performance over the sample period. ENU, TGS, and POP display moderate variability, suggesting gradual shifts in energy consumption patterns. In contrast, FDI exhibits volatility and uneven distribution, pointing to periods of sharp increases and declines in capital inflows. DIGT shows moderate variation with a relatively balanced distribution.
Table 2 reports the correlation matrix and multicollinearity diagnostics. The pairwise correlations provide descriptive evidence of unconditional associations among the variables, while the VIF results indicate no problematic linear multicollinearity.
Table 2.
Examination of Pairwise Correlations and Variance Inflation Indicators.
4. Results and Discussion
4.1. CSD, Stationarity, and Cointegration Test
We commence our analysis by investigating the CSD to select appropriate stationarity and cointegration tests. The statistics in Table 3 indicate the occurrence of CSD across all series.
Table 3.
Test of Cross-sectional Dependence.
Given the existence of CSD, we inspect the stationarity of the series using second-generation tests, precisely the CIPS and CADF. Table 4 indicates that all series are integrated of order one, I(1), with no evidence of I(2) variables. This integration structure is compatible with the CS-ARDL framework, which allows variables to be I(0) and/or I(1), provided that none is I(2).
Table 4.
Unit Root Test.
Furthermore, to examine the long-run relationships among the variables, we applied the Westerlund [79] cointegration test, which addresses the issue of CSD. The null hypothesis of the test is that there is no cointegration among the variables. The findings displayed in Table 5 provide mixed evidence of cointegration. Specifically, Gt and Pt are statistically significant at the 10% and 5% levels, rejecting the null of no cointegration, while Ga and Pa are not significant. Therefore, the results provide partial, rather than uniform, evidence of a long-run relationship among the variables. Given this mixed evidence of cointegration, along with cross-sectional dependence, the CS-ARDL method is appropriate, with the error-correction terms providing additional information on adjustment toward the estimated long-run relationship.
Table 5.
Westerlund Test.
4.2. Full Sample Analysis
The CS-ARDL results of the full sample for both Equations (1) and (2) are shown in Table 6. Starting with the long-run outcomes of the direct effect (i.e., Model 1), most parameters are statistically significant. Specifically, GDP is positively associated with EFP, indicating that higher income levels are associated with greater ecological pressure. This result supports prior research, such as [60,63]. Additionally, energy use is positively related to EFP, consistent with the notion that higher energy usage increases EFP. The findings also reveal that population (POP) is positively associated with EFP, consistent with previous studies, such as [81]. The long-run effect of FDI is positive, supporting the studies of [62,63]. Moreover, the findings indicate that higher digitalization is associated with a lower EFP in the long run, supporting H2. This implies that more digitalized countries are less likely to experience ecological pressure. This result is also consistent with prior research, including [82,83,84], which report a negative association between digitalization and pollutant emissions. Across the two specifications, the error-correction terms (−0.161 and −0.197) are negative and less than unity in absolute value, indicating adjustment toward the long-run equilibrium. Their magnitudes imply that approximately 16.1% and 19.7% of the previous period’s deviation from equilibrium are corrected within one period, respectively.
Table 6.
Results of CS-ARDL- Full Sample.
Importantly, the long-run results indicate a significant negative association between TGS and EFP, supporting H1. This implies that higher taxes on goods and services are consistent with a lower EFP. Several possible mechanisms may explain this outcome. First, TGS may raise the relative cost of goods and services with large EFP, discouraging excessive consumption of resource-intensive products. Second, differences in relative prices associated with TGS may coincide with differences in consumer demand for cleaner substitutes, such as energy-efficient appliances. Third, TGS revenues may fund environmental programs, including investments in renewable energy and clean technologies. Finally, an effective TGS system that broadens the base and improves compliance may contribute to the internalization of environmental costs, encouraging both producers and consumers toward greener choices. This finding aligns with [39], which reported an adverse link between indirect taxation and environmental pressure.
In contrast to the long-run analysis, the short-run estimates indicate that the coefficients on TGS are statistically insignificant. In addition, several covariates exhibit weaker or non-robust short-run responses: for instance, ENU and FDI are insignificant in the short run, diverging from their positive long-run effects. GDP and population (POP) remain positive and significant, consistent with the long-run findings. Digitalization (DIGT) is negative in the short run, indicating that higher digitalization is associated with lower EFP in the short run.
Regarding Model 2, which incorporates the interaction between TGS and DIGT, the results are generally consistent with Model 1. The coefficients of most control variables maintain their signs, indicating that the results remain stable after introducing the interaction term. TGS continues to exhibit an adverse association with EFP, while digitalization is independently associated with a lower EFP.
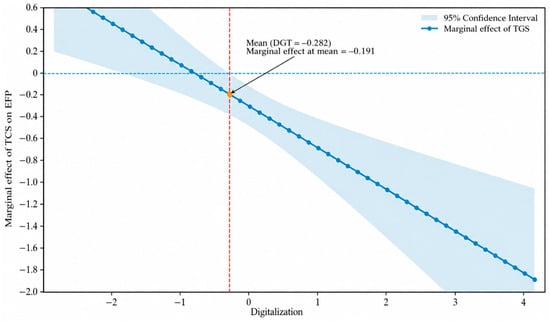
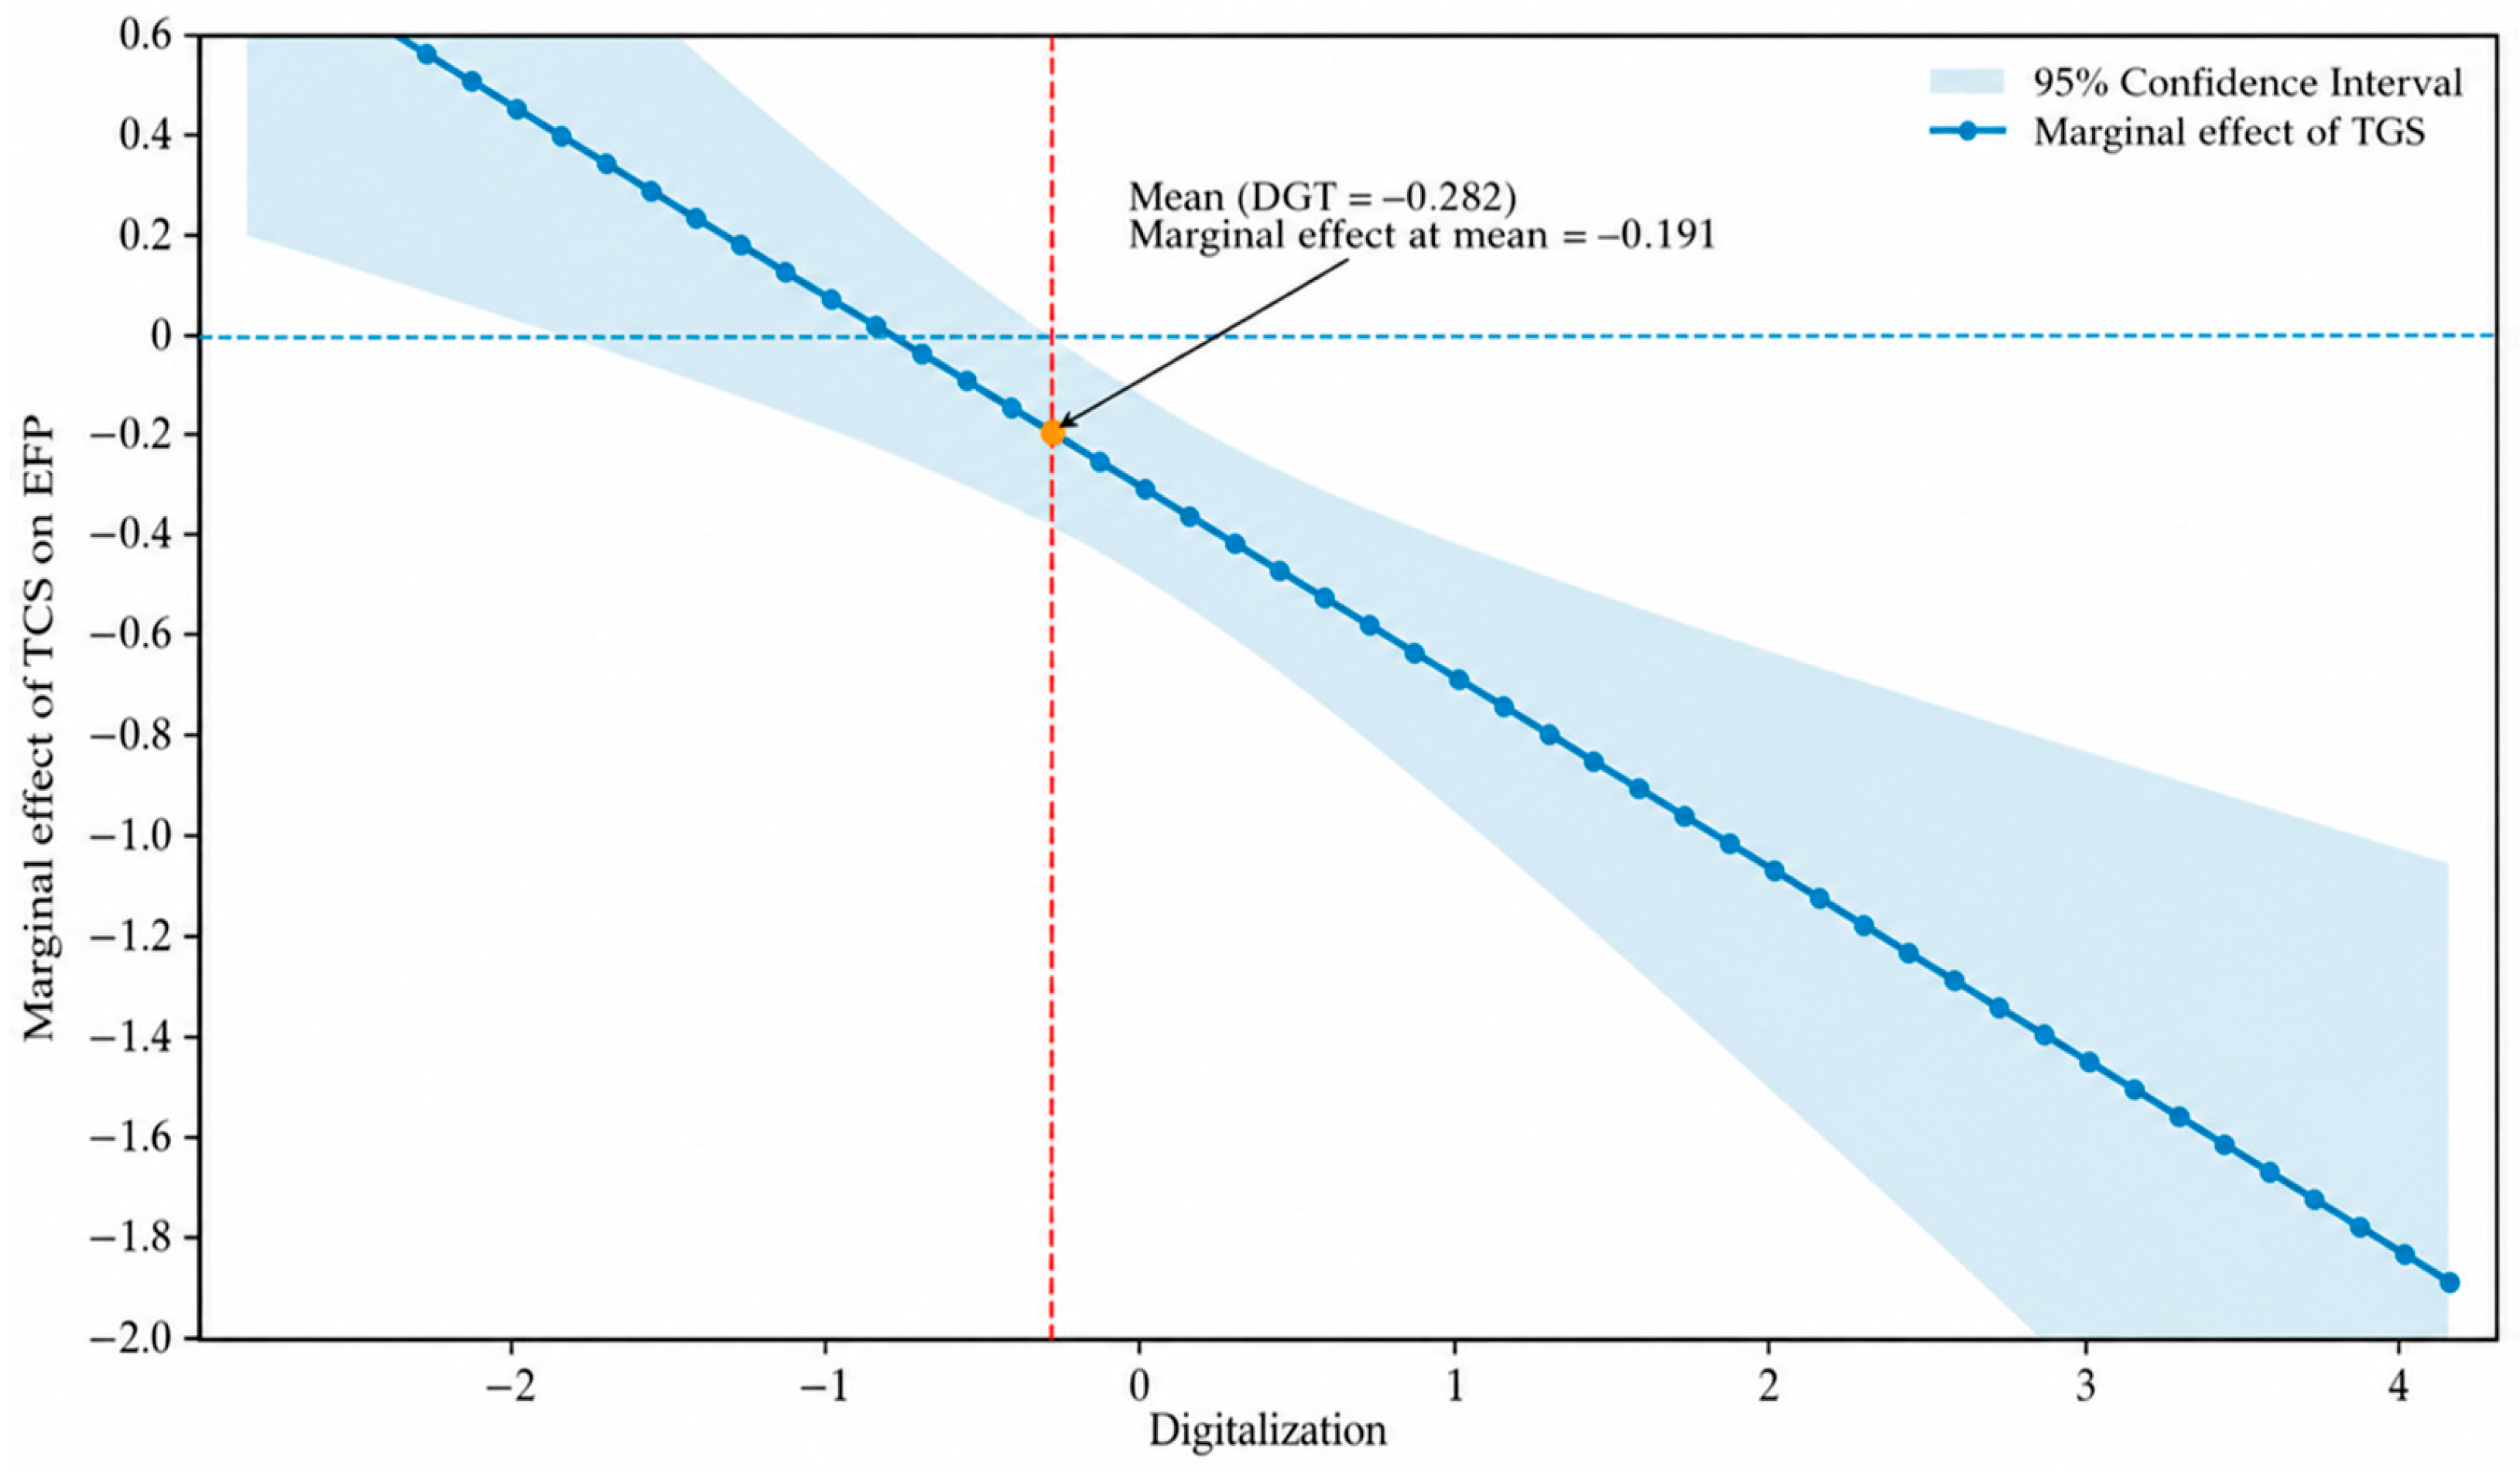
Regarding the moderating role of digitalization, the results show that the interaction between TGS and digitalization is negative and statistically significant in the long run, supporting H3, whereas the short-run interaction is not statistically significant. To clarify the conditional relationship, we compute the marginal effect of TGS on EFP as a function of digitalization, as specified in Equation (2): . At the sample mean of DIGT (−0.282), the marginal effect of TGS is −0.191, indicating an average negative association. Figure 2 illustrates how the marginal effect of TGS varies across the full observed range of digitalization, together with the corresponding 95% confidence intervals. For a more detailed assessment, Appendix D reports the marginal effects at the 10th, 25th, 50th, 75th, and 90th percentiles of digitalization, along with their 95% confidence intervals.
Figure 2.
Marginal Effect of TGS on EFP across the observed range of DIGT.
The marginal-effects analysis indicates that the association between TGS and EFP changes from positive at relatively low levels of digitalization to negative at higher levels, and is significant at both low and high levels (Appendix D). This pattern aligns with the significant negative interaction term and indicates that the TGS-EFP relationship varies with digitalization. One possible explanation is that greater digitalization may facilitate tax administration and compliance, strengthen monitoring, and support the implementation of environmental policies. However, our empirical model does not directly test these mechanisms; instead, it identifies a conditional association between TGS and EFP across different digitalization levels rather than the specific channels through which this relationship operates. Future research could examine these channels using more detailed data on digital tax administration, tax compliance, monitoring capacity, and environmental policy implementation.
4.3. Sub-Samples Analysis
To gain further insights into the link between TGS, digitalization, and EFP, we estimated Equations (1) and (2) by splitting the full sample into two sub-samples: (1) low- and lower-middle-income economies (LLMEs) and (2) upper-middle- and high-income economies (UMHEs). The outcomes of the direct effect analysis (i.e., Equation (1)) for the two sub-samples are shown in columns 2 and 4 of Table 7.
Table 7.
Results of CS-ARDL: LLMEs and UMHEs.
The long-run findings indicate a negative association between TGS and EFP in both LLMEs and UMHEs. By contrast, the short-run estimates show that TGS is not significant, consistent with the full-sample results. Notably, the TGS coefficient is numerically larger in absolute magnitude in UMHEs than in LLMEs, although this difference should not be interpreted as statistically established. One possible explanation is that UMHEs typically exhibit stricter regulatory frameworks and stronger institutional capacity, which enhance the effectiveness of tax policy in curbing ecological pressure [85,86]. Conversely, LLMEs may face economic and institutional constraints, such as weaker governance, narrower tax bases, and lower digital capacity, that dampen the potential of TGS to improve environmental outcomes.
Table 7 indicates that the relationship between digital progress and EFP varies across country groups. In UMHEs, digitalization is significantly and negatively associated with EFP, whereas the association is statistically insignificant in LLMEs. This result suggests that UMHEs may have more mature digital infrastructures, enabling them to enforce tax policies effectively. In contrast, LLMEs often lack comparable digital capacity, limiting their ability to leverage technology to reduce their EFP. These findings align with [87,88,89], which reported that the impacts of digitalization differ between developed and less developed nations.
Regarding the combined influence of digitalization and TGS on EFP, the estimation results for the interaction specification (Equation (2)) in columns (3) and (5) of Table 7 show that the interaction terms are negative and significant in UMHEs. By contrast, in LLMEs, the interaction is insignificant in the short run. The numerical differences in the interaction estimates across the two groups may reflect disparities in digital infrastructure, the intensity and composition of ecological pressure, and the scale and effectiveness of TGS implementation within these groups [88,90]. As shown in Appendix E, there are notable differences in the digitalization, EFP, and TGS across LLMEs and UMHEs, underscoring the contextual factors that condition the effectiveness of TGS in addressing environmental challenges.
4.4. Robustness
4.4.1. Alternative Estimators (CCEMG and AMG)
To evaluate the reliability of the CS-ARDL estimates, we re-estimated the long-run relationships using the CCEMG and AMG estimators.
Both CCEMG and AMG account for cross-country heterogeneity, common factor, and cross-sectional dependence. The results reported in Table 8 are broadly consistent with the baseline CS-ARDL estimates. Although coefficient magnitudes vary somewhat across estimators, the main relationships remain similar. In particular, TGS retains a negative and statistically significant association with EFP, supporting the full-sample CS-ARDL results in Table 6. The interaction term is also negative, indicating that the negative association between TGS and EFP becomes stronger as digitalization increases. Overall, these results support the robustness of the baseline finding.
Table 8.
Results of CCEMG and AMG Estimators.
4.4.2. Robustness to Alternative Measure of TGS
As an additional sensitivity check, we re-estimate the models using an alternative proxy for the key independent variable, TGS. Specifically, instead of measuring TGS as a share of GDP, we redefine it as a percentage of total government revenue. This alternative measure captures the importance of TGS within the overall fiscal structure, rather than its size relative to the economy. This exercise assesses whether the estimated relationship is sensitive to the choice of denominator. Table 9 presents the CS-ARDL results using this alternative measure.
Table 9.
Results of CS-ARDL (Independent variable: TGS as share of total revenue).
The estimated coefficient of TGS remains consistent in sign and significance in the long run, although its magnitude is higher than in the baseline model. This reflects the relatively larger role of TGS when measured as a share of total government revenue rather than GDP. Furthermore, the interaction term remains negative, indicating that higher digitalization is associated with a stronger negative relationship between TGS and EFP.
5. Conclusions and Recommendations
Fiscal policy is increasingly documented as a vital tool for addressing environmental challenges. Among its instruments, taxation is expected to play a significant role in reducing EFP and responding to the growing threats of environmental degradation. Despite a substantial body of literature on environmental taxes, the role of broad taxation, such as TGS, in influencing EFP has received limited attention because of the lack of cross-country tax data. This study addresses this gap by investigating the association between TGS and EFP, using newly released government revenue data from UNU-WIDER, and examining the moderating role of digitalization.
The results indicate that higher TGS is associated with lower EFP in the long run, suggesting an important link between taxes on goods and services and ecological pressure. In addition, digitalization is negatively and significantly associated with EFP in both the full sample and the lower- and higher-income groups. However, in lower-income countries, the relationship is insignificant, which may reflect differences in digital infrastructure and capacity. Notably, the analysis reveals that greater digitalization is associated with a stronger negative relationship between TGS and EFP. This interaction suggests that the relationship between TGS and EFP becomes stronger at higher levels of digitalization. Moreover, the combined effect of digitalization and taxation differs across income groups, suggesting that the relationship between TGS and ecological pressure varies with digitalization and a country’s stage of development. Furthermore, the findings are supported by alternative estimation approaches, including CCEMG and AMG, as well as an alternative proxy for the key independent variable.
The study offers several policy implications for environmental sustainability. First, rather than supporting broad increases in TGS, the findings suggest that policymakers could consider TGS as part of a broader environmental policy framework, with greater attention to goods and services associated with higher environmental impacts. Second, digitalization may be a complementary factor shaping the observed association between TGS and environmental outcomes. In lower-income countries, expanding digital infrastructure and digital tax administration, including e-tax platforms and data-driven compliance systems, may help strengthen tax administration and facilitate the implementation of environmental fiscal measures. Finally, improving digital access and information systems can facilitate greater engagement among citizens and firms and may support better coordination between fiscal and environmental policies.
Despite its contributions, this paper has some limitations. First, although it uses newly available data from UNU-WIDER, the TGS variable is measured at an aggregate level, which may mask important differences across tax types. Digitalization may also be subject to measurement error due to limitations in the underlying indicators. Second, although complementary econometric methods are applied, the endogeneity arising from reverse causality and omitted-variable bias cannot be completely ruled out. Third, although this study covers a wide range of countries, future research could extend the analysis to a broader set of countries. The income-group analysis is complementary, and we did not formally test for statistical equality of coefficients across LLMEs and UMHEs. Fourth, data availability constrains the model, leading us to omit some relevant institutional and economic factors, such as governance quality, trade openness, and renewable-energy use. Fifth, the mechanisms linking TGS and digitalization to EFP are discussed conceptually but are not directly tested. Future research could examine these channels using more detailed data on tax administration, government capacity, and institutional conditions. Finally, the study does not explicitly assess whether individual countries, particularly large economies, exert disproportionate influence on the estimated results.
Author Contributions
Conceptualization, E.M.E. and M.E.M.A.; methodology, E.M.E.; software, E.M.E.; validation, E.M.E.; formal analysis, M.E.; investigation, M.E. and T.S.; data curation, M.E.M.A.; writing—original draft preparation, M.E.M.A.; writing—review and editing, T.S.; visualization, E.M.E. and T.S.; supervision, E.M.E.; project administration, E.M.E. and M.E. Funding acquisition, M.E. All authors have read and agreed to the published version of the manuscript.
Funding
This research was funded by Princess Nourah bint Abdulrahman University Researchers Supporting Project Number (PNURSP2026R866), Princess Nourah bint Abdulrahman University, Riyadh, Saudi Arabia.
Data Availability Statement
All data utilized in this paper are publicly accessible from the World Bank, UNU-WIDER and GFN.
Acknowledgments
The authors extend their appreciation to Princess Nourah bint Abdulrahman University Researchers Supporting Project number (PNURSP2026R866), Princess Nourah bint Abdulrahman University, Riyadh, Saudi Arabia.
Conflicts of Interest
The authors declare no conflicts of interest.
Abbreviations
The following abbreviations are used in this manuscript:
| AMG | Augmented Mean Group |
| CADF | Cross-Sectionally Augmented Dickey–Fuller |
| CCEMG | Common Correlated Effects Mean Group |
| CIPS | Cross-Sectionally Augmented IPS |
| CO2 | Carbon Dioxide |
| CS-ARDL | Cross-sectionally Augmented Autoregressive Distributed Lag |
| CSD | Cross-Sectional Dependence |
| EFP | Ecological Footprint |
| EKC | Environmental Kuznets Curve |
| GDP | Gross Domestic Product |
| GFN | Global Footprint Network |
| OECD | Organization for Economic Cooperation and Development |
| PCA | Principal Component Analysis |
| TGS | Taxes on Goods and Services |
| UNU-WIDER | United Nations University World Institute for Development Economics |
| VAT | Value-added taxes |
| WDI | World Development Indicators |
Appendix A. PCA Results
Table A1.
PCA results for the digital infrastructure sub-index.
Table A2.
PCA results for the digital trade sub-index.
Table A3.
PCA results for the social impact sub-index.
Table A4.
PCA results for the overall digitalization index (DIGT).
Appendix B. CS-ARDL Lag Structure Selection Based on AIC and BIC
| Model | Specification | AIC | BIC | Comment |
| Baseline | CS-ARDL(1,0,0,0,0,0,0) | −3.012 | −2.745 | Not preferred |
| Baseline | CS-ARDL(1,0,0,2,0,0,1) | −3.189 | −2.813 | Preferred |
| Baseline | CS-ARDL(2,0,0,0,0,0,0) | −2.850 | −2.638 | Not preferred |
| Baseline | CS-ARDL(2,0,0,1,0,0,1) | −2.917 | −2.762 | Not preferred |
| Interaction | CS-ARDL(1,0,0,0,0,0,0,0) | −3.041 | −2.688 | Not preferred |
| Interaction | CS-ARDL(1,0,0,1,0,0,1,0) | −3.126 | −2.741 | Preferred |
| Interaction | CS-ARDL(1,0,0,1,0,1,1,0) | −3.087 | −2.703 | Not preferred |
Appendix C. List of Countries
Low- and lower-middle-income economies (LLMEs) (31).
Bangladesh, Bhutan, Burkina Faso, Cambodia, Cameroon, Congo (Rep.), Côte d’Ivoire, DRC, Egypt, Eswatini, Ethiopia, Ghana, Guatemala, Honduras, Kenya, Kyrgyzstan, Lesotho, Madagascar, Mali, Morocco, Nicaragua, Niger, Nigeria, Pakistan, Papua New Guinea, Rwanda, Senegal, Togo, Tunisia, Uganda, and Uzbekistan.
Upper-middle- and high-income economies (UMHEs) (65).
“Albania, Argentina, Armenia, Australia, Austria, Barbados, Belgium, Bosnia and Herzegovina, Brazil, Bulgaria, Canada, Cape Verde, Chile, China, Costa Rica, Croatia, Cuba, Cyprus, Czechia, Denmark, Dominican Republic, El Salvador, Estonia, Finland, France, Georgia, Germany, Greece, Hungary, Indonesia, Ireland, Israel, Italy, Japan, South Korea, Latvia, Lithuania, Luxembourg, Malaysia, Malta, Mauritius, Mexico, Mongolia, Netherlands, New Zealand, Norway, Paraguay, Peru, Poland, Portugal, Romania, Russian Federation, Singapore, Slovak Republic, Slovenia, South Africa, Spain, Sweden, Switzerland, Thailand, Trinidad and Tobago, Turkey, Ukraine, United Kingdom, and United States.”
Appendix D. Marginal Effects of TGS on EFP at Different Levels of Digitalization
| DIGT | Marginal Effect | SE | 95% CI | p-Value |
| 10th | 0.469 | 0.138 | [0.199, 0.739] | 0.001 |
| 25th | 0.259 | 0.107 | [0.049, 0.469] | 0.016 |
| 50th | −0.127 | 0.100 | [−0.323, 0.069] | 0.204 |
| 75th | −0.635 | 0.110 | [−0.851, −0.419] | 0.001 |
| 90th | −0.939 | 0.133 | [−1.200, −0.678] | 0.001 |
Appendix E. Summary Statistics of Variables Across Country Groups
| Variable | LLMEs Nations | UMHEs Nations | ||
| Mean | SD | Mean | SD | |
| EFP | 3.193 | 2.446 | 3.814 | 3.388 |
| TGS | 6.303 | 2.744 | 10.806 | 3.678 |
| GDP | 1615.80 | 989.60 | 22,384.45 | 21,280.44 |
| ENU | 6.414 | 3.821 | 4.558 | 2.735 |
| POP | 37.00 | 51.30 | 54.00 | 171.00 |
| FDI | 3.021 | 3.405521 | 8.524 | 31.647 |
| DIGT | −1.296 | 0.490 | 0.621 | 1.048 |
References
- Mardones, C.; Andaur, C. Evaluating carbon taxes in Argentina based on the demand for GHG-intensive goods and an input-output approach. Sustain. Prod. Consum. 2024, 46, 418–429. [Google Scholar] [CrossRef] [Scilit]
- Ghazouani, A.; Xia, W.; Ben Jebli, M.; Shahzad, U. Exploring the Role of Carbon Taxation Policies on CO2 Emissions: Contextual Evidence from Tax Implementation and Non-Implementation European Countries. Sustainability 2020, 12, 8680. [Google Scholar] [CrossRef] [Scilit]
- Zhang, Y.; Khan, I.; Zafar, M.W. Assessing environmental quality through natural resources, energy resources, and tax revenues. Environ. Sci. Pollut. Res. 2022, 29, 89029–89044. [Google Scholar] [CrossRef] [Scilit] [PubMed]
- Cavalli, F.; Mainini, A.; Visetti, D. The role of taxation in an integrated economic-environmental model: A dynamical analysis. Decis. Econ. Finance 2024, 47, 597–626. [Google Scholar] [CrossRef] [Scilit]
- Shahzad, U. Environmental taxes, energy consumption, and environmental quality: Theoretical survey with policy implications. Environ. Sci. Pollut. Res. 2020, 27, 24848–24862. [Google Scholar] [CrossRef] [Scilit] [PubMed]
- Depren, Ö.; Kartal, M.T.; Ayhan, F.; Kılıç Depren, S. Heterogeneous impact of environmental taxes on environmental quality: Tax domain based evidence from the nordic countries by nonparametric quantile approaches. J. Environ. Manag. 2023, 329, 117031. [Google Scholar] [CrossRef] [Scilit] [PubMed]
- Cao, G.; She, J.; Cao, C.; Cao, Q. Environmental Protection Tax and Green Innovation: The Mediating Role of Digitalization and ESG. Sustainability 2024, 16, 577. [Google Scholar] [CrossRef] [Scilit]
- Zhou, Z.; Yu, H.; Shao, Q.; Sun, H.; Zhang, R.; Wei, Y.-M. Tax and subsidy policy for domestic air pollution with asymmetric local and global spillover effects. J. Clean. Prod. 2021, 318, 128504. [Google Scholar] [CrossRef] [Scilit]
- Xu, Y.; Wen, S.; Tao, C.-Q. Impact of environmental tax on pollution control: A sustainable development perspective. Econ. Anal. Policy 2023, 79, 89–106. [Google Scholar] [CrossRef] [Scilit]
- Manta, A.G.; Doran, N.M.; Bădîrcea, R.M.; Badareu, G.; Țăran, A.M. Does the implementation of a Pigouvian tax be considered an effective approach to address climate change mitigation? Econ. Anal. Policy 2023, 80, 1719–1731. [Google Scholar] [CrossRef] [Scilit]
- Mukherjee, S. Goods and Services Tax efficiency across Indian States: Panel stochastic frontier analysis. Indian Econ. Rev. 2020, 55, 225–251. [Google Scholar] [CrossRef] [Scilit]
- Khoja, I.A.; Khan, N.A. Goods and services tax, cascading, and revenue performance: Analyzing Indian commodity taxation market. J. Public Aff. 2020, 20, e2109. [Google Scholar] [CrossRef] [Scilit]
- Timmermans, B.; Achten, W.M.J. From value-added tax to a damage and value-added tax partially based on life cycle assessment: Principles and feasibility. Int. J. Life Cycle Assess. 2018, 23, 2217–2247. [Google Scholar] [CrossRef] [Scilit]
- Liu, Z.; Jiang, Y.; Bolayog, D. Does “replacing business tax with value-added tax” promote the energy efficiency of the logistics industry in China? Environ. Sci. Pollut. Res. 2019, 26, 33169–33180. [Google Scholar] [CrossRef] [Scilit] [PubMed]
- Griffiths, J. Financing the Sustainable Development Goals (SDGs). Development 2018, 61, 62–67. [Google Scholar] [CrossRef] [Scilit]
- Richards, N.U. Sustainable development goals and taxation in Nigeria. Commonw. Law Bull. 2021, 47, 570–588. [Google Scholar] [CrossRef] [Scilit]
- He, P.; Zhang, S.; Wang, L.; Ning, J. Will environmental taxes help to mitigate climate change? A comparative study based on OECD countries. Econ. Anal. Policy 2023, 78, 1440–1464. [Google Scholar] [CrossRef] [Scilit]
- Guo, X.; Wei, T.; Wang, A.; Hu, H. Corporate governance effects of digital finance: Evidence from corporate tax avoidance in China. Res. Int. Bus. Finance 2024, 72, 102526. [Google Scholar] [CrossRef] [Scilit]
- Ding, Y.; Wang, X.; Wu, L. Environmental tax law and greenwashing: The moderating role of digitization. Humanit. Soc. Sci. Commun. 2025, 12, 518. [Google Scholar] [CrossRef] [Scilit]
- Martínez, Y.U.; Arzoz, P.P.; Arregui, I.Z. Tax collection efficiency in OECD countries improves via decentralization, simplification, digitalization and education. J. Policy Model. 2022, 44, 298–318. [Google Scholar] [CrossRef] [Scilit]
- Nose, M.; Mengistu, A. Exploring the Adoption of Selected Digital Technologies in Tax Administration; IMF Notes; International Monetary Fund: Washington, DC, USA, 2023; Volume 2023, p. 1. [Google Scholar] [CrossRef] [Scilit]
- Pigou, A.C. Co-operative Societies and Income Tax. Econ. J. 1920, 30, 156–162. [Google Scholar] [CrossRef] [Scilit]
- Jacobs, B.; de Mooij, R.A. Pigou meets Mirrlees: On the irrelevance of tax distortions for the second-best Pigouvian tax. J. Environ. Econ. Manag. 2015, 71, 90–108. [Google Scholar] [CrossRef] [Scilit]
- Tullock, G. THE WELFARE COSTS OF TARIFFS, MONOPOLIES, AND THEFT. Econ. Inq. 1967, 5, 224–232. [Google Scholar] [CrossRef] [Scilit]
- Silva, S.; Soares, I.; Afonso, O. Assessing the double dividend of a third-generation environmental tax reform with resource substitution. Environ. Dev. Sustain. 2021, 23, 15145–15156. [Google Scholar] [CrossRef] [Scilit]
- Alola, A.A.; Nwulu, N. Do energy-pollution-resource-transport taxes yield double dividend for Nordic economies? Energy 2022, 254, 124275. [Google Scholar] [CrossRef] [Scilit]
- Sarkodie, S.A.; Ozturk, I. Investigating the Environmental Kuznets Curve hypothesis in Kenya: A multivariate analysis. Renew. Sustain. Energy Rev. 2020, 117, 109481. [Google Scholar] [CrossRef] [Scilit]
- Boubellouta, B.; Kusch-Brandt, S. Testing the environmental Kuznets Curve hypothesis for E-waste in the EU28+2 countries. J. Clean. Prod. 2020, 277, 123371. [Google Scholar] [CrossRef] [Scilit]
- Ben Youssef, A.; Dahmani, M. Assessing the Impact of Digitalization, Tax Revenues, and Energy Resource Capacity on Environmental Quality: Fresh Evidence from CS-ARDL in the EKC Framework. Sustainability 2024, 16, 474. [Google Scholar] [CrossRef] [Scilit]
- Grossman, G.M.; Krueger, A.B. Environmental Impacts of a North American Free Trade Agreement; National Bureau of Economic Research: Cambridge, MA, USA, 1991. [Google Scholar] [CrossRef] [Scilit]
- Panayotou, T. Empirical Tests and Policy Analysis of Environmental Degradation at Different Stages of Economic Development; working paper WP238; technology and employment programme; International Labour Office: Geneva, Switzerland, 1993; Volume 4. [Google Scholar]
- Stern, D.I. The Rise and Fall of the Environmental Kuznets Curve. World Dev. 2004, 32, 1419–1439. [Google Scholar] [CrossRef] [Scilit]
- Dinda, S. Environmental Kuznets curve hypothesis: A survey. Ecol. Econ. 2004, 49, 431–455. [Google Scholar] [CrossRef] [Scilit]
- Porter, M.E. America’s Green Strategy. Sci. Am. 1991, 264, 168. [Google Scholar] [CrossRef] [Scilit]
- Figge, L.; Oebels, K.; Offermans, A. The effects of globalization on Ecological Footprints: An empirical analysis. Environ. Dev. Sustain. 2017, 19, 863–876. [Google Scholar] [CrossRef] [Scilit]
- Obekpa, H.O.; Alola, A.A.; Adejo, A.M.; Echebiri, C. Examining the drivers of ecological footprint components: Is pursuing food security environmentally costly for Nigeria? Ecol. Indic. 2025, 170, 113009. [Google Scholar] [CrossRef] [Scilit]
- Nathaniel, S.P. Ecological footprint, energy use, trade, and urbanization linkage in Indonesia. GeoJournal 2021, 86, 2057–2070. [Google Scholar] [CrossRef] [Scilit]
- Destek, M.A.; Sinha, A. Renewable, non-renewable energy consumption, economic growth, trade openness and ecological footprint: Evidence from organisation for economic Co-operation and development countries. J. Clean. Prod. 2020, 242, 118537. [Google Scholar] [CrossRef] [Scilit]
- Ebaidalla, E.M. Impact of indirect taxes on CO2 emissions in the presence of institutional quality: Evidence from a global panel data analysis. Manag. Environ. Qual. Int. J. 2024, 35, 729–750. [Google Scholar] [CrossRef] [Scilit]
- Bassey, E.; Mulligan, E.; Ojo, A. A conceptual framework for digital tax administration—A systematic review. Gov. Inf. Q. 2022, 39, 101754. [Google Scholar] [CrossRef] [Scilit]
- Cheng, Q.; Chen, B.; Luo, J. The impact of digital tax administration on local government debt: Based on the revision of the tax collection and administration law. Finance Res. Lett. 2024, 67, 105938. [Google Scholar] [CrossRef] [Scilit]
- Zhou, S.; Zhou, P.; Ji, H. Can digital transformation alleviate corporate tax stickiness: The mediation effect of tax avoidance. Technol. Forecast. Soc. Change 2022, 184, 122028. [Google Scholar] [CrossRef] [Scilit]
- Uyar, A.; Nimer, K.; Kuzey, C.; Shahbaz, M.; Schneider, F. Can e-government initiatives alleviate tax evasion? The moderation effect of ICT. Technol. Forecast. Soc. Change 2021, 166, 120597. [Google Scholar] [CrossRef] [Scilit]
- Chen, M.; Zhao, K.; Jin, W. Corporate digital transformation and tax avoidance: Evidence from China. Pac.-Basin Finance J. 2024, 85, 102400. [Google Scholar] [CrossRef] [Scilit]
- Bellon, M.; Dabla-Norris, E.; Khalid, S.; Lima, F. Digitalization to improve tax compliance: Evidence from VAT e-Invoicing in Peru. J. Public Econ. 2022, 210, 104661. [Google Scholar] [CrossRef] [Scilit] [PubMed]
- Kitsios, E.; Jalles, J.T.; Verdier, G. Tax evasion from cross-border fraud: Does digitalization make a difference? Appl. Econ. Lett. 2023, 30, 1400–1406. [Google Scholar] [CrossRef] [Scilit]
- Okunogbe, O.; Santoro, F. Increasing Tax Collection in African Countries: The Role of Information Technology. J. Afr. Econ. 2023, 32, i57–i83. [Google Scholar] [CrossRef] [Scilit]
- Kochanova, A.; Hasnain, Z.; Larson, B. Does E-Government Improve Government Capacity? Evidence from Tax Compliance Costs, Tax Revenue, and Public Procurement Competitiveness. World Bank Econ. Rev. 2020, 34, 101–120. [Google Scholar] [CrossRef] [Scilit]
- Xiao, C.; Shao, Y. Information system and corporate income tax enforcement: Evidence from China. J. Account. Public Policy 2020, 39, 106772. [Google Scholar] [CrossRef] [Scilit]
- Kotsogiannis, C.; Salvadori, L.; Karangwa, J.; Murasi, I. E-invoicing, tax audits and VAT compliance. J. Dev. Econ. 2025, 172, 103403. [Google Scholar] [CrossRef] [Scilit]
- Okunogbe, O.; Pouliquen, V. Technology, Taxation, and Corruption: Evidence from the Introduction of Electronic Tax Filing. Am. Econ. J. Econ. Policy 2022, 14, 341–372. [Google Scholar] [CrossRef] [Scilit]
- Qayyum, M.; Zhang, Y.; Ali, M.; Kirikkaleli, D. Towards environmental sustainability: The role of information and communication technology and institutional quality on ecological footprint in MERCOSUR nations. Environ. Technol. Innov. 2024, 34, 103523. [Google Scholar] [CrossRef] [Scilit]
- Zhang, Q.; Pang, Y. The digital tax administration (DTA) and green transformation of heavy polluting Enterprises—Based on the policy effect evaluation of the “Golden Tax Project III”. J. Clean. Prod. 2025, 486, 144463. [Google Scholar] [CrossRef] [Scilit]
- UNU-WIDER. UNU-WIDER Government Revenue Dataset: Version 2023; UNU-WIDER: Helsinki, Finland, 2023. [Google Scholar]
- Doğan, B.; Chu, L.K.; Ghosh, S.; Diep Truong, H.H.; Balsalobre-Lorente, D. How environmental taxes and carbon emissions are related in the G7 economies? Renew. Energy 2022, 187, 645–656. [Google Scholar] [CrossRef] [Scilit]
- Rokhmawati, A.; Sarasi, V.; Berampu, L.T. Scenario analysis of the Indonesia carbon tax impact on carbon emissions using system dynamics modeling and STIRPAT model. Geogr. Sustain. 2024, 5, 577–587. [Google Scholar] [CrossRef] [Scilit]
- Erdogan, S. Linking green fiscal policy, energy, economic growth, population dynamics, and environmental degradation: Empirical evidence from Germany. Energy Policy 2024, 189, 114110. [Google Scholar] [CrossRef] [Scilit]
- Bozatli, O.; Akca, H. The effects of environmental taxes, renewable energy consumption and environmental technology on the ecological footprint: Evidence from advanced panel data analysis. J. Environ. Manag. 2023, 345, 118857. [Google Scholar] [CrossRef] [Scilit] [PubMed]
- Yuping, L.; Ramzan, M.; Xincheng, L.; Murshed, M.; Awosusi, A.A.; Bah, S.I.; Adebayo, T.S. Determinants of carbon emissions in Argentina: The roles of renewable energy consumption and globalization. Energy Rep. 2021, 7, 4747–4760. [Google Scholar] [CrossRef] [Scilit]
- Thio, E.; Tan, M.; Li, L.; Salman, M.; Long, X.; Sun, H.; Zhu, B. The estimation of influencing factors for carbon emissions based on EKC hypothesis and STIRPAT model: Evidence from top 10 countries. Environ. Dev. Sustain. 2022, 24, 11226–11259. [Google Scholar] [CrossRef] [Scilit]
- Awad, A.; Ebaidalla, E.M.; Yasin, S.; Ozturk, I. Navigating the impact of remittances on environmental quality in Africa: The crucial role of institutional quality. J. Environ. Manag. 2024, 369, 122298. [Google Scholar] [CrossRef] [Scilit] [PubMed]
- Essandoh, O.K.; Islam, M.; Kakinaka, M. Linking international trade and foreign direct investment to CO2 emissions: Any differences between developed and developing countries? Sci. Total Environ. 2020, 712, 136437. [Google Scholar] [CrossRef] [Scilit] [PubMed]
- Wang, Y.; Liao, M.; Wang, Y.; Xu, L.; Malik, A. The impact of foreign direct investment on China’s carbon emissions through energy intensity and emissions trading system. Energy Econ. 2021, 97, 105212. [Google Scholar] [CrossRef] [Scilit]
- Zhang, W.; Li, G.; Uddin, M.K.; Guo, S. Environmental regulation, Foreign investment behavior, and carbon emissions for 30 provinces in China. J. Clean. Prod. 2020, 248, 119208. [Google Scholar] [CrossRef] [Scilit]
- Nguyen, D.K.; Huynh, T.L.D.; Nasir, M.A. Carbon emissions determinants and forecasting: Evidence from G6 countries. J. Environ. Manag. 2021, 285, 111988. [Google Scholar] [CrossRef] [Scilit] [PubMed]
- Karlilar, S.; Balcilar, M.; Emir, F. Environmental sustainability in the OECD: The power of digitalization, green innovation, renewable energy and financial development. Telecommun. Policy 2023, 47, 102568. [Google Scholar] [CrossRef] [Scilit]
- Shahbaz, M.; Wang, J.; Dong, K.; Zhao, J. The impact of digital economy on energy transition across the globe: The mediating role of government governance. Renew. Sustain. Energy Rev. 2022, 166, 112620. [Google Scholar] [CrossRef] [Scilit]
- Zhang, L.; Hu, C.; Guo, C.; Wang, J. Digital economy, technical change and total factor productivity: Empirical evidence from high-tech industry in China. Telecommun. Policy 2024, 48, 102834. [Google Scholar] [CrossRef] [Scilit]
- Verma, A.; Das, K.C.; Misra, P. Digital finance and MSME performance in India: Evidence from World Bank Enterprise Survey data. J. Econ. Stud. 2024, ahead-of-print. [Google Scholar] [CrossRef] [Scilit]
- Oloyede, A.A.; Faruk, N.; Noma, N.; Tebepah, E.; Nwaulune, A.K. Measuring the impact of the digital economy in developing countries: A systematic review and meta- analysis. Heliyon 2023, 9, e17654. [Google Scholar] [CrossRef] [Scilit] [PubMed]
- Szabó, I.; Ternai, K.; Prosser, A.; Kovács, T. The impact of digitalization on SMEs GDP contribution. Procedia Comput. Sci. 2024, 239, 1807–1814. [Google Scholar] [CrossRef] [Scilit]
- Wang, B.; Wang, J.; Dong, K.; Dong, X. Is the digital economy conducive to the development of renewable energy in Asia? Energy Policy 2023, 173, 113381. [Google Scholar] [CrossRef] [Scilit]
- Cheng, M.; Liu, A.; Li, R. The Impact of Digital Transformation on Public Health: A Multicountry Analysis. Health Soc. Care Community 2026, 2026, 2320652. [Google Scholar] [CrossRef] [Scilit]
- Chudik, A.; Pesaran, M.H. Common correlated effects estimation of heterogeneous dynamic panel data models with weakly exogenous regressors. J. Econom. 2015, 188, 393–420. [Google Scholar] [CrossRef] [Scilit]
- Pesaran, M.H. Testing Weak Cross-Sectional Dependence in Large Panels. Econom. Rev. 2015, 34, 1089–1117. [Google Scholar] [CrossRef] [Scilit]
- Eberhardt, M.; Bond, S. Cross-Section Dependence in Nonstationary Panel Models: A Novel Estimator. 2009. Available online: https://mpra.ub.uni-muenchen.de/17870/ (accessed on 7 March 2026).
- Gao, J.; Xia, K.; Zhu, H. Heterogeneous panel data models with cross-sectional dependence. J. Econom. 2020, 219, 329–353. [Google Scholar] [CrossRef] [Scilit]
- Pesaran, M.H. A simple panel unit root test in the presence of cross-section dependence. J. Appl. Econom. 2007, 22, 265–312. [Google Scholar] [CrossRef] [Scilit]
- Westerlund, J. Panel cointegration tests of the Fisher effect. J. Appl. Econom. 2008, 23, 193–233. [Google Scholar] [CrossRef] [Scilit]
- World Bank. World Development Indicator; World Bank: Washington, DC, USA, 2025. [Google Scholar]
- Rehman, E.; Rehman, S. Modeling the nexus between carbon emissions, urbanization, population growth, energy consumption, and economic development in Asia: Evidence from grey relational analysis. Energy Rep. 2022, 8, 5430–5442. [Google Scholar] [CrossRef] [Scilit]
- Xu, Q.; Zhong, M.; Cao, M. Does digital investment affect carbon efficiency? Spatial effect and mechanism discussion. Sci. Total Environ. 2022, 827, 154321. [Google Scholar] [CrossRef] [Scilit] [PubMed]
- Sun, X.; Xiao, S.; Ren, X.; Xu, B. Time-varying impact of information and communication technology on carbon emissions. Energy Econ. 2023, 118, 106492. [Google Scholar] [CrossRef] [Scilit]
- Jiang, H.; Elahi, E.; Gao, M.; Huang, Y.; Liu, X. Digital economy to encourage sustainable consumption and reduce carbon emissions. J. Clean. Prod. 2024, 443, 140867. [Google Scholar] [CrossRef] [Scilit]
- Bibi, S.; Khan, A.; Fubing, X.; Jianfeng, H.; Hussain, S.; Khan, A.N. Impact of environmental policies, regulations, technologies, and renewable energy on environmental sustainability in China’s textile and fashion industry. Front. Environ. Sci. 2024, 12, 1496454. [Google Scholar] [CrossRef] [Scilit]
- Ogwu, M.C.; El Malahi, S.; Izah, S.C. Policy and Regulatory Frameworks for Sustainable Environmental Practices. In Evaluating Environmental Processes and Technologies; Ogwu, M.C., Chibueze Izah, S., Eds.; Springer Nature: Cham, Switzerland, 2025; pp. 513–544. [Google Scholar]
- Mishakov, V.Y.; Daitov, V.V.; Gordienko, M.S. Impact of Digitalization on Economic Sustainability in Developed and Developing Countries. In Sustainable Development of Modern Digital Economy: Perspectives from Russian Experiences; Ragulina, J.V., Khachaturyan, A.A., Abdulkadyrov, A.S., Babaeva, Z.S., Eds.; Springer International Publishing: Cham, Switzerland, 2021; pp. 265–274. [Google Scholar]
- Chatti, W.; Majeed, M.T. Information communication technology (ICT), smart urbanization, and environmental quality: Evidence from a panel of developing and developed economies. J. Clean. Prod. 2022, 366, 132925. [Google Scholar] [CrossRef] [Scilit]
- Chatti, W.; Majeed, M.T. How does ICT affect the shadow economy towards environmental preservation? Evidence from a panel of developing and developed nations. Environ. Sci. Pollut. Res. 2023, 30, 22046–22062. [Google Scholar] [CrossRef] [Scilit] [PubMed]
- Ali, E.; Bataka, H.; Wonyra, K.O.; Awade, N.E.; Braly, N.N. Global value chains participation and environmental pollution in developing countries: Does digitalization matter? J. Int. Dev. 2024, 36, 451–478. [Google Scholar] [CrossRef] [Scilit]

Disclaimer/Publisher’s Note: The statements, opinions and data contained in all publications are solely those of the individual author(s) and contributor(s) and not of MDPI and/or the editor(s). MDPI and/or the editor(s) disclaim responsibility for any injury to people or property resulting from any ideas, methods, instructions or products referred to in the content. |
© 2026 by the authors. Licensee MDPI, Basel, Switzerland. This article is an open access article distributed under the terms and conditions of the Creative Commons Attribution (CC BY) license.