


Abstract
Carbon emission accounting for power transmission and transformation projects is increasingly needed to support low-carbon grid infrastructure, but existing studies often pay limited attention to the construction phase and rely on generalized emission factors that may not reflect regional electricity and industrial conditions. This study develops a construction-phase carbon emission accounting framework for a representative 1000 kV power transmission and transformation project in Shanxi Province, China. The framework defines a construction-specific accounting boundary covering material production, material transportation, construction electricity use, machinery fuel use, and installation-related vehicle fuel use. It also incorporates province-specific electricity and material emission factors to improve the regional representativeness of the inventory. The results show that the total construction-phase carbon footprint of the project was 1.92 × 10⁵ t CO2eq, with material-production emissions accounting for 87.23%. Off-site transmission line works and major production works were the dominant engineering divisions, contributing 39.40% and 33.79% of total emissions, respectively. Steel and cement-concrete products were the major material sources, jointly accounting for 89.78% of material-production emissions. Compared with national average factors, Shanxi-specific factors reduced estimated material emissions by 9.18%, while increasing the estimates for aluminum products and mixed electricity, indicating that regionalized factors can change both total results and source-level contributions. A contribution-based screening analysis further showed that 8.44% and 21.59% of the data streams accounted for 95% and 99% of cumulative construction-phase emissions, respectively. These findings highlight the importance of construction-phase boundary definition and regional emission-factor selection in project-level carbon accounting for power grid infrastructure.
1. Introduction
The low-carbon transition of power systems requires not only cleaner electricity generation but also a clearer understanding of the emissions embodied in grid infrastructure. Power transmission and transformation projects are essential for renewable energy integration, long-distance electricity delivery, and grid security [1,2]. Grid infrastructure also increasingly supports cross-sector interactions, including the participation of electric vehicles in electricity and carbon markets [3]. Recent analysis of the European electricity transition has further highlighted stability and reliability risks when renewable-energy deployment is not accompanied by adequate investment in energy storage and system flexibility [4]. However, their construction requires large quantities of steel, cement, concrete, non-ferrous metals, electricity, and fuels. These inputs generate substantial carbon emissions before the projects enter operation. Construction projects place substantial pressure on energy and material resources, making their environmental sustainability a major concern [5]. Therefore, construction-phase carbon accounting is necessary for evaluating the carbon performance of new power grid infrastructure and for identifying mitigation opportunities during engineering design, procurement, and construction.
Existing studies have examined carbon-emission reduction during the operational stage of substations [6]. Life cycle assessment and emission-factor methods have also been applied to power transmission and distribution equipment [7]. Construction-engineering carbon accounting methods have been developed to support project-level assessments [8]. Component-level life cycle assessments have quantified the environmental impacts of power lines, cables, transformers, and substation equipment [9,10]. These studies have shown that embodied emissions from construction materials can represent a major share of infrastructure-related carbon footprints [11,12]. The literature also employs diverse sustainability-assessment methods across design and construction stages, resulting in differences in assessment scope [13]. For power transmission and transformation projects, this finding is particularly relevant because their engineering composition combines civil works, electrical installation, foundations, towers, equipment supports, grounding systems, transportation, and on-site construction activities. As a result, construction-phase emissions are distributed across both material production and construction processes, rather than being limited to energy consumed at the construction site.
Despite these advances, construction-phase carbon accounting for power transmission and transformation projects still faces several methodological challenges. First, the construction phase is often embedded within broader life cycle assessments, which may obscure emission sources that are directly related to engineering construction [14]. Second, many project-level assessments do not fully connect carbon emissions with engineering divisions, subprojects, and bills of quantities, although building information modeling–based life-cycle assessment (BIM–LCA) frameworks demonstrate the value of connecting carbon calculations with detailed engineering information [15,16]. Third, the calculated embodied carbon of construction projects is influenced by differences in material inventories, emission factors, system boundaries, and regional production conditions [17].
The selection of regional emission factors is especially important for project-level carbon accounting in China. Provincial electricity mixes differ substantially because of variations in coal-fired generation, renewable energy development, power imports, and industrial structure. Material production processes and supply chains also vary by region. Province-level carbon-flow studies provide a basis for regionalizing electricity emission factors in China [18]. Regionalized inventories have also been developed for the Chinese cement industry [19]. Provincial carbon-flow evidence is available for the iron and steel industry [20]. Comparable spatially resolved information has also been developed for China’s aluminum industry chain [21]. Because electricity-related carbon estimates can vary with the emission-factor method employed, the geographic scope and accounting basis of each factor should be stated explicitly [22]. Therefore, using national average emission factors may reduce the regional representativeness of a project inventory and may lead to different conclusions regarding dominant emission sources and mitigation priorities.
In addition to factor selection, construction-phase accounting requires a clear and operable system boundary. A power transmission and transformation project involves numerous material, transportation, electricity, and fuel data streams. If the accounting boundary is too narrow, important embodied emissions may be omitted. If it is too broad without prioritization, data collection becomes burdensome and difficult to verify. A practical accounting framework should therefore define the construction-phase boundary explicitly while also retaining the ability to identify high-contribution sources within the project hierarchy.
This study develops a construction-phase carbon emission accounting framework for a representative 1000 kV power transmission and transformation project in Shanxi Province, China. The framework covers material production, material transportation, construction electricity use, machinery fuel use, and installation-related vehicle fuel use. It links emission results with engineering divisions and subprojects, and incorporates Shanxi-specific electricity and material emission factors to improve the regional representativeness of the inventory. A contribution-based screening analysis is further used to examine how the main emission structure can be retained while reducing the number of low-contribution data streams.
The contributions of this study are threefold. First, it defines a construction-specific accounting boundary for power transmission and transformation projects, allowing construction-stage emissions to be evaluated independently from the operation stage. Second, it compares results based on national average factors and Shanxi-specific factors, highlighting the influence of provincial emission-factor selection on project-level carbon accounting. Third, it identifies the dominant engineering divisions, subprojects, and material sources that drive construction-phase emissions, providing practical evidence for low-carbon design, procurement, and construction management of power grid infrastructure.
2. Methods
2.1. Construction-Phase Carbon Footprint Boundary
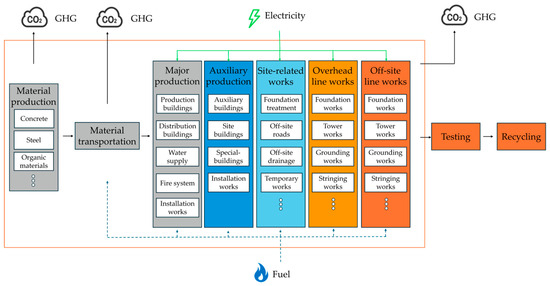
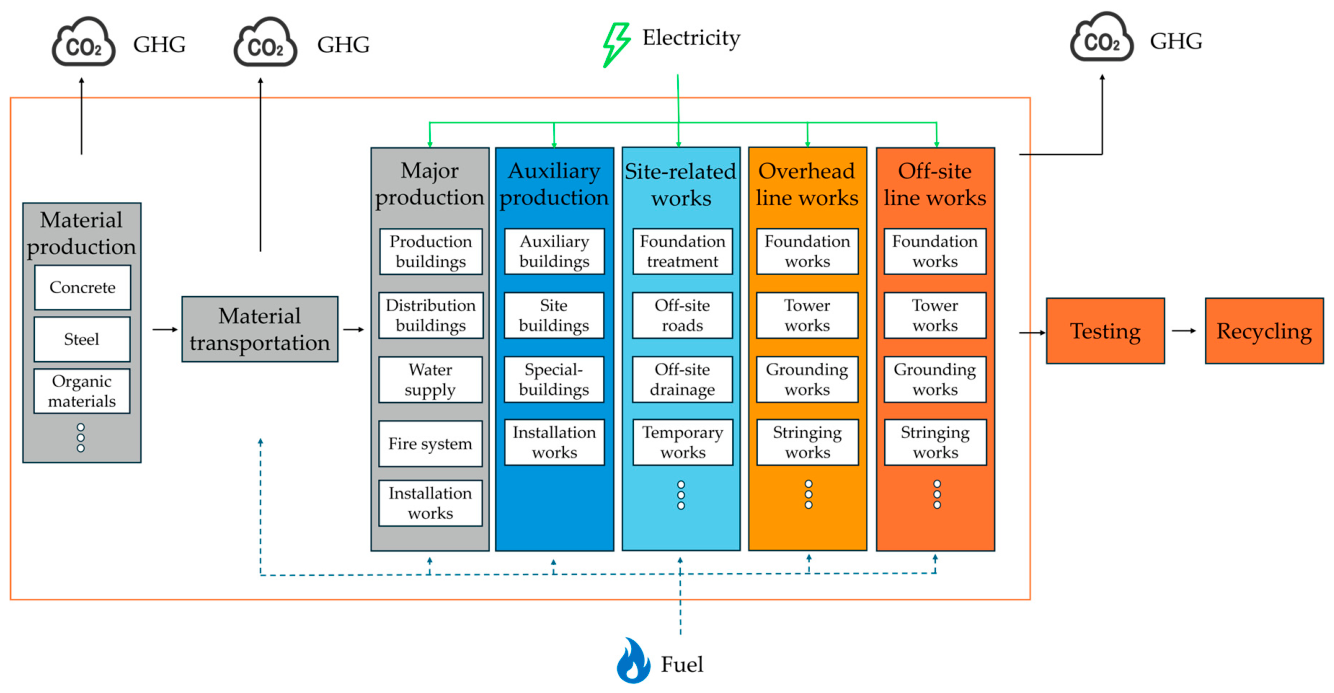
The construction-phase carbon footprint was divided into three components: embodied emissions from construction materials, electricity-related emissions and fuel-consumption emissions. Figure 1 illustrates the accounting boundary and the associated greenhouse gas (GHG) emissions from material production, material transportation, and on-site construction and installation.
Figure 1.
System boundary of carbon footprint accounting for the construction phase of power transmission and transformation projects. Black horizontal arrows indicate material and process flows; black upward arrows indicate GHG emissions; green arrows indicate electricity inputs; and blue dashed arrows indicate fuel inputs. Ellipses denote additional materials or subprojects not displayed. Different fill colors distinguish engineering divisions and process categories, while the orange outline indicates the system boundary.
The boundary definition followed the logic of activity-based engineering accounting. Material production emissions were attributed to the production of consumable construction materials before they entered the project site. Material transportation emissions were attributed to the movement of those materials from suppliers or processing locations to the construction site. On-site construction and installation emissions included fuel consumed by construction machinery, temporary electricity use and vehicle fuel used in construction-related material and equipment movement. This boundary was selected because these activities can be connected to engineering quantity records and construction organization documents [23].
The study focused on the construction phase rather than the full life cycle of the power transmission and transformation project. Operation, maintenance, equipment replacement and end-of-life recycling were outside the main boundary. Operational power losses and thermal effects associated with end-use technologies were also excluded because they arise after project commissioning. For example, research on wireless electric vehicle charging has shown that misalignment can increase power losses and surface-temperature rise, illustrating the dependence of such operational effects on specific technologies and operating conditions [24]. This choice was made because the purpose of the study was to identify construction-phase emission hotspots and to optimize the accounting boundary for engineering implementation. The boundary is therefore narrower than a cradle-to-grave life-cycle assessment, but it is more closely aligned with the data responsibilities of construction management and project carbon accounting. The included and excluded processes and the rationale for their treatment are summarized in Table S1 of the Supplementary Information.
2.2. Carbon Footprint Accounting Method for the Construction Phase of Power Transmission and Transformation Projects
The construction work was divided into five engineering divisions: major production works, auxiliary production works, site-related works, overhead line works and off-site transmission line works. The activity inventory was compiled from the engineering quantity records and construction organization documents of the case project and was organized by engineering division and subproject. Each entry was assigned to material production, off-site transportation, construction electricity, machinery fuel, or installation-related vehicle fuel, and the measurement units were harmonized before calculation. To protect commercially sensitive project information, item-level identifiers and procurement details were aggregated before reporting. The material classification and the inventory structure, record counts, and available data fields are provided in Tables S2 and S6, respectively. The total construction-phase carbon footprint was calculated as follows:
where CFall is the carbon footprint of the construction phase of the power transmission and transformation project, t CO2eq; and CFz is the carbon footprint of engineering division z, t CO2eq.
For each engineering division, carbon footprint was calculated by aggregating material-related and installation-related emissions from its subprojects:
where CFmaterial,z,i denotes the material-related carbon footprint of subproject i in engineering division z, t CO2eq; and CFinstall,z,i denotes the installation-related carbon footprint of subproject i in engineering division z, t CO2eq.
The material-related carbon footprint included emissions from material production and off-site transportation from suppliers or processing locations to the construction sites. The calculation method was as follows:
where Ematerial,z,i,j denotes the production-stage carbon emissions of material j consumed by subproject i in engineering division z, t CO2eq. Etrans,z,i,j denotes the transportation emissions of material j consumed by subproject i in engineering division z, t CO2eq. Amaterial,z,i,j denotes the quantity of material j consumed by subproject i in engineering division z, kg or m3. EFj denotes the emission factor of material j, t CO2eq/kg or t CO2eq/m3. Mmaterial,z,i,j denotes the mass of material j transported for subproject i in engineering division z, t. For materials recorded in m3, the transported mass was obtained using the corresponding material density and converted from kilograms to tonnes. For materials recorded in kg, the recorded quantity was divided by 1000. Dj denotes the transportation distance of material j, km. EFtrans,j denotes the direct transportation emission factor assigned according to the vehicle energy type and payload, kg CO2eq/(t·km), as reported in Table S5. The factor 10−3 converts the calculated transportation emissions from kg CO2eq to t CO2eq.
Carbon emissions from on-site installation mainly include three sources. The first is fuel consumption by construction machinery, including pile-driving, earthwork, horizontal transport, lifting, concrete and mortar, and welding machinery. The second is temporary construction electricity use, including pumps, construction lighting, electric welding machines, and testing equipment. The third is fuel consumption by installation-related vehicles used for the on-site transport and handling of materials and equipment; this category excludes the off-site material transportation described above. The calculation method is as follows:
where Elecinstall,z,i,r denotes the electricity consumed by installation activity r during the on-site installation of subproject i in engineering division z, kWh. EFelec denotes the applicable provincial electricity emission factor, t CO2eq/kWh. Fuelinstall,z,i,k denotes the amount of fuel type k consumed by construction machinery or installation-related vehicles during the on-site installation of subproject i in engineering division z, kg. EFfuel,k denotes the emission factor of fuel type k, t CO2eq/kg. Fuel-related emissions were calculated using recorded fuel consumption. Equipment-specific load rates, variations in operating efficiency, and idle-time profiles were not modeled separately; their effects were included only to the extent that they were reflected in the recorded fuel consumption. The calculation therefore represents average emissions under conventional construction operating conditions.
National average emission factors were applied to materials for which province-specific data were unavailable. Shanxi-specific emission factors were applied to cement and concrete products, iron and steel products, primary aluminum, and mixed electricity. The national average material factors, transportation factors, and Shanxi-specific factors are reported in Tables S3, S4, and S5, respectively.
2.3. Carbon Emission Aggregation and Boundary Optimization
After calculating and summarizing carbon emissions from energy consumption and material consumption, the overall carbon emissions during the construction phase of the power transmission and transformation project were aggregated and analyzed at multiple levels. A contribution-based screening procedure was then applied to identify low-contribution unit data streams using a significance threshold and a critical emission ratio.
At the engineering-division level, material-related and installation-related emissions were aggregated across all subprojects using Equation (2). The resulting division-level carbon footprints were then summed using Equation (1) to obtain the total construction-phase carbon footprint. The engineering divisions included major production works, auxiliary production works, site-related works, overhead line works, and off-site transmission line works.
The contribution of each unit data stream was then calculated relative to the total construction-phase carbon footprint:
where αu denotes the contribution ratio of unit data stream u to the total construction-phase carbon footprint, %. CFu denotes the carbon footprint of unit data stream u, t CO2eq. If the contribution ratio of a unit data stream is lower than the preset significance threshold, it is identified as a low-contribution stream. Such a stream is excluded from the accounting boundary only if the cumulative emissions of all excluded streams satisfy the following constraint:
where Uexcl denotes the set of unit data streams selected for exclusion;and c denotes the critical emission ratio, %. The cumulative contribution of all unit data streams in Uexcl must not exceed c. The significance threshold for an individual unit data stream was evaluated over the range from 0.001% to 0.05% to examine its influence on the retained inventory size and cumulative emission coverage. Critical emission ratios of 5% and 1% were applied to define accounting boundaries retaining at least 95% and 99% of the total construction-phase carbon footprint, respectively. The 5% cumulative cut-off is consistent with the quantitative cut-off principle specified in the ILCD Handbook [25]. A low-contribution unit data stream was excluded only if its individual contribution was below the selected significance threshold and its exclusion did not cause the cumulative contribution of all excluded streams to exceed the corresponding critical emission ratio.
2.4. Mitigation Scenario Definition and Parameterization
Five mitigation scenarios were defined from the baseline construction-phase inventory: recycled concrete substitution, electric-arc-furnace (EAF) steel substitution, green electricity procurement, HVO-blended diesel use, and precast concrete construction. The recycled concrete and EAF steel scenarios were applied to 100% of the respective eligible material quantities to represent technical mitigation potential rather than near-term market deployment. In the combined scenario, recycled concrete substitution was first applied to 100% of the eligible concrete volume, after which the 10% reduction associated with precast concrete construction was applied to the remaining concrete emissions to avoid double counting. The recycled-concrete parameter was derived from Luo [26]. The EAF steel parameter was based on the steel-industry analysis reported by Wang et al. [20].
For the green-electricity scenario, electricity volumes matched with retired and verifiable renewable electricity attributes were assigned a zero-emission factor under a market-based accounting approach [27]. Electricity consumption not covered by such attributes was calculated using the applicable grid emission factor. The diesel scenario assumed a 5% HVO blend in eligible diesel consumption based on the reported life-cycle emission benefits of HVO integration [28]. The precast-concrete scenario applied a 10% emission-intensity reduction to eligible components [29]. In the combined scenario, the five measures were applied sequentially to the applicable activities, with the precast-concrete reduction calculated from the remaining concrete emissions after recycled concrete substitution. The total reduction was then recalculated from the remaining baseline emissions. Detailed scenario parameters and applicability conditions are reported in Table S8 of the Supplementary Information.
3. Results
3.1. Construction-Phase Carbon Emission Characteristics
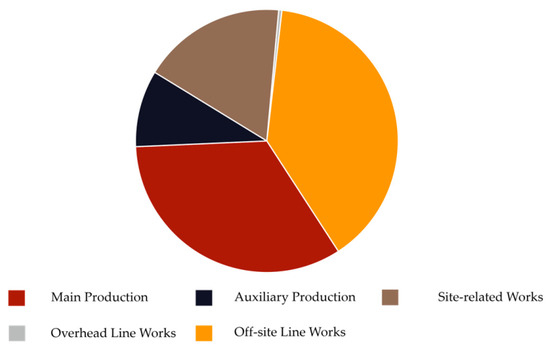
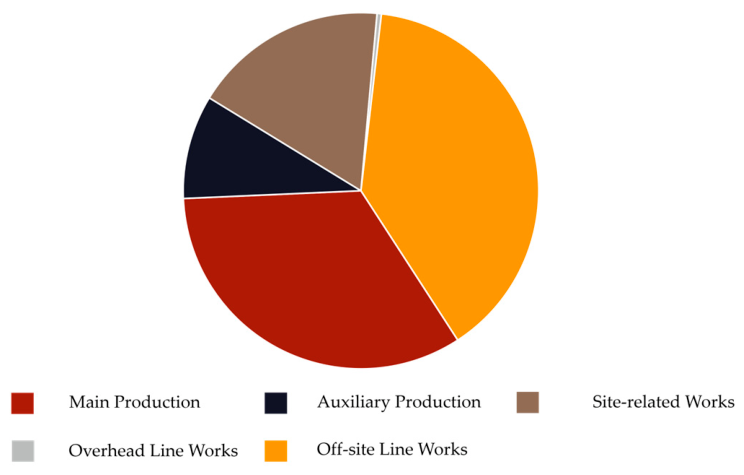
Carbon emission accounting was conducted for the construction phase of the studied 1000 kV power transmission and transformation project. The total construction-phase carbon footprint was 1.92 × 10⁵ t CO2eq. As shown in Figure 2, off-site transmission line works contributed the largest share, accounting for 39.40% of the total, followed by major production works at 33.79%. Together, these two divisions accounted for 73.19% of total construction-phase emissions.
Figure 2.
Construction-phase carbon-emission contributions by engineering division.
Auxiliary production works, site-related works, and overhead line works contributed smaller shares, jointly accounting for 26.81% of total emissions. This distribution indicates that construction-phase emissions were concentrated in a limited number of engineering divisions rather than evenly distributed across the project. Within off-site transmission line works, tower structures, foundation works, conductor installation, and distributed construction activities represented the main emission-related work components.
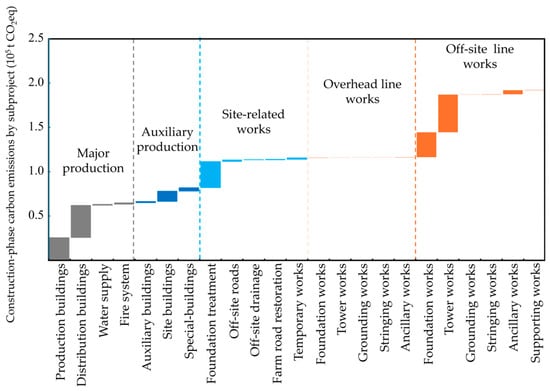
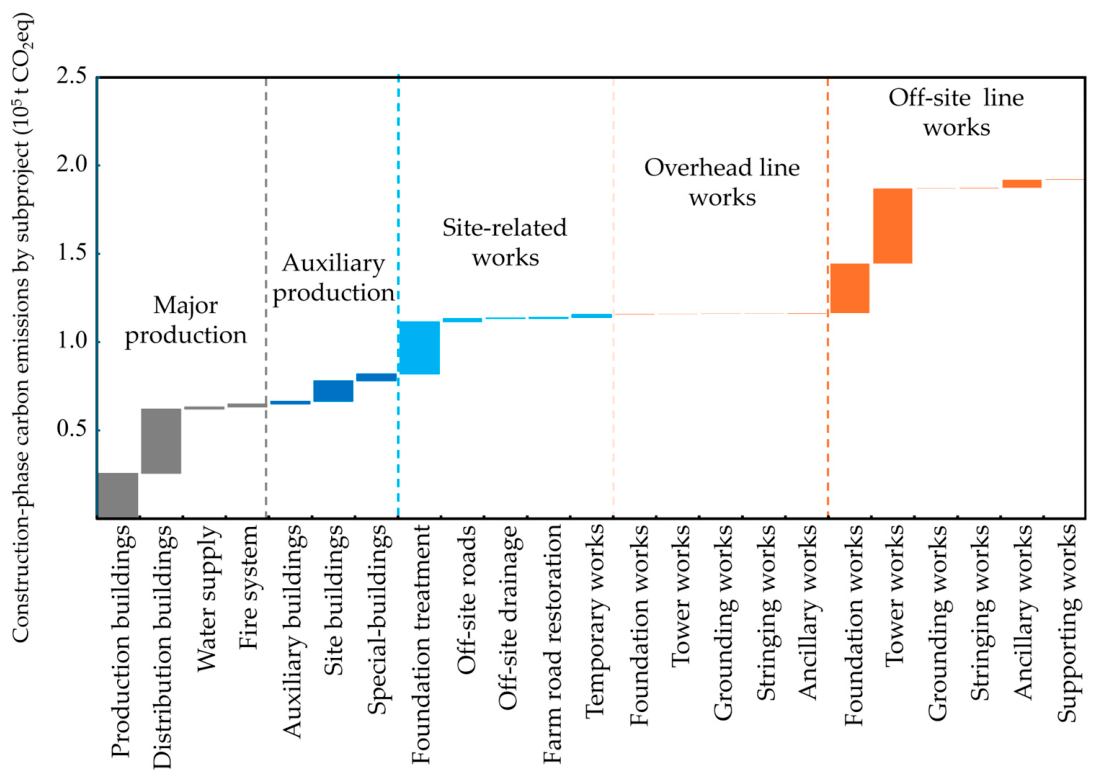
At the subproject level, the concentration of emissions became more evident. As shown in Figure 3, tower works in the off-site transmission line division had the highest emissions, reaching 4.25 × 10⁴ t CO2eq. This accounted for 55.07% of emissions within this division and 22.09% of the total project footprint. Distribution buildings and production buildings in major production works emitted 3.64 × 10⁴ t CO2eq and 2.57 × 10⁴ t CO2eq, respectively.
Figure 3.
Construction-phase carbon emissions by subproject.
3.2. Material-Related Carbon Emission Characteristics
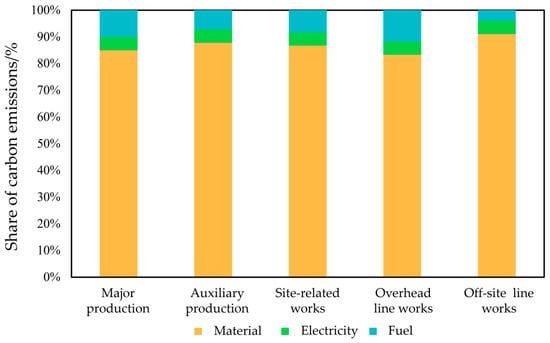
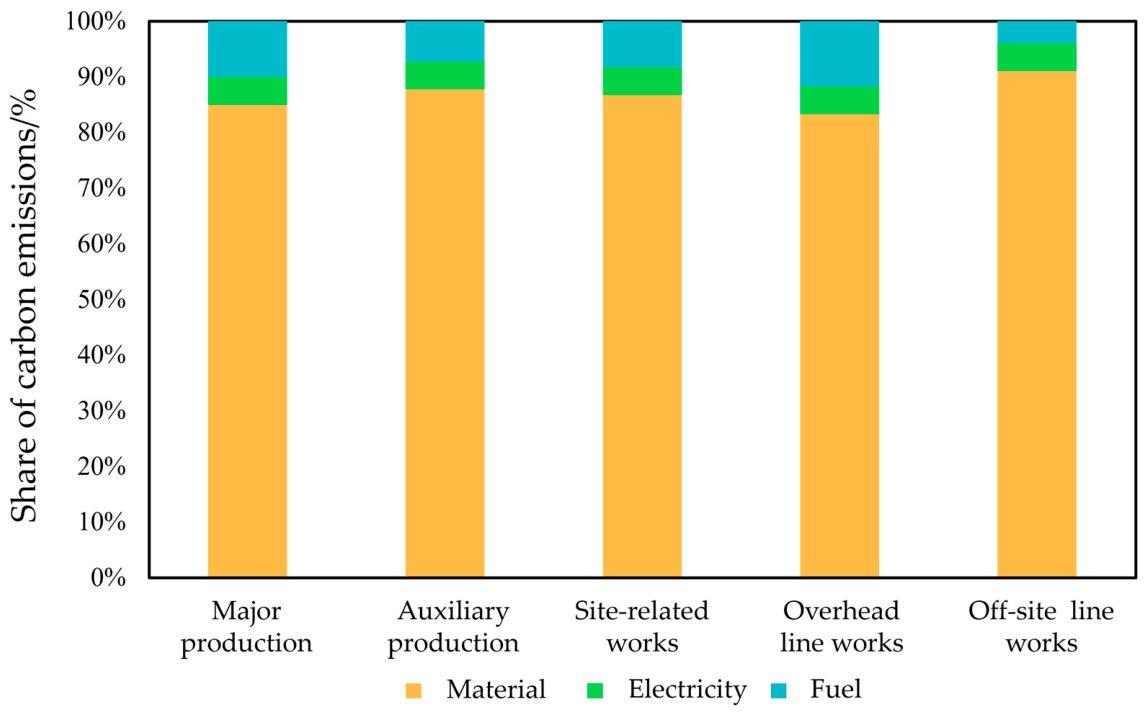
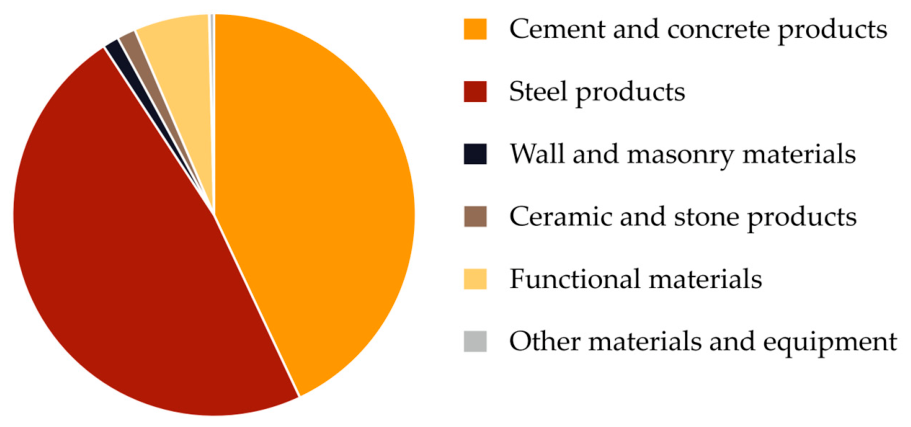
Material-production emissions dominated across all engineering divisions. As shown in Figure 4, their contributions ranged from 82.51% to 90.72%. Off-site transportation contributed 4.28–12.49%. As shown in Figure 5, steel products and cement-concrete products were the two largest material sources. Steel products contributed 8.45 × 10⁴ t CO2eq, while cement-concrete products contributed 6.60 × 10⁴ t CO2eq. Together, they accounted for 89.78% of material-production emissions. Other material categories, including wall and masonry materials, ceramic and stone products, functional materials, plastic and resin materials, non-ferrous metals, and other equipment, made relatively small individual contributions.
Figure 4.
Emission-source composition of construction-phase carbon emissions by engineering division.
Figure 5.
Composition of material-production carbon emissions in power transmission and transformation projects. For visualization in Figure 5, plastic and resin materials were combined with non-ferrous metals and other equipment as “Other materials and equipment” because of their small individual contributions.
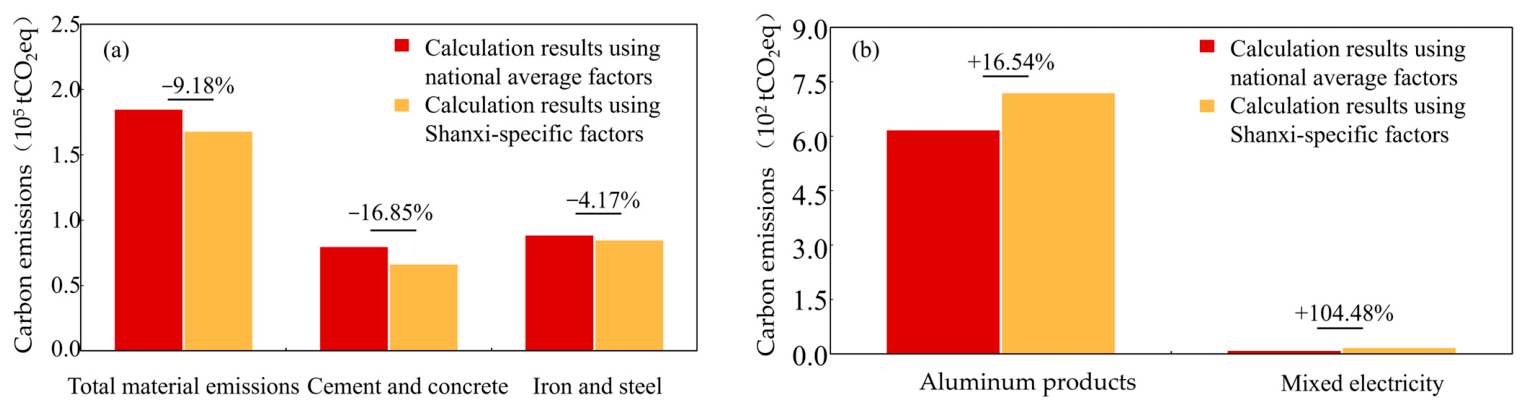
The use of Shanxi-specific emission factors changed the calculated results compared with national average factors. As shown in Figure 6, total material emissions decreased from 1.85 × 10⁵ t CO2eq to 1.68 × 10⁵ t CO2eq, representing a reduction of 9.18%. Cement-concrete emissions decreased by 16.85%, and iron and steel emissions decreased by 4.17%. In contrast, aluminum-product emissions increased by 16.54%, and mixed-electricity emissions increased by 104.48%.
Figure 6.
Comparison of calculation results using national average factors and Shanxi-specific emission factors. (a) total material emissions and emissions from cement and concrete products and iron and steel products; (b) emissions from aluminum products and mixed electricity.
3.3. Boundary Optimization Results
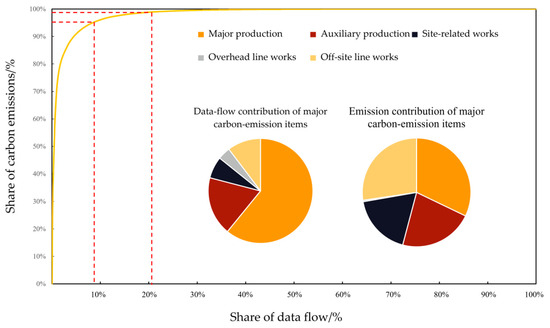
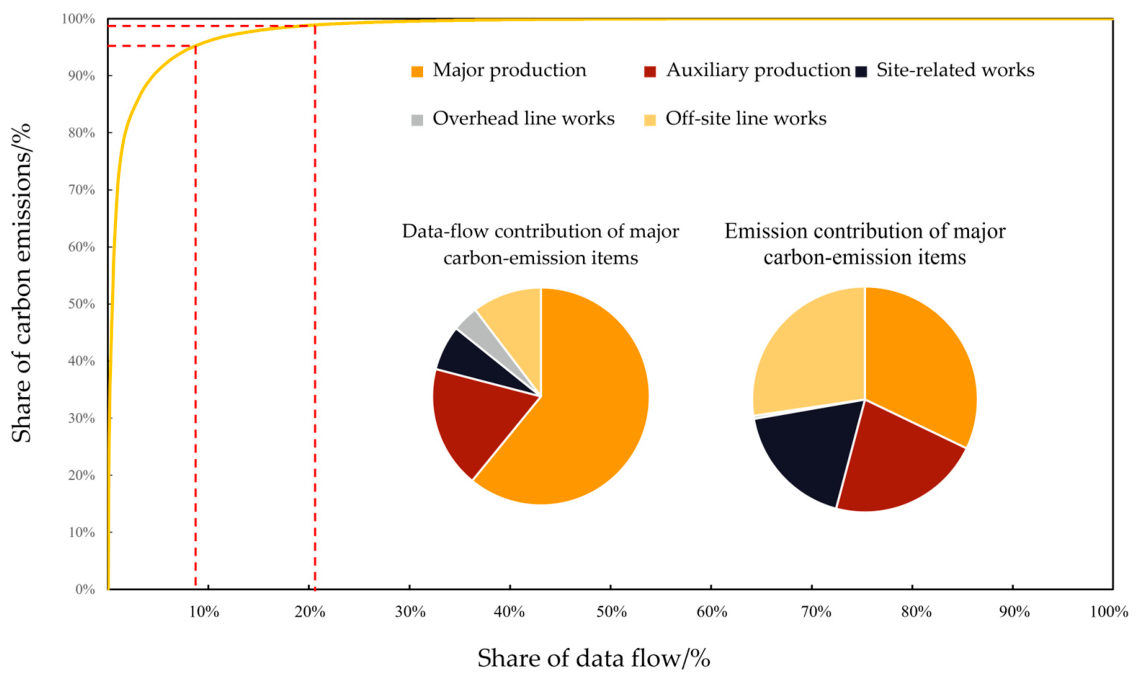
The construction-phase inventory comprised 1658-unit data streams with highly uneven emission contributions. As shown in Figure 7, the cumulative emission coverage increased rapidly with the inclusion of the highest-contribution streams and then gradually approached a plateau. Under the 95% accounting boundary, 140-unit data streams, representing 8.44% of the complete inventory, were retained and provided an actual emission coverage of 95.04%. Increasing the required coverage to 99% increased the retained inventory to 358 streams, corresponding to 21.59% of all streams and an actual coverage of 99.00%.
Figure 7.
Cumulative emission coverage and retained data-stream composition for the 95% and 99% accounting boundaries.
The sensitivity analysis showed that increasing the significance threshold progressively reduced the retained inventory. When the threshold increased from 0.001% to 0.045%, the number of retained unit data streams under the 95% boundary decreased from 672 (40.53% of all streams) to 140 (8.44%), while the achieved emission coverage decreased from 99.83% to 95.04%. Under the 99% boundary, the critical emission ratio became the controlling constraint when the significance threshold reached 0.010%. The retained inventory subsequently remained stable at 358 streams (21.59%), with an emission coverage of approximately 99.00%. Increasing the threshold from 0.045% to 0.050% produced no further change in the 95% boundary, indicating that the retained inventory had also stabilized at this coverage level. Detailed sensitivity results are provided in Table S7.
The contribution-based ranking of the unit data streams remained unchanged because it was determined by their calculated emission contributions; changing the significance threshold affected only whether streams near the cut-off boundary were retained or excluded. Compared with the 95% boundary, achieving 99% coverage required 218 additional data streams, although these streams collectively contributed only approximately 3.96% of the total construction-phase emissions. Within the 99% boundary, the retained streams were mainly associated with major production works, off-site transmission line works, and auxiliary production works. These categories were consistent with the dominant engineering divisions identified in Section 3.1, indicating that the screening procedure retained the principal emission structure of the project while substantially reducing the number of data streams requiring detailed accounting.
3.4. Mitigation Potential Under Multiple Pathways
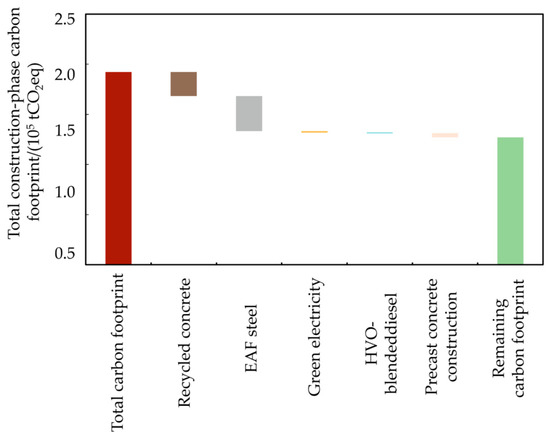
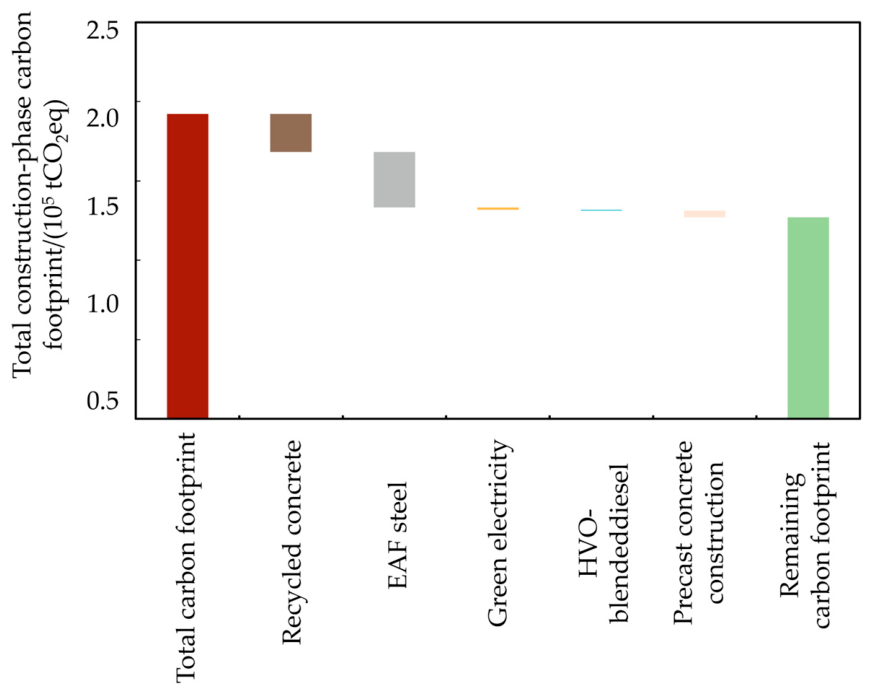
Five mitigation pathways were evaluated to estimate the potential reduction in construction-phase carbon emissions. As shown in Figure 8, the combined scenario reduced the total construction-phase carbon footprint from 1.92 × 10⁵ t CO2eq to 1.27 × 10⁵ t CO2eq, corresponding to an overall reduction of 33.92% relative to the baseline scenario. Recycled concrete substitution reduced emissions by 2.40 × 10⁴ t CO2eq, whereas EAF steel substitution reduced emissions by 3.52 × 10⁴ t CO2eq. These two pathways provided the largest individual reductions and accounted for most of the total mitigation potential.
Figure 8.
Technical mitigation potential of individual and combined construction-phase emission-reduction scenarios.
Green electricity procurement, HVO-blended diesel use, and precast concrete construction also reduced construction-phase carbon emissions. Their individual reduction effects were smaller than those of recycled concrete and EAF steel substitutions.
4. Discussion
The results of this study show that construction-phase carbon emissions from power transmission and transformation projects are jointly shaped by engineering hierarchy, material demand, and regional emission-factor selection. The project footprint was not evenly distributed across the construction system. Instead, emissions were concentrated in off-site transmission line works, major production works, and several key subprojects, including tower works, production buildings, and distribution buildings. This pattern suggests that project-level carbon accounting should not stop at an aggregated footprint. For engineering practice, it is necessary to identify where emissions are generated within the project structure, because mitigation measures are implemented through specific engineering units rather than through the project as a whole.
The concentration of emissions in transmission line and production-related works reflects the engineering characteristics of power grid infrastructure. Off-site transmission line works involve repeated tower structures, foundation construction, conductor installation, transportation, and distributed construction activities along the route. Major production works include buildings and equipment-support structures that require substantial quantities of steel, cement, and concrete. These components are functional parts required for mechanical strength, electrical safety, durability, and long-term operational stability. Therefore, the high contribution of these divisions should be understood as the interaction between carbon-intensive material production and the technical requirements of high-voltage power infrastructure.
The dominance of material-related emissions is consistent with previous embodied-carbon studies of buildings and infrastructure. Conventional process-based life-cycle assessment frameworks generally organize emissions by life-cycle stage or material category [30], whereas BIM–LCA frameworks provide a more detailed connection between material quantities, building components, and carbon emissions [15,16]. However, these frameworks generally do not map emissions simultaneously to the engineering divisions, subprojects, and unit data streams used in the management of power transmission and transformation projects. The present framework addresses this difference by linking material production, off-site transportation, and on-site installation emissions to this three-level engineering hierarchy, followed by contribution-based boundary screening. This structure is tailored to power transmission and transformation projects because it accommodates the combined organization of substation works and transmission-line works, including production buildings, equipment supports, foundations, towers, roads, and auxiliary facilities. Although the numerical emission shares and hotspot rankings obtained from the Shanxi case are project-specific, the accounting structure and screening procedure can be transferred to projects with different voltage levels and regional supply chains by replacing the engineering quantities, transportation distances, construction records, and applicable emission factors. The generalizable contribution of the case study therefore lies in the hierarchical accounting and boundary-screening method rather than in treating its numerical results as universal benchmarks.
The substantial increase in mixed-electricity emissions after factor regionalization reflects the spatial heterogeneity of China’s electricity system rather than a change in project electricity consumption. Liu et al. [18] demonstrated that electricity-related carbon intensity is influenced by coal quality, plant-level characteristics, transmission and distribution losses, and emission transfers associated with interprovincial coal and electricity trade. These mechanisms are particularly relevant to Shanxi, which is one of China’s major electricity-generation and associated emission sources. A recent interprovincial-grid study also reported that the average electricity-consumption carbon footprint factor of the North China grid was higher than the national average, largely because of its coal-dominated generation structure [31]. Differences in provincial coal-fired generation technologies may further contribute to spatial variations in life-cycle emission factors [32]. Therefore, applying a Shanxi-specific factor can substantially increase the estimated electricity-related emissions relative to the national average, indicating that national factors may obscure the effects of regional generation structures and interprovincial electricity flows.
The implication is that emission-factor selection should be aligned with the accounting purpose. National average factors are useful when the objective is cross-project comparison or when local data are unavailable. Province-specific factors are more suitable when the objective is local project management, procurement optimization, or provincial mitigation planning. This distinction is important for construction-phase accounting because many construction materials and electricity inputs are linked to regional production and supply systems. Therefore, carbon accounting reports should clearly document the geographic scope, system boundary, unit, and data year of emission factors. Without this information, differences in accounting results may be incorrectly attributed to engineering design rather than to factor selection.
The boundary screening analysis provides a practical basis for prioritizing data collection and verification within the construction-phase accounting framework. A power transmission and transformation project contains many material, transportation, electricity, and fuel data streams. Full-boundary accounting can improve completeness, but it may also create a large verification burden when many items have very small contributions. Contribution-based screening can help prioritize data collection and quality control toward high-impact materials, subprojects, transport assumptions, and emission factors. Low-contribution items should only be simplified when their cumulative contribution remains within a defined threshold, so that accounting remains both transparent and usable.
The mitigation scenario analysis identifies the technical reduction potential of measures targeting the dominant emission sources rather than predicting their near-term deployment. Recycled concrete and EAF steel substitution produced the largest reductions because they directly affected the material categories responsible for most construction-phase emissions. Realizing these potentials in practice would require compliance with structural safety and durability standards, verification of material performance, and stable supplies of qualified recycled concrete and EAF steel. Green-electricity procurement depends on the availability and retirement of credible renewable electricity attributes and on applicable market rules. HVO blending depends on regional fuel availability, compatibility with construction machinery, and procurement cost, whereas precast construction depends on component standardization, transportation and lifting capacity, and site assembly conditions. More generally, implementation may also be limited by regional production capacity, procurement requirements, transportation distances, and the availability of certified suppliers. The substitution rates used in Figure 8 should therefore be interpreted as upper-bound technical scenarios, while feasible deployment rates would need to be determined for individual projects.
Construction mitigation measures should be evaluated across life-cycle phases and in relation to their environmental, economic, and social implications [33]. Comparative life cycle assessment indicates that the benefits of recycled concrete depend on concrete composition, aggregate substitution, and transportation conditions [34]. In the steel sector, energy efficiency and material efficiency represent complementary routes for reducing emissions [35]. The decarbonization of cement and concrete similarly requires a combination of material efficiency, energy transition, clinker substitution, and improvements in production technology [36]. Among these measures, scalable eco-efficient cement systems can reduce emissions by lowering clinker demand while retaining the performance required for construction applications [37]. Previous comparisons of off-site prefabrication and conventional construction have also demonstrated the potential for prefabrication to reduce construction-stage greenhouse gas emissions [38]. These interventions are consistent with circular-economy practices in construction, although their implementation may be constrained by data availability, organizational capacity, and technology-adoption barriers [39].
Several limitations should be acknowledged. First, the case project represents one voltage level and one provincial context. Projects with different routes, tower types, terrain conditions, substation layouts, construction distances, or supply chains may show different hotspot patterns. Second, some emission factors remain dependent on available databases, especially for materials without complete provincial data. Third, the mitigation pathways were evaluated as scenario estimates, and their implementation would depend on technical standards, market availability, cost constraints, procurement policy, and construction organization. Future studies should apply the framework to more project types, improve province-level emission-factor databases, and connect carbon accounting with digital bills of quantities or project management systems. These extensions would improve the traceability, comparability, and practical use of construction-phase carbon accounting for power grid infrastructure.
5. Conclusions
This study developed a construction-phase carbon emission accounting framework for power transmission and transformation projects and applied it to a representative 1000 kV project in Shanxi Province, China. The framework defined a construction-specific boundary covering material production, material transportation, construction electricity use, machinery fuel use, and installation-related vehicle fuel use, and incorporated Shanxi-specific emission factors to improve regional representativeness.
The results show that the total construction-phase carbon footprint was 1.92 × 10⁵ t CO2eq, with material-production emissions accounting for 87.23%. Off-site transmission line works and major production works were the dominant engineering divisions, while tower works represented the largest single subproject source. Steel products and cement-concrete products jointly contributed 89.78% of material-production emissions. Compared with national average factors, Shanxi-specific factors reduced estimated total material emissions by 9.18% and changed source-level contributions, highlighting the importance of province-specific factor selection.
The boundary screening analysis showed that a small proportion of the data streams accounted for most cumulative emissions, supporting more efficient data collection and verification. The mitigation scenario analysis further indicated that combining low-carbon material substitution, energy substitution, and construction-process optimization could reduce the project footprint, with recycled concrete and EAF steel substitution providing the largest reductions. These findings suggest that clear construction-phase boundaries and regionally representative factors can support hotspot identification, low-carbon procurement, and construction management for power grid infrastructure.
Supplementary Materials
The following supporting information can be downloaded at: https://www.mdpi.com/article/10.3390/su182110773/s1, Table S1: Included and excluded processes in the construction-phase carbon accounting boundary; Table S2: Classification and specific components of major construction materials during substation construction; Table S3: Carbon footprint factors of construction materials; Table S4: Transportation emission factors by vehicle energy type; Table S5: Shanxi-specific emission factors applied in the calculation; Table S6: Summary of project activity inventories used in the construction-phase carbon footprint accounting; Table S7: Sensitivity of the retained inventory to the significance threshold and critical emission ratio; Table S8: Parameterization of construction-phase mitigation scenarios. References cited in the Supplementary Information are included in the main reference list [18,19,20,21,26,27,28,29].
Author Contributions
Conceptualization, G.W. and K.L.; methodology, G.W., D.H. and R.T.; formal analysis, G.W., D.H. and R.T.; investigation, G.W., Y.Z. and C.J.; data curation, D.H., R.T. and Y.Z.; writing—original draft preparation, G.W.; writing—review and editing, G.W., C.J. and K.L.; visualization, D.H. and R.T.; project administration, D.H. and C.J.; supervision, K.L.; funding acquisition, K.L. All authors have read and agreed to the published version of the manuscript.
Funding
This research was funded by the Science and Technology Project of State Grid Shanxi Electric Power Company, China (No. SGSXJS00XYJS2500217).
Data Availability Statement
The aggregated data supporting the findings of this study are provided in the article and Supplementary Information. Item-level engineering quantity, procurement, and construction records contain commercially sensitive project information and are therefore not publicly available. Access to these records may be considered upon reasonable request to the corresponding author, subject to permission from the data owner.
Conflicts of Interest
Guoxuan Wang, Yan Zhou, and Dongfeng Han are employed by State Grid Shanxi Electric Power Company. The remaining authors declare no conflicts of interest. State Grid Shanxi Electric Power Company funded the study and was involved in the study design, enterprise surveys, and the collection of industrial activity data.
References
- Byles, D.; Mohagheghi, S. Sustainable Power Grid Expansion: Life Cycle Assessment, Modeling Approaches, Challenges, and Opportunities. Sustainability 2023, 15, 8788. [Google Scholar] [CrossRef] [Scilit]
- Ma, J. Growing the power system: Expansions on transmission and distribution systems for deep electrification. iScience 2025, 28, 112662. [Google Scholar] [CrossRef] [Scilit]
- Lei, X.; Zhong, J.; Chen, Y.; Shao, Z.; Jian, L. Grid Integration of Electric Vehicles within Electricity and Carbon Markets: A Comprehensive Overview. eTransportation 2025, 25, 100435. [Google Scholar] [CrossRef] [Scilit]
- Maris, T.I.; Fotis, G.; Mladenov, V. The Electrical Energy Transition in Europe: Risks, Impacts, and Scenarios for Its Future Implementation. In Proceedings of the 2025 17th Electrical Engineering Faculty Conference-Energetics and Efficiency (BulEF), Golden Sands Resort, Varna, Bulgaria, 10–13 September 2025. [Google Scholar] [CrossRef] [Scilit]
- Kiani Mavi, R.; Gengatharen, D.; Kiani Mavi, N.; Hughes, R.; Campbell, A.; Yates, R. Sustainability in Construction Projects: A Systematic Literature Review. Sustainability 2021, 13, 1932. [Google Scholar] [CrossRef] [Scilit]
- Che, W.; Wang, Y.; Zhu, W.; Hong, L.; Fang, C.; Wu, H.; Liu, J. A Review of Carbon Emission Reduction During the Operation Stage of Substations. Sustainability 2024, 16, 10017. [Google Scholar] [CrossRef] [Scilit]
- Wang, Z.; Zhang, Y.; Wang, J.; Zhang, Y.; Zhao, J. Carbon footprint calculation for power transmission and distribution equipment: A comprehensive review of methodologies, standards, and applications. Resour. Conserv. Recycl. Adv. 2025, 28, 200295. [Google Scholar] [CrossRef] [Scilit]
- Wu, Y.; Zhang, C.; Liu, Y.; Deng, W.; Jike, S.; Liu, F. Carbon Accounting in Construction Engineering: Methodology and Applications. Sustainability 2025, 17, 5090. [Google Scholar] [CrossRef] [Scilit]
- Jorge, R.S.; Hawkins, T.R.; Hertwich, E.G. Life Cycle Assessment of Electricity Transmission and Distribution—Part 1: Power Lines and Cables. Int. J. Life Cycle Assess. 2012, 17, 9–15. [Google Scholar] [CrossRef] [Scilit]
- Jorge, R.S.; Hawkins, T.R.; Hertwich, E.G. Life Cycle Assessment of Electricity Transmission and Distribution—Part 2: Transformers and Substation Equipment. Int. J. Life Cycle Assess. 2012, 17, 184–191. [Google Scholar] [CrossRef] [Scilit]
- Pomponi, F.; Moncaster, A. Embodied Carbon Mitigation and Reduction in the Built Environment: What Does the Evidence Say? J. Environ. Manag. 2016, 181, 687–700. [Google Scholar] [CrossRef] [Scilit]
- Rock, M.; Saade, M.R.M.; Balouktsi, M.; Rasmussen, F.N.; Birgisdottir, H.; Frischknecht, R.; Habert, G.; Lutzkendorf, T.; Passer, A. Embodied GHG emissions of buildings: The hidden challenge for effective climate change mitigation. Appl. Energy 2020, 258, 114107. [Google Scholar] [CrossRef] [Scilit]
- Pons-Valladares, O.; Nikolic, J. Sustainable Design, Construction, Refurbishment and Restoration of Architecture: A Review. Sustainability 2020, 12, 9741. [Google Scholar] [CrossRef] [Scilit]
- Cabeza, L.F.; Rincón, L.; Vilariño, V.; Pérez, G.; Castell, A. Life Cycle Assessment and Life Cycle Energy Analysis of Buildings and the Building Sector: A Review. Renew. Sustain. Energy Rev. 2014, 29, 394–416. [Google Scholar] [CrossRef] [Scilit]
- Lu, K.; Jiang, X.; Tam, V.W.Y.; Li, M.; Wang, H.; Xia, B.; Chen, Q. Development of a Carbon Emissions Analysis Framework Using Building Information Modeling and Life Cycle Assessment for the Construction of Hospital Projects. Sustainability 2019, 11, 6274. [Google Scholar] [CrossRef] [Scilit]
- Yang, X.; Hu, M.; Wu, J.; Zhao, B. Building-information-modeling enabled life cycle assessment, a case study on carbon footprint accounting for a residential building in China. J. Clean. Prod. 2018, 183, 729–743. [Google Scholar] [CrossRef] [Scilit]
- Xiong, X.; Xu, M.; Li, X. Impact Factors of Embodied Carbon from the Materialization of Residences in China: Consensuses, Controversies and Understudies. Sustain. Cities Soc. 2026, 136, 107048. [Google Scholar] [CrossRef] [Scilit]
- Liu, K.; Wang, K.; Wang, S.; Wu, Q.; Hao, J. Tracking Carbon Flows from Coal Mines to Electricity Users in China Using an Ensemble Model. Environ. Sci. Technol. 2023, 57, 12242–12250. [Google Scholar] [CrossRef] [Scilit]
- Liu, S.; Xiong, S.; Wang, K.; Liu, K.; Chen, X.; Wang, X.; Xu, G.; Liu, J. Synergistic Mitigation Potential of Carbon and Air Pollutants in China’s Cement Industry: A Perspective from Material-Energy Flows. J. Clean. Prod. 2025, 521, 146209. [Google Scholar] [CrossRef] [Scilit]
- Wang, K.; Liu, S.; Liu, K.; Mo, D.; Ji, X.; Lu, Y.; Xing, Y. Tracking Carbon Flows in China’s Iron and Steel Industry. Environ. Sci. Technol. 2023, 57, 11510–11519. [Google Scholar] [CrossRef] [Scilit]
- Bai, X.; Jia, S.; Su, H.; Liu, Y.; Xu, M.; Liu, Z.; Li, P.; Liu, K. Spatiotemporal Evolution, Driving Mechanisms, and Scenario Analysis of Carbon and Pollutant Emissions in China’s Aluminum Industry Chain. Res. Environ. Sci. 2026, 39, 1256–1266. [Google Scholar] [CrossRef]
- Bertolini, M.; Duttilo, P.; Lisi, F. Accounting carbon emissions from electricity generation: A review and comparison of emission factor-based methods. Appl. Energy 2025, 392, 125992. [Google Scholar] [CrossRef] [Scilit]
- Araujo, A.G.; Carneiro, A.M.P.; Palha, R.P. Sustainable Construction Management: A Systematic Review of the Literature with Meta-Analysis. J. Clean. Prod. 2020, 256, 120350. [Google Scholar] [CrossRef] [Scilit]
- Niu, S.; Yu, H.; Niu, S.; Jian, L. Power Loss Analysis and Thermal Assessment on Wireless Electric Vehicle Charging Technology: The Over-Temperature Risk of Ground Assembly Needs Attention. Appl. Energy 2020, 275, 115344. [Google Scholar] [CrossRef] [Scilit]
- European Commission; Joint Research Centre; Institute for Environment and Sustainability. International Reference Life Cycle Data System (ILCD) Handbook: General Guide for Life Cycle Assessment—Detailed Guidance; EUR 24708 EN; Publications Office of the European Union: Luxembourg, 2010. [Google Scholar] [CrossRef]
- Luo, Z.X. Study on Calculation Method of Building Life Cycle CO2 Emission and Emission Reduction Strategies. Ph.D. Thesis, Xi’an University of Architecture and Technology, Xi’an, China, 2016. [Google Scholar]
- Paris, A.; Hechelmann, R.-H.; Buchenau, N. Exploring the Effect of Guarantees of Origin on the Decarbonization of Corporate Electricity Procurement: A Case Study of Germany and Norway. J. Ind. Ecol. 2024, 28, 1657–1669. [Google Scholar] [CrossRef] [Scilit]
- Kourkoumpas, D.-S.; Sagani, A.; Vallianatos, A.; Kiartzis, S.; Karellas, S.; Dedoussis, V.; Grammelis, P. Life Cycle GHG Emission Reduction of Hydrotreated Vegetable Oil Integration in an Industrial Petroleum Refinery. Green Technol. Sustain. 2024, 2, 100076. [Google Scholar] [CrossRef] [Scilit]
- Dong, Y.H.; Jaillon, L.; Chu, P.; Poon, C.S. Comparing Carbon Emissions of Precast and Cast-in-Situ Construction Methods: A Case Study of a High-Rise Private Building. Constr. Build. Mater. 2015, 99, 39–53. [Google Scholar] [CrossRef] [Scilit]
- Cheng, S.; Zhou, X.; Zhou, H. Study on Carbon Emission Measurement in Building Materialization Stage. Sustainability 2023, 15, 5717. [Google Scholar] [CrossRef] [Scilit]
- Yang, Y.; Zhou, P.; Wang, H. Carbon emissions from electricity consumption in interprovincial grids of China: An electricity-extended input-output analysis. Energy Policy 2026, 208, 114907. [Google Scholar] [CrossRef] [Scilit]
- Li, J.; Wang, Y.; Xu, D.; Xie, K. High-resolution analysis of life-cycle carbon emissions from China’s coal-fired power industry: A provincial perspective. Int. J. Greenh. Gas Control 2020, 100, 103110. [Google Scholar] [CrossRef] [Scilit]
- Srivastava, S.; Raniga, U.I.; Misra, S. A Methodological Framework for Life Cycle Sustainability Assessment of Construction Projects Incorporating TBL and Decoupling Principles. Sustainability 2022, 14, 197. [Google Scholar] [CrossRef] [Scilit]
- Knoeri, C.; Sanyé-Mengual, E.; Althaus, H.-J. Comparative LCA of Recycled and Conventional Concrete for Structural Applications. Int. J. Life Cycle Assess. 2013, 18, 909–918. [Google Scholar] [CrossRef] [Scilit]
- Milford, R.L.; Pauliuk, S.; Allwood, J.M.; Müller, D.B. The Roles of Energy and Material Efficiency in Meeting Steel Industry CO2 Targets. Environ. Sci. Technol. 2013, 47, 3455–3462. [Google Scholar] [CrossRef] [Scilit]
- Habert, G.; Miller, S.A.; John, V.M.; Provis, J.L.; Favier, A.; Horvath, A.; Scrivener, K.L. Environmental Impacts and Decarbonization Strategies in the Cement and Concrete Industries. Nat. Rev. Earth Environ. 2020, 1, 559–573. [Google Scholar] [CrossRef] [Scilit]
- Scrivener, K.L.; John, V.M.; Gartner, E.M. Eco-Efficient Cements: Potential Economically Viable Solutions for a Low-CO2 Cement-Based Materials Industry. Cem. Concr. Res. 2018, 114, 2–26. [Google Scholar] [CrossRef] [Scilit]
- Mao, C.; Shen, Q.; Shen, L.; Tang, L. Comparative Study of Greenhouse Gas Emissions between Off-Site Prefabrication and Conventional Construction Methods: Two Case Studies of Residential Projects. Energy Build. 2013, 66, 165–176. [Google Scholar] [CrossRef] [Scilit]
- Thirumal, S.; Udawatta, N.; Karunasena, G.; Al-Ameri, R. Barriers to Adopting Digital Technologies to Implement Circular Economy Practices in the Construction Industry: A Systematic Literature Review. Sustainability 2024, 16, 3185. [Google Scholar] [CrossRef] [Scilit]
Disclaimer/Publisher’s Note: The statements, opinions and data contained in all publications are solely those of the individual author(s) and contributor(s) and not of MDPI and/or the editor(s). MDPI and/or the editor(s) disclaim responsibility for any injury to people or property resulting from any ideas, methods, instructions or products referred to in the content. |
© 2026 by the authors. Licensee MDPI, Basel, Switzerland. This article is an open access article distributed under the terms and conditions of the Creative Commons Attribution (CC BY) license.