


Abstract
Source reduction of volatile organic compounds (VOCs) can advance sustainable manufacturing, but technology adoption, project completion, and environmental cost attribution require distinct assessment. We integrated 278 plant-level records (270 enterprises), 19 projects, and three verified cases to examine adoption stages, generation-side VOC reduction, capital efficiency, and annualized social net cost. Two sequential logistic models distinguished entry into implementation/planning from completion conditional on entry. Of the participating plants, 63.3% had entered implementation/planning, and 27.7% reported completion; 62.5% of the entered plants combined material substitution with process modification. Perceived economic benefits were positively associated with entry (odds ratio [OR] = 2.12), whereas baseline VOC emissions ≥ 3 t·a−1 (OR = 0.27) and reported technical barriers (OR = 0.45) were negatively associated with completion conditional on entry. Capital-efficiency descriptors spanned approximately three orders of magnitude among 14 calculable projects. At a 5% discount rate, a 10-year lifetime, and full attribution of project capital, the three verified cases yielded annualized social net costs of approximately CNY 2.80, −0.01, and −2.90 million per year. For one multifunctional upgrade, the modeled break-even environmental investment share was 15.1%. The framework links implementation monitoring, activity-adjusted source reduction, cost attribution, and qualitative screening for life-cycle burden shifting to support sustainable-manufacturing decisions.
1. Introduction
Volatile organic compounds (VOCs) contribute to ground-level ozone and secondary organic aerosol formation. Although industrial VOC emission intensity in China has decreased, manufacturing and solvent use remain important sources, and emission inventories, activity data, and fugitive-emission estimates still contain considerable uncertainty [1,2,3]. Whole-process VOC governance therefore extends beyond end-of-pipe removal to raw and auxiliary materials, production operations, collection systems, and terminal treatment. Generation-side VOC reduction differs from end-of-pipe control: it reduces the VOC mass generated by the production process itself. Its sustainability value depends not only on reduced emissions but also on resource use, cost-effectiveness, energy and carbon consequences, and compliance with regulatory requirements.
The technical scope of source reduction extends beyond low-VOC material substitution to precision feeding, automated spraying and printing, closed-loop cleaning, product/process redesign, and elimination of VOC-intensive steps. Regulatory obligations, available capital, expected return on investment, and product-performance constraints shape whether these measures are economically and technically viable. Studies of packaging and printing show that source, process, and terminal measures jointly influence reduction potential and cost structure [4,5,6]; production technologies also affect emission factors and VOC chemical profiles [7,8]. Electronics manufacturing and surface coatings similarly show process-specific features [9,10]. Thus, source reduction is a manufacturing-technology choice that must meet environmental requirements while preserving product quality, productivity, customer acceptance, and regulatory compliance.
Two accounting boundaries are easily conflated. First, lower VOC emissions do not necessarily imply better environmental performance across the product life cycle. Life-cycle assessment (LCA) of automotive coatings indicates that VOC-control and carbon outcomes may move together or in opposite directions [11]; related studies identify energy, upstream materials, and waste management as important burdens [12,13,14,15,16,17]. Second, capital expenditure for multifunctional projects cannot automatically be attributed entirely to environmental protection. Equipment renewal, capacity expansion, and quality improvements may be important motivations for investment, so total capital divided by VOC reduction can exaggerate an attributable environmental cost. An auditable analysis must specify the counterfactual production investment, costs, expected financial returns, regulatory constraints, system boundaries, and the actors bearing costs [18,19,20].
China-focused evidence documents the co-benefits of pollution control and climate mitigation [21,22,23,24], heterogeneity in regulatory abatement costs [25], and related air-quality and health effects [26]. Research on cleaner-production adoption also links implementation decisions to financial capacity, regulation, managerial perceptions, and technology readiness [27,28,29,30,31,32]. Reported VOC source-reduction status encompasses distinct states: no near-term plan, implementing/planned, and completed. This distinction enables stage-specific associations to be examined without interpreting cross-sectional status as a longitudinal transition.
This study connects reported adoption status, generation-side VOC reduction, project capital efficiency, and environmental cost attribution through three distinct empirical tiers. It asks: (1) which characteristics are associated with entry into implementation/planning and with completion conditional on entry; (2) how project-level capital-efficiency estimates vary and how data quality limits their comparability; and (3) how the environmental share of investment and verified direct savings influence annualized social net cost in multifunctional upgrades. The life-cycle component identifies potential burden shifting; it is a qualitative screening tool, not a completed cross-industry LCA. The proposed sequence is intended to support sustainable-manufacturing decisions while keeping causal, sampling, and environmental accounting boundaries explicit.
2. Materials and Methods
2.1. Overall Research Framework and Evidence Levels
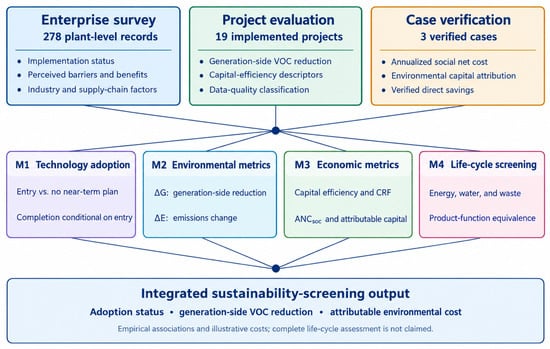
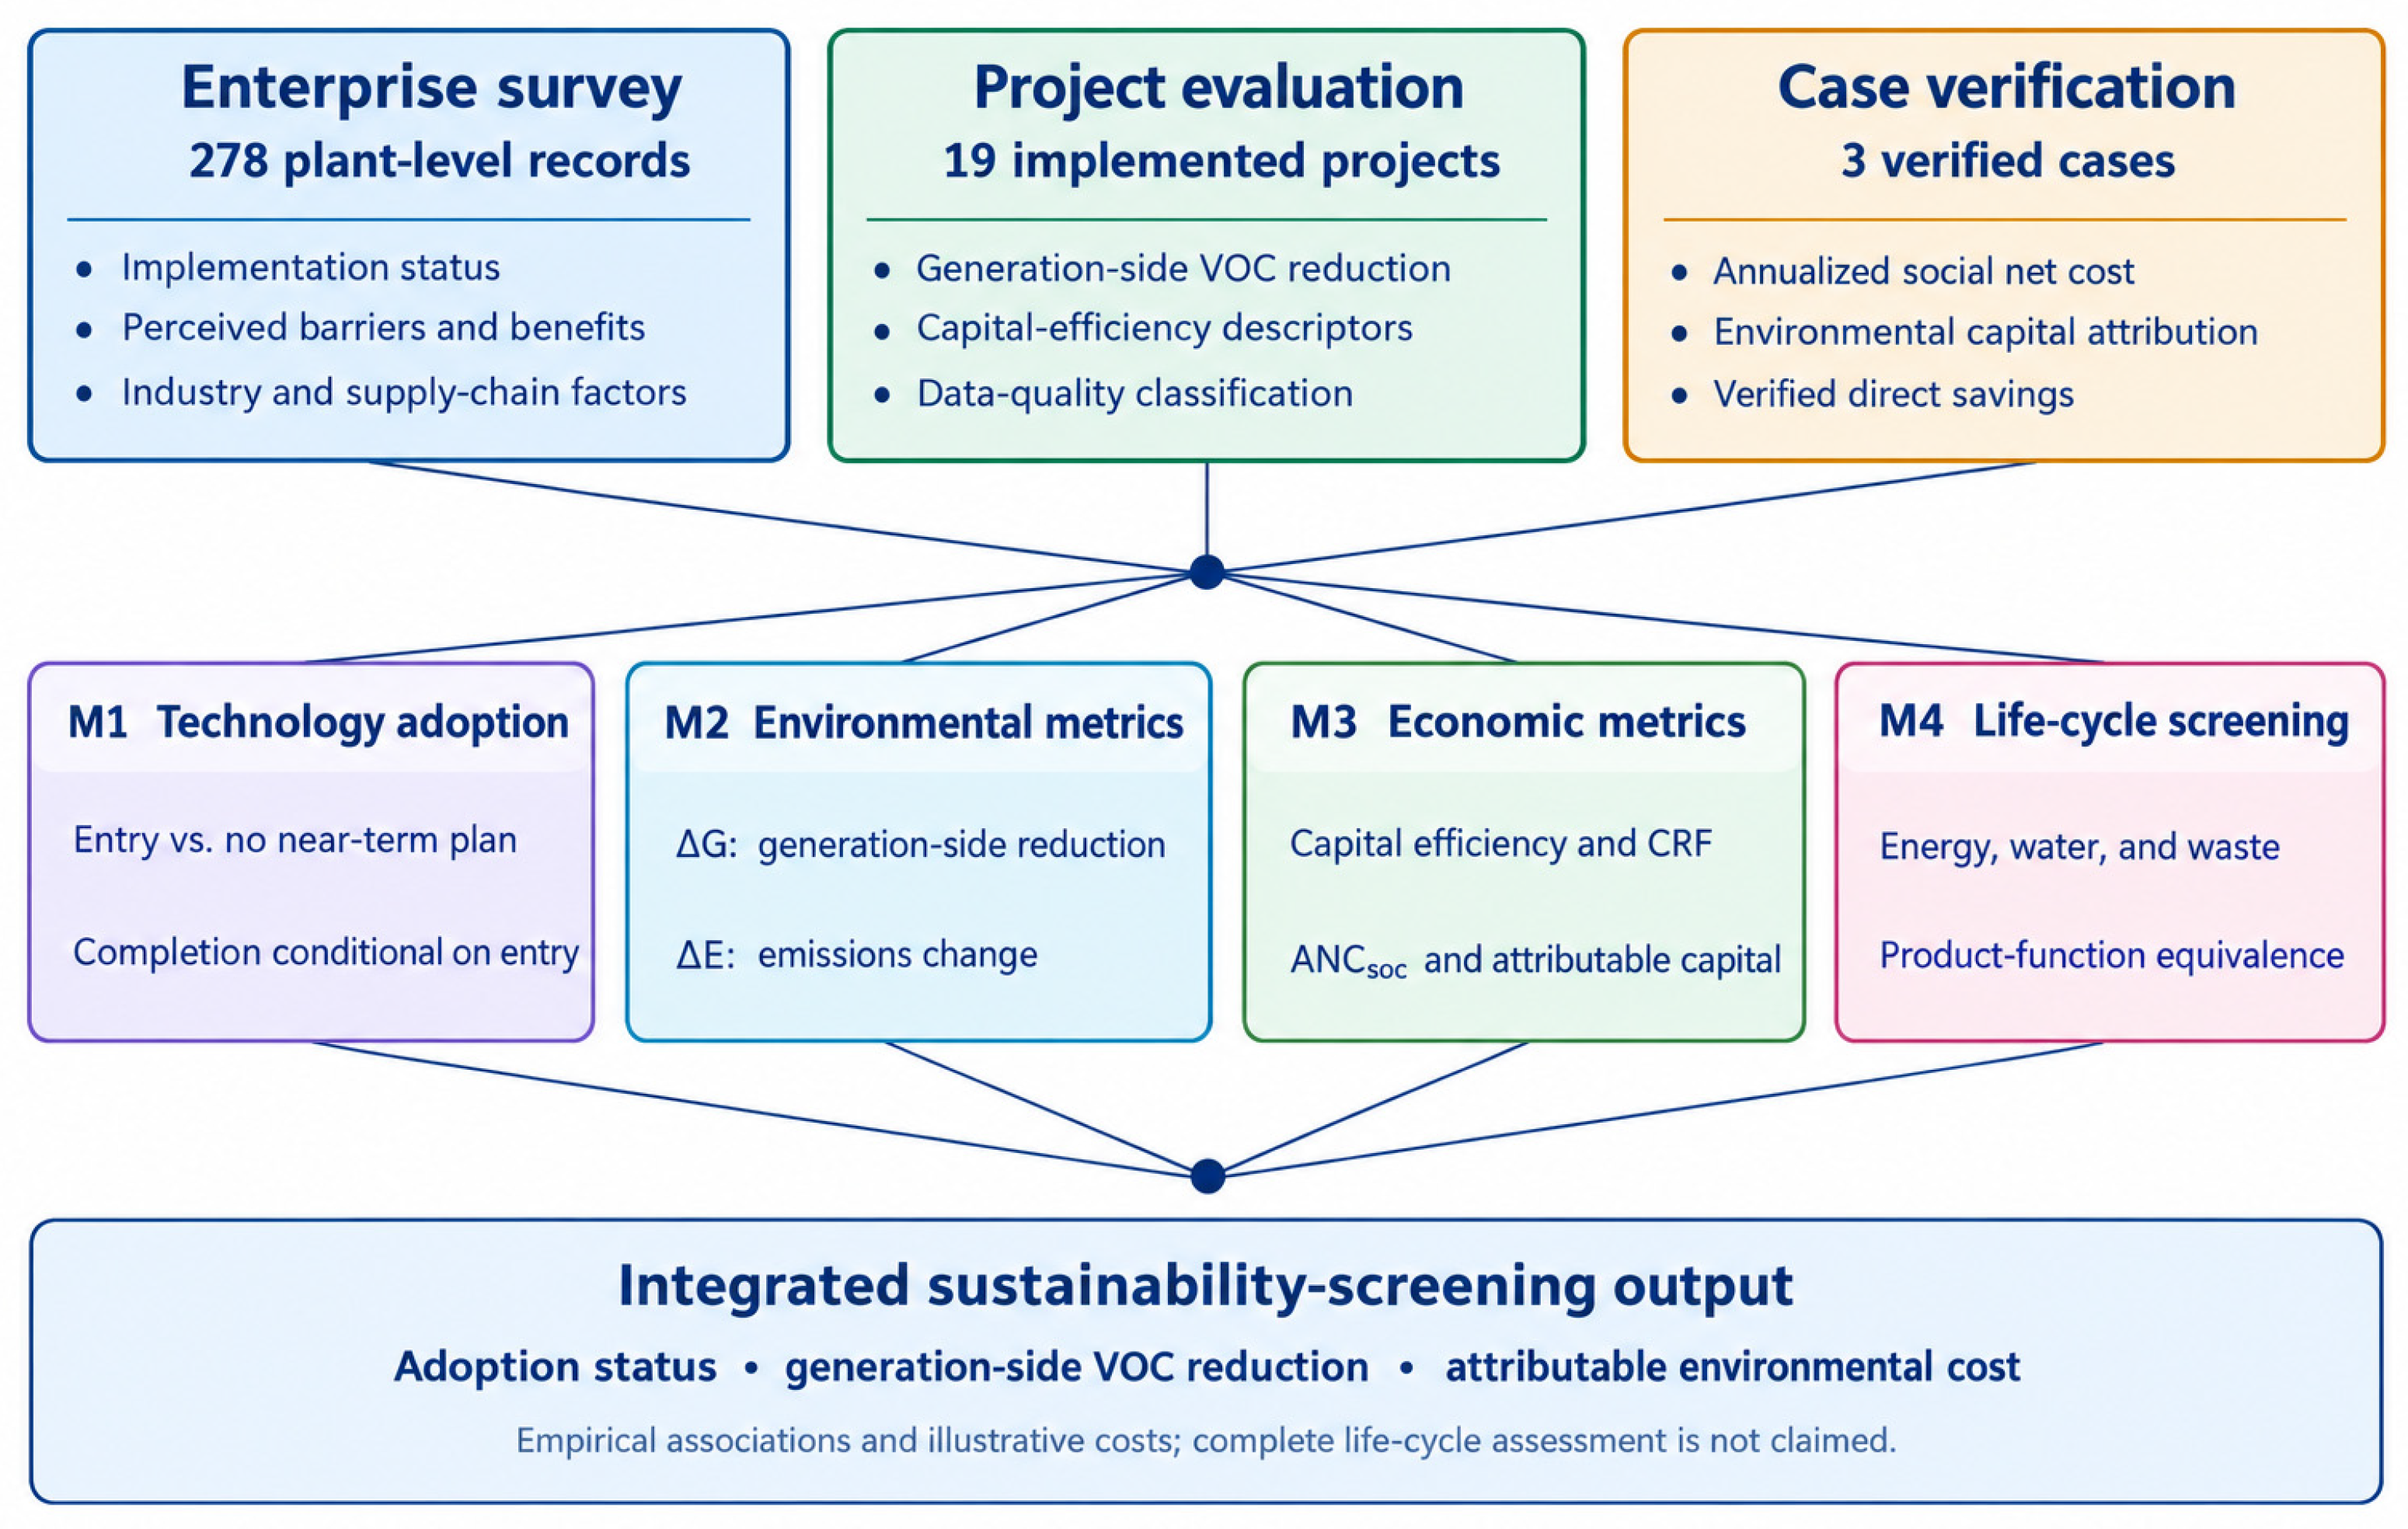
We adapted a life-cycle-oriented assessment sequence, from hotspot identification through technology scenarios, impact characterization, economic evaluation, and optimization [12] to three non-pooled empirical tiers (Figure 1). Questionnaire records describe adoption status, implemented-project records describe generation-side VOC reduction and capital efficiency, and independently verified cases support illustrative calculations of annualized social net cost. These sources have different inclusion rules and units of observation. They do not provide a common equivalent-product functional unit or harmonized inventories of upstream materials, energy, transport, waste handling, and equipment life. Consequently, this is neither a pooled causal evaluation nor a complete ISO 14040/14044 LCA [33,34]. The life-cycle module provides explicit boundaries and screening questions for subsequent within-industry studies.
Figure 1.
Multilevel evidence chain and analytical framework for industrial VOC source reduction.
2.2. Data Sources, Survey Design, and Quality Control
The empirical base is a 2024 questionnaire survey of industrial plants with VOC emissions in a coastal manufacturing cluster in China, supplemented by project records and technical verification. Enterprises were purposively recruited from regulated VOC emitters and major solvent-using industries. Following site visits, sector consultations, and pilot testing with semi-open-ended questions, the instrument was administered as a structured questionnaire. Industries included electronic components, plastics, packaging and printing, surface coatings, and other solvent-using sectors. The questionnaire indicators reflect operating and regulatory practices rather than a validated psychometric scale. Baseline VOC-emission categories refer to 2022 regulatory records; implementation status refers to the 2024 questionnaire, while the near-term planning horizon could extend through the end of 2025. Planned projects were not counted as completed projects.
The analytical dataset comprised 278 plant-level questionnaires representing 270 anonymized enterprises; multiple records from an enterprise corresponded to different plants. Complete-case analyses were used without imputation. Standard errors were clustered at the enterprise level, and one-plant-per-enterprise sensitivity analyses were conducted using alternative selection rules. Invitations and excluded-questionnaire totals were not archived, precluding a conventional survey-response rate.
Of 24 initially identified projects, 19 implemented source-reduction projects were retained based on identifiable technical interventions, consistent reduction-accounting boundaries, and the availability of project documentation. Relocation projects and records with an inadequate budget or incompatible reduction boundaries or inadequate screening-stage investment documentation were excluded. Some retained projects had zero or incomplete investment fields; these records were excluded from capital-efficiency ratio calculations. The project assessment drew on regulatory emission data, equipment and material files, site documentation, and before–after process calculations. Generation-side VOC reduction was primarily quantified from changes in raw and auxiliary material consumption and as-applied VOC content, with production quantities and site records used for verification where available.
Reported reduction thresholds and incomplete investment fields were retained explicitly. A value reported as “>2 t·a−1” was treated as a lower bound, so 2 t·a−1 provides a lower-bound capital-efficiency descriptor rather than an exact estimate. Recorded zero budgets accompanying documented technical modifications were treated as incomplete financial records; such projects were omitted from ratio calculations. Three verified projects underwent document checks, on-site review, and expert assessment between mid-2024 and October 2024. Enterprise identities and precise locations were removed from the analytical records.
2.3. Adoption Stages, Variables, and Statistical Models
Reported implementation status was coded as follows: 0 = no clear near-term plan, 1 = implementing or planning, and 2 = completed. Stage 1 contrasts status 1 or 2 with status 0; Stage 2 contrasts status 2 with status 1 among plants that had already entered implementation/planning. The emissions variable distinguishes 2022 regulatory records of ≥3 t·a−1 versus <3 t·a−1, consistent with local management categories. The archived questionnaire contains only the binary emission category.
The proportional-odds assumption underlying cumulative ordered logistic regression [35,36] was rejected by a Wald test of threshold interactions involving 16 covariates (χ2 = 42.54, df = 16, p < 0.001). Two sequential logistic regressions therefore characterize entry and completion conditional on entry. Generalized and partial proportional-odds models are alternative approaches when the assumption fails [37,38,39]; the standard ordered-logit model is retained here only as a directional sensitivity analysis.
Stage 1 compares implementation/planning or completion (Y1 = 1 for status 1 or 2) with no near-term plan (status 0). Stage 2 includes only Y1 = 1 plants and compares completion (Y2 = 1 for status 2) with implementing/planned status (Y2 = 0 for status 1). The specified logit models are as follows:
logit[P(Y1 = 1 | X)] = α1 + Xβ1
logit[P(Y2 = 1 | Y1 = 1, X)] = α2 + Xβ2
Explanatory variables included annual revenue, industry, ownership, VOC emissions ≥ 3 t·a−1, recognition of economic benefits, successful cases in the industry, supply-chain status, technical barriers (implementation difficulty or lack of mature applicable technology), and perceived project effects. The supply-chain reference category is customer acceptance of products manufactured using source-reduction technology.
Models were estimated in Python 3.13.5 using pandas 2.2.3, NumPy 2.3.5, and statsmodels 0.14.6. Logistic regressions used enterprise-clustered robust standard errors [40]; sample sizes were 278 plants for Stage 1 and 176 entered plants for Stage 2. The ordered-logit sensitivity model used HC1 covariance. The maximum variance inflation factor was 2.30. Three completed surface-coating cases formed the smallest Stage 2 industry cell; subgroup estimates are interpreted in Section 4.7.
2.4. Boundary Between Generation-Side VOC Reduction and Atmospheric Emission Reduction
Generation-side VOC reduction should be calculated from material use and process activity rather than inferred from terminal exhaust concentrations alone. When material quantities and as-applied VOC fractions are known, the estimated generation in period, t, is as follows:
Gₜ = Σⱼ (Mⱼ,ₜ × Cⱼ,ₜ)
Here, Mⱼ,ₜ is the quantity of raw or auxiliary material, j, consumed in period t, and Cⱼ,ₜ is its as-applied VOC mass fraction. For an equivalent process output or activity, Qₜ, the generation intensity is gₜ = Gₜ/Qₜ, and the reduction, ΔG, is standardized to post-modification output, Q1. This separates changes in material intensity from changes in production volume:
gₜ = Gₜ/Qₜ
ΔG = (g0 − g1) × Q1
When collection and end-of-pipe treatment remain essentially unchanged before and after the project, the corresponding emission reduction can be approximated as follows:
ΔE = ΔG × (1 − ηc × ηr)
Here, ηc and ηr represent collection and removal efficiency, respectively. Equation (4) applies when these efficiencies and operating conditions are comparable between periods; otherwise, before- and after-project atmospheric emissions must be estimated separately. Project-level comparisons in this study use the generation-side indicator, ΔG.
2.5. Project Capital Efficiency and Uncertain Data
The following reciprocal descriptors relate generation-side VOC reduction to reported total project capital:
α = 100 × ΔG/I
CI = I/ΔG
Here, I is project investment in CNY 10,000, α has units of t·a−1 per CNY 1 million, and CI has units of CNY 10,000/(t·a−1). For reductions reported as “>2 t·a−1”, substituting 2 t·a−1 produces a lower bound for α and an upper bound for CI. Because the projects have different production functions and investment scopes, these ratios describe the observed portfolio, not a sector-wide abatement-cost benchmark.
2.6. Annualized Social Net Cost and Incremental Environmental Investment
Source-reduction investments may also serve capacity expansion, equipment renewal, productivity, or quality objectives. Total investment divided by VOC reduction is therefore an apparent capital-intensity measure rather than an attributable environmental cost. Let Iproject be the total capital expenditure and λ its attributable environmental share (0 ≤ λ ≤ 1), such that Ienv = λIproject. Full attribution (λ = 1) provides a conservative scenario for the environmental capital charge. Where a comparable business-as-usual (BAU) production investment can be documented, Ienv = Iproject − IBAU is preferable to an assumed allocation. For case V01, λ is varied in sensitivity analysis rather than treated as an observed share.
Capital expenditure is converted to an annual stream using the capital recovery factor:
CRF = r(1 + r)n/[(1 + r)n − 1]
Annualized social net cost (ANCsoc) is calculated using a restricted resource-cost accounting boundary: annualized attributable capital, changes in documented material energy and operation and maintenance costs, and verified direct savings. Taxes and subsidies are excluded as transfers. Because unpriced health and ecological impacts are not monetized, “social” here identifies the treatment of transfers and resources, not a comprehensive social cost–benefit analysis:
ANCsoc = λI × CRF + ΔCmaterial + ΔCenergy + ΔCOM − Bdirect
Unit source-reduction cost is as follows:
CE = ANCsoc/ΔG
In Equation (8), ΔCmaterial, ΔCenergy, and ΔCOM denote annual incremental resource costs (negative for savings); Bdirect includes separately documented benefits not already included in these cost terms to avoid double counting. Unverified benefits from productivity, yield, quality, or labor are reported as non-monetized co-benefits. The verified-case base scenario uses r = 5% and n = 10 years; sensitivity scenarios combine r = 3%, 5%, and 8% with n = 8, 10, and 15 years.
2.7. Life-Cycle Boundary Extension and Interface for Future LCA
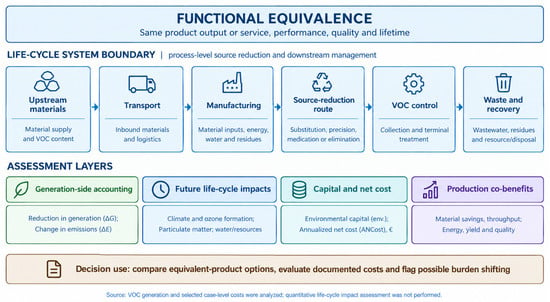
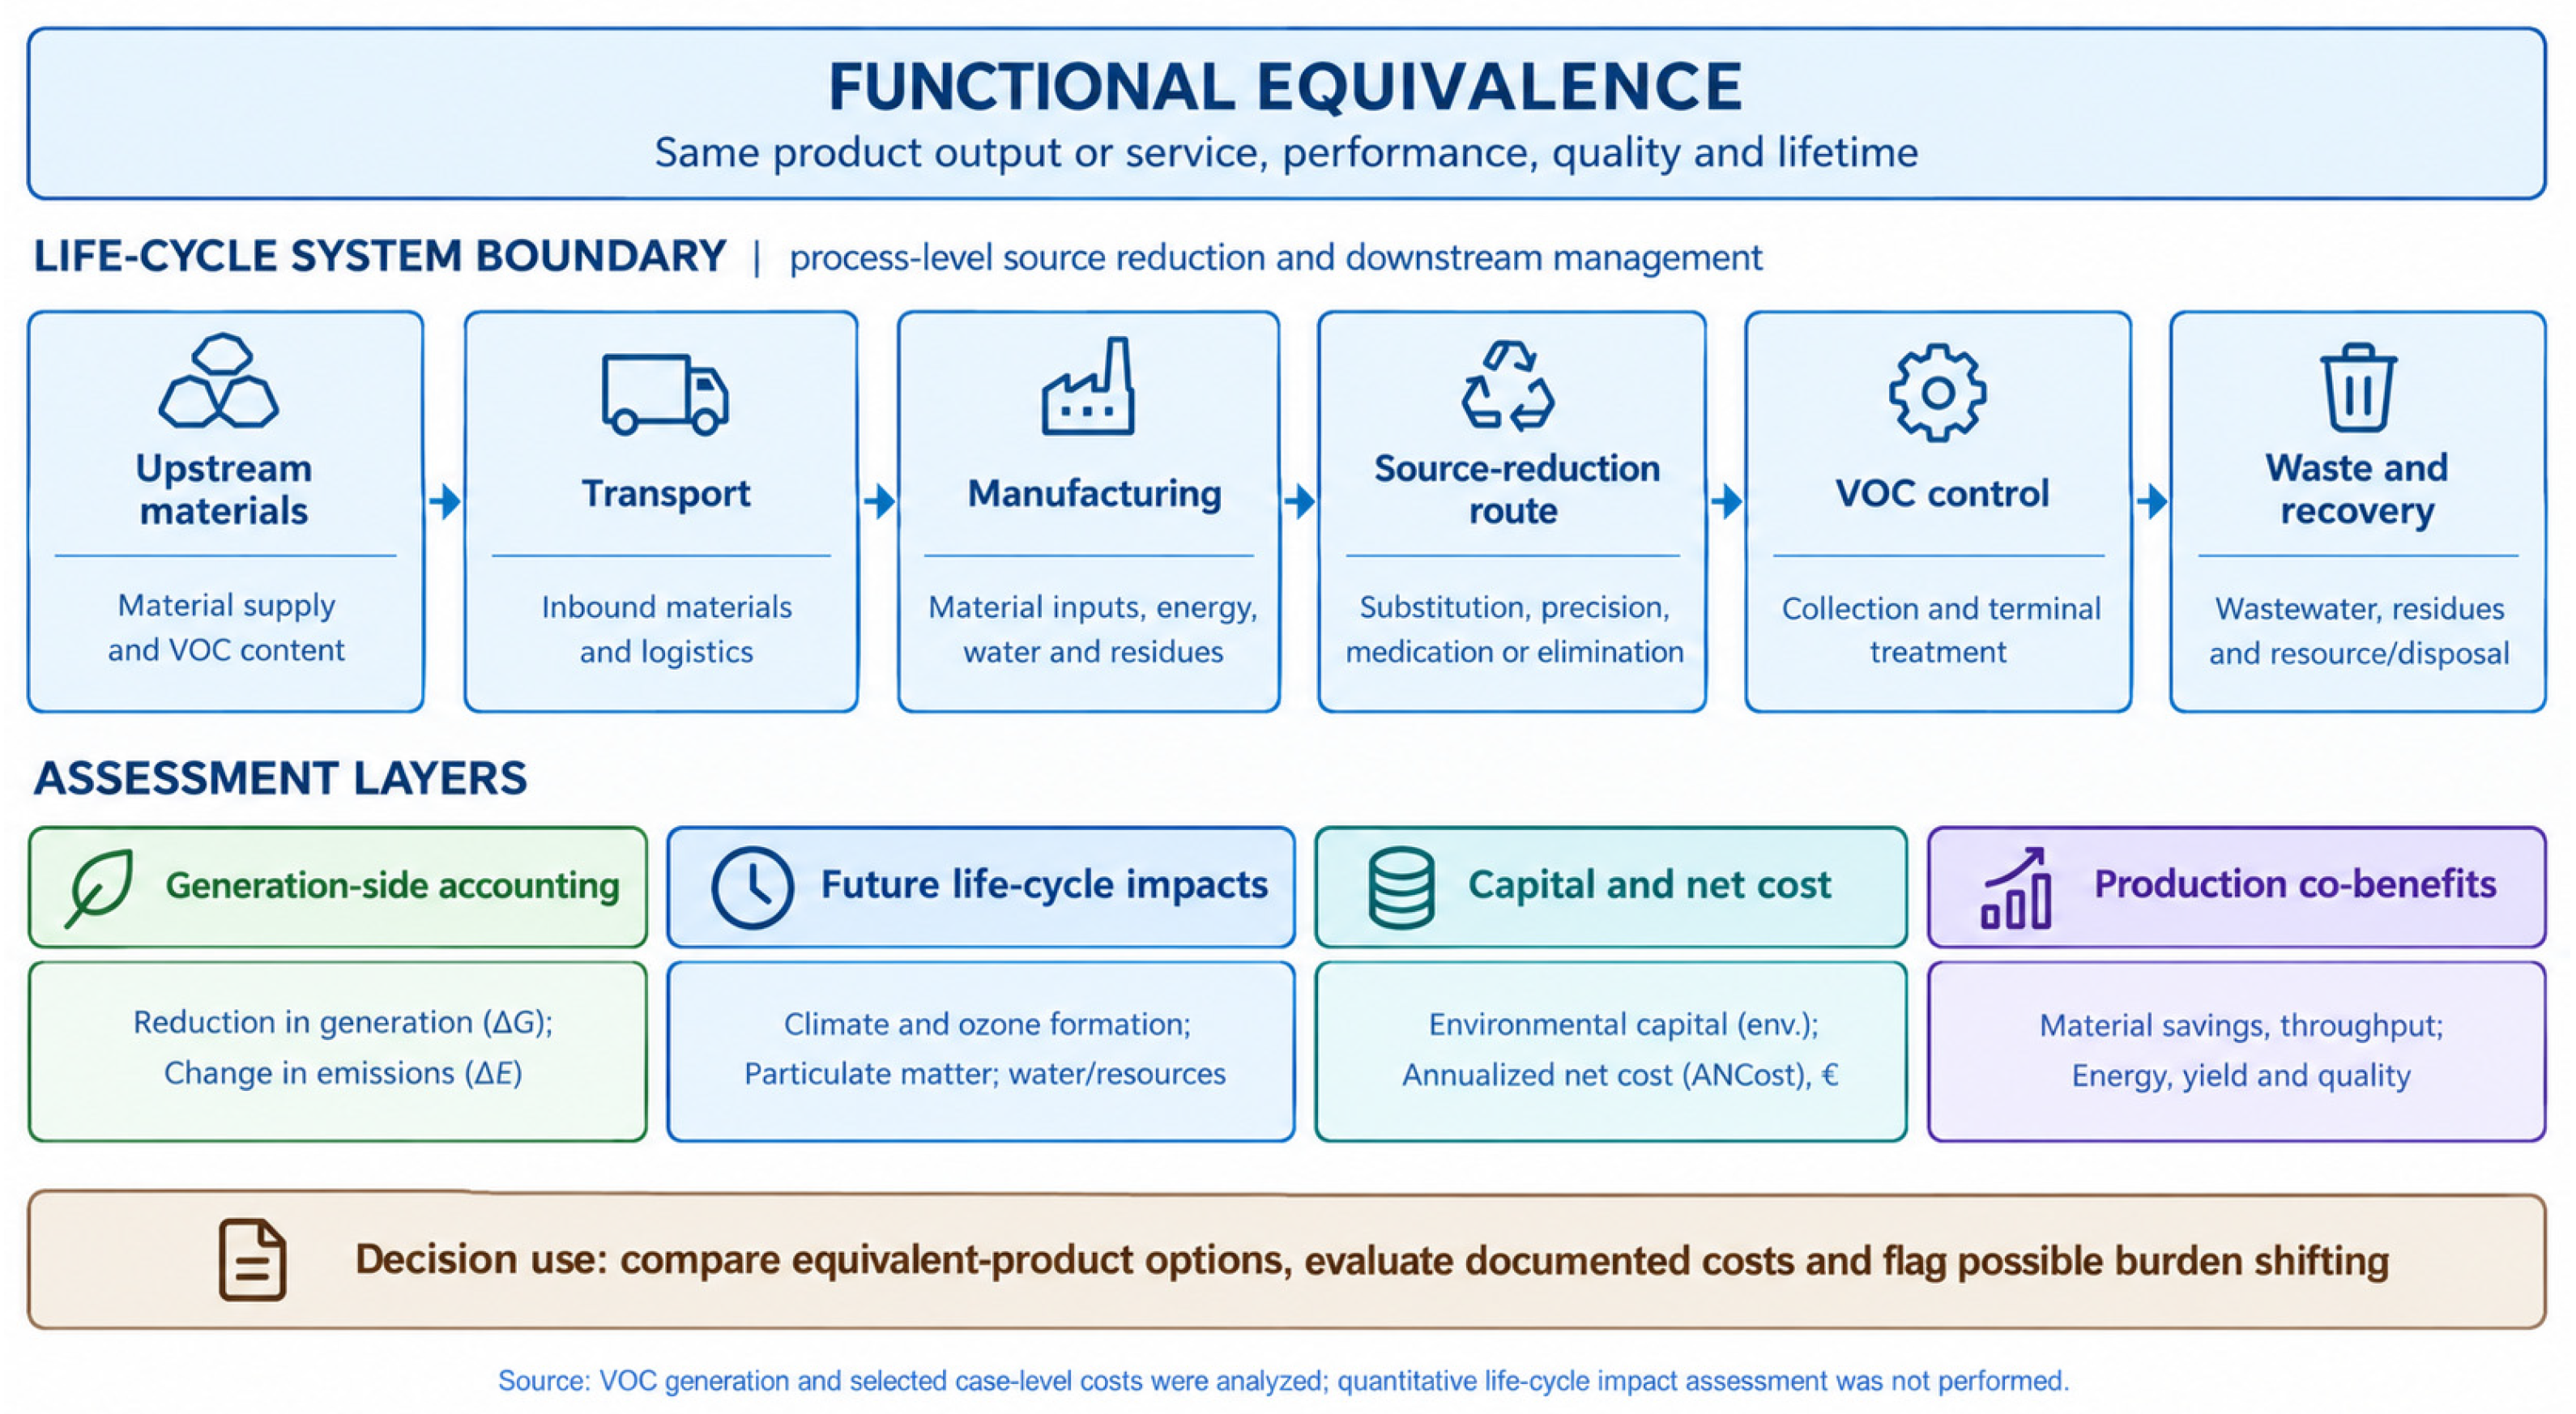
A complete LCA under ISO 14040/14044 requires a defined functional unit, harmonized inventories, impact characterization, and interpretation [33,34]. A ton of VOC reduction is an environmental-service indicator, not a functional unit suitable for ranking dissimilar products. Formal assessment should compare equivalent product functions within an industry, such as coating 1000 m2 at equal thickness, durability, and quality or producing 104 units meeting identical specifications. Boundaries should include upstream materials and transport, manufacturing operations, electricity/heat and other utilities, VOC collection and treatment, wastewater and hazardous-waste treatment, and—if technology changes durability—the use and maintenance stages. Screening should document baseline assumptions, data origin, and measurement uncertainty before inferring a sustainability gain.
A future life-cycle-impact assessment (LCIA) can characterize climate change, photochemical ozone formation, particulate-matter formation, acidification, eutrophication, resource use, and water use, with toxicity added where inventories support it. Regionally appropriate inventories [17], uncertainty analysis [18,19], and equivalent-product functions underpin such comparisons. The present study uses qualitative burden-shifting checks (Figure 2), rather than calculating a cross-industry LCIA score.
Figure 2.
Life-cycle boundaries and future assessment interface for source-reduction technologies.
3. Results
3.1. Sample Structure and Analytical Basis
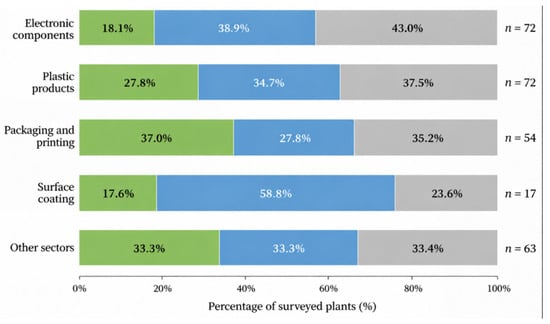
The sample comprises 278 plant records: a total of 77 (27.7%) reported completed projects, 99 (35.6%) were implementing or planning, and 102 (36.7%) had no clear near-term plan. Industry counts were 72 electronic-component plants, 72 plastic-product plants, 54 packaging-and-printing plants, 17 surface-coating plants, and 63 plants in other sectors. The 278 records represent 270 enterprises; standard errors in the regression models account for multi-plant enterprises. Table 1 reports status percentages within each industry and combined-route shares among entered plants; the figures describe purposively recruited respondents within each rather than weighted industry estimates. Apparent similarities across industries should not be interpreted as evidence of equal underlying adoption rates, especially given the small coating subgroup and the absence of an industry sampling frame.
Table 1.
Implementation status and combined technical routes for VOC source reduction by industry.
3.2. Adoption Status and Technical Routes
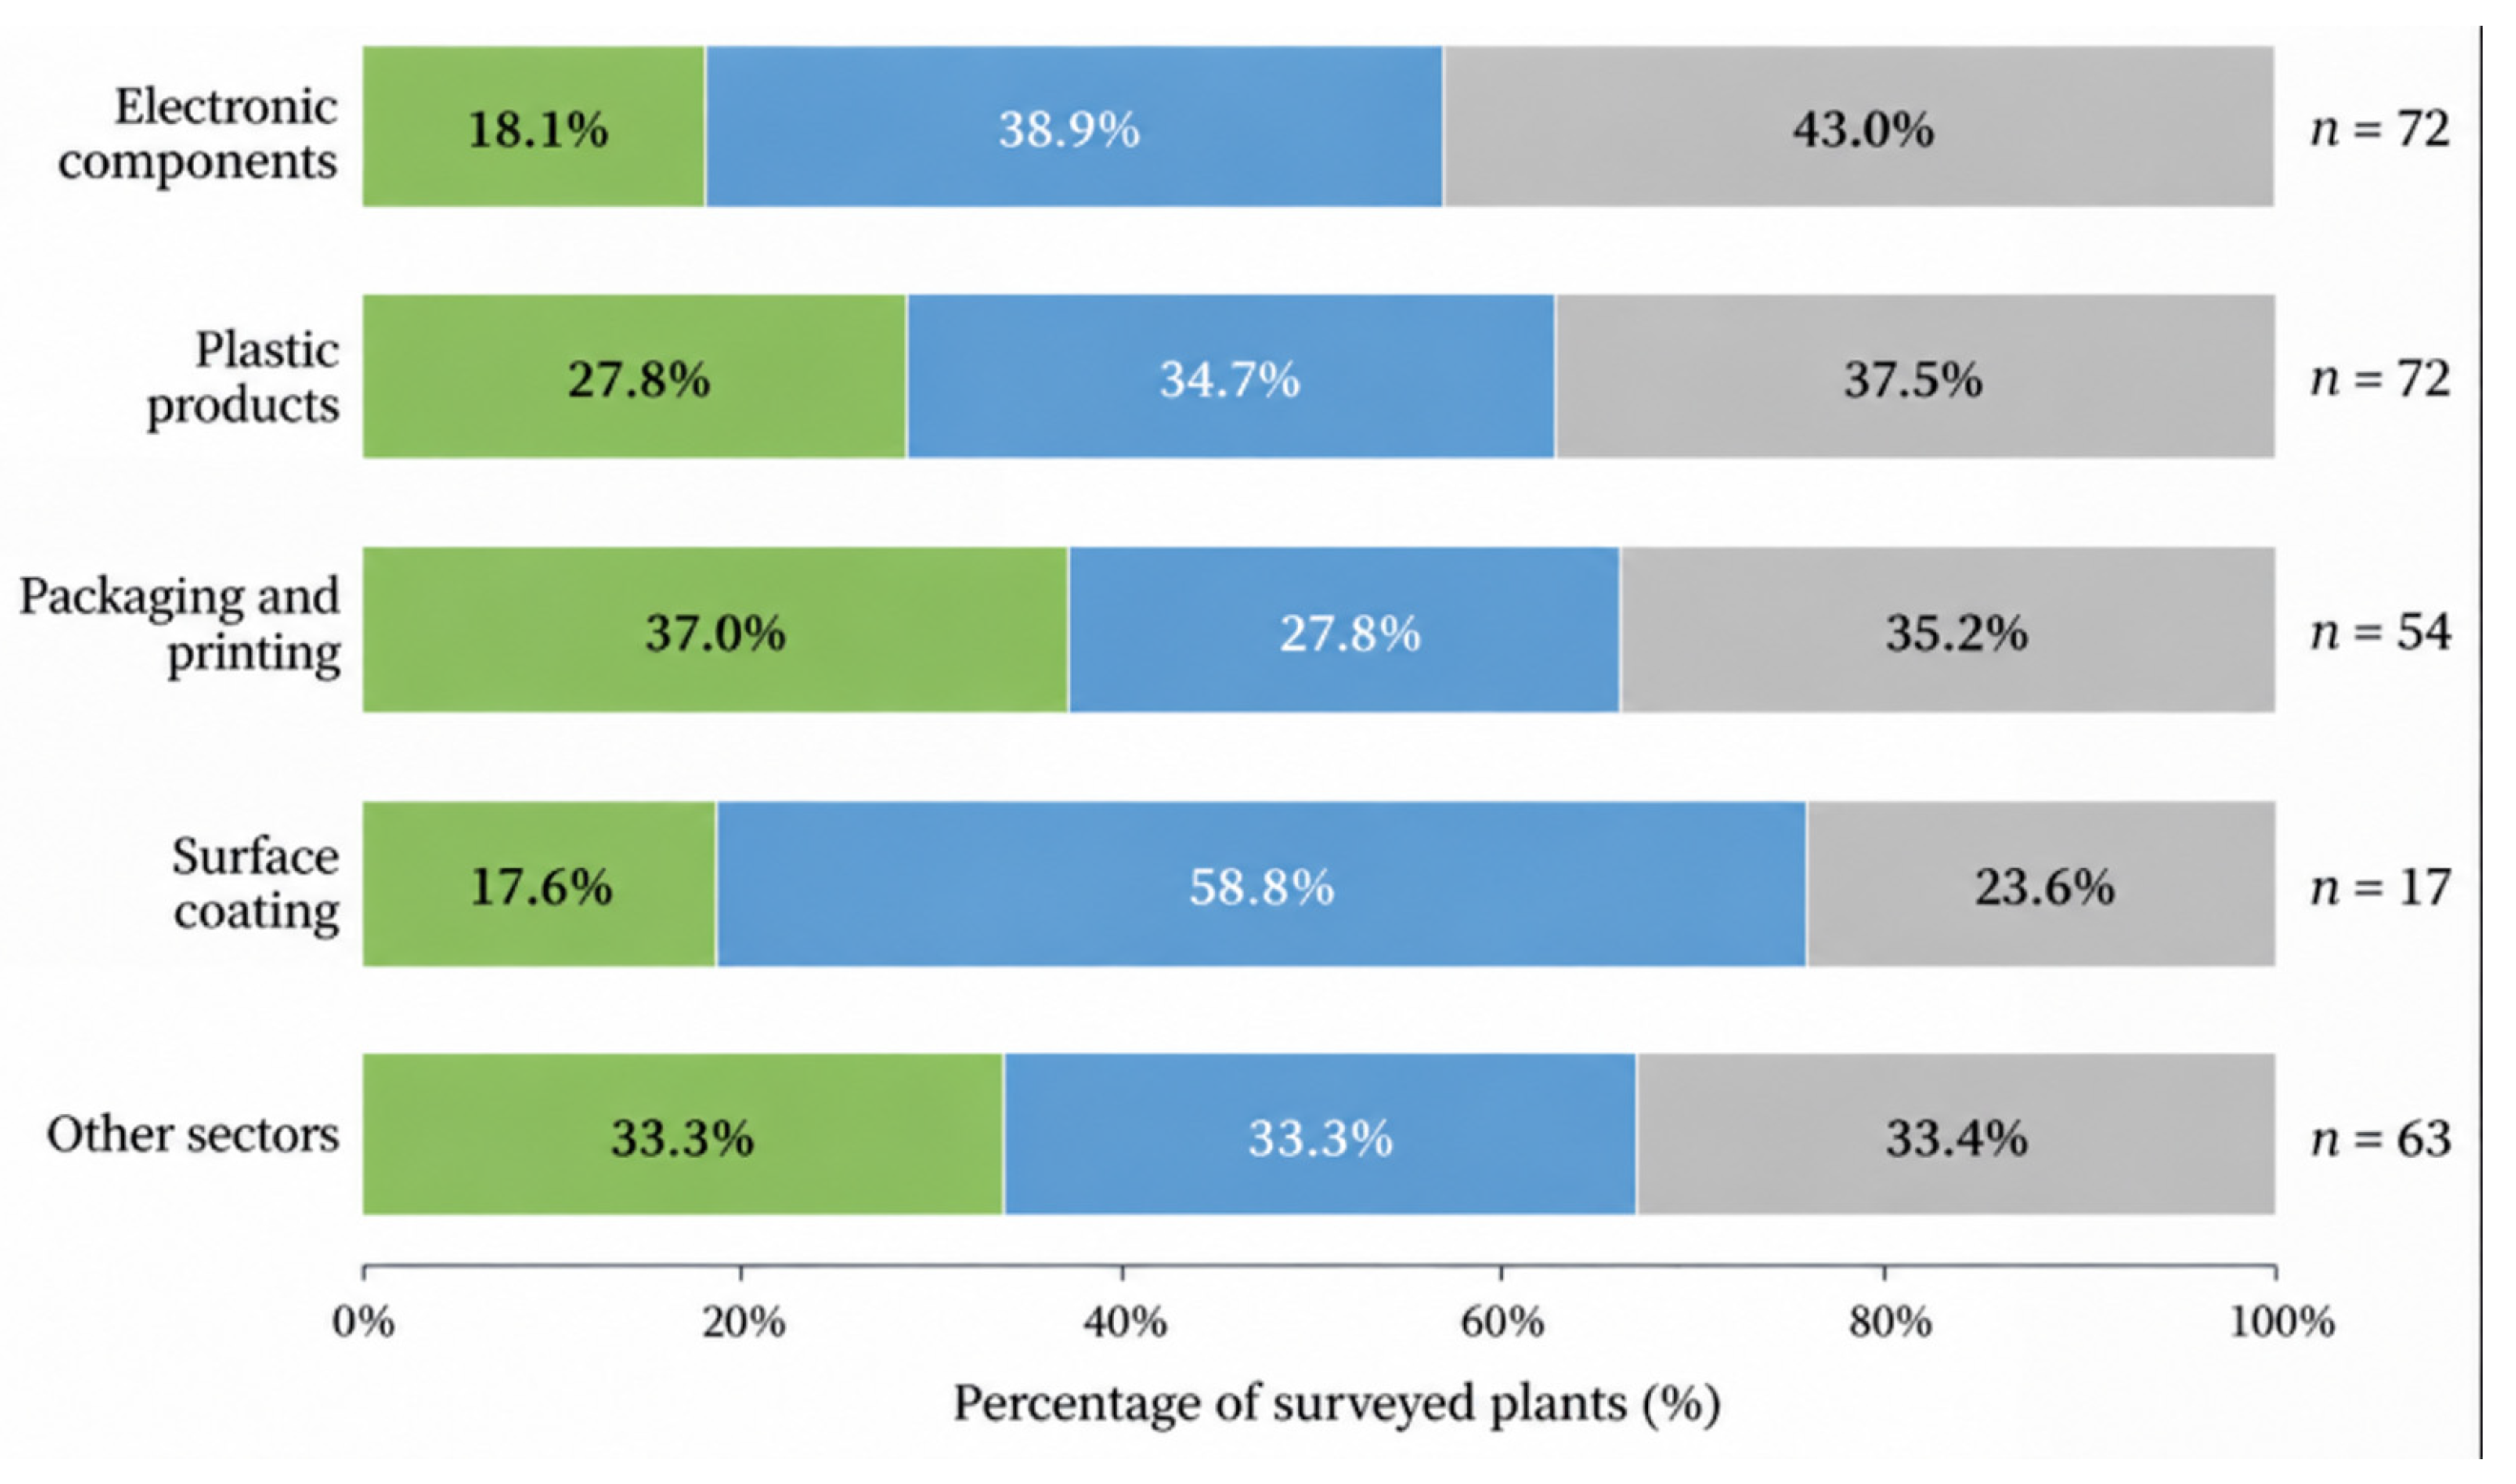
Overall, 176 of 278 surveyed plants (63.3%) had entered implementation/planning, while 77 (27.7%) had completed measures. Entry proportions were numerically similar across several industries, whereas completed shares differed, notably in smaller subgroups (Table 1 and Figure 3). Common local regulatory and supply-chain conditions may have contributed to these patterns.
Figure 3.
VOC source-reduction implementation status by industry.
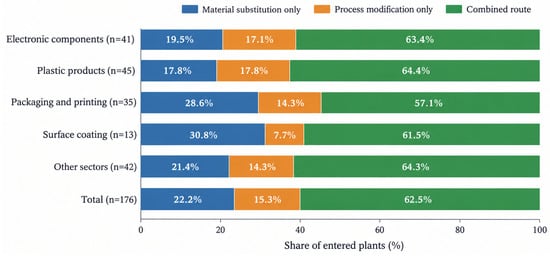
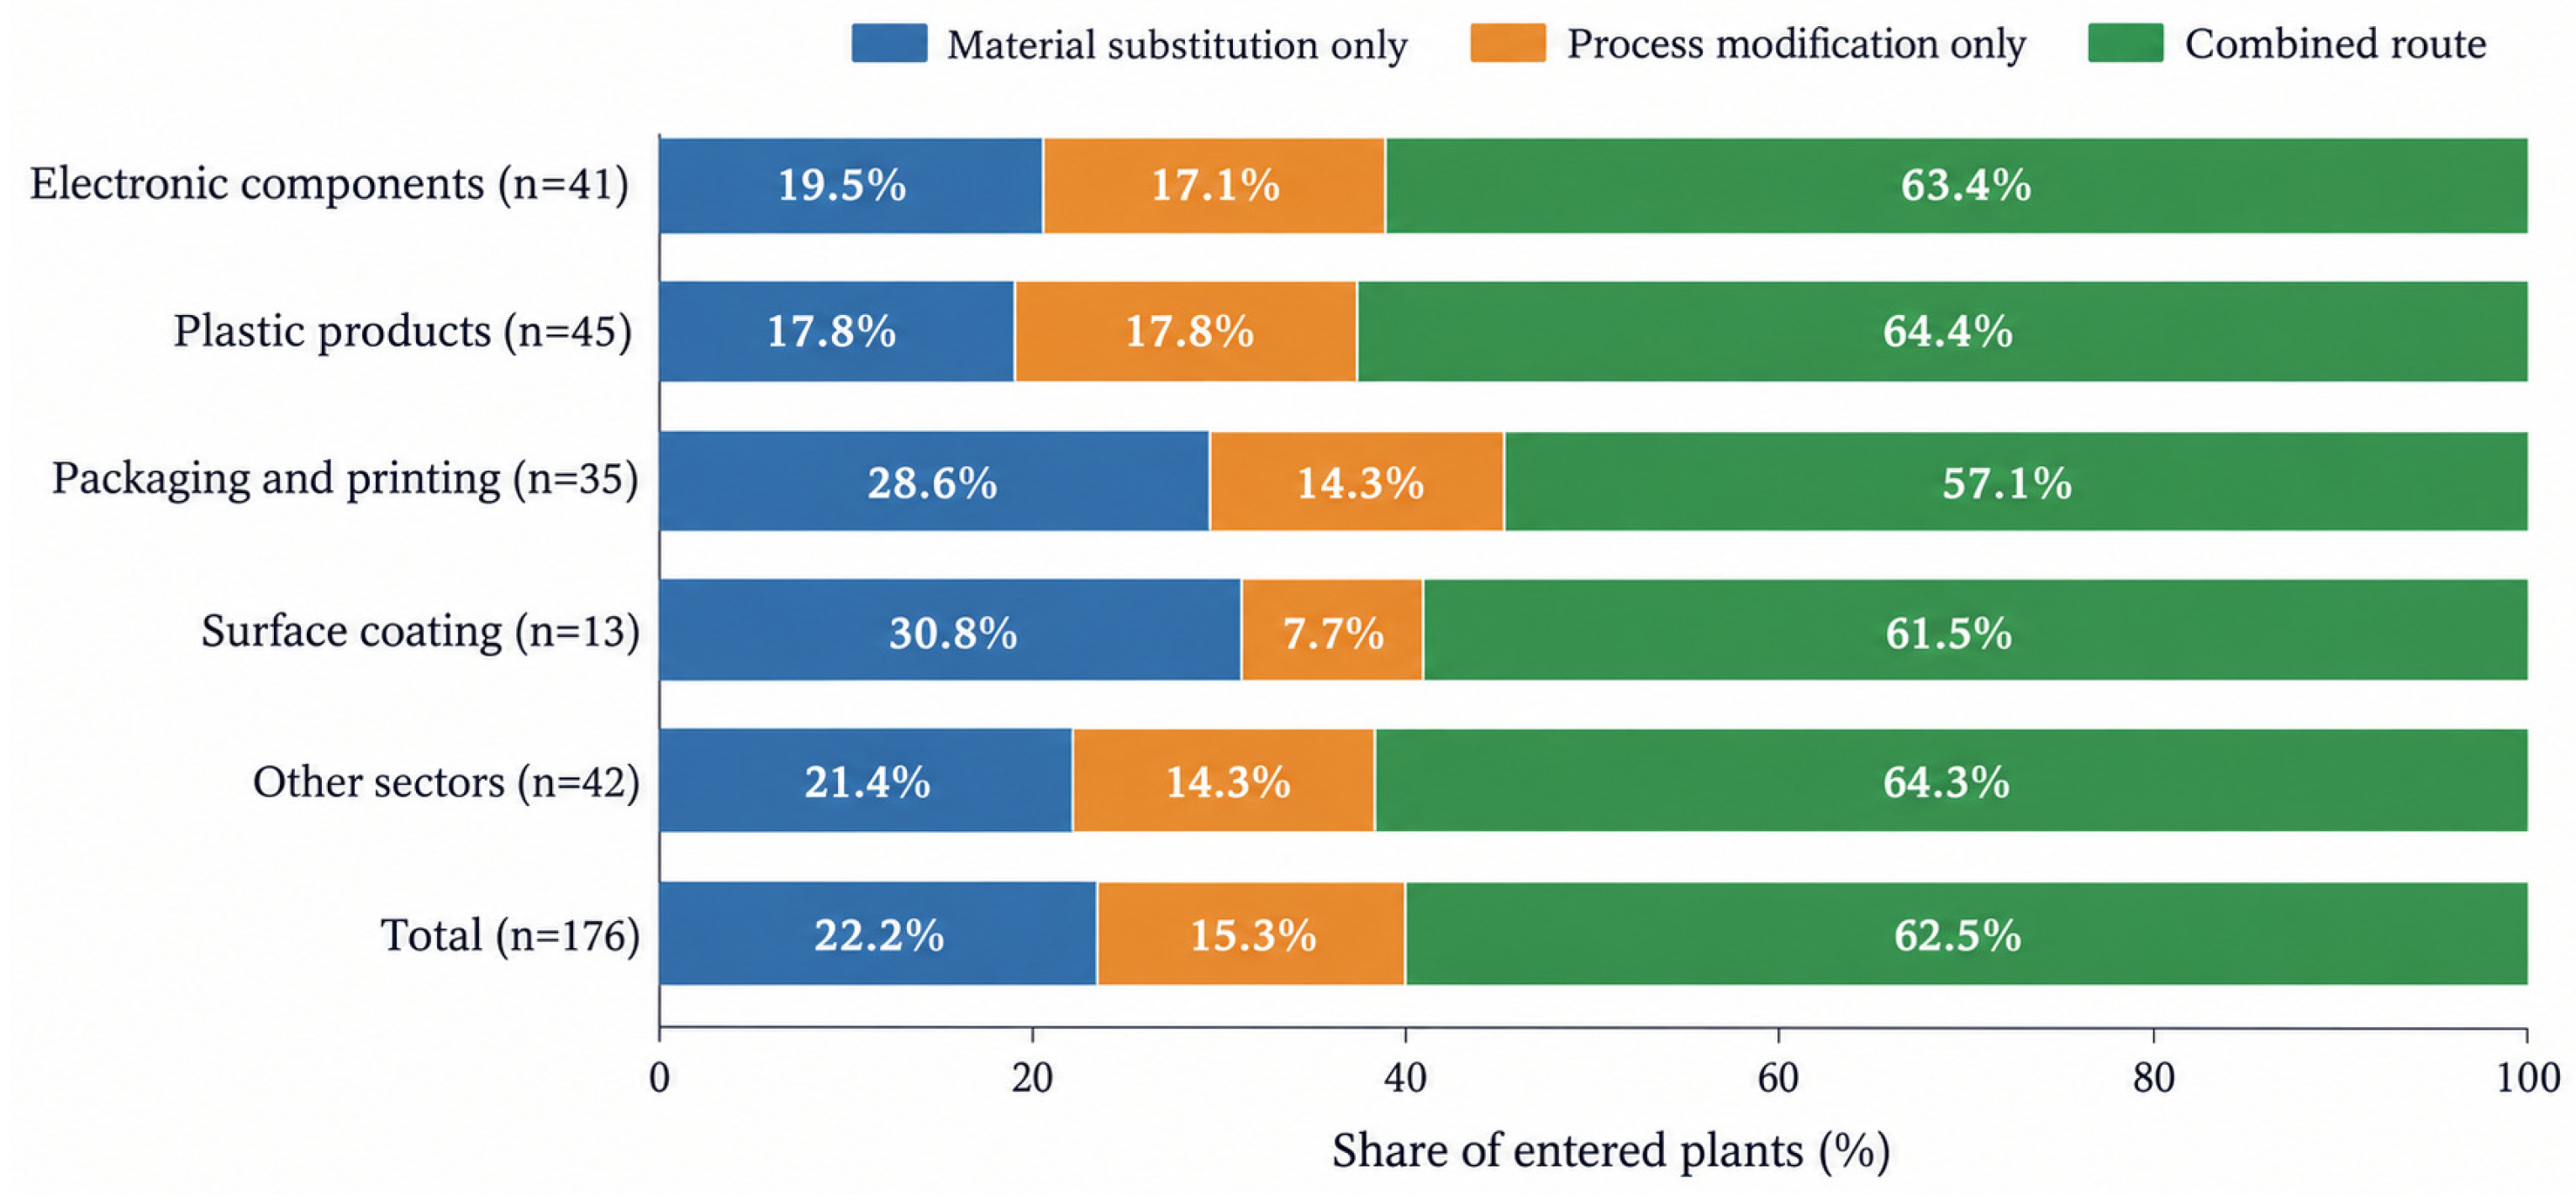
Among the entered 176 plants with a recorded technical route, 110 (62.5%) combined material substitution and process modification, 39 (22.2%) used material substitution only, and 27 (15.3%) used process modification only (Figure 4). Combined-route shares ranged from 57.1% to 64.4% by sector. Material substitution lowers the VOC fraction of applied materials, whereas process modification improves utilization efficiency and the configuration of VOC-intensive operations.
Figure 4.
Composition of VOC source-reduction technical routes by industry.
3.3. Stage 1: Entry into Implementation/Planning
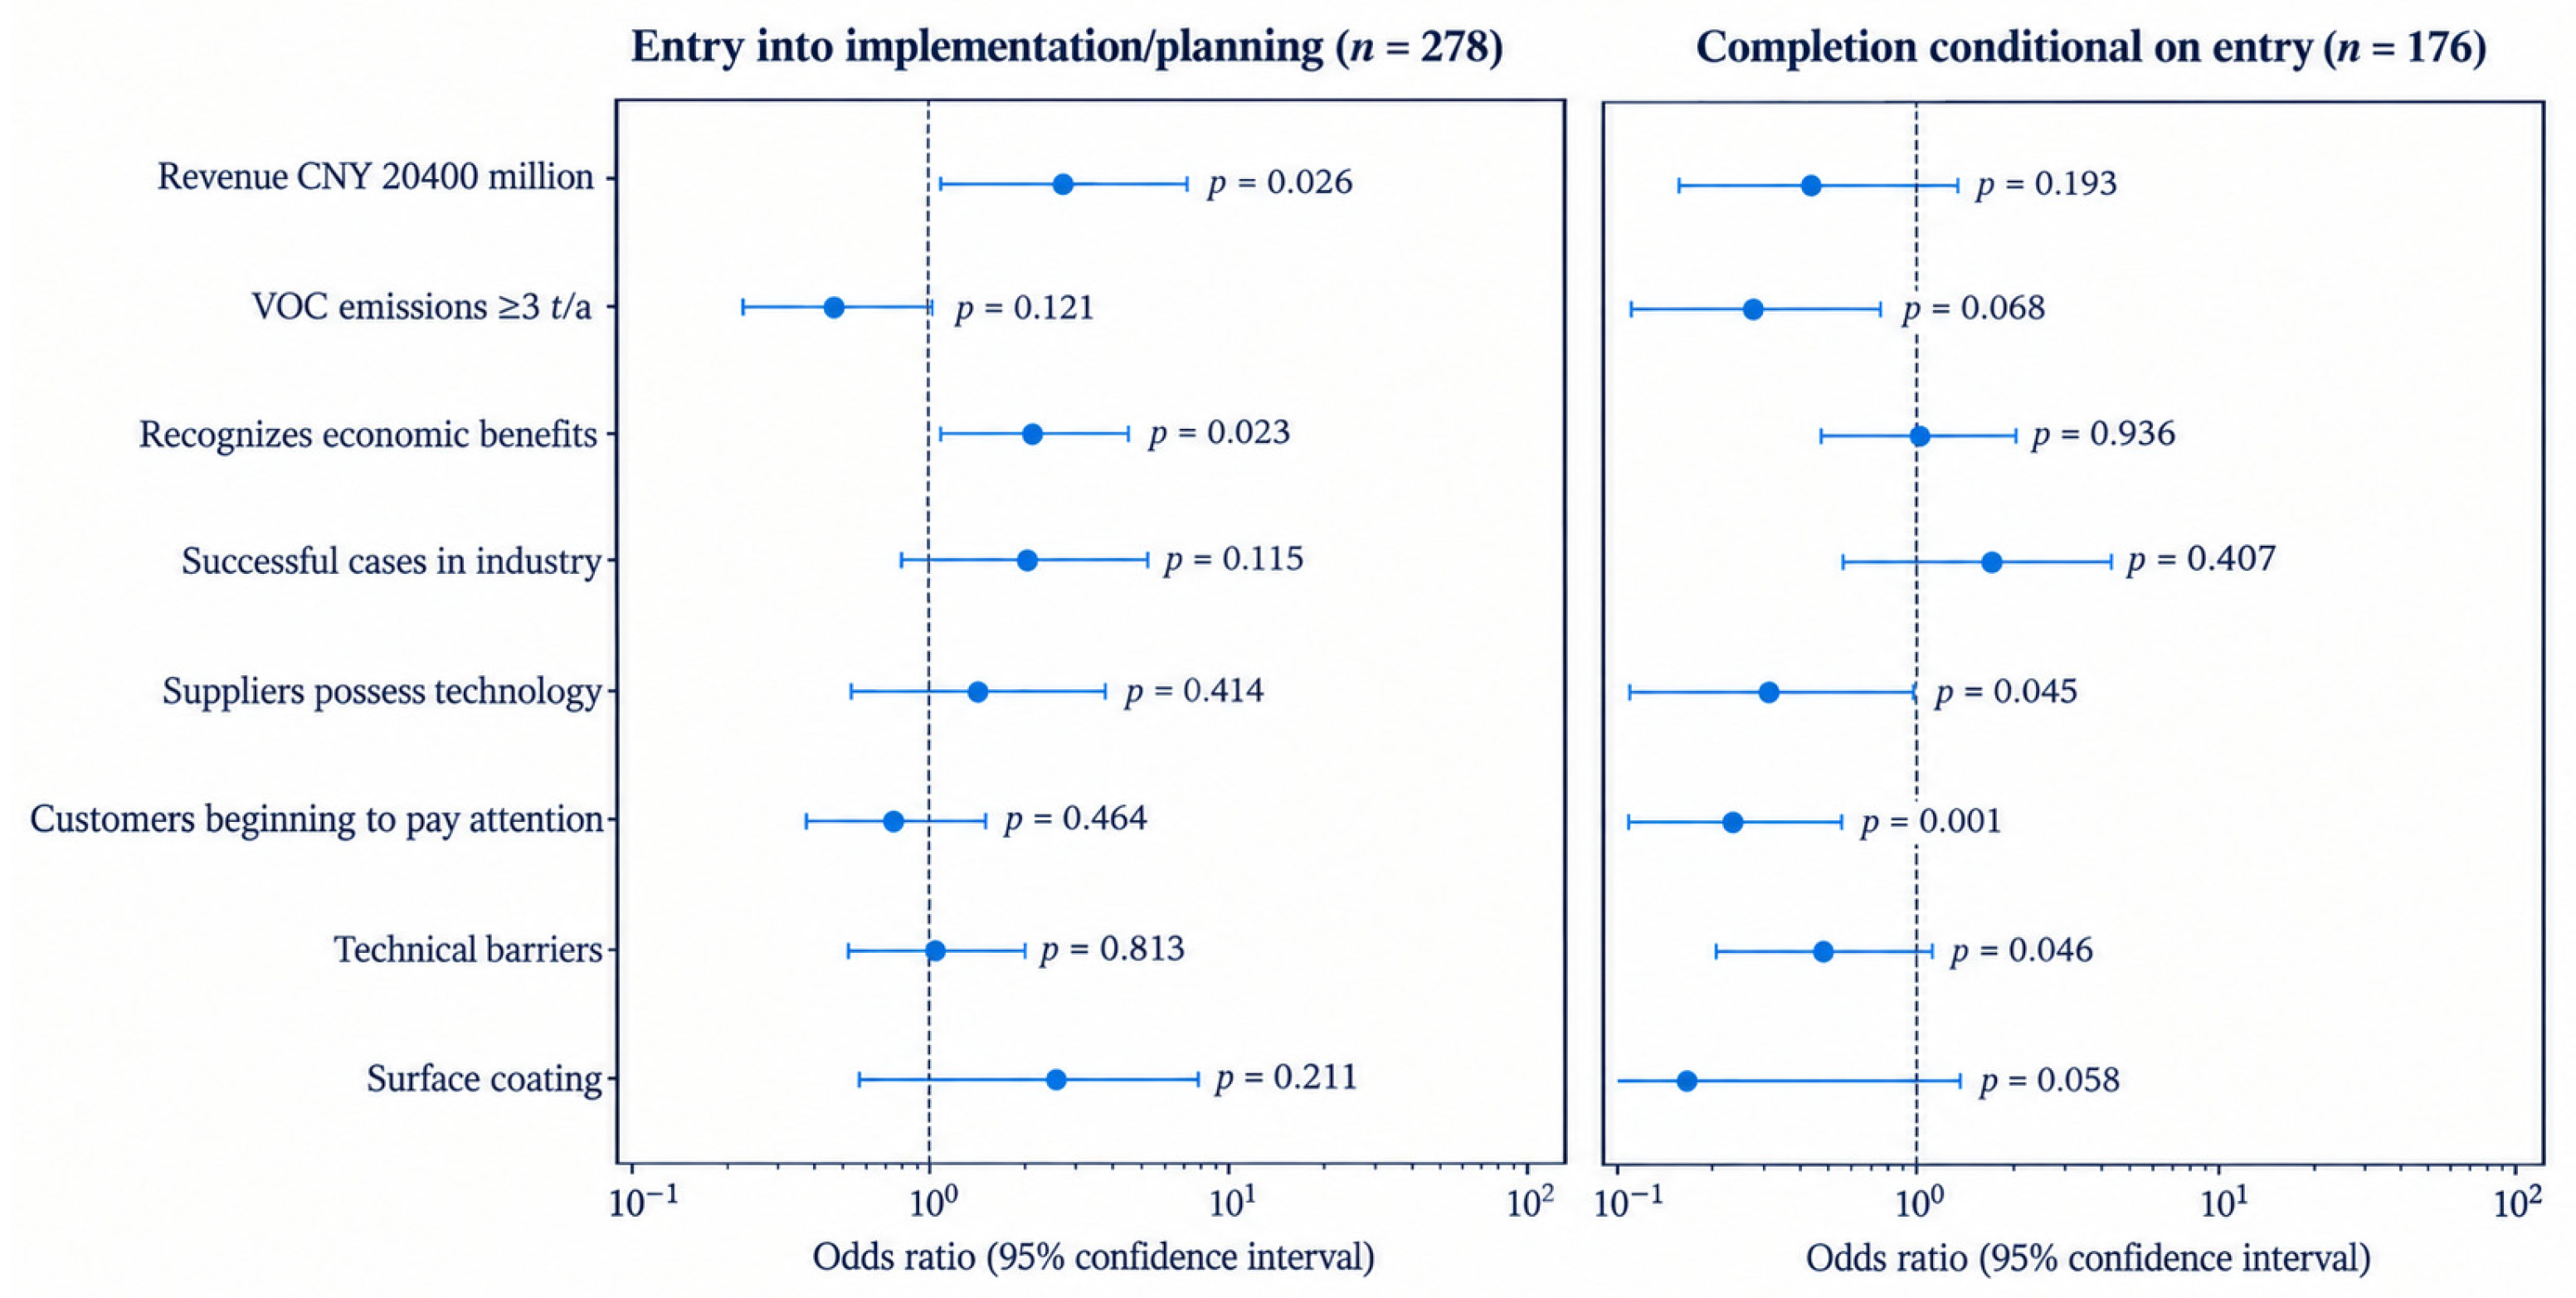
In Stage 1, an annual revenue of CNY 20–400 million was associated with higher odds of entry relative to revenue below CNY 3 million (OR = 2.90, 95% CI: 1.14–7.39; p = 0.026). Estimates for other revenue categories did not show similarly clear evidence of association (Table 2 and Figure 5).
Table 2.
Adjusted odds ratios (ORs) from sequential logistic regressions: entry (all plants, n = 278) and completion (entered plants only, n = 176).
Figure 5.
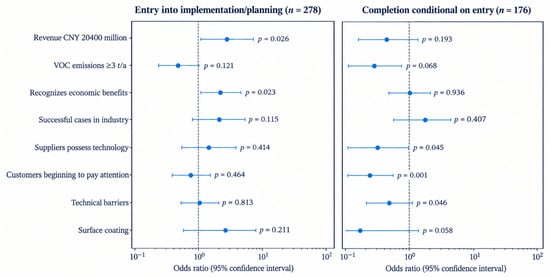
Adjusted ORs and 95% confidence intervals by stage. Stage 1 includes all 278 plants (entry versus no plan); Stage 2 includes only 176 entered plants (completion versus implementing/planned). Associations are conditional, not causal.
Recognition of economic benefits was associated with entry (OR = 2.12, 95% CI: 1.11–4.04; p = 0.023). The indicator for VOC emissions ≥ 3 t·a−1 (OR = 0.566; p = 0.121), perceived technical barriers (OR = 1.074; p = 0.813), and availability of successful industry examples (OR = 2.119; p = 0.115) did not provide strong evidence of Stage 1 associations.
3.4. Stage 2: Completion After Entry
Among the 176 entered plants, baseline VOC emissions ≥ 3 t·a−1 were negatively associated with reported completion (OR = 0.269, 95% CI: 0.102–0.705; p = 0.008); the corresponding association for technical barriers was OR = 0.450 (95% CI: 0.205–0.986; p = 0.046). Compared with products already accepted by customers, supplier availability alone (OR = 0.319; p = 0.045) and preliminary customer attention (OR = 0.238; p = 0.001) were associated with lower completion odds. These categories represent different supply-chain acceptance stages rather than evidence of harmful supplier capability (Table 2 and Figure 5).
As a directional check, an ordered logistic regression fitted to all 278 plants produced negative associations for the category of VOC emissions ≥3 t·a−1 (OR = 0.489, 95% CI: 0.293–0.817; p = 0.006) and early customer attention (OR = 0.499; p = 0.010), and a positive association for perceived economic benefits (OR = 1.810, 95% CI: 1.098–2.982; p = 0.020). Retaining one plant per enterprise under alternative rules produced ORs for the VOC-emissions category of 0.521 and 0.502 and economic-benefit ORs of 1.953 and 1.875. Directional consistency provides limited reassurance that these associations are not driven solely by a few multi-plant records. It does not repair the rejected proportional-odds assumption, non-random sampling, reverse causality, or possible conditioning bias in Stage 2.
3.5. Heterogeneity in Material-Substitution Costs
For the 149 plants with usable responses on material-procurement costs, 69 (46.3%) reported increases, 66 (44.3%) reported no substantial change, and 14 (9.4%) reported decreases (Table 3). The combined material-substitution/process-modification group showed corresponding shares of 44.5%, 43.6%, and 11.8%. Input materials and performance requirements differed across industries, so cost changes are reported as proportions rather than pooled unit-price averages. Across all 278 plants, the most frequently reported implementation barriers were capital-investment pressure (92; 33.1%), technical implementation difficulty (76; 27.3%), access to mature or applicable technology (59; 21.2%), and difficulty determining project-compliance requirements (51; 18.3%). The perceived effects were pollution/carbon reduction and green transition (149; 53.6%), air-quality improvement (77; 27.7%), and life-cycle cost advantages (52; 18.7%). Barrier and perceived-effect items were single-choice responses; these pooled shares do not imply comparable experiences across industries.
Table 3.
Descriptive statistics for material-substitution costs, implementation barriers, and perceived effects.
3.6. Distribution of Project Capital Efficiency
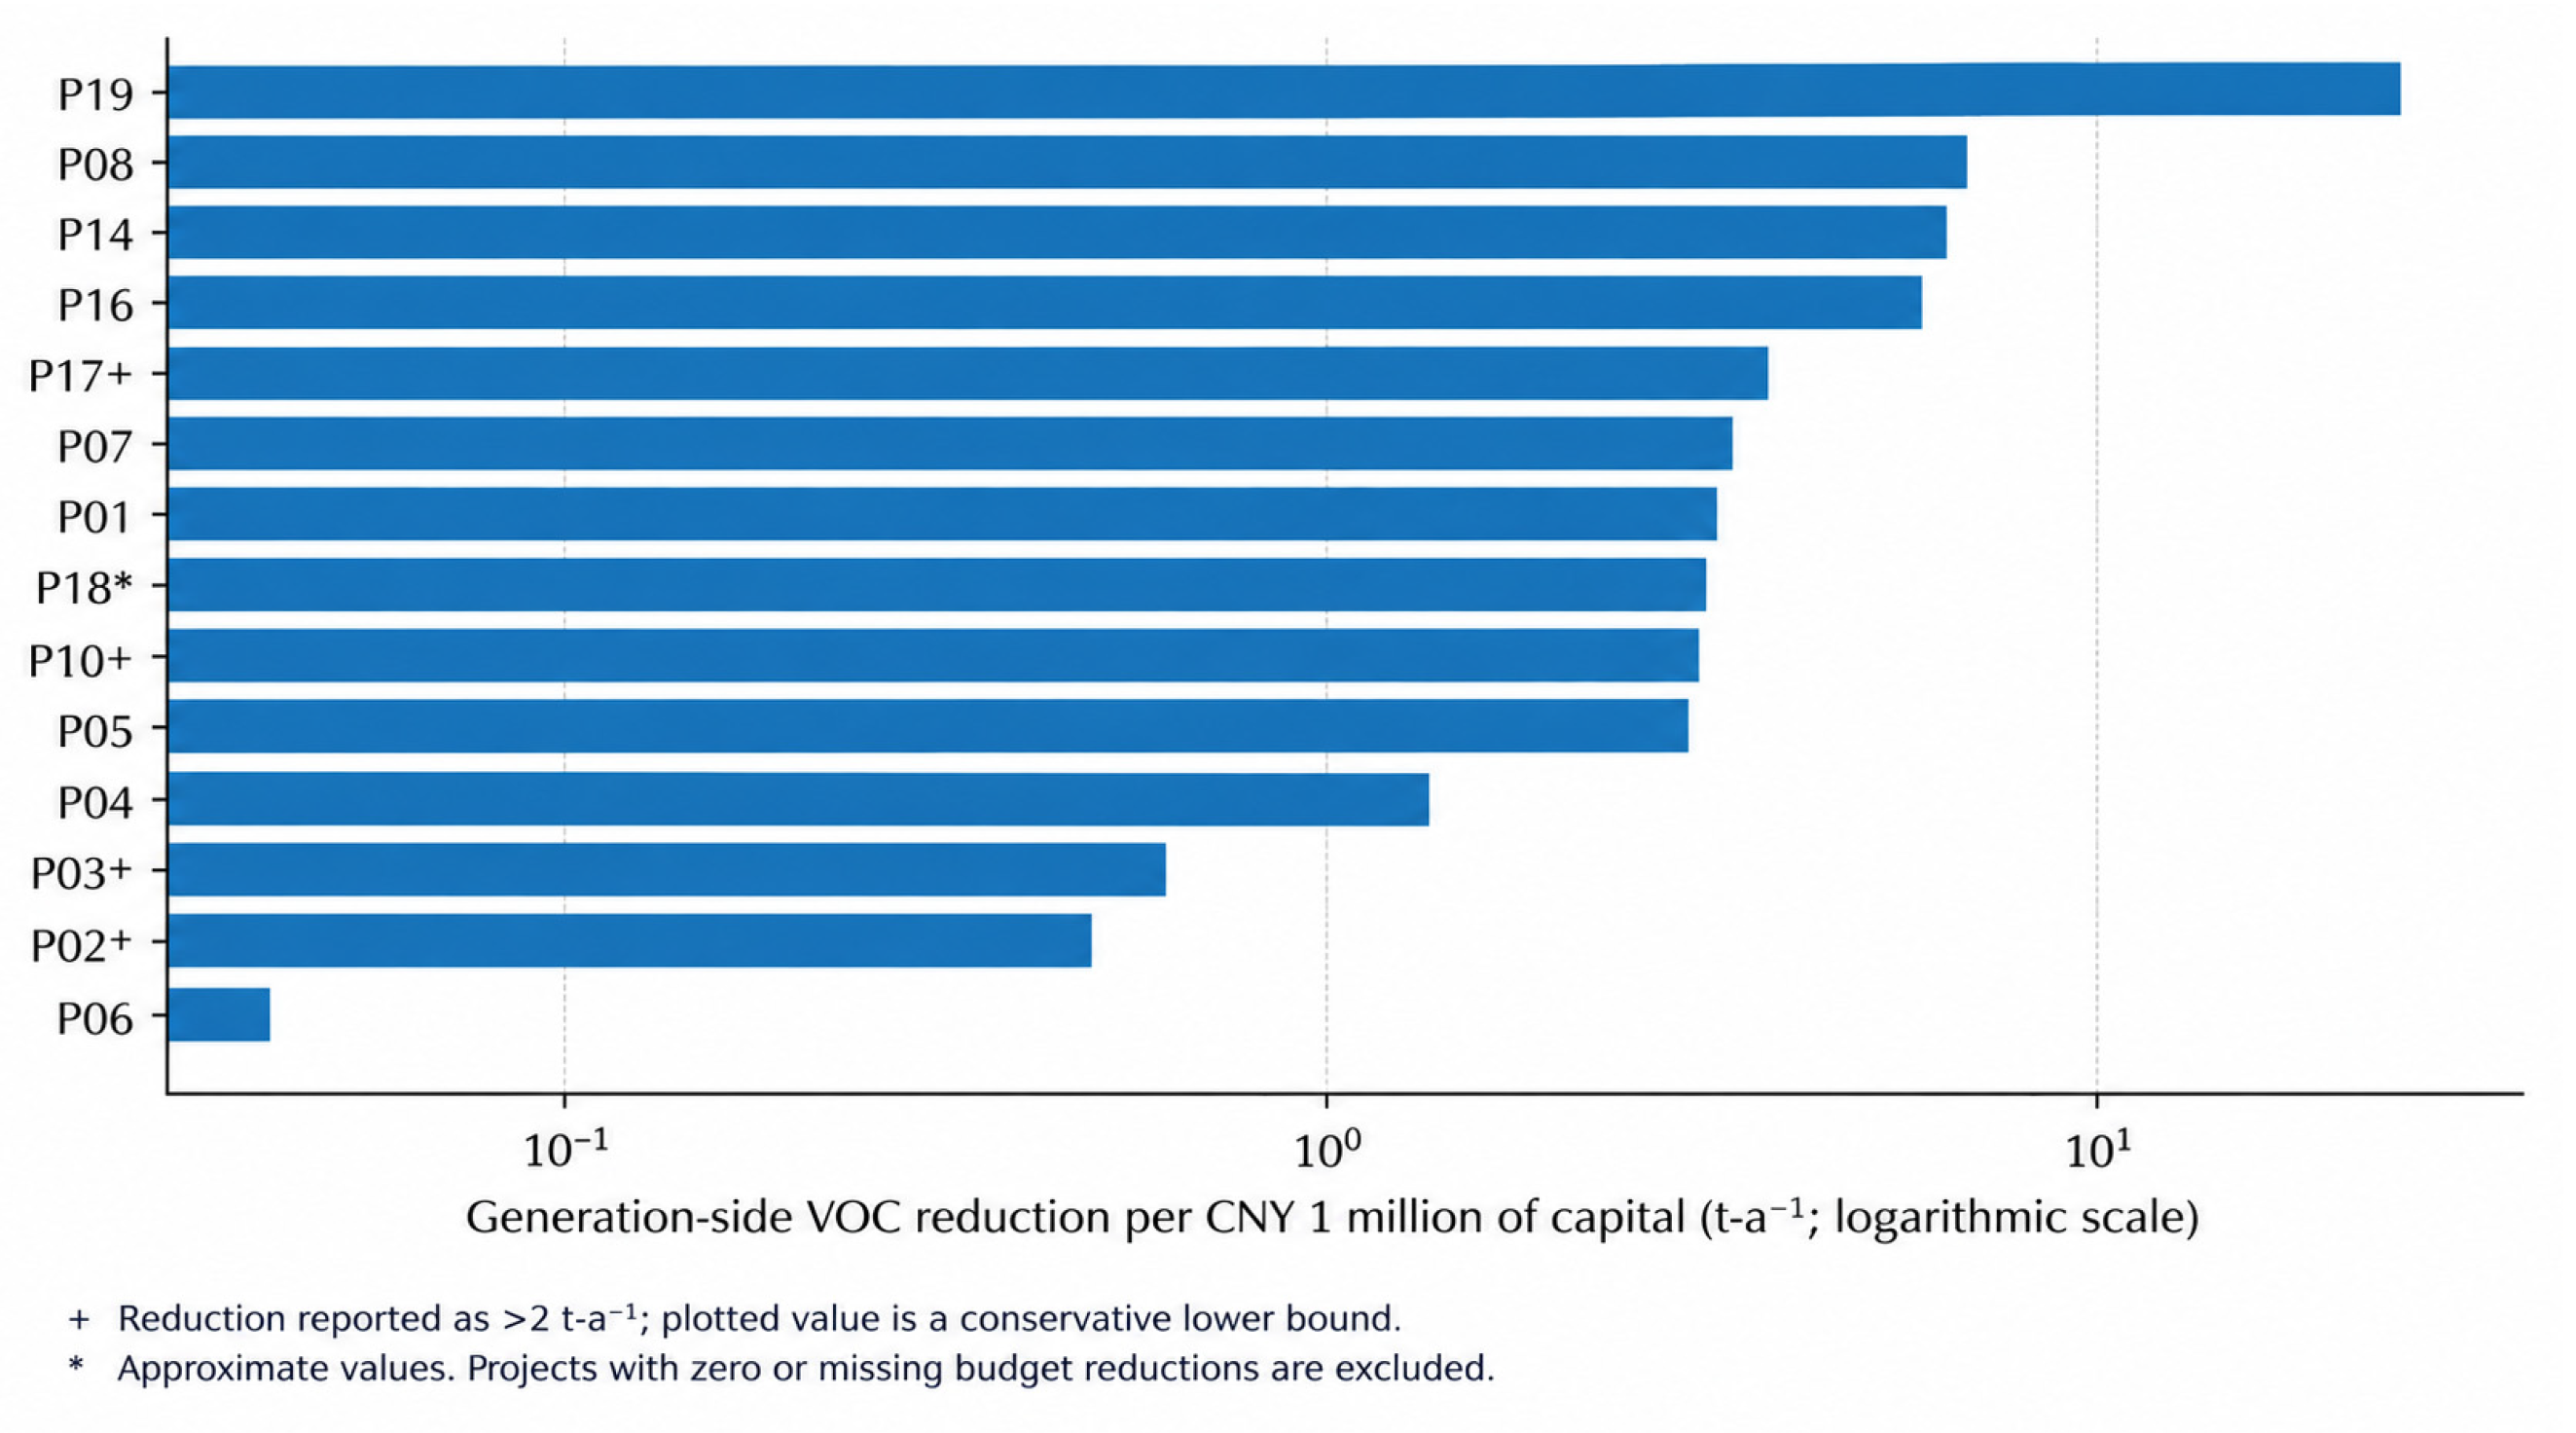
The 19 implemented projects had approximately CNY 134.93 million in combined reported capital and 292 t·a−1 in nominal generation-side VOC reduction. The corresponding aggregate capital-intensity descriptor is approximately CNY 462,000 per annual ton reduced; this descriptive total includes nominal threshold-based reduction values and should not be interpreted as an exact portfolio estimate. Capital efficiency was calculable for 14 projects and varied across approximately three orders of magnitude.
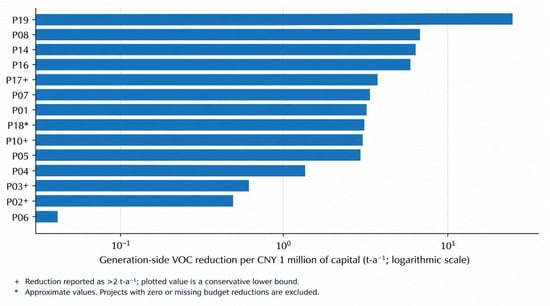
Project P19 had the highest reported point efficiency at 34.0 t·a−1 per CNY 1 million; P08, P14, and P16 had approximately 6.88, 6.75, and 6.36 t·a−1 per CNY 1 million, respectively. For projects with only “>2 t·a−1” reductions, Figure 6 depicts conservative lower bounds; records with incomplete capital information were excluded from point ratios. The figure displays project-level accounting descriptors rather than a ranking of intrinsic technical performance.
Figure 6.
Descriptive capital-efficiency comparison for 14 projects. A “+” marks projects reported as >2 t·a−1, for which plotted efficiencies are conservative lower bounds. Bar lengths must not be interpreted as a ranking of technical performance.
3.7. Annualized Social Net Cost and Incremental Environmental Investment in Verified Cases
Three technically verified projects illustrate how capital attribution and documented annual savings jointly determine modeled annualized social net cost (Table 4 and Figure 7). Table 4 reports capital, source reduction, direct savings, and the base-case annualized cost; unit costs and financial sensitivity ranges are described below to avoid an overcrowded table. All scenario calculations use the restricted resource-cost boundary defined in Section 2.6; environmental capital shares are assumptions rather than observed allocations.
Table 4.
Verified project investment, generation-side VOC reduction, direct savings, and annualized social net cost (base case).
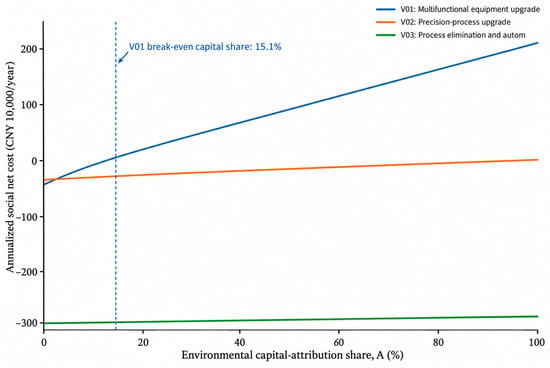
Figure 7.
Sensitivity of modeled annualized social net cost to the assumed environmental capital-attribution share λ in three verified projects; λ values are scenario assumptions, not observed shares.
Case V01 involved a multifunctional production-equipment upgrade with a total capital of CNY 25.50 million, generation-side VOC reduction of 2.60 t·a−1, and documented annual material savings of CNY 0.50 million. With λ = 1, r = 5%, and n = 10 years, the annualized social net cost was CNY 2.8024 million·a−1, equivalent to CNY 1.0778 million per annual ton reduced. The modeled annualized cost ranged from CNY 1.6360 million·a−1 to CNY 3.9374 million·a−1 across the specified financial scenarios. Under comparable production conditions, project records also reported a 50% reduction in production time and a 46% reduction in plate setup/calibration time; these operational benefits were not monetized. At the specified financial parameters and savings, the modeled break-even environmental capital-attribution share was λ* ≈ 15.1%.
Case V02 involved a precision-process upgrade with CNY 3.01 million in capital, 13.34 t·a−1 in verified generation-side VOC reduction, and CNY 0.40 million·a−1 in documented direct savings. The annualized social net cost was −CNY 0.0102 million·a−1 in the base case, equivalent to approximately −CNY 800 per annual ton reduced. It ranged from −CNY 0.1479 million·a−1 to +CNY 0.1238 million·a−1 across the discount-rate and lifetime sensitivity scenarios.
Case V03 combined process elimination with automation. Capital expenditure was CNY 0.735 million; verified generation-side VOC reduction was 90.67 t·a−1, and documented annual direct savings were CNY 3.00 million. The annualized social net cost was −CNY 2.9048 million·a−1 in the base case, equivalent to approximately −CNY 32,000 per annual ton reduced. It ranged from −CNY 2.9384 million·a−1 to −CNY 2.8721 million·a−1 across the specified financial scenarios and therefore remained negative throughout.
3.8. Synthesis of Technology Types
Four technology classes summarize the mechanisms seen in the survey and project records (Table 5): low-VOC material substitution, process precision/automation, process elimination or redesign, and multifunctional equipment upgrades. They differ in required investment, production constraints, and the possible transfer of environmental burdens. Table 6 summarizes qualitative life-cycle screening checks for each class. The classes are illustrative rather than measured cross-sector rankings; all comparisons require equivalent product performance and consistent activity boundaries.
Table 5.
Types of industrial VOC source-reduction technologies, evaluation priorities, and applicability boundaries.
Table 6.
Qualitative life-cycle burden-shifting screening matrix for four industrial VOC source-reduction technology types (potential effects; not quantified in this study).
4. Discussion
4.1. From End-of-Pipe Cost-Effectiveness to Production-Technology Decisions
The evidence suggests a practical distinction among reported implementation status, generation-side VOC reduction, and environmental investment attribution. A project can progress through planning and technical validation without completing deployment, and a multifunctional investment can improve both production and environmental performance. Evaluation should therefore link dated implementation milestones with activity-adjusted VOC accounting, separate environmental capital allocation, and a check for shifted burdens in energy, water, waste, and upstream supply chains.
4.2. For High-Emitting Enterprises, Completion Is the Bottleneck
The baseline ≥ 3 t·a−1 emissions category was associated with lower completion odds among plants already implementing or planning source-reduction measures but not with entry into those stages. High-emission plants can face more complex process requalification, customer specifications, and engineering requirements. Management programs could test this explanation by recording pilot-test outcomes, process validation, customer approvals, and retrofit completion dates alongside emissions and regulatory obligations.
4.3. Downstream Acceptance as a Signal of Commercialization Maturity
Compared with products already accepted by customers, early-stage supplier availability and customer interest corresponded to lower conditional completion odds. This pattern is consistent with the distinction between knowing a replacement technology is available and securing commercial qualification for its use. Future longitudinal monitoring should distinguish supplier readiness, customer trial, approval, and routine production.
4.4. Distinguish Total Investment from Incremental Environmental Cost
For multifunctional modernization, total project capital intensity, attributable environmental investment, and annualized social net cost address different questions. A comparable BAU production-investment baseline is the preferred basis for attribution; where it is unavailable, explicit λ scenarios reveal the extent to which a result depends on allocation. The restricted resource-cost calculation excludes transfer payments but does not monetize broader environmental or human-health benefits [18,19,20].
In V01, full assignment of equipment investment to VOC reduction yields a substantial annualized cost, while modeled attribution of approximately 15.1% of capital balances the independently documented direct material savings under the base assumptions. This figure is a break-even scenario threshold, not an empirically estimated environmental share of the equipment purchase.
4.5. Rank Technology Pathways by Mechanism and Life-Cycle Burden, Not by Material Label
Material substitution changes the VOC mass fraction of purchased inputs; precision and automation reduce input use and losses; process elimination removes VOC-intensive operations; and multifunctional upgrades integrate environmental and productive functions. Field research in flexible packaging connects source-level VOC reduction and energy performance [41]. Each pathway has a different investment and verification profile, so technical selection should prioritize equivalent product quality, feasibility, and verified reductions rather than rely on broad labels.
Life-cycle screening remains necessary where generation-side VOC reduction is large: alternative coatings may require additional drying energy or wastewater treatment, automation changes electricity and equipment demand, and redesign can shift upstream burdens. Table 6 provides a four-class screening matrix. LCA of thermal oxidation [42], pharmaceutical fugitive-emission accounting [43], and reviews of catalytic-treatment pathways [44,45] further distinguish source changes from terminal control and its secondary impacts. Digital circular-waste management [46] and multi-objective supply-chain optimization [47] provide methodological analogies for traceability and decision support, not VOC-sector performance evidence.
4.6. Management and Technical Implications
Technology assessment can be operationalized as a documented sequence: confirm project and completion status; calculate output-adjusted generation-side VOC reduction; identify the environmental increment of capital relative to BAU; report verified direct cost components and non-monetized operating benefits; and screen changes in energy, wastewater, hazardous waste, and upstream material impacts.
For higher-emitting plants, tracking technology diagnosis, pilot testing, process validation, customer qualification, and full-scale retrofit would help identify the principal delay points. Recording milestone dates and applicable requirements is particularly important when project status and economic expectations are reported in a single questionnaire.
A comparative case library for sustainable manufacturing could record equivalent product function, baseline and post-change output, material use and VOC content, electricity and thermal energy, water and waste, capital-investment components, customer qualification, and dated vouchers for directly verified savings. Digital monitoring and structured decision models offer options for organizing these records [46,47].
Generation-side VOC reduction (ΔG) should be distinguished from atmospheric emissions change (ΔE), especially when exhaust collection or terminal treatment is modified. Reporting both environmental capital attribution and annualized social net cost will make the economic and pollution-accounting implications of a source-reduction decision transparent.
4.7. Limitations and Future Research
Several limitations define the scope of interpretation. First, purposive recruitment in one coastal manufacturing cluster, missing invitation and nonresponse counts, and complete-case selection limit external validity; the estimates do not represent the national industrial population. Second, the cross-sectional survey records implementation status and perceptions simultaneously. Common-method variation, reverse causality, unobserved management quality, process complexity, and heterogeneous regulatory oversight remain possible explanations of the associations. Conditioning Stage 2 on entry can additionally induce selection-related associations, while the small surface-coating cell restricts subgroup inference; the ordered-logit and one-plant-per-enterprise checks provide directional rather than causal validation. Third, the capital-efficiency comparison combines point observations with reductions reported as “>2 t·a−1”, differing project and investment boundaries, and missing budget fields, precluding an intrinsic technology ranking. Fourth, only three purposively verified cases support the annualized cost calculations. Their cash-flow boundaries exclude unpriced external damages, and the environmental capital shares are modeled rather than observed for multifunctional projects. Finally, the absence of equivalent-product inventories, VOC speciation, and consistent upstream energy/material inventories prevents comprehensive LCIA or quantified photochemical ozone impacts. Future studies should use multi-region sampling frames, dated implementation panels, sparse-cell-sensitive modeling, verified BAU investment counterfactuals, and harmonized within-sector life-cycle inventories.
5. Conclusions
First, the analysis of 278 plant-level responses identified different reported stages of source-reduction implementation: a total of 63.3% had entered implementation/planning, 27.7% had completed measures, and 62.5% of the 176 entered plants combined material substitution with process modification.
Second, the correlates of entry differed from those of conditional completion. A revenue of CNY 20–400 million and recognition of economic benefits were associated with entry, while baseline VOC emissions ≥ 3 t·a−1 and reported technical barriers were associated with lower completion odds among entered plants. These stage-specific results suggest that support for initial technology appraisal and support for full process qualification address different managerial questions.
Third, apparent project capital efficiency was heterogeneous among 14 calculable projects, and environmental cost attribution materially influenced the three verified case scenarios. Under the 5%/10-year base case, V01’s modeled break-even environmental capital share was approximately 15.1%; V02 lay near break-even, and V03 had documented direct savings greater than its annualized capital charge.
The main contribution is a transparent screening procedure for sustainable manufacturing that connects implementation milestones, output-adjusted generation-side VOC reduction, attributable environmental capital, verified direct operating benefits, and potential shifts in energy, water, waste, and upstream impacts. Applying the procedure across sectors will require equivalent-function comparisons, documented BAU alternatives, and harmonized life-cycle measurements.
Author Contributions
Conceptualization, B.F. and G.Z.; methodology, B.F.; software, G.Z.; validation, G.Z.; formal analysis, B.F.; investigation, B.F.; resources, B.F. and G.Z.; data curation, B.F.; writing—original draft preparation, B.F.; writing—review and editing, B.F. and G.Z.; visualization, B.F.; supervision, B.F.; project administration, B.F.; funding acquisition, G.Z. All authors have read and agreed to the published version of the manuscript.
Funding
This research was funded by the Shanghai Municipal Bureau of Ecology and Environment, grant number Hu Huan Ke [2025] No. 7.
Institutional Review Board Statement
Ethical review and approval were waived for this study by the Institution Committee as per the Measures for the Ethical Review of Life Sciences and Medical Research Involving Humans (National Health Commission Scientific and Educational Document [2023] No.4).
Informed Consent Statement
Informed consent for participation was obtained from all subjects involved in the study.
Data Availability Statement
The data presented in this study are available on request from the corresponding author.
Acknowledgments
The authors acknowledge the support provided by the Shanghai Academy of Environmental Sciences.
Conflicts of Interest
The authors declare no conflicts of interest.
References
- Wang, H.; Sun, S.; Nie, L.; Zhang, Z.; Li, W.; Hao, Z. A review of whole-process control of industrial volatile organic compounds in China. J. Environ. Sci. 2023, 123, 127–139. [Google Scholar] [CrossRef] [Scilit]
- Simayi, M.; Shi, Y.; Xi, Z.; Ren, J.; Hini, G.; Xie, S. Emission trends of industrial VOCs in China since the clean air action and future reduction perspectives. Sci. Total Environ. 2022, 826, 153994. [Google Scholar] [CrossRef] [Scilit]
- Li, B.; Ho, S.S.H.; Li, X.; Guo, L.; Chen, A.; Hu, L.; Yang, Y.; Chen, D.; Lin, A.; Fang, X. A comprehensive review on anthropogenic volatile organic compounds (VOCs) emission estimates in China: Comparison and outlook. Environ. Int. 2021, 156, 106710. [Google Scholar] [CrossRef] [Scilit]
- Sun, Y.; Bai, L.; Qiao, Q.; Zhang, Y.; Wang, S.; Li, X.; Xu, W.; Zhao, R. Exploring the emission reduction potential of industries: A source-processing-end coordinated model and its application. J. Clean. Prod. 2022, 380, 134885. [Google Scholar] [CrossRef] [Scilit]
- Sun, Y.; Zhang, Y.; Zhao, H.; Qiao, Q.; Bai, L. Synergistic reduction potentials for VOCs in solvent-using industrial sectors: A case study of the packaging and printing industry in China. Resour. Conserv. Recycl. 2022, 187, 106638. [Google Scholar] [CrossRef] [Scilit]
- You, G.; Liu, H.; Sun, R.; Jin, Z.; Li, J.; Zhou, X.; Lu, S.; Xie, S. Characterizing VOCs emissions of five packaging and printing enterprises in China and the emission reduction potential of this industry. J. Clean. Prod. 2023, 420, 138445. [Google Scholar] [CrossRef] [Scilit]
- Liang, X.; Chen, L.; Liu, M.; Lu, H.; Lu, Q.; Gao, B.; Zhao, W.; Sun, X.; Ye, D. Improved emission factors and speciation to characterize VOC emissions in the printing industry in China. Sci. Total Environ. 2023, 866, 161295. [Google Scholar] [CrossRef] [Scilit]
- Zhu, L.; Guan, X.; Li, J.; Peng, Y.; Zhang, X.; Gong, A.; Li, M.; Xie, H.; Chen, S.; Li, J.; et al. Characterization of VOCs emissions and associated health risks inherent to the packaging and printing industries in Shandong Province, China. Sci. Total Environ. 2024, 946, 174108. [Google Scholar] [CrossRef] [Scilit]
- Lv, Z.; Liu, X.; Wang, G.; Shao, X.; Li, Z.; Nie, L.; Li, G. Sector-based volatile organic compounds emission characteristics from the electronics manufacturing industry in China. Atmos. Pollut. Res. 2021, 12, 101097. [Google Scholar] [CrossRef] [Scilit]
- Xu, Y.; Bai, L.; Sun, H.; Wang, X.; Du, J.; Zhao, J.; Jin, B.; Long, X.; You, X.; Cao, X. Sector-based volatile organic compounds (VOCs) emission characteristics of metal surface coating industry and their emission reduction potential in Henan, China. J. Environ. Chem. Eng. 2025, 13, 118128. [Google Scholar] [CrossRef] [Scilit]
- Liang, W.; Wang, J.; Zhang, C.; Liu, J. Synergetic emission reduction of VOCs and CO2 in the automotive coating industry using life cycle assessment (LCA) technology. J. Environ. Chem. Eng. 2025, 13, 115534. [Google Scholar] [CrossRef] [Scilit]
- Zhang, Y.; Wang, Y.; Zhang, J.; Liu, J.; Ruan, J.; Jin, X.; Liu, D.; Lu, Z.; Xu, Z. Research on waste gas treatment technology and comprehensive environmental performance evaluation for collaborative management of pollution and carbon in China’s pharmaceutical industry based on life cycle assessment (LCA). Sci. Total Environ. 2024, 919, 170555. [Google Scholar] [CrossRef] [Scilit]
- Chen, Z.; Lian, J.Z.; Zhu, H.; Zhang, J.; Zhang, Y.; Xiang, X.; Huang, D.; Tjokro, K.; Barbarossa, V.; Cucurachi, S.; et al. Application of Life Cycle Assessment in the pharmaceutical industry: A critical review. J. Clean. Prod. 2024, 459, 142550. [Google Scholar] [CrossRef] [Scilit]
- Yang, K.; Lv, B.; Shen, H.; Jing, G.; Zhou, Z. Life cycle assessment of pharmaceuticals: The ciprofloxacin hydrochloride case. Int. J. Life Cycle Assess. 2021, 26, 64–75. [Google Scholar] [CrossRef] [Scilit]
- Kong, W.; Lv, B.; Yang, S.; Shen, H.; Jing, G.; Zhou, Z. Case study on environmental safety and sustainability of pharmaceutical production based on life cycle assessment of enrofloxacin. J. Environ. Chem. Eng. 2021, 9, 105734. [Google Scholar] [CrossRef] [Scilit]
- Santos, A.; Barbosa-Póvoa, A.; Carvalho, A. Life cycle assessment in chemical industry—A review. Curr. Opin. Chem. Eng. 2019, 26, 139–147. [Google Scholar] [CrossRef] [Scilit]
- Chen, Z.; Wang, Y.; Huang, B.; Li, S.; Song, J.; Xu, X.; Xie, M.; Wang, X.; Long, Y. Normalization factor database for life cycle impact assessment in China. Environ. Impact Assess. Rev. 2024, 105, 107394. [Google Scholar] [CrossRef] [Scilit]
- Barahmand, Z.; Eikeland, M.S. Life Cycle Assessment under Uncertainty: A Scoping Review. World 2022, 3, 692–717. [Google Scholar] [CrossRef] [Scilit]
- Padilla-Rivera, A.; Hannouf, M.; Assefa, G.; Gates, I. A systematic literature review on current application of life cycle sustainability assessment: A focus on economic dimension and emerging technologies. Environ. Impact Assess. Rev. 2023, 103, 107268. [Google Scholar] [CrossRef] [Scilit]
- Savelski, M.J.; Slater, C.S.; Tozzi, P.V.; Wisniewski, C.M. On the simulation, economic analysis, and life cycle assessment of batch-mode organic solvent recovery alternatives for the pharmaceutical industry. Clean Technol. Environ. Policy 2017, 19, 2467–2477. [Google Scholar] [CrossRef] [Scilit]
- Qian, H.; Xu, S.; Cao, J.; Ren, F.; Wei, W.; Meng, J.; Wu, L. Air pollution reduction and climate co-benefits in China’s industries. Nat. Sustain. 2021, 4, 417–425. [Google Scholar] [CrossRef] [Scilit]
- Shi, Q.; Zheng, B.; Zheng, Y.; Tong, D.; Liu, Y.; Ma, H.; Hong, C.; Geng, G.; Guan, D.; He, K.; et al. Co-benefits of CO2 emission reduction from China’s clean air actions between 2013–2020. Nat. Commun. 2022, 13, 5061. [Google Scholar] [CrossRef] [Scilit]
- Xian, B.; Xu, Y.; Chen, W.; Wang, Y.; Qiu, L. Co-benefits of policies to reduce air pollution and carbon emissions in China. Environ. Impact Assess. Rev. 2024, 104, 107301. [Google Scholar] [CrossRef] [Scilit]
- Zhu, J.; Wu, S.; Xu, J. Synergy between pollution control and carbon reduction: China’s evidence. Energy Econ. 2023, 119, 106541. [Google Scholar] [CrossRef] [Scilit]
- Zhang, N.; Huang, X.; Qi, C. The effect of environmental regulation on the marginal abatement cost of industrial firms: Evidence from the 11th Five-Year Plan in China. Energy Econ. 2022, 112, 106147. [Google Scholar] [CrossRef] [Scilit]
- Tang, R.; Zhao, J.; Liu, Y.; Huang, X.; Zhang, Y.; Zhou, D.; Ding, A.; Nielsen, C.P.; Wang, H. Air quality and health co-benefits of China’s carbon dioxide emissions peaking before 2030. Nat. Commun. 2022, 13, 1008. [Google Scholar] [CrossRef] [Scilit]
- Hrovatin, N.; Cagno, E.; Dolšak, J.; Zorić, J. How important are perceived barriers and drivers versus other contextual factors for the adoption of energy efficiency measures: An empirical investigation in manufacturing SMEs. J. Clean. Prod. 2021, 323, 129123. [Google Scholar] [CrossRef] [Scilit]
- Trianni, A.; Cagno, E.; Dolšak, J.; Hrovatin, N. Implementing energy efficiency measures: Do other production resources matter? A broad study in Slovenian manufacturing small and medium-sized enterprises. J. Clean. Prod. 2021, 287, 125044. [Google Scholar] [CrossRef] [Scilit]
- Zhao, S.; Teng, L.; Ji, J. Impact of environmental regulations on eco-innovation: The moderating role of top managers’ environmental awareness and commitment. J. Environ. Plan. Manag. 2024, 67, 2229–2256. [Google Scholar] [CrossRef] [Scilit]
- Guo, L.; Hu, C.; Fan, M.; Mao, J.; Tian, M.; Wang, Z.; Wei, Y. Does informal environmental regulation matter? Evidence on the different impacts of communities and ENGOs on heavy-polluting firms’ green technology innovation. J. Environ. Plan. Manag. 2024, 67, 2668–2694. [Google Scholar] [CrossRef] [Scilit]
- Pan, A.; Jiang, P.; Wang, C.; Wang, F. Does environmental regulation promote green technological innovation of companies? Evidence from green patents of Chinese listed companies. Int. J. Low Carbon Technol. 2024, 19, ctad078. [Google Scholar] [CrossRef] [Scilit]
- Wang, G.; Feng, X.; Tian, L.G.; Tu, Y. Environmental regulation, green technology innovation and enterprise performance. Finance Res. Lett. 2024, 68, 105983. [Google Scholar] [CrossRef] [Scilit]
- ISO 14040:2006; Environmental Management—Life Cycle Assessment—Principles and Framework. ISO: Geneva, Switzerland, 2006.
- ISO 14044:2006; Environmental Management—Life Cycle Assessment—Requirements and Guidelines. ISO: Geneva, Switzerland, 2006.
- McCullagh, P. Regression models for ordinal data. J. R. Stat. Soc. Ser. B Methodol. 1980, 42, 109–127. [Google Scholar] [CrossRef] [Scilit]
- Brant, R. Assessing proportionality in the proportional odds model for ordinal logistic regression. Biometrics 1990, 46, 1171–1178. [Google Scholar] [CrossRef] [Scilit]
- Peterson, B.; Harrell, F.E., Jr. Partial proportional odds models for ordinal response variables. J. R. Stat. Soc. Ser. C Appl. Stat. 1990, 39, 205–217. [Google Scholar] [CrossRef] [Scilit]
- Williams, R. Generalized ordered logit/partial proportional odds models for ordinal dependent variables. Stata J. 2006, 6, 58–82. [Google Scholar] [CrossRef] [Scilit]
- Williams, R. Understanding and interpreting generalized ordered logit models. J. Math. Sociol. 2016, 40, 7–20. [Google Scholar] [CrossRef] [Scilit]
- Cameron, A.C.; Miller, D.L. A practitioner’s guide to cluster-robust inference. J. Hum. Resour. 2015, 50, 317–372. [Google Scholar] [CrossRef] [Scilit]
- Kliopova-Galickaja, I.; Kliaugaite, D. VOC emission reduction and energy efficiency in the flexible packaging printing processes: Analysis and implementation. Clean Technol. Environ. Policy 2018, 20, 1805–1818. [Google Scholar] [CrossRef] [Scilit]
- Tomatis, M.; Moreira, M.T.; Xu, H.; Deng, W.; He, J.; Parvez, A.M. Removal of VOCs from waste gases using various thermal oxidizers: A comparative study based on life cycle assessment and cost analysis in China. J. Clean. Prod. 2019, 233, 808–818. [Google Scholar] [CrossRef] [Scilit]
- Lin, Q.; Gao, Z.; Zhu, W.; Chen, J.; An, T. Underestimated contribution of fugitive emission to VOCs in pharmaceutical industry based on pollution characteristics, odorous activity and health risk assessment. J. Environ. Sci. 2023, 126, 722–733. [Google Scholar] [CrossRef] [Scilit]
- Zhao, Z.; Ma, S.; Gao, B.; Bi, F.; Qiao, R.; Yang, Y.; Wu, M.; Zhang, X. A systematic review of intermediates and their characterization methods in VOCs degradation by different catalytic technologies. Sep. Purif. Technol. 2023, 314, 123510. [Google Scholar] [CrossRef] [Scilit]
- Zhang, H.; Wang, Z.; Wei, L.; Liu, Y.; Dai, H.; Deng, J. Recent progress on VOC pollution control via the catalytic method. Chin. J. Catal. 2024, 61, 71–96. [Google Scholar] [CrossRef] [Scilit]
- Eslamipoor, R. Digital Technology’s Role in Circular Waste Management: A Systematic Review. Bus. Strategy Environ. 2026. early view. Available online: https://onlinelibrary.wiley.com/doi/full/10.1002/bse.70943 (accessed on 18 October 2026).
- Eslamipoor, R. Integrating Recycling and Emission Reduction: A Business Strategy Analysis With Multi-Objective Mixed-Integer Linear Programming Framework for Optimising Sustainable Closed-Loop Supply Chain Network Design. Bus. Strategy Environ. 2026. early view. Available online: https://onlinelibrary.wiley.com/doi/10.1002/bse.71137 (accessed on 18 October 2026).

Disclaimer/Publisher’s Note: The statements, opinions and data contained in all publications are solely those of the individual author(s) and contributor(s) and not of MDPI and/or the editor(s). MDPI and/or the editor(s) disclaim responsibility for any injury to people or property resulting from any ideas, methods, instructions or products referred to in the content. |
© 2026 by the authors. Licensee MDPI, Basel, Switzerland. This article is an open access article distributed under the terms and conditions of the Creative Commons Attribution (CC BY) license.