


Abstract
This study examines how first-sale market organization, realized producer returns, and harvesting-related fuel consumption are jointly associated in Vietnam’s offshore skipjack tuna gillnet fishery. Using 242 vessel observations from repeated cross-sectional surveys in 2008, 2012, 2018, and 2024, this study first compares channel-specific prices within the same vessel-year, avoiding the mechanical relationship between marketing shares and quantity-weighted average prices. Direct sales to processors are associated with an average observed price differential of about 12.4% relative to sales through middlemen among mixed-channel vessels. Realized annual producer price is not detectably associated with fishing days, trip frequency, or days spent at fishing grounds per trip after conditioning on vessel capacity and survey-year effects. Total annual fuel use is strongly associated with fishing days, engine power, and gear capacity; its association with realized price is positive but imprecise and specification-sensitive. An exact accounting decomposition suggests that, in the pooled estimates, the price–fuel association is more evident in catch scale than in fuel use per tonne, although the component coefficients are not statistically distinguishable and the price–catch relationship varies across survey waves. The findings connect fisheries value-chain governance with bioeconomic incentives and aggregate fossil-fuel consumption, while emphasizing that the repeated cross-sections do not identify causal behavioural responses.
1. Introduction
Wild-capture fisheries are simultaneously biological production systems, economic activities, and institutional arrangements. Bioeconomic models show that expected output prices and operating costs shape the returns to fishing and can alter harvesting incentives when effort, capacity, or access are imperfectly constrained [1,2,3,4]. At the same time, mechanized harvesting relies heavily on fossil fuel. Fuel use varies with fishing technique, stock conditions, vessel technology, and operating patterns, and constitutes a major source of capture-fisheries greenhouse-gas emissions [5,6,7,8]. Understanding environmental pressure in fisheries therefore requires attention to both the incentives facing producers and the physical scale of harvesting.
Those incentives are partly shaped downstream. Global value-chain research emphasizes that transaction complexity, codifiability, supplier capabilities, bargaining power, and coordination determine how value and risk are distributed among chain actors [9,10]. In fisheries and aquatic-food chains, upgrading, certification, traceability, buyer requirements, and access to infrastructure can reorganize producer–buyer relationships rather than simply change a spot-market price [11,12,13,14,15,16]. A recent scoping review likewise shows that fish-value-chain research has increasingly moved beyond margin accounting toward governance, sustainability, resilience, and equity, while much of the empirical literature remains case-based and descriptive [17].
Middlemen are central to this institutional setting. They may aggregate landings, provide credit and liquidity, arrange transport and ice, absorb marketing risk, and connect dispersed producers to buyers; the same relationships may also create dependence, information asymmetry, or market power. Evidence from East Africa, Indonesia, Mexico, and the Amazon shows that intermediary relations can affect livelihood security, bargaining, market access, and fishing behaviour in heterogeneous ways [18,19,20,21,22,23,24,25]. Market-chain institutions therefore cannot be classified a priori as either environmentally beneficial or harmful. Their effects depend on local governance, resource conditions, and the alternatives available to fishers [26,27].
Tuna fisheries provide a particularly relevant setting because high-value and internationally traded products link remote fishing operations to processors, exporters, certification schemes, and traceability requirements. Studies in Indonesia and the Philippines show that market incentives can coexist with patron–client relations and that sustainability-oriented upgrading may be constrained by unequal capabilities and power along the chain [15,16,28,29,30]. International policy frameworks similarly treat value chains, market access, resource governance, and harmful capacity-enhancing subsidies as connected concerns rather than separate domains [31,32,33].
Vietnam’s offshore fisheries bring these literatures together. Previous studies document open-access rent dissipation, differences in fishing efficiency, government support and profitability, and the role of vessel and operational characteristics in catches [34,35,36,37]. Revenue distribution across fishers, intermediaries, processors, and downstream actors has long been a central concern in seafood value-chain analysis [38]. Research on Vietnamese tuna chains similarly documents unequal bargaining positions and value distribution among fishers, middlemen, and processors [39,40,41]. Most directly, Pham, et al. [42] show theoretically and empirically that middlemen’s market power can affect both fishermen’s rents and resource-exploitation incentives in a Vietnamese open-access skipjack fishery. What is less developed is vessel-level evidence that separates the price dimension of first-sale organization from observable fishing effort and aggregate fuel consumption, while distinguishing aggregate fuel use from fuel-use intensity.
These relationships may operate through two potentially offsetting margins. On the one hand, stronger expected returns can increase incentives to expand harvesting activity or catch, potentially raising aggregate fuel consumption when additional output requires greater fishing activity. On the other hand, economic incentives to economize on fuel can encourage operational adjustments, including more efficient fishing techniques, trip planning, and search behaviour, thereby reducing fuel use per unit of catch [8,37,43]. Evidence from Vietnamese offshore tuna fisheries also indicates that fuel-cost incentives are associated with fuel-use efficiency [37]. Consequently, improvements in operational efficiency need not reduce total fuel consumption if lower fuel use per unit of catch is offset by an expansion in harvesting scale. Distinguishing catch scale from fuel-use intensity is therefore important for assessing how economic incentives are associated with aggregate fossil-fuel use.
This separation is important for identification. Standard bioeconomics concerns the expected marginal price known or anticipated when effort decisions are made. The survey used here observes an ex-post annual realized producer price. That realized price can be jointly determined with catch quality, landing timing, buyer relationships, fishing-ground productivity, and other unobserved factors. It should therefore not be interpreted as an exogenous price shock or as the price entering a structural effort-supply equation. Similarly, a vessel’s quantity-weighted average price is mechanically related to the shares sold through channels with different prices. The primary market-organization evidence in this paper consequently comes from the within-vessel difference between channel-specific prices for vessels using both channels, rather than from treating the middlemen share as an ordinary determinant of the same weighted price.
A second distinction concerns environmental measurement. Total annual fuel use captures harvesting-related fossil-fuel consumption, whereas litres per tonne captures an intensity ratio. The two answer different questions: aggregate fuel consumption can rise with harvest scale even when fuel intensity falls, while stock recovery or technological change can alter intensity without a parallel change in total output [8,44,45,46]. This distinction is consistent with the broader economic case for aligning incentives, capacity, and resource management rather than treating efficiency gains alone as sufficient for sustainability [47].
Using 242 vessel observations from four repeated cross-sections (2008, 2012, 2018, and 2024), the paper addresses four research questions (RQ1–RQ4): whether direct-processor and middlemen prices differ within mixed-channel vessels; whether realized producer price is conditionally associated with fishing days, trip frequency, or days spent at fishing grounds per trip; how realized price is associated with annual fuel use before and after conditioning on observable fishing effort, alongside vessel capacity; and how the pooled price–fuel association decomposes between catch scale and fuel-use intensity. The empirical strategy is deliberately associational. Survey-year fixed effects and observed vessel controls improve conditional comparability but cannot remove endogeneity from unobserved vessel quality, stock conditions, buyer selection, or expectations. The contribution is therefore not a causal estimate of market governance on fishing effort. It is a measurement and empirical-design contribution that connects first-sale price differences, observable fishing-effort measures, and fossil-fuel consumption without imposing a causal mediation pathway that the data cannot identify.
2. Study Context and Conceptual Framework
2.1. Study Context
This study focuses on the offshore skipjack tuna (Katsuwonus pelamis) gillnet fishery in Khanh Hoa Province on Vietnam’s South Central Coast. Vessels operate in the same broad fishery but can market catch through middlemen, directly to processing companies, or through both channels within the same survey year. The coexistence of channels is analytically valuable because it permits a within-vessel-year comparison of observed channel prices for mixed-channel sellers rather than a comparison only across vessels that self-select into different marketing arrangements.
The fishery is also institutionally relevant. Vietnamese offshore fisheries have been characterized by open-access pressures, heterogeneous vessel efficiency, and policy support that affects profitability and incentives [34,35,36]. Tuna-chain studies identify middlemen as providers of finance, aggregation, logistics, and market access while also documenting bargaining asymmetries and uneven value capture [39,40,41]. Pham, Flaaten and Skonhoft [42] provide the closest theoretical benchmark by showing that intermediary market power can alter both rent distribution and exploitation incentives. The present framework complements that work by keeping the empirical links among marketing organization, realized returns, fishing effort, and fuel consumption analytically distinct.
The conceptual framework therefore treats the value chain as part of the economic institution within which harvesting occurs, but not as a stand-alone fisheries-management regime. Market governance can shape prices, finance, information, and buyer access; harvesting responses still depend on vessel technology, resource conditions, operating costs, expectations, and the rules governing access and capacity [27,31]. Four empirical questions follow from this distinction.
2.2. Marketing Channels and Producer Returns
Value-chain governance concerns how transactions are coordinated and how information, risks, capabilities, and economic value are distributed among actors [9]. Fisheries research shows that intermediary ties may simultaneously provide services and constrain choice. Middlemen can reduce transaction and search costs, extend credit, smooth income, and organize logistics, yet patron–client ties and thin local markets can also reduce producers’ outside options or bargaining power [18,20,21,22,25]. The direction and magnitude of the resulting price differential are therefore empirical questions rather than assumptions about intermediary behaviour.
In the present fishery, a substantial set of vessels uses both channels. This creates a particularly transparent estimand: the log difference between the price received from processing companies and the price received through middlemen for the same vessel-year. The comparison removes vessel-year characteristics that are common to the two transactions, although it does not remove channel-specific differences in fish quality, grade, timing, contract terms, or financing. It is thus stronger than a simple cross-vessel price comparison but remains observational.
- RQ1. Among vessels using both marketing channels, are observed producer prices received from direct sales to processing companies higher than those received through middlemen?
RQ1 concerns an observed within-vessel channel-price differential rather than the causal effect of switching buyers. This qualification matters because fishers may allocate higher-grade or differently timed landings to processors, while credit or relational obligations may influence what is sold to middlemen. Similar embedded relationships are documented across small-scale fisheries (SSF) and tuna chains [14,15,19,28].
2.3. Producer Returns and Fishing Effort
Standard fisheries bioeconomics models harvesting choices as responses to expected revenues and costs, conditional on technology and resource conditions [1,2,4,48]. Empirical effort models likewise find that stock conditions, fleet characteristics, catch rates, prices, and fuel costs can jointly influence effort allocation [3]. A stylized vessel objective can therefore be represented as
where i indexes a vessel observation and t denotes the survey year associated with that observation, πi denotes vessel profit, denotes the expected producer price relevant to the harvesting decision, Ei denotes fishing effort, Ki represents vessel capital and gear capacity, St denotes stock abundance in survey year t, and wi represents input prices. Under conventional assumptions, higher expected output prices increase the marginal return to harvesting, whereas higher input prices reduce it.
The survey does not observe , stock abundance, fishing-ground conditions, or market fuel prices at the decision margin. It observes instead a quantity-weighted realized annual producer price, Pricei. Realized and expected prices may be correlated, but they are not conceptually interchangeable: the realized price can incorporate ex-post catch composition, quality, landing timing, buyer choice, and shocks that occur after fishing decisions. Consequently, the empirical price coefficients below are conditional associations, not structural effort-supply elasticities.
- RQ2. Are realized producer prices associated with observable fishing-effort measures—annual fishing days, trip frequency, and days spent at fishing grounds per trip—after accounting for vessel capacity and common survey-year conditions?
2.4. Producer Returns and Fuel Consumption
Ecological economics distinguishes aggregate material and energy throughput from unit-level efficiency [44,45]. The distinction is especially relevant in capture fisheries because fuel is both a major variable input and a major source of harvesting-related emissions [5,6,7]. Fuel requirements can fall when stocks recover or fishing techniques improve, but gains in fuel intensity need not reduce aggregate fuel use if harvesting scale expands [8].
Fueli denotes total annual vessel fuel consumption and is interpreted narrowly as harvesting-related fossil-fuel consumption, not as a complete environmental-impact indicator. It should vary with fishing effort and vessel capacity, while its association with realized producer returns may reflect a mixture of operating scale, technology, resource conditions, expectations, and unobserved productivity. Because realized producer price and total fuel consumption are jointly observed annual outcomes, no directional causal interpretation is imposed.
- RQ3. How is realized producer price associated with annual fuel use before and after conditioning on observable fishing effort, alongside vessel capacity?
This formulation retains the economic logic that returns and resource use may be connected while avoiding the stronger claim that realized price directly causes fuel consumption. The estimating equations and control vectors are specified only in Section 4.
2.5. Harvest Scale and Fuel-Use Intensity
Aggregate fuel use can change through harvested scale, fuel use per unit of catch, or both. These margins carry different interpretations. Lower litres per tonne can be consistent with higher total fuel consumption when catch expands, and stock recovery can reduce fuel intensity even without a market-induced behavioural response [6,8]. More generally, technical efficiency can affect welfare and resource use differently depending on management institutions [46]. Fuel-use intensity may also respond to operational adjustments, including fishing techniques and trip planning, so improvements in operational efficiency can reduce fuel use per unit of catch without necessarily reducing aggregate fuel consumption when harvesting scale expands [8,43].
The analysis therefore distinguishes annual fuel consumption, annual catch, and fuel-use intensity (litres per tonne). Fuel-use intensity is a physical ratio, not a production-frontier measure of technical efficiency. Their exact accounting identity is defined in Section 3 and used in Section 4 to decompose common-regressor coefficients. This accounting step prevents an aggregate fuel relationship from being mislabelled as an intensity relationship.
- RQ4. Is the observed association between realized producer prices and total annual fuel consumption reflected primarily in annual catch, fuel-use intensity, or both?
RQ4 is deliberately framed as a decomposition question rather than a directional hypothesis. Statistical significance in one component and insignificance in another is not, by itself, evidence that the components differ. The empirical interpretation instead relies on their estimated magnitudes, uncertainty, and the accounting decomposition developed in Section 4.
3. Data and Variable Construction
3.1. Data and Sample
The study uses vessel-level survey data from the offshore skipjack tuna gillnet fishery in Khanh Hoa Province. The analytical sample contains 242 vessel observations from four waves: 58 in 2008, 57 in 2012, 49 in 2018, and 78 in 2024. The corresponding registered offshore gillnet fleets in Khanh Hoa Province comprised 225, 258, 210, and 196 vessels, respectively, so the analytical samples represented approximately 25.8%, 22.1%, 23.3%, and 39.8%, respectively, of the registered provincial fleet in the four survey years. These registered-fleet figures provide context for sample coverage; vessels were not drawn from a complete enumerated sampling frame.
Fieldwork in all four waves covered the Vinh Phuoc, Xuong Huan, and Phuoc Dong wards of Nha Trang City, where most of the province’s offshore skipjack tuna gillnet vessels were located. Interviews were conducted at Hon Ro fishing port and, when more convenient for respondents, at the residences of vessel owners or captains/skippers. Eligible vessels were active offshore skipjack tuna gillnet vessels meeting the engine-capacity criterion applied in the respective survey wave: at least 50 hp in 2008 and at least 90 hp in 2012, 2018, and 2024. Vessels were purposively selected from eligible active vessels identified in the survey area, with selection designed to cover different engine-capacity categories. Structured face-to-face interviews were conducted primarily with vessel owners, with captains/skippers interviewed where appropriate. Respondents provided information on fishing operations, catch and marketing, vessel characteristics, fuel use, and related economic variables. The same core questionnaire was administered across the four survey waves, with the survey year updated as appropriate; the core questionnaire items underlying the variables used in the present analysis are reproduced in Appendix B. Of the 70, 72, 68, and 80 vessels approached in 2008, 2012, 2018, and 2024, respectively, 58, 57, 49, and 78 completed the survey, corresponding to respective participation rates of 82.9%, 79.2%, 72.1%, and 97.5%. All surveys were administered by the same researcher using consistently defined core variables and comparable measurement procedures across waves.
As an external benchmark for sample composition, mean engine capacity in each survey wave was compared with the corresponding mean for the registered offshore gillnet fleet in Khanh Hoa Province, based on provincial vessel-registration reports [49,50,51,52]. The sample means were 249.6, 311.9, 413.2, and 411.4 hp in 2008, 2012, 2018, and 2024, respectively, compared with respective registered-fleet means of 231.5, 303.1, 402.6, and 405.8 hp. Two-sided one-sample t-tests did not reject equality of the sample and registered-fleet means in any survey year (all p > 0.30; Table A8). These comparisons provide an external benchmark showing that the samples were broadly comparable with the registered fleet in terms of mean engine capacity, but they do not establish probability-based representativeness across all vessel characteristics.
The surveys were not originally designed around a prespecified minimum detectable effect, and no ex-ante statistical-power calculation was used to determine sample size. Statistical precision for the empirical estimates is therefore assessed using two-sided 95% confidence intervals and heteroskedasticity-robust standard errors, as described in Section 4.6.
The data are repeated cross-sections, not a verified longitudinal vessel panel. Each interview was assigned a study-specific survey identifier, but no official vessel-registration or owner identifier was recorded that would permit vessels or common ownership to be verified across observations. The analysis therefore relies on within-wave and pooled cross-vessel variation and does not use vessel fixed effects or interpret observations as repeated measurements of the same units.
The surveys record annual catch, quantities and prices by marketing channel, fuel consumption, fuel-support variables, vessel characteristics, and fishing operations. Restricting the sample to one province and fishing method creates a relatively coherent fishery-market setting but limits external validity. Results should be read as evidence from this offshore skipjack gillnet fishery, not as nationally representative estimates for Vietnam’s capture fisheries.
Monetary variables are expressed in constant 2024 Vietnamese dong (VND). Nominal values from 2008, 2012, and 2018 were multiplied by 2.7755, 1.3865, and 1.1875, respectively, using GDP-deflator data from the World Development Indicators; 2024 values require no adjustment [53]. These deflated producer-price and subsidy variables are used in the empirical models. Table 1 summarizes the definitions, measurement, transformations, and analytical roles of the variables used in the empirical analysis.
Table 1.
Variable definitions, notation, and analytical roles.
3.2. Marketing Channels and Producer-Price Variables
For vessel observation i, let Catchi denote the vessel’s annual landed and marketed quantity of skipjack tuna and and denote, respectively, the portions of that same annual skipjack tuna catch sold through middlemen and directly to processing companies. Thus, Catchi, , and refer to the same species, survey year, and marketed catch base, and satisfy . Quantities of other species, if any, are not included in these variables. Consistent with the notation summarized in Table 1, Middlemeni denotes the share of the annual marketed skipjack tuna catch sold through middlemen:
Middlemeni ranges from zero to one. In the pooled sample, 92 observations sold all catch through middlemen, 144 used both middlemen and direct-processor channels, and six sold all catch directly to processors. Thus, 236 observations report positive middlemen sales and 150 report positive direct sales.
Let and denote the real producer prices received through middlemen and direct processors, respectively. For the 144 mixed-channel observations, both prices are observed within the same vessel-year. The within-vessel log channel-price differential used for RQ1 is defined as follows:
A positive ∆i indicates that the observed direct-processor price exceeds the middlemen price for the same vessel-year. Because fish grade, size, timing, and quality are not separately observed by channel, ∆i is interpreted as an observed within-vessel channel-price differential rather than a causal effect of direct marketing.
For the fishing-effort and fuel-consumption analyses, Pricei denotes the vessel’s quantity-weighted realized average producer price across the marketing portfolio actually used:
The empirical regressions use ln(Pricei). Pricei summarizes the average real producer return per kilogram across channels. Middlemeni is a quantity weight in Equation (4); accordingly, the main analysis does not regress ln(Pricei) on Middlemeni as evidence that intermediary dependence determines producer prices. Middlemeni remains a descriptor of marketing composition, while , , and ∆i provide the primary evidence on channel-price differences.
3.3. Fishing Effort, Catch, and Fuel-Consumption Outcomes
Observable fishing effort is represented by three trip- and time-based measures. FishingDaysi is the primary annual effort measure. The survey also records Tripsi, the number of fishing trips per year, and DaysPerTripi, the average number of days spent at fishing grounds per trip. DaysPerTripi excludes transit time from port to the fishing grounds and from the fishing grounds back to port. While at the fishing grounds, however, the measure includes time spent searching for fish, waiting, and moving between fishing grounds, rather than only time actively fishing. Because this offshore fishery involves multi-day operations at sea, the survey did not obtain a sufficiently reliable separate measure of active fishing time within each trip. Annual fishing days are constructed as
FishingDaysi = Tripsi × DaysPerTripi
The preferred effort models use ln(FishingDaysi). Separate outcomes ln(Tripsi) and ln(DaysPerTripi) distinguish trip frequency from time spent at fishing grounds per trip. These variables are observable or nominal fishing-effort measures rather than complete measures of effective fishing effort because fishing-ground distance, hours actively fishing, and several other effort dimensions are unavailable.
Annual landed and marketed skipjack tuna catch (Catchi) is measured in tonnes and represents harvesting scale rather than fishing effort itself, as catch also reflects resource abundance, fishing-ground conditions, vessel capacity, skipper performance, and other factors not fully observed in the survey. The empirical models use ln(Catchi).
Annual vessel fuel consumption (Fueli) was obtained directly from respondents as the total quantity of diesel consumed by the vessel during the survey year. Respondents reviewed their vessel records and aggregated the recorded fuel quantities over the year when reporting this value. The questionnaire also recorded typical diesel consumption per fishing trip, which was used as a cross-check on the reported annual total rather than to construct Fueli. Thus, Fueli is a directly reported annual measure, expressed in litres/year, rather than an annualized estimate constructed from trip frequency and fuel consumption per trip. The empirical models use ln(Fueli). As discussed in Section 2, this represents harvesting-related fossil-fuel consumption rather than a comprehensive measure of environmental impact.
Fuel-use intensity (FuelIntensityi) is measured as litres of fuel consumed per tonne of catch:
and enters the empirical models as ln(FuelIntensityi). It is a physical resource-use ratio rather than a measure of technical efficiency derived from a production-frontier approach.
By construction, these variables satisfy the exact accounting identity
ln(Fueli) = ln(Catchi) + ln(FuelIntensityi).
Equation (7) provides the accounting basis for the scale–intensity decomposition developed in Section 4.
3.4. Vessel Capacity and Observed Operating Characteristics
The preferred specifications characterize observable vessel capacity and operations using Enginei, Gillnetsi, FishingDaysi, and Agei. Enginei is engine power measured in horsepower, while Gillnetsi is the number of gillnets and represents gear capacity. Enginei, Gillnetsi, and FishingDaysi enter the preferred models in natural logarithms. This formulation gives proportional or elasticity-type interpretations to their conditional associations and reduces the influence of the wide absolute scale of vessel characteristics.
Agei is vessel age in years and is retained in levels as a parsimonious capital-vintage control. The dataset also contains vessel length, fishing experience, and crew size. These are not included simultaneously in the preferred models because they overlap conceptually with vessel scale, human capital, or operating capacity and would increase model complexity without resolving the principal sources of endogeneity. They may be used in supplementary sensitivity checks where appropriate.
All preferred cross-vessel regressions include survey-year indicators for 2012, 2018, and 2024, with 2008 as the reference year. These indicators absorb common differences across survey waves, including broad market, technological, policy, and resource conditions. They cannot control for unobserved vessel-specific determinants.
3.5. Fuel-Support Variables
The survey records whether a vessel received government fuel support and the real monetary amount received. Vietnam has implemented several fisheries-support programmes aimed at offshore fleet development, whose evolution and performance have been reviewed by Le, et al. [54]. More generally, capacity-enhancing subsidies can affect fishing profitability and harvesting incentives [55,56,57,58], while studies of Vietnamese fisheries document effects on vessel profitability and related economic outcomes under other empirical designs [36,37,59,60]. The earlier specification emphasized subsidy intensity, defined as real subsidy per litre of fuel consumed. That ratio is retained for descriptive comparability only because Fueli, the main fuel-consumption outcome, appears in its denominator; placing it on the right-hand side of a fuel equation would create a mechanical relationship.
The main models therefore omit subsidy intensity. Sensitivity analysis instead uses an indicator for positive fuel-support receipt and ln(1 + TotalSubsidyi). These variables are still potentially endogenous to eligibility rules, vessel characteristics, and fishing effort and are not treatment variables. The analysis is consequently descriptive and does not attempt to identify a causal subsidy effect, a distinction that is especially important given the WTO Agreement on Fisheries Subsidies, which entered into force in 2025, and the continuing policy debate over harmful support [33,61].
3.6. Descriptive Statistics
Table 2 reports pooled descriptive statistics for the variables used in the empirical analysis. The 242-vessel sample exhibits substantial variation in marketing organization, harvesting scale, fuel use, and vessel capacity. On average, 79.1% of catch is sold through middlemen, and the realized producer price is VND 34,018/kg in constant 2024 prices. Average annual catch is 94.4 tonnes, annual fuel consumption is 36,224 litres, and fuel-use intensity is 392.6 litres per tonne.
Table 2.
Pooled descriptive statistics.
Table 3 summarizes variables by survey year. The mean share of catch sold through middlemen declines from 91.9% in 2008 to 70.6% in 2024, while the mean real producer price falls from approximately VND 40,215/kg to VND 31,101/kg. Over the same period, average engine capacity and annual catch increase, whereas annual fishing days fall markedly in 2024 and fuel-use intensity varies non-monotonically across survey waves. These patterns are descriptive rather than causal and motivate the inclusion of survey-year indicators in the multivariate models.
Table 3.
Descriptive statistics by survey year.
Figure 1 complements Table 3 by displaying the survey-wave means and 95% confidence intervals for the four principal study outcomes: realized producer price, annual skipjack tuna catch, annual fuel consumption, and fuel-use intensity. The figure highlights substantial changes across survey waves, while these patterns remain descriptive rather than causal.
Figure 1.
Key study outcomes across survey waves: (a) realized producer price; (b) annual skipjack tuna catch; (c) annual fuel consumption; and (d) fuel-use intensity. Points indicate survey-wave means, and error bars indicate 95% confidence intervals. Producer prices are expressed in constant 2024 VND.
4. Empirical Strategy
4.1. Overview and Empirical Interpretation
The empirical analysis follows four stages aligned with RQ1–RQ4. Equations (8)–(14) define the estimators and the coefficient decomposition. The design separates: (i) a within-vessel comparison of channel-specific prices; (ii) conditional associations between realized price and observable fishing effort; (iii) conditional associations with total annual fuel use; and (iv) a decomposition of common-regressor coefficients between catch scale and fuel intensity.
Except for the paired channel-price comparison, the preferred models are pooled cross-vessel OLS regressions with survey-year fixed effects. Heteroskedasticity-consistent (HC1) standard errors are used for primary inference, with HC3 and other sensitivity checks reported in the Appendix A. Both HC1 and HC3 allow for heteroskedasticity but rely on conditional independence across vessel observations. This assumption cannot be verified with respect to common ownership because owner identifiers are unavailable. The data therefore do not permit identification of multiple sampled vessels operated by the same owner or owner-level clustering. If regression disturbances are correlated among vessels under common ownership, the reported heteroskedasticity-robust standard errors could understate sampling uncertainty. The estimands are partial associations conditional on observed controls, not causal effects. This conservative interpretation is consistent with the conceptual distinction between expected prices in bioeconomic theory and the realized annual price observed in the survey.
4.2. Within-Vessel Channel-Price Comparison
RQ1 is examined using the 144 mixed-channel vessel observations for which both direct-processor and middlemen prices are observed. The primary parameter of interest is the mean within-vessel log-price difference, estimated by the sample mean of ∆i. Because ∆i is a within-vessel log-price difference, vessel-year characteristics common to both marketing channels are differenced out mechanically. The null hypothesis is that the mean channel-price differential is zero, with a positive differential corresponding to the directional alternative posed by RQ1.
Let denote the sample mean of the vessel-level log-price differentials defined in Equation (3). For interpretation, the estimated mean log difference is converted to percentage terms as . The analysis reports the overall estimate and its 95% confidence interval, together with corresponding estimates by survey wave. Although RQ1 is formulated as a directional research question, conventional two-sided inference is reported in the tables. These comparisons are not interpreted as causal effects of direct marketing because fish sold by the same vessel through different channels may differ in unobserved quality, grade, size, timing, or other transaction-level characteristics.
As a supplementary diagnostic, the observed relationship between Pricei and Middlemeni is compared with the relationship obtained using a synthetic quantity-weighted price constructed from survey-year mean channel prices and each vessel’s observed marketing shares. This exercise is not intended as a hypothesis test. Rather, it assesses the extent to which an association between Pricei and Middlemeni may arise mechanically because Middlemeni enters as a weight in the construction of Pricei in Equation (4).
4.3. Realized Producer Price and Fishing Effort
RQ2 examines three observable fishing-effort measures: annual fishing days, annual trip frequency, and days spent at fishing grounds per trip. To keep notation compact while preserving the original variable names, let Effortki denote one of FishingDaysi, Tripsi, or DaysPerTripi. The preferred specification is
where k ∈ {FishingDays, Trips, DaysPerTrip}.
ln(Effortki) = αk + β1kln(Pricei) + β2kln(Enginei) + β3kln(Gillnetsi) + β4kAgei + δkt + uki,
For k = FishingDays, Equation (8) provides the main effort specification; the Trips and DaysPerTrip versions are complementary decompositions of annual fishing effort. Enginei and Gillnetsi capture observed vessel and gear capacity, respectively; Agei controls for vessel vintage; δkt denotes survey-year fixed effects; and uki is the regression disturbance for effort outcome k and vessel observation i. The coefficient β1k is the conditional association between realized producer price and the relevant effort margin.
Because Pricei is an annual realized price rather than the ex-ante expected price in Equation (1), β1k is not interpreted as a structural effort-supply elasticity. Unobserved productivity, quality, landing conditions, buyer relations, and expectations can influence both realized price and fishing effort. RQ2 is therefore evaluated from the magnitude, uncertainty, and consistency of the price coefficient across the three observable fishing-effort measures.
4.4. Fuel-Consumption Models
RQ3 is examined with two specifications because conditioning on FishingDaysi changes the empirical question. The first model relates annual fuel consumption to realized producer price and observed vessel capacity without conditioning on annual fishing effort:
ln(Fueli) = α + β1ln(Pricei) + β2ln(Enginei) + β3ln(Gillnetsi) + β4Agei + δt + εi.
Here, δt denotes survey-year fixed effects and εi is the regression disturbance for vessel observation i. Equation (9) is interpreted as the association between Pricei and annual fuel use (Fueli), conditional on vessel capacity. It does not isolate a behavioural pathway through fishing effort.
The preferred effort-conditioned specification adds annual fishing days:
ln(Fueli) = α + β1ln(Pricei) + β2ln(FishingDaysi) + β3ln(Enginei) + β4ln(Gillnetsi) + β5Agei + δt + εi.
In Equation (10), β1 captures the conditional association between realized producer price and annual fuel use, holding observed fishing effort and vessel capacity constant; β2 captures the association of fishing days with fuel use; β3 and β4 capture the corresponding associations of engine power and gillnet capacity, respectively; and β5 captures the association with vessel age. All other notation is as defined in Equation (9). Because Equations (9) and (10) condition on different sets of covariates, their coefficients are not interpreted as alternative estimates of a common structural parameter.
Middlemeni is not added to either fuel equation. It is already a quantity weight in the construction of Pricei and including it would neither remove the endogeneity of realized price nor identify a marketing-channel effect on fuel use. Likewise, the original subsidy-intensity ratio is excluded from the main fuel equations because Fueli appears in its denominator.
4.5. Catch and Fuel-Intensity Decomposition
RQ4 uses the accounting identity in Equation (7) to decompose the conditional Fueli association into Catchi and FuelIntensityi components. To make the decomposition exact, the three equations are estimated on the same observations with the same regressors as Equation (10):
Because Equation (7) holds observation by observation, OLS with an identical sample and design matrix implies the following coefficient identity for every common regressor j:
For the realized-price coefficient specifically, is therefore decomposed into , the component associated with annual catch, and , the component associated with fuel use per tonne. This is an accounting decomposition of OLS coefficients, not a mediation analysis. The interpretation relies on coefficient magnitudes and confidence intervals; statistical significance in one component and insignificance in another is not by itself evidence that the two component coefficients differ.
Catchi is treated as an observed harvesting-scale outcome rather than as a structural measure of production. Fuel use, fishing effort, vessel capacity, and catch may be jointly determined, while stock abundance and fishing-ground productivity remain unobserved.
4.6. Estimation, Inference, and Identification
The cross-vessel equations are estimated by ordinary least squares. Primary inference uses HC1 standard errors, with HC3 standard errors reported as a sensitivity check because the sample is moderate in size and some observations have non-negligible leverage. Results are reported with coefficient estimates, robust standard errors, two-sided p-values, and 95% confidence intervals.
Survey-year indicators for 2012, 2018, and 2024 are included in all preferred cross-vessel regressions, with 2008 as the reference year. These indicators absorb common differences across survey waves. Consequently, the coefficient on ln(Pricei) is estimated conditional on the survey-year structure rather than from the broad intertemporal movement in real prices. Standard errors are not clustered by vessel because the data do not contain a verified longitudinal vessel identifier. Clustering by survey year is also not used because there are only four survey-wave clusters.
The empirical strategy does not impose a structural causal mediation model because the available data do not establish the temporal ordering or exogenous variation required to identify a causal sequence from Middlemeni to Pricei to fishing effort, Catchi, or Fueli. Pricei may reflect unobserved fish quality, catch composition, fishing-ground productivity, timing of sales, skipper ability, financing arrangements, buyer relationships, and other factors that may also affect harvesting outcomes.
The empirical claims are therefore deliberately bounded. The analysis addressing RQ1 documents an observed within-vessel channel-price differential. Equations (8)–(13) estimate conditional cross-sectional associations, and Equation (14) provides the OLS coefficient decomposition implied by Equation (7). Survey-year fixed effects and observed capacity controls improve comparability but do not eliminate endogeneity. Results are therefore reported using associational rather than causal language.
4.7. Robustness and Supplementary Analyses
The robustness strategy addresses functional form, survey-wave stability, influential observations, marketing-price construction, and fuel-support measurement. First, the preferred logarithmic specifications for Enginei, Gillnetsi, and FishingDaysi are compared with level forms. The preferred log formulation is retained because the variables span wide ranges and the specification yields directly interpretable proportional associations.
Second, survey-wave stability is examined by sequentially omitting each survey wave and by interacting ln(Pricei) with the survey-year indicators. A joint test of the interaction terms assesses whether the pooled price association differs systematically across survey waves. These exercises are treated as stability diagnostics rather than as separate year-specific causal estimates.
Third, influential observations are assessed using Cook’s distance. The full sample remains the preferred sample; models excluding observations above conventional influence thresholds are reported only as sensitivity checks and are not used for post hoc sample selection.
Fourth, the channel-price analysis is supplemented by channel-specific price regressions and the synthetic-price diagnostic described in Section 4.2. These checks distinguish within-channel price variation from the mechanical association created when a marketing share is also used as a weight in a quantity-weighted average price.
Fifth, fuel support is examined only in supplementary models using (i) an indicator for receipt of positive fuel subsidy and (ii) ln(1 + TotalSubsidyi). The present repeated cross-sectional gillnet data do not contain the treatment structure and identifying information required to reproduce that causal design. Accordingly, fuel-support estimates here remain descriptive sensitivity analyses rather than causal subsidy effects.
5. Results
5.1. Marketing Channels and Within-Vessel Producer-Price Differentials
Table 4 reports the within-vessel comparison of producer prices for the 144 vessel observations that sold skipjack tuna through both middlemen and direct-processor channels. The mean log price differential, defined as the direct-processor price minus the middlemen price, is 0.1170 (SE = 0.003; 95% CI: 0.111–0.123; p < 0.001). Converting this log difference into percentage terms indicates that prices received from direct processors were, on average, 12.41% higher than prices received through middlemen (95% CI: 11.69–13.13%). The positive within-vessel price differential provides an affirmative answer to RQ1.
Table 4.
Within-vessel producer-price differential between direct processors and middlemen.
The within-vessel price differential is positive in every survey wave, although its magnitude varies over time. It is largest in 2008, at approximately 17.28%, and equals 12.25%, 11.99%, and 11.16% in 2012, 2018, and 2024, respectively (Table 4). Thus, the within-vessel evidence consistently indicates a producer-price advantage for direct-processor sales over middlemen sales among mixed-channel vessels. These differences should nevertheless be interpreted as observed channel-price differentials rather than causal effects of marketing-channel choice because channel-specific fish quality, grade, size, timing of sale, and other transaction characteristics are not separately observed.
As an additional diagnostic, Table A6 examines the relationship between the observed quantity-weighted average producer price and the share sold through middlemen. The correlation between the observed and synthetically constructed log average prices is 0.977. Moreover, the coefficient on Middlemeni is −0.121 in the observed-price regression and −0.116 when the dependent variable is replaced by a synthetic price constructed from survey-year mean channel prices and observed marketing shares (Table A6). The close correspondence indicates that much of the negative association between Middlemeni and the quantity-weighted average Pricei may arise mechanically from the construction of Pricei. This finding supports the use of the within-vessel channel-price comparison in Table 4, rather than a regression of Pricei on Middlemeni, as the primary analysis for addressing RQ1.
5.2. Realized Producer Prices and Fishing Effort
Table 5 examines whether realized producer prices are associated with three observable dimensions of fishing effort: annual fishing days, trips per year, and average days per trip. After controlling for vessel capacity, vessel age, and survey-year fixed effects, the coefficient on ln(Pricei) is positive but statistically insignificant in the fishing-days equation (β = 0.167, SE = 0.346, p = 0.629) and in the trip-frequency equation (β = 0.255, SE = 0.425, p = 0.549). The coefficient is negative and similarly imprecise for days at fishing grounds per trip (β = −0.088, SE = 0.463, p = 0.850). The data therefore provide no detectable evidence that differences in realized producer prices are systematically associated with any of the three observable fishing-effort margins.
Table 5.
Realized producer price and fishing effort.
Several vessel characteristics are nevertheless associated with the organization of fishing effort. Engine power is positively associated with annual fishing days (β = 0.070, p < 0.05) and days at fishing grounds per trip (β = 0.200, p < 0.01), but negatively associated with the number of trips per year (β = −0.130, p < 0.05). Gillnet capacity shows a similar reorganization across effort margins: it is strongly negatively associated with trip frequency (β = −0.580, p < 0.01) but positively associated with days at fishing grounds per trip (β = 0.689, p < 0.01). These opposing associations are consistent with larger-capacity vessels undertaking fewer trips but spending more days at fishing grounds per trip, rather than necessarily increasing annual fishing days.
The effort regressions provide little evidence that cross-vessel differences in realized annual producer price are systematically associated with the three observed fishing-effort measures after conditioning on vessel capacity and survey-wave conditions. This null result should not be read as evidence that expected prices are behaviourally irrelevant. Bioeconomic theory and empirical effort studies concern expected returns at the decision margin [1,3], whereas the present Pricei is an ex-post annual outcome.
5.3. Realized Producer Prices, Fishing Effort, and Fuel Consumption
Table 6 presents the annual fuel-consumption models. In the capacity-conditioned specification without annual fishing days [Equation (9)], the coefficient on ln(Pricei) is positive (β = 0.796, SE = 0.463) and statistically significant only at the 10% level (p = 0.087). Engine power and gillnet capacity are both positively associated with annual fuel use, whereas vessel age is negatively associated with fuel consumption.
Table 6.
Realized producer price, vessel capacity, fishing effort, and annual fuel consumption.
Adding annual fishing days in the preferred effort-conditioned specification [Equation (10)] substantially improves the explanatory power of the model, with R2 increasing from 0.601 to 0.693 (Table 6). The coefficient on ln(FishingDaysi) is 0.733 (SE = 0.102, p < 0.001), indicating a strong positive conditional association between fishing effort and annual fuel consumption. Engine power (β = 0.298, SE = 0.045, p < 0.001) and gillnet capacity (β = 0.374, SE = 0.112, p = 0.001) also remain positively associated with fuel use.
By contrast, after conditioning on annual fishing effort and vessel capacity, the coefficient on ln(Pricei) decreases to 0.673 and is estimated relatively imprecisely (SE = 0.435, p = 0.123). Thus, although the point estimate remains positive, the preferred specification does not provide conventional statistical evidence of a conditional association between realized producer price and annual fuel consumption. The main empirical regularity in Table 6 is instead the strong association of total fuel use with fishing effort and vessel capacity.
HC3 inference leaves the substantive conclusion unchanged: the price coefficient remains imprecise, while fishing days, engine power, and gillnet capacity retain strong positive associations with annual fuel use (Table A1). Heteroskedasticity diagnostics support robust inference: the Breusch–Pagan/Cook–Weisberg test rejects homoskedasticity (χ2 = 16.29, p = 0.0001; Table A5).
The precision of the price coefficient is nevertheless sensitive to functional form. When fishing days, engine power, and gillnet capacity enter in levels rather than logarithms, the price coefficient rises to 0.863 and is significant at the 5% level (p = 0.044; Table A2). This sensitivity is one reason not to interpret the pooled price coefficient as a stable elasticity or a causal response parameter.
The result is not driven solely by a small number of highly influential observations. Nineteen observations exceed the conventional Cook’s-distance threshold of 4/N. When these observations are excluded as a sensitivity check, the price coefficient remains positive and becomes statistically significant (β = 0.653, p = 0.031; Table A5). Because exclusion based on ex-post influence diagnostics can alter the target sample, the full 242-observation specification in Table 6 remains the preferred result.
There is also no evidence that the price–fuel slope differs systematically across the four survey waves. The joint test of the ln(Pricei) × survey-year interaction terms yields F(3,230) = 0.74 (p = 0.528; Table A4). Together, these checks indicate a consistently positive point estimate for the price–fuel association, but its statistical precision depends partly on functional form and sample influence. The evidence for effort and capacity associations with fuel consumption is considerably stronger.
5.4. Catch Scale and Fuel-Use Intensity
Table 7 decomposes the annual fuel-consumption relationship into annual catch and fuel use per tonne using Equations (11)–(13). All three regressions use the same 242 observations and identical regressors, allowing the coefficient identity implied by Equation (7) to hold exactly up to rounding.
Table 7.
Decomposition of annual fuel consumption into catch and fuel-use intensity.
The coefficient on ln(Pricei) in the annual catch equation is positive and statistically significant (β = 0.824, SE = 0.313, p = 0.009). In contrast, the corresponding coefficient in the fuel-intensity equation is negative, small relative to its uncertainty, and statistically insignificant (β = −0.151, SE = 0.480, p = 0.754). These estimates sum to the coefficient in the fuel equation, consistent with Equation (14): 0.673 = 0.824 + (−0.151). The pooled point estimates therefore suggest that the positive price–fuel association is reflected more in the catch component than in fuel use per tonne. However, this decomposition should not be interpreted as evidence that the two component coefficients differ statistically. A robust cross-equation SUEST test does not reject equality of the price coefficients in the catch and fuel-intensity equations (χ2(1) = 2.10, p = 0.147; Table 7). Accordingly, the evidence supports a positive pooled association between realized producer price and catch, but does not establish that the price association with catch is statistically larger than that with fuel intensity.
The decomposition also clarifies the roles of fishing effort and capacity. A 1% difference in annual fishing days is associated with approximately 0.769% higher catch (p < 0.001), whereas its coefficient in the fuel-intensity equation is small and statistically insignificant (β = −0.036, p > 0.10). Similarly, engine power is positively associated with both catch (β = 0.227, p < 0.01) and, more weakly, fuel intensity (β = 0.070, p < 0.10). Gillnet capacity is positively associated with catch (β = 0.502, p < 0.01), while its fuel-intensity coefficient is negative but statistically insignificant. These results indicate that the strong associations of effort and capacity with total fuel use largely coincide with differences in harvesting scale.
The principal decomposition results are robust to HC3 inference. The price–catch coefficient remains positive and statistically significant (β = 0.824, p = 0.012), whereas the price–fuel-intensity coefficient remains statistically insignificant (p = 0.761; Table A1). The same qualitative pattern is obtained under the level-control specification: ln(Pricei) is positively associated with catch (β = 0.970, p = 0.004) but not with fuel intensity (β = −0.108, p > 0.10; Table A2). Moreover, the price–fuel-intensity coefficient remains statistically insignificant in every leave-one-wave-out specification (Table A3).
The pooled price–catch relationship is less temporally stable. The price coefficient remains positive and statistically significant when 2008, 2012, or 2018 is omitted, but falls to 0.405 and becomes statistically insignificant (p = 0.308) when the 2024 year is excluded (Table A3). More importantly, the joint test of the price-by-year interaction terms rejects equality of the price slope across survey waves in the catch equation [F(3,230) = 4.92, p = 0.0025; Table A4]. The positive pooled price–catch association should therefore be interpreted as an average conditional relationship whose magnitude varies across survey waves rather than as a temporally invariant association.
5.5. Additional Robustness and Sensitivity Analyses
The supplementary analyses provide three further checks on the main findings. First, the high correlation between realized producer prices and survey-wave conditions produces some multicollinearity in the preferred models. The VIF for ln(Pricei) is 10.39 and that for the 2024 indicator is 17.33 (Table A5). Survey-year fixed effects are nevertheless retained because they control for common temporal conditions across survey waves, including broad changes in resource conditions, as well as other common year-specific influences. Consequently, the price coefficients in Table 5, Table 6 and Table 7 are identified primarily from cross-vessel price variation conditional on survey-wave conditions rather than from the long-run movement in average prices between 2008 and 2024.
Second, alternative controls for fuel subsidies do not materially alter the preferred fuel-consumption result. Adding an indicator for receipt of a fuel subsidy leaves the ln(Pricei) coefficient at 0.681 (p = 0.124), while the subsidy-receipt coefficient itself is small and statistically insignificant (β = 0.012, p = 0.808). Using ln(1 + TotalSubsidyi) yields a similar price coefficient of 0.685 (p = 0.122), while the subsidy coefficient is again statistically insignificant (Table A7). These specifications are treated as descriptive sensitivity analyses rather than estimates of causal subsidy effects.
Across these sensitivity checks, comparatively stable findings can be distinguished from those that are more sensitive to specification. The within-vessel direct-price premium is consistently positive; realized price is not detectably related to the available effort margins; and the absence of an association between price and fuel intensity is robust across the principal alternatives. The pooled coefficient on price in the catch specification is positive in several specifications but varies significantly across survey waves. The coefficient on price in the fuel specification is positive across the preferred and principal sensitivity models, yet its statistical significance depends on functional form and influence treatment. The Discussion section therefore emphasizes magnitudes, uncertainty, and identification limits rather than a single causal narrative.
6. Discussion
6.1. Marketing Channels and Producer Returns
The most stable market result is a within-vessel price differential. Among the 144 observations using both channels, direct sales to processing companies receive an average price about 12.4% above sales through middlemen, and the differential is positive in every survey wave. Because the comparison is within the same vessel-year, vessel characteristics common to both transactions cannot explain the gap. This extends Vietnamese tuna-chain studies that document unequal bargaining positions and value distribution [39,40,41] by showing that an economically meaningful channel-price gap is visible even among vessels that simultaneously participate in both channels.
The result is consistent with a wider literature in which intermediary relations combine service provision with unequal outside options. Middlemen may supply finance, logistics, information, risk-sharing, and market access while retaining bargaining advantages or enforcing relational obligations [18,20,21,22]. Evidence from Indonesia shows that sustainability and upgrading initiatives can reorganize these relationships but do not automatically eliminate dependence or unequal power [14,15,16,28]. Conversely, the Amazon evidence that improved direct market access raised fishers’ prices and induced incumbent middlemen to respond illustrates how outside options can alter bargaining in thin markets [25].
The 12.4% differential should nevertheless not be interpreted as the causal return to bypassing middlemen. Channel-specific fish grade, size, quality, timing, contractual conditions, and financing are unobserved. Fishers may sort fish across buyers, and the services embedded in an intermediary relationship may be compensated partly through the observed price. The estimand is therefore an observed channel-price differential, not a treatment effect or a complete welfare comparison.
This distinction also explains why the coefficient on Middlemeni in the Pricei regression is not treated as the principal market result. Because Pricei is constructed as a quantity-weighted average of channel-specific prices, Middlemeni enters directly as one of the weights used in its construction. The synthetic-price diagnostic in Table A6 reproduces nearly all of the observed negative association between Middlemeni and Pricei using only survey-year mean channel prices and vessels’ observed marketing shares. This association therefore appears to arise largely from the mechanical construction of Pricei and should not be interpreted as evidence that a higher share of sales through middlemen independently reduces the price received by producers.
6.2. Producer Returns, Fishing Effort, and Fuel Consumption
The effort regressions nevertheless reveal economically coherent relationships between vessel capacity and trip organization. Larger engines and greater gear capacity are associated with changes in the combination of trip frequency and days spent at fishing grounds per trip, while the relationship with annual fishing days is more limited. This is consistent with previous evidence that vessel characteristics and fishing effort are important components of harvesting performance in Vietnamese offshore fisheries [34]. It also suggests that annual fishing effort should not be represented by a single behavioural margin when operational organization differs across vessel types.
The effort models show no detectable conditional association between realized annual producer price and fishing days, trip frequency, or days spent at fishing grounds per trip. This finding is substantively important because it rejects a simple empirical story in which a higher observed annual price is automatically accompanied by more measured fishing effort. It does not reject the bioeconomic proposition that expected returns matter for behaviour. Expected prices can affect effort allocation [3], but the survey’s realized annual price is jointly determined with outcomes and may be a noisy proxy for the price anticipated when fishing decisions were made.
By contrast, total annual fuel use is strongly and consistently associated with fishing days, engine power, and gillnet capacity. These relationships are physically intuitive and align with the fisheries-energy literature, in which fuel consumption depends on fishing effort, vessel and gear characteristics, fishing technique, and resource conditions [5,6,7,8]. The coefficient on Pricei in the conditional fuel-use specification remains positive but is statistically imprecise in the preferred log-log model and sensitive to functional form and influence diagnostics. It should therefore be interpreted as suggestive evidence of a positive association rather than as a robust price elasticity.
Survey-year fixed effects are essential because the four waves span substantial changes in markets, technology, policy, and likely resource conditions. Yet these indicators absorb only common wave-level variation. They cannot replace direct stock measures or vessel fixed effects, and the high VIFs for ln(Pricei) and the 2024 indicator show that long-run movements in prices are difficult to separate from other time-specific changes. The preferred price coefficient is consequently identified primarily by within-wave cross-vessel variation.
6.3. Harvesting Scale, Fuel Intensity, and Sustainability Implications
The accounting decomposition in Equation (7) helps clarify the pooled results. The coefficient on realized price is positive in the catch equation, whereas the corresponding coefficient in the fuel-intensity equation is close to zero and statistically insignificant. Because the coefficients on common regressors sum mechanically across the decomposition, the point estimates suggest that the positive pooled association between realized price and fuel use is reflected more in the catch component than in fuel use per tonne. This decomposition is an accounting relationship and does not, by itself, identify a behavioural mechanism. Moreover, the robust cross-equation test does not reject equality of the price coefficients in the catch and fuel-intensity equations.
This scale–intensity distinction matters for sustainability interpretation. Ecological economics cautions that efficiency improvements do not necessarily reduce aggregate material or energy throughput when scale expands [44,45]. In fisheries, recovered stocks and more efficient techniques can reduce fuel use per unit of catch [8], while technological efficiency may have different welfare and resource consequences under different management regimes [46]. A low fuel-intensity vessel is therefore not automatically a low-throughput vessel, and a positive association with total fuel should not be labelled an intensity effect.
The positive pooled coefficient on Pricei in the catch specification also requires qualification across survey waves. It weakens substantially when the year 2024 is excluded, and the formal interaction test rejects a common coefficient on Pricei across waves. This heterogeneity is consistent with the view that market signals operate within changing biological, technological, and institutional contexts rather than through a stable reduced-form elasticity. The data do not identify whether the observed variation across waves reflects stock conditions, buyer composition, vessel selection, policy changes, or other common shocks.
The policy implication is not that low producer prices are environmentally desirable. Value-chain upgrading can improve producer welfare, market transparency, quality incentives, and bargaining opportunities, objectives recognized in the SSF Guidelines and the wider aquatic-food policy agenda [31,32]. However, market interventions and resource-management institutions solve different problems. International and comparative research shows that stronger market integration can generate either livelihood gains or greater pressure on resources depending on local institutions and governance capacity [23,26,27]. Improving producer returns should therefore be accompanied by credible rules governing access, effort, capacity, and stock conservation rather than treated as a substitute for them.
The subsidy results point in the same direction. Fuel-support receipt and total real subsidy are not statistically associated with contemporaneous fuel use in the supplementary models and do not materially change the price coefficient. These null conditional associations do not imply that fisheries subsidies are environmentally unimportant. Global studies distinguish beneficial, ambiguous, and capacity-enhancing support and show that harmful subsidies can reinforce overcapacity and overfishing incentives [55,56,57]. In Vietnam, successive subsidy programmes have supported offshore fleet development through measures including credit, fuel support, and insurance, while also raising questions about their long-term design and sustainability implications [54]. Vietnamese studies using other empirical designs have documented effects of fisheries support on vessel profitability and related economic outcomes [36,37,59,60]. The entry into force of the WTO Agreement on Fisheries Subsidies in 2025 and the continuation of negotiations on additional disciplines after MC14 give this issue direct policy salience [61,62,63]. The present subsidy variables, however, are controls rather than exogenous treatments.
Overall, the empirical results support a governance interpretation that is narrower than claiming that the value chain itself is an environmental institution. First-sale organization is associated with how value is distributed, and producer returns coexist with different harvesting outcomes; environmental consequences, however, are mediated by fishing technology, capacity, stock conditions, and management institutions. This framing is more consistent with interactive-governance research on fisheries market chains [27] and with the broader policy objective of improving both value-chain performance and resource sustainability [32].
7. Conclusions
This study connects first-sale market organization, producer returns, observable fishing effort, and fossil-fuel consumption using repeated vessel surveys from Vietnam’s offshore skipjack tuna gillnet fishery. Its main empirical design choice is to separate relationships that can easily be conflated: channel-specific price differences, the association between realized price and fishing effort, the association between effort/capacity and aggregate fuel use, and the accounting decomposition of fuel between catch scale and fuel intensity.
Three findings are most defensible. First, mixed-channel vessels receive an average observed direct-processor price about 12.4% above the middlemen price, with a positive gap in all four waves. Because fish characteristics and transaction conditions are not observed by channel, this is a within-vessel price differential rather than the causal value of switching buyers. Second, realized annual producer price is not detectably associated with fishing days, trip frequency, or days spent at fishing grounds per trip once vessel capacity and survey-wave conditions are included. Total fuel use, by contrast, is strongly associated with fishing days, engine power, and gear capacity; the conditional price coefficient is positive but imprecise and specification-sensitive.
Third, the pooled point estimates suggest that the price–fuel association is reflected more in annual catch than in litres of fuel per tonne. The accounting identity makes the coefficient decomposition exact for common regressors, but the component coefficients are not statistically distinguishable and the price–catch relationship varies across survey waves. The evidence therefore does not support a general causal claim that higher producer prices expand harvests or fuel use. It supports the narrower conclusion that the pooled estimates are consistent with a relationship between market returns and harvesting scale, but the strength and form of that relationship vary across survey waves and specifications.
For policy, the results argue for complementarity. Better market access, producer organization, transparency, and bargaining opportunities can improve distributional outcomes without being treated as fisheries-management tools. The results provide no empirical basis for treating lower producer prices as a conservation instrument. If higher returns increase the attractiveness or scale of fishing in some contexts, their resource consequences depend on the institutions governing access, capacity, effort, and stock rebuilding. This is consistent with international guidance that links viable value chains to effective resource governance and with the broader economic case for reducing overcapacity and rebuilding stocks [31,32,33,47].
The limitations are material. The data are repeated cross-sections rather than a verified panel; realized price is not the ex-ante expected price; stock abundance, fishing-ground conditions, market fuel prices, and channel-specific fish quality are unavailable; the observable effort measures do not capture all dimensions of effective fishing effort; and Khanh Hoa skipjack gillnet vessels are not representative of all Vietnamese fisheries. Survey-year fixed effects absorb common temporal conditions but cannot solve these identification problems. In addition, owner identifiers are unavailable, so potential dependence among vessels under common ownership cannot be identified or accommodated through owner-level clustered inference.
Future research would benefit from verified vessel panels or trip-level data linking expected prices, buyer identities, channel-specific quality, fuel purchases and prices, spatial fishing effort, stock indicators, and contractual or credit relationships. Exogenous shifts in buyer access, infrastructure, regulations, or market institutions could then support stronger causal designs. Combining these data with traceability and value-chain information would be particularly useful for testing when producer upgrading improves livelihoods without increasing pressure on fish stocks or fossil-fuel use.
The broader contribution is methodological as much as substantive. Fisheries value-chain research increasingly asks how governance, sustainability, and equity interact [17], but observational data can easily turn accounting relationships or realized outcomes into causal stories. By isolating the within-vessel channel-price comparison, distinguishing expected from realized prices, and separating aggregate fuel consumption from fuel intensity, this study offers a cautious empirical bridge between value-chain governance, fisheries bioeconomics, and ecological economics.
Funding
This research was funded by the Vietnam National Foundation for Science and Technology Development (NAFOSTED) under grant number 502.01-2021.13.
Institutional Review Board Statement
The study was conducted in accordance with the Declaration of Helsinki. The Scientific and Training Council of the School of Economics and Business, Nha Trang University, approved the study and the reuse of survey data collected in 2008, 2012, and 2018, and prospectively approved the additional 2024 survey (Approval No. 39/HĐKHĐT-KTKD, 10 September 2023). The Council reviewed the research protocol, including the research design and methodology, participant selection, data-collection and confidentiality procedures, and the informed consent process.
Informed Consent Statement
Verbal informed consent was obtained from all participants before the interviews. Verbal rather than written consent was used because the surveys consisted of non-interventional socioeconomic interviews conducted in field settings and did not collect directly identifying personal information. Before each interview, participants were informed of the purpose of the research, the voluntary nature of participation, the intended scientific use of the information provided, and the confidentiality of their information. Interviews proceeded only after participants verbally agreed to participate.
Data Availability Statement
The data presented in this study are available upon reasonable request from the corresponding author.
Conflicts of Interest
The author declares no conflicts of interest.
Abbreviations
The following abbreviations are used in this manuscript:
| CI | Confidence interval |
| GDP | Gross domestic product |
| HC | Heteroskedasticity-consistent |
| HP | Horsepower |
| OLS | Ordinary least squares |
| RQ | Research question |
| SE | Standard error |
| VIF | Variance inflation factor |
| VND | Vietnamese dongong |
| WTO | World Trade Organization |
Appendix A
Table A1.
HC3 robustness for the decomposition models.
Table A2.
Functional-form sensitivity using level controls.
Table A3.
Leave-one-survey-wave-out sensitivity of the realized-price coefficient.
Table A4.
Survey-wave heterogeneity in the realized-price slope.
Table A5.
Diagnostic and influence checks for the preferred fuel model.
Table A6.
Mechanical-composition diagnostic for the marketing-share/average-price relationship.
Table A7.
Fuel-subsidy sensitivity analyses.
Table A8.
Comparison of sample and registered-fleet mean engine capacity by survey wave.
Appendix B. Core Survey Questionnaire Items Used in the Empirical Analysis
The same core questionnaire was administered in the 2008, 2012, 2018, and 2024 survey waves, with the survey year updated as appropriate. The items reproduced below are limited to the information used in, or directly relevant to the measurement procedures of, the present empirical analysis. The original questionnaire contained additional questions collected for other research purposes that are not reproduced here.
| B.1. Respondent information 1. Respondent’s role: □ Vessel owner □ Captain/skipper □ Other (please specify): __________ B.2. Vessel characteristics and fishing operations 2. Vessel characteristics (a) Vessel length: __________ m (b) Engine power: __________ HP (c) Vessel age: __________ years (d) Number of gillnets used: __________ nets 3. Fishing operations during the survey year (a) Number of fishing trips during the year: __________ trips/year (b) Average number of days spent at fishing grounds per trip, excluding transit time between port and the fishing grounds: __________ days/trip (c) Average crew size: __________ persons/trip (d) Fishing experience of the captain/skipper in tuna fishing: __________ years B.3. Annual skipjack tuna catch and marketing 4. What was the total landed and marketed skipjack tuna catch during the survey year? If you do not recall the annual total, please check the vessel’s available records before providing your answer: __________ tonnes/year 5. Of the total annual skipjack tuna catch reported above, how much was sold through each of the following buyer types during the survey year? Please report either the quantity sold or the approximate share of total annual skipjack tuna catch. (a) Middlemen: __________ tonnes/year or approximately __________ % (b) Processing companies (direct sales): __________ tonnes/year or approximately __________ % (c) Other buyer(s) (please specify buyer type): __________; quantity sold: __________ tonnes/year or approximately __________ %. 6. On average, what price did you receive for skipjack tuna sold to each of the following buyer types during the survey year? If prices varied across sales, please report the approximate average price received over the year. If you do not recall, please check the vessel’s available sales records before providing your answer. (a) Middlemen: __________ VND/kg (b) Processing companies (direct sales): __________ VND/kg (c) Other buyer(s) (please specify buyer type): __________; average price received: __________ VND/kg B.4. Diesel fuel consumption 7. Total diesel fuel consumed by the vessel during the survey year, based on the vessel’s available fuel records: __________ litres/year 8. Typical diesel fuel consumption per fishing trip: __________ litres/trip B.5. Government fuel support 9. Did the vessel receive government fuel support during the survey year? □ Yes □No 10. If yes, what was the total monetary amount of government fuel support received during the survey year? __________ million VND/year. |
References
- Clark, C. Mathematical Bioeconomics: The Optimal Management of Renewable Resources, 2nd ed.; John Wiley & Sons: New York, NY, USA, 1990. [Google Scholar]
- Gordon, H.S. The economic theory of a common property resource: The fishery. J. Polit. Econ. 1954, 62, 124–142. [Google Scholar] [CrossRef] [Scilit] [PubMed]
- Pascoe, S.D.; Sharp, J.A.; Buckworth, R.C. Modelling effort levels in a sequential fishery. ICES J. Mar. Sci. 2016, 73, 503–511. [Google Scholar] [CrossRef] [Scilit]
- Schaefer, M.B. Some considerations of population dynamics and economics in relation to the management of marine fisheries. J. Fish. Res. Board Can. 1957, 14, 669–681. [Google Scholar] [CrossRef] [Scilit]
- Tyedmers, P.H.; Watson, R.; Pauly, D. Fueling Global Fishing Fleets. AMBIO J. Hum. Environ. 2005, 34, 635–638. [Google Scholar] [CrossRef]
- Parker, R.W.R.; Tyedmers, P.H. Fuel consumption of global fishing fleets: Current understanding and knowledge gaps. Fish Fish. 2015, 16, 684–696. [Google Scholar] [CrossRef] [Scilit]
- Parker, R.W.R.; Blanchard, J.L.; Gardner, C.; Green, B.S.; Hartmann, K.; Tyedmers, P.H.; Watson, R.A. Fuel use and greenhouse gas emissions of world fisheries. Nat. Clim. Change 2018, 8, 333–337. [Google Scholar] [CrossRef] [Scilit]
- Bastardie, F.; Hornborg, S.; Ziegler, F.; Gislason, H.; Eigaard, O.R. Reducing the fuel use intensity of fisheries: Through efficient fishing techniques and recovered fish stocks. Front. Mar. Sci. 2022, 9, 817335. [Google Scholar] [CrossRef] [Scilit]
- Gereffi, G.; Humphrey, J.; Sturgeon, T. The governance of global value chains. Rev. Int. Political Econ. 2005, 12, 78–104. [Google Scholar] [CrossRef] [Scilit]
- Swinnen, J.; Vandeplas, A. Rich Consumers and Poor Producers: Quality and Rent Distribution in Global Value Chains. J. Glob. Dev. 2011, 2, 1–30. [Google Scholar] [CrossRef] [Scilit]
- Ponte, S.; Kelling, I.; Jespersen, K.S.; Kruijssen, F. The Blue Revolution in Asia: Upgrading and Governance in Aquaculture Value Chains. World Dev. 2014, 64, 52–64. [Google Scholar] [CrossRef] [Scilit]
- Hamilton-Hart, N.; Stringer, C. Upgrading and exploitation in the fishing industry: Contributions of value chain analysis. Mar. Policy 2016, 63, 166–171. [Google Scholar] [CrossRef] [Scilit]
- Bush, S.; Oosterveer, P. Governing Sustainable Seafood, 1st ed.; Routledge: London, UK, 2019. [Google Scholar] [CrossRef] [Scilit]
- Doddema, M.; Spaargaren, G.; Wiryawan, B.; Bush, S.R. Fisher and Trader Responses to Traceability Interventions in Indonesia. Soc. Nat. Resour. 2020, 33, 1232–1251. [Google Scholar] [CrossRef] [Scilit]
- Wiranthi, P.E.; Toonen, H.M.; Oosterveer, P. Multi-tier captive relations in the global value chain of tuna: The case of Fair Trade certification of small-scale tuna fishery in Indonesia. Ocean Coast. Manag. 2024, 258, 107398. [Google Scholar] [CrossRef] [Scilit]
- Wiranthi, P.E.; Toonen, H.M.; Oosterveer, P. Dynamic Interactions and Governance Capabilities of State and Non-State Actors in Small-Scale Tuna Fishery Certification in Indonesia. Environ. Policy Gov. 2025, 35, 1012–1027. [Google Scholar] [CrossRef] [Scilit]
- Mahmud, A.; Parikh, P.; Ahmed, J.U.; Alam, M.J.; Mostafizur, R.M.; Shijun, D.; Begum, I.A.; Akhtar, F.; Siddika, S.; McKenzie, A.M. Fish value chain analysis: A scoping review. Front. Sustain. Food Syst. 2026, 10, 1673453. [Google Scholar] [CrossRef] [Scilit]
- Crona, B.; Nyström, M.; Folke, C.; Jiddawi, N. Middlemen, a critical social-ecological link in coastal communities of Kenya and Zanzibar. Mar. Policy 2010, 34, 761–771. [Google Scholar] [CrossRef] [Scilit]
- Basurto, X.; Bennett, A.; Hudson Weaver, A.; Rodriguez-Van Dyck, S.; Aceves-Bueno, J.-S. Cooperative and Noncooperative Strategies for Small-scale Fisheries’ Self-governance in the Globalization Era: Implications for Conservation. Ecol. Soc. 2013, 18, 38. [Google Scholar] [CrossRef] [Scilit]
- Bailey, M.; Bush, S.; Oosterveer, P.; Larastiti, L. Fishers, Fair Trade, and finding middle ground. Fish. Res. 2016, 182, 59–68. [Google Scholar] [CrossRef] [Scilit]
- Miñarro, S.; Navarrete Forero, G.; Reuter, H.; van Putten, I.E. The role of patron-client relations on the fishing behaviour of artisanal fishermen in the Spermonde Archipelago (Indonesia). Mar. Policy 2016, 69, 73–83. [Google Scholar] [CrossRef] [Scilit]
- Drury O’Neill, E.; Crona, B. Assistance networks in seafood trade—A means to assess benefit distribution in small-scale fisheries. Mar. Policy 2017, 78, 196–205. [Google Scholar] [CrossRef] [Scilit]
- Bennett, A.; Basurto, X. Local Institutional Responses to Global Market Pressures: The Sea Cucumber Trade in Yucatán, Mexico. World Dev. 2018, 102, 57–70. [Google Scholar] [CrossRef] [Scilit]
- González-Mon, B.; Bodin, Ö.; Crona, B.; Nenadovic, M.; Basurto, X. Small-scale fish buyers’ trade networks reveal diverse actor types and differential adaptive capacities. Ecol. Econ. 2019, 164, 106338. [Google Scholar] [CrossRef] [Scilit]
- Bartkus, V.O.; Brooks, W.; Kaboski, J.P.; Pelnik, C. Big fish in thin markets: Competing with the middlemen to increase market access in the Amazon. J. Dev. Econ. 2022, 155, 102757. [Google Scholar] [CrossRef] [Scilit]
- Crona, B.I.; Van Holt, T.; Petersson, M.; Daw, T.M.; Buchary, E. Using social–ecological syndromes to understand impacts of international seafood trade on small-scale fisheries. Glob. Environ. Change 2015, 35, 162–175. [Google Scholar] [CrossRef] [Scilit]
- Steenbergen, D.J.; Fabinyi, M.; Barclay, K.; Song, A.M.; Cohen, P.J.; Eriksson, H.; Mills, D.J. Governance interactions in small-scale fisheries market chains: Examples from the Asia-Pacific. Fish Fish. 2019, 20, 697–714. [Google Scholar] [CrossRef] [Scilit]
- Adhuri, D.S.; Rachmawati, L.; Sofyanto, H.; Hamilton-Hart, N. Green market for small people: Markets and opportunities for upgrading in small-scale fisheries in Indonesia. Mar. Policy 2016, 63, 198–205. [Google Scholar] [CrossRef] [Scilit]
- Digal, L.N.; Placencia, S.G.P.; Balgos, C.Q. Market assessment on the incentives and disincentives for the adoption of sustainable practices along the tuna value chain in Region 12, Philippines. Mar. Policy 2017, 86, 39–46. [Google Scholar] [CrossRef] [Scilit]
- Djelantik, A.A.A.S.K.; Bush, S.R. Assembling tuna traceability in Indonesia. Geoforum 2020, 116, 172–179. [Google Scholar] [CrossRef] [Scilit]
- FAO. Voluntary Guidelines for Securing Sustainable Small-Scale Fisheries—In the Context of Food Security and Poverty Eradication; Food and Agriculture Organization of the United Nations: Rome, Italy, 2015. [Google Scholar]
- FAO. In Brief to the State of World Fisheries and Aquaculture 2024: Blue Transformation in Action; Food and Agriculture Organization of the United Nations: Rome, Italy, 2024. [Google Scholar] [CrossRef] [Scilit]
- World Trade Organization (WTO). Agreement on Fisheries Subsidies; WT/MIN(22)/W/22, Ministerial Decision of 17 June 2022; The Ministerial Conference: Geneva, Switzerland, 2022; Available online: https://www.wto.org/english/news_e/news22_e/wtmin22w22.pdf (accessed on 25 June 2025).
- Duy, N.N.; Flaaten, O.; Kim Anh, N.T.; Ngoc, Q.T.K. Open-access fishing rent and efficiency—The case of gillnet vessels in Nha Trang, Vietnam. Fish. Res. 2012, 127–128, 98–108. [Google Scholar] [CrossRef] [Scilit]
- Duy, N.N.; Flaaten, O.; Long, L.K. Government support and profitability effects—Vietnamese offshore fisheries. Mar. Policy 2015, 61, 77–86. [Google Scholar] [CrossRef] [Scilit]
- Duy, N.N.; Flaaten, O. Profitability effects and fishery subsidies: Average treatment effects based on propensity scores. Mar. Resour. Econ. 2016, 31, 373–402. [Google Scholar] [CrossRef]
- Duy, N.N. Causal impact of fuel subsidies in Vietnam’s oceanic tuna fishery. J. Asian Bus. Econ. Stud. 2025, 36, 81–97. (In Vietnamese) [Google Scholar] [CrossRef] [Scilit]
- Gudmundsson, E.; Asche, F.; Nielsen, M. Revenue distribution through the seafood value chain. FAO Fish. Circ. 2006, 1019, 42. [Google Scholar]
- Nguyen, K.A.T.; Jolly, C.M. Balancing interests of actors in the ocean tuna value chain of Khanh Hoa province, Vietnam. Mar. Policy 2018, 98, 11–22. [Google Scholar] [CrossRef] [Scilit]
- Thu, N.D.H.; Quyen, C.L.; Hang, L.T.M.; Thi, N.T.T.; Lebailly, P. Social Value Chain Analysis: The Case of Tuna Value Chain in Three South Central Provinces of Vietnam. Asian Soc. Sci. 2020, 16, 43–60. [Google Scholar] [CrossRef] [Scilit]
- Thu, N.D.H.; Quyen, C.L.; Hang, L.T.M.; Thi, N.T.T.; Lebailly, P. Market Structure and Market Performance of Tuna Value Chain: A Case Study of Yellowfin Tuna and Bigeye Tuna Value Chain in Three South Central Provinces of Vietnam. Int. J. Econ. Financ. Issues 2021, 11, 94–113. [Google Scholar] [CrossRef] [Scilit]
- Pham, T.T.T.; Flaaten, O.; Skonhoft, A. Middlemen: Good for resources and fishermen? Environ. Dev. Econ. 2019, 24, 437–456. [Google Scholar] [CrossRef] [Scilit]
- Bastardie, F.; Nielsen, J.R.; Andersen, B.S.; Eigaard, O.R. Integrating individual trip planning in energy efficiency—Building decision tree models for Danish fisheries. Fish. Res. 2013, 143, 119–130. [Google Scholar] [CrossRef] [Scilit]
- Daly, H.E. Beyond Growth: The Economics of Sustainable Development, 1st ed.; Beacon Press: Boston, MA, USA, 1996. [Google Scholar]
- Common, M.; Stagl, S. Ecological Economics: An Introduction, 1st ed.; Cambridge University Press: Cambridge, UK, 2005. [Google Scholar]
- Quaas, M.; Skonhoft, A. Welfare Effects of Changing Technological Efficency in Regulated Open-Access Fisheries. Environ. Resour. Econ. 2022, 82, 869–888. [Google Scholar] [CrossRef] [Scilit]
- World Bank. The Sunken Billions Revisited: Progress and Challenges in Global Marine Fisheries; Environment and Sustainable Development Series; World Bank: Washington, DC, USA, 2017. [Google Scholar] [CrossRef] [Scilit]
- Hannesson, R. Bioeconomic Analysis of Fisheries, 1st ed.; Fishing News Books Ltd.: Oxford, UK, 1993; pp. vi + 138pp. [Google Scholar]
- Department of Capture Fisheries and Resources Protection (DECAFIREP). Annual Report on the Number of Registered Vessels and Engine Power in 2008; DECAFIREP: Khanh Hoa, Vietnam, 2008. (In Vietnamese)
- Department of Capture Fisheries and Resources Protection (DECAFIREP). Annual Report on the Number of Registered Vessels and Engine Power in 2012; DECAFIREP: Khanh Hoa, Vietnam, 2012. (In Vietnamese)
- Department of Capture Fisheries and Resources Protection (DECAFIREP). Annual Report on the Number of Registered Vessels and Engine Power in 2018; DECAFIREP: Khanh Hoa, Vietnam, 2018. (In Vietnamese)
- Department of Capture Fisheries and Resources Protection (DECAFIREP). Annual Report on the Number of Registered Vessels and Engine Power in 2024; DECAFIREP: Khanh Hoa, Vietnam, 2024. (In Vietnamese)
- World Bank. World Development Indicators: GDP Deflator. Available online: https://data.worldbank.org/indicator/NY.GDP.DEFL.KD.ZG (accessed on 5 June 2025).
- Le, P.V.; Nguyen, L.T.; Nguyen, K.Q. An overview of financial subsidy programs in Vietnamese fisheries during the past 25 years: An evaluation and recommendations towards improved future mechanisms. World Dev. Perspect. 2025, 39, 100704. [Google Scholar] [CrossRef] [Scilit]
- Sumaila, U.R.; Ebrahim, N.; Schuhbauer, A.; Skerritt, D.; Li, Y.; Kim, H.S.; Mallory, T.G.; Lam, V.W.L.; Pauly, D. Updated estimates and analysis of global fisheries subsidies. Mar. Policy 2019, 109, 103695. [Google Scholar] [CrossRef] [Scilit]
- Sakai, Y.; Yagi, N.; Sumaila, U.R. Fishery subsidies: The interaction between science and policy. Fish. Sci. 2019, 85, 439–447. [Google Scholar] [CrossRef] [Scilit]
- Schuhbauer, A.; Skerritt, D.J.; Ebrahim, N.; Le Manach, F.; Sumaila, U.R. The global fisheries subsidies divide between small-and large-scale fisheries. Front. Mar. Sci. 2020, 7, 539214. [Google Scholar] [CrossRef] [Scilit]
- Sumaila, U.R.; Dyck, A.; Baske, A. Subsidies to tuna fisheries in the Western Central Pacific Ocean. Mar. Policy 2014, 43, 288–294. [Google Scholar] [CrossRef] [Scilit]
- Pham, T.T.T.; Flaaten, O.; Nguyen, L.T.; Vu, N.K. Subsidies—Help or hurt? A study from Vietnamese fisheries. Mar. Resour. Econ. 2021, 36, 369–387. [Google Scholar] [CrossRef] [Scilit]
- Le, P.V.; Tran, M.-H.; Nguyen, K.Q.; Nguyen, L.T. Profitability effects of capacity-enhancing subsidies: Insights into the fisheries of Vietnam. Aquac. Fish. 2026, in press. [Google Scholar] [CrossRef] [Scilit]
- World Trade Organization (WTO). WTO Agreement on Fisheries Subsidies Enters into Force. 2025. Available online: https://www.wto.org/english/news_e/news25_e/fish_15sep25_e.htm (accessed on 28 July 2026).
- World Trade Organization (WTO). Fisheries Subsidies: Post-MC14 Briefing Note. Available online: https://www.wto.org/english/thewto_e/minist_e/mc14_e/briefing_notes_e/fisheriessubsidies_e.htm (accessed on 28 July 2026).
- World Trade Organization (WTO). Rules Negotiating Group Chair Reports on Fisheries Subsidies Negotiations, Next Steps. 2026. Available online: https://www.wto.org/english/news_e/news26_e/fish_08jul26_449_e.htm (accessed on 28 July 2026).
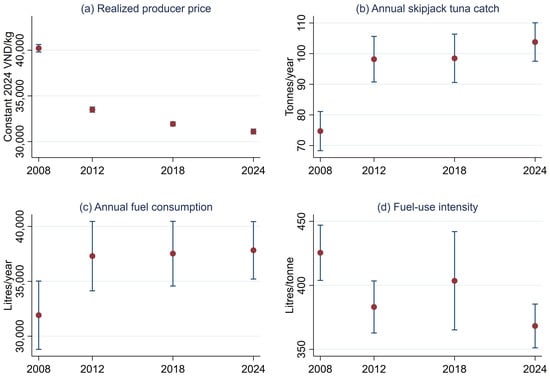
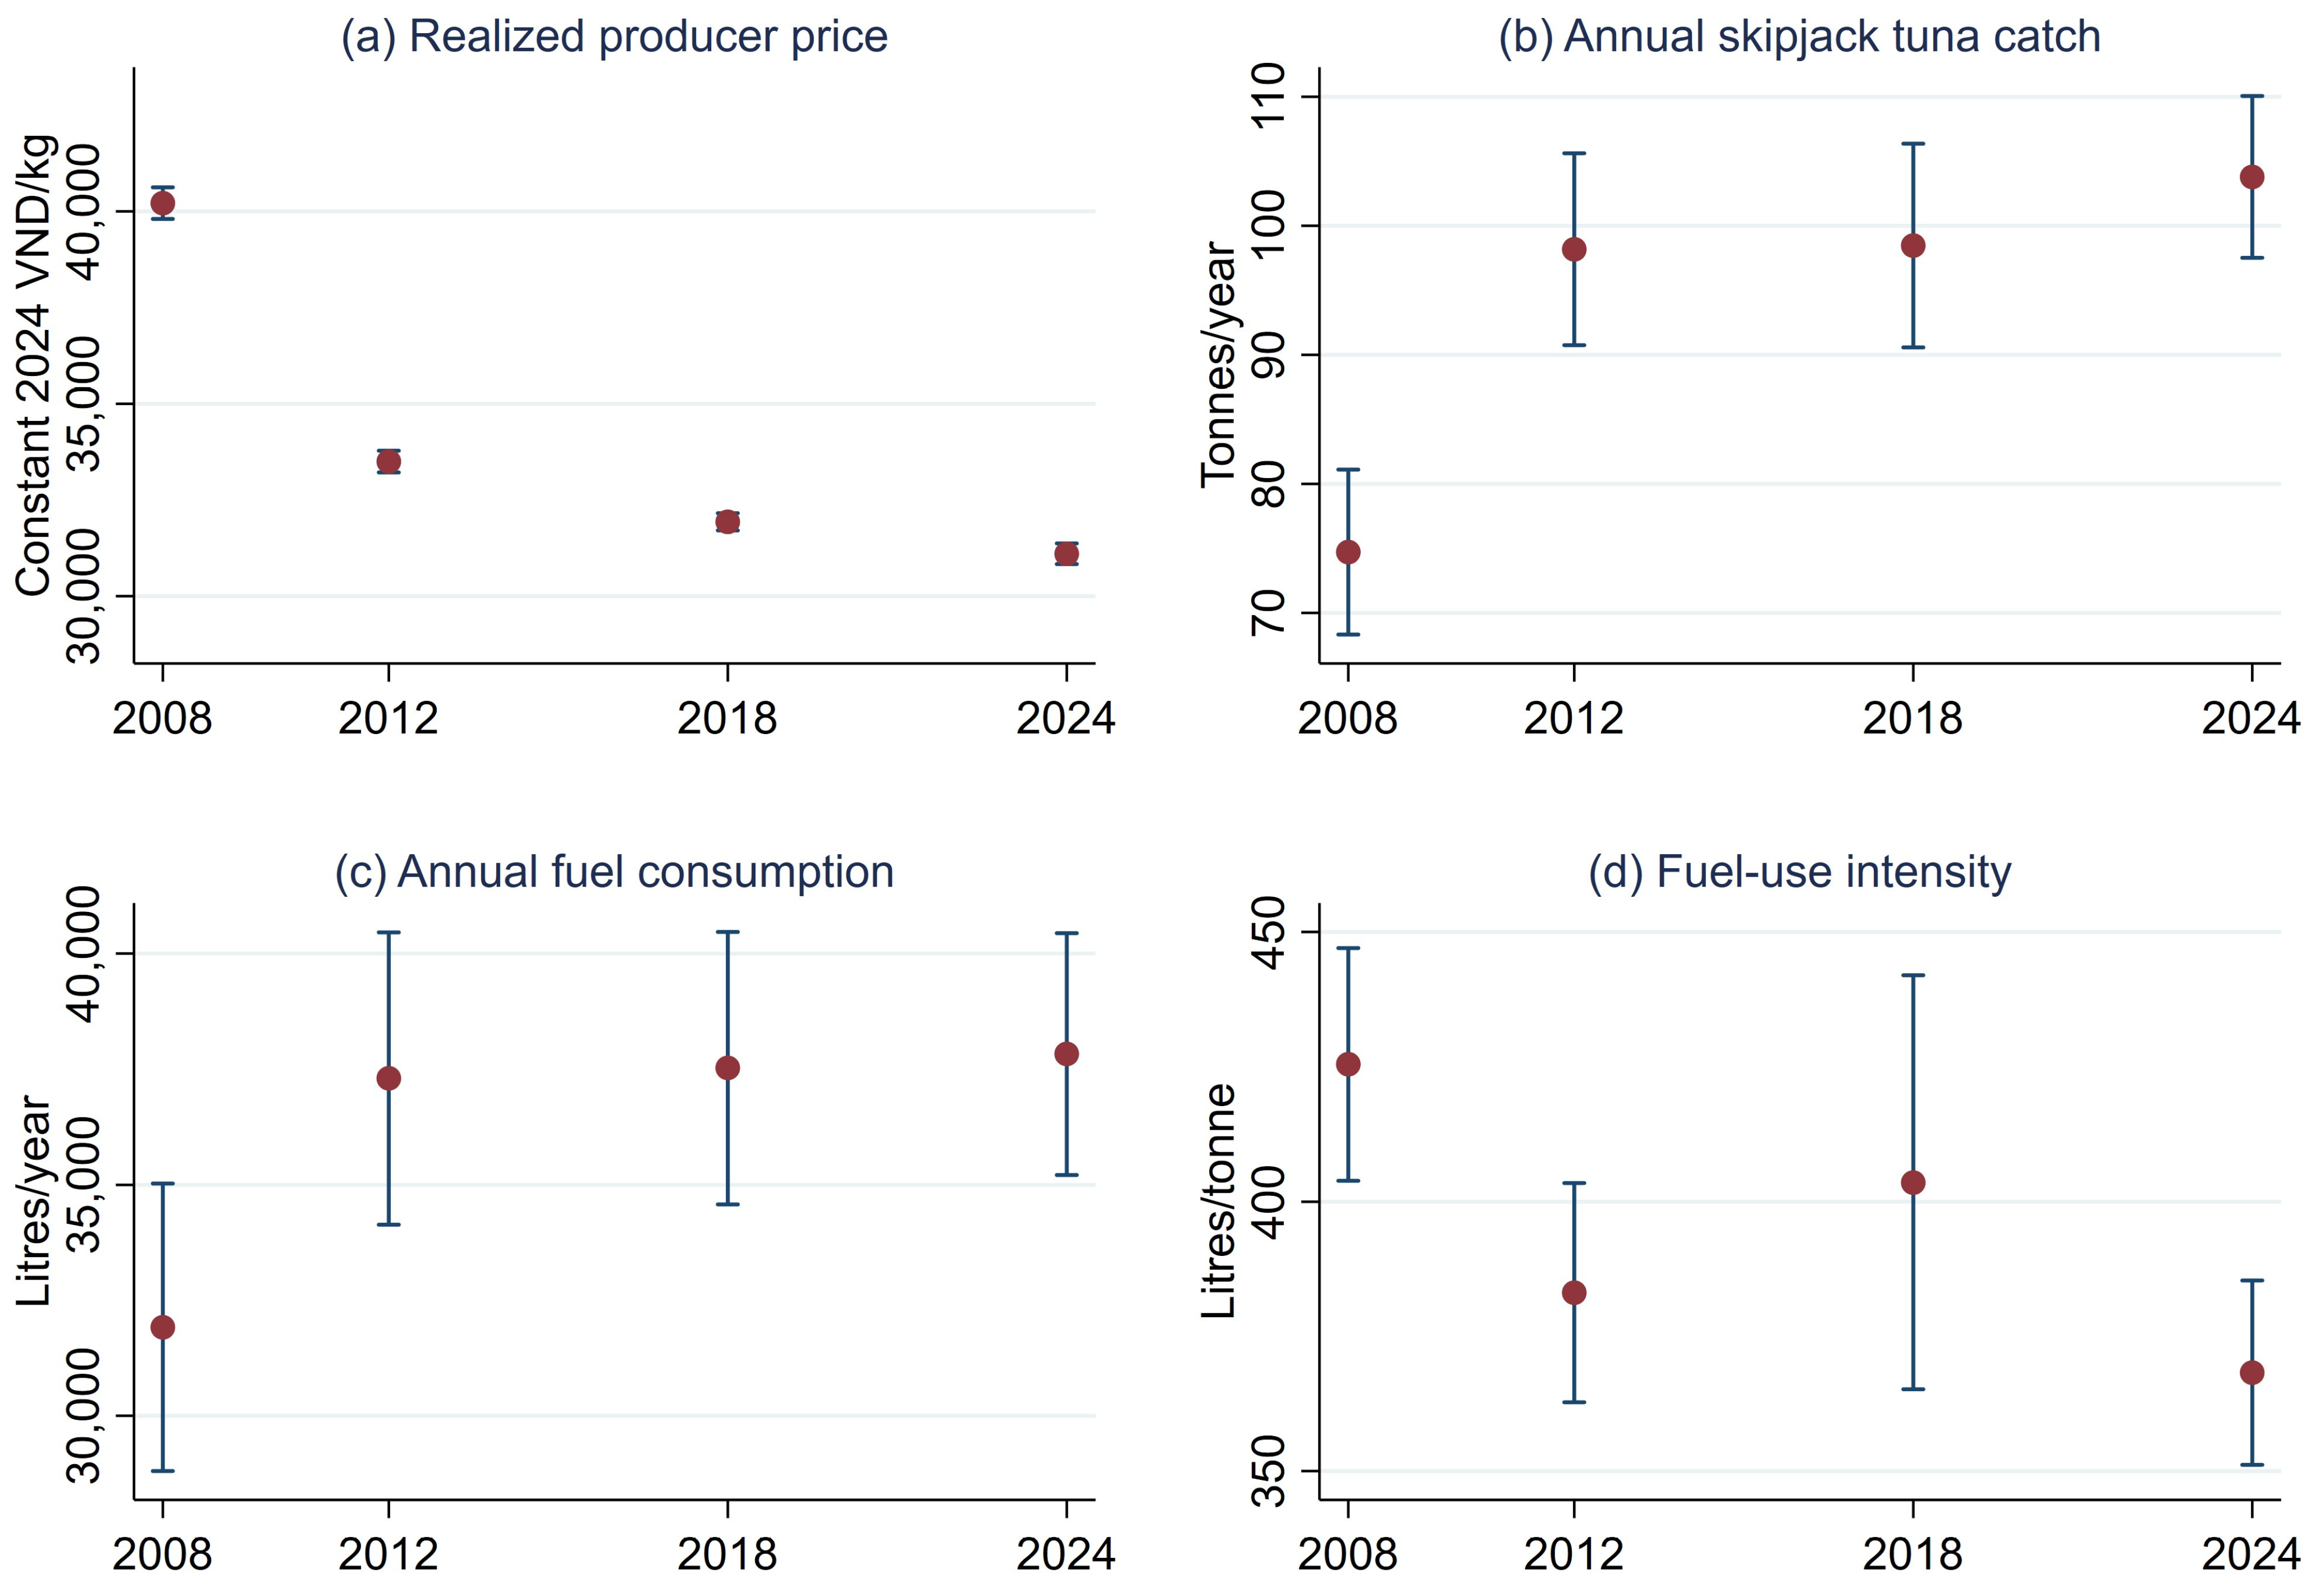

Disclaimer/Publisher’s Note: The statements, opinions and data contained in all publications are solely those of the individual author(s) and contributor(s) and not of MDPI and/or the editor(s). MDPI and/or the editor(s) disclaim responsibility for any injury to people or property resulting from any ideas, methods, instructions or products referred to in the content. |
© 2026 by the author. Licensee MDPI, Basel, Switzerland. This article is an open access article distributed under the terms and conditions of the Creative Commons Attribution (CC BY) license.