


Abstract
Salicylic acid (SA) is a plant signalling compound that may enhance crop growth and productivity, while hyperspectral reflectance provides a non-destructive approach for characterizing plant optical and physiological variability. A two-season field experiment was conducted to evaluate the effects of foliar SA application on the growth and yield of red onion (Allium cepa L. cv. Giza Red) under arid field conditions, within the broader context of agricultural sustainability. Five foliar treatments, consisting of a water-sprayed control and SA at 100, 200, 300, and 400 mg L−1, were arranged in a randomized complete block design with three replicates. Plant growth, bulb characteristics, and marketable and non-marketable yields were evaluated across the 2023/2024 and 2024/2025 growing seasons using a combined analysis that included the effects of growing season, SA concentration, and their interaction. Leaf reflectance spectra were also measured from seven representative samples during each season, and 15 vegetation indices associated with vegetation vigor, pigment status, red-edge behavior, and physiological stress were calculated. The season × SA interaction was non-significant for most agronomic traits, indicating generally consistent SA responses across seasons, except for bulb fresh weight at harvest, for which a significant interaction was detected. The highest numerical values were generally recorded at 400 mg L−1, although 300 mg L−1 produced near-maximum responses for several traits, particularly marketable yield. The spectral datasets displayed the typical reflectance pattern of green vegetation, characterized by relatively low visible reflectance, a marked red-edge transition, and higher near-infrared reflectance. Considerable variation was observed among individual leaf samples in NDVI, GNDVI, NDRE, CIred-edge, MTCI, REIP, PSRI, PRI, and other indices. However, because the spectral samples were not accompanied by verified treatment codes, the observed spectral variability was interpreted at the individual-sample level and was not statistically attributed to specific SA concentrations. The results demonstrate the agronomic potential of foliar SA application in onion and highlight the complementary value of hyperspectral measurements for the non-destructive characterization of leaf optical variability.
1. Introduction
Onion (Allium cepa L.) is one of the most widely cultivated vegetable crops worldwide due to its high economic value, extensive culinary use, and contribution to food production. According to FAOSTAT, Egypt is among the major global producers of dry onions and shallots, highlighting the economic and agricultural importance of onion production in the country [1]. Onion productivity and bulb quality are closely associated with plant physiological performance during vegetative growth and bulbing stages, which are strongly influenced by environmental conditions and crop management practices, particularly in arid and semi-arid regions [2,3]. Among the locally cultivated Egyptian onion genotypes, ‘Giza Red’ is a well-established red onion cultivar that has been evaluated under different Egyptian production environments. Recent comparative evaluation of Egyptian onion cultivars also demonstrated distinctive phytochemical characteristics of ‘Giza Red’, particularly its relatively high phenolic and flavonoid contents [4]. Its established cultivation and documented agronomic and phytochemical characteristics supported its selection for the present field experiment. Salicylic acid (SA) is an endogenous phenolic phytohormone that plays a fundamental role in regulating plant growth, photosynthesis, and stress responses [5,6]. SA also acts as a key signaling molecule through crosstalk with other phytohormones, particularly jasmonic acid and ethylene, thereby coordinating plant growth, defense, and stress responses [7]. Beyond its classical function in plant defense, SA regulates chlorophyll biosynthesis, photosynthetic efficiency, antioxidant activity, and senescence, thereby enhancing plant vigor and productivity at appropriate concentrations [8,9]. Recent studies have further shown that SA modulates signaling pathways associated with growth and abiotic stress tolerance, improving resource-use efficiency [5,6]. In onion, foliar SA application has been reported to enhance vegetative growth, photosynthetic pigments, water-use efficiency, and bulb yield under optimal and stress conditions, while improving chlorophyll concentration, bulb size, and marketable yield through enhanced photosynthetic performance and physiological resilience [10,11]. More recently, Pathak et al. [12] reported that foliar SA application significantly improved growth, yield, and quality attributes of onion, further supporting the agronomic potential of SA-based foliar management in Allium cepa. These responses are highly dependent on SA concentration and environmental conditions, highlighting the importance of identifying optimal application rates that maximize physiological benefits without unnecessary input use [12]. Recent evidence from other Allium species also indicates that SA can improve crop performance under water-limited conditions. Yousefvand et al. [13] demonstrated that foliar SA application enhanced growth, yield, and water-use efficiency of Allium hirtifolium under different levels of water stress, emphasizing its potential relevance to crop production in arid and semi-arid environments. Onion is particularly sensitive to water limitation because of its relatively shallow root system and high dependence on adequate soil moisture during critical growth stages. Water deficit can restrict vegetative growth, photosynthetic activity, bulb development, yield, and quality, making onion particularly vulnerable under arid and semi-arid conditions [3]. Exogenous SA may mitigate these effects, as previous studies on onion have reported improvements in growth, bulb quality, and water-use responses under water-limited conditions [11]. However, conventional assessment of SA effects relies mainly on destructive sampling and end-season measurements, whereas hyperspectral reflectance sensing enables non-destructive monitoring of plant physiological status through spectral information related to pigment absorption and internal leaf structure. Hyperspectral reflectance in the visible (400–700 nm) and red-edge (approximately 680–750 nm) regions is primarily influenced by pigment absorption and chlorophyll-related changes, respectively, whereas near-infrared reflectance is mainly governed by internal leaf structure and multiple scattering [14]. Consequently, red-edge and chlorophyll-sensitive vegetation indices are widely used to assess crop physiological status, often with greater sensitivity than traditional broadband indices under moderate to dense vegetation conditions [15,16].
Recent advances in hyperspectral analysis have highlighted red-edge dynamics and spectral sensitivity for detecting subtle crop physiological changes. Red-edge-based indices and hyperspectral biomarkers have provided robust estimates of chlorophyll content, photosynthetic performance, and plant health across different crops and environmental conditions [17,18,19]. Hyperspectral reflectance and vegetation indices have also detected crop responses to foliar nutrient treatments through changes in the red, red-edge, and near-infrared regions [20], supporting their use for non-destructive assessment of foliar management effects. In onion, hyperspectral approaches have detected spatial variability in yield [21] while narrowband hyperspectral imagery has identified spectral variables suitable for yield prediction across growing seasons [22]. Reflectance spectroscopy has also been used for non-destructive assessment of onion leaf biochemical and structural characteristics. Collectively, these studies demonstrate the sensitivity of onion spectral responses to agronomic and physiological variability; however, the integration of leaf hyperspectral characterization with foliar SA application under arid field conditions remains insufficiently investigated. Previous studies have investigated onion responses to SA application through conventional growth, physiological, and yield measurements, whereas hyperspectral studies have primarily focused on onion yield prediction and crop variability. Although controlled-environment studies provide opportunities to investigate plant spectral responses under standardized conditions, the combined assessment of foliar SA concentrations and leaf-level hyperspectral characteristics in onion under arid field conditions remains insufficiently documented [12,21,22]. Compared with conventional destructive measurements, hyperspectral sensing enables rapid, non-destructive, and repeated assessment of plant structural, physiological, and biochemical variability [23,24]. However, its reliability can be affected by data acquisition and processing complexity, illumination, scattering, plant geometry, and environmental variability [23,24], highlighting the importance of appropriate calibration, preprocessing, and standardized measurement conditions [23]. Integrating hyperspectral measurements with conventional agronomic assessments and biostimulant management could improve the interpretation and monitoring of crop responses. However, the integration of hyperspectral sensing with SA application remains insufficiently explored in onion under field conditions, particularly for identifying sensitive spectral regions and indices associated with physiological responses. Addressing this gap is especially relevant in arid environments, where non-destructive crop monitoring could support more efficient and sustainable production.
We hypothesized that foliar SA application would significantly improve onion growth and yield under arid field conditions, with the magnitude of the response varying among SA concentrations, and that hyperspectral reflectance and vegetation indices would capture measurable optical and physiological variability among onion leaves. The agronomic and hyperspectral components were designed to provide complementary information: conventional measurements quantify SA-related changes in plant growth and bulb yield, whereas leaf reflectance and vegetation indices characterize optical variability associated with pigment absorption, red-edge characteristics, and leaf structure. The hyperspectral assessment was exploratory and was not intended to predict responses to individual SA concentrations, as verified treatment identifiers were unavailable for the spectral samples.
Accordingly, the main objective of this study was to evaluate the agronomic and hyperspectral responses of onion to foliar salicylic acid application under arid field conditions. Specifically, the study aimed to: (i) quantify the effects of different SA concentrations on onion growth, bulb characteristics, and yield across two successive growing seasons; (ii) characterize leaf hyperspectral reflectance patterns across the visible, red-edge, and near-infrared spectral regions; (iii) evaluate selected vegetation indices related to vegetation vigor, pigment-related absorption, red-edge characteristics, and physiological stress; and (iv) assess the potential of hyperspectral measurements as a complementary, non-destructive approach for monitoring onion physiological responses under arid field conditions.
2. Materials and Methods
2.1. Study Area
The experimental site was located at the Experimental Farm of the National Research Centre, El-Beheira Governorate, Egypt (30°30′1.4″ N, 30°19′10.9″ E), at an average altitude of approximately 21 m above sea level. The study area is characterized by an arid climate with cool winters and hot, dry summers. Climatic data for the two experimental growing seasons were obtained from the NASA Prediction of Worldwide Energy Resources (POWER) Data Access Viewer for the coordinates of the experimental site (30.5004° N, 30.3197° E). Monthly mean, maximum, and minimum air temperatures, relative humidity, and bias-corrected precipitation (PRECTOTCORR) were considered for the onion growing period from December to May (Table S1) NASA POWER Data Access Viewer https://power.larc.nasa.gov/data-access-viewer/ (accessed on 18 September 2026). During both seasons, mean air temperature increased progressively toward the end of the growing period, reaching 25.61 and 25.55 °C in May 2024 and May 2025, respectively, while relative humidity generally decreased toward May. Precipitation was limited and irregular, consistent with the arid climatic conditions of the experimental area.
The experimental soil is sandy in texture and was classified as an Aridisol (order Aridisols), belonging to the suborder Durids, according to the USDA Soil Taxonomy [25]. Selected physical and chemical properties of the soil, as well as soil moisture characteristics at different depths (0–20, 20–40, and 40–60 cm), are presented in Table 1. Irrigation water used throughout the experiment had a pH of 7.3 and an electrical conductivity (EC) of 0.39 dS m−1. Peanut (Arachis hypogaea L.) was the preceding crop in both seasons. (Figure 1).
Table 1.
Soil properties and moisture characteristics at the Experimental Farm of the National Research Centre, El-Beheira Governorate, Egypt.
Figure 1.
Location of the experimental site at the National Research Centre Farm, El-Beheira Governorate, Egypt.
2.2. Experimental Layout and Applied Treatments
The field experiment was conducted during two successive growing seasons (2023/2024 and 2024/2025) using red onion (Allium cepa L. cv. Giza Red). Seedlings were obtained from the Onion Research Department, Agricultural Research Center (ARC), Giza, Egypt, and raised in the nursery for approximately 60 days following the recommended practices of the Egyptian Ministry of Agriculture and Land Reclamation. Approximately 60-day-old seedlings were transplanted on 25 December 2023 and 22 December 2024 in the first and second seasons, respectively, using the same production, selection, and transplanting procedures in both seasons. The field appearance of the crop is shown in Figure 2.
Figure 2.
Red onion (Allium cepa L. cv. Giza Red) plants grown under the arid field conditions at the experimental site, El-Beheira Governorate, Egypt.
The experiment followed a randomized complete block design (RCBD) with five foliar treatments and three replicates; blocks were separated by 1.0 m buffer spaces. Treatments comprised a distilled-water control and SA at 100, 200, 300, and 400 mg L−1, applied twice at 50 and 70 days after transplanting (DAT). Each plot measured 3.0 × 3.5 m (10.5 m2), with seedlings planted on both sides of drip-irrigation lines at 10 cm within-row spacing.
Before transplanting, calcium superphosphate (15.5% P2O5; Abu Zaabal Fertilizers and Chemicals Company, Egypt) was incorporated at 714 kg ha−1, equivalent to approximately 110.7 kg P2O5 ha−1 (48.3 kg P ha−1). Ammonium nitrate (33.5% N; Abu Qir Fertilizers and Chemicals Industries Company, Alexandria, Egypt) was applied at 286 kg N ha−1 in ten equal portions during the growing season. Potassium sulfate (48% K2O; Suez Fertilizer Manufacturing Company, Suez, Egypt) was applied at 200 kg K2O ha−1, with 25% incorporated during land preparation and the remaining 75% applied in ten weekly applications through the drip-irrigation system starting one month after transplanting. Fertilization followed ARC recommendations. All plots received the same drip irrigation and uniform weed, pest, disease, and routine crop-management practices in both seasons.
2.3. Vegetative Growth Measurements
At 90 DAT, three plants were randomly selected from the inner rows of each experimental plot (replicate), avoiding border plants to minimize edge effects, resulting in nine plants per treatment in each growing season. The three replicates represented three independent experimental plots rather than individual plants. Plant height was measured from the soil surface to the tip of the longest fully extended leaf. Bulb fresh weight was recorded immediately after sampling. For dry-weight determination, plant samples were oven-dried at 70 °C until a constant weight was reached, ensuring complete removal of moisture before recording the final dry weight. Measurements at 90 DAT were selected to characterize plant growth during the advanced vegetative and bulb-development stage, before final crop maturity.
2.4. Yield and Yield Components
Onion bulbs were harvested at 150 DAT, and the total yield was determined by harvesting the whole plot area for each treatment. At harvest, the number of leaves per plant, bulb length (cm), bulb fresh weight (g), and bulb diameter (cm) were recorded. Harvest at 150 DAT corresponded to the crop maturity stage under the experimental conditions and was therefore used for the final assessment of bulb yield and marketable and non-marketable yield components. After harvest, onion bulbs were classified into marketable and non-marketable categories. Marketable yield comprised bulbs suitable for commercial sale, whereas non-marketable yield included bolted bulbs, double bulbs, and bulbs affected by insect infestation or disease. Marketable and non-marketable bulb yields were determined separately for each experimental plot.
Marketable and non-marketable bulb yields were determined separately for each plot and converted to tonnes per hectare (t ha−1) using the following equation:
Yield (t ha−1) = [bulb yield per plot (kg) × 10]/plot area (m2)
As the experimental plot area was 10.5 m2, yield was calculated as: Yield (t ha−1) = bulb yield per plot (kg) × 10/10.5.
2.5. Hyperspectral Reflectance Measurements
Leaf hyperspectral reflectance measurements were collected from seven representative onion leaf samples during each of the 2023/2024 and 2024/2025 growing seasons. Measurements were conducted at 90 days after transplanting (DAT) using a FieldSpec HandHeld 2 spectroradiometer (Malvern Panalytical, Boulder, CO, USA), covering a wavelength range of 325–1075 nm with a sampling interval of 1 nm. Healthy, fully expanded leaves free from visible disease symptoms and mechanical damage were selected using the same sampling procedure in both growing seasons. Seven individual leaf samples were assessed in each season, yielding 14 sample-level spectra across the two seasons after averaging three readings per sample. Because the available spectral records did not contain verified identifiers linking individual leaves to their respective SA treatments, the spectra were analyzed as individual observations without assignment to unverified treatment groups.
Before spectral acquisition, the spectroradiometer was calibrated using a standard white reference panel. Leaves were carefully cleaned before measurement, and all spectra were collected using consistent illumination and sensor-geometry conditions. Three consecutive spectral readings were recorded for each leaf sample and averaged to obtain one representative reflectance spectrum per sample. To reduce spectral noise near the limits of the sensor, spectral visualization and subsequent calculations were restricted to the reliable wavelength range of 350–1050 nm.
The reflectance spectrum obtained from each leaf sample was retained separately to characterize sample-to-sample optical variability within each growing season.
2.6. Vegetation-Index Calculation
Fifteen vegetation indices were calculated from narrow-band leaf reflectance values using Equations (2)–(16) and wavelength bands presented in Table 2. The selected indices represented vegetation vigor, chlorophyll- and pigment-related absorption, red-edge characteristics, photosynthetic radiation-use efficiency, and stress- or senescence-related spectral behavior. Reflectance at wavelength λ is denoted as Rλ. When an exact wavelength was unavailable, the reflectance value at the nearest recorded wavelength was used. The calculated indices were interpreted as relative indicators of sample-level optical and physiological variability rather than as direct quantitative measurements of pigment concentration or stress intensity.
Table 2.
Hyperspectral vegetation indices calculated from onion leaf reflectance spectra.
2.7. Statistical Analysis
Agronomic data from the two growing seasons were subjected to a combined analysis of variance (ANOVA) according to the randomized complete block design (RCBD). The statistical model included growing season, salicylic acid (SA) concentration, and the season × SA interaction, with blocks nested within growing season to account for the experimental design. The effect of growing season was tested against the block-within-season mean square, whereas the effects of SA concentration and the season × SA interaction were tested against the residual error. In addition, season-specific analyses were retained to facilitate interpretation of SA responses within each growing season. When significant treatment effects were detected, treatment means were compared using the least significant difference (LSD) test at the 5% probability level (p ≤ 0.05). Model residuals were examined for normality and homogeneity of variance. Spectral reflectance data and vegetation indices were summarized descriptively because verified treatment codes and sufficient independent spectral replicates were unavailable.
3. Results and Discussion
3.1. Effects of Salicylic Acid on Onion Growth and Yield
3.1.1. Vegetative Growth Response to Salicylic Acid
Table 3 shows that foliar application of salicylic acid significantly improved onion vegetative growth during the 2023/2024 growing season. Plant height increased from 50.50 cm in the untreated control to 54.12, 57.23, 59.50, and 60.12 cm following the application of SA at 100, 200, 300, and 400 mg L−1, respectively. All SA treatments produced significant increases in plant height compared with the control because the differences exceeded the LSD value of 1.31 cm. However, the difference between 300 and 400 mg L−1 was not significant. Bulb fresh weight increased from 91.20 g in the control to 100.55, 106.11, 109.15, and 112.45 g under SA at 100, 200, 300, and 400 mg L−1, respectively. All SA treatments differed significantly from the control based on the LSD value of 2.10 g. The difference between 300 and 400 mg L−1 was also significant. Similarly, bulb dry weight increased from 9.45 g in the control to 11.50, 12.45, 13.70, and 14.12 g under the corresponding SA concentrations. All SA treatments significantly increased bulb dry weight compared with the control, whereas the difference between 300 and 400 mg L−1 was not significant according to the LSD value of 0.61 g.
Table 3.
Effects of foliar salicylic acid application on onion growth characteristics at 90 days.
These results indicate that foliar SA application enhanced onion growth and bulb biomass accumulation. The stimulatory effect of SA may be related to its regulatory roles in cell division, cell expansion, photosynthetic activity, hormonal balance, and stress-related signaling pathways [5,6,40]. The increases in bulb fresh and dry weights may also indicate greater assimilate production and allocation to the bulb. Similar improvements in onion biometric traits and water-use efficiency following SA application have been reported under field conditions [11]. Similarly, Pradhan et al. [41] reported that foliar SA application significantly increased plant height and bulb weight in onion compared with the untreated control, supporting the positive growth and biomass responses observed in the present study. During the 2024/2025 growing season, plant height increased from 51.24 cm in the control to 53.26, 57.45, 58.70, and 59.46 cm under SA at 100, 200, 300, and 400 mg L−1, respectively. All SA treatments significantly increased plant height compared with the control based on the LSD value of 1.12 cm. However, the difference between 300 and 400 mg L−1 was not significant.
Bulb fresh weight increased from 94.62 g in the control to 99.12, 104.80, 108.61, and 111.14 g under the corresponding SA concentrations. All SA treatments differed significantly from the control based on the LSD value of 2.22 g. The difference between 300 and 400 mg L−1 was also significant. Bulb dry weight increased from 9.90 g in the control to 10.87, 11.23, 12.70, and 13.24 g, respectively. All SA treatments significantly increased bulb dry weight compared with the control, whereas the difference between 300 and 400 mg L−1 was not significant according to the LSD value of 0.56 g. The combined analysis across the two growing seasons showed that SA concentration significantly affected plant height, bulb fresh weight, and bulb dry weight at 90 DAT (p < 0.001). The season × SA interaction was not significant for any of these vegetative growth traits (p > 0.05), indicating that the response pattern to increasing SA concentration was generally consistent across the two growing seasons. The main effect of growing season was also not significant for these traits (p > 0.05). Thus, although individual mean values differed slightly between seasons, the combined analysis confirmed that the effects of SA on vegetative growth and bulb biomass at 90 DAT were not significantly dependent on growing season.
3.1.2. Bulb Traits and Leaf Number at Harvest
Table 4 shows that foliar SA application significantly affected bulb length and bulb fresh weight at harvest during the 2023/2024 growing season. Bulb length increased from 6.20 cm in the control to 6.82, 7.55, 7.89, and 8.11 cm following the application of SA at 100, 200, 300, and 400 mg L−1, respectively. All SA treatments produced significant increases compared with the control because the differences exceeded the LSD value of 0.26 cm. However, the difference between 300 and 400 mg L−1 was not significant. Bulb fresh weight at harvest increased from 94.50 g in the control to 126.40, 139.12, 148.75, and 152.23 g under SA at 100, 200, 300, and 400 mg L−1, respectively. All SA treatments significantly increased bulb fresh weight compared with the control based on the LSD value of 3.11 g. The difference between 300 and 400 mg L−1 was also significant. In contrast, the number of leaves per plant ranged from 9.54 in the control to 11.12 under 400 mg L−1, but the treatment effect was not significant. These findings demonstrate that SA had a greater effect on bulb enlargement and fresh biomass accumulation than on leaf production. The increase in bulb length and bulb fresh weight may be associated with improved assimilate production and allocation toward the bulb, which represents the principal economic sink in onion. This interpretation is consistent with evidence indicating that onion bulb development and productivity depend on the maintenance of physiological activity during vegetative growth and bulb filling [3]. Previous field studies have also shown that SA application can improve onion productivity-related characteristics without necessarily producing significant changes in all vegetative traits [11].
Table 4.
Effects of foliar salicylic acid application on leaf number and bulb characteristics of onion.
In contrast, Nangare et al. [42] reported a significant increase in the number of leaves per plant following foliar SA application in onion. The difference from the present results may be related to differences in cultivar, SA concentration, application timing, and prevailing environmental conditions, indicating that the leaf-number response to SA is dependent on both treatment regime and growing conditions.
During the 2024/2025 growing season, bulb length increased from 6.51 cm in the control to 7.30, 7.95, 8.25, and 8.37 cm under SA at 100, 200, 300, and 400 mg L−1, respectively. All SA treatments produced significant increases compared with the control based on the LSD value of 0.24 cm. However, the difference between 300 and 400 mg L−1 was not significant. Bulb fresh weight at harvest increased from 96.12 g in the control to 121.34, 145.12, 154.24, and 156.28 g under the corresponding SA concentrations. All SA treatments significantly increased bulb fresh weight compared with the control according to the LSD value of 3.18 g. The difference between 300 and 400 mg L−1 was not significant. The number of leaves per plant ranged from 9.50 in the control to 11.00 under 400 mg L−1, but the treatment effect was not significant. These results confirmed that the response to SA during the second growing season was expressed mainly through bulb enlargement and biomass accumulation rather than a significant increase in leaf number.
The combined ANOVA showed that SA concentration significantly affected bulb fresh weight at harvest and bulb length (p < 0.001), whereas its effect on the number of leaves per plant was not significant (p > 0.05). A significant main effect of growing season was detected for bulb length (p < 0.001), while the season × SA interaction was significant only for bulb fresh weight at harvest (p < 0.001). This interaction indicates that the magnitude of the bulb fresh-weight response to SA differed between the two growing seasons, although SA increased bulb fresh weight in both seasons. In contrast, the season × SA interaction was not significant for bulb length or number of leaves per plant (p > 0.05).
3.1.3. Yield and Yield Components
As shown in Table 5, foliar SA application significantly affected bulb diameter and marketable bulb yield during the 2023/2024 growing season. Bulb diameter increased from 5.25 cm in the control to 6.25, 7.11, 7.44, and 7.56 cm under SA at 100, 200, 300, and 400 mg L−1, respectively. All SA treatments produced significant increases compared with the control because the differences exceeded the LSD value of 0.22 cm. The difference between 300 and 400 mg L−1 was not significant.
Table 5.
Effects of foliar salicylic acid application on bulb diameter and marketable and non-marketable onion yields during the 2023/2024 and 2024/2025 growing seasons.
Marketable bulb yield increased from 23.24 t ha−1 in the control to 25.60, 27.70, 29.00, and 29.40 t ha−1 under SA at 100, 200, 300, and 400 mg L−1, respectively. All SA treatments significantly increased marketable yield compared with the control based on the LSD value of 0.45 t ha−1. However, the difference between 300 and 400 mg L−1 was not significant. Non-marketable bulb yield increased from 1.45 t ha−1 in the control to 1.65, 1.87, 2.11, and 2.24 t ha−1 under the corresponding SA concentrations. The difference between the control and 100 mg L−1 was not significant because it was smaller than the LSD value of 0.25 t ha−1. In contrast, SA at 200, 300, and 400 mg L−1 produced significant increases in non-marketable yield compared with the control. Differences among SA at 200, 300, and 400 mg L−1 were not significant.
The increase in bulb diameter and marketable yield demonstrates that SA enhanced onion productive performance; possibly by supporting assimilate production and allocation during bulb development. Similar improvements in the growth, yield, and water-use efficiency of Allium crops following SA application have been reported under field and water-limited conditions [3,11,13]. However, non-marketable yield also increased at the higher SA concentrations. Therefore, the results primarily demonstrate an increase in absolute bulb production rather than an unequivocal improvement in the proportion of marketable bulbs. However, because the individual causes of bulb rejection (bolting, double bulbs, and insect- or disease-affected bulbs) were not quantified separately, the specific factors contributing to the increase in non-marketable yield could not be determined.
Although 400 mg L−1 generally produced the highest numerical values, the responses obtained at 300 mg L−1 were close to the maximum for several traits, particularly marketable bulb yield. Therefore, 300 mg L−1 may represent a practical agronomic rate under the conditions of this study; however, an economically optimum concentration cannot be identified without a formal cost–benefit or dose–response analysis.
During the 2024/2025 growing season, bulb diameter increased from 5.55 cm in the control to 6.11, 6.89, 7.23, and 7.55 cm under SA at 100, 200, 300, and 400 mg L−1, respectively. All SA treatments produced significant increases compared with the control based on the LSD value of 0.31 cm. The difference between 300 and 400 mg L−1 was also significant. Marketable bulb yield increased from 22.40 t ha−1 in the control to 23.51, 26.64, 28.32, and 28.75 t ha−1 under SA at 100, 200, 300, and 400 mg L−1, respectively. All SA treatments significantly increased marketable yield compared with the control according to the LSD value of 0.46 t ha−1. However, the difference between 300 and 400 mg L−1 was not significant.
Non-marketable bulb yield increased from 1.39 t ha−1 in the control to 1.72, 1.88, 1.99, and 2.11 t ha−1 under the corresponding SA concentrations. Based on an LSD value of 1.94 t ha−1, the differences in non-marketable bulb yield among SA treatments and the untreated control were not statistically significant during the 2024/2025 growing season. The response observed during the 2024/2025 season therefore confirmed the general improvement in bulb diameter and marketable yield following SA application, although the simultaneous increase in non-marketable yield indicates that SA primarily enhanced total production rather than consistently improving the marketable proportion of the harvested bulbs.
As shown in Table 6, the combined ANOVA showed significant effects of SA concentration on bulb diameter, marketable bulb yield, and non-marketable bulb yield (p < 0.01). In contrast, the main effect of growing season and the season × SA interaction were not significant for any of these yield traits (p > 0.05). These results indicate that the overall response of bulb diameter and yield components to SA was generally consistent across the two growing seasons despite differences in the numerical values recorded between seasons.
Table 6.
Combined analysis of variance for the effects of growing season, salicylic acid (SA) concentration, and their interaction on onion growth and yield traits.
The combined ANOVA demonstrated a significant main effect of SA concentration on all evaluated agronomic traits except the number of leaves per plant (Table 6). The main effect of growing season was non-significant for most traits, whereas bulb length differed significantly between seasons (p < 0.001). The season × SA interaction was non-significant for eight of the nine evaluated traits, indicating that the general response to SA was largely consistent across the two growing seasons. A significant season × SA interaction was detected only for bulb fresh weight at harvest (F = 9.587, p < 0.001), indicating that the magnitude of the response to SA for this trait differed between seasons. Therefore, the season-specific treatment means presented in Table 3, Table 4 and Table 5 were retained to facilitate interpretation of treatment responses within each growing season. The climatic data in Table S1 also provide important context for interpreting the two growing seasons. Although the seasonal temperature patterns were broadly comparable, precipitation differed markedly between seasons, particularly during the early growing period. Total precipitation from December to May was higher in 2023/2024 than in 2024/2025. However, because all treatments received the same drip-irrigation regime, rainfall was not the sole source of crop water supply. The combined ANOVA showed that the main effect of growing season was non-significant for most agronomic traits, except bulb length, while most season × SA interactions were also non-significant. This suggests that the positive response to SA was generally maintained across the interseasonal climatic variability, although the significant season × SA interaction for bulb fresh weight at harvest indicates that the magnitude of this response varied between seasons. Overall, the study hypothesis was partially supported. Foliar SA application significantly improved most agronomic traits, whereas the number of leaves per plant was not significantly affected. The generally non-significant season × SA interactions indicated that the agronomic response to SA was largely consistent across the two growing seasons, although the significant interaction for bulb fresh weight at harvest showed that the magnitude of this response varied between seasons. The hyperspectral component also confirmed measurable optical and physiological variability among onion leaf samples; however, this variability could not be statistically attributed to individual SA concentrations because verified treatment identifiers were unavailable for the spectral samples.
3.2. Hyperspectral Assessment of Representative Onion Leaf Samples
3.2.1. Hyperspectral Reflectance Signatures in the 2023/2024 Spectral Dataset
The reflectance spectra recorded at the first measurement date showed the characteristic spectral response of green vegetation across the analyzed wavelength range of 350–1050 nm (Figure 3). Reflectance was relatively low in the blue region because of strong pigment absorption, increased moderately in the green region, and remained comparatively low throughout the red region. A pronounced increase occurred across the red-edge region, followed by substantially higher reflectance in the near-infrared region [14]. Clear spectral variability was observed among the seven onion leaf samples, particularly after the red-edge transition. Sample 7 exhibited the highest near-infrared reflectance, whereas Sample 1 showed the lowest values in this region. This variability may reflect differences in leaf pigment composition, internal cellular structure, water status, or physiological condition [14,43]. Because the spectral dataset did not include codes linking the individual samples to specific salicylic acid treatments, the observed differences were interpreted as sample-to-sample variability and were not attributed to particular SA concentrations. The observed spectral pattern agrees with the established optical behavior of healthy green vegetation. Reflectance in the visible region is mainly controlled by the absorption of photosynthetic pigments, whereas reflectance in the near-infrared region is primarily influenced by internal leaf structure and multiple scattering within leaf tissues [14,44].
Figure 3.
Hyperspectral reflectance signature of onion leaves (350–1100 nm).
3.2.2. Mean Reflectance of the Major Spectral Regions at the First Measurement Date
Mean reflectance values were calculated separately for the seven onion leaf samples within the blue, green, combined red and red-edge, and near-infrared spectral regions (Figure 4). Mean blue reflectance ranged from 0.0395 to 0.0791, with Sample 1 recording the lowest value and Sample 6 recording the highest value. Mean green reflectance ranged from 0.0607 to 0.1195, and the lowest and highest values were also recorded for Samples 1 and 6, respectively. In the combined red and red-edge region, mean reflectance ranged from 0.0814 to 0.1690, with Sample 1 showing the lowest value and Sample 6 showing the highest value. The near-infrared region exhibited the greatest variability among samples, with mean reflectance ranging from 0.2660 in Sample 1 to 0.5294 in Sample 7. Samples 3 and 6 also exhibited relatively high near-infrared reflectance values of 0.4785 and 0.3917, respectively.
Figure 4.
Mean reflectance of seven representative onion leaf samples within the blue, green, combined red and red-edge, and near-infrared spectral regions at the first measurement date.
The greater variability observed in the near-infrared region can be attributed primarily to differences in leaf internal structure and multiple scattering within leaf tissues. In comparison, variability in the visible region is more closely associated with differences in pigment absorption [43,44]. These findings demonstrate that the near-infrared region provided the clearest separation among the examined onion leaf samples at the first measurement date. However, the differences were interpreted descriptively because the seven spectral samples were not identified according to their corresponding salicylic acid treatments [43,44].
3.2.3. Vegetation Indices in the 2023/2024 Spectral Dataset
Vegetation indices calculated at the first measurement date revealed considerable optical and physiological variability among the seven onion leaf samples (Table 7). NDVI ranged from 0.4067 in Sample 6 to 0.7360 in Sample 7, while GNDVI ranged from 0.4089 in Sample 6 to 0.5909 in Sample 7. Sample 7 also exhibited the highest CIred-edge (1.2594), MCARI (0.1484), TCARI (0.2196), and OSAVI (0.6923) values. These results indicate that Sample 7 had comparatively high vegetation vigor, chlorophyll-related activity, and near-infrared reflectance at the first measurement date. In contrast, Sample 6 recorded the lowest NDVI and GNDVI values, indicating a comparatively weaker vegetation-vigor response.
Table 7.
Vegetation indices calculated for seven representative onion leaf samples at the first measurement date during the 2023/2024 growing season.
The red-edge indices also varied among the examined samples. Sample 1 recorded the highest NDRE value (0.2361), closely followed by Sample 7 (0.2338), while the highest MTCI value was recorded for Sample 1 (2.8809). REIP values showed a comparatively narrow range from 718.4171 nm in Sample 4 to 719.9104 nm in Sample 5. These red-edge indices are sensitive to changes in leaf chlorophyll concentration and the position and shape of the transition between red absorption and near-infrared reflectance. Consequently, the differences among samples indicate variability in their pigment-related and structural characteristics.
Stress- and pigment-related indices provided additional information about leaf condition. PSRI ranged from 0.0109 in Sample 7 to 0.1129 in Sample 6, suggesting comparatively greater senescence- or stress-related pigment changes in Sample 6. PRI values were negative for all samples and ranged from −0.038411 in Sample 6 to −0.007891 in Sample 1. SIPI ranged from 1.0334 in Sample 7 to 1.2690 in Sample 6. The combination of a relatively high PSRI and SIPI and a more negative PRI in Sample 6 was consistent with its comparatively low NDVI and GNDVI values. ARI1 ranged from 0.7200 in Sample 7 to 1.9231 in Sample 5, while CRI1 ranged from 1.5555 in Sample 6 to 4.3726 in Sample 7, demonstrating additional variability in anthocyanin- and carotenoid-sensitive reflectance responses.
Overall, the results demonstrate that narrow-band vegetation indices were sensitive to differences in the optical, biochemical, and structural characteristics of onion leaves. Vigor-related indices such as NDVI, GNDVI, and OSAVI were consistent with the strong near-infrared response observed in Sample 7, whereas PSRI, PRI, and SIPI indicated comparatively greater physiological alteration in Sample 6 [32,35,36,43]. The sensitivity of spectral vegetation indices observed in the present onion samples is consistent with previous onion-specific remote-sensing studies. Marino and Alvino [21] demonstrated that hyperspectral vegetation indices were significantly related to spatial variability in onion yield, supporting the usefulness of spectroradiometric measurements for detecting differences in crop performance. Similarly, Hassan et al. [45] reported that vegetation indices, including NDVI, MCARI, and REIP, were responsive to biophysical characteristics and yield variability of green onion under Egyptian conditions. These onion-specific findings support the interpretation that the variability observed in the present vegetation indices reflects meaningful differences in leaf optical and physiological characteristics, although direct attribution to SA treatments was not possible in the current spectral dataset.
3.3. Hyperspectral Assessment of the 2024/2025 Spectral Dataset
3.3.1. Hyperspectral Reflectance Signatures
The hyperspectral reflectance curves recorded at the second measurement date exhibited the characteristic spectral pattern of green vegetation over the analyzed wavelength range of 350–1050 nm (Figure 5). Reflectance was relatively low in the blue region because of strong absorption by photosynthetic pigments, increased gradually toward a local green reflectance peak around 550–560 nm, and subsequently decreased within the red absorption region. A pronounced increase was observed between approximately 700 and 750 nm, representing the red-edge transition, followed by substantially higher reflectance throughout the near-infrared region. This general spectral behavior is consistent with the optical properties of green leaves, in which visible reflectance is primarily controlled by pigment absorption, whereas red-edge and near-infrared reflectance is strongly affected by chlorophyll status and the internal structure of leaf tissues [18,43].
Figure 5.
Hyperspectral reflectance spectra of seven representative onion leaf samples at the second measurement date over the 350–1050 nm analysis range.
Considerable spectral variability was observed among the seven onion leaf samples, particularly across the red-edge and near-infrared regions. Sample 7 showed the highest reflectance after the red-edge transition and reached a maximum reflectance of approximately 0.8264 at 929 nm. Samples 3, 4, and 6 exhibited intermediate-to-high near-infrared reflectance, with maximum values of approximately 0.4328, 0.4446, and 0.4612, respectively. In contrast, Samples 1, 2, and 5 showed comparatively lower near-infrared reflectance, with maximum values of approximately 0.2806, 0.3113, and 0.3048, respectively. The pronounced separation among samples after approximately 700 nm indicates that red-edge and near-infrared wavelengths were particularly sensitive to differences in onion leaf optical and structural properties. Similar sensitivity of red-edge wavelengths to chlorophyll-related and physiological variability has been reported in recent hyperspectral studies of crop and tree leaves [17,18].
At the green reflectance peak around 555 nm, reflectance ranged from 0.0832 in Sample 5 to 0.2175 in Sample 7. At 720 nm, within the red-edge transition, reflectance ranged from 0.1668 in Sample 5 to 0.4699 in Sample 7. The separation became more pronounced at 800 nm, where reflectance ranged from 0.2540 in Sample 1 to 0.7766 in Sample 7. These results indicate that variability among the samples was considerably greater in the red-edge and near-infrared regions than in the visible region. However, because the spectral dataset did not include codes linking the individual samples to specific salicylic acid treatments, these differences were interpreted as sample-to-sample variability and were not attributed to particular SA concentrations.
3.3.2. Mean Reflectance of the Major Spectral Regions at the Second Measurement Date
Mean reflectance was calculated separately for each onion leaf sample within the blue, green, combined red and red-edge, and near-infrared spectral regions (Figure 6). Mean blue reflectance ranged from 0.0393 in Sample 5 to 0.0944 in Sample 7. Mean green reflectance ranged from 0.0558 in Sample 5 to 0.1288 in Sample 7, whereas mean reflectance in the combined red and red-edge region ranged from 0.0806 in Sample 5 to 0.1751 in Sample 7. The near-infrared region showed the greatest variability, with mean reflectance ranging from 0.2468 in Sample 1 to 0.7051 in Sample 7.
Figure 6.
Mean reflectance of seven representative onion leaf samples within the blue, green, combined red and red-edge, and near-infrared spectral regions at the second measurement date.
The mean near-infrared reflectance values were 0.2468, 0.2680, 0.3754, 0.3856, 0.2584, 0.4020, and 0.7051 for Samples 1–7, respectively. Sample 7 therefore exhibited a substantially stronger near-infrared response than the other samples, followed by Samples 6, 4, and 3. In contrast, Samples 1, 2, and 5 showed comparatively low mean near-infrared reflectance. The marked variability in this region may be associated with differences in leaf internal cellular organization, thickness, air–cell interfaces, biomass, or water status. Near-infrared reflectance is influenced primarily by multiple scattering within leaf tissues and therefore may vary substantially even when visible reflectance differences are comparatively small [18,43]. The contrast between Samples 1 and 7 was also consistent with their vegetation-index responses. Sample 7 exhibited substantially higher near-infrared reflectance, together with higher NDVI and GNDVI and lower senescence-related index values, suggesting comparatively favorable leaf optical and physiological characteristics. In contrast, the weaker near-infrared response of Sample 1, together with its lower vigor-related indices and higher PSRI, may reflect differences in internal leaf structure and pigment status. Nevertheless, these interpretations remain indirect because leaf anatomical characteristics, pigment concentrations, and water content were not independently measured for the individual spectral samples.
Variability within the visible region was narrower than that observed in the near-infrared region. Nevertheless, Samples 5 and 7 maintained the lowest and highest mean reflectance, respectively, across the blue, green, and combined red and red-edge regions. These differences may reflect variation in pigment absorption and leaf structural properties. Recent hyperspectral investigations have similarly demonstrated that combined analysis of visible, red-edge, and near-infrared reflectance can provide complementary information about chlorophyll concentration, vegetation vigor, and plant physiological condition [17,19]. In onion specifically, Marino and Alvino [21] demonstrated that hyperspectral vegetation indices were significantly related to spatial variability in onion yield, highlighting the value of spectral measurements for characterizing crop performance. These onion-specific findings further support the usefulness of hyperspectral measurements for characterizing variability in onion crop performance.
3.3.3. Vegetation Indices in the 2024/2025 Spectral Dataset
Vegetation indices calculated at the second measurement date revealed substantial optical and physiological variability among the seven onion leaf samples (Table 8). NDVI ranged from 0.2627 in Sample 1 to 0.6967 in Sample 7, whereas GNDVI ranged from 0.3164 to 0.5633 in the same samples. Sample 7 also recorded the highest CIred-edge (1.2391), MCARI (0.1817), TCARI (0.2931), OSAVI (0.6946), and TCARI/OSAVI (0.4220) values. The concurrence of high vigor-, chlorophyll-, and red-edge-related indices in Sample 7 was consistent with its pronounced red-edge transition and markedly high near-infrared reflectance. Similar consistency between spectral reflectance patterns and vegetation indices has been reported in hyperspectral assessments of wild plants, field crops, and structurally different vegetation types [18,20,46].
Table 8.
Vegetation indices calculated for seven representative onion leaf samples at the second measurement date during the 2024/2025 growing season.
Sample 1 recorded the lowest NDVI, GNDVI, and OSAVI values, indicating comparatively weak spectral vegetation vigor at the second measurement date. NDVI is strongly influenced by the contrast between red absorption and near-infrared scattering, whereas GNDVI provides greater sensitivity to changes in green reflectance and chlorophyll-related properties. OSAVI incorporates a soil-adjustment coefficient and is generally less affected by background reflectance than NDVI, although the influence of soil background is expected to be limited in direct leaf-level measurements. The agreement among the low NDVI, GNDVI, and OSAVI values of Sample 1 therefore strengthens the interpretation of its comparatively weak vigor-related spectral response. Conversely, Sample 7 showed the highest NDVI and OSAVI values, demonstrating close agreement between its calculated indices and measured near-infrared response. The usefulness of combining several indices rather than relying on a single spectral metric has also been demonstrated in hyperspectral assessments of plant condition, chlorophyll content, environmental exposure, and crop response to nutrient management [19,20,47,48].
Red-edge indices provided additional evidence of variation among the examined samples. NDRE ranged from 0.1126 in Sample 1 to 0.2689 in Sample 6, whereas CIred-edge ranged from 0.3807 in Sample 1 to 1.2391 in Sample 7. Sample 6 recorded the highest MTCI value (4.0664), closely followed by Sample 5 (3.9297). Sample 6 also showed the highest REIP value at 722.6798 nm, while Sample 5 recorded the second-highest value at 722.1578 nm. These comparatively high MTCI and REIP values indicate pronounced red-edge responses in Samples 5 and 6, potentially reflecting differences in chlorophyll-related absorption and in the position and slope of the red-edge transition. However, MTCI, NDRE, CIred-edge, and REIP do not necessarily rank samples identically because each index uses different wavelengths and responds differently to chlorophyll concentration, leaf structure, canopy density, and spectral background. Recent studies have demonstrated the strong sensitivity of red-edge and narrow-band indices to variation in leaf chlorophyll content and plant physiological status, while also emphasizing the importance of crop-specific calibration [17,18,20,49].
Chlorophyll-absorption indices also differed among samples. Sample 7 recorded the highest MCARI and TCARI values, whereas Sample 1 recorded the lowest values of both indices. MCARI and TCARI were developed to enhance sensitivity to chlorophyll absorption while reducing the influence of non-chlorophyll spectral effects. Nevertheless, their values can also be affected by leaf structure, pigment interactions, and measurement conditions. The high MCARI, TCARI, CIred-edge, NDVI, and OSAVI values of Sample 7 therefore provide mutually supporting evidence of a strong chlorophyll- and vigor-related spectral response. Similar applications of hyperspectral indices for estimating chlorophyll variability and detecting crop physiological responses have been reported for winter wheat, cotton, jujube, and faba bean [17,20,48,49].
Stress- and senescence-sensitive indices provided complementary information about the physiological condition of the examined leaves. PSRI ranged from 0.0110 in Sample 7 to 0.1867 in Sample 1. Sample 1 also recorded the highest SIPI value (1.5674) and the most negative PRI value (−0.056115). The combination of high PSRI and SIPI values, a strongly negative PRI value, and low NDVI and GNDVI values suggests that Sample 1 experienced comparatively greater pigment alteration or physiological stress than the other samples. PSRI is sensitive to changes in the relative proportions of carotenoids and chlorophyll associated with senescence, while SIPI reflects changes in the carotenoid-to-chlorophyll relationship. PRI is associated with changes in photosynthetic radiation-use efficiency and xanthophyll-cycle activity, although it may also respond to illumination conditions, pigment pools, leaf age, and structural variation. Therefore, these indices provide relative indicators of physiological condition rather than direct measurements of stress intensity [49,50,51].
In contrast to Sample 1, Sample 7 recorded the lowest PSRI (0.0110), the lowest SIPI (1.0319), and the least negative PRI value (−0.002362). These values were consistent with the comparatively high NDVI, GNDVI, OSAVI, MCARI, and TCARI values recorded for this sample. The agreement between high vigor-related indices and low senescence-related indices indicates that Sample 7 maintained a comparatively favorable pigment and structural response at the second measurement date. Previous hyperspectral investigations have similarly demonstrated that the joint interpretation of vigor-, pigment-, and stress-sensitive indices provides more reliable physiological information than interpreting an individual index separately [20,46,49].
Pigment-sensitive indices revealed further variability. ARI1 ranged from 0.4682 in Sample 7 to 2.4575 in Sample 5, whereas CRI1 ranged from 1.7448 in Sample 1 to 4.1702 in Sample 5. Sample 5 therefore showed the highest responses in both anthocyanin- and carotenoid-sensitive indices. Anthocyanins and carotenoids are involved in photoprotection and may vary in response to leaf development, oxidative pressure, nutrient conditions, and environmental stress. The high ARI1 and CRI1 values recorded for Sample 5 may consequently indicate a comparatively strong accessory-pigment response. However, reflectance indices should not be interpreted as direct quantitative measurements of pigment concentrations unless they are calibrated and validated against laboratory biochemical measurements. Recent studies have confirmed both the potential of hyperspectral reflectance for pigment estimation and the importance of appropriate calibration under different vegetation structures and measurement conditions [18,19,52].
Overall, vegetation-index patterns were consistent with the measured reflectance characteristics of the onion samples. Sample 7 combined high near-infrared reflectance with high NDVI, GNDVI, CIred-edge, MCARI, TCARI, and OSAVI and low PSRI and SIPI values, indicating a comparatively strong vigor- and chlorophyll-related spectral response. Sample 1 showed the opposite pattern, characterized by low vigor-related indices and high stress- and senescence-related indices. Sample 5 showed the strongest ARI1 and CRI1 responses, while Sample 6 exhibited the highest NDRE, MTCI, and REIP values. These differences demonstrate that individual indices respond to distinct biochemical and structural characteristics and should therefore be interpreted collectively. This conclusion is consistent with previous research demonstrating the value of integrating full spectral signatures with multiple vegetation indices for detecting plant-condition variability and responses to environmental or agronomic factors [46,49].
Nevertheless, the present results represent variability among individual onion leaf samples. Because the spectral dataset did not include verified codes linking each sample to its corresponding salicylic acid treatment, the observed spectral differences could not be attributed statistically to specific SA concentrations. Reliable treatment-level interpretation will require several independent biological replicates for each SA treatment, explicit sample coding, and calibration of spectral indices against measured chlorophyll, carotenoid, anthocyanin, water-status, and yield variables.
3.3.4. Descriptive Comparison of the Two Seasonal Spectral Datasets
Descriptive comparison of the two seasonal spectral datasets revealed differences in the mean values of several vegetation indices. Mean NDVI decreased slightly from 0.5558 in the 2023/2024 dataset to 0.5315 in the 2024/2025 dataset, whereas mean GNDVI remained relatively stable, changing from 0.4930 to 0.4965. Mean NDRE increased from 0.2029 to 0.2177, while mean CIred-edge increased from 0.9150 to 0.9779. A more pronounced increase was observed for MTCI, which changed from 2.5436 to 3.0275, and for REIP, which shifted from 719.15 to 720.30 nm. These descriptive changes indicate greater differentiation in red-edge-related spectral characteristics within the 2024/2025 dataset. Red-edge indices are particularly sensitive to changes in pigment-related absorption and the position and slope of the red-edge transition, although their interpretation requires consideration of leaf structure, measurement conditions, and crop-specific characteristics [17,18,49].
In contrast, mean MCARI decreased from 0.0707 to 0.0607, mean TCARI decreased from 0.1300 to 0.1134, and mean OSAVI decreased from 0.4962 to 0.4750. Mean PSRI increased from 0.0629 to 0.0797, while mean PRI became slightly more negative, changing from −0.0255 to −0.0315. Mean SIPI also increased from 1.1381 to 1.1825. Collectively, these descriptive differences indicate that the two seasonal sample sets differed in their vigor-, pigment-, and stress-related spectral characteristics. However, variations in these indices may reflect several interacting factors, including leaf age, pigment composition, internal leaf structure, water status, illumination, and measurement geometry, and should not be considered direct measurements of individual physiological variables without biochemical calibration [19,51,52].
Mean ARI1 increased from 1.1705 in the 2023/2024 dataset to 1.4416 in the 2024/2025 dataset, whereas mean CRI1 decreased slightly from 3.0156 to 2.8582. These indices are related to reflectance changes within anthocyanin- and carotenoid-sensitive wavelength regions. Nevertheless, the observed differences should be interpreted as relative pigment-related spectral variation rather than as direct evidence of changes in anthocyanin or carotenoid concentrations because corresponding laboratory pigment measurements were not available. Calibration against measured pigment concentrations would be required before using these indices for quantitative biochemical interpretation.
Overall, the comparison demonstrated that the two seasonal datasets differed in the magnitude and distribution of several vegetation indices. The 2024/2025 dataset showed higher mean NDRE, CIred-edge, MTCI, and REIP values but lower mean NDVI, MCARI, TCARI, and OSAVI values than the 2023/2024 dataset. This contrasting behavior confirms that different vegetation indices respond to different regions of the reflectance spectrum and should therefore be interpreted collectively rather than individually. Integrating several vegetation indices with the full spectral signature can provide a more comprehensive characterization of vegetation optical variability than reliance on a single index [53].
The agronomic improvements observed following foliar SA application may be associated with its reported roles in regulating photosynthetic activity, maintaining photosynthetic pigments, enhancing antioxidant defense, and modulating stress-related signaling pathways. Previous studies on onion have demonstrated improvements in vegetative growth, chlorophyll status, bulb characteristics, and yield following SA application, while research on Allium hirtifolium has further highlighted its potential contribution to growth and water-use efficiency under water-limited conditions [12,41]. From an optical perspective, variation in chlorophyll-related absorption may influence visible and red-edge reflectance, whereas differences in internal leaf structure may contribute to near-infrared variability. Accordingly, indices such as GNDVI, NDRE, CIred-edge, MTCI, and REIP provide complementary information on pigment-sensitive and red-edge spectral characteristics, while PRI and PSRI may indicate variation associated with photochemical regulation and pigment-related senescence. These spectral interpretations are consistent with the established use of hyperspectral reflectance for characterizing crop physiological variability. However, because verified SA treatment identifiers were unavailable for the individual spectral samples, the observed reflectance and vegetation-index variability cannot be directly attributed to specific SA concentrations. The spectral findings should therefore be interpreted as exploratory evidence of leaf-level optical variability rather than as a treatment-specific physiological response.
However, the samples included in the two seasonal datasets represented independent sample sets rather than repeated measurements of the same biological units. Therefore, differences between the 2023/2024 and 2024/2025 datasets should be interpreted descriptively and should not be considered within-plant temporal changes. Furthermore, because verified treatment codes and sufficient independent spectral replicates were unavailable, the observed seasonal differences could not be statistically attributed to specific salicylic acid concentrations. A formal comparison would require identical sampling procedures, explicit treatment coding, sufficient biological replication for each SA concentration, and preferably repeated measurements of identified plants.
4. Limitations of the Study
The hyperspectral component of this study has an important limitation. The available spectral files did not contain verified codes linking individual leaf samples to their corresponding salicylic acid treatments. Consequently, spectral reflectance and vegetation indices could only be interpreted descriptively at the individual-sample level and could not be statistically attributed to specific SA concentrations. In addition, the study was conducted using a single onion cultivar at one experimental location, which may limit the broader generalization of the findings. Future studies should include treatment-linked spectral sampling across multiple cultivars and locations to validate the observed hyperspectral responses.
A limitation of the present study is that soil mineral N, available P, and exchangeable K were not quantified before or during the experiment. Although fertilization was applied uniformly to all experimental plots, direct measurements of soil nutrient status would have strengthened the interpretation of treatment responses across the two growing seasons, particularly given the sandy soil conditions and the interseasonal variation in precipitation.
5. Conclusions
Foliar application of salicylic acid (SA) improved onion growth, bulb characteristics, and marketable yield during both growing seasons. The highest numerical values were generally obtained at 400 mg L−1, although 300 mg L−1 produced near-maximum responses for several traits and may represent a practical agronomic rate under the experimental conditions. Nevertheless, determining the economically optimal concentration requires further dose–response and cost–benefit analyses. The increase in total bulb production was accompanied by an increase in non-marketable yield at higher SA concentrations, indicating that greater total yield did not necessarily translate into a proportional improvement in marketable production. Furthermore, the number of leaves per plant was not significantly affected by SA application.
Leaf hyperspectral measurements characterized the typical visible, red-edge, and near-infrared reflectance patterns of onion leaves and revealed considerable optical variability among individual samples. The calculated vegetation indices provided complementary information on vegetation vigor, pigment-sensitive absorption, red-edge characteristics, and stress- or senescence-related spectral behavior. These findings highlight the potential of hyperspectral sensing as a non-destructive complement to conventional agronomic assessment under arid field conditions. However, because verified treatment identifiers and sufficient independent spectral replicates were unavailable, the observed spectral differences could not be statistically attributed to specific SA concentrations. Future studies should integrate treatment-linked spectral sampling, independent biological replication, repeated measurements on identified plants, and laboratory assessments of chlorophyll, water status, and antioxidant activity to establish and validate relationships between SA application, onion physiology, and hyperspectral responses.
Supplementary Materials
The following supporting information can be downloaded at: https://www.mdpi.com/article/10.3390/su182010543/s1, Table S1: Monthly climatic conditions at the experimental site during the 2023/2024 and 2024/2025 onion growing seasons.
Author Contributions
G.A.K.: conceptualization, methodology, software, validation, formal analysis, investigation, resources, data curation, writing—original draft, writing—review & editing, visualization, supervision, project administration. I.M.E.-M.: methodology, investigation, resources, formal analysis, validation, data curation, supervision, project administration, writing—review & editing. S.M.E.-S.: investigation, methodology, validation, writing—review & editing. M.S.S.: software, visualization, writing—review & editing. All authors have read and agreed to the published version of the manuscript.
Funding
This research received no external funding.
Institutional Review Board Statement
Not applicable.
Informed Consent Statement
Not applicable.
Data Availability Statement
The data are contained within the article and Supplementary Materials.
Acknowledgments
This publication has been supported by RUDN University and authors would thank the National Authority of Remote Sensing and Space Science (NARSS)—Cairo, Egypt, the National Research Center.
Conflicts of Interest
The authors declare no conflicts of interest.
References
- FAOSTAT. Crops and Livestock Products; FAOSTAT: Rome, Italy, 2022. [Google Scholar]
- El-Metwally, I.; Shalaby, S. Herbicidal efficacy of some natural products and mulching compared to herbicides for weed control in onion fields. J. Plant Prot. Res. 2019, 59, 479–486. [Google Scholar]
- Sansan, O.C.; Ezin, V.; Ayenan, M.A.T.; Chabi, I.B.; Adoukonou-Sagbadja, H.; Saïdou, A.; Ahanchede, A. Onion (Allium cepa L.) and drought: Current situation and perspectives. Scientifica 2024, 2024, 6853932. [Google Scholar] [CrossRef] [Scilit] [PubMed]
- Fathalla, F.H.; Hassan, H.M.; Abd El-Hameed, H.I.; Soltan, H.A.H.; Ezzat, A.S. Evaluation of growth and yield characters of some Egyptian onion (Allium cepa L.) cultivars and their phytochemical composition under Middle Egypt conditions. Middle East J. Agric. Res. 2025, 14, 75–90. [Google Scholar] [CrossRef] [Scilit]
- Li, A.; Sun, X.; Liu, L. Action of salicylic acid on plant growth. Front. Plant Sci. 2022, 13, 878076. [Google Scholar] [CrossRef] [Scilit] [PubMed]
- Decsi, K.; Ahmed, M.; Abdul-Hamid, D.; Tóth, Z. The role of salicylic acid in activating plant stress responses—Results of the past decade and future perspectives. Int. J. Mol. Sci. 2025, 26, 4447. [Google Scholar] [CrossRef] [Scilit] [PubMed]
- Li, N.; Han, X.; Feng, D.; Yuan, D.; Huang, L.-J. Signaling crosstalk between salicylic acid and ethylene/jasmonate in plant defense: Do we understand what they are whispering? Int. J. Mol. Sci. 2019, 20, 671. [Google Scholar] [CrossRef] [Scilit] [PubMed]
- Rivas-San Vicente, M.; Plasencia, J. Salicylic acid beyond defence: Its role in plant growth and development. J. Exp. Bot. 2011, 62, 3321–3338. [Google Scholar] [CrossRef] [Scilit] [PubMed]
- Arif, Y.; Sami, F.; Siddiqui, H.; Bajguz, A.; Hayat, S. Salicylic acid in relation to other phytohormones in plant: A study towards physiology and signal transduction under challenging environment. Environ. Exp. Bot. 2020, 175, 104040. [Google Scholar] [CrossRef] [Scilit]
- Semida, W.M.; Abd El-Mageed, T.A.; Mohamed, S.E.; El-Sawah, N.A. Combined effect of deficit irrigation and foliar-applied salicylic acid on physiological responses, yield, and water-use efficiency of onion plants in saline calcareous soil. Arch. Agron. Soil Sci. 2017, 63, 1227–1239. [Google Scholar] [CrossRef] [Scilit]
- Mugwanya, M.; Kimera, F.; Abdelnaser, A.; Sewilam, H. Coping with water stress: Ameliorative effects of combined treatments of salicylic acid and glycine betaine on the biometric traits and water-use efficiency of onion (Allium cepa) cultivated under deficit drip irrigation. Biomolecules 2023, 13, 1634. [Google Scholar] [CrossRef] [Scilit] [PubMed]
- Pathak, M.; Gupta, P.; Yadav, A.; Sharma, K. Influence of foliar spray of salicylic acid on growth, yield and quality of onion (Allium cepa L.). Int. J. Adv. Biochem. Res. 2025, 9, 84–1846. [Google Scholar] [CrossRef] [Scilit]
- Yousefvand, P.; Sohrabi, Y.; Mastinu, A.; Heidari, G.; Weisany, W. Optimizing growth, yield, and water use efficiency of Allium hirtifolium with salicylic acid under water stress condiions. Heliyon 2025, 11, e41550. [Google Scholar] [CrossRef] [Scilit] [PubMed]
- Ustin, S.L.; Roberts, D.A.; Gamon, J.A.; Asner, G.P.; Green, R.O. Using imaging spectroscopy to study ecosystem processes and properties. BioScience 2004, 54, 523–534. [Google Scholar] [CrossRef] [Scilit]
- Zarco-Tejada, P.J.; Miller, J.R.; Morales, A.; Berjón, A.; Agüera, J. Hyperspectral indices and model simulation for chlorophyll estimation in open-canopy tree crops. Remote Sens. Environ. 2004, 90, 463–476. [Google Scholar] [CrossRef] [Scilit]
- Wu, C.; Niu, Z.; Tang, Q.; Huang, W. Estimating chlorophyll content from hyperspectral vegetation indices: Modeling and validation. Agric. For. Meteorol. 2008, 148, 1230–1241. [Google Scholar] [CrossRef] [Scilit]
- Tuerxun, N.; Zheng, J.; Wang, R.; Wang, L.; Liu, L. Hyperspectral estimation of chlorophyll content in jujube leaves: Integration of derivative processing techniques and dimensionality reduction algorithms. Front. Plant Sci. 2023, 14, 1260772. [Google Scholar] [CrossRef] [Scilit] [PubMed]
- Brown, L.A.; Morris, H.; MacLachlan, A.; D’Adamo, F.; Adams, J.; Lopez-Baeza, E.; Albero, E.; Martínez, B.; Sánchez-Ruiz, S.; Campos-Taberner, M.; et al. Hyperspectral leaf area index and chlorophyll retrieval over forest and row-structured vineyard canopies. Remote Sens. 2024, 16, 2066. [Google Scholar] [CrossRef] [Scilit]
- Qian, X.; Yan, J.; Liu, L. Assessment of vegetation indices for estimating leaf chlorophyll content in sparse canopies. Ecol. Inform. 2025, 92, 103506. [Google Scholar] [CrossRef] [Scilit]
- Khdery, G.A.; El-Metwally, I.; Shokr, M.S.; Meroño de Larriva, J.E.; Aldosari, A.A. Analysis of spectral signatures and vegetation indices to assess the response of faba bean plants to varying zinc levels under sandy soil conditions. Front. Environ. Sci. 2025, 13, 1706260. [Google Scholar] [CrossRef] [Scilit]
- Marino, S.; Alvino, A. Hyperspectral vegetation indices for predicting onion (Allium cepa L.) yield spatial variability. Comput. Electron. Agric. 2015, 116, 109–117. [Google Scholar] [CrossRef] [Scilit]
- Kang, Y.S.; Jang, S.H.; Park, J.W.; Song, H.Y.; Ryu, C.S.; Jun, S.R.; Kim, S.H. Yield prediction and validation of onion (Allium cepa L.) using key variables in narrowband hyperspectral imagery and effective accumulated temperature. Comput. Electron. Agric. 2020, 178, 105667. [Google Scholar] [CrossRef] [Scilit]
- Mishra, P.; Lohumi, S.; Khan, H.A.; Nordon, A. Close-range hyperspectral imaging of whole plants for digital phenotyping: Recent applications and illumination correction approaches. Comput. Electron. Agric. 2020, 178, 105780. [Google Scholar] [CrossRef] [Scilit]
- Ram, B.G.; Oduor, P.; Igathinathane, C.; Howatt, K.; Sun, X. A systematic review of hyperspectral imaging in precision agriculture: Analysis of its current state and future prospects. Comput. Electron. Agric. 2024, 222, 109037. [Google Scholar] [CrossRef] [Scilit]
- Soil Survey Staff. Keys to Soil Taxonomy; USDA Natural Resources Conservation Service (NRCS): Washington, DC, USA, 2022. [Google Scholar]
- Rouse, J.W., Jr.; Haas, R.H.; Schell, J.A.; Deering, D.W. Monitoring Vegetation Systems in the Great Plains with ERTS. In Proceedings of the 3rd ERTS-1 Symposium; PAPER-A20; NASA Goddard Space Flight Center: Greenbelt, MD, USA, 1974. [Google Scholar]
- Gitelson, A.A.; Kaufman, Y.J.; Merzlyak, M.N. Use of a green channel in remote sensing of global vegetation from EOS-MODIS. Remote Sens. Environ. 1996, 58, 289–298. [Google Scholar] [CrossRef] [Scilit]
- Barnes, E.; Clarke, T.; Richards, S.; Colaizzi, P.; Haberland, J.; Kostrzewski, M.; Waller, P.; Choi, C.; Riley, E.; Thompson, T. Coincident detection of crop water stress, nitrogen status and canopy density using ground based multispectral data. In Proceedings of the Fifth International Conference on Precision Agriculture, Bloomington, MN, USA, 16–19 July 2000. [Google Scholar]
- Gitelson, A.A.; Viña, A.; Arkebauer, T.J.; Rundquist, D.C.; Keydan, G.; Leavitt, B. Remote estimation of leaf area index and green leaf biomass in maize canopies. Geophys. Res. Lett. 2003, 30, 1248. [Google Scholar] [CrossRef] [Scilit]
- Dash, J.; Curran, P.J. The MERIS terrestrial chlorophyll index. Int. J. Remote Sens. 2004, 25, 5403–5413. [Google Scholar] [CrossRef] [Scilit]
- Daughtry, C.S.; Walthall, C.L.; Kim, M.; De Colstoun, E.B.; McMurtrey, J., III. Estimating corn leaf chlorophyll concentration from leaf and canopy reflectance. Remote Sens. Environ. 2000, 74, 229–239. [Google Scholar] [CrossRef] [Scilit]
- Haboudane, D.; Miller, J.R.; Tremblay, N.; Zarco-Tejada, P.J.; Dextraze, L. Integrated narrow-band vegetation indices for prediction of crop chlorophyll content for application to precision agriculture. Remote Sens. Environ. 2002, 81, 416–426. [Google Scholar] [CrossRef] [Scilit]
- Rondeaux, G.; Steven, M.; Baret, F. Optimization of soil-adjusted vegetation indices. Remote Sens. Environ. 1996, 55, 95–107. [Google Scholar] [CrossRef] [Scilit]
- Guyot, G.; Baret, F. Utilisation de la haute resolution spectrale pour suivre l’etat des couverts vegetaux. In Proceedings of the Spectral Signatures of Objects in Remote Sensing, Aussois, France, 18–22 January 1988; p. 279. [Google Scholar]
- Merzlyak, M.N.; Gitelson, A.A.; Chivkunova, O.B.; Rakitin, V.Y. Non-destructive optical detection of pigment changes during leaf senescence and fruit ripening. Physiol. Plant. 1999, 106, 135–141. [Google Scholar] [CrossRef] [Scilit]
- Gamon, J.A.; Penuelas, J.; Field, C. A narrow-waveband spectral index that tracks diurnal changes in photosynthetic efficiency. Remote Sens. Environ. 1992, 41, 35–44. [Google Scholar] [CrossRef] [Scilit]
- Gitelson, A.A.; Merzlyak, M.N.; Chivkunova, O.B. Optical properties and nondestructive estimation of anthocyanin content in plant leaves. Photochem. Photobiol. 2001, 74, 38–45. [Google Scholar] [CrossRef] [Scilit] [PubMed]
- Penuelas, J.; Baret, F.; Filella, I. Semi-empirical indices to assess carotenoids/chlorophyll a ratio from leaf spectral reflectance. Photosynthetica 1995, 31, 221–230. [Google Scholar]
- Gitelson, A.A.; Zur, Y.; Chivkunova, O.B.; Merzlyak, M.N. Assessing carotenoid content in plant leaves with reflectance spectroscopy. Photochem. Photobiol. 2002, 75, 272–281. [Google Scholar] [CrossRef] [Scilit] [PubMed]
- Elsisi, M.; Elshiekh, M.; Sabry, N.; Aziz, M.; Attia, K.; Islam, F.; Chen, J.; Abdelrahman, M. The genetic orchestra of salicylic acid in plant resilience to climate change induced abiotic stress: Critical review. Stress Biol. 2024, 4, 31. [Google Scholar] [CrossRef] [Scilit] [PubMed]
- Pradhan, R. Effect of salicylic acid on growth and bulb yield of onion (Allium cepa L.). Int. J. Bio-Resour. Stress Manag. 2016, 7, 960–963. [Google Scholar] [CrossRef] [Scilit][Green Version]
- Nangare, S.; Gaikwad, S.; Dighe, S.; Bhalekar, M. Effect of salicylic acid on growth and yield of onion (Allium cepa L.). J. Agric. Res. Technol. 2019, 44, 93. [Google Scholar]
- Ustin, S.L.; Middleton, E.M. Current and near-term advances in Earth observation for ecological applications. Ecol. Process. 2021, 10, 1. [Google Scholar] [CrossRef] [Scilit] [PubMed]
- Gamon, J.; Somers, B.; Malenovský, Z.; Middleton, E.; Rascher, U.; Schaepman, M.E. Assessing vegetation function with imaging spectroscopy. Surv. Geophys. 2019, 40, 489–513. [Google Scholar] [CrossRef] [Scilit]
- Hassan, H.A.; Abdeldaym, E.A.; Aboelghar, M.; Morsy, N.; Kucher, D.E.; Rebouh, N.Y.; Ali, A.M. Multi-sensor remote sensing to estimate biophysical variables of green-onion crop (Allium cepa L.) under different sources of magnesium in Ismailia, Egypt. Sustainability 2023, 15, 16048. [Google Scholar] [CrossRef] [Scilit]
- Khdery, G.; Yones, M. Innovative spectral library for identification common wild plants using hyperspectral technology in Northwestern Coast, Egypt. Egypt. J. Remote Sens. Space Sci. 2021, 24, 485–491. [Google Scholar] [CrossRef] [Scilit]
- Xing, N.; Huang, W.; Ye, H.; Ren, Y.; Xie, Q. Joint retrieval of winter wheat leaf area index and canopy chlorophyll density using hyperspectral vegetation indices. Remote Sens. 2021, 13, 3175. [Google Scholar] [CrossRef] [Scilit]
- Yones, M.; Khdery, G.A.; Aboelghar, M.; Kadah, T.; Ma’moun, S.A. Early detection of the Mediterranean Fruit Fly, Ceratitis capitata (Wied.) in oranges using different aspects of remote sensing applications. Egypt. J. Remote Sens. Space Sci. 2023, 26, 798–806. [Google Scholar] [CrossRef] [Scilit]
- Thorp, K.R.; Thompson, A.L.; Herritt, M.T. Phenotyping cotton leaf chlorophyll via in situ hyperspectral reflectance sensing, spectral vegetation indices, and machine learning. Front. Plant Sci. 2024, 15, 1495593. [Google Scholar] [CrossRef] [Scilit] [PubMed]
- Hikosaka, K. Photosynthesis, chlorophyll fluorescence and photochemical reflectance index in photoinhibited leaves. Funct. Plant Biol. 2021, 48, 815–826. [Google Scholar] [CrossRef] [Scilit] [PubMed]
- Guo, A.; Huang, W.; Wang, K.; Qian, B.; Cheng, X. Early monitoring of maize northern leaf blight using vegetation indices and plant traits from multiangle hyperspectral data. Agriculture 2024, 14, 1311. [Google Scholar] [CrossRef] [Scilit]
- Sonobe, R.; Hirono, Y. Carotenoid content estimation in tea leaves using noisy reflectance data. Remote Sens. 2023, 15, 4303. [Google Scholar] [CrossRef] [Scilit]
- Nițu, A.; Florea, C.; Ivanovici, M.; Racoviteanu, A. NDVI and beyond: Vegetation indices as features for crop recognition and segmentation in hyperspectral data. Sensors 2025, 25, 3817. [Google Scholar] [CrossRef] [Scilit] [PubMed]
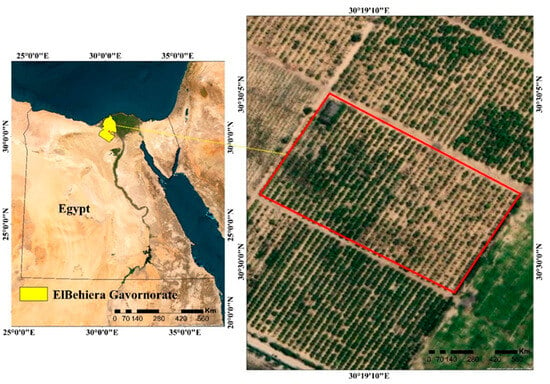
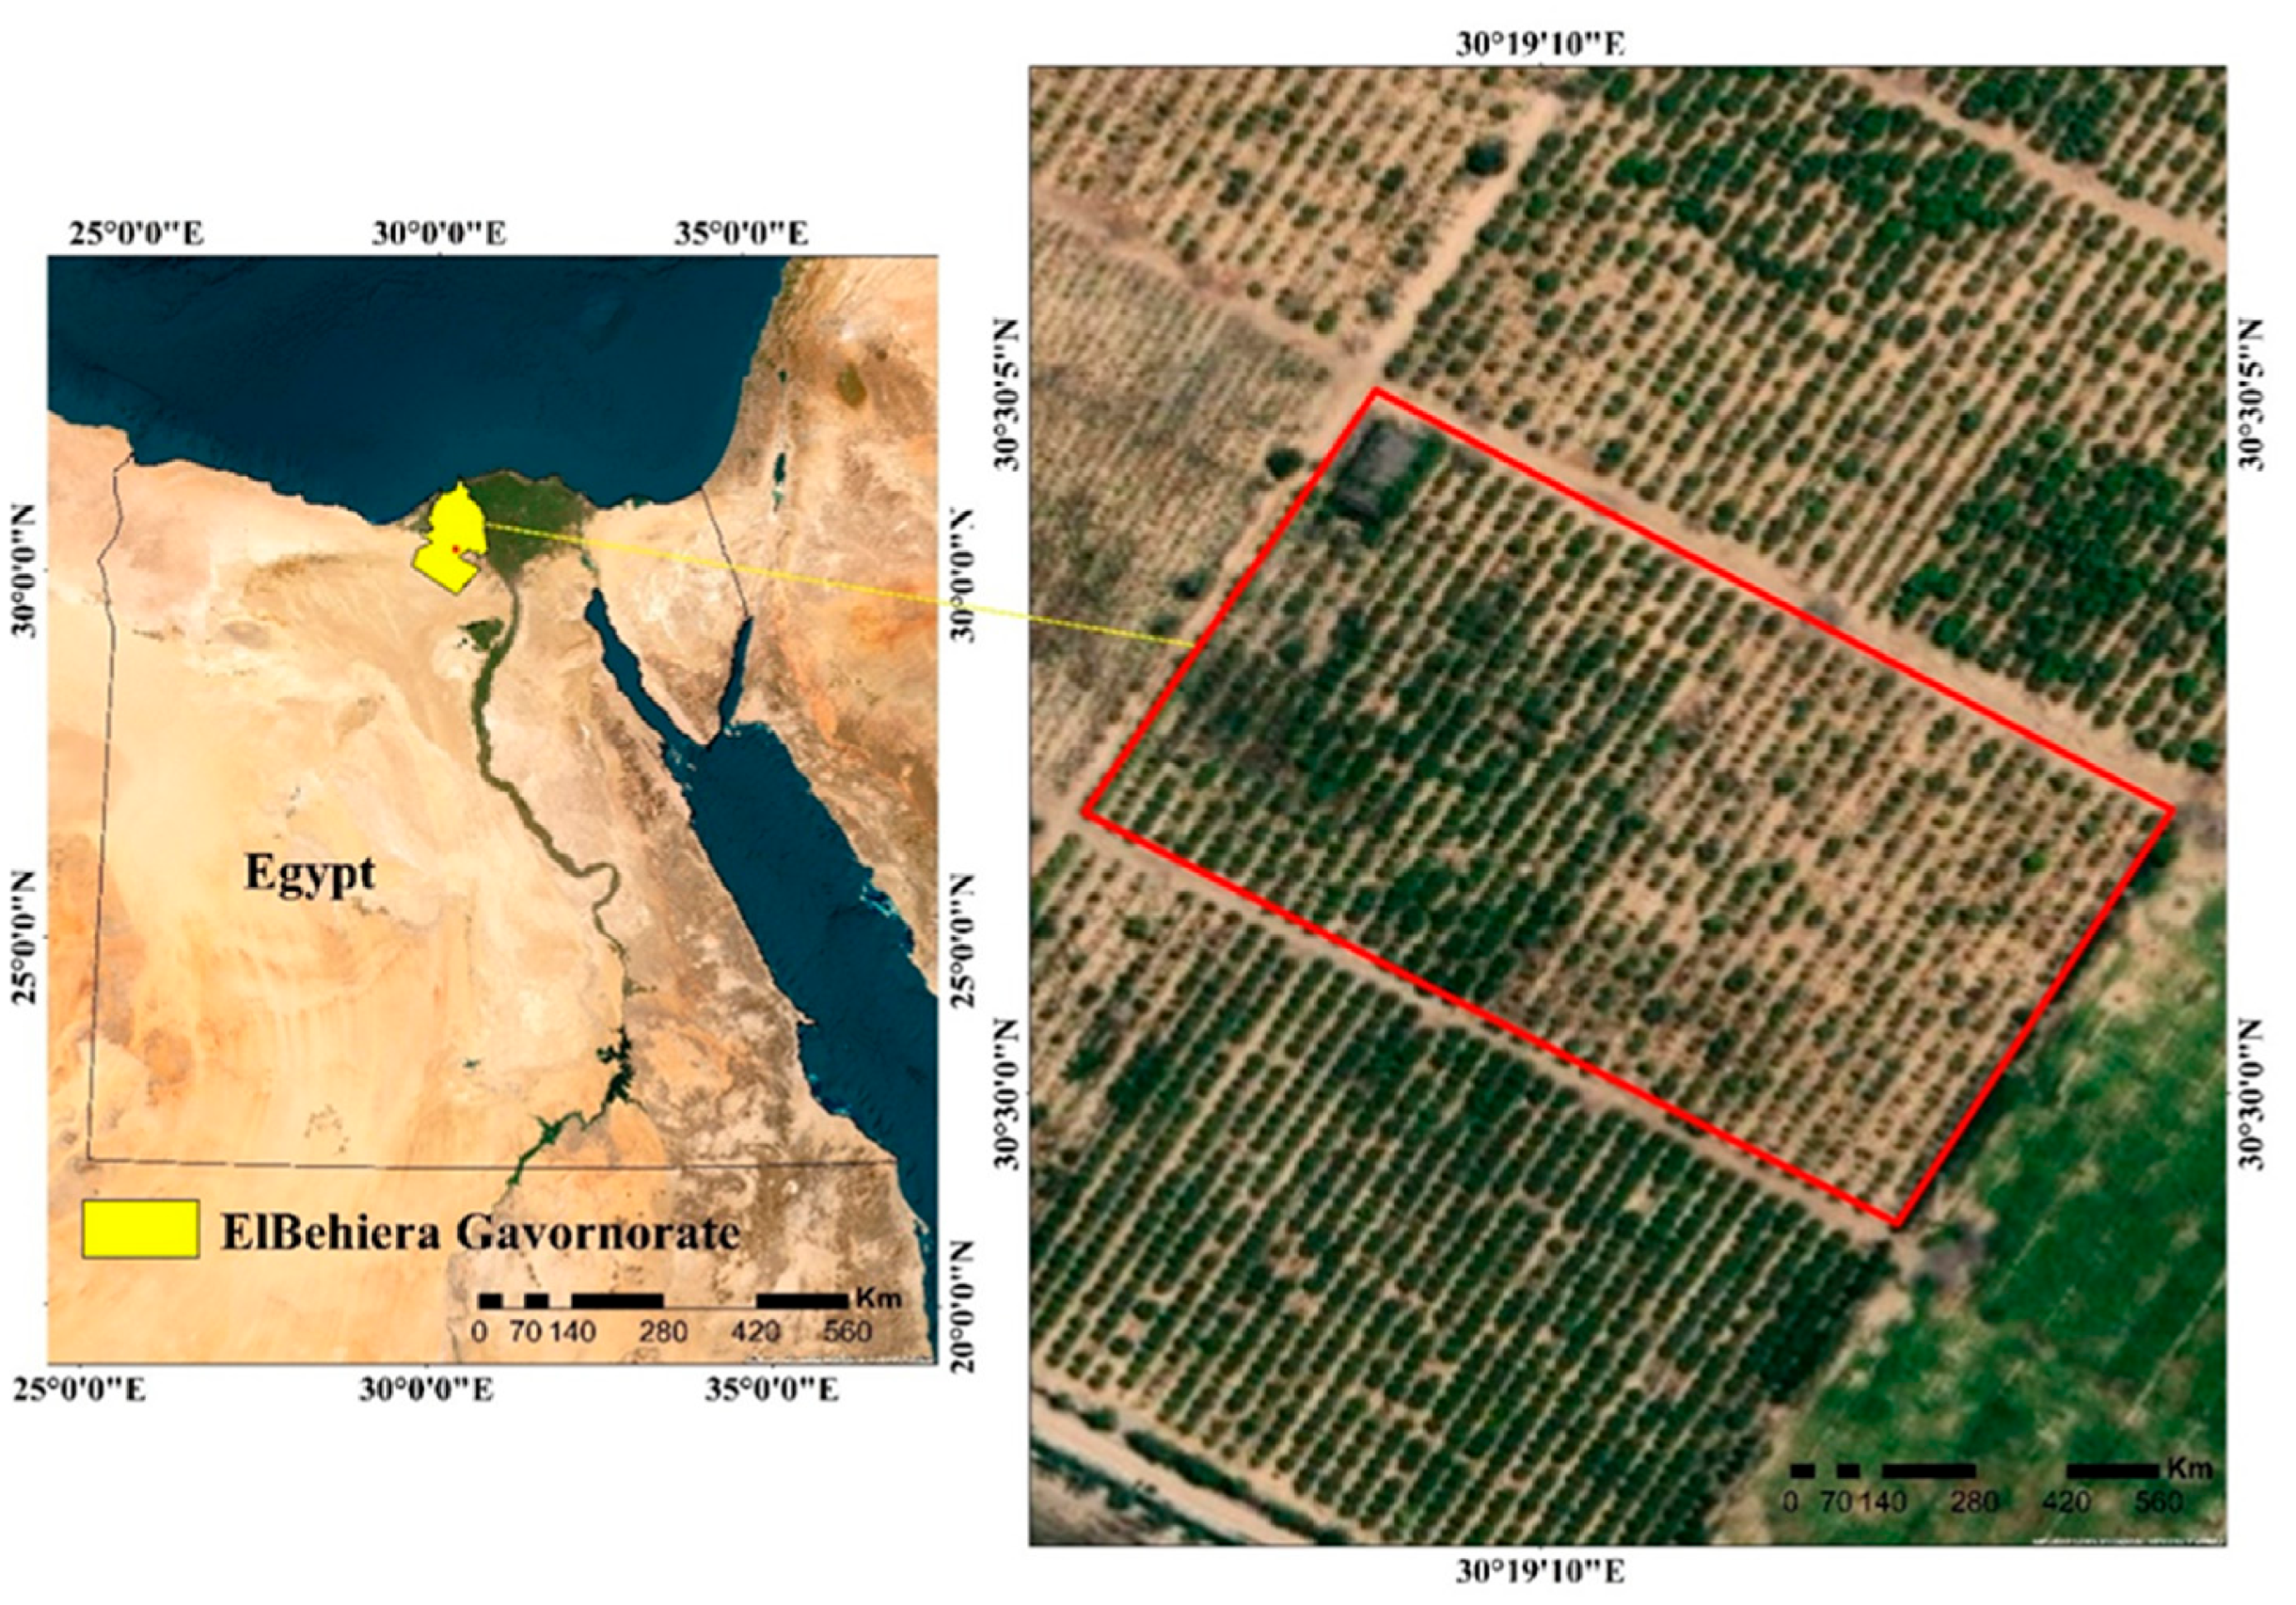
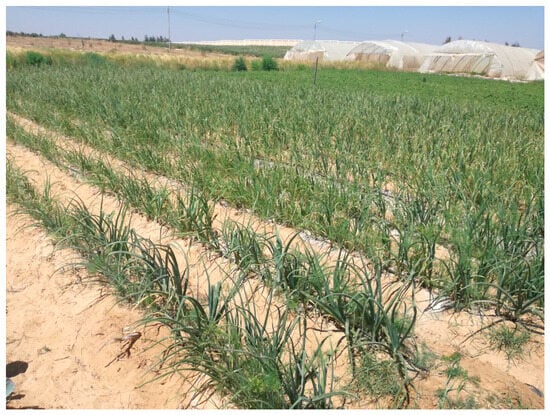
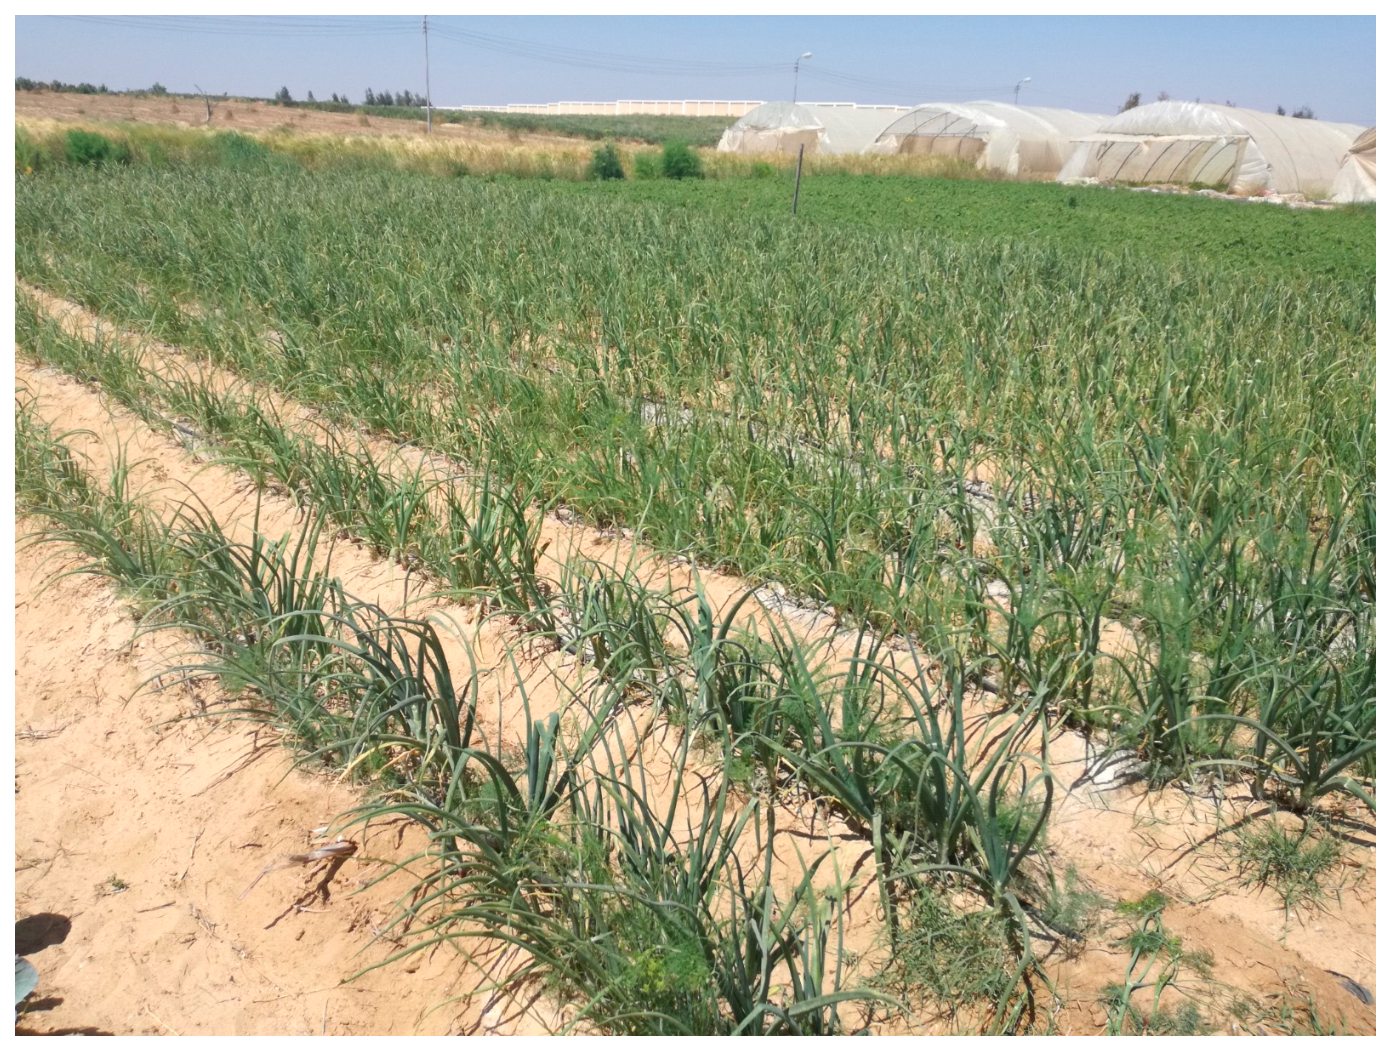
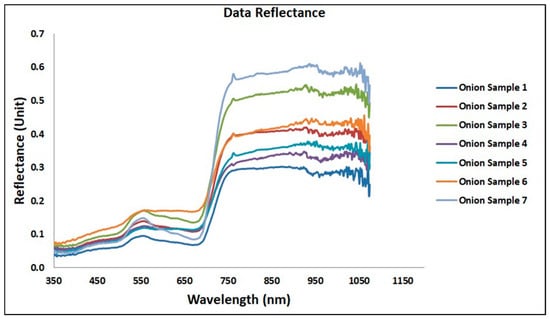
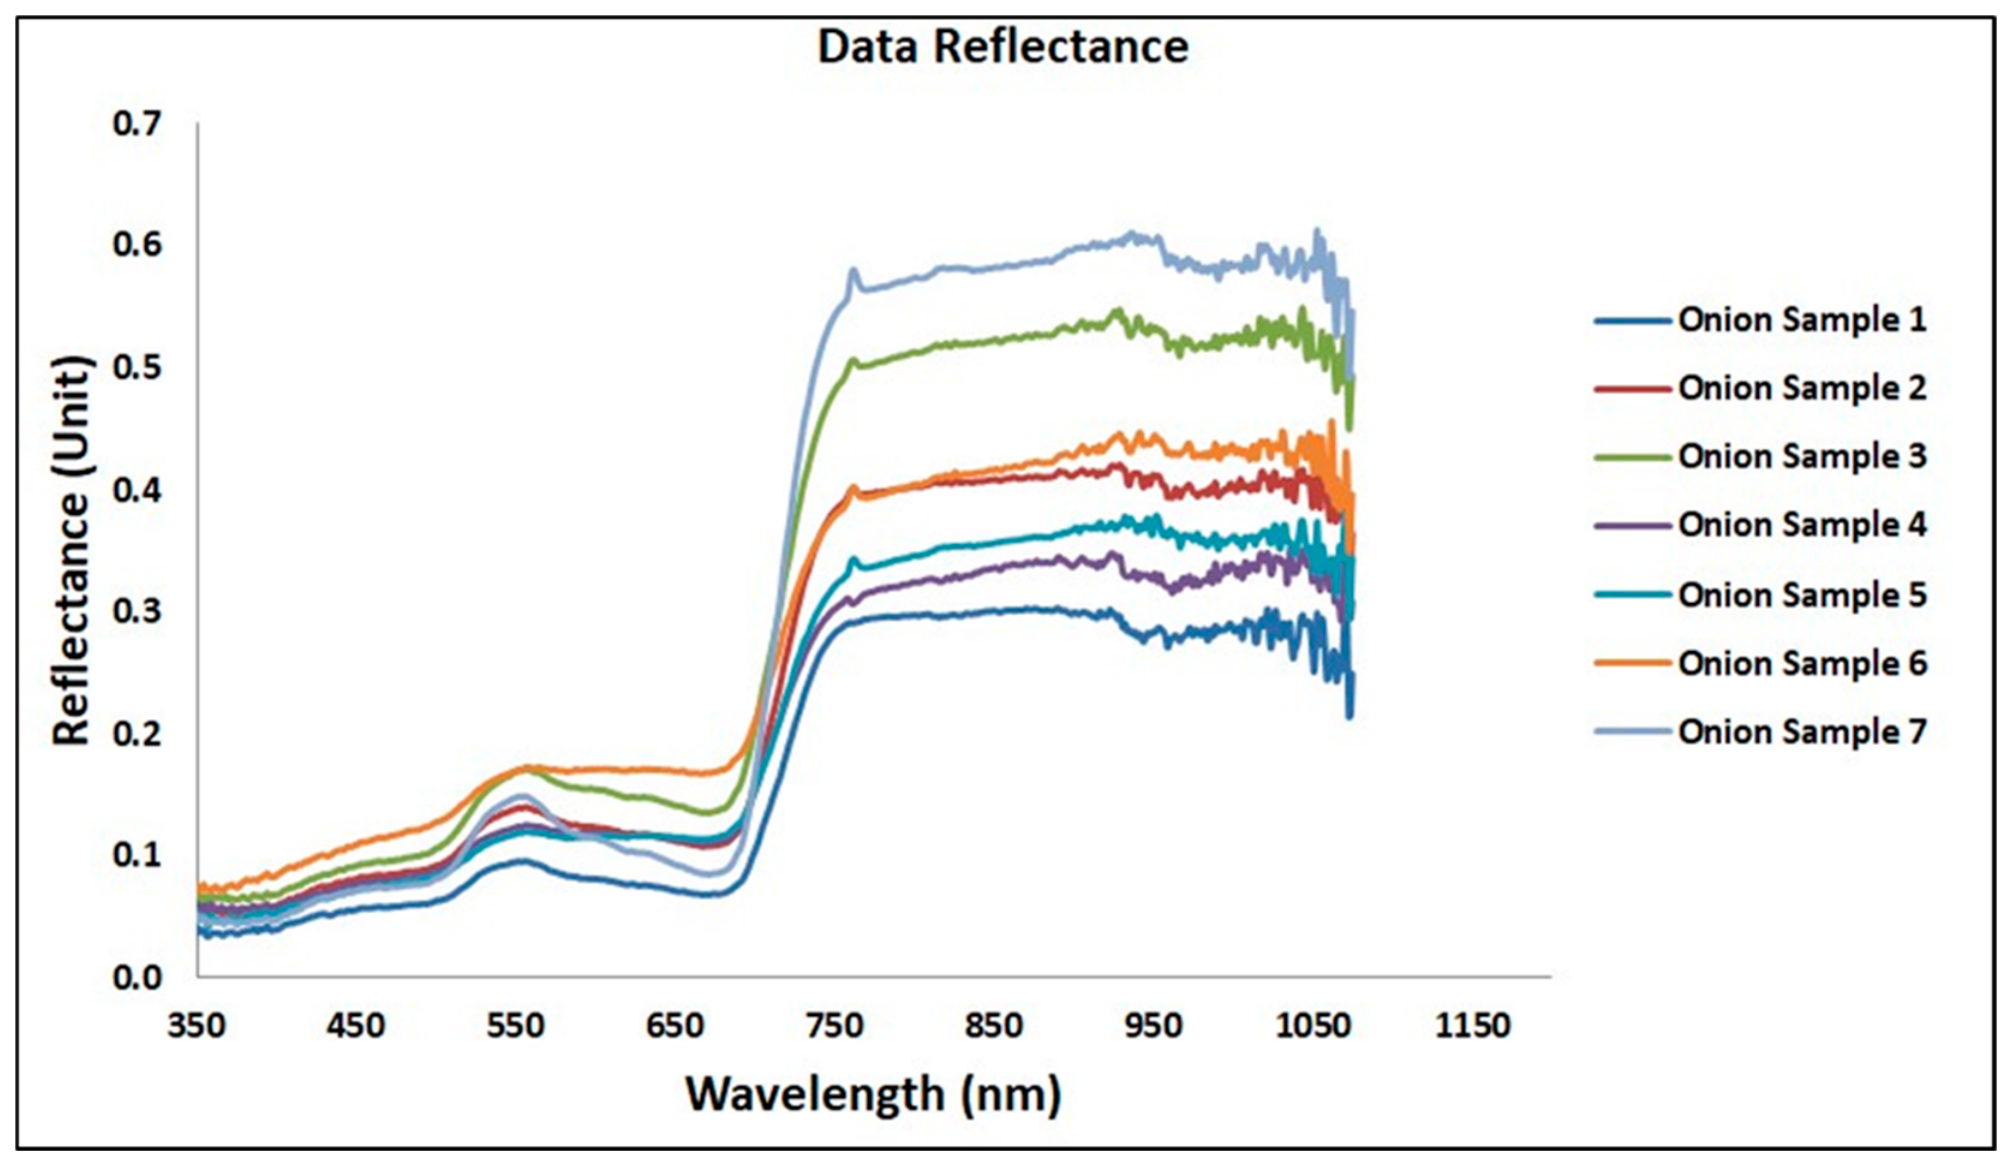
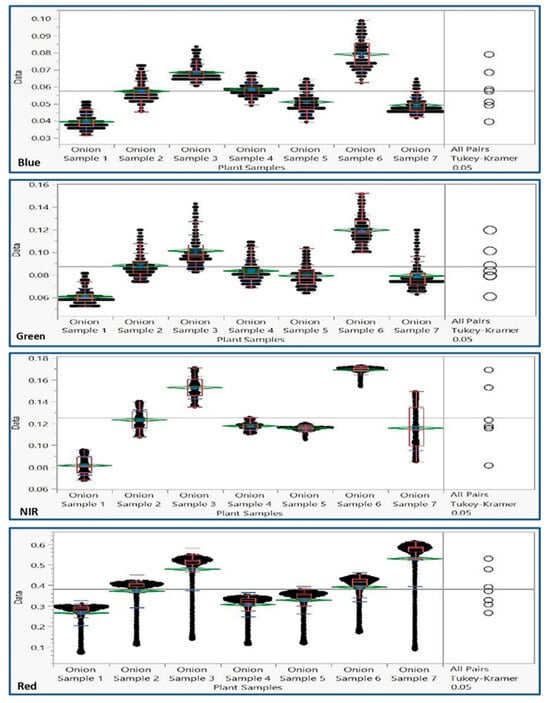
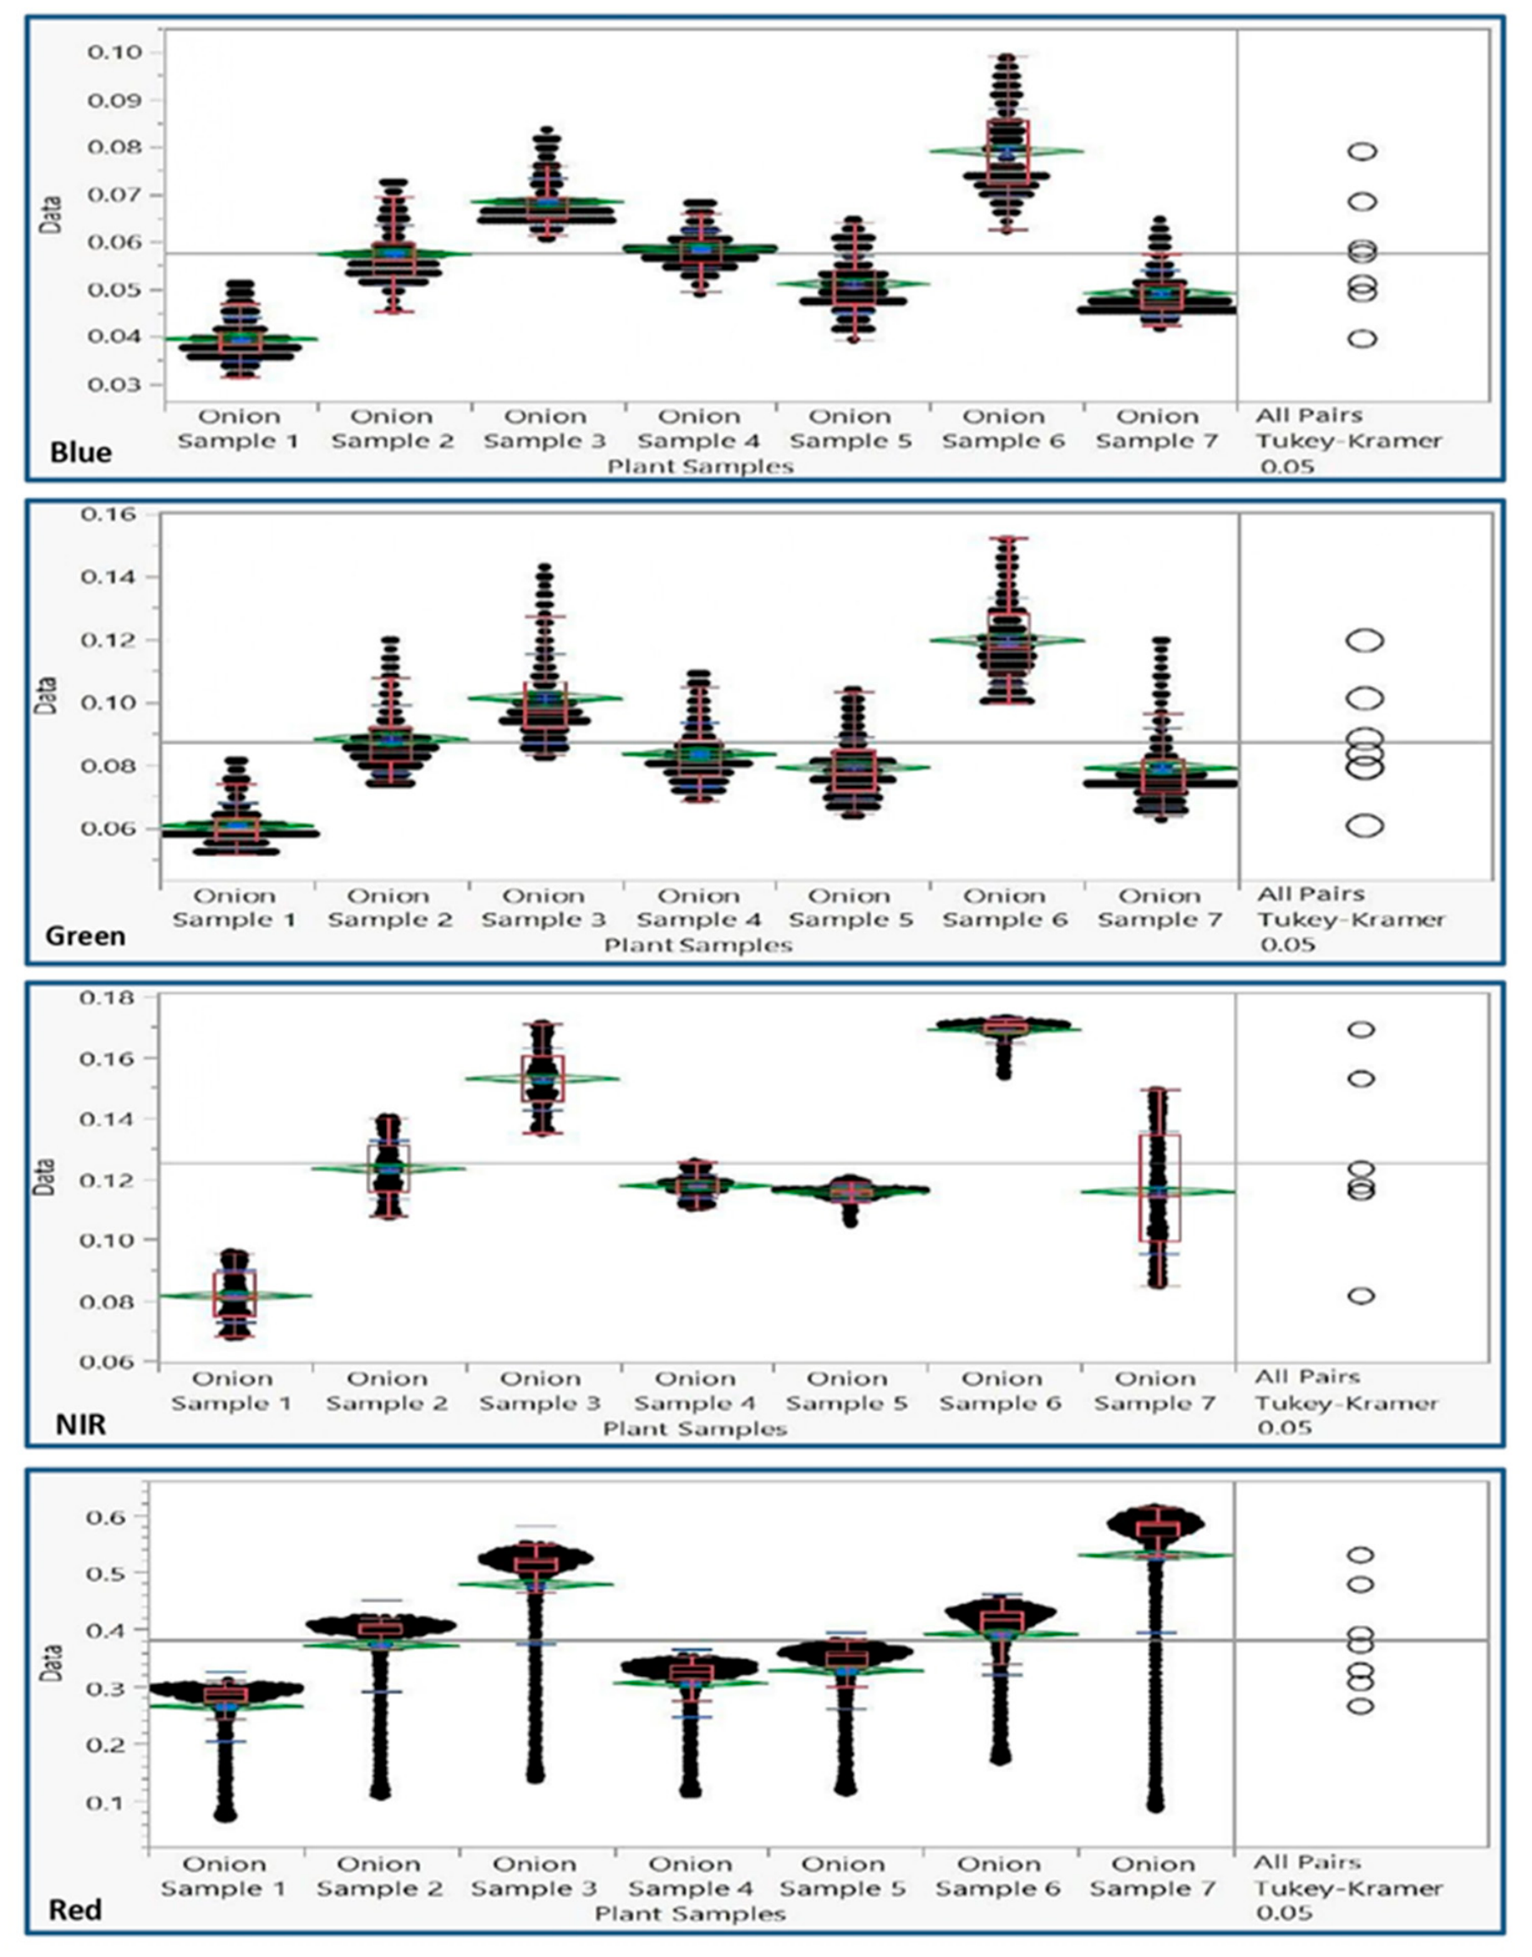
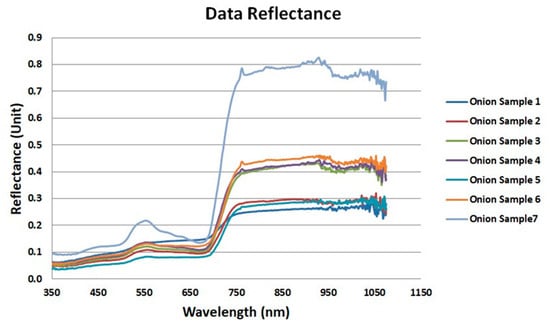
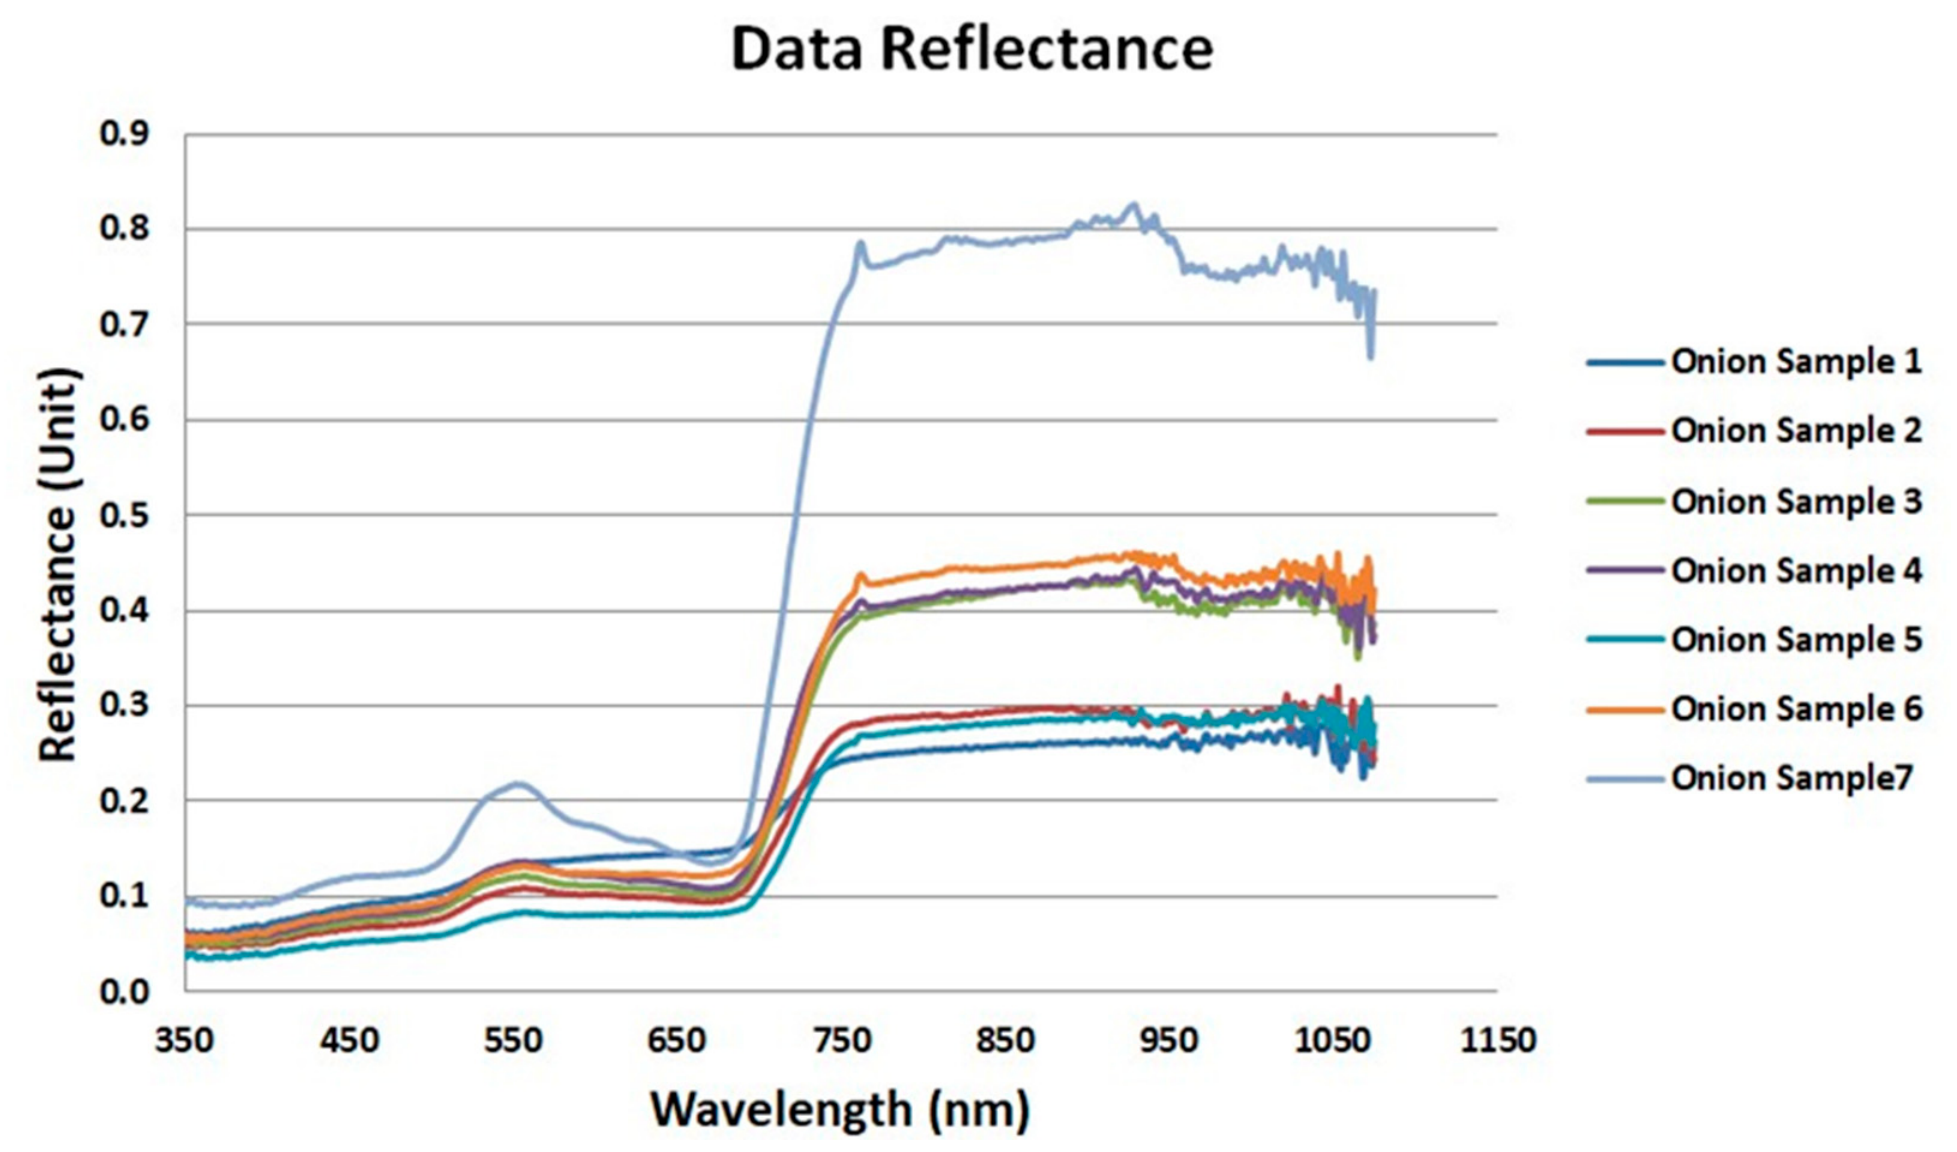
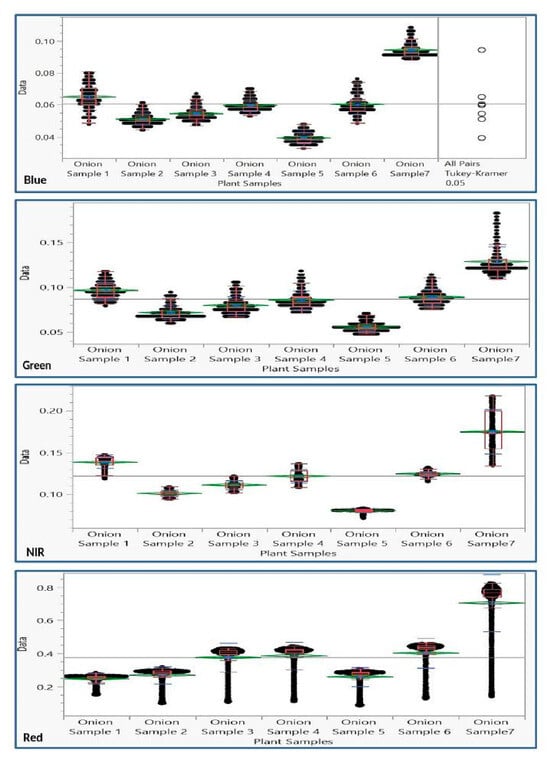
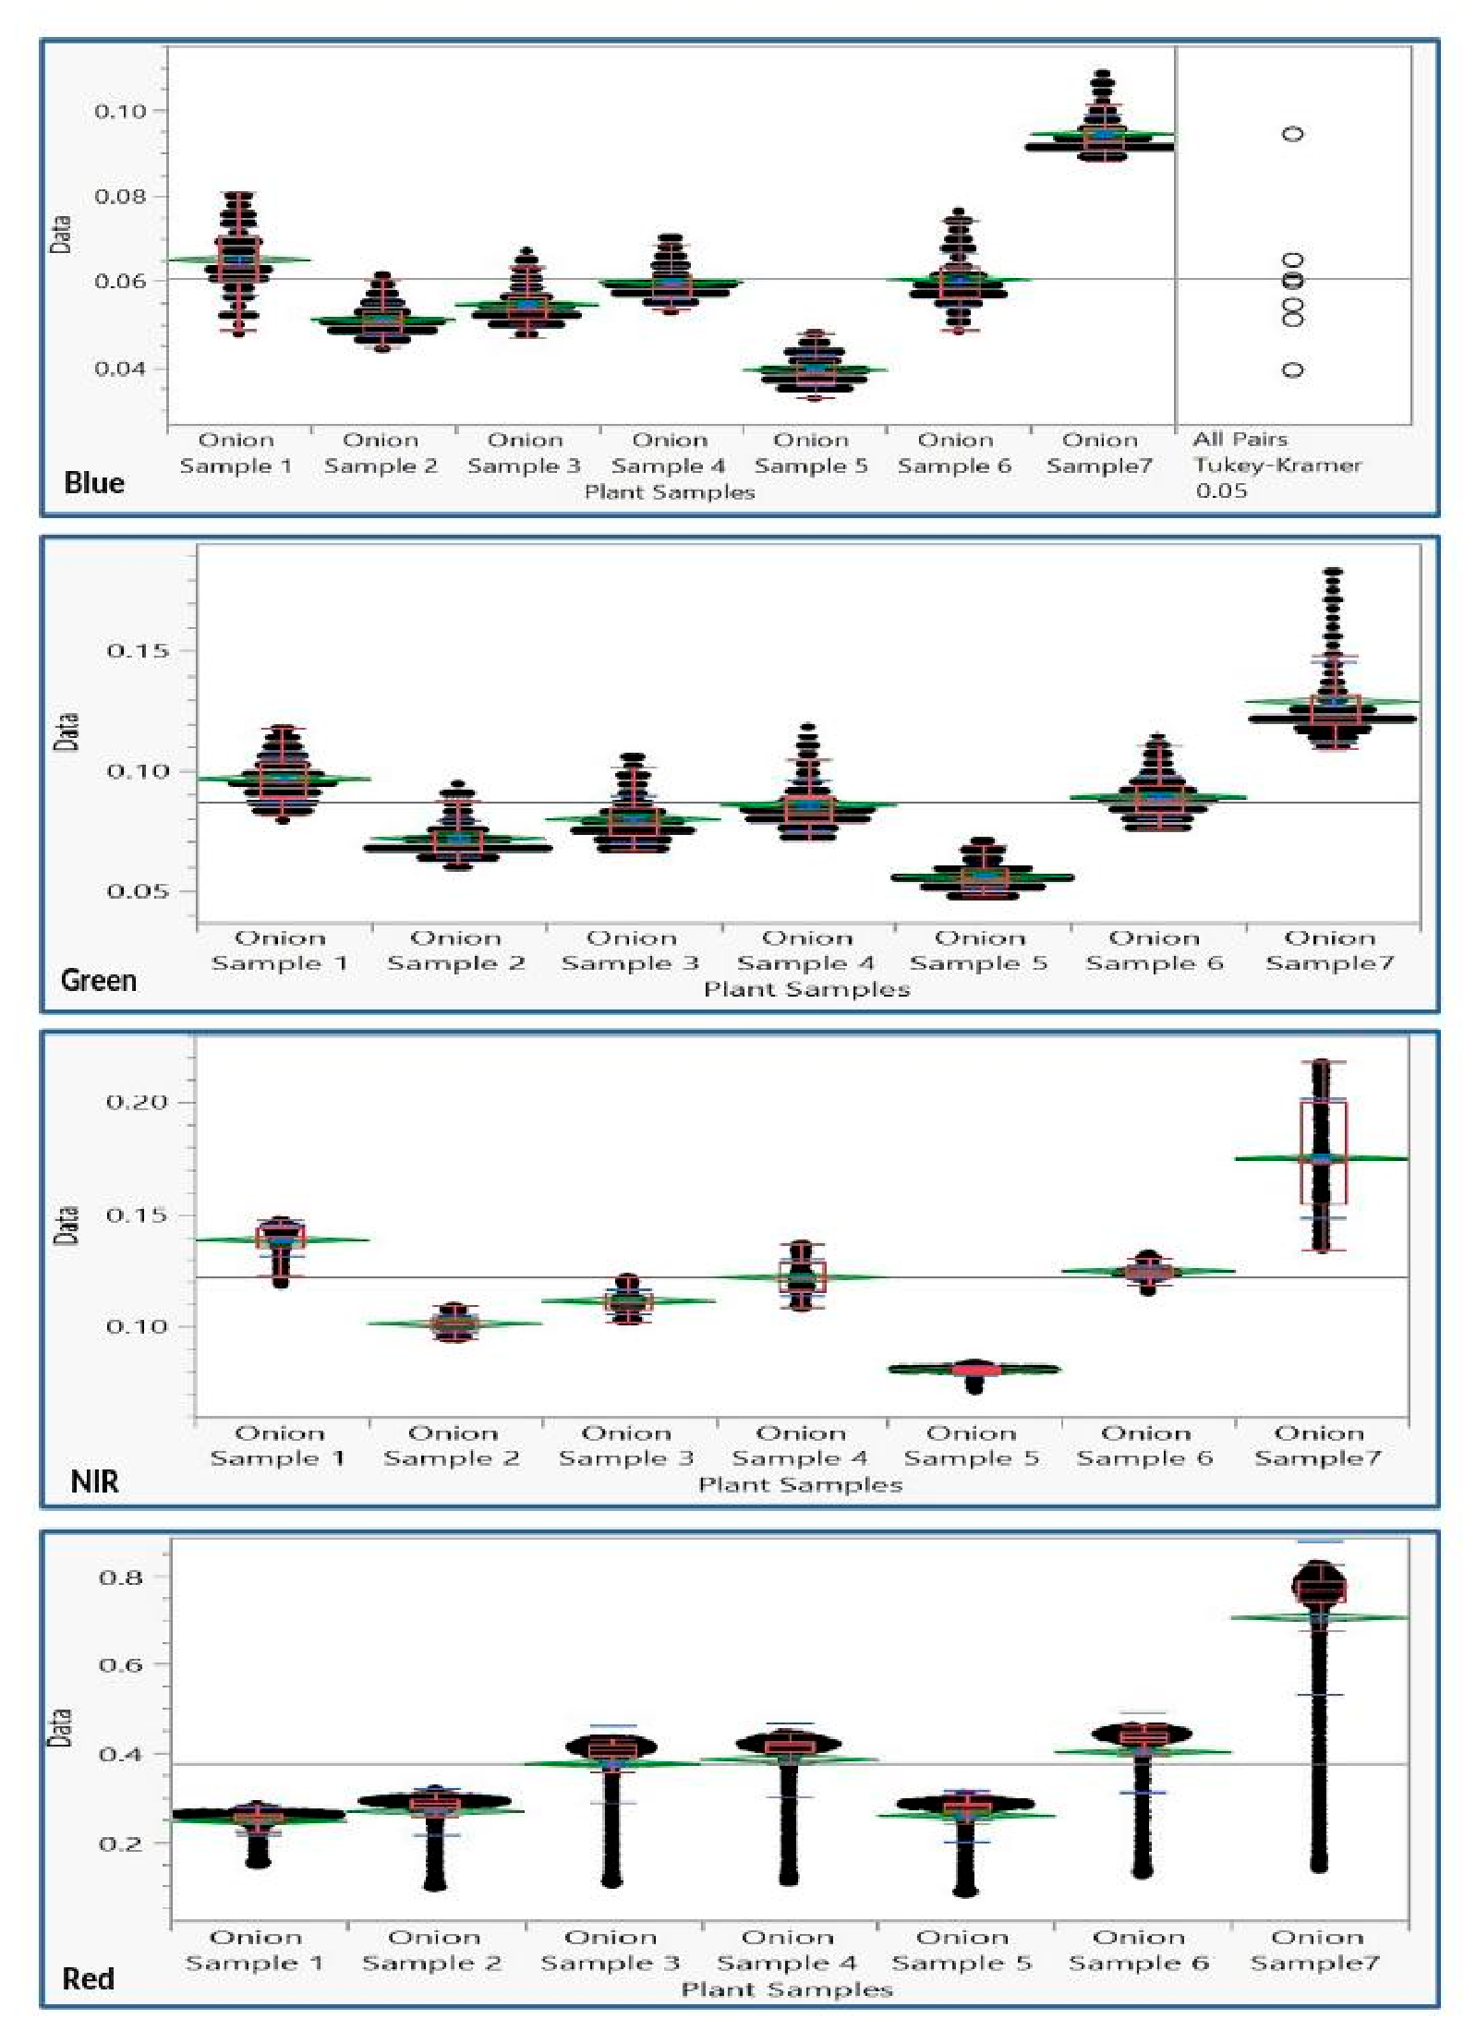

Disclaimer/Publisher’s Note: The statements, opinions and data contained in all publications are solely those of the individual author(s) and contributor(s) and not of MDPI and/or the editor(s). MDPI and/or the editor(s) disclaim responsibility for any injury to people or property resulting from any ideas, methods, instructions or products referred to in the content. |
© 2026 by the authors. Licensee MDPI, Basel, Switzerland. This article is an open access article distributed under the terms and conditions of the Creative Commons Attribution (CC BY) license.