


Abstract
The increasing penetration of distributed energy resources (DERs) in low-voltage networks is central to the clean energy transition but introduces coupled challenges in voltage regulation, harmonic distortion, and distribution-transformer operation that impact grid sustainability and asset longevity. This paper isolates feeder impedance as a controlled variable and evaluates whether remote-network power-quality severity and transformer consequence follow the same sensitivity trend. A time-domain model used a factory-matched 200 kVA, 11 kV/420 V Dyn11 transformer with 40% DER connected at remote Node S3. The DER current contained prescribed fifth, seventh, eleventh, and thirteenth harmonics, while the LV feeder resistance and inductance were co-scaled from 0.5 to 2.0 pu. Across the DER-connected sweep, Node S3 line-to-line RMS voltage increased from 420.45 V to 428.95 V, and the voltage-rise magnitude increased from 3.03 V to 11.55 V. Selected-order Node S3 VTHD increased monotonically from 1.104% to 1.395%. Baseline-corrected harmonic transfer impedance also increased at every assessed harmonic, supporting a feeder-impedance-driven voltage-response mechanism. In contrast, transformer loading remained within 14.44–14.52%, total transformer loss within 350.26–350.93 W, hot-spot temperature within 38.229–38.246 °C, and common-baseline relative aging within 0.2863–0.2871. The results demonstrate that feeder weakness can materially increase remote-node voltage and harmonic sensitivity without producing a corresponding increase in transformer thermal severity. Network voltage response and transformer consequence should therefore be assessed as related but non-equivalent engineering domains. By separating power quality management from transformer thermal risk, distribution utilities can avoid premature asset replacement, enabling targeted, resource-efficient investments that support sustainable grid planning and long-term renewable integration (SDG 7 and SDG 9).
1. Introduction
The increasing integration of distributed energy resources (DERs), particularly inverter-based resources such as photovoltaic (PV) generation and battery energy storage systems, is changing the operating behavior of low-voltage (LV) distribution networks. LV feeders have traditionally been designed for predominantly unidirectional power flow from the upstream distribution transformer towards downstream customer loads. With DER connected at the customer or feeder level, power flow can become bidirectional, feeder voltage profiles can change, and harmonic currents produced by power electronic converters can propagate through the feeder and distribution transformer [1,2].
Harmonic distortion is an important power quality consideration in DER-rich distribution networks. IEEE 519-2022 establishes harmonic voltage and current distortion requirements at the point of common coupling, while NRS 048-2 specifies voltage characteristics, compatibility levels, limits, and assessment methods applicable to South African electricity supply systems [3,4]. In the South African embedded-generation context, NRS 097-2-3 provides simplified utility connection criteria for LV-connected generators and identifies conditions for which further network assessment may be required [5]. These standards provide an important framework for interpreting DER-related voltage and current distortion; however, compliance-oriented distortion indices do not by themselves describe the operating consequence for a distribution transformer.
Inverter-based DER can inject characteristic and non-characteristic harmonic currents whose magnitudes and spectral composition depend on the converter topology, control strategy, switching behavior, operating point, and network conditions. When these harmonic currents flow through network impedance, they can contribute to harmonic voltage distortion. At the transformer, non-sinusoidal current can also increase harmonic-sensitive winding eddy-current and stray losses. IEEE C57.110 provides guidance for evaluating transformer capability under non-sinusoidal current loading, while IEEE C57.91-2011 provides the loading and thermal framework retained for the calculations in this study [6,7]. Transformer consequence therefore depends not only on percentage current distortion, but also on the absolute current magnitude, harmonic spectrum, transformer loading, and the loss structure of the transformer.
Feeder impedance is an important part of this interaction. CIGRÉ guidance on harmonic studies emphasizes the need to represent network components and impedance appropriately when assessing harmonic propagation [8]. In an LV feeder, impedance affects the fundamental voltage profile, voltage rise or drop, power transfer, and the harmonic voltage produced by injected harmonic current. Its effect on transformer-side quantities is less direct because the current flowing through the transformer also depends on the load–generation balance and resulting network operating point. Consequently, an electrically weaker feeder may exhibit greater remote-node voltage sensitivity without necessarily producing greater transformer loading, harmonic-sensitive loss, or thermal stress.
This paper investigates this distinction through a controlled feeder-impedance sensitivity study. A fixed 40% DER penetration level is connected at the remote feeder node, Node S3, while the resistance and inductance of the LV feeder sections are scaled together to represent feeder-impedance factors of 0.5, 1.0, 1.5, and 2.0 pu. DER location, load distribution, upstream source condition, transformer rating, and the imposed fifth-, seventh-, eleventh-, and thirteenth-harmonic current spectrum are otherwise retained. Node S3 is used principally to assess the remote network voltage response, while Node S0 provides the transformer-side current, power flow, and harmonic quantities.
This study builds on the authors’ previous work examining harmonic distortion under increasing DER penetration using a CIGRÉ LV benchmark feeder adapted to a South African distribution network context [9]. The present contribution isolates feeder impedance and examines whether remote-network power-quality severity and transformer consequences follow the same sensitivity trend. The assessment distinguishes Node S3 voltage magnitude and selected-order voltage total harmonic distortion (VTHD) from Node S0 transformer loading, current total harmonic distortion (ITHD), transformer-capacity-referenced comparative total demand distortion (TDD), the additional harmonic loss factor FHL,add, total transformer loss, and thermal response. The central contribution is not the proposition that feeder impedance affects harmonic voltage; rather, it is the controlled separation of the network-voltage response from the transformer-side current, loss, and thermal consequence under a common DER operating condition.
2. Background
Studies of DER-related harmonic behavior in distribution networks have commonly examined increasing DER penetration, inverter harmonic emissions, point of connection, voltage and current distortion, and harmonic mitigation. Ahsan et al. reported, for their weak-grid LV PV study, current and voltage distortion of approximately 10.2% and 5.2%, respectively, at 50% PV penetration, illustrating the dependence of observed distortion on the specific network and operating condition [10]. Vinayagam et al. examined harmonic behavior and mitigation in a PV-integrated network and showed that harmonic dominance varies with operating condition [11]. Yuan et al. reported that harmonic loss represented approximately 0.6% of the total network loss in their studied LV distribution network and also identified voltage-quality sensitivity near the PV access point [12]. These studies establish the importance of harmonic assessment in DER-rich LV systems, but feeder impedance is typically one element of the network model rather than the isolated sensitivity variable.
The electrical characteristics of the network are important because harmonic voltage is produced by the interaction between harmonic current and the impedance presented by the network at the corresponding frequencies. CIGRÉ guidance therefore emphasizes appropriate representation of network topology, impedance, and harmonic-producing devices when conducting harmonic studies [8]. In a radial LV feeder, increasing electrical impedance can increase the voltage response to both the fundamental and harmonic current at electrically remote locations. However, this relationship does not imply that every current-based or transformer-related quantity must increase in the same manner. The current reaching the transformer is determined by the complete operating state of the feeder, including local demand, DER injection, and power-flow direction.
This distinction is particularly important when percentage current distortion is used. ITHD is referenced to the fundamental current of the operating case and can therefore become large when the fundamental transformer current is reduced by local DER support or export. A large ITHD value does not necessarily correspond to a large absolute harmonic-current burden. For this reason, the present study also retains a fixed transformer-capacity-referenced current-distortion measure, referred to as TDD in this study, to provide a complementary indication of harmonic current relative to the transformer rated current. The two measures should therefore be interpreted together rather than as interchangeable indicators of transformer severity.
This distinction is particularly important for transformer assessment. Chidurala et al. demonstrated the influence of high PV penetration on harmonic propagation and transformer-related harmonic indices in distribution networks [13]. Transformer-focused studies further show that thermal consequences depend on both harmonic content and loading. Seddik et al. linked harmonic losses to transformer thermal response and showed that the thermal effect becomes more pronounced as loading increases [14]. In an experimental dry-type transformer study, Costa et al. reported temperature increases of up to 35% under the assessed harmonic conditions and a 7.9% temperature variation associated with harmonic phase angle for cases with the same harmonic amplitudes [15]. These findings reinforce the need to retain absolute loading, a harmonic spectrum, and a transformer-specific loss structure when interpreting harmonic risk rather than relying on a percentage-distortion metric alone.
This distinction is especially relevant to the additional harmonic loss factor, FHL,add, used in this study. FHL,add characterizes the additional harmonic weighting associated with the transformer-side current spectrum, with FHL,total = 1 + FHL,add. It is applied to the harmonic-sensitive stray/eddy-loss component rather than indiscriminately to the complete transformer load loss. The transformer used in this study has a rated ohmic load-loss component of 2702 W and a substantially smaller rated stray/eddy component of 46.5 W. Consequently, a relatively high FHL,add can occur under light transformer loading without producing a correspondingly high total transformer loss or hot-spot temperature.
The practical assessment problem is therefore not simply whether increasing feeder impedance increases harmonic distortion. Rather, it is whether the resulting network consequence and transformer consequence change in the same way. Remote-node voltage magnitude and VTHD principally describe the voltage-quality response of the feeder, whereas Node S0 current, loading, ITHD, transformer-capacity-referenced comparative TDD, harmonic spectrum, and FHL,add describe the current exposure experienced by the transformer. Absolute transformer loss and thermal response then determine whether that exposure translates into a material transformer consequence. In the final feeder impedance dataset, the DER-connected transformer remains lightly loaded at approximately 14.44–14.52%, even as the remote-node voltage response increases with feeder impedance.
The research gap addressed by this paper is therefore the controlled evaluation of feeder impedance across these two assessment domains. Rather than assuming a monotonic pathway of higher feeder impedance leading to greater harmonic distortion and consequently greater transformer heating, this study isolates feeder impedance while retaining a common DER rating, location, load condition, upstream source, and prescribed harmonic spectrum. Weak-grid inverter studies such as Zhao et al. have shown that grid impedance can amplify harmonic voltage and alter inverter-grid harmonic behavior [16]. The present work complements that literature by using a controlled lower-order current-injection framework and a transformer-specific post-processing chain to determine whether the same feeder impedance sweep produces corresponding transformer loss and thermal severity.
3. Methodology
The methodology was structured to isolate feeder impedance as the principal independent variable while maintaining a consistent DER operating condition, network topology, transformer, load distribution, upstream source condition, and injected harmonic spectrum. The simulated feeder system and impedance-scaling approach are first defined, followed by the DER current-injection model and voltage-alignment procedure. Steady-state electrical and harmonic quantities are then extracted at defined measurement locations for subsequent assessment.
The methodology deliberately distinguishes between network-side response and transformer-side response. Node S3 is used principally to assess the remote feeder voltage and harmonic-voltage behavior, whereas Node S0 represents the LV side of the distribution transformer and is used for transformer current, power flow, loading, and harmonic-current assessment. This separation prevents a large remote-end voltage response from being interpreted automatically as severe transformer loading or thermal stress.
3.1. Study Design
The simulation model was implemented in MATLAB/Simulink R2025b using Simscape Electrical Specialized Power Systems. A three-phase time-domain model was used so that fundamental-frequency electrical quantities and harmonic quantities could be obtained from the same simulated voltage and current waveforms. The electrical network was simulated using a continuous powergui configuration with the variable-step ode23tb solver. The fundamental frequency was 50 Hz, and the total simulation duration was 0.5 s.
A controlled feeder-impedance sensitivity study was performed on a balanced radial LV network supplied through a 200 kVA distribution transformer, with inverter-based DER connected at the remote feeder node, Node S3. The feeder-impedance scaling factor was used as the independent variable. For the DER-connected cases, the DER penetration level, DER location, transformer rating, load distribution, upstream source impedance, and relative harmonic-current spectrum were retained, while feeder impedance was varied.
In this study, DER penetration is defined as the DER rated apparent power expressed as a percentage of the distribution-transformer rated apparent power. The DER-connected Group C cases use a fixed penetration of 40%, corresponding to an 80 kVA DER source connected at Node S3.
Five cases were considered. Case C0 represents the no-DER reference condition at the base feeder impedance. Cases C1–C4 represent the controlled feeder-impedance comparison with 40% DER connected at Node S3. The impedance factors of 0.5, 1.0, 1.5, and 2.0 pu represent progressively stronger and weaker feeder conditions relative to the base feeder.
The selected factors are controlled sensitivity-study parameters and are not intended to define universal feeder-strength thresholds for practical LV networks. The purpose is to determine how the same DER operating condition interacts with different feeder impedances while the principal remaining study variables are retained.
3.2. Network Model
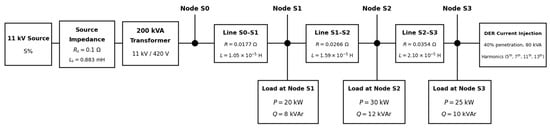
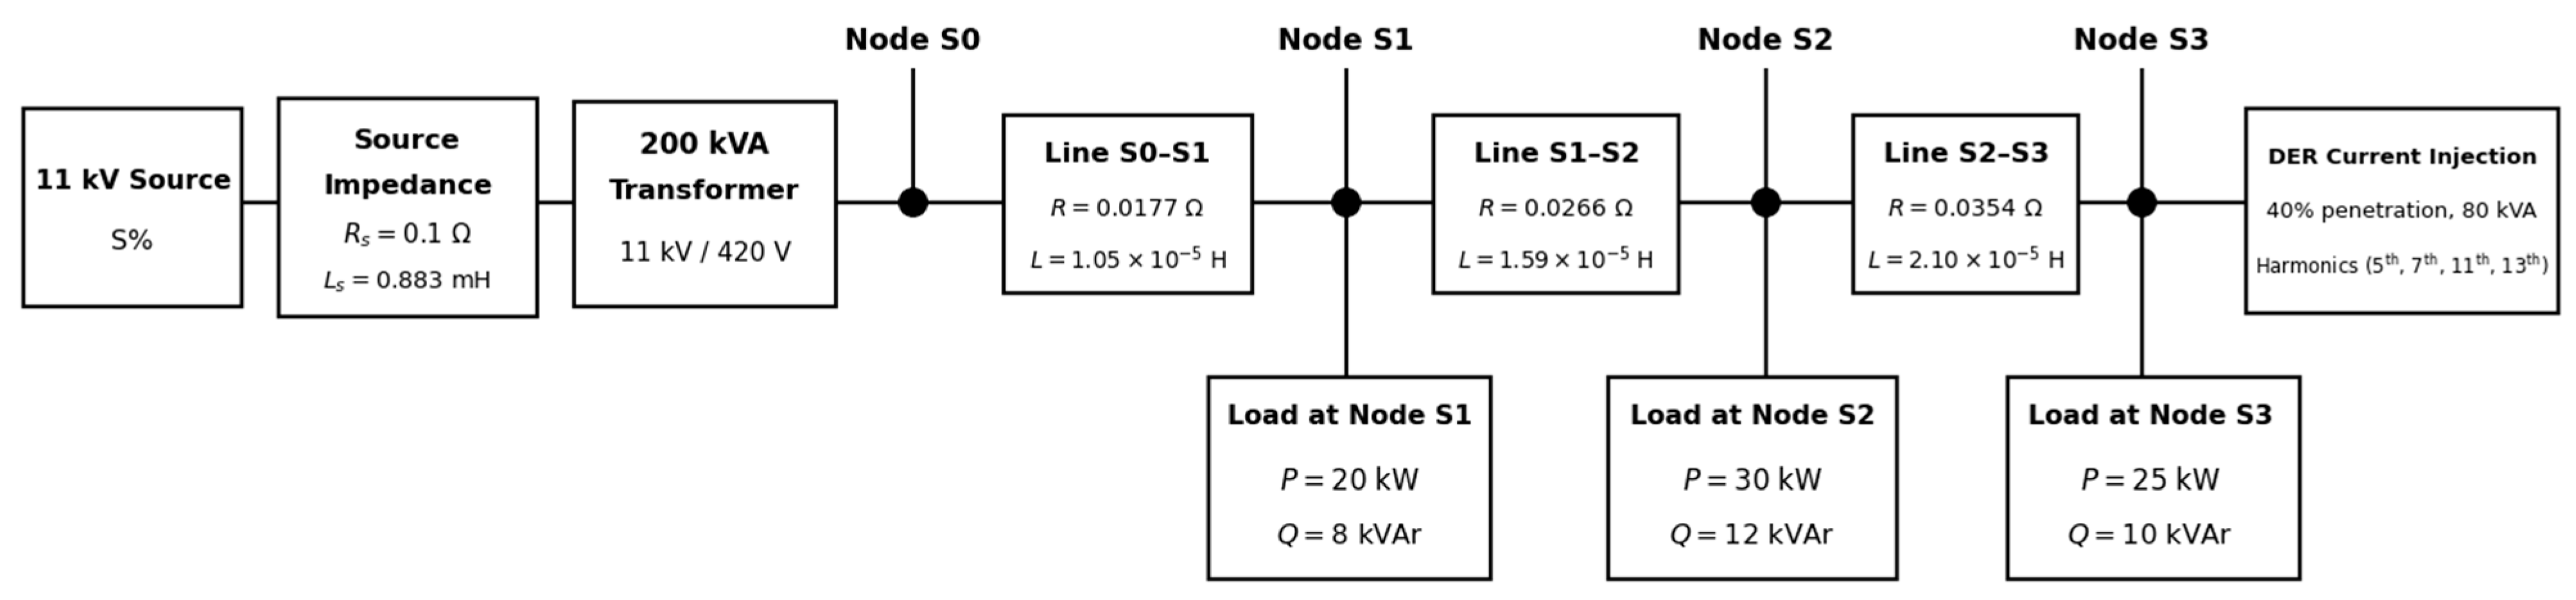
The simulated network consisted of an ideal 11 kV, 50 Hz three-phase source, an external source-impedance branch of R = 0.100 Ω and L = 0.0050 H, a factory-matched 200 kVA, 11 kV/420 V transformer with 4.53% short-circuit impedance, and a radial 420 V LV feeder, as seen in Figure 1. The transformer was implemented with a high-voltage delta winding and a grounded-wye LV winding and was validated at system level to realize the required Dyn11 displacement. The feeder contained four principal measurement nodes: Node S0, Node S1, Node S2, and Node S3. Node S0 is the transformer-side LV measurement node and study boundary; it is not asserted to be the formal utility point of common coupling. Node S3 is the remote feeder node and DER connection point.
Figure 1.
Simplified LV feeder model used for the feeder-impedance sensitivity study.
The external source-impedance branch and transformer parameters were retained unchanged throughout the feeder-impedance sensitivity study. The source block internal impedance was kept at zero so that the separate external branch represented the effective upstream source impedance. Adjacent LV feeders, neighboring customer networks, and parallel feeder interactions were not represented because the objective was to isolate the sensitivity of the study feeder to changes in its own series impedance.
The base feeder consisted of three lumped series R-L sections. The corresponding parameters are given in Table 1.
Table 1.
Base LV feeder parameters.
Balanced three-phase grounded-wye loads were connected at Nodes S1, S2, and S3 using the Specialized Power Systems Three-Phase Parallel RLC Load representation. The loads were specified at 420 V line-to-line and 50 Hz using the nominal active and inductive reactive powers listed in Table 2, with no capacitive reactive-power component. They are therefore passive RLC representations rather than ideal constant-PQ loads.
Table 2.
LV load distribution.
The rated LV current of the transformer was determined from the standard three-phase apparent-power relationship:
where is the transformer rated apparent power and is the rated LV line-to-line voltage.
For the 200 kVA, 420 V transformer:
The rated current of 274.93 A was subsequently used as the reference for transformer loading and for the fixed transformer-capacity-referenced TDD measure adopted in this study.
3.3. Feeder Impedance Scaling
The independent variable in the study was the feeder-impedance scaling factor, . The same factor was applied to the resistance and inductance of each of the three LV feeder sections. Scaling both quantities together preserves the feeder topology and base X/R relationship while changing the magnitude of the feeder impedance.
For each feeder section:
where , , and are the scaled feeder resistance, inductance, and impedance, respectively, and , , and are the corresponding base values.
The transformer parameters, upstream source impedance, load distribution, DER location, DER fundamental rating, and imposed relative harmonic spectrum were retained across C1–C4. The case matrix is shown in Table 3.
Table 3.
Feeder-impedance sensitivity case matrix.
Case C0 provides a passive no-DER reference at the base feeder impedance. Since DER presence also changes between C0 and the remaining cases, the controlled feeder-impedance sensitivity comparison is made primarily between C2, C1, C3, and C4, corresponding to increasing feeder impedance factors of 0.5, 1.0, 1.5, and 2.0 pu.
The methodology does not assume that the weakest feeder will necessarily produce the greatest transformer consequence. Feeder impedance directly influences the voltage produced by fundamental and harmonic current flow, whereas transformer-side current depends on the resulting load-generation balance and complete network operating state. Network-voltage indicators and transformer-current indicators are therefore retained separately throughout the analysis.
3.4. DER Current Injection Model
The DER was represented as a balanced three-phase inverter-based current source connected at Node S3. The current-source representation allows the fundamental current and selected harmonic components to be imposed as controlled inputs without introducing the switching and proprietary controller dynamics of a particular commercial inverter.
The DER apparent power was defined from the selected penetration level as:
where is the DER penetration expressed in per unit of transformer rated apparent power.
For the 40% DER condition:
The corresponding fundamental RMS line current at the rated LV line-to-line voltage was:
The DER current contained a fundamental component together with selected 5th, 7th, 11th, and 13th harmonic components. Their RMS magnitudes were specified as fixed percentages of the fundamental DER current, as shown in Table 4.
Table 4.
DER harmonic current spectrum.
The phase-A current waveform was represented in general form as:
where is the fundamental RMS current, is the RMS current of harmonic order , is the fundamental angular frequency, and and are the corresponding phase angles.
The RMS magnitude of each injected harmonic current was defined by:
where is the specified fractional magnitude of harmonic order .
Phases B and C were generated by applying one-third-cycle time displacements to the complete non-sinusoidal phase-A waveform. This yields the expected harmonic-order-dependent sequence for the selected non-triplen harmonics: the 5th and 11th are negative, whereas the 7th and 13th are positive sequences. The complete-waveform displacement also preserves an approximately 120° separation between the fundamental components. This formulation is more precise than assigning an identical ±120° phase shift independently to every harmonic order.
The prescribed spectrum is used as a controlled study input and is not presented as a universal emission spectrum for inverter-based DER. Actual inverter harmonic emissions depend on the converter topology, control strategy, switching behavior, operating point, and network conditions.
3.5. Voltage-Aligned DER Injection
For each DER-connected case, the DER current injection was aligned to the local fundamental voltage at Node S3. This procedure was necessary because changing feeder impedance changes both the magnitude and phase angle of the voltage at the DER connection point. If a single fixed current phase reference were used for all impedance conditions, differences between cases could arise from an unintended change in the current-to-voltage phase relationship rather than from feeder impedance alone.
The voltage-alignment procedure consisted of the following sequence:
- The required feeder-impedance factor was applied, and the DER current source was disabled;
- A reference simulation was performed to determine the local fundamental voltage at Node S3;
- The fundamental voltage phase angle at Node S3 was extracted;
- The three-phase DER waveform was generated relative to this local voltage reference;
- The final DER-connected simulation was performed;
- The measured DER current was validated before the case was accepted for results extraction.
This voltage-reference and waveform-generation procedure was repeated independently for C1–C4 because the local Node S3 voltage angle changes with feeder impedance. The procedure is a prescribed-current alignment method, not an iterative closed-loop constant-power controller. A zero-injection reference simulation provides the local fundamental voltage angle, the current command is generated from that reference, and one DER-connected simulation is then accepted only after the measured injected current and operating point pass the validation checks.
The validation was performed on the measured injected waveform rather than only on the commanded current waveform. Checks included the fundamental RMS magnitude, 5th, 7th, 11th, and 13th harmonic magnitudes, the harmonic sequence, the phase RMS balance, an approximately 120° fundamental-phase separation, the ABC phase sequence, and the current-to-local-voltage relationship. The resulting active and reactive power and power factor were taken from the accepted simulated operating point rather than assumed from the current command.
This validation step is important because the purpose of the Group C study is to ensure that feeder impedance remains the intended changing network variable, while the DER operating condition remains physically consistent.
3.6. Simulation Window and Harmonic Extraction
The system was simulated at a fundamental frequency of 50 Hz with a total simulation duration of 0.5 s. All accepted Group C electrical, power, and harmonic quantities were extracted over the common steady-state interval 0.300 ≤ t < 0.500 s. The measured waveforms were linearly resampled to a uniform 10 kHz analysis grid, giving 2000 samples over the exclusive-end interval. Fundamental and selected harmonic phasors were obtained using a simultaneous least-squares fit containing a DC term and h = {1, 5, 7, 11, 13}. The same extraction method was applied to every accepted Group C case and to the matched no-DER references used for baseline correction.
The fundamental period is:
The selected analysis interval is:
and therefore contains:
The selected exclusive-end interval removes the initial electrical settling response and provides ten fundamental cycles on a common uniformly sampled analysis grid. Applying one common extraction method to the DER-connected and matched no-DER cases prevents differences in windowing or harmonic estimation from being mistaken for feeder-impedance sensitivity.
The harmonic analysis considered the 5th, 7th, 11th, and 13th harmonic orders explicitly represented in the DER current source. This study was therefore designed as a controlled lower-order harmonic sensitivity assessment rather than a full broadband harmonic survey.
Voltage and current waveforms were recorded throughout the feeder. Node S3 was used principally to evaluate remote-end RMS voltage, voltage rise or drop, and selected-order voltage total harmonic distortion, whereas Node S0 was used for transformer-side RMS current, active-power direction, transformer loading, selected-order current total harmonic distortion, transformer-capacity-referenced TDD, and the transformer-side harmonic spectrum.
Accordingly, the reported VTHD and ITHD quantities should be interpreted as distortion indices derived from the harmonic orders represented in the simulation. IEEE 519-2022 provides the broader framework for interpreting voltage and current harmonic distortion [3], but the present controlled model is not presented as a full-spectrum field compliance measurement.
The separate use of Node S3 and Node S0 is fundamental to the subsequent interpretation of results. The Group C dataset demonstrates that feeder impedance can materially affect remote-node voltage behavior while the transformer-side operating condition remains comparatively stable.
3.7. RMS Voltage, Current, and Power Flow Calculation
RMS voltage and current quantities were calculated from the measured steady-state time-domain waveforms over the analysis interval defined in Section 3.6. For a waveform , the RMS value over the selected interval was calculated as:
where , , and .
For each measurement node, the representative three-phase voltage used in the reported results was the arithmetic mean of the three line-to-line RMS quantities. The use of line-to-line voltage is consistent with the 420 V LV rating of the study system:
VLL,rms = (VAB,rms + VBC,rms + VCA,rms)/3
Similarly, the representative three-phase RMS current was calculated as:
The feeder voltage difference was defined as the transformer-side RMS voltage at Node S0 minus the remote-node RMS voltage at Node S3:
A positive value therefore indicates a conventional downstream voltage drop from Node S0 towards Node S3, whereas a negative value indicates a voltage rise at Node S3 relative to Node S0. This sign convention is retained throughout the results so that the effect of DER export on the feeder voltage profile can be interpreted consistently.
Three-phase active power at Node S0 was calculated directly from the phase voltage and current waveforms over the same steady-state interval:
The sign of was used to determine the direction of active-power transfer. Positive denotes net forward power flow from the transformer/source towards the LV feeder, while negative denotes net export from the LV feeder through the transformer towards the upstream source. Reverse-power status was therefore derived directly from the Node S0 active-power result, with reverse power recorded when .
The use of measured Node S0 and Node S3 waveforms ensures that the voltage profile and power-flow quantities reflect the actual simulated network response rather than the commanded DER source quantities. These quantities provide the operating-state context required for the transformer loading and harmonic assessments that follow.
3.8. Transformer Loading
Transformer loading was calculated from the representative three-phase RMS current measured at Node S0 relative to the rated LV current of the 200 kVA transformer. Node S0 was used because its LV current represents the current flowing through the distribution transformer. The loading percentage was calculated as:
where IS0,rms is the representative three-phase RMS current at Node S0, and Irated is the rated LV current of the transformer. For the 200 kVA, 420 V transformer, Irated = 274.93 A, as established in Section 3.2.
Because transformer loading is based on RMS current magnitude, it is independent of the sign of active power. The transformer may therefore carry current under either forward power flow or reverse DER export. This distinction is important in DER-connected feeders, where the direction of active-power transfer can change without eliminating transformer current.
Transformer loading was retained as a separate indicator from ITHD, TDD, and the additional harmonic loss factor, FHL,add. Percentage current distortion can be elevated when the fundamental current is small, while a high harmonic weighting factor does not by itself establish a large absolute transformer loss. The subsequent transformer-loss assessment therefore combines the actual Node S0 loading with the transformer-side harmonic spectrum and transformer-specific loss components. This treatment is consistent with the non-sinusoidal loading principles of IEEE C57.110 and the transformer loading framework of IEEE C57.91 [6,7].
3.9. Voltage THD and Current THD
Selected-order voltage total harmonic distortion (VTHD) was calculated from the RMS magnitudes of the harmonic voltage components represented in the model relative to the fundamental voltage component. For the set of analyzed harmonics H = {5, 7, 11, 13}, VTHD was calculated as:
where V1 is the fundamental RMS voltage magnitude, Vh is the RMS voltage magnitude at harmonic order h, and H = {5, 7, 11, 13} is the set of harmonic orders represented in the controlled DER current spectrum.
Selected-order current total harmonic distortion (ITHD) was calculated using the same structure, but with the harmonic current components referenced to the case-specific fundamental current:
where I1 is the case-specific fundamental RMS current magnitude, and Ih is the RMS current magnitude at harmonic order h.
VTHD was evaluated principally at Node S3 to characterize harmonic-voltage distortion at the remote DER-connected node, while ITHD was evaluated at Node S0 to characterize the current distortion flowing through the LV side of the distribution transformer. The use of different measurement locations is intentional because the greatest remote-node voltage response does not necessarily correspond to the greatest transformer-side current consequence.
ITHD is normalized to the fundamental current of the individual operating case. It can therefore become comparatively large when DER injection reduces the net fundamental current through the transformer, even when the absolute harmonic-current burden remains modest. ITHD was consequently interpreted together with transformer loading and the fixed transformer-capacity-referenced TDD measure defined in Section 3.10, rather than being used as a stand-alone indicator of transformer severity.
The reported VTHD and ITHD values are selected-order distortion indices based on the 5th, 7th, 11th, and 13th harmonics represented in the controlled simulation. IEEE 519-2022 provides the broader harmonic-distortion assessment framework [3]; however, these calculated quantities are not presented as a full-spectrum field compliance measurement.
3.10. Total Demand Distortion
Total demand distortion (TDD) was retained as a complementary transformer-side current-distortion measure because ITHD is normalized to the fundamental current of the individual operating case. Under DER-connected conditions, the net fundamental current through the transformer can be reduced substantially, causing ITHD to become comparatively large even when the absolute harmonic-current magnitude remains modest. In this study, the selected harmonic current content was therefore also normalized to the fixed rated LV current of the 200 kVA transformer:
where Ih is the RMS current magnitude at harmonic order h, H = {5, 7, 11, 13} is the set of harmonic orders represented in the controlled DER spectrum, and Irated is the rated LV current of the transformer. For the 200 kVA, 420 V transformer, Irated = 274.93 A.
The fixed rated-current denominator provides a stable transformer-capacity reference across the feeder-impedance cases, including conditions in which DER export materially reduces the case-specific fundamental current through Node S0. TDD therefore complements ITHD by expressing the selected harmonic-current magnitude relative to transformer capacity rather than relative to the fundamental current of the individual case.
This denominator convention is specific to the comparative transformer assessment adopted in this study. IEEE 519-2022 defines conventional current-distortion assessment using a demand-current reference at the point of common coupling [3]. Accordingly, the TDD values reported here are used as transformer-capacity-referenced comparative indicators and are not presented as direct IEEE 519 site-compliance values.
The distinction between ITHD and TDD is particularly important for the feeder-impedance sensitivity analysis because all DER-connected Group C cases operate at comparatively low transformer loading. Retaining both indices reduces the likelihood that a high percentage distortion caused primarily by a small fundamental-current denominator is interpreted automatically as a large absolute harmonic burden on the transformer.
3.11. Additional Harmonic Loss Factor
The transformer-side harmonic current spectrum at Node S0 was used to quantify the additional harmonic-sensitive eddy-current loss contribution. Higher-order harmonic currents have a disproportionate influence on transformer winding eddy-current loss because this loss component increases strongly with harmonic frequency. Consistent with the harmonic-order weighting used in IEEE C57.110 [6], the additional harmonic loss factor adopted in this study was calculated from the selected Node S0 harmonic spectrum as:
where Ih is the RMS current magnitude at harmonic order h, I1 is the fundamental RMS current at Node S0, and the summation is taken over the selected harmonic orders h ∈ {5, 7, 11, 13}. The fundamental component is excluded from the additional term because the fundamental-frequency stray/eddy loss is already represented in the transformer factory loss split.
The corresponding total multiplier applied to the harmonic-sensitive stray/eddy loss component is:
The notation is deliberately separated into FHL,add and FHL,total. FHL,add represents only the additional harmonic-frequency contribution, whereas FHL,total includes the fundamental-frequency reference contribution through the term 1 + FHL,add. Consequently, an FHL,add value below unity is physically meaningful and indicates that the additional harmonic contribution is smaller than the fundamental-frequency stray/eddy reference component.
The harmonic-order weighting in Equation (20) means that a relatively small higher-order harmonic current can contribute materially to the additional loss factor. However, FHL,add is an exposure indicator rather than a direct measure of total transformer heating. It does not multiply the transformer no-load loss or the dominant ohmic load-loss component. In the transformer-loss calculation developed in Section 3.12, the total multiplier is applied only to the harmonic-sensitive stray/eddy component, while the magnitude of the current-dependent losses remains governed by transformer loading.
This distinction is essential to the feeder-impedance sensitivity assessment because the feeder condition with the largest additional harmonic loss factor need not be the condition with the greatest remote-end voltage distortion, transformer loading, or thermal consequence. The harmonic factor is therefore retained together with ITHD, TDD, and transformer loading rather than being interpreted as a standalone transformer-risk measure.
3.12. Transformer Loss Assessment
The electrical and harmonic indicators obtained from the simulation do not directly quantify the absolute transformer loss. The accepted Node S0 RMS current and harmonic spectrum were therefore converted into transformer-specific losses in a deterministic post-processing stage. The calculation follows the non-sinusoidal-loading principles of IEEE C57.110 [6] and uses the factory-derived separation between the dominant ohmic load-loss component and the smaller harmonic-sensitive stray/eddy component.
The transformer loss parameters used in the calculation are summarized in Table 5. The complete factory report is confidential; only the parameters required to reproduce the loss calculation are reported.
Table 5.
Transformer loss parameters used in the post-processing model.
The component values are retained separately because they do not respond identically to non-sinusoidal current. The factory-derived ohmic and stray/eddy components sum to 2748.5 W, while the factory report gives the rounded rated load loss as 2748 W. The component values are used in the harmonic calculation, whereas the reported 3040 W rated total loss is retained as the thermal reference used in Section 3.13.
The per-unit transformer loading factor, K, was calculated from the Node S0 RMS current as:
where IS0 is the measured RMS current at Node S0, and Irated = 274.93 A is the transformer rated LV current. Current-dependent loss components are scaled by K2.
The harmonic-adjusted transformer load loss was then calculated as:
Equation (23) is intentionally structured so that the additional harmonic multiplier acts only within the stray/eddy term. The dominant ohmic component is scaled by current magnitude through K2, but it is not multiplied by FHL,add. This avoids treating the complete rated load loss as though it had the same harmonic-frequency sensitivity.
For interpretation, the operating ohmic component can be written separately as:
The harmonic-adjusted stray/eddy component is:
The latter term contains both the fundamental-frequency stray/eddy contribution and the additional harmonic contribution. Equivalently, the fundamental component is K2PSE,rated, while the additional harmonic contribution is K2PSE,ratedFHL,add. This decomposition explains why a high additional harmonic loss factor under light loading can still produce a modest absolute transformer loss.
Total transformer loss was obtained by adding the no-load loss to the harmonic-adjusted load loss:
The no-load loss is treated as present independently of the case current over the comparative steady-state simulations. Consequently, total transformer loss does not approach zero at low transformer current. The calculated Ptotal is subsequently used as the heat-input quantity in the thermal assessment in Section 3.13.
The separation between loading and harmonic weighting is central to the interpretation of the feeder-impedance cases. Transformer loading enters the loss calculation through the square of K and therefore scales both current-dependent loss components, whereas FHL,add modifies only the much smaller harmonic-sensitive component. A feeder condition can therefore exhibit a relatively high additional harmonic loss factor without producing the highest total transformer loss or thermal severity.
3.13. Thermal and Aging Assessment
The total transformer loss calculated in Section 3.12 was converted into a steady-state thermal and aging response. The thermal quantities are not direct outputs of the Simulink network model; they are calculated in post-processing from the case-specific total transformer loss and Node S0 loading. The calculations retain the IEEE C57.91-2011 loading-guide framework used in the study [7]. IEEE C57.91-2025 is acknowledged as the current edition of the loading guide [17]. IEC 60076-7:2018 is additionally cited for the broader transformer loading, operating temperature, and thermal-aging context [18].
The parameters used for the thermal and aging calculation are summarized in Table 6. The 3040 W rated total-loss value is retained as the thermal reference for the top-oil calculation. Temperature-rise terminology and test context are consistent with IEC 60076-2:2011 [19], while the adopted 130 °C aging-reference hot-spot temperature for the natural-ester and thermally upgraded paper insulation system is supported by the high-temperature-insulation framework of IEC 60076-14:2013 [20].
Table 6.
Thermal and aging parameters used in the post-processing model.
The steady-state top-oil rise was calculated from the ratio of the case-specific total transformer loss to the rated total-loss thermal reference:
where ΔθTO,R = 42.8 K is the rated top-oil rise, Ptotal,rated = 3040 W is the rated total-loss thermal reference, and x = 0.8 is the oil exponent. The corresponding top-oil temperature is obtained by adding the assumed ambient temperature to the calculated top-oil rise.
The winding hot-spot gradient above top oil was calculated separately from transformer loading:
where gR = 12.7 K is the rated winding-to-oil gradient, H = 1.1 is the hot-spot factor, K is the per-unit loading factor defined in Section 3.12, and y = 1.6 is the winding exponent. This term retains the direct influence of transformer current on the local winding temperature elevation.
The resulting winding hot-spot temperature was calculated as:
where θA = 30 °C is the common ambient temperature used for all cases. This sequence separates the bulk loss-driven top-oil response from the loading-dependent winding gradient before the two are combined into the final hot-spot temperature.
The aging acceleration factor was calculated using the Arrhenius-type relationship used in this study:
where θH,ref = 130 °C is the adopted aging-reference hot-spot temperature. The aging factor is therefore determined from the calculated thermal state rather than directly from THD, FHL,add, or feeder impedance.
For comparison across cases, the aging acceleration factor was normalized to the canonical common Dyn11 no-DER reference: relative aging = FAA/FAA,ref.
The canonical common no-DER reference is FAA,ref = 5.979674 × 10⁻⁵. A relative aging value greater than one indicates a faster calculated aging rate than this common reference, while a value below one indicates a slower calculated rate. Relative aging is a comparative aging-rate indicator and is not interpreted as remaining transformer life or cumulative loss of life.
The thermal assessment is intentionally steady-state and comparative. It does not simulate transformer thermal time constants or the temperature trajectory following a short-duration operating change. All feeder-impedance cases are evaluated using the same transformer parameters and ambient temperature so that differences in hot-spot temperature and aging arise from the calculated transformer loss and loading. This distinction is important for the revised Group C interpretation: increased remote-end voltage sensitivity does not, by itself, imply increased transformer thermal severity.
3.14. Validation Checks and Methodological Scope
Before a Group C case was accepted, the DER injection and resulting network response were checked at several levels. The measured injected current was verified against the prescribed fundamental and harmonic targets and expected sequence; the accepted operating point was checked for physically consistent active/reactive power and reverse-power direction; component-level and whole-system P/Q balances were required to pass; and all required Node S0–S3 electrical quantities had to be finite and available. Network response validation was then strengthened using matched no-DER references and baseline-corrected harmonic transfer impedance. These checks provide internal simulation and analytical consistency evidence, not field experimental validation.
For the 40% DER condition, the expected fundamental current was 109.97 A RMS, with harmonic-current magnitudes of 4.3989 A, 3.2991 A, 2.1994 A, and 1.0997 A for the 5th, 7th, 11th, and 13th harmonics, respectively. These values correspond to 4%, 3%, 2%, and 1% of the fundamental current. The voltage-reference simulation and DER waveform generation were repeated for each feeder-impedance factor so that changes in the local Node S3 voltage angle did not introduce an uncontrolled change in the DER current-to-voltage phase relationship.
A case was accepted only when the intended feeder-impedance factor had been applied correctly, the measured DER current passed the electrical and sequence checks, the required voltage/current signals at Nodes S0–S3 were available, the steady-state interval was valid, and the accepted operating point passed the component/global power-balance checks. The DER-connected results were additionally paired with a zero-injection no-DER reference at the same feeder factor for the transfer-impedance assessment.
The measurement locations were retained consistently throughout the assessment. Node S3 was used principally to evaluate the remote-end voltage magnitude, voltage rise or drop, and selected-order VTHD, while Node S0 was used for the transformer-side RMS current, active-power direction, loading, selected-order ITHD, transformer-capacity-referenced TDD, harmonic spectrum, FHL,add, transformer loss, and the subsequent thermal and aging calculations. Nodes S1 and S2 were retained as intermediate feeder measurement points where required. This distinction is important because the location of the greatest feeder voltage response is not necessarily the location associated with the greatest transformer consequence.
The network model is intentionally balanced and radial and uses lumped series R-L representations for the three LV feeder sections. The model therefore captures the fundamental voltage response and the voltage response associated with the specified lower-order harmonic currents, but it does not represent frequency-dependent cable parameters, shunt capacitance, broadband resonance, or detailed electromagnetic transients. These effects would be relevant to a detailed broadband harmonic study but would introduce additional variables beyond the controlled feeder-impedance sensitivity considered here.
Phase imbalance, neutral-current effects, unequal conductor impedances, single-phase DER allocation, and meshed LV operation were also outside the present scope. Similarly, the DER was represented as an aggregate controlled current source rather than as the detailed switching and control system of a specific commercial inverter. The imposed 5th, 7th, 11th, and 13th harmonic spectrum is therefore a repeatable study input and should not be interpreted as a universal inverter emission signature.
The feeder-impedance factors are controlled sensitivity parameters relative to the representative base feeder and are not intended to define universal strong- or weak-feeder thresholds for practical LV networks. The validation hierarchy comprises waveform checks, operating-point and P/Q-balance checks, matched no-DER baseline correction, and harmonic transfer-impedance consistency. This supports a mechanism-oriented comparative simulation, but it is not a substitute for site-specific field validation or formal statistical uncertainty analysis.
Within this scope, the methodology provides a controlled basis for distinguishing network voltage sensitivity from transformer consequences. Remote-end voltage distortion and voltage rise are assessed independently of transformer current, harmonic-sensitive loss, total loss, and thermal response, allowing feeder weakness to be identified as a power-quality concern without assuming that it necessarily produces severe transformer loading or aging.
4. Results and Discussion
4.1. Overview of Results
Table 7 summarizes the electrical and harmonic results for the no-DER reference C0 and the four DER-connected feeder-impedance cases. All voltages are line-to-line RMS. The controlled feeder-impedance trend is discussed in the physical sweep order C2 → C1 → C3 → C4, corresponding to 0.5 → 1.0 → 1.5 → 2.0 pu.
Table 7.
Master comparison results for the feeder-impedance sensitivity study.
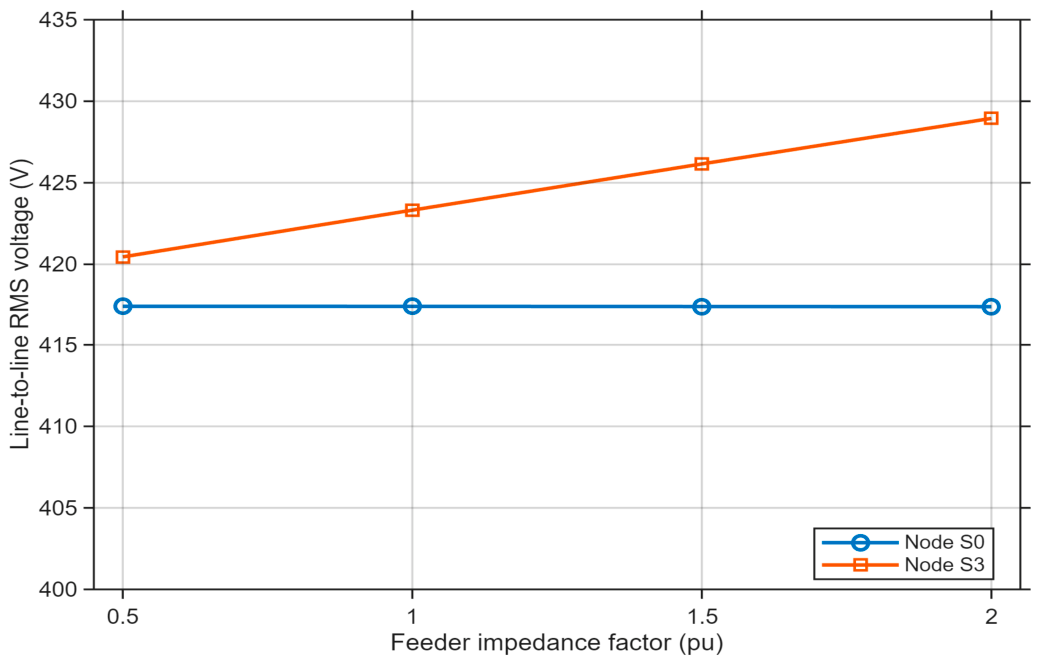
Across the DER-connected sweep, Node S0 line-to-line RMS voltage remains tightly grouped at 417.40–417.42 V, whereas Node S3 increases from 420.45 V in C2 to 423.32 V in C1, 426.16 V in C3, and 428.95 V in C4. The corresponding Node S0–Node S3 voltage difference becomes increasingly negative, from −3.03 V to −11.55 V, indicating progressively greater voltage increases at the remote DER node.
The remote-node harmonic response also increases with feeder impedance: selected-order Node S3 VTHD is 1.1041% in C2, 1.2187% in C1, 1.3171% in C3, and 1.3948% in C4. In contrast, transformer loading remains between 14.44% and 14.52%, and the additional harmonic loss factor decreases modestly from 1.0789 in C2 to 1.0087 in C4. The Group C dataset therefore separates a clear increase in remote-network voltage sensitivity from a comparatively stable, lightly loaded transformer operating condition.
The following subsections examine voltage, power flow, current distortion, transformer consequence, and harmonic transfer response separately so that network power-quality severity is not conflated with transformer thermal severity.
4.2. RMS Voltage and Voltage Rise/Drop Sensitivity
The RMS voltage results show that feeder impedance materially influences the voltage profile between the transformer-side node and the remote DER connection point. Case C0 is retained as the no-DER reference at the base feeder impedance, while the controlled DER-connected comparison is made between C2, C1, C3, and C4, corresponding to feeder-impedance factors of 0.5, 1.0, 1.5, and 2.0 pu, respectively.
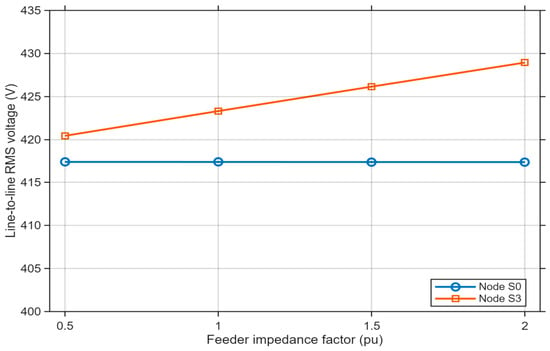
As shown in Figure 2, Node S0 line-to-line RMS voltage is effectively insensitive to the feeder-impedance sweep, changing from 417.423 V in C2 to 417.402 V in C4. Node S3, however, rises monotonically from 420.454 V in C2 to 423.322 V in C1, 426.156 V in C3, and 428.949 V in C4. The transformer-side voltage therefore remains nearly unchanged, while the remote-node voltage response becomes progressively larger.
Figure 2.
Node S0 and Node S3 line-to-line RMS voltage versus feeder impedance.
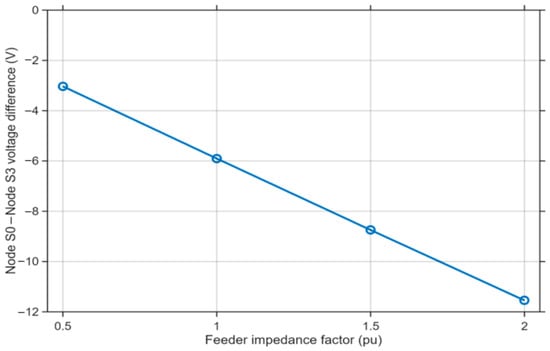
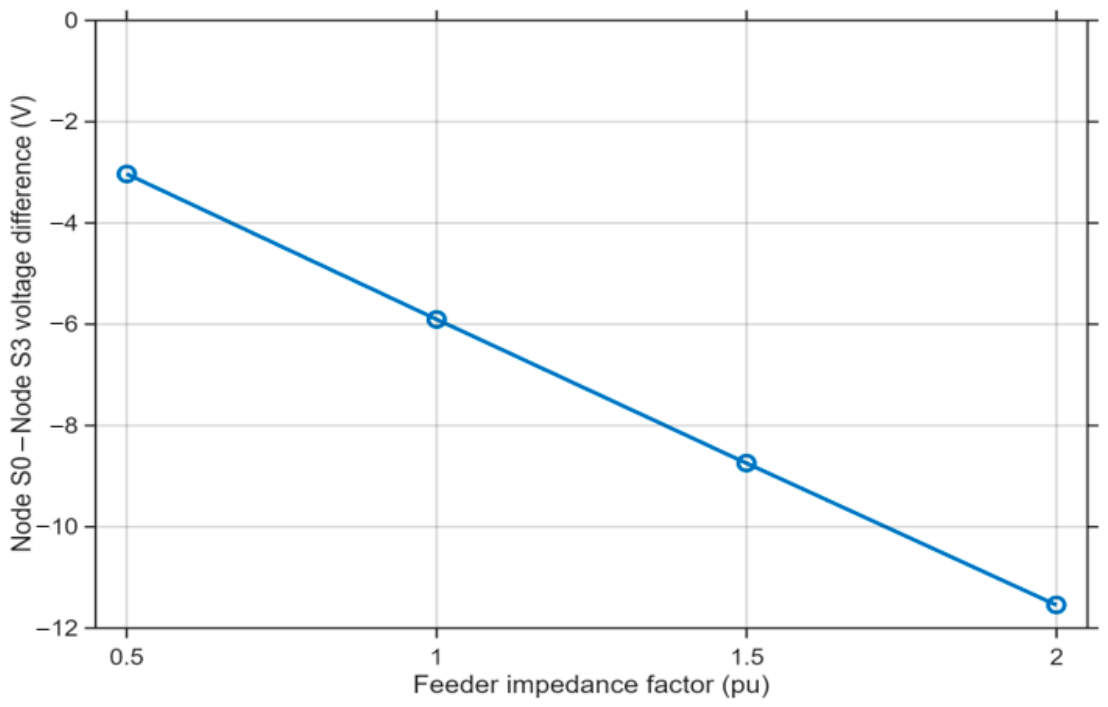
The feeder voltage difference, defined as the Node S0 line-to-line RMS voltage minus the Node S3 line-to-line RMS voltage, is shown in Figure 3. A positive value denotes a conventional downstream voltage drop, whereas a negative value denotes a voltage rise at Node S3 relative to Node S0. The no-DER reference C0 exhibits a 9.090 V downstream drop.
Figure 3.
Node S0–Node S3 line-to-line RMS voltage difference versus feeder impedance.
With 40% DER connected at Node S3, the voltage difference reverses sign in every DER-connected case. In increasing order of feeder impedance, the magnitude of the voltage increase increases from 3.030 V in C2 to 5.903 V in C1, 8.745 V in C3, and 11.547 V in C4. The same DER penetration, location, and prescribed harmonic-current spectrum therefore produce an increasingly pronounced remote-node voltage rise as feeder impedance increases.
These results establish a monotonic network-voltage sensitivity to feeder impedance within the controlled study. Increasing feeder impedance does not materially shift the transformer-side voltage, but it increases the remote-node voltage rise. This is consistent with a larger voltage response to substantially common DER export as the effective electrical impedance between the DER and upstream source increases.
The voltage response should not be interpreted as evidence of a corresponding increase in transformer thermal severity. All DER-connected cases remain in a common light-loading, reverse-power regime, so transformer consequence must be assessed separately from Node S0 current, harmonic spectrum, losses, and loading.
4.3. Active Power Flow and Transformer Loading
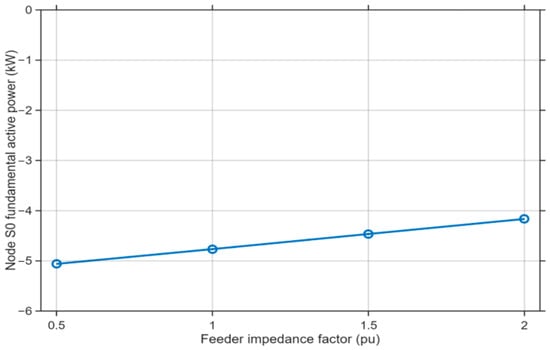
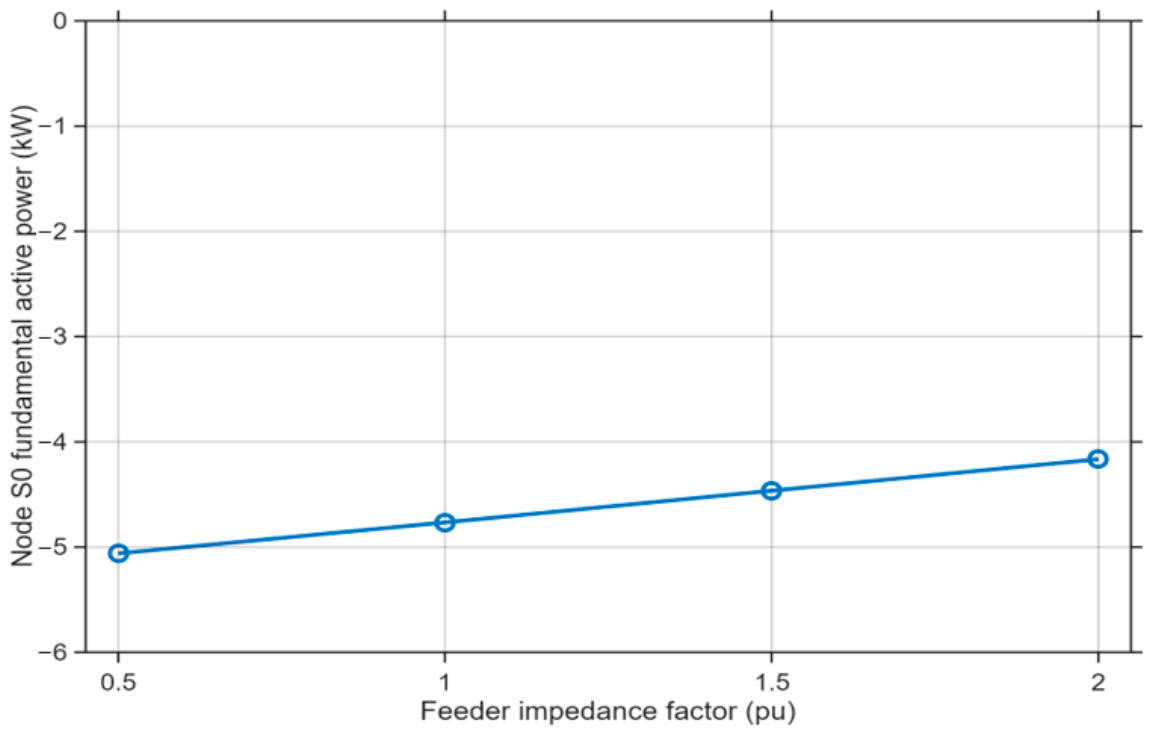
The Node S0 fundamental active-power response is shown in Figure 4. The no-DER reference C0 imports 71.624 kW from the transformer into the feeder. In contrast, every DER-connected case is in reverse power: −5.061 kW in C2, −4.766 kW in C1, −4.465 kW in C3, and −4.165 kW in C4.
Figure 4.
Fundamental active power at Node S0 versus feeder impedance.
The accepted DER operating points remain close to unity power factor across the sweep. DER active power is 80.049 kW in C2, 80.590 kW in C1, 81.122 kW in C3, and 81.647 kW in C4, with corresponding power factors of 0.99959, 0.99954, 0.99947, and 0.99939. These are measured accepted operating points, not assumed command values. Detailed P/Q values are provided in Supplementary Table S2.
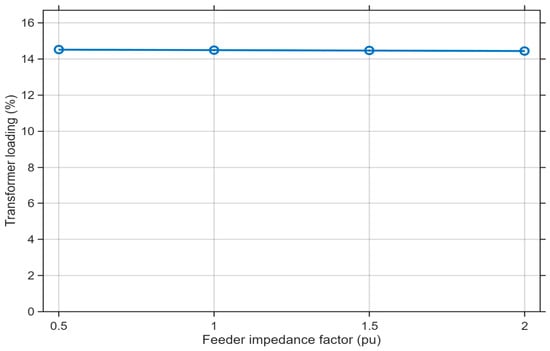
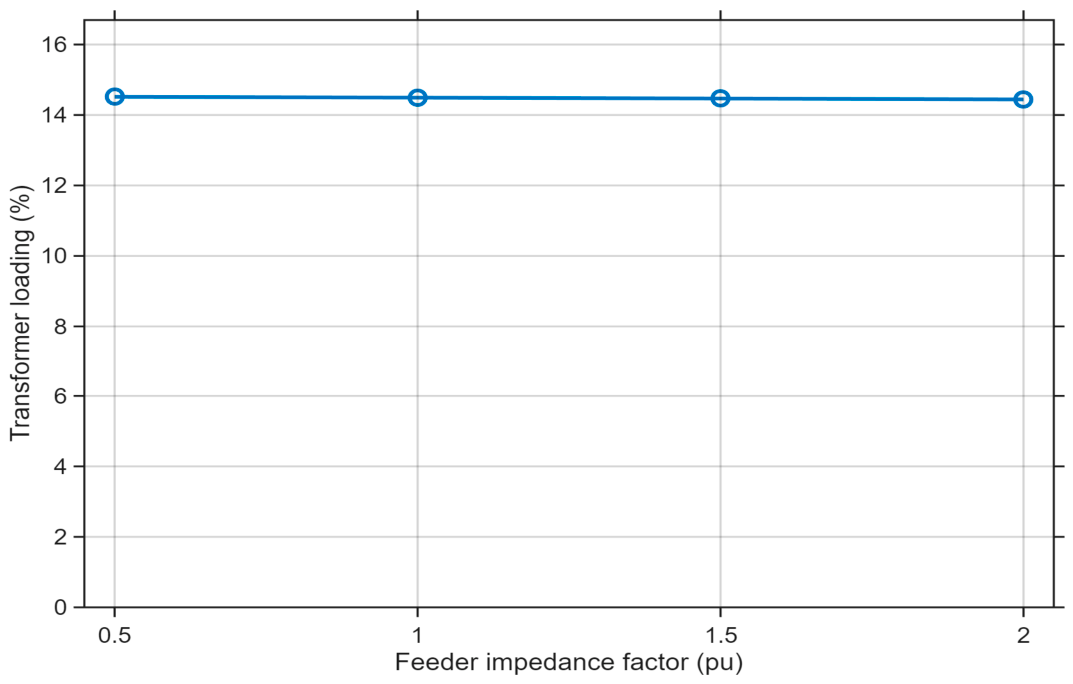
The transformer-loading response is shown in Figure 5. The no-DER reference C0 operates at 39.116% loading. Connecting the 40% DER substantially reduces the net transformer current, with all DER-connected cases operating in the narrow range of 14.441–14.516%.
Figure 5.
Transformer loading versus feeder impedance.
In increasing order of feeder impedance, loading is 14.516% in C2, 14.492% in C1, 14.466% in C3, and 14.441% in C4. The corresponding Node S0 RMS currents are 39.910 A, 39.842 A, 39.773 A, and 39.702 A. Feeder impedance therefore has only a small effect on the RMS current flowing through the transformer under the fixed DER condition.
The P/Q evidence provides an additional check on this interpretation. All C1–C4 component-level and whole-system balance checks passed, and the final DER operating points reproduce the accepted reverse-power conditions. Source, transformer-terminal, feeder-loss, load, and DER P/Q quantities, as well as the global residuals, are provided in Supplementary Table S3.
The power-flow and loading results are important for interpreting the subsequent thermal assessment. The progressively greater remote-node voltage response occurs while the transformer remains lightly loaded and in reverse power throughout C1–C4. The transformer loss and thermal response therefore remain governed primarily by the low absolute current and transformer-specific loss structure rather than by feeder impedance alone.
4.4. Voltage THD Sensitivity to Feeder Impedance
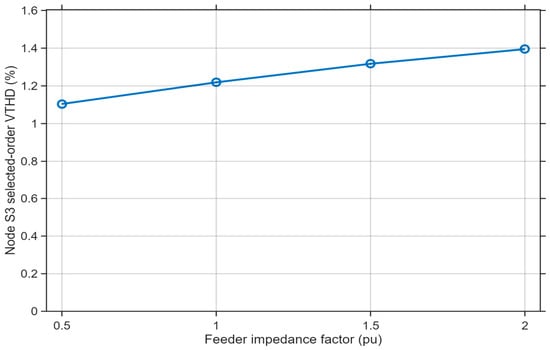
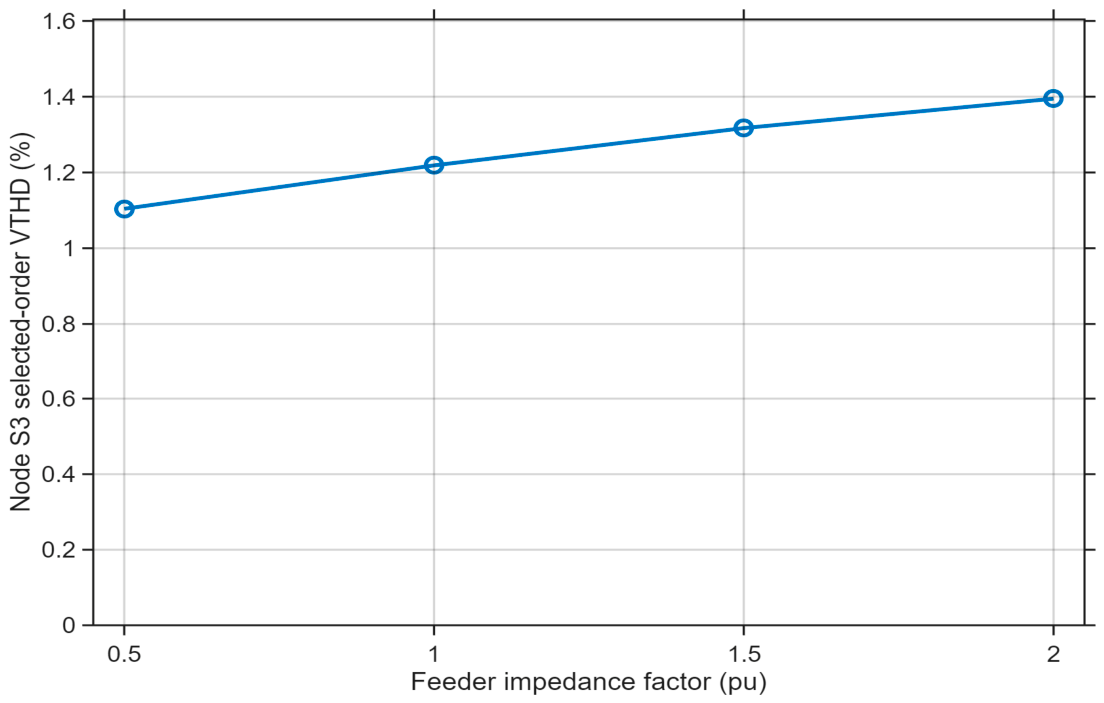
The selected-order Node S3 VTHD results show a clear monotonic sensitivity to feeder impedance. The no-DER base reference C0 exhibits negligible selected-order VTHD of 0.000520%. For the controlled DER-connected comparison, the physical sweep order is C2, C1, C3, and C4.
As shown in Figure 6, Node S3 VTHD increases from 1.1041% in C2 to 1.2187% in C1, 1.3171% in C3, and 1.3948% in C4. The accepted Dyn11 dataset therefore exhibits a monotonic increase across the full 0.5–2.0 pu feeder-impedance sweep.
Figure 6.
Selected-order Node S3 VTHD versus feeder impedance.
The monotonic VTHD increase is consistent with the fact that substantially common DER harmonic currents interact with a progressively larger effective network response at Node S3. Section 4.7 demonstrates this mechanism directly using matched no-DER baseline correction and harmonic transfer impedance.
VTHD remains a network-side voltage-quality indicator rather than a direct measure of transformer thermal severity. The transformer-side current, harmonic-loss, and thermal quantities follow different and much smaller trends, as shown below.
4.5. Transformer-Side Current THD and TDD
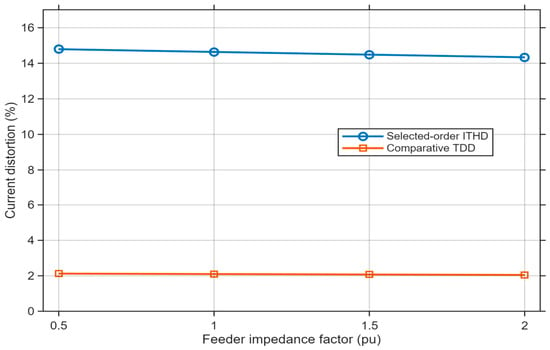
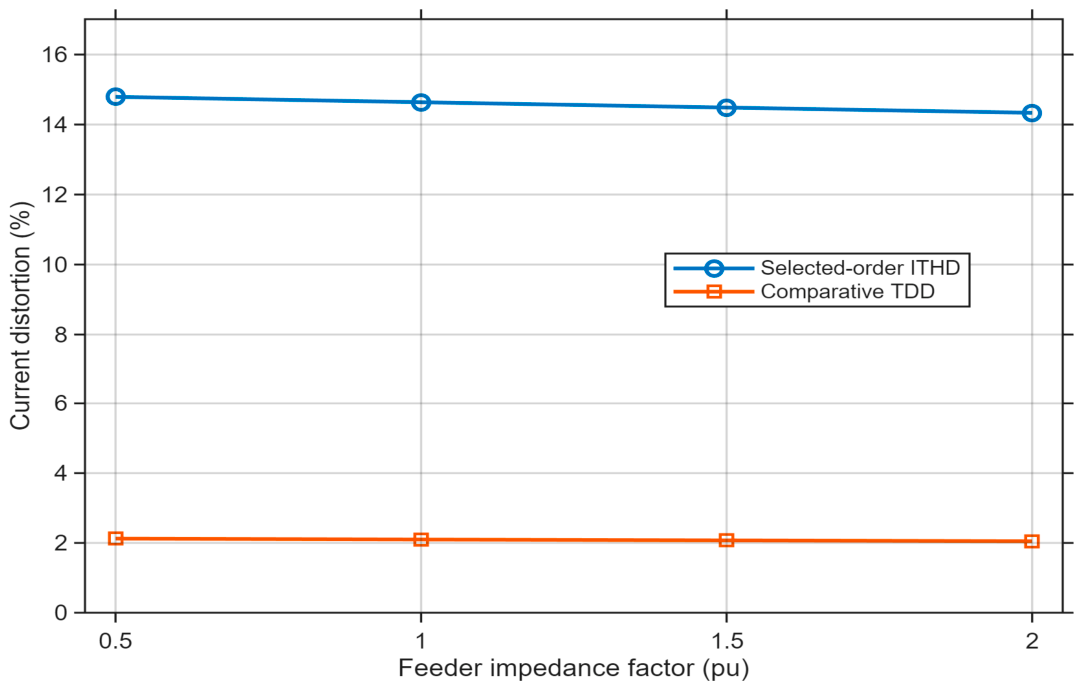
The transformer-side current-distortion results are shown in Figure 7. Current total harmonic distortion (ITHD) and total demand distortion (TDD) are both evaluated at Node S0, but they use different reference currents and therefore provide different information. ITHD is normalized to the fundamental current of the individual operating case, whereas the TDD measure adopted in this study is referenced to the fixed transformer rated LV current of 274.93 A.
Figure 7.
Node S0 selected-order ITHD and transformer-capacity-referenced comparative TDD.
The no-DER reference C0 exhibits negligible selected-order current distortion, with ITHD of 0.000494% and comparative TDD of 0.000148%. With 40% DER connected, ITHD is 14.7915% in C2, 14.6371% in C1, 14.4850% in C3, and 14.3347% in C4.
ITHD therefore decreases modestly as feeder impedance increases across the accepted DER-connected sweep. The values remain elevated in percentage terms because the fundamental transformer current is small under local generation and reverse power. The detailed Node S0 and Node S3 voltage/current magnitudes for h = 1, 5, 7, 11, and 13 are provided in Supplementary Table S1.
The transformer-capacity-referenced comparative TDD values are 2.1239% in C2, 2.0985% in C1, 2.0734% in C3, and 2.0487% in C4. The fixed rated-current denominator avoids the case-specific denominator effect inherent in ITHD and shows that the absolute selected harmonic-current burden relative to transformer capacity changes only slightly across the feeder-impedance sweep.
These values are not presented as IEEE 519 demand-current-reference compliance TDD. IEEE 519-2022 is used as a broader harmonic-assessment context, whereas the present denominator is intentionally the fixed 274.93 A transformer rated LV current for controlled transformer-capacity comparison.
The remote-node VTHD and transformer-side current-distortion trends therefore diverge: Node S3 VTHD increases with feeder impedance, whereas ITHD and comparative TDD decrease modestly. This is direct evidence that a single percentage-distortion measure cannot represent both network voltage sensitivity and transformer current exposure.
4.6. Additional Harmonic Loss Factor and Transformer Consequences
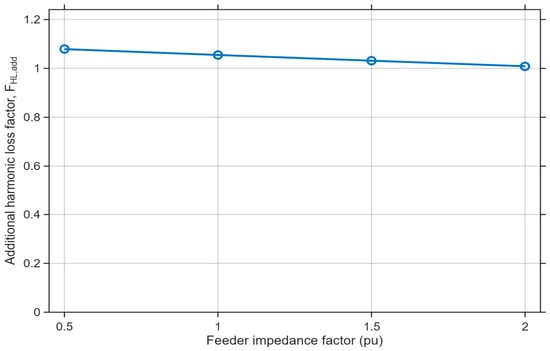
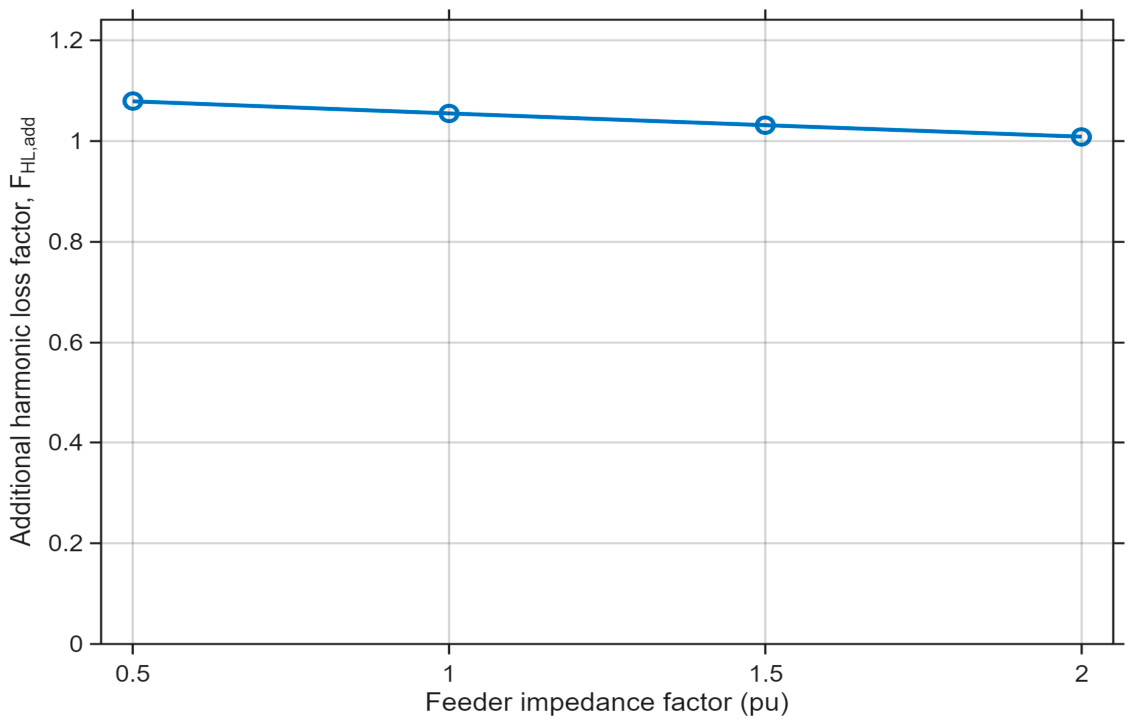
The additional harmonic loss factor, FHL,add, provides a harmonic-order-weighted indication of the transformer-side current spectrum. The no-DER reference value is negligible at 1.427 × 10⁻⁹. For the DER-connected cases, FHL,add is 1.07895 in C2, 1.05492 in C1, 1.03153 in C3, and 1.00872 in C4, as shown in Figure 8.
Figure 8.
Additional harmonic loss factor at Node S0 versus feeder impedance.
FHL,add therefore decreases modestly with increasing feeder impedance in the accepted dataset, even while remote Node S3 VTHD increases. This divergence is physically plausible because the two metrics describe different parts of the system: VTHD reflects the harmonic voltage response of the remote network, whereas FHL,add reflects the harmonic-order weighting of the current spectrum actually flowing through Node S0.
The transformer consequence cannot be inferred from FHL,add alone because the factor acts only on the harmonic-sensitive stray/eddy component, whereas the dominant current-dependent loss components remain governed by actual RMS transformer loading. Table 8 therefore combines FHL,add with the total transformer loss, hot-spot temperature, and common-baseline relative aging.
Table 8.
Transformer consequence for the DER-connected Group C feeder-impedance cases.
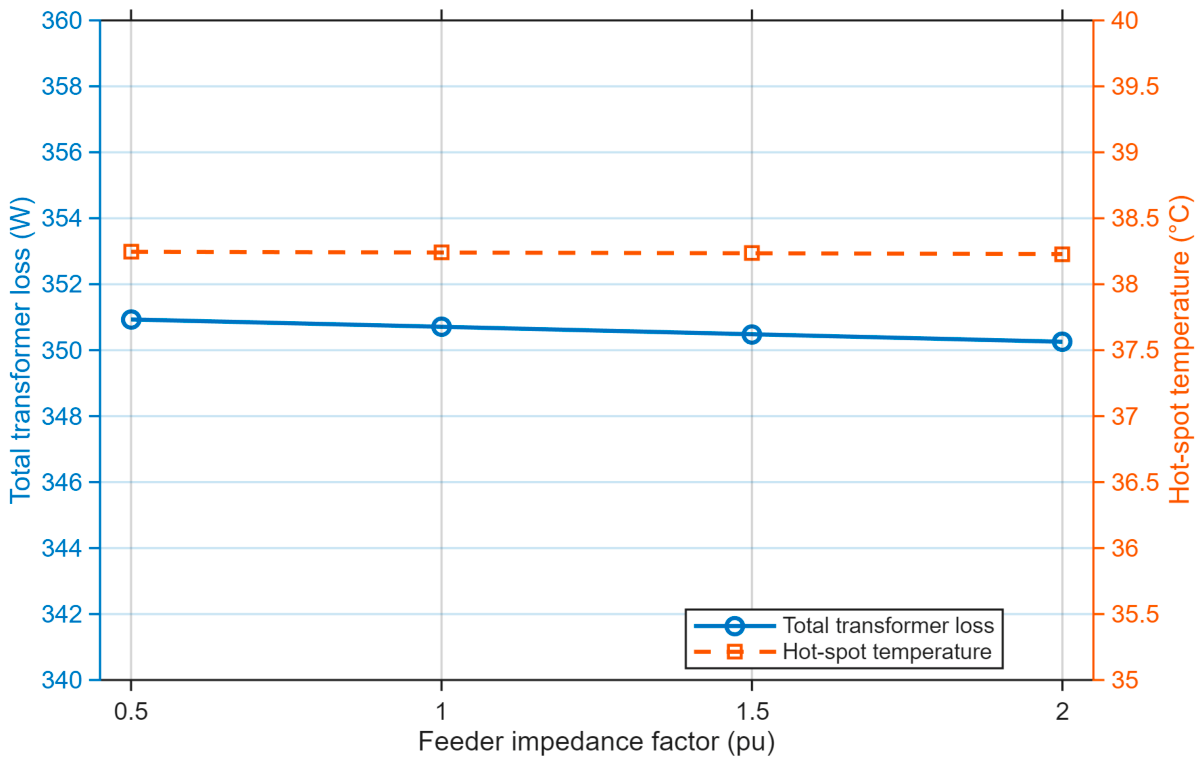
Total transformer loss remains within a very narrow range: 350.932 W in C2, 350.710 W in C1, 350.484 W in C3, and 350.256 W in C4. The case with the highest FHL,add, C2, also has the highest total loss, but the absolute difference across the sweep is less than 1 W because all cases are lightly loaded and the harmonic-sensitive stray/eddy component is small relative to the dominant current-dependent loss structure.
The thermal response is correspondingly small. The hot-spot temperature is 38.246 °C in C2, 38.240 °C in C1, 38.235 °C in C3, and 38.229 °C in C4. Relative aging, normalized to the canonical common Dyn11 no-DER reference, is 0.28708, 0.28683, 0.28658, and 0.28632, respectively. The higher-impedance cases therefore do not develop a higher calculated transformer thermal or aging state under the accepted operating condition.
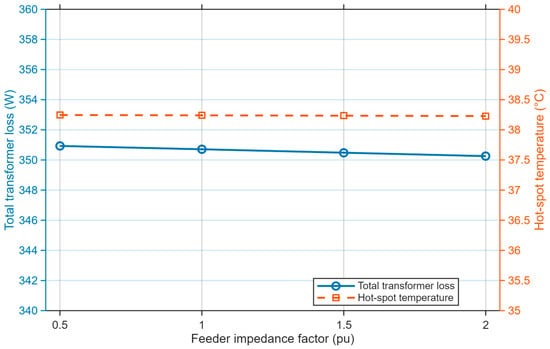
Figure 9 highlights the limited change in absolute transformer consequence across the feeder-impedance sweep. Although the remote-node voltage rise and VTHD increase with feeder impedance, total transformer loss and hot-spot temperatures decrease slightly because the transformer current also decreases slightly. The direct terminal electrical transformer-loss diagnostic used for the component P/Q balance is retained separately in the supplementary evidence and is not added to, or substituted for, the thermal-model total loss shown here.
Figure 9.
Total transformer loss and hot-spot temperature versus feeder impedance.
The Group C results therefore demonstrate that network power-quality severity and transformer thermal severity are related but non-equivalent. Feeder impedance materially changes the Node S3 voltage response, whereas transformer thermal consequence is determined by the current and harmonic spectrum actually flowing through Node S0, together with the transformer-specific loss structure. This interpretation is consistent with transformer thermal studies showing stronger harmonic-temperature effects at higher loading [14,15]; the present transformer remains lightly loaded, which explains the comparatively small thermal variation.
4.7. Harmonic Transfer-Impedance Mechanism
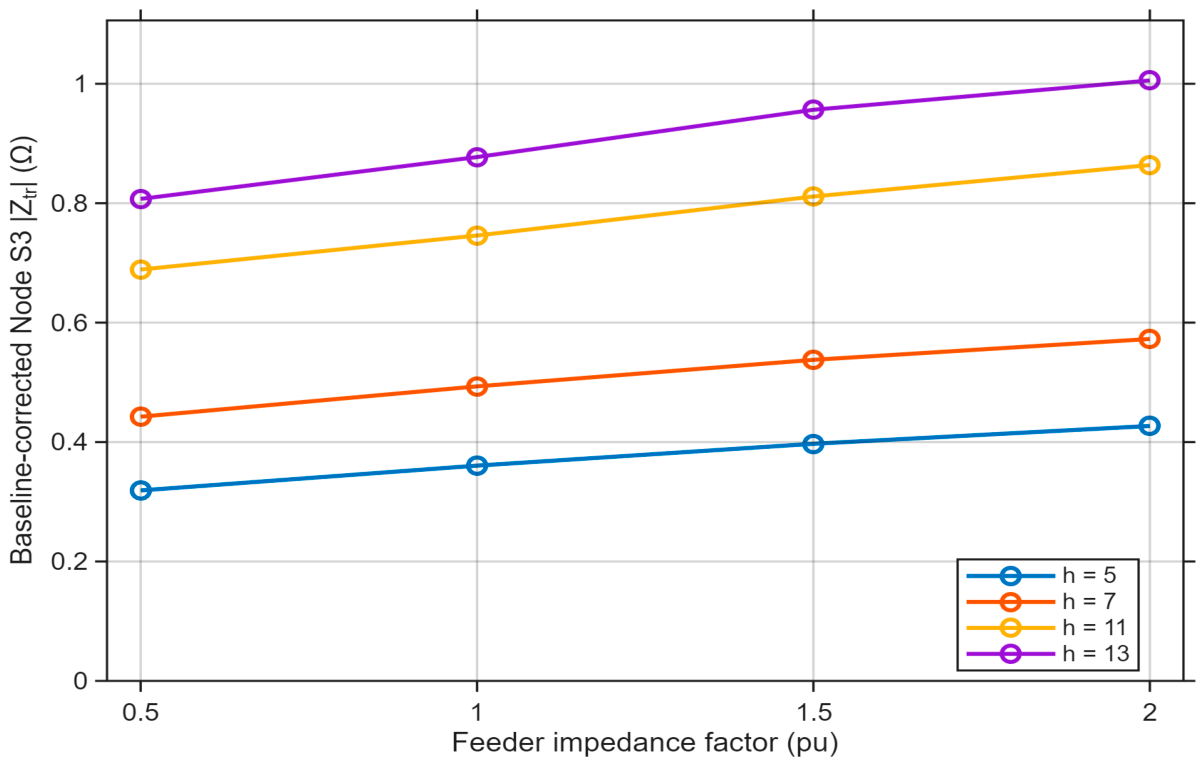
To test whether the Node S3 VTHD trend is attributable to network response rather than to increasing harmonic-current injection, each DER-connected case was paired with a zero-injection no-DER reference at the same feeder-impedance factor. The baseline harmonic voltage was subtracted before calculating the sequence-domain transfer magnitude |Ztr| = |ΔVh|/|Ih|. The factor-1 reference uses the canonical no-DER baseline, while matched accepted zero-injection references were used for 0.5, 1.5, and 2.0 pu.
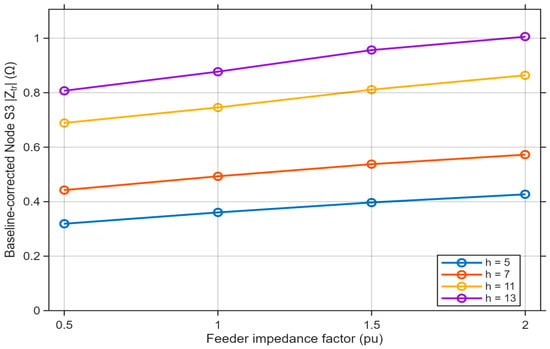
Figure 10 shows that the baseline-corrected effective Node S3 transfer impedance increases monotonically with feeder impedance at every assessed harmonic. From C2 to C4, |Ztr| increases from 0.319 to 0.427 Ω at the fifth harmonic, 0.443 to 0.573 Ω at the seventh, 0.689 to 0.864 Ω at the eleventh, and 0.807 to 1.006 Ω at the 13ththirteenth. The corresponding injected sequence-current magnitudes remain substantially common across C1–C4. This evidence is consistent with a feeder-impedance-driven harmonic voltage-response mechanism and explains why Node S3 VTHD increases while transformer-side current distortion and thermal consequences do not.
Figure 10.
Baseline-corrected effective Node S3 harmonic transfer impedance versus feeder impedance.
The transfer-impedance quantity is an effective network-response measure for the controlled simulation and should not be interpreted as the physical feeder R + jX alone or as a direct measurement of transformer impedance. It provides mechanism-based simulation evidence rather than field experimental validation.
4.8. Engineering Interpretation and Utility Implications
The completed results support a two-domain engineering interpretation. Weak-grid studies have shown that larger effective network impedance can amplify harmonic-voltage response [16], while transformer studies show that harmonic thermal severity depends strongly on the loading, spectrum, and transformer loss structure [14,15]. The present results connect these mechanisms: feeder impedance increases the remote voltage response, but the transformer remains lightly loaded, and its absolute loss and temperature change very little.
Table 9 provides a study-specific decision guide. It is intentionally diagnostic rather than threshold-based: the impedance factors in this study are comparative parameters, and practical interventions should be selected using site-specific voltage, harmonic, loading, and equipment data, together with applicable utility criteria.
Table 9.
Diagnostic interpretation and utility response for feeder-impedance studies.
The Group C case itself is voltage-dominated rather than transformer-thermal-dominated: remote voltage rise, VTHD, and effective harmonic transfer impedance increase with feeder impedance, whereas transformer loading, total loss, hot-spot temperature, and relative aging remain low and comparatively stable. This distinction prevents a weak-feeder diagnosis from being converted automatically into a transformer-overheating conclusion.
5. Conclusions
This paper investigated feeder-impedance sensitivity in a controlled DER-rich LV network using a factory-matched Dyn11 distribution-transformer model. Feeder resistance and inductance were co-scaled while the DER penetration, DER location, source condition, load distribution, and prescribed selected-harmonic spectrum were retained. The final results demonstrate that feeder impedance is a strong network-voltage sensitivity variable but not a direct surrogate for transformer thermal severity.
The clearest response occurs at Node S3. Across the 0.5–2.0 pu DER-connected sweep, Node S3 line-to-line RMS voltage increases from 420.45 V to 428.95 V, the voltage-rise magnitude increases from 3.03 V to 11.55 V, and selected-order VTHD increases monotonically from 1.104% to 1.395%. Matched no-DER baseline correction shows that the effective Node S3 harmonic transfer impedance also increases monotonically at the fifth, seventh, eleventh, and thirteenth harmonics. The voltage-distortion trend is therefore consistent with a feeder-impedance-driven harmonic voltage-response mechanism under substantially common injected harmonic currents.
Transformer-side behavior follows a different pattern. All DER-connected cases remain in reverse power, with loading confined to 14.44–14.52%. Node S0 ITHD and transformer-capacity-referenced comparative TDD decrease modestly with feeder impedance rather than increasing with Node S3 VTHD. This confirms that percentage current distortion and remote-node voltage distortion describe different physical exposures and should not be used interchangeably.
FHL,add likewise decreases from 1.07895 at 0.5 pu to 1.00872 at 2.0 pu. More importantly, the complete transformer consequence remains small: total loss changes only from 350.932 W to 350.256 W, hot-spot temperature from 38.246 °C to 38.229 °C, and common-baseline relative aging from 0.28708 to 0.28632. FHL,add is therefore best interpreted as one input to the harmonic-sensitive transformer-loss calculation, not as a stand-alone indicator of heating, aging, or loss of life.
The principal engineering conclusion is that network power-quality severity and transformer thermal severity are related but non-equivalent assessment domains. A feeder condition that is more severe from a remote-voltage or VTHD perspective is not necessarily more severe from a transformer loading, harmonic-loss, or thermal perspective. DER connection studies should therefore retain network-side indicators, including remote-node voltage and harmonic voltage response, separately from transformer-side current, spectrum, loading, loss, and thermal indicators.
For distribution utilities, the practical implication is to diagnose the dominant concern before selecting mitigation. A voltage-dominated case should trigger feeder-voltage, conductor-impedance, reactive-power, and harmonic-network assessment; a transformer-dominated case should trigger transformer loading, current spectrum, loss/derating, and cooling assessment. When both domains are elevated, coordinated network and transformer mitigation is required. The feeder-impedance factors used here remain comparative study parameters and should not be converted into universal utility thresholds.
The conclusions are limited to the balanced radial feeder, the 200 kVA transformer, fixed 40% DER penetration at Node S3, the prescribed fifth, seventh, eleventh, and thirteenth harmonic spectrum, and the assessed loading condition. Inter-harmonics, switching-frequency components, background distortion and broadband resonance, phase unbalance, neutral-current effects, adjacent feeders, and field-system statistical variability were not modeled. Future work should extend the analysis to measured or site-specific feeders, broader and manufacturer-specific spectra, unbalanced operation, frequency-dependent network models, formal uncertainty assessment, and field validation.
Supplementary Materials
The following supporting information can be downloaded at: https://www.mdpi.com/article/10.3390/su182010503/s1. Table S1: Node S0/S3 selected spectra for h = 1, 5, 7, 11, and 13; Table S2: Accepted DER operating points; Table S3: Component-level and whole-system P/Q balance; Table S4: Matched no-DER evidence; Table S5: Baseline-corrected harmonic transfer-impedance results.
Author Contributions
Conceptualization, F.B.; methodology, F.B.; software, F.B.; validation, F.B., M.K. and A.S.; formal analysis, F.B.; investigation, F.B.; resources, F.B.; data curation, F.B.; writing—original draft preparation, F.B.; writing—review and editing, F.B., M.K. and A.S.; visualization, F.B.; supervision, M.K. and A.S.; project administration, F.B. All authors have read and agreed to the published version of the manuscript.
Funding
This research received no external funding.
Institutional Review Board Statement
Not applicable.
Informed Consent Statement
Not applicable.
Data Availability Statement
The numerical data supporting the results of this study, including selected harmonic spectra, accepted DER operating points, component-level and whole-system P/Q balance, matched no-DER reference data, and harmonic transfer-impedance results, are provided in the accompanying Supplementary Material. Additional model and simulation records are available from the corresponding author upon reasonable request.
Conflicts of Interest
The authors declare no conflicts of interest.
Abbreviations
The following abbreviations are used in this manuscript:
| DER | Distributed energy resource |
| FHL | Harmonic loss factor |
| LV | Low voltage |
| PV | Photovoltaic |
| RMS | Root mean square |
| TDD | Total demand distortion |
| THD | Total harmonic distortion |
| Ztr | Baseline-corrected effective harmonic transfer impedance |
References
- Horowitz, K.; Peterson, Z.; Coddington, M.; Ding, F.; Sigrin, B.; Saleem, D.; Baldwin, S.E.; Lydic, B.; Stanfield, S.C.; Enbar, N.; et al. An Overview of Distributed Energy Resource (DER) Interconnection: Current Practices and Emerging Solutions; NREL/TP-6A20-72102; National Renewable Energy Laboratory: Golden, CO, USA, 2019. [Google Scholar] [CrossRef] [Scilit]
- Bollen, M.H.J.; Häger, M. Power quality: Interactions between distributed energy resources, the grid, and other customers. Leonardo Energy 2005, 1, 1–20. Available online: https://www.diva-portal.org/smash/get/diva2:981522/FULLTEXT01.pdf (accessed on 12 July 2026).
- IEEE Std 519-2022; IEEE Standard for Harmonic Control in Electric Power Systems. IEEE: New York, NY, USA, 2022. [CrossRef] [Scilit]
- NRS 048-2:2025; Electricity Supply—Quality of Supply—Part 2: Voltage Characteristics, Compatibility Levels, Limits and Assessment Methods, 5th ed. NRS Association: Johannesburg, South Africa, 2025.
- NRS 097-2-3:2023; Grid Interconnection of Embedded Generation—Part 2: Small-Scale Embedded Generation—Section 3: Simplified Utility Connection Criteria for Low-Voltage Connected Generators, 2nd ed. NRS Association: Johannesburg, South Africa, 2023.
- IEEE Std C57.110-2018; IEEE Recommended Practice for Establishing Liquid-Immersed and Dry-Type Power and Distribution Transformer Capability when Supplying Nonsinusoidal Load Currents. IEEE: New York, NY, USA, 2018. [CrossRef] [Scilit]
- IEEE Std C57.91-2011; IEEE Guide for Loading Mineral-Oil-Immersed Transformers and Step-Voltage Regulators. IEEE: New York, NY, USA, 2012. [CrossRef] [Scilit]
- CIGRÉ Joint Working Group C4/B4.38. Network Modelling for Harmonic Studies; Technical Brochure 766; CIGRÉ: Paris, France, 2019. [Google Scholar]
- Bennie, F.; Khan, M.; Swanson, A. Assessment of harmonic distortion compliance in South African distribution networks under increasing penetration of distributed energy resources. Eng. Proc. 2026, 140, 40. [Google Scholar] [CrossRef] [Scilit]
- Ahsan, S.M.; Khan, H.A.; Hussain, A.; Tariq, S.; Zaffar, N.A. Harmonic analysis of grid-connected solar PV systems with nonlinear household loads in low-voltage distribution networks. Sustainability 2021, 13, 3709. [Google Scholar] [CrossRef] [Scilit]
- Vinayagam, A.; Aziz, A.; Balasubramaniyam, P.M.; Chandran, J.; Veerasamy, V.; Gargoom, A. Harmonics assessment and mitigation in a photovoltaic integrated network. Sustain. Energy Grids Netw. 2019, 20, 100264. [Google Scholar] [CrossRef] [Scilit]
- Yuan, W.; Yuan, X.; Xu, L.; Zhang, C.; Ma, X. Harmonic loss analysis of low-voltage distribution network integrated with distributed photovoltaic. Sustainability 2023, 15, 4334. [Google Scholar] [CrossRef] [Scilit]
- Chidurala, A.; Saha, T.K.; Mithulananthan, N. Harmonic impact of high penetration photovoltaic system on unbalanced distribution networks—Learning from an urban photovoltaic network. IET Renew. Power Gener. 2016, 10, 485–494. [Google Scholar] [CrossRef] [Scilit]
- Seddik, M.S.; Eteiba, M.B.; Shazly, J. Evaluating the harmonic effects on the thermal performance of a power transformer. Energies 2024, 17, 4871. [Google Scholar] [CrossRef] [Scilit]
- Costa, M.C.; Fortes, M.Z.; Sotelo, G.G.; França, B.W. Thermal effects due to harmonics on dry-type transformers: Impact of filters and phase angles. Meas. Energy 2025, 6, 100045. [Google Scholar] [CrossRef] [Scilit]
- Zhao, E.; Han, Y.; Lin, X.; Liu, E.; Yang, P.; Zalhaf, A.S. Harmonic characteristics and control strategies of grid-connected photovoltaic inverters under weak grid conditions. Int. J. Electr. Power Energy Syst. 2022, 142, 108280. [Google Scholar] [CrossRef] [Scilit]
- IEEE Std C57.91-2025; IEEE Guide for Loading Mineral-Oil-Immersed Transformers and Step-Voltage Regulators. IEEE: New York, NY, USA, 2026.
- IEC 60076-7:2018; Power Transformers—Part 7: Loading Guide for Mineral-Oil-Immersed Power Transformers, 2nd ed. International Electrotechnical Commission: Geneva, Switzerland, 2018.
- IEC 60076-2:2011; Power Transformers—Part 2: Temperature Rise for Liquid-Immersed Transformers, 3rd ed. International Electrotechnical Commission: Geneva, Switzerland, 2011.
- IEC 60076-14:2013; Power Transformers—Part 14: Liquid-Immersed Power Transformers Using High-Temperature Insulation Materials, 1st ed. International Electrotechnical Commission: Geneva, Switzerland, 2013.

Disclaimer/Publisher’s Note: The statements, opinions and data contained in all publications are solely those of the individual author(s) and contributor(s) and not of MDPI and/or the editor(s). MDPI and/or the editor(s) disclaim responsibility for any injury to people or property resulting from any ideas, methods, instructions or products referred to in the content. |
© 2026 by the authors. Licensee MDPI, Basel, Switzerland. This article is an open access article distributed under the terms and conditions of the Creative Commons Attribution (CC BY) license.