


Abstract
This study examines the effects of global supply chain shocks on inflation in Saudi Arabia, using monthly data from January 2014 to March 2026. Supply chain resilience has emerged as a critical dimension of economic sustainability, yet its inflationary consequences in commodity-dependent economies remain insufficiently understood. The analysis applies both Structural Vector Autoregression (SVAR) and Local Projection (LP) models to estimate impulse response functions. Inflation is measured using the wholesale price index (WPI) and its primary components. Findings from both methodologies are consistent, demonstrating that global supply chain shocks have positive, statistically significant impacts on most measures of wholesale price inflation in the short to medium term. The magnitude and persistence of these effects differ across components. In proportional terms, the most pronounced responses are found in ores and minerals and agricultural products—sectors closely tied to food security and sustainable resource management. However, their contribution to the aggregate WPI depends on their relative weights, with higher-weight categories, particularly metal products, machinery and equipment and food-related products, contributing more to aggregate wholesale price movements. Although the effects diminish in statistical significance over longer horizons, the cumulative responses indicate that supply chain disruptions can leave a persistent upward effect on wholesale price levels across specific categories, even after the direct inflationary impulse has subsided. These findings underscore the importance of building supply chain resilience as part of broader strategies for sustainable economic stability, with direct implications for monetary policy and inflation management in resource-dependent economies.
1. Introduction
Many academics and policymakers are concerned with the factors that drive inflation. Inflation undermines the purchasing power of households, with the impact falling hardest on lower-income groups, while also raising input costs for enterprises, squeezing profit margins, and delaying investment decisions. Sustained increases in prices can make monetary policy more difficult to conduct, threaten exchange-rate stability, and, when severe, cause wider social and economic turmoil. In countries that are dependent on imports, these effects are further exacerbated since foreign price shocks in food, energy and industrial inputs are swiftly translated into domestic cost pressures with wide-ranging distributional ramifications. Traditional factors, such as money supply, oil prices, and food prices, are considered the primary contributors. However, following the COVID-19 pandemic, global economies experienced a significant rise in inflation. In addition to these conventional factors, various external events—particularly shocks to global supply chains—have contributed significantly to inflationary pressures. Before the pandemic, policymakers and scholars largely neglected the inflationary impact of global supply chain bottlenecks, but a growing body of literature has since emerged to investigate the effects of supply chain disruptions on inflation, consistently finding that they have a significant impact [1,2,3].
The containment measures implemented during COVID-19 caused imbalances between supply and demand, resulting in raw material and labour shortages, congestion at ports and factories, reduced inventory levels, manufacturing delays, and increased transportation costs. All these factors led to higher production costs, elevated demand pressures, and, ultimately, a rise in prices [4]. Supply chain disruptions can therefore affect inflation through cost-push channels or aggregate demand channels. The unpredictability of such disruptions poses significant challenges for monetary authorities. Andriantomanga et al. [5] emphasised that this situation can become entrenched, generating expectations of persistently high inflation, which in turn may promote wage increases and produce a spillover effect that drives up prices for non-tradable goods and services. Furthermore, attempts to stabilise inflation during periods of significant supply chain volatility may incur substantial economic costs, with implications for the long-term sustainability of monetary policy frameworks.
Carrière-Swallow et al. [6] conducted a study using data from a large panel of countries between 1992 and 2021 and found that supply chain shocks are associated with significant increases in inflation. They concluded that this impact is persistent and more pronounced in countries with higher levels of trade openness and greater reliance on imports. Building on this, the present paper assesses how global supply chain shocks affect inflation in Saudi Arabia. As a major oil-exporting economy that imports a wide range of industrial and consumer goods, Saudi Arabia is particularly vulnerable to disruptions in global supply chains. Such vulnerability has direct implications for the country’s economic sustainability, particularly in the context of Saudi Vision 2030, which seeks to diversify the economy and reduce its dependence on volatile commodity markets. In 2023, its total trade volume, including imports and exports, represented approximately 62% of gross domestic product, reflecting a high degree of dependence on international trade flows. Consequently, understanding how external supply-side shocks translate into domestic inflation is of particular strategic importance for macroeconomic stability, sustainable economic planning, and policy formulation.
The contribution of this paper is twofold. First, only one study has examined the effect of the global supply chain on inflation in the Saudi context (Albahouth [7]), specifically by employing an autoregressive distributed lag model to identify the determinants of inflation in the country. This paper diverges from Albahouth [7]’s work by implementing structural vector autoregression (SVAR) and local projection (LP) models to estimate how inflation responds to a positive shock from global supply chain disruptions.
Second, previous empirical works (e.g., Albahouth [7]; Diaz et al. [8]; Wang [9]; Andriantomanga, Bolhuis and Hakobyan [5]; Benigno, Di Giovanni, Groen and Noble [2]; LaBelle and Santacreu [10]) have measured inflation using various indices, such as the headline Consumer Price Index (CPI), core CPI, or producer price index (PPI). This paper is the first to examine the effect of supply chain shocks on inflation measured using the wholesale price index (WPI) and its components.
Wang [9], Carrière-Swallow, Deb, Furceri, Jiménez and Ostry [6], and Benigno, Di Giovanni, Groen and Noble [2] found that the effect of supply chain shocks on inflation measured using the PPI is higher, more persistent, and more pronounced than that measured using the CPI. This is because supply chain shocks typically lead to an initial increase in production costs, which directly affect the PPI, before being passed through to consumers via the CPI. Given that the WPI measures the average change in the prices of raw materials, intermediate goods, and final goods at the wholesale level—before they reach consumers—the effects of supply chain shocks are directly reflected in the WPI before being observed indirectly in the CPI. This makes the WPI a particularly relevant measure for understanding the sustainability of price stability and the transmission of external shocks through the supply chain. Therefore, this paper uses the WPI to measure inflation. The results show that global supply chain shocks have a significant positive impact on the inflation rate in Saudi Arabia.
Sustainability implications of supply-chain inflation cover various measurable areas of sustainable development. Persistent pressures on wholesale food prices undermine food security in heavily import-dependent nations, and energy price shocks increase the social cost of the clean-energy transition and complicate the financial case for managed price adjustments. Against this background, this paper examines how global supply-chain shocks are transmitted across the WPI and its components, providing sector-level evidence on the sensitivity of wholesale prices to external supply disruptions and their broader sustainability implications. In doing so, the paper moves beyond the rhetorical association between price stability and sustainable development to a measurable, sector-level linkage.
The remainder of this paper is organised as follows. A brief overview of the relevant literature is provided in Section 2, followed by a description of the data and econometric methodologies in Section 3. Section 4 presents the empirical results, while Section 5 provides a discussion of the findings. Section 6 concludes with policy implications and directions for future research.
2. Literature Review
Studies concerning the impact of supply chain disruptions on inflation are limited; however, following the COVID-19 pandemic, policymakers and scholars have shown increased interest in investigating the magnitude and significance of these shocks on inflation rates. Most of these studies have concentrated on advanced economies, with relatively few focusing on emerging or developing economies, a gap that carries important implications for sustainable development, given that these economies are often more exposed to external supply-side vulnerabilities. For instance, LaBelle and Santacreu [10] and Díaz Aguiluz, Cunado and Pérez de Gracia [3] concluded that exposure to global supply chain shocks has a significant impact on inflation in the US. Furthermore, Liu and Nguyen [11] used the LP approach and found that supply chain shocks have a significant positive impact on inflation in the US, highlighting production costs and import prices as the two major channels.
Meanwhile, Diaz, Cunado and de Gracia [8] examined the impact of global supply chain disruptions on the inflation rates of Germany, Japan, the UK, and the US. Their results, based on the impulse response function, indicated that global supply chain shocks have a significant and persistent impact on inflation in Germany, the UK, and the US but not in Japan. These findings are consistent with those observed by Benigno, Di Giovanni, Groen and Noble [2], who also found that supply chain shocks have a positive and persistent effect on inflation in Europe and the US. Similarly, Ascari, Bonam and Smadu [4] showed that the impact of global supply-chain pressure shocks on inflation in Europe is hump-shaped and persistent. Tillmann [12] conducted a study on a panel of 28 European economies, concluding that supply chain shocks have a substantial impact on inflation rates. However, the findings indicated that positive shocks have a substantially more significant and persistent effect than negative shocks.
In a wider cross-country analysis, Yilmazkuday [13] investigates inflationary dynamics in 58 emerging markets and finds that global turbulence and supply-chain pressures are significant cost-push factors for inflation in a range of developing-country contexts, indicating that the transmission mechanisms noted in regional studies are suggestive of a more general emerging-market pattern. Furthermore, Medina-Espidio [14] shows at the country level that global supply-chain disruptions increase inflation-at-risk in Mexico, highlighting the greater vulnerability of import-dependent emerging economies to external supply-side shocks.
Outside advanced economies, Platitas and Ocampo [15] investigated the inflationary impact of global supply chain pressures on selected East Asian countries using an LP model. They found significant inflationary impacts of global supply chain pressures on headline inflation and tradable inflation, which are large and persistent. By contrast, non-tradable inflation exhibited only minor and transitory reactions to global supply-chain pressure shocks, which were not statistically significant. In addition, Andriantomanga, Bolhuis and Hakobyan [5] studied the inflationary effects of global supply chain pressures in sub-Saharan Africa and found that the inflation response to global supply chain pressures is significant and persistent. In addition, supply chain shocks have a greater impact on the tradable components of the CPI basket such as food and agricultural products that are strongly tied to food security and the accomplishment of sustainable development goals in lower-income economies. Extending this to a comparative context, Ye et al. [16] examined the joint effect of global supply chain pressures and oil prices on inflation across both advanced and emerging economies, finding asymmetric long-run effects whereby supply chain disruptions produce stronger short-run inflationary impacts in advanced economies, while emerging market economies face distinct structural vulnerabilities to sustained supply-side pressures. In this regard, Saidi et al. [17] emphasise that building sustainable and resilient supply chains is a critical priority for emerging economies, as their greater exposure to external disruptions poses ongoing risks to both economic stability and long-term sustainable development.
Despite this growing body of international evidence, the literature specifically examining supply chain shocks and inflation within Saudi Arabia and the broader Gulf Cooperation Council (GCC) region remains limited. Prior research on Saudi and GCC inflation has primarily focused on traditional macroeconomic determinants. Fareed, et al. [18] demonstrated that imported inflation from key trading partners and the nominal effective exchange rate are the primary drivers of GCC inflation, while direct commodity price pass-through is limited once trading-partner inflation is accounted for. Similarly, Basher and Elsamadisy [19] found that money supply and foreign prices better explain long-run inflation dynamics across GCC countries. At the country level, Al-Khathlan [20] identified world inflation, currency depreciation, and supply-side bottlenecks as the major long-run determinants of Saudi inflation, while Jawad [21] confirmed that world commodity and food prices exert positive long-run pressure on the Saudi CPI. Collectively, these studies establish the important role of external factors in driving domestic inflation in Saudi Arabia, but none explicitly examines global supply chain disruptions as a distinct inflationary driver.
A related strand of the literature has examined the differential transmission of supply chain shocks through various price indices, providing further motivation for the use of the WPI in the present study. It identified global supply chain and energy shocks as major contributors to post-pandemic core inflation and demonstrated that supply chain shocks raise producer prices more substantially than consumer prices, implying asymmetric pass-through across price indices. Complementing this, Finck and Tillmann [22] used firm-level data to confirm that supply chain disruptions are more directly and immediately reflected in producer and wholesale prices than in the CPI. These findings reinforce the rationale for using the WPI as the primary inflation measure in this study, as it captures the effects of supply chain disruptions at the point where they first manifest—before being partially absorbed or delayed in their transmission to consumer prices.
Collectively, the existing evidence establishes that global supply chain shocks generate significant inflationary pressures across a range of economic contexts. However, the literature remains heavily concentrated on advanced economies, with limited attention paid to commodity-dependent or import-reliant emerging economies where supply chain vulnerabilities may pose distinct risks to economic sustainability. Saudi Arabia represents a particularly instructive case in this regard, combining a high degree of trade openness with an ongoing structural transition toward a more diversified and sustainable economy under Vision 2030. The present study addresses this gap by examining how global supply chain shocks transmit into domestic wholesale price inflation in Saudi Arabia.
3. Data and Methodology
3.1. Data
Monthly data collected between January 2014 and March 2026 are used in this study. Table 1 describes all the variables and lists the sources used in this paper. Global supply chain disruption is measured using the global supply chain pressure index (GSCPI) developed by Benigno, Di Giovanni, Groen and Noble [2], which captures indicators of shipping costs, air freight costs, and supply bottlenecks (see Appendix A). Inflation is measured using multiple indicators: the general WPI (GWPI); the WPI for agriculture and fishery products (AWPI); the WPI for ores and minerals (MWPI); the WPI for food products, beverages, tobacco, and textiles (FWPI); the WPI for metal products, machinery, and equipment (CWPI); and the WPI for other transportable goods (OWPI). The use of disaggregated WPI components—spanning agricultural, mineral, food, industrial, and transport goods—provides a comprehensive picture of price dynamics across sectors central to Saudi Arabia’s economic sustainability agenda and its Vision 2030 diversification objectives.
Table 1.
Variables and Sources.
3.2. Methodology
To examine the dynamic relationship between global supply chain shocks and inflation, an SVAR model is constructed and defined as follows:
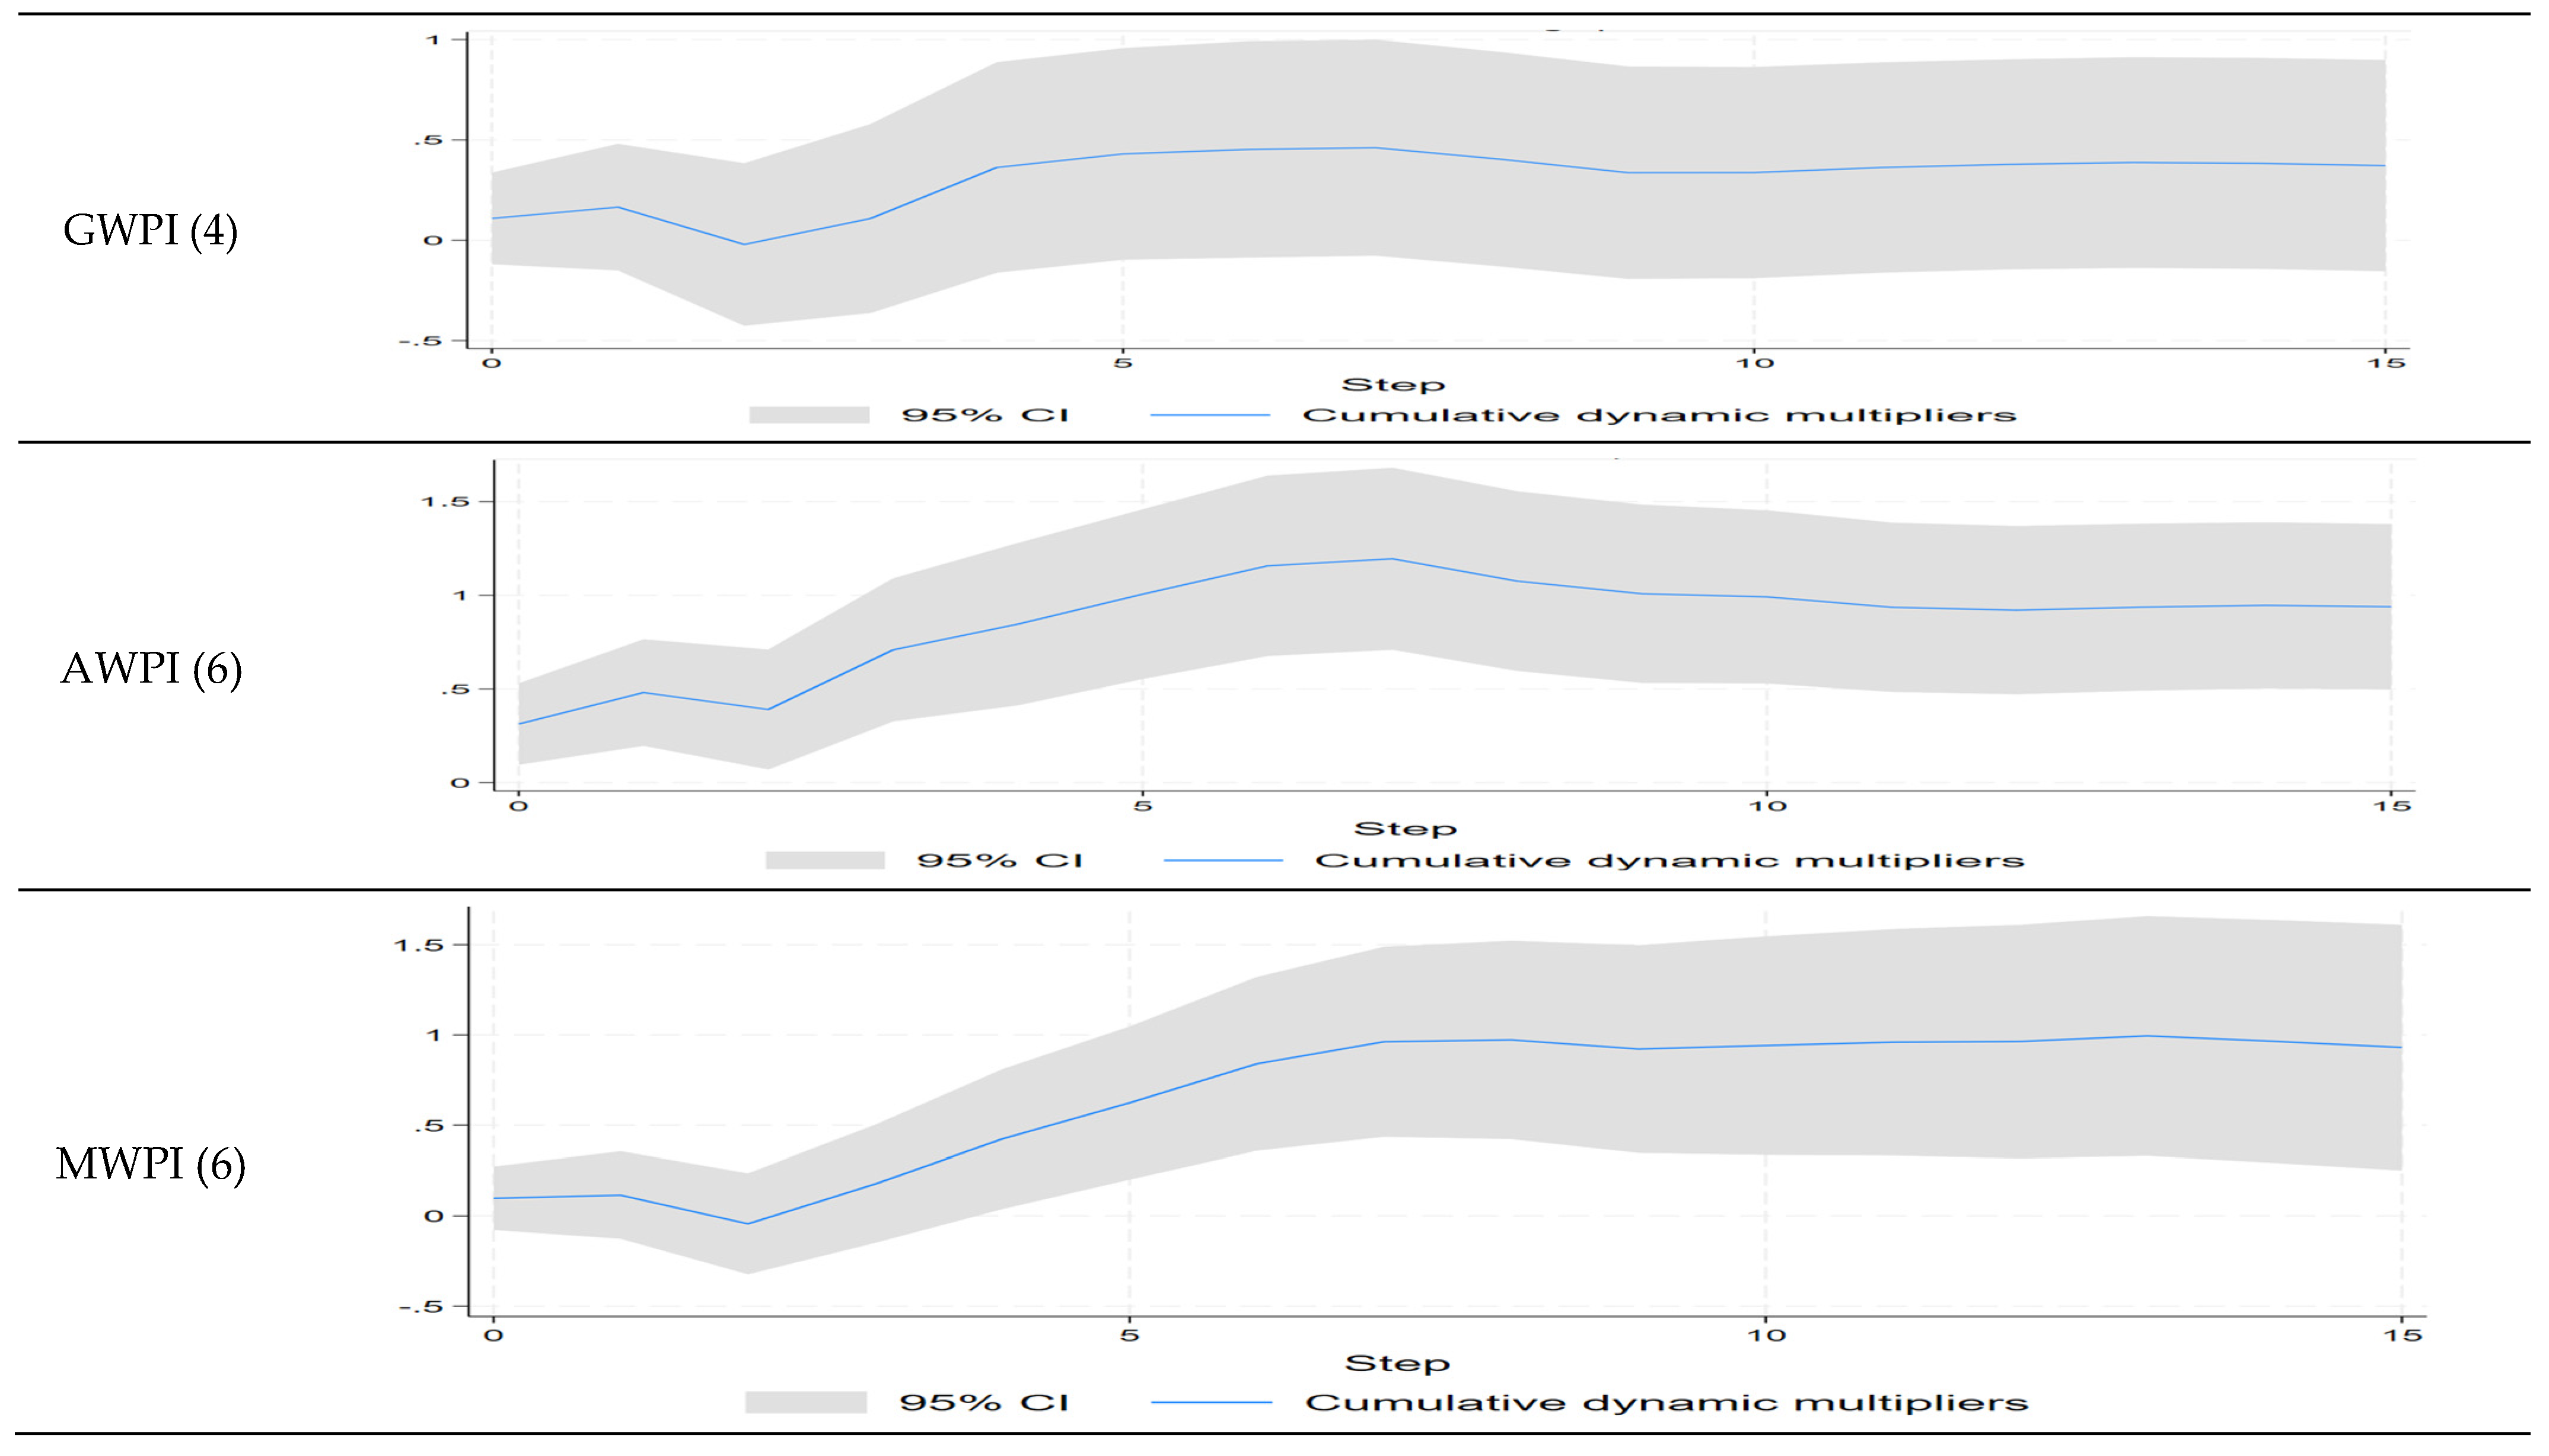
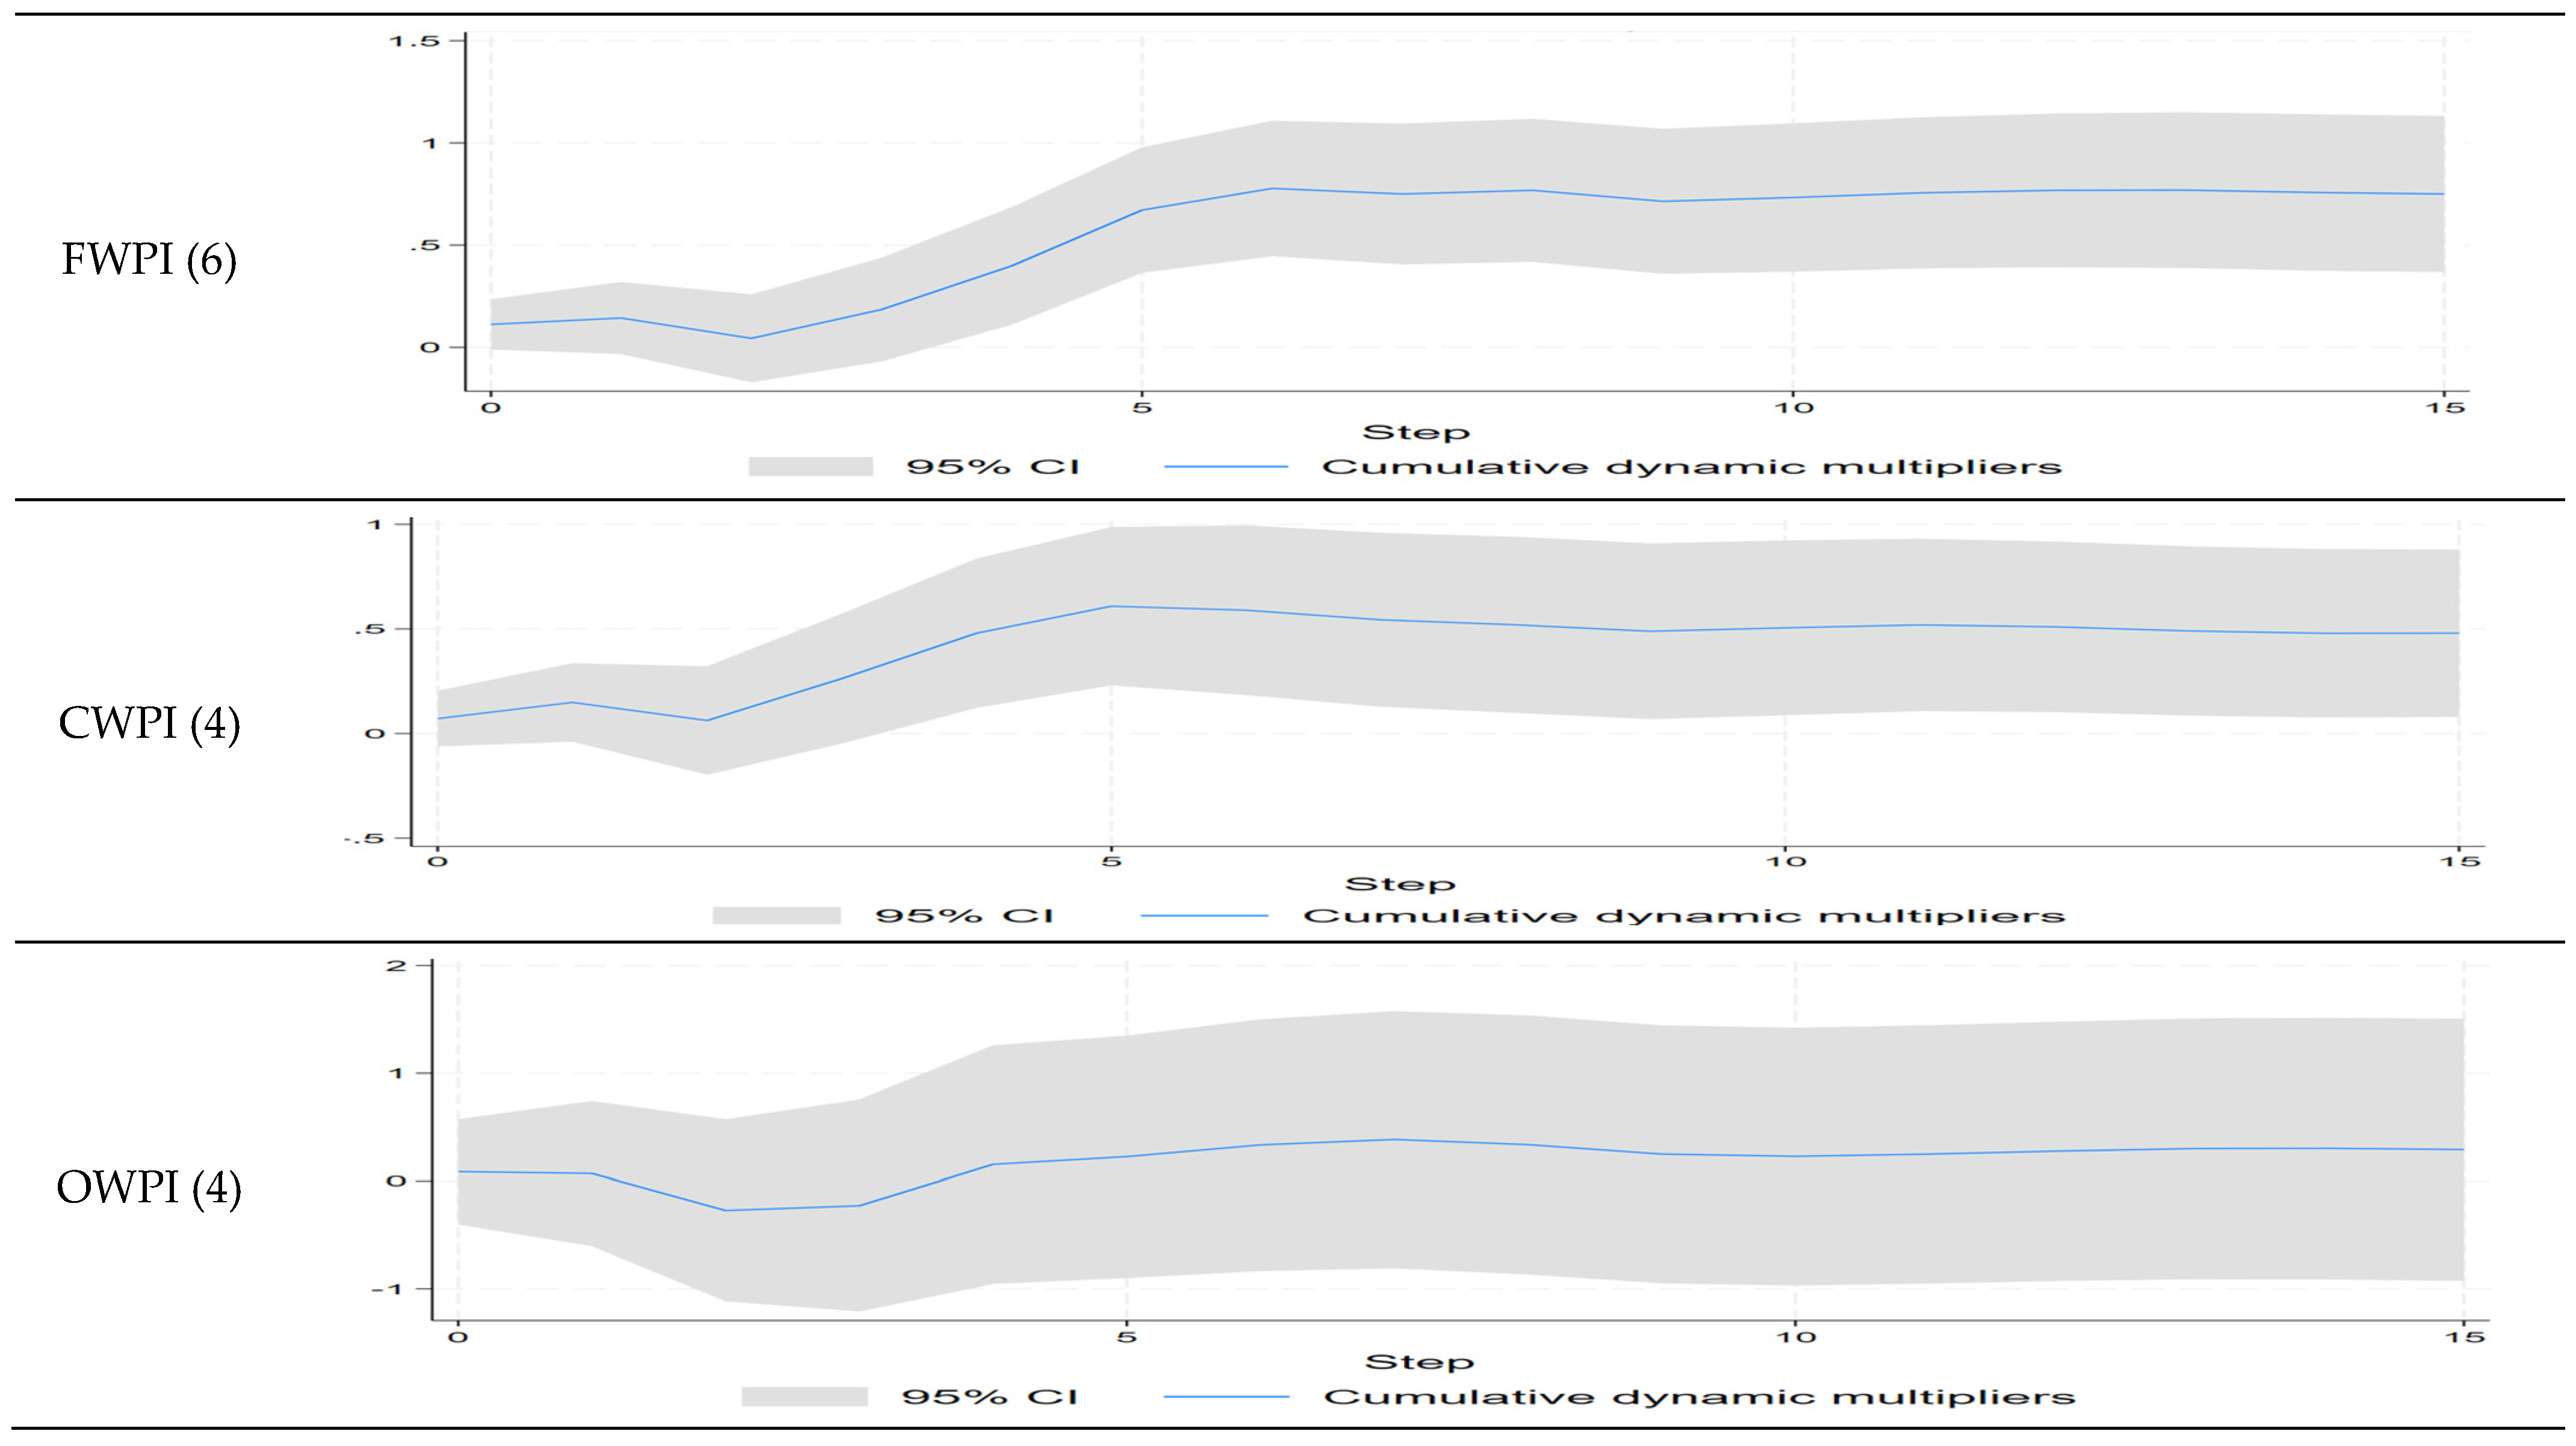
where Yt is a vector of endogenous variables, comprising GSCPIt, dpoilt, dinflationt, drit, and dreert. Moreover, εt and p represent the error term and the lag length, respectively. The lag length is set to 12 to ensure the absence of serial correlation. Before estimation, unit-root tests were conducted and confirmed that the variables are stationary in levels supporting estimation of the SVAR and LP models (see Appendix A). Lag-selection criteria were then examined separately for each inflation specification and suggested different optimal lag lengths across the WPI measures. To maintain a consistent dynamic specification across models, twelve monthly lags are retained in the baseline specification, consistent with the monthly VAR literature. Post-estimation diagnostics confirm that the estimated VARs satisfy the stability condition and show no evidence of residual serial correlation (see Appendix A). As an additional robustness check, models were re-estimated using the optimal lag length selected for each inflation specification. The sectoral responses remain broadly consistent with the baseline results, although the aggregate GWPI response is more sensitive to lag selection (see Appendix A.4 and A.5). (Under the AIC-selected lag specifications, the cumulative SVAR responses of AWPI, MWPI, FWPI, and CWPI remain statistically significant, whereas the cumulative GWPI response under the four-lag specification does not reach statistical significance at the 5% level).
The reduced-form VAR is written as follows:
where . Thus, structural shocks are identified as follows:
Consistent with Diaz, Cunado and de Gracia [8] and Asadollah et al. [23], the GSCPI is positioned first in our SVAR model owing to its global nature; it is predetermined in relation to domestic variables such as inflation rates, interest rates, and exchange rates. Additionally, oil prices are contemporaneously affected by GSCPI shocks, and oil prices can contemporaneously affect all other variables in the model.
Furthermore, in accordance with Diaz, Cunado and de Gracia [8], inflation is contemporaneously affected by shocks from GSCPI and oil prices; however, it is influenced by interest rate shocks and currency shocks with a lag. The real effective exchange rate is ordered as the last variable in our model; thus, it is contemporaneously affected by shocks from all other variables. (To ensure robustness, the model is re-estimated with inflation ordered last, as suggested by Diaz et al. [8]. Altering the order does not affect the results. The corresponding results are reported in Appendix A.6).
Variable ordering highlights key aspects of the Saudi economy’s structure. The GSCPI is prioritized, as global supply chain conditions are unlikely to shift within the same period as domestic macroeconomic variables in Saudi Arabia. Oil prices are positioned second, underscoring the oil sector’s significance and the rapid transmission of oil price shocks to domestic economic conditions. Inflation is sequenced next, allowing domestic prices to respond concurrently to shocks from both global supply chains and oil prices. Domestic financial conditions are assumed to influence the economy with a lag. The REER is placed last, enabling it to respond immediately to all preceding shocks. This approach aligns with Saudi Arabia’s fixed exchange rate regime, where the Saudi riyal is pegged to the US dollar. However, the REER remains adjustable through changes in relative prices and fluctuations in the currencies of trading partners.
Generally, the impulse response functions estimated from LP models are comparable to those calculated from SVAR models, although the LP model may offer more robust estimators because it is less sensitive to the dynamic specification and the IRF estimation methodology [9,24,25]. Thus, the LP model proposed by Jordà [26] is implemented herein, which takes the following form:
where h represents the response horizon months (h = 15), xt−j represent a set of control variables (dpoil, dri, dreer), and j represents the number of lags used to estimate the model and is set to 12. In addition, following Mignon and Saadaoui [27], the estimated structural supply shocks from Equation (3) are added to our LP model as an exogenous shock. Newey–West standard errors are used to account for potential heteroskedasticity and autocorrelation with fixed lag truncation of 16 applied across all projection horizons.
It should be acknowledged, however, that because Equation (4) uses the estimated structural GSCPI shock derived from the recursive SVAR in Equation (3), the LP exercise provides robustness with respect to the dynamic specification and the IRF estimation methodology, rather than with respect to the underlying structural identification strategy. Both approaches therefore rely on the same recursive ordering assumption, and the consistency between their results should be interpreted accordingly.
4. Results
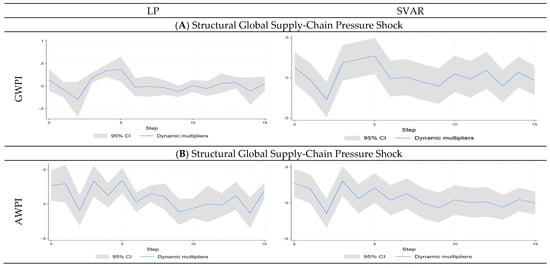
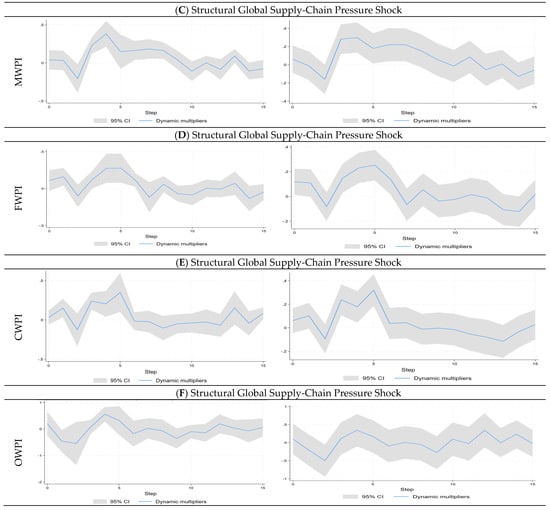
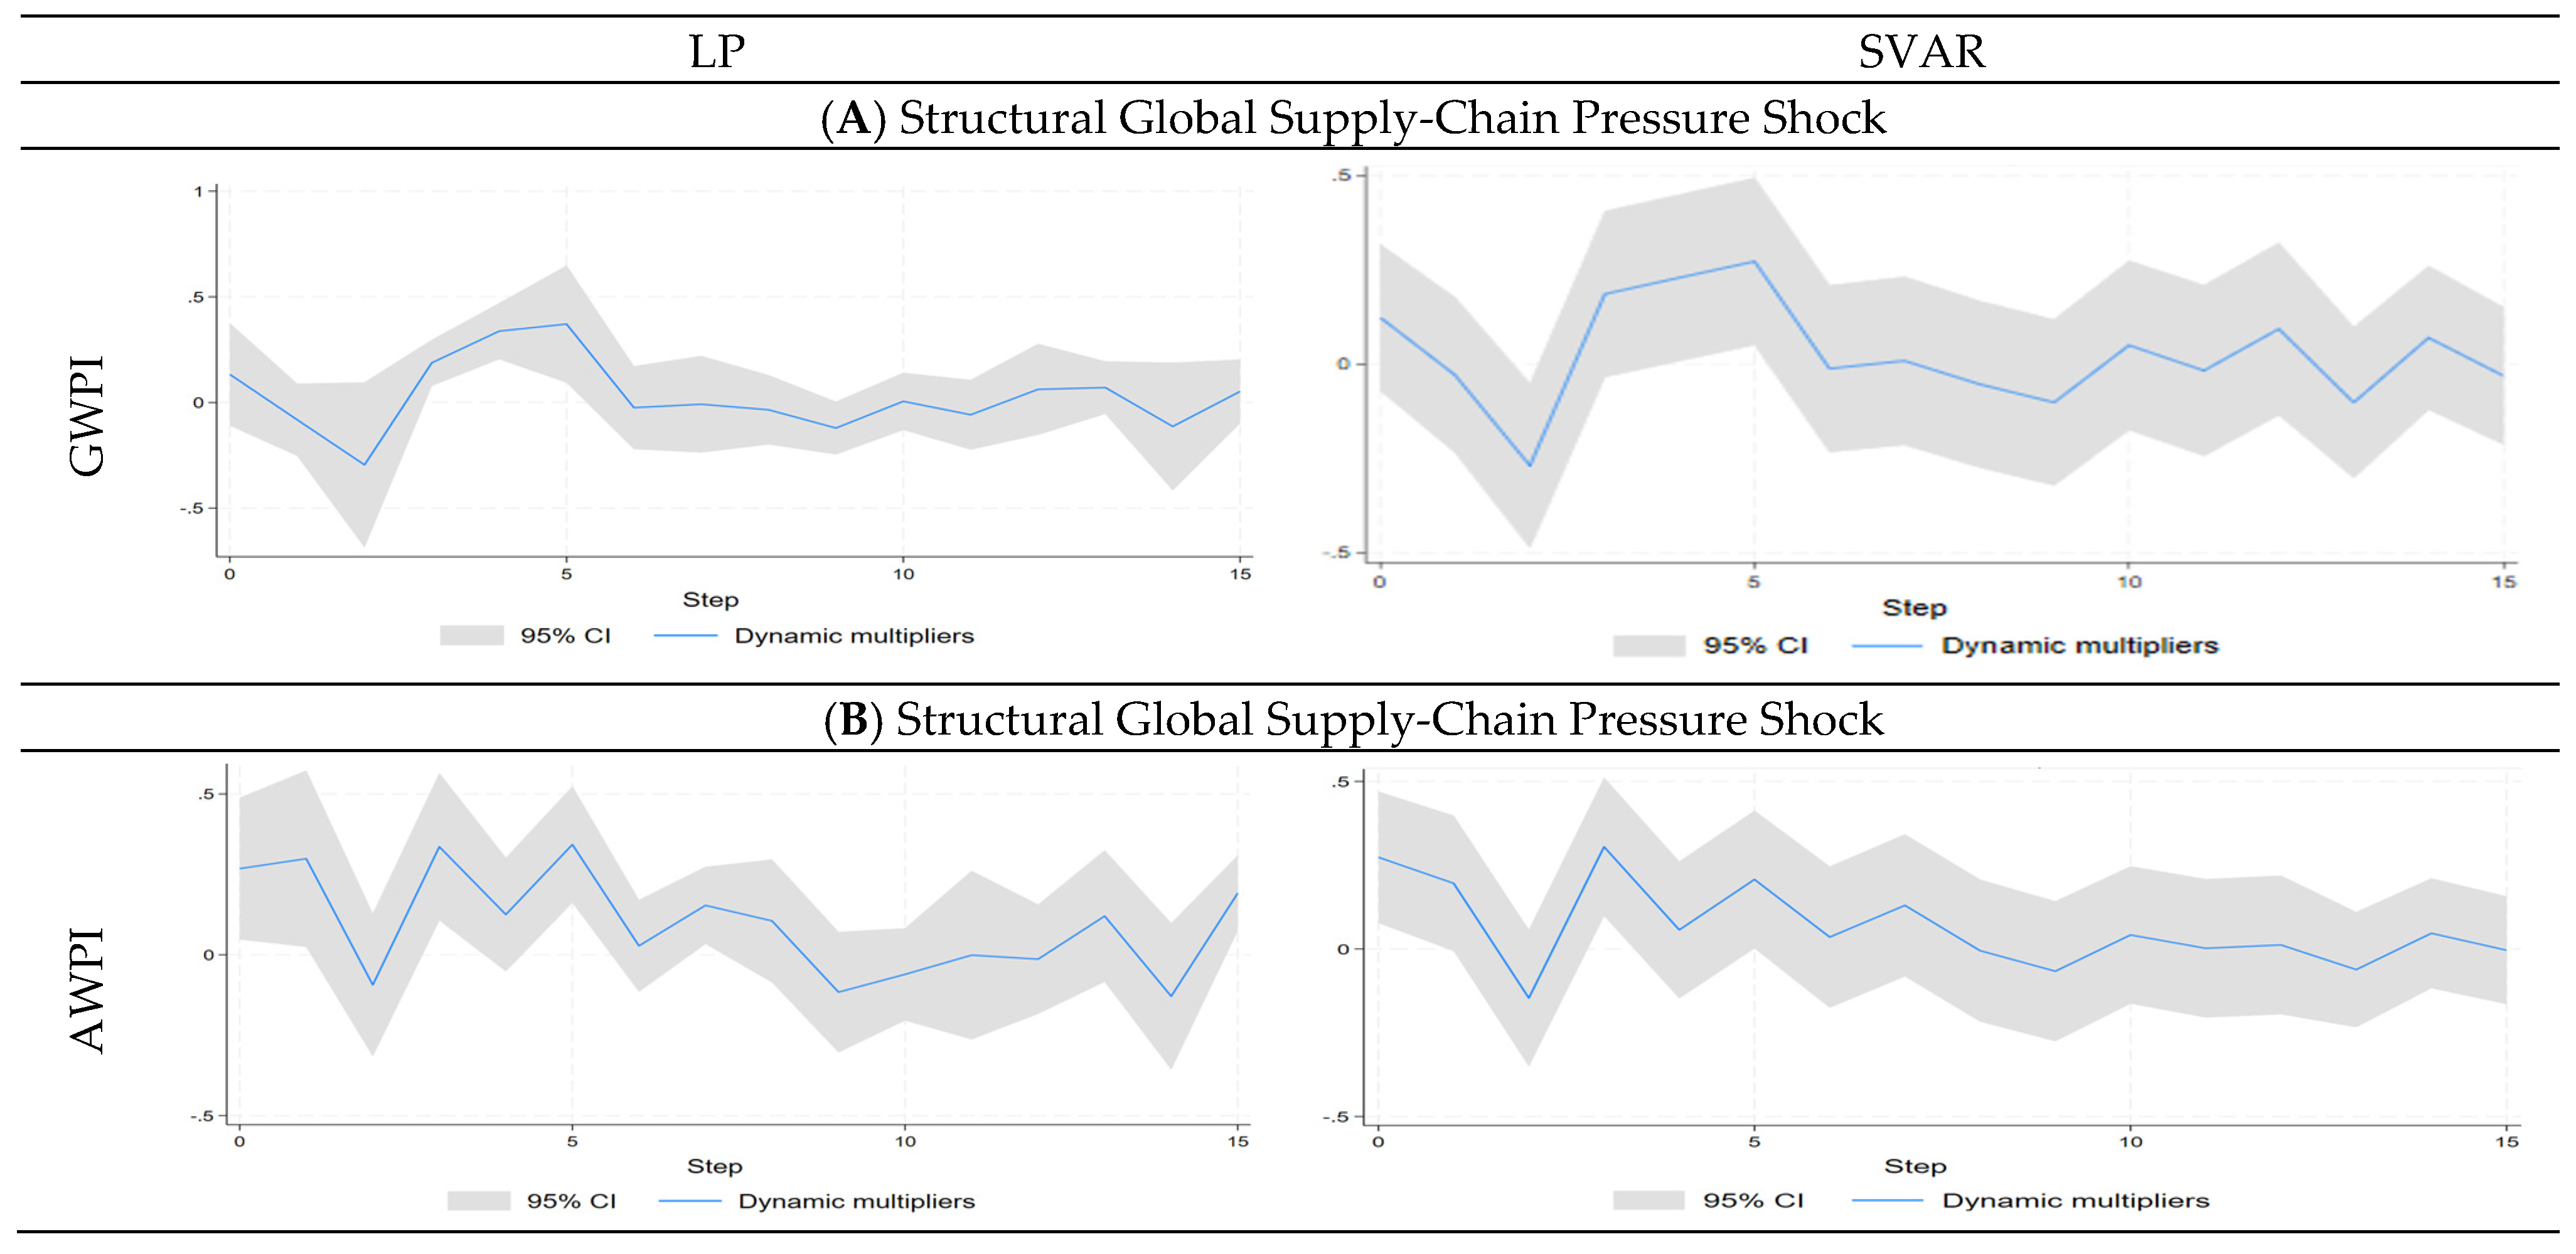
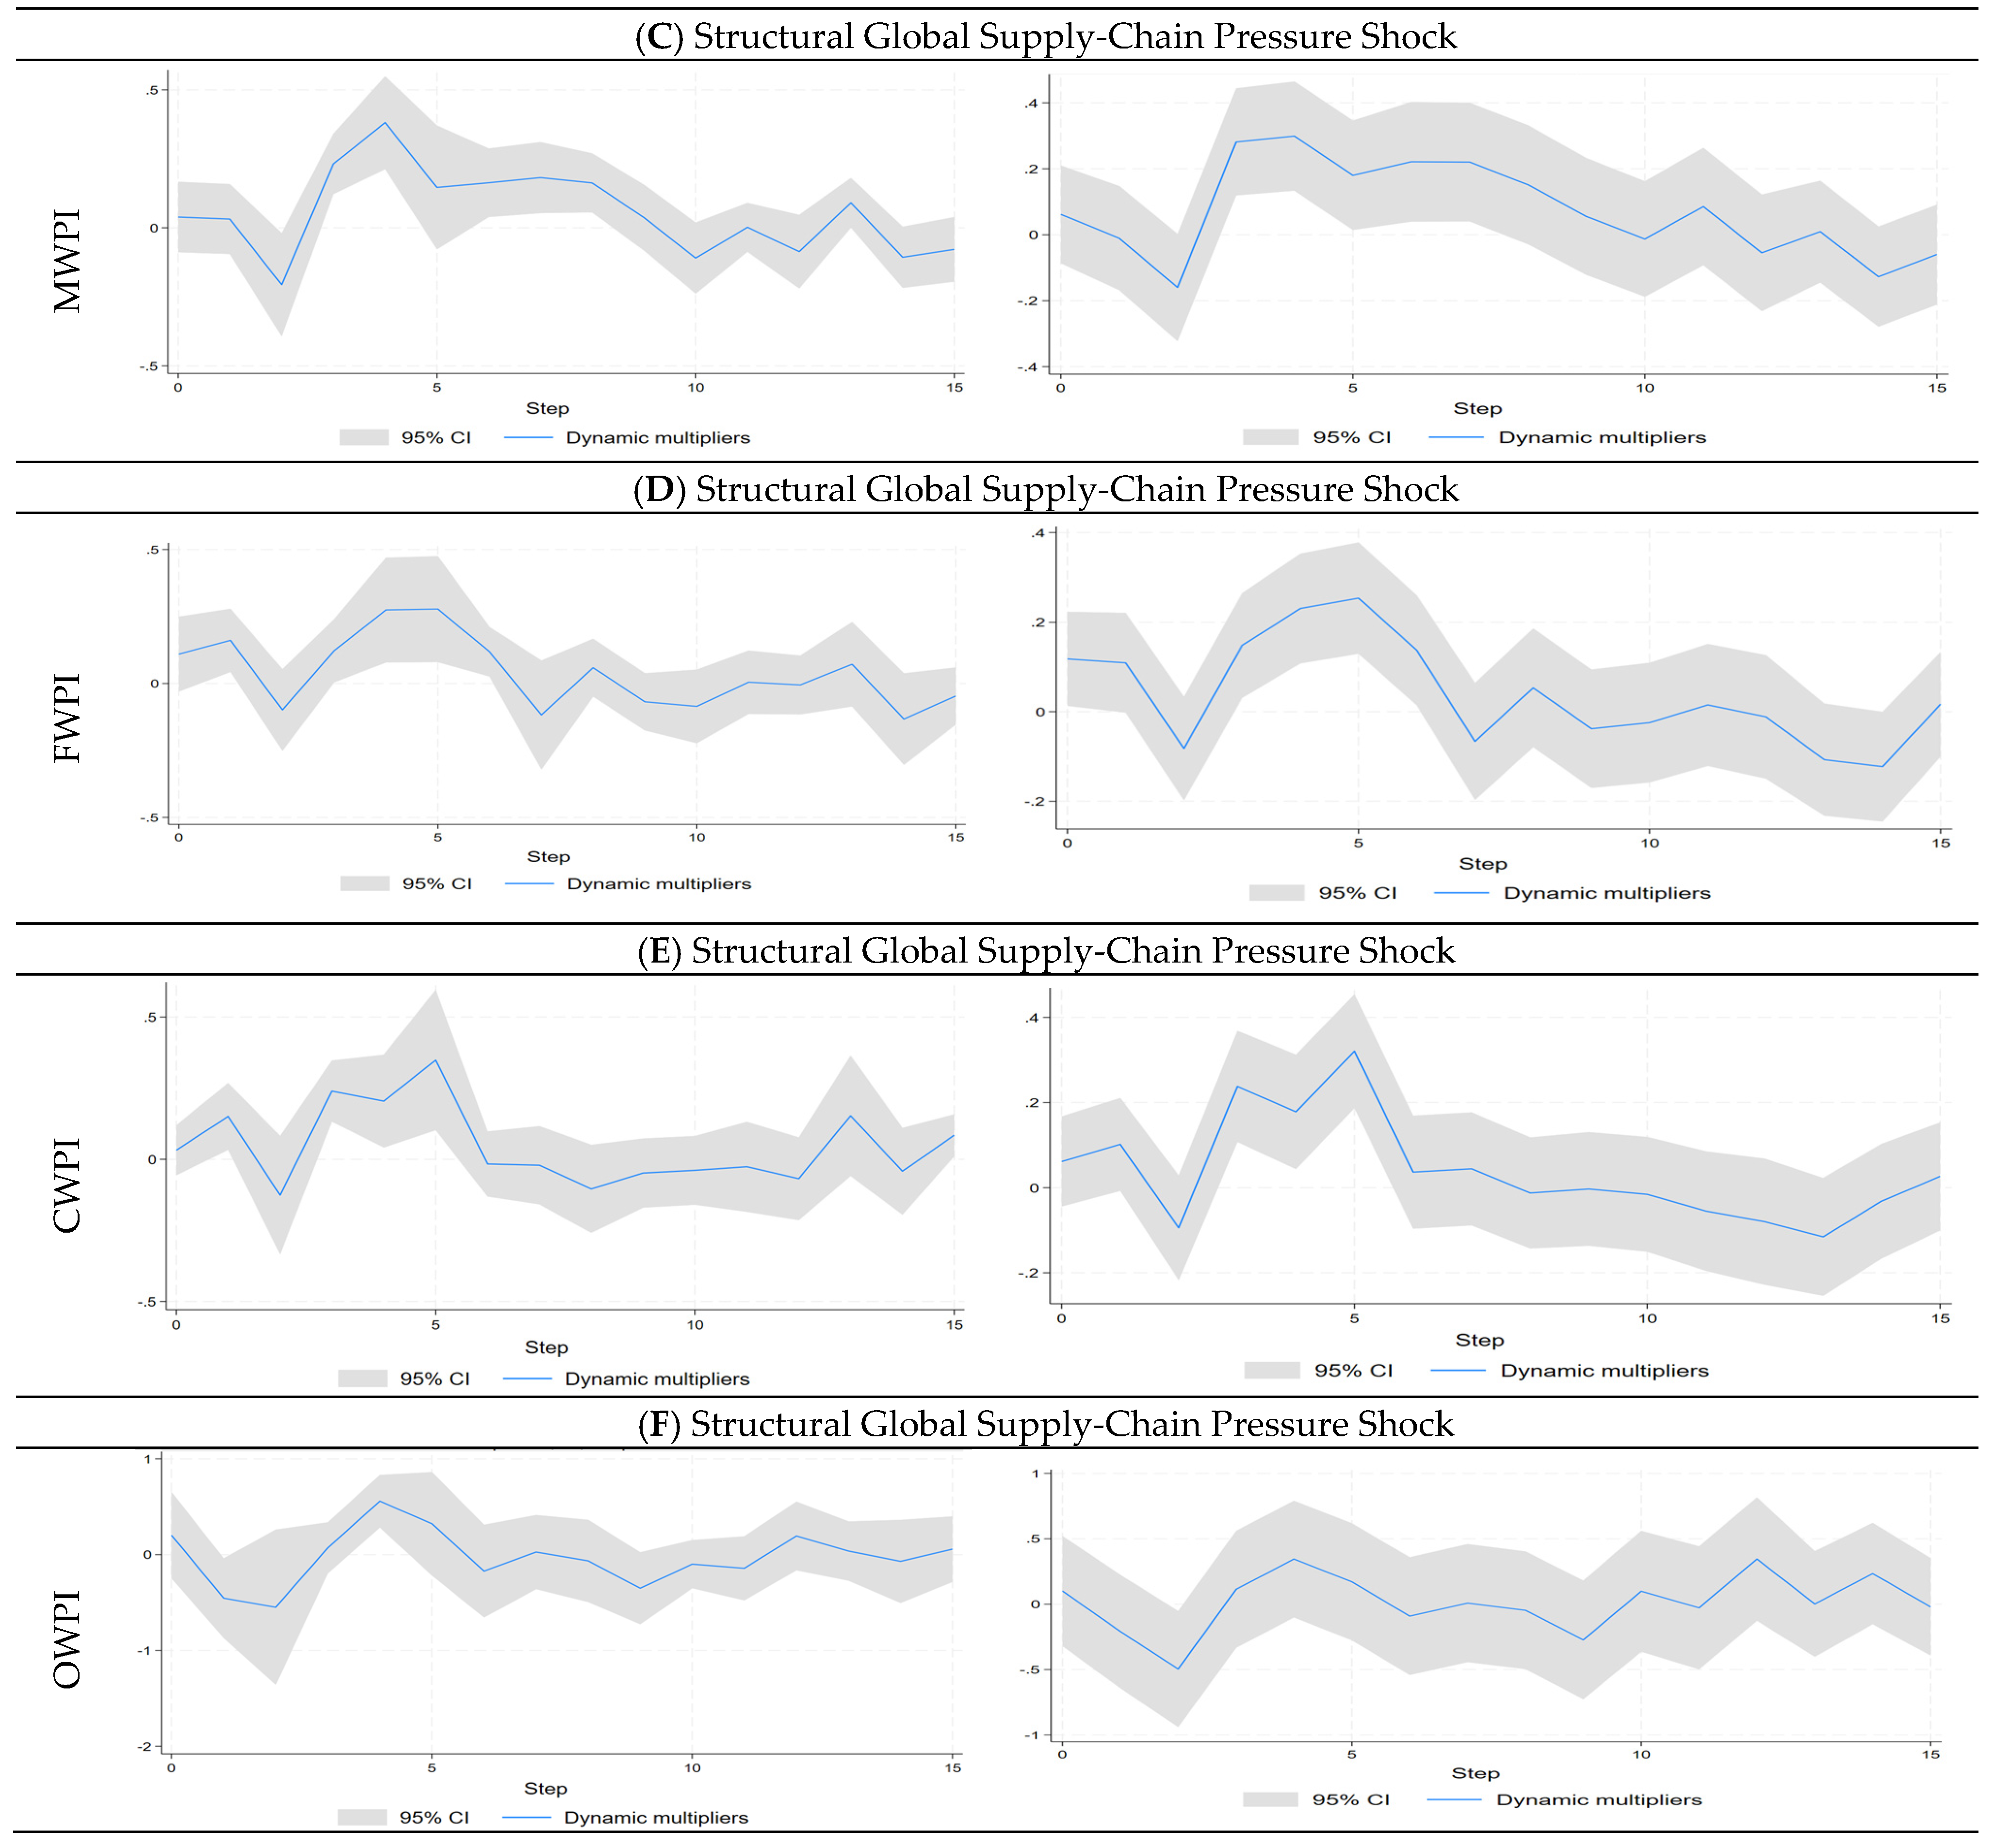
Figure 1 presents the impulse response functions of inflation in response to global supply chain shocks, as estimated using both the SVAR and LP models. The results from both models are consistent, indicating that the estimated dynamic responses are not sensitive to the choice of estimation method. Furthermore, findings indicate significant positive responses across most wholesale price measures. The timing and statistical significance vary across indices and estimation methods, with significance generally concentrated between the third and fifth months and extending to around the seventh month for some measures. The timing of the peak also varies across the indices, although the responses generally reach their maximum at the fifth month. However, in the long term, the responses become insignificant, suggesting that the effect of the shock is transitory.
Figure 1.
Impulse Response Function of inflation to structural global supply-chain pressure shocks.
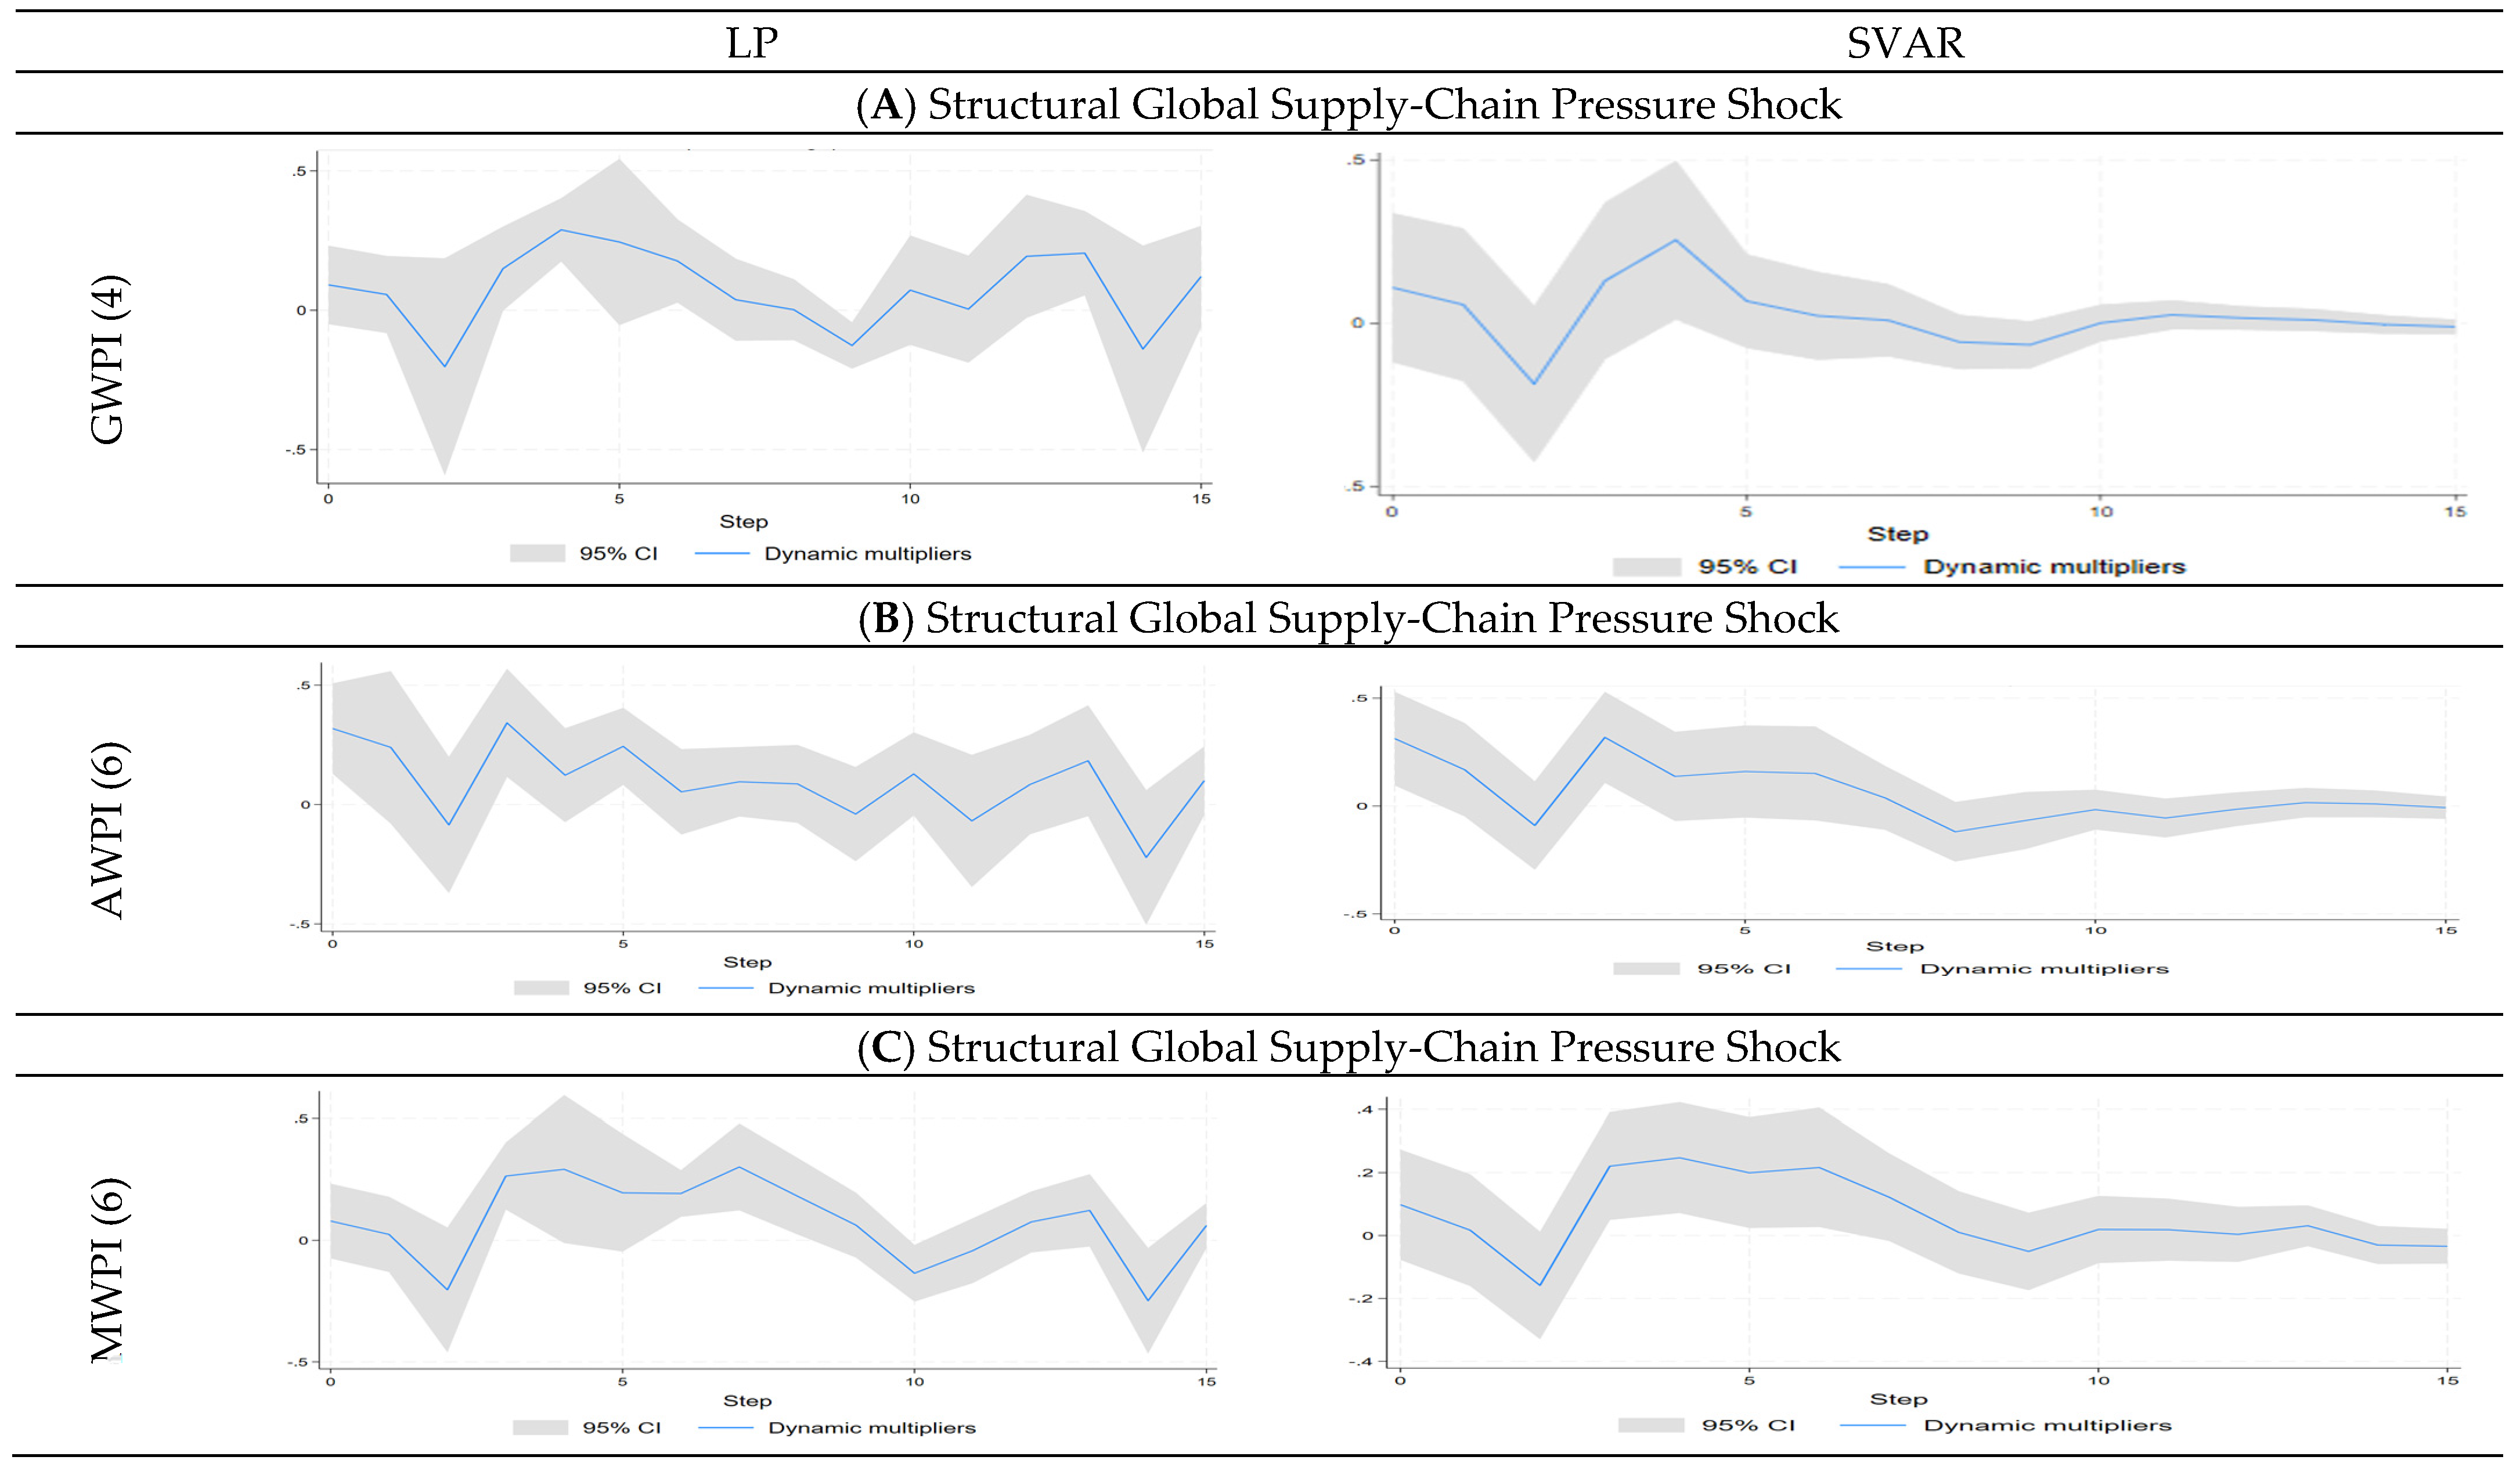
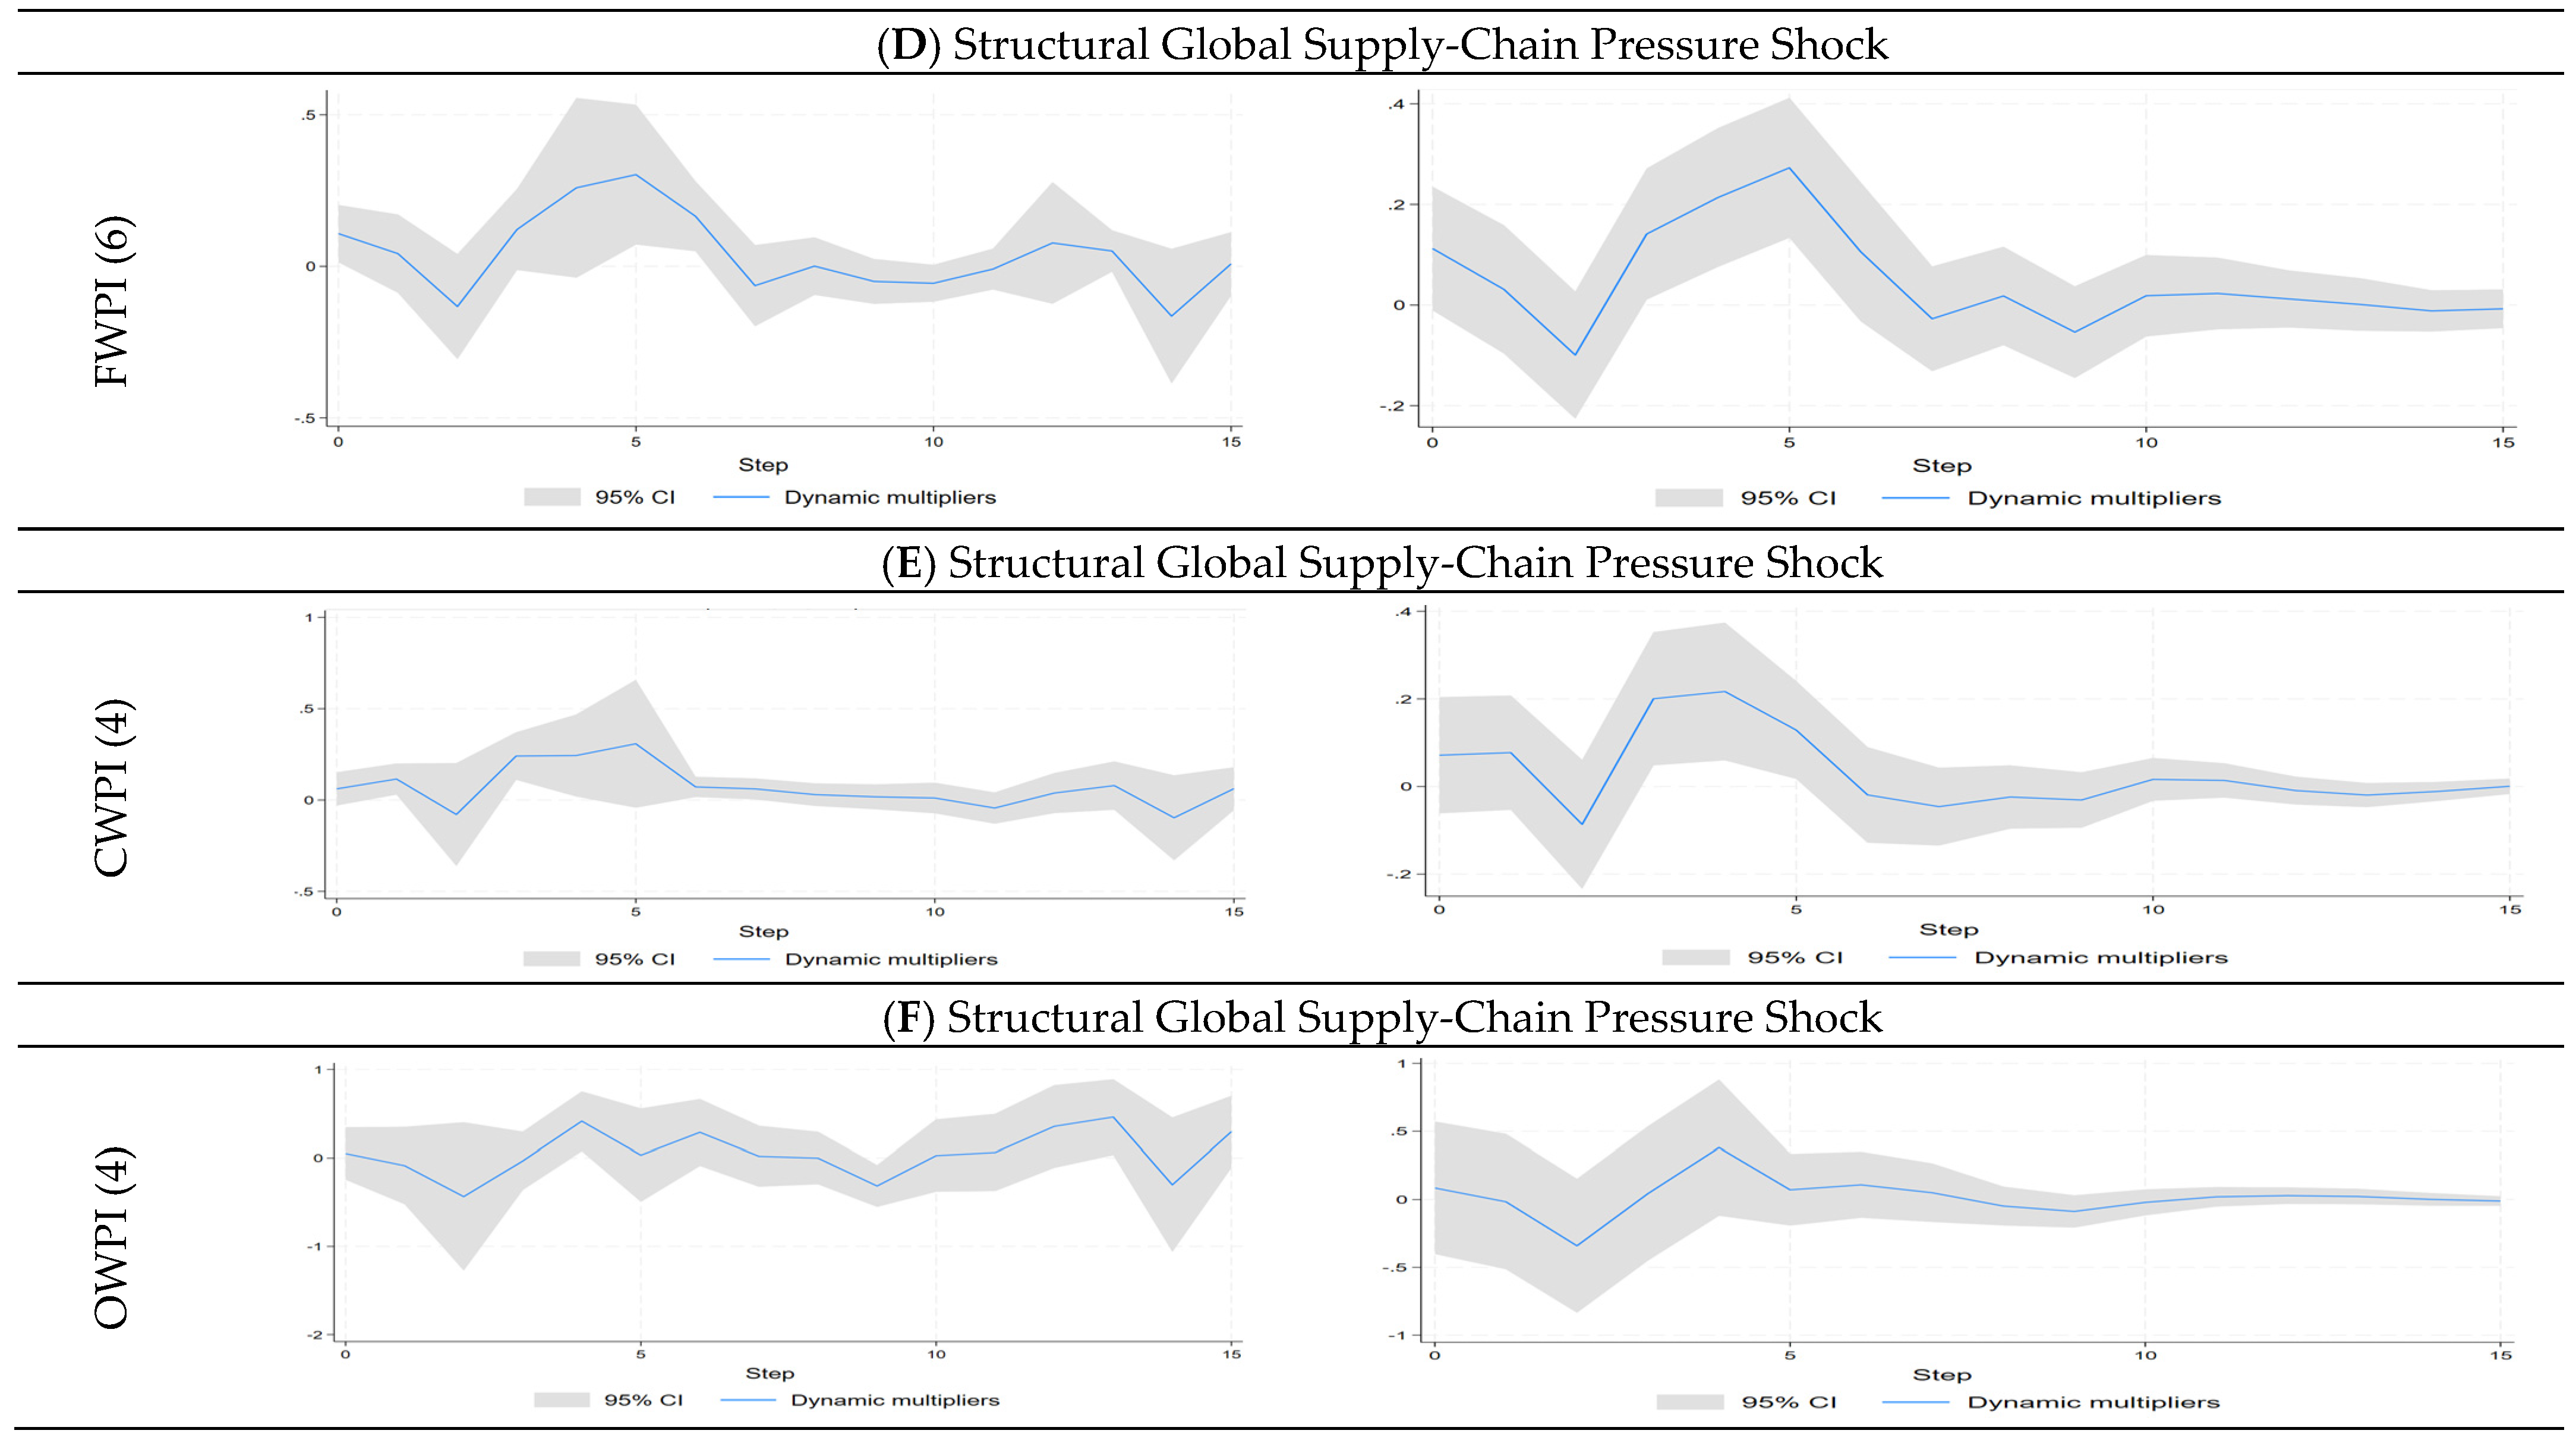
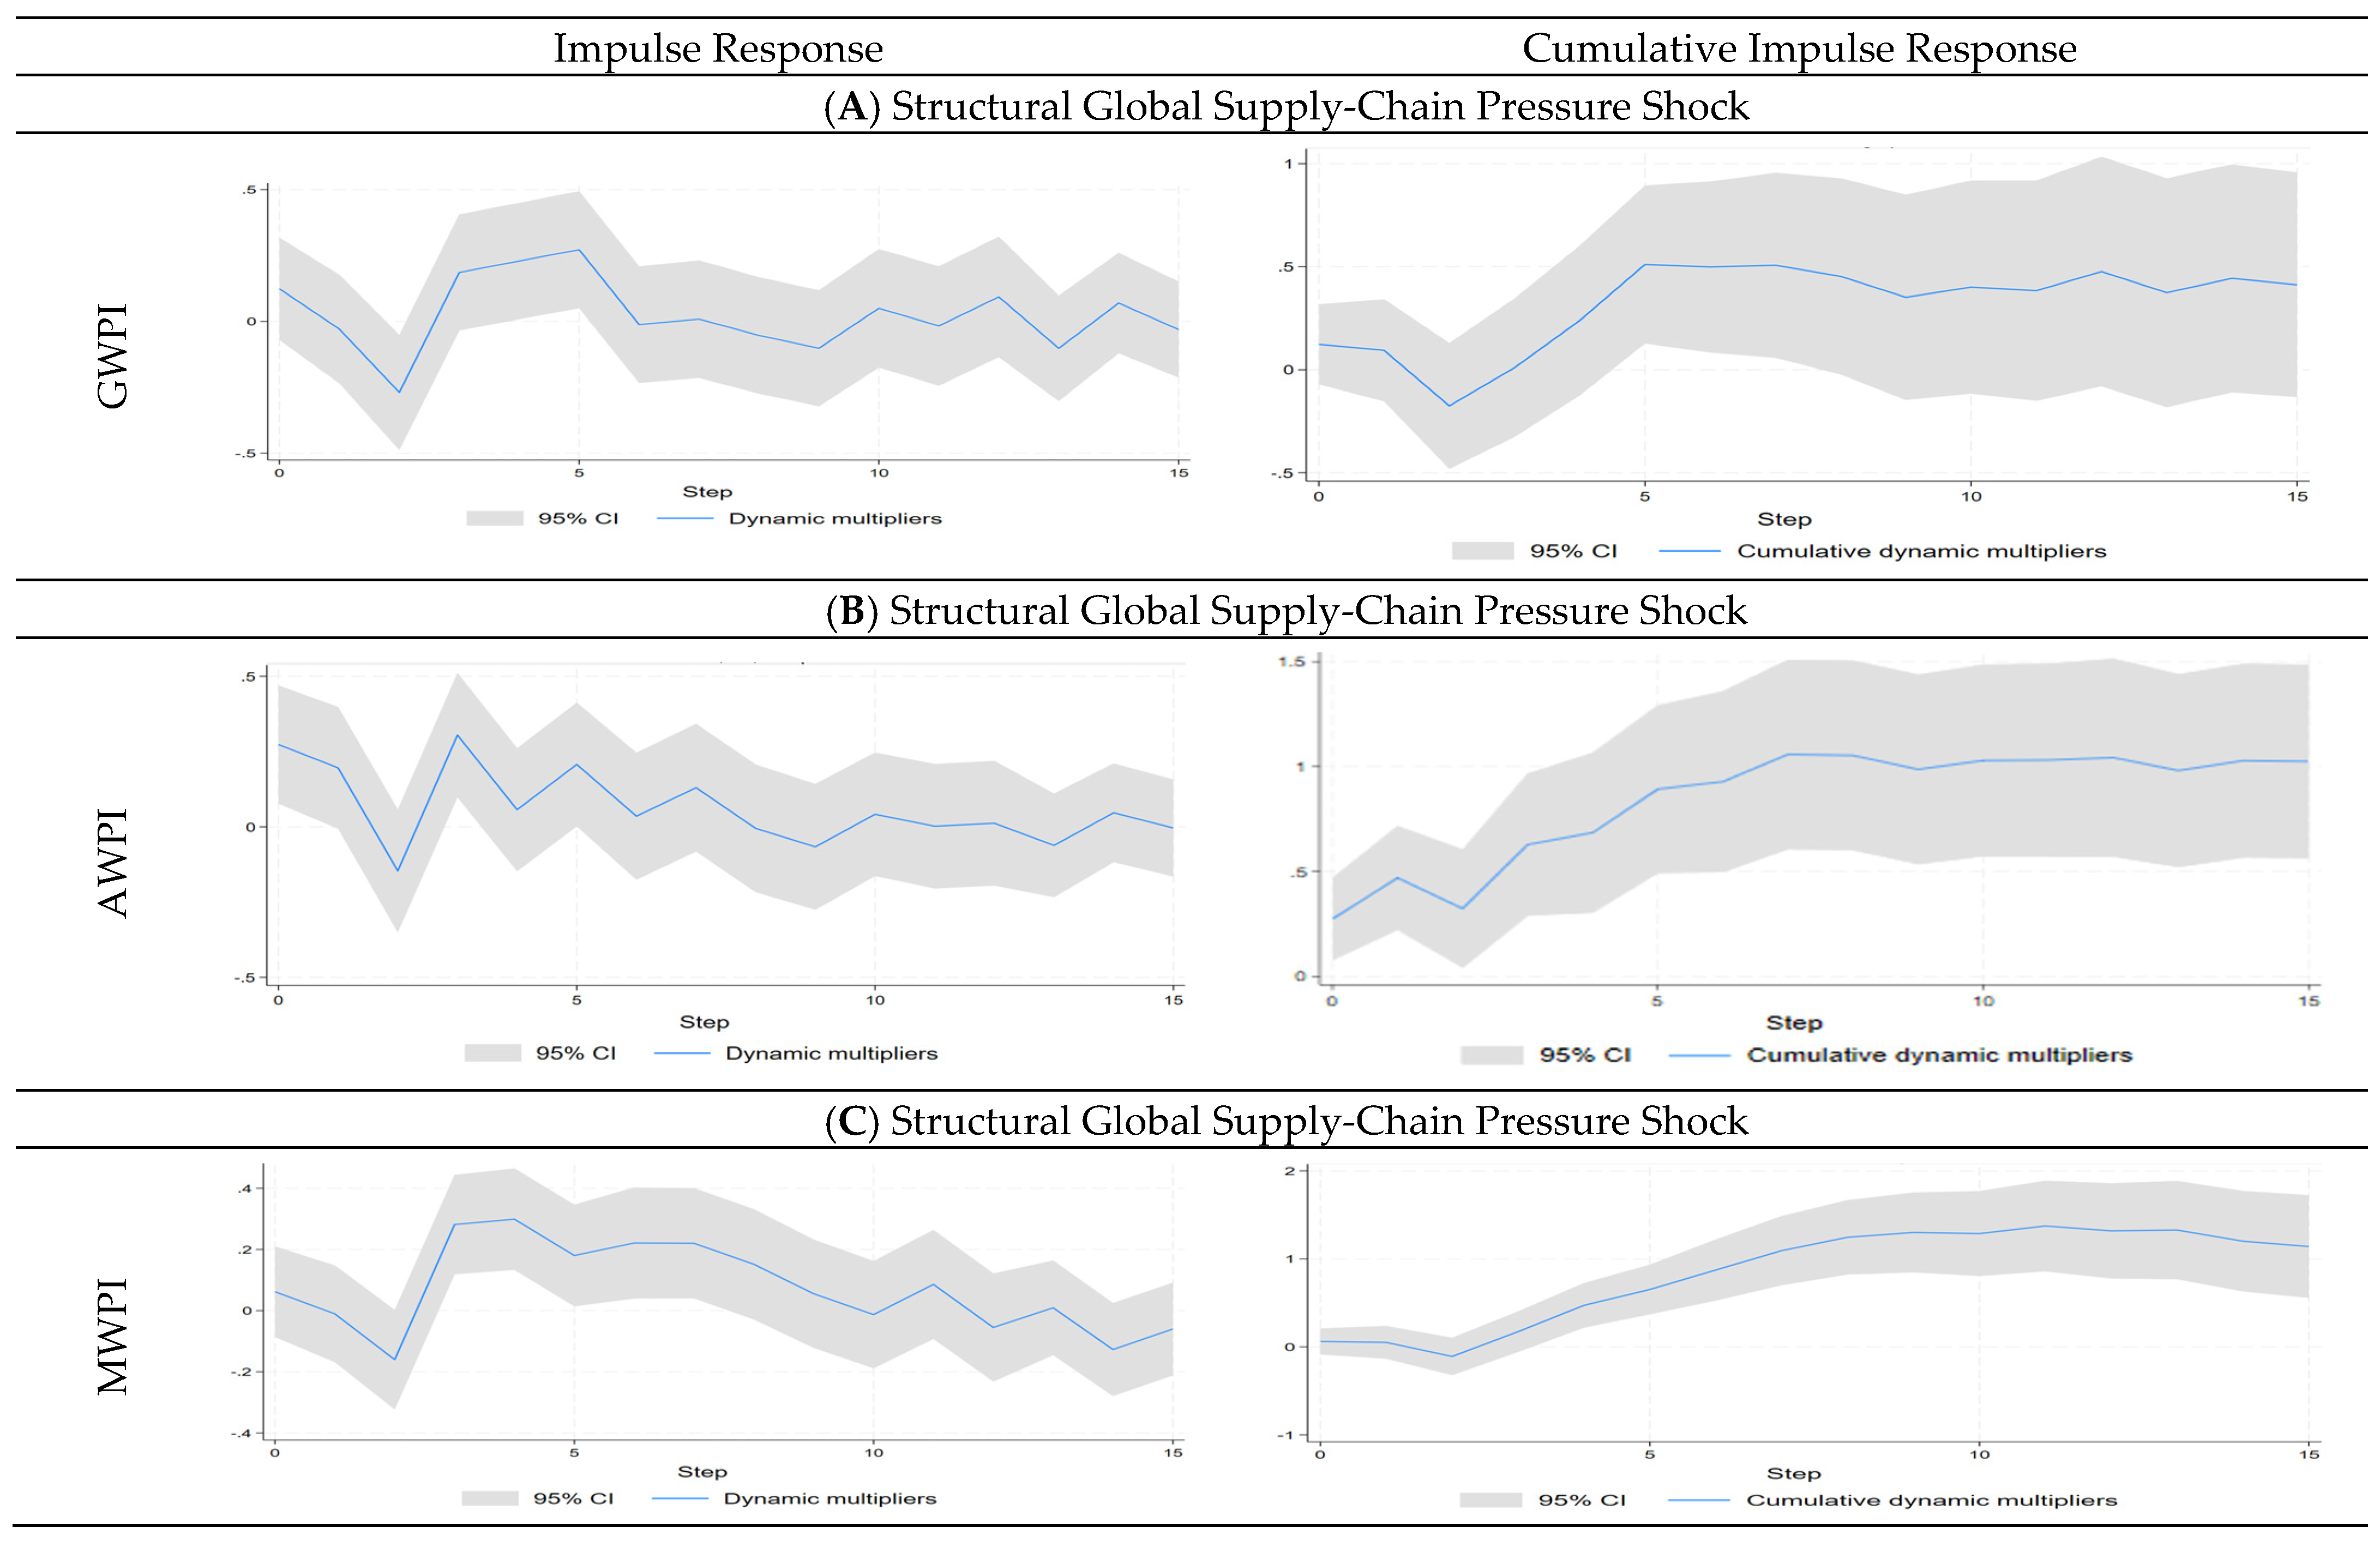
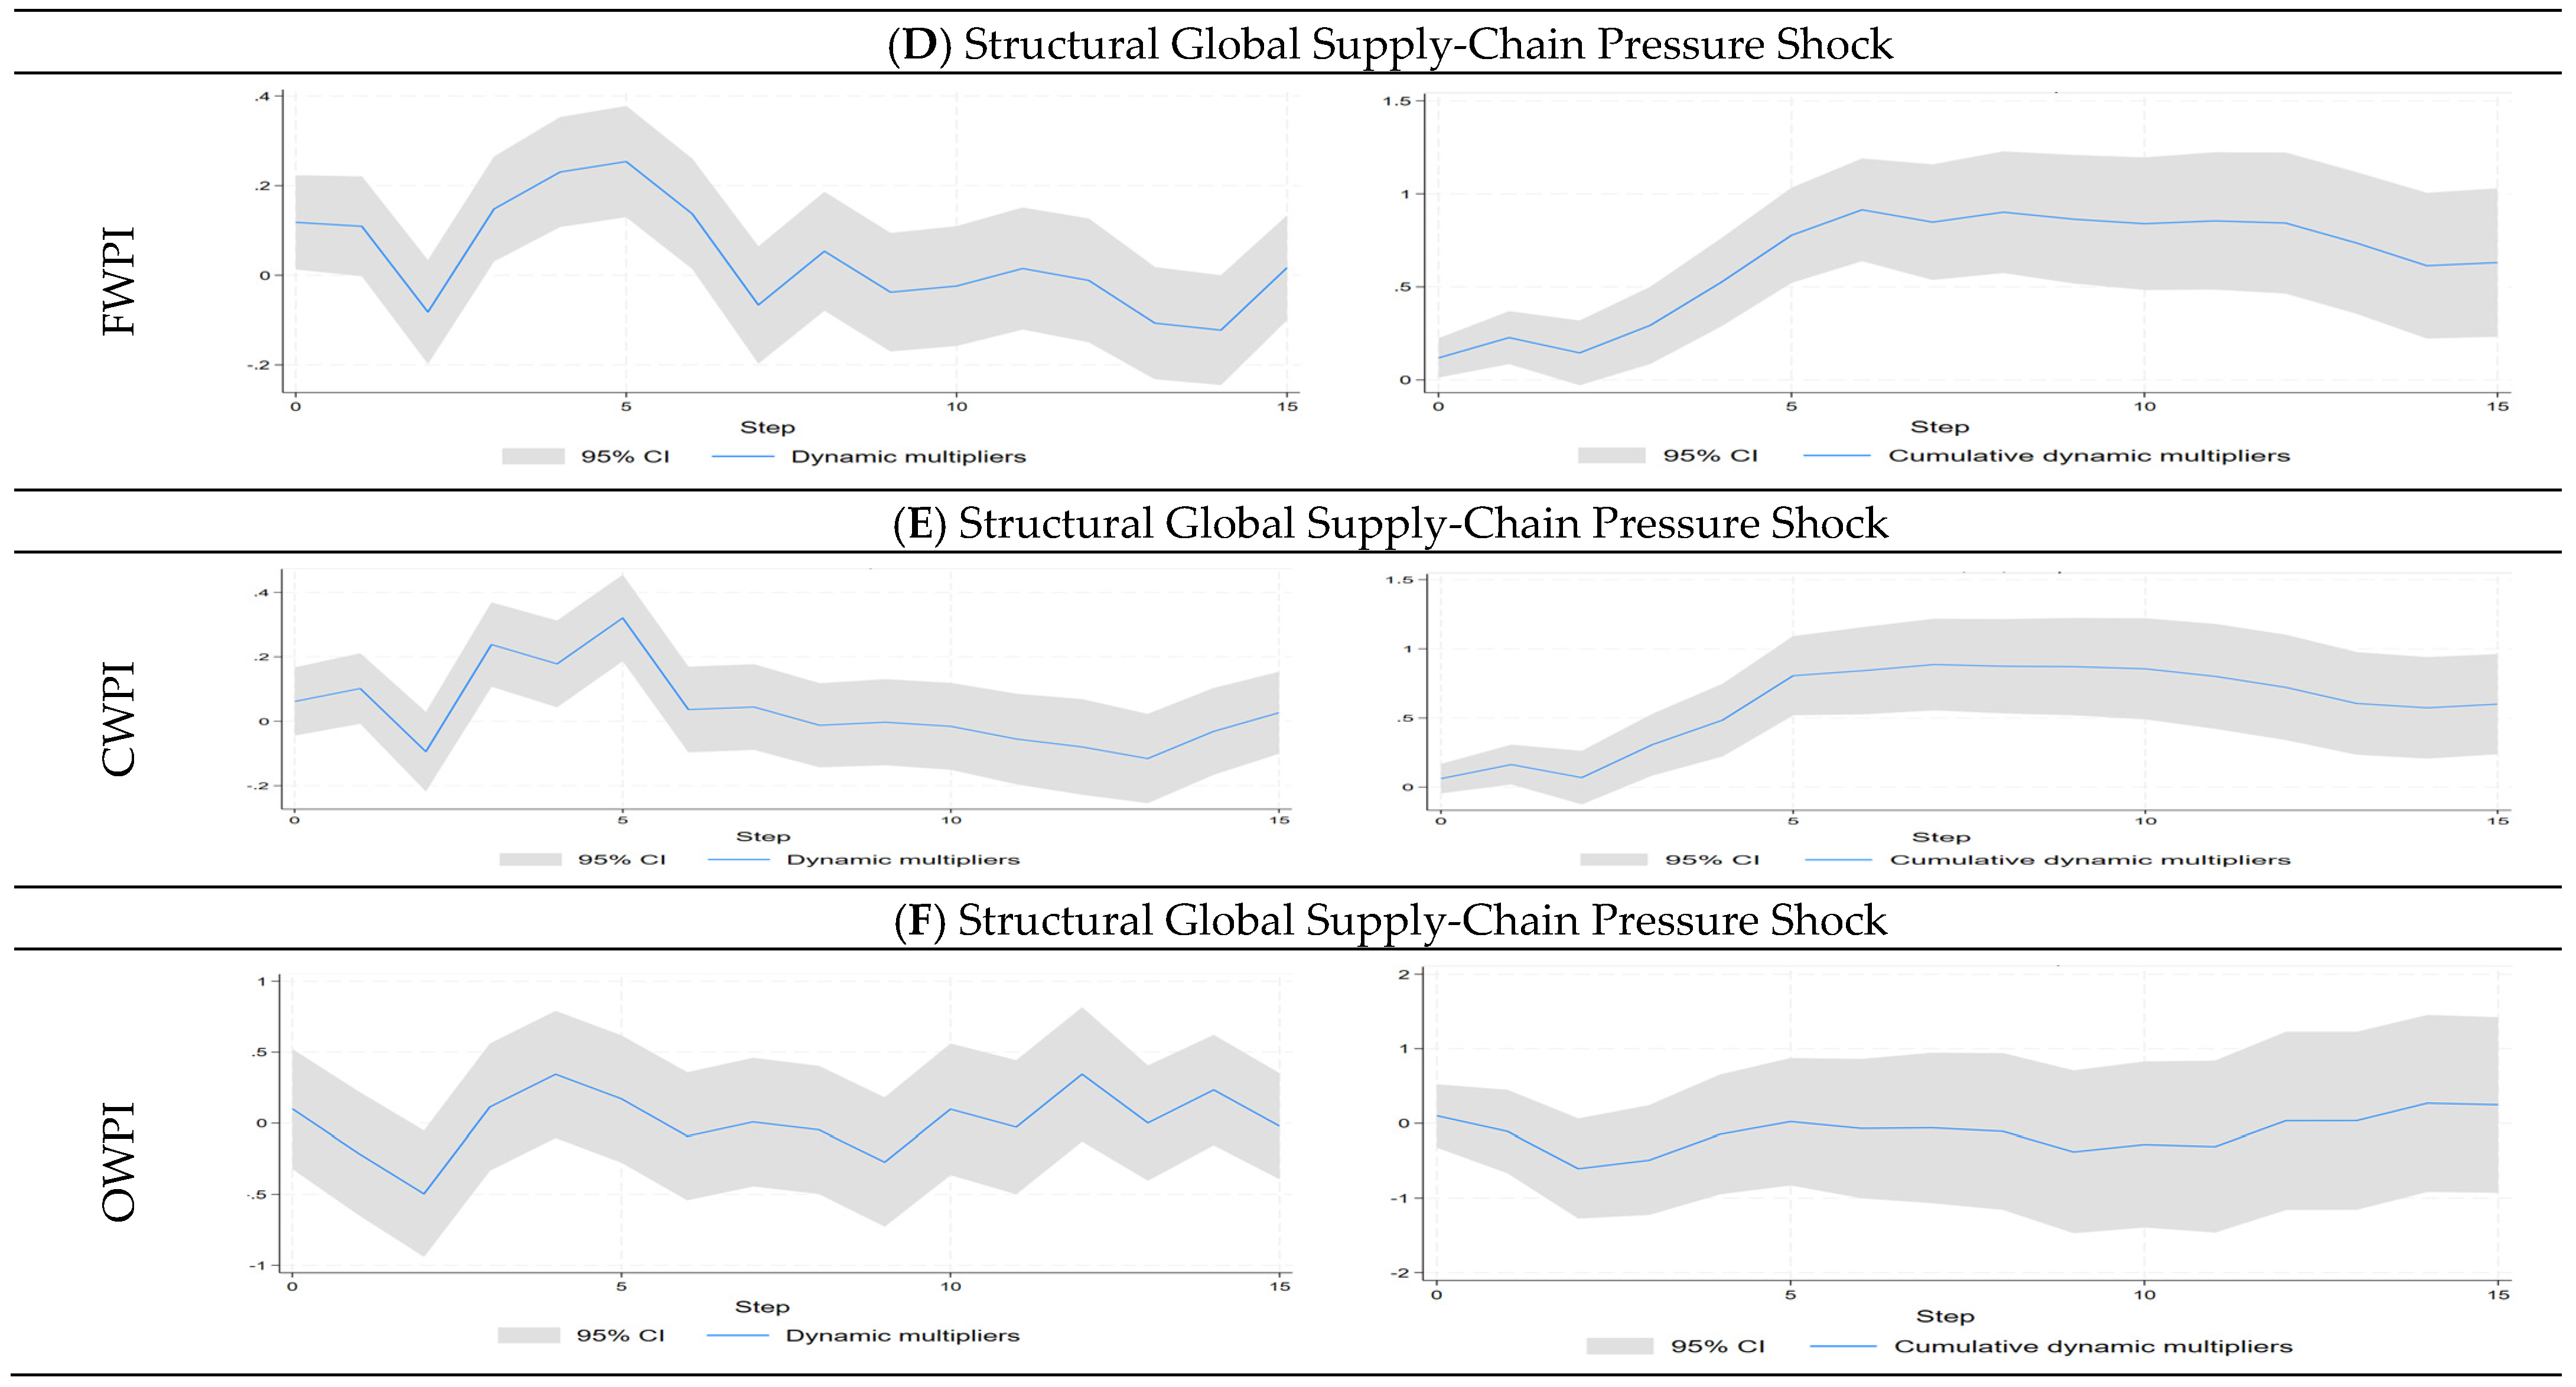
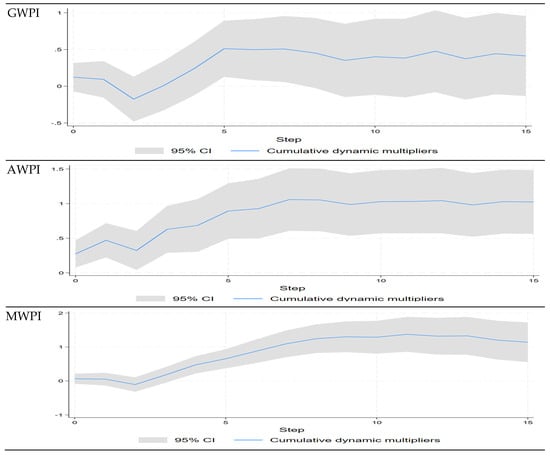
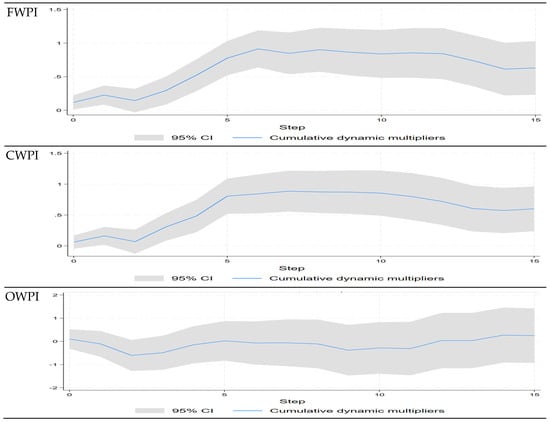
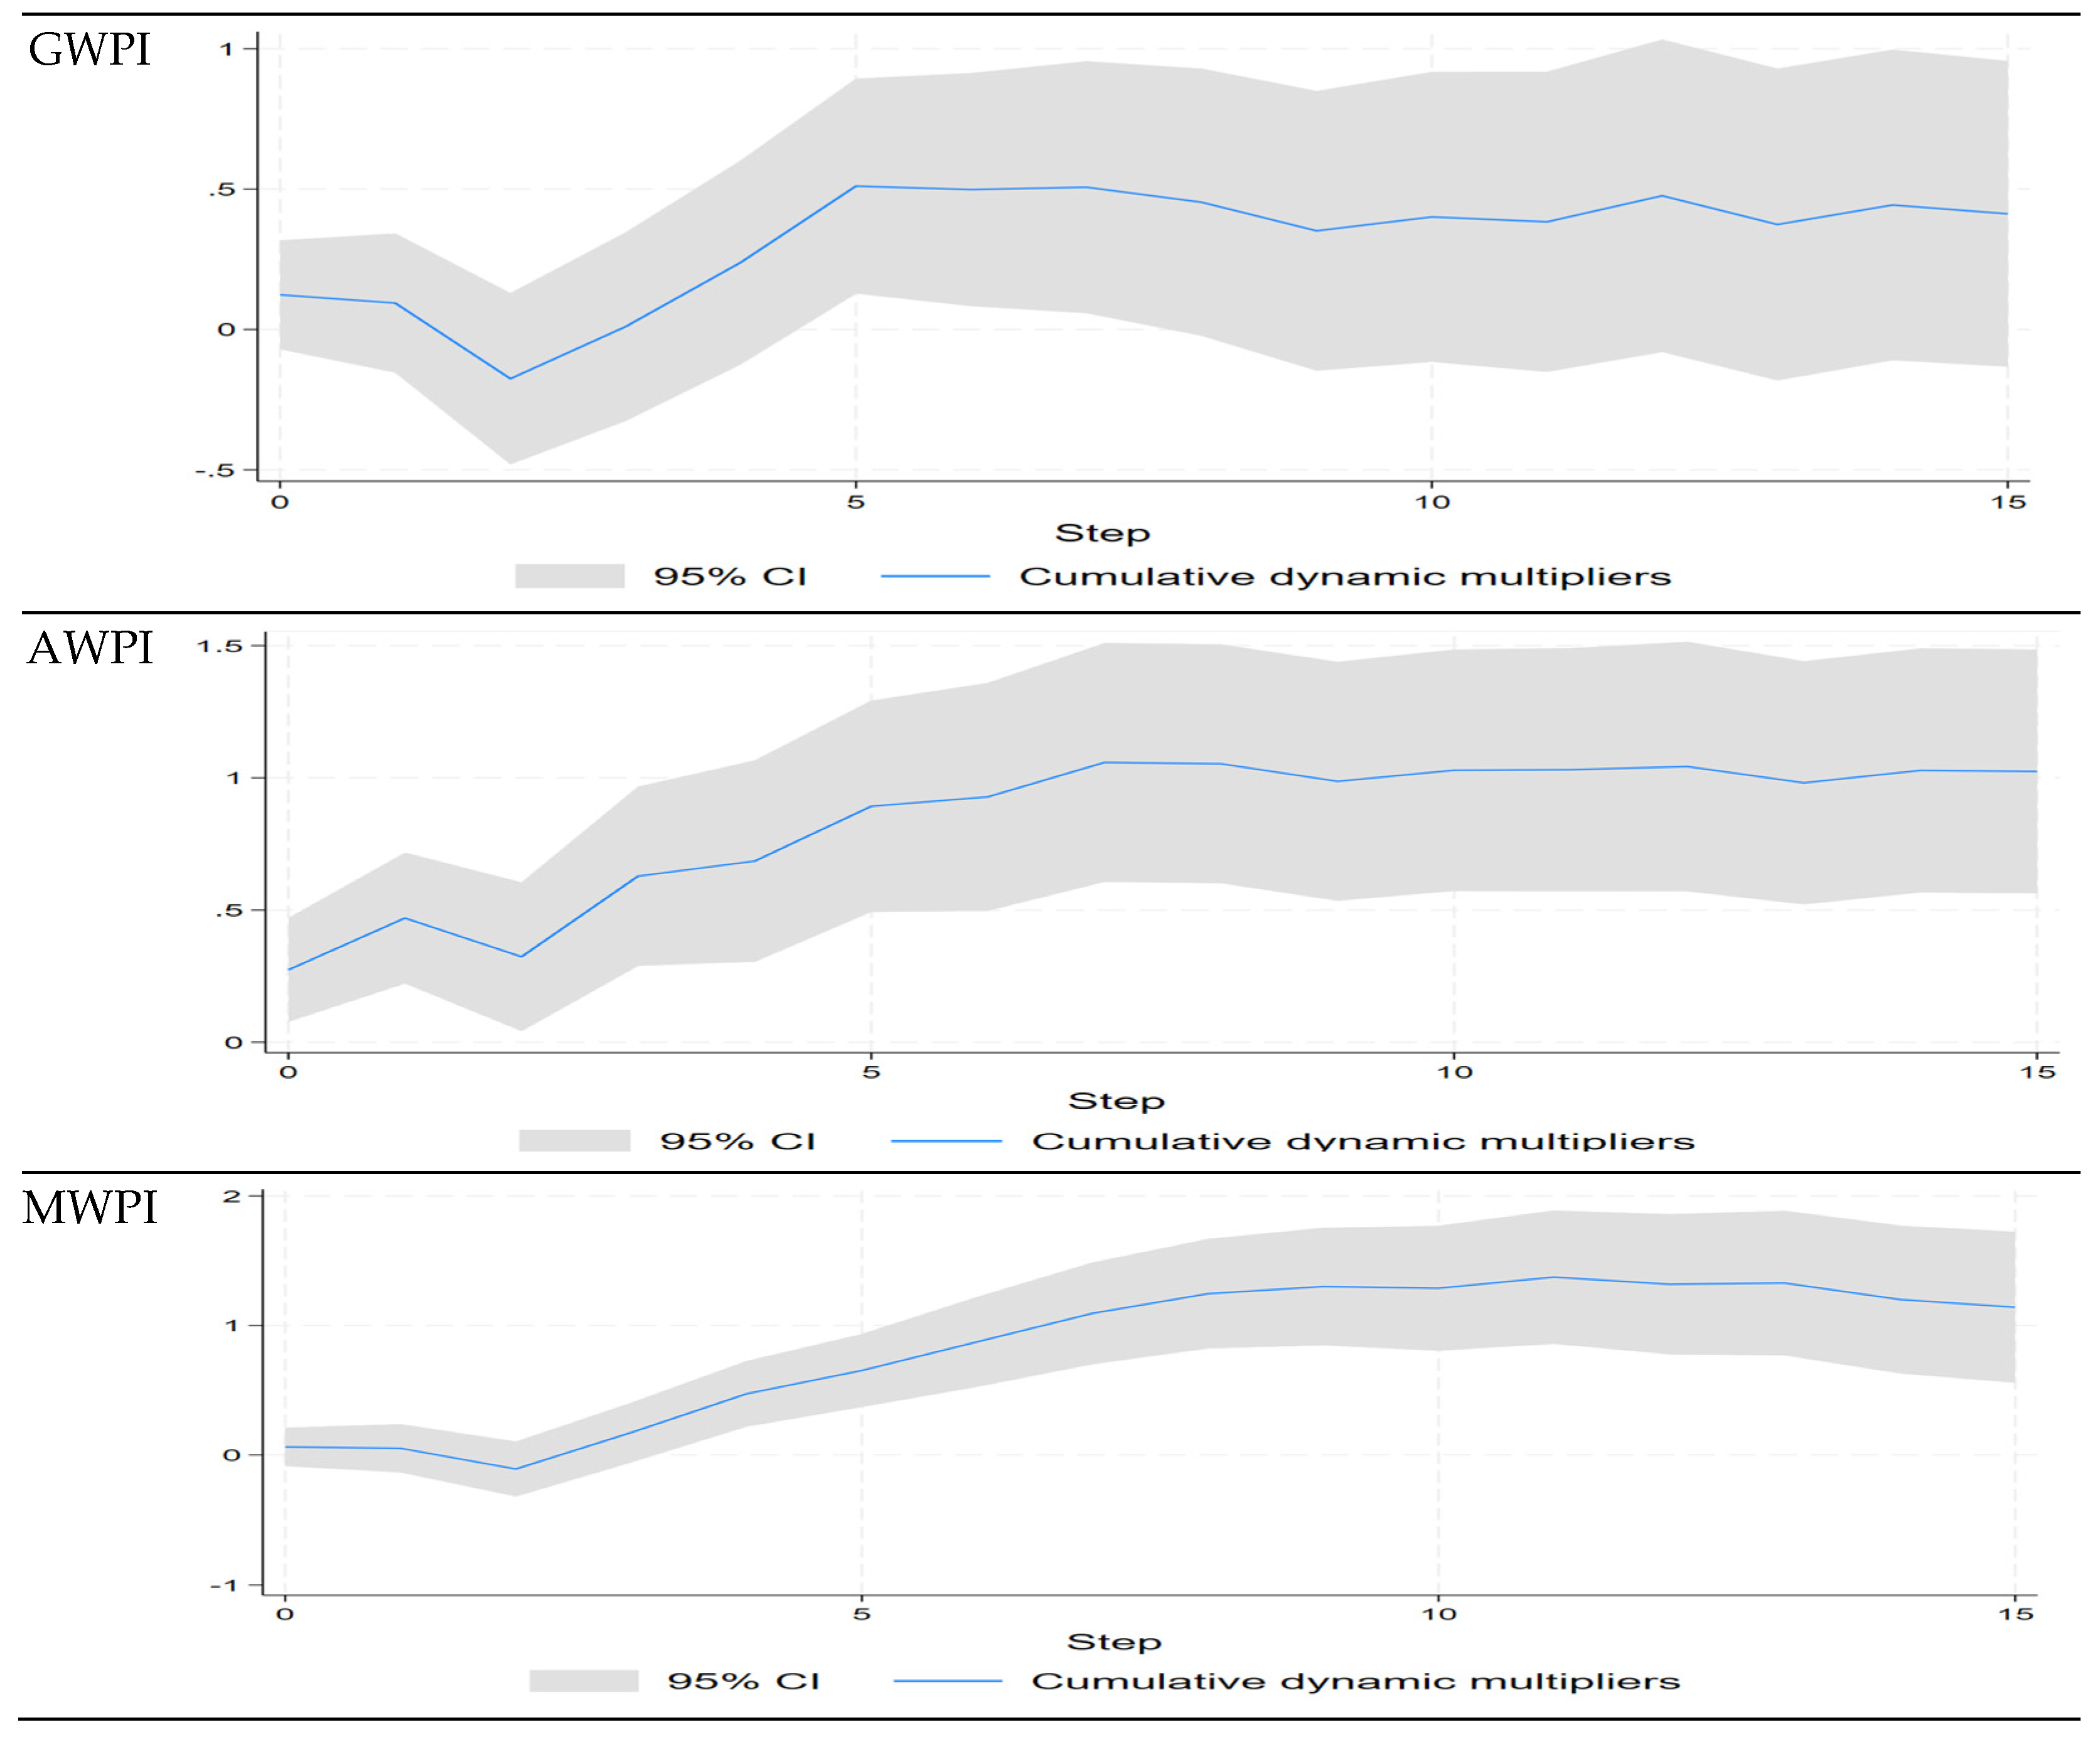
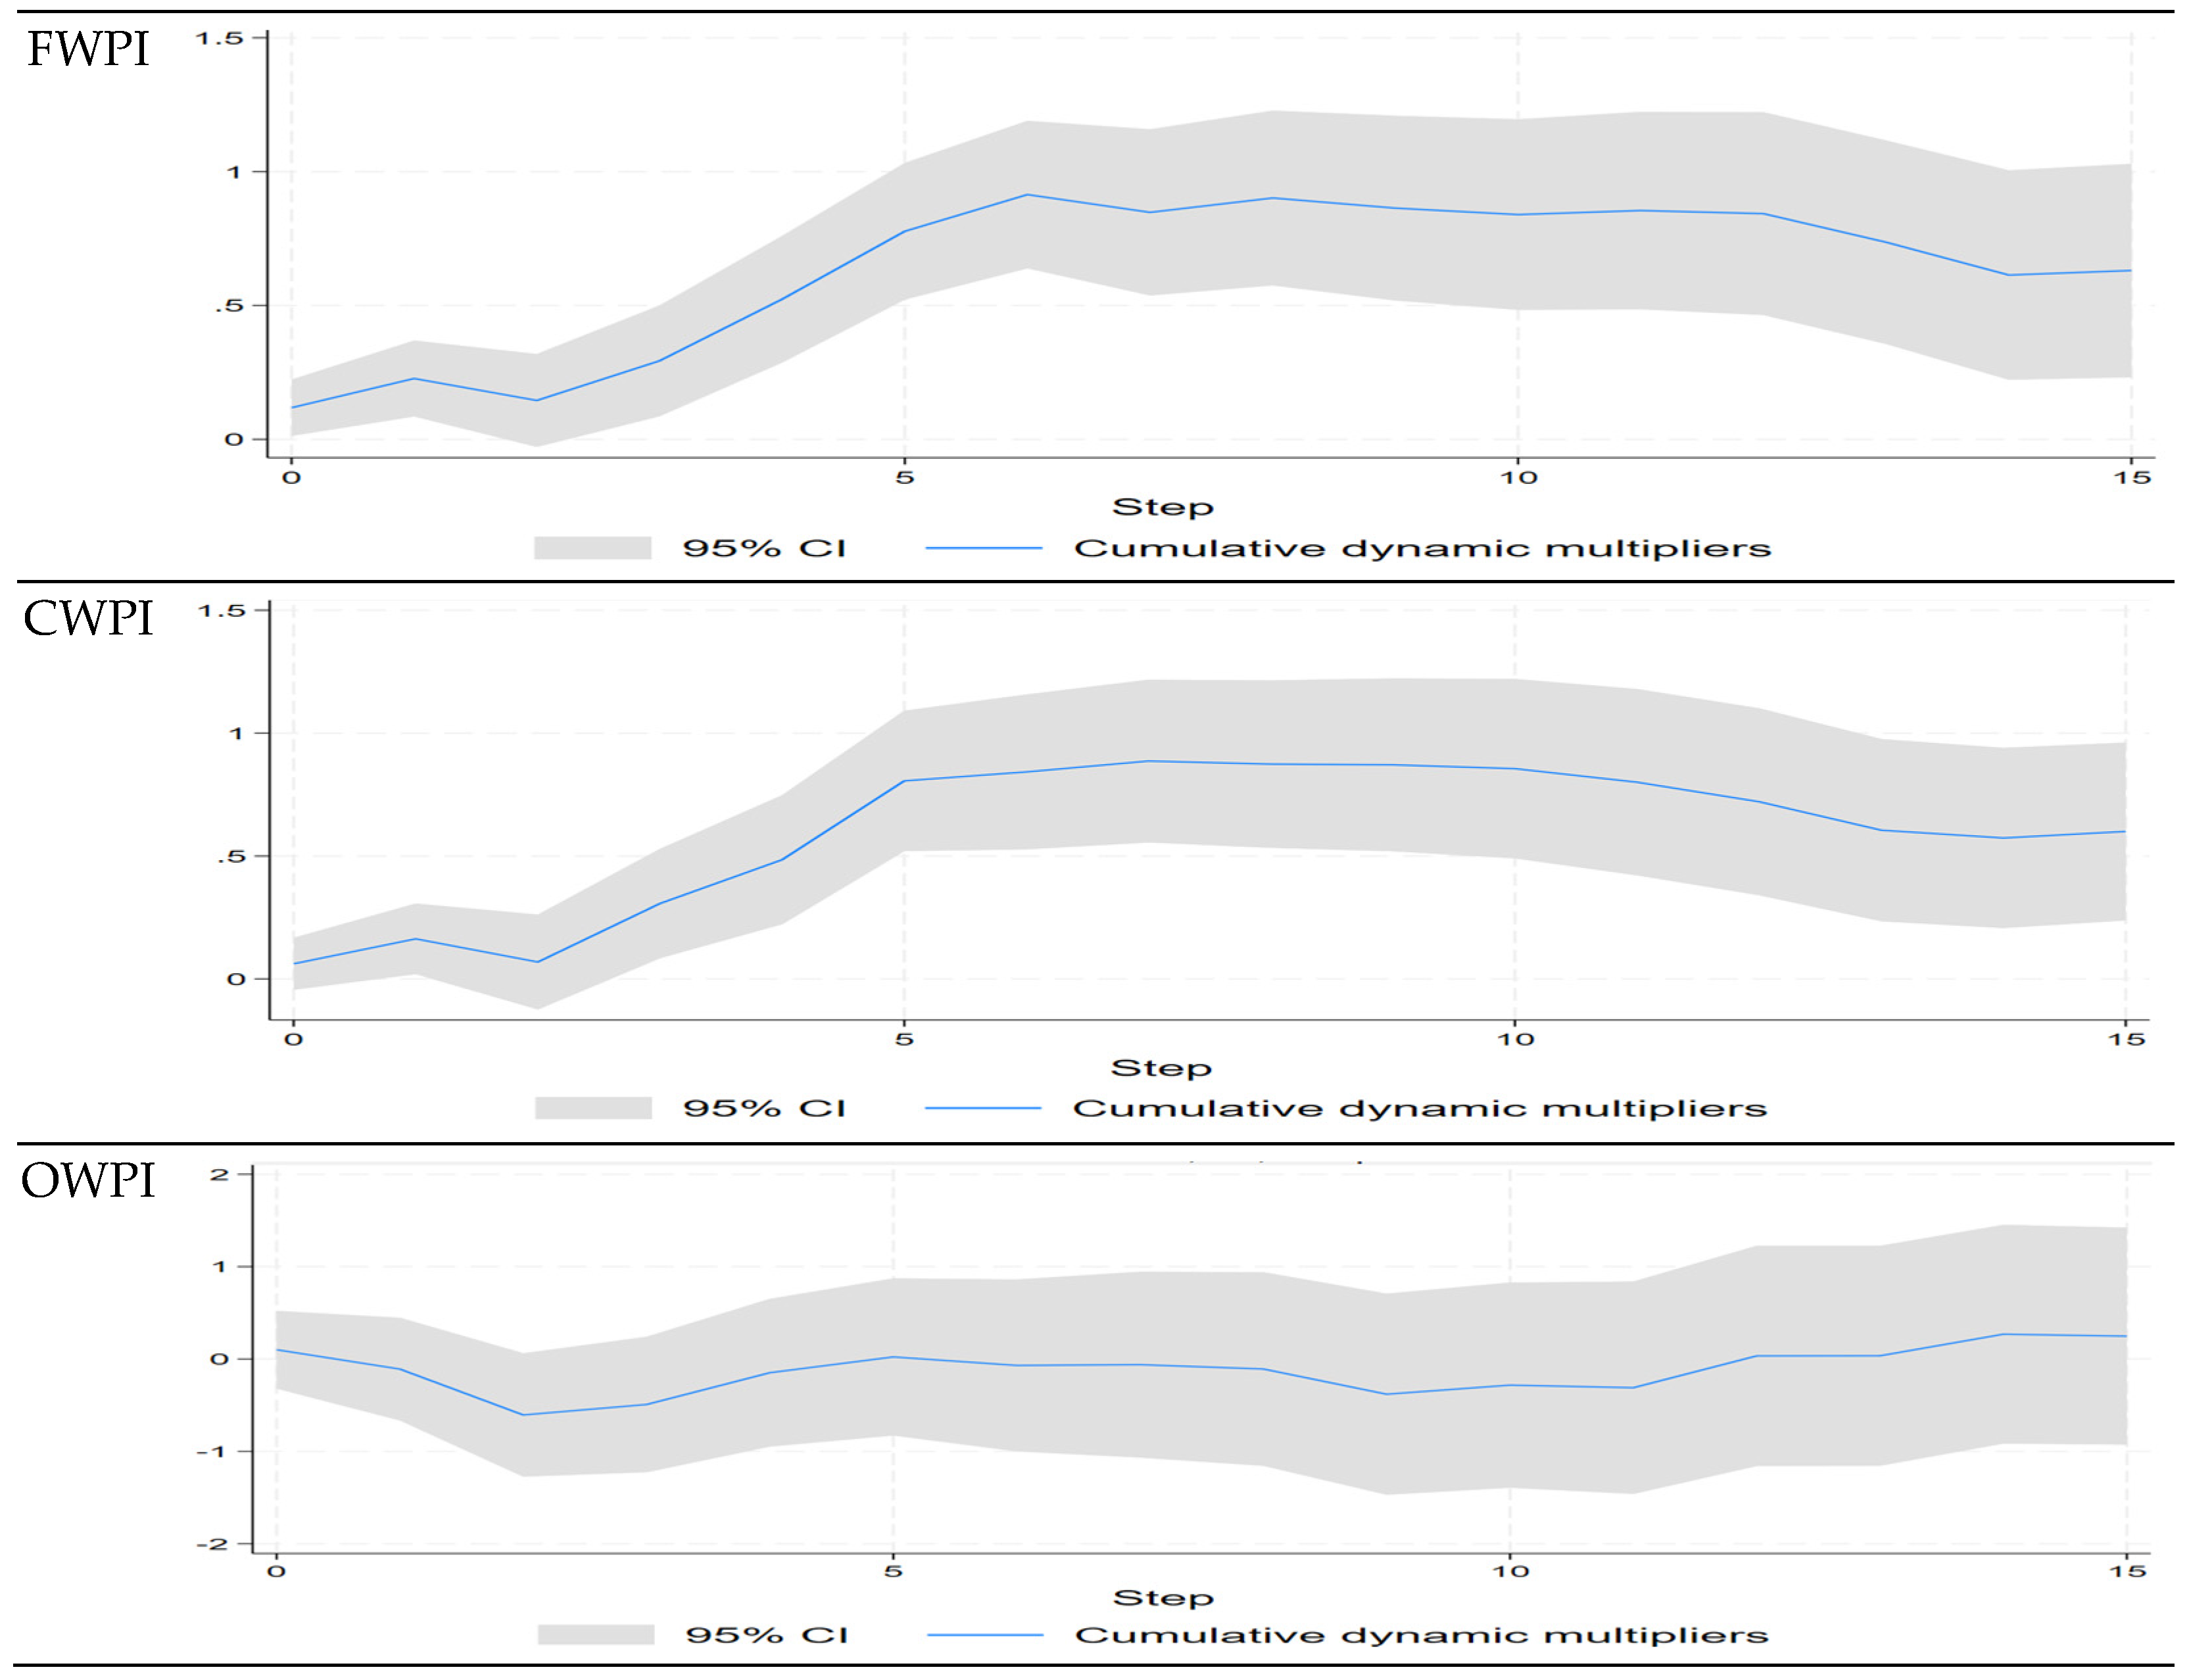
While Figure 1 demonstrates that Global Supply-Chain Pressure Shocks produce a significant positive response in most wholesale price indices between the third and sixth months—effects that gradually diminish and become statistically insignificant over longer horizons—the short-run negative responses observed at the first two horizons weaken or become statistically insignificant under the AIC-selected lag specifications and are therefore not interpreted as a robust feature of the transmission mechanism (see Appendix A.4 and A.5). Figure 2 provides additional insights into the cumulative impact of these shocks over time. Although the short-run responses are transitory, the cumulative effects remain positive for most price categories. This pattern suggests that the temporary increases in monthly inflation can leave the price level persistently above its pre-shock path even after the inflation response has subsided.
Figure 2.
Cumulative Impulse Response Function of inflation to structural global supply-chain pressure shocks.
The cumulative impulse response results show that wholesale price components respond differently in both size and statistical significance. In proportional terms, ores and minerals (MWPI) exhibit the largest and most persistent effect, with a cumulative response of nearly 1.4% following a one-standard-deviation positive shock to the GSCPI, becoming statistically significant from the fourth month onward. Agricultural and fishery products (AWPI) also show a notable, statistically significant response across most of the forecast period, peaking at about 1.1%. Food products, beverages, tobacco, and textiles (FWPI) show a positive and statistically significant response of around 0.91% for most of the period. For metal products, machinery, and equipment (CWPI), the cumulative response rises to about 0.88%.
By comparison, the general wholesale price index (GWPI) shows a smaller cumulative response of about 0.5%. It is only statistically significant in the medium term, between the fifth and seventh months after the shock. After that, the response remains positive but is not statistically significant. Other transportable goods (OWPI) do not show a statistically significant response, suggesting little evidence of transmission to this group. These differentiated sectoral responses carry important implications for price stability governance, particularly as Saudi Arabia pursues sustainable economic diversification under Vision 2030.
These findings also show a significant difference between the extent of the responses within various sectors and the way in which they contribute to the overall WPI. Even though ores and minerals show the greatest proportional response, their share in the WPI is only 0.6%, which means that their impact on the overall price movement is limited. On the other hand, the sectors that have a higher weight—namely metal products, machinery and equipment (39.7%) and food products, beverages, tobacco and textiles (17.3%)—contribute much more to changes in the aggregate WPI.
5. Discussion
The finding that global supply chain shocks generate a significant but transitory positive effect on most wholesale price indices in Saudi Arabia is broadly consistent with evidence from advanced economies. Studies examining the post-COVID-19 supply chain disruption episode in Europe and the United States have similarly documented that the pass-through of supply bottlenecks to domestic prices, while sizeable in the short run, tends to fade over medium to longer horizons [1,22]. The present study extends this evidence to an emerging economy context, confirming that the transitory nature of supply chain inflation is not confined to high-income countries. Moreover, the consistency between the SVAR and LP estimates indicates that the main dynamic response pattern is robust to the choice of estimation method, in line with the methodological arguments advanced by Plagborg-Møller and Wolf [25] and applied in comparable settings by Diaz, Cunado and de Gracia [8,23].
A key contribution of this study lies in its use of disaggregated WPI components, which reveals considerable sectoral heterogeneity in the transmission of supply chain shocks. The large and persistent cumulative response of ores and minerals (MWPI) may reflect Saudi Arabia’s continued dependence on imported mineral inputs for its construction, manufacturing, and industrial sectors. Similarly, the notable response of agricultural and fishery products (AWPI) may be consistent with greater exposure of food-supply chains to global disruptions—a concern amplified by the fact that Saudi Arabia imports a substantial share of its food requirements. This distinction shows that the sectors most sensitive to supply-chain shocks are not necessarily those that contribute most to aggregate wholesale price movements. These sectoral patterns align with earlier findings on the determinants of inflation in Saudi Arabia and the broader GCC region [19,20,21], which highlighted the sensitivity of domestic prices to imported commodity costs. The different performances of various sectors can also be interpreted in light of Saudi Arabia’s dependence on imported production inputs and international logistics conditions. In the first quarter of 2026, capital and intermediate goods made up approximately 70.6% of total imports, showing how important imported inputs are for domestic production. This pattern of inputs provides a plausible channel through which global supply-chain disruptions may affect domestic production costs since such disruptions lead to higher expenses for inputs, freight, insurance and inventory, as well as longer delivery times. Sectors that rely more on imported inputs or have little ability to make short-term substitutions are likely to show larger price reactions to external supply disruptions. This mechanism may help to explain the varied responses seen among the components of the Wholesale Price Index (WPI).
Unlike most prior studies that rely on the CPI or PPI as inflation proxies, this study employs the WPI and its five sub-indices, capturing price dynamics at the wholesale level before they propagate downstream to consumer prices. This approach reveals transmission channels that may be obscured in aggregate CPI-based analyses. The relatively muted cumulative response of the general WPI (GWPI) compared to the sectoral sub-indices demonstrates that headline price indices can mask substantial heterogeneity in the inflationary impact of external shocks. This finding carries important implications for inflation monitoring in commodity-dependent economies, where sector-level price dynamics often diverge sharply from aggregate trends [16,17,18].
The leading indicator property of the GSCPI—which precedes the inflation peak by approximately three to five months—represents a directly actionable finding for macroeconomic management. Incorporating the GSCPI into Saudi Arabia’s monetary and fiscal surveillance frameworks could meaningfully improve the timeliness of policy responses to imported inflationary pressures, as originally proposed by Benigno, Di Giovanni, Groen and Noble [2]. This is especially pertinent given Saudi Arabia’s fixed exchange rate regime, which limits the use of the exchange rate as an automatic shock absorber and consequently places greater weight on forward-looking price monitoring tools as the primary line of defence against cost-push inflation.
From a sustainability perspective, the results carry implications that extend beyond near-term monetary policy. The findings show that there are two complementary aspects of vulnerability: ores and minerals as well as agricultural products show relatively strong proportional responses to supply-chain shocks, whereas the more heavily weighted categories—namely metal products, machinery and equipment and food-related products—contribute more to aggregate wholesale price movements. These sectoral patterns are also pertinent to Saudi Arabia’s Vision 2030 programme, especially in relation to its focus on import substitution, food security and domestic industrial development. The cumulative and differentiated inflationary pass-through documented here reinforces the economic rationale for supply chain diversification, strategic stockpiling of essential commodities, and sustained investment in domestic productive capacity. These measures should not be viewed solely as short-term stabilisation tools; they represent structural adjustments essential to building the resilient, diversified economy envisioned under Vision 2030. In this sense, supply chain resilience and price stability emerge as mutually reinforcing pillars of Saudi Arabia’s long-term sustainable development strategy.
Several limitations of the present study warrant acknowledgement. First, the analysis uses the aggregate GSCPI as the supply chain shock variable; future research could examine the inflationary effects of sector-specific or region-specific supply disruptions, which may exhibit different transmission dynamics. Second, the sample period encompasses the COVID-19 pandemic—an unprecedented supply chain disruption—and findings may not fully generalise to more moderate shock episodes. Third, while the WPI captures wholesale-level price dynamics, the downstream pass-through to consumer prices remains an important open question for future work. Finally, extending this analytical framework to other GCC economies would help determine whether the documented patterns are specific to Saudi Arabia’s economic structure or characteristic of commodity-dependent emerging economies more broadly.
6. Conclusions
The impact of global supply chain shocks on inflation in Saudi Arabia was evaluated in this study, using monthly data collected between January 2014 and March 2026. Both SVAR and LP models were employed to estimate the impulse response functions of inflation in response to these shocks. Notably, most prior research has concentrated on the inflationary effects of supply chain shocks in advanced economies; there has been little focus on emerging economies. In addition, unlike previous studies, the WPI and its five components were used as measures of inflation rather than the CPI or PPI. These choices reflect a broader concern with supply chain resilience as a dimension of economic sustainability, particularly relevant for commodity-dependent economies such as Saudi Arabia. Results from standard impulse responses suggest that inflation from global supply chain shocks is mostly temporary. These effects peak within the first few months and then lose statistical significance. Still, the cumulative impulse responses reveal that the inflationary pressures from those early months accumulate over time, leading to a lasting positive effect on several wholesale price categories. Thus, while the shocks do not cause inflation to rise indefinitely, they do leave a lasting cumulative impact on wholesale price inflation.
These results add to the literature on economic sustainability by pinpointing the specific industry channels via which global supply-chain disruptions damage the conditions of sustainable growth. The relatively strong proportional responses observed in ores and minerals and agricultural products highlight their sensitivity to global supply-chain disruptions. However, the small weight of ores and minerals in the WPI limits their contribution to aggregate wholesale price movements, which are more strongly influenced by higher-weight categories, particularly metal products, machinery and equipment and food-related products. Overall, the results suggest that supply-chain resilience is not only a macroeconomic stability goal but a core sustainability policy requirement.
While the global supply chain shocks that have driven inflation seem to be largely transitory, these findings have several important policy implications, both in terms of short-term inflation mitigation measures and in terms of long-term sustainability-oriented policies. In the short term, since inflation typically peaks three to five months after a supply chain shock, the Global Supply Chain Pressure Index (GSCPI) could be a useful early-warning indicator for wholesale price inflation. Adding such an indicator to Saudi Arabia’s inflation tracking and forecasting would help monetary and fiscal authorities better forecast cost-push inflation from international disruptions. Moreover, by properly managing stocks and ensuring that essential inputs and items are available, it is possible to lessen the effect of short-term supply disruptions and prevent external shocks from being passed on to domestic prices. The most significant proportional responses were observed in the case of ores and minerals as well as in agricultural products, and the more heavily weighted categories are still of particular importance for overall wholesale price movements. It is therefore important to strengthen the supply chains in these sectors by diversifying both the sources of imports and the transportation routes.
Lastly, the findings emphasize the necessity of encouraging local production of intermediate inputs and raw materials to reduce the economy’s dependence on foreign supply chains and enhance its resilience to future global shocks—which aligns with Saudi Arabia’s Vision 2030 goals of economic diversification and long-term sustainable development. There are some limitations in this study. The sample period of January 2014 to March 2026 contains a number of overlapping structural disruptions, including the COVID-19 pandemic (from March 2020), the subsequent global shipping and logistics crisis (2021–2022), and geopolitics shocks like the Russia–Ukraine conflict (February 2022). As these events are happening in parallel, it is hard to attribute the inflationary impacts solely to global supply-chain pressure. In fact, the GSCPI hit historical highs precisely during the pandemic demand collapse and post-pandemic supply bottlenecks. Future studies using structural break tests, and period-specific dummy variables, would help to untangle these overlapping channels more carefully.
Several avenues for future research emerge from this study. Future work could extend the analysis to other GCC economies to assess whether the inflationary patterns documented here are region-wide, or specific to Saudi Arabia’s economic structure. Additionally, incorporating disaggregated supply chain indices—distinguishing between demand-driven and supply-driven disruptions—could provide more granular insights into the transmission mechanisms identified in this paper.
Author Contributions
Conceptualization, R.A., B.M.A. and J.B.; methodology, R.A.; software, R.A.; validation, R.A., B.M.A. and J.B.; formal analysis, R.A.; investigation, R.A., B.M.A. and J.B.; resources, R.A.; writing—original draft preparation, R.A. and B.M.A.; writing—review and editing, R.A., B.M.A. and J.B.; funding acquisition, J.B. All authors have read and agreed to the published version of the manuscript.
Funding
This research was funded by the Princess Nourah bint Abdulrahman University Researchers Supporting Project number (PNURSP2026R540), Princess Nourah bint Abdulrahman University, Riyadh, Saudi Arabia.
Institutional Review Board Statement
Not applicable.
Informed Consent Statement
Not applicable.
Data Availability Statement
The data presented in this study are openly available in World bank at http://databank.worldbank.org/data/source/world-development-indicators (accessed on 28 March 2026).
Acknowledgments
The authors extend their appreciation to the Princess Nourah bint Abdulrahman University Researchers Supporting Project number (PNURSP2026R540), Princess Nourah bint Abdulrahman University, Riyadh, Saudi Arabia.
Conflicts of Interest
The authors declare no conflicts of interest.
Appendix A
Appendix A.1. Relative Weights of Wholesale Price Index Components
| WPI Component | Abbreviation | Weight (%) |
| Agriculture and fishery products | AWPI | 8.7 |
| Ores and minerals | MWPI | 0.6 |
| Food products, beverages, tobacco, and textiles | FWPI | 17.3 |
| Other transportable goods, except metal products, machinery, and equipment | OWPI | 33.7 |
| Metal products, machinery, and equipment | CWPI | 39.7 |
| General Wholesale Price Index | GWPI | 100.0 |
Appendix A.2. Augmented Dickey–Fuller (ADF) Unit Root Test Results
| Variable | ADF Statistic | 5% Critical Value |
| GSCPI | −2.17 ** | −1.950 |
| dgwpi | −8.29 *** | −2.887 |
| dawpi | −8.62 *** | −2.887 |
| dmwpi | −9.47 *** | −2.887 |
| dfwpi | −8.13 *** | −2.887 |
| dowpi | −8.17 *** | −2.887 |
| dcwpi | −6.97 *** | −2.887 |
| dloil | −8.83 *** | −2.887 |
| dcpi | −9.45 *** | −2.887 |
| dlrealr | −13.93 *** | −2.887 |
| dlreer | −7.35 *** | −2.887 |
| *** and ** denote significance at the 1% and 5% level, respectively. | ||
Appendix A.3. Residual Serial Correlation LM Test
| Model | Inflation Measure in VAR | LM Lag Reported * | χ2 | p-Value |
| Model 1 | GWPI | 12 | 11.35 | 0.991 |
| Model 2 | AWPI | 12 | 12.78 | 0.979 |
| Model 3 | MWPI | 12 | 8.84 | 0.998 |
| Model 4 | FWPI | 12 | 26.41 | 0.386 |
| Model 5 | OWPI | 12 | 16.43 | 0.902 |
| Model 6 | CWPI | 12 | 24.53 | 0.489 |
| * LM tests were conducted for lag orders 1–12 for each VAR specification; for compactness, the table reports the results at lag 12. | ||||
Appendix A.4. Robustness Check: Impulse Response Function of Inflation to Structural Global Supply-Chain Pressure Shock
Figure A1.
Robustness Check: Impulse Response Function of Inflation to Structural Global Supply-Chain Pressure Shock. Note: Optimal lag length is reported in parentheses based on the Akaike Information Criterion (AIC).
Appendix A.5. Robustness Check: SVAR Cumulative Impulse Response Function to Structural Global Supply-Chain Pressure Shock
Figure A2.
Robustness Check: SVAR Cumulative Impulse Response Function to Structural Global Supply-Chain Pressure Shock. Note: Optimal lag length is reported in parentheses based on the Akaike Information Criterion (AIC).
Appendix A.6. Robustness Check: Impulse Response Function of Inflation to Structural Global Supply-Chain Pressure Shock Under Alternative SVAR Ordering
Figure A3.
Robustness Check: Impulse Response Function of Inflation to Structural Global Supply-Chain Pressure Shock Under Alternative SVAR Ordering.
Appendix A.7. Impulse Response Estimates for GWPI
| Model 1: Baseline Specification (12 Lags) | Model 2: AIC-Selected Lag Specification (4 Lags) | |||||||||||
| Step | LP Response | LP_S.E. | SVAR Response | SVAR_S.E. | SVAR Cumulative Response | SVAR Cumulative S.E. | LP Response | LP_S.E. | SVAR Response | SVAR_S.E. | SVAR Cumulative Response | SVAR Cumulative S.E. |
| 0 | 0.133 | 0.124 | 0.124 | 0.099 | 0.124 | 0.099 | 0.091 | 0.072 | 0.109 | 0.116 | 0.109 | 0.116 |
| 1 | −0.082 | 0.087 | −0.029 | 0.105 | 0.094 | 0.126 | 0.056 | 0.071 | 0.056 | 0.119 | 0.165 | 0.161 |
| 2 | −0.295 | 0.199 | −0.27 | 0.111 | −0.175 | 0.155 | −0.203 | 0.199 | −0.186 | 0.122 | −0.021 | 0.206 |
| 3 | 0.188 | 0.056 | 0.185 | 0.112 | 0.01 | 0.171 | 0.149 | 0.077 | 0.129 | 0.122 | 0.108 | 0.24 |
| 4 | 0.338 | 0.068 | 0.229 | 0.113 | 0.239 | 0.185 | 0.288 | 0.058 | 0.254 | 0.124 | 0.363 | 0.267 |
| 5 | 0.371 | 0.141 | 0.272 | 0.113 | 0.511 | 0.195 | 0.245 | 0.152 | 0.067 | 0.073 | 0.43 | 0.269 |
| 6 | −0.024 | 0.1 | −0.012 | 0.113 | 0.498 | 0.212 | 0.177 | 0.076 | 0.022 | 0.069 | 0.453 | 0.275 |
| 7 | −0.008 | 0.117 | 0.008 | 0.114 | 0.507 | 0.229 | 0.038 | 0.075 | 0.008 | 0.056 | 0.461 | 0.274 |
| 8 | −0.035 | 0.084 | −0.053 | 0.113 | 0.453 | 0.243 | 0.002 | 0.056 | −0.058 | 0.042 | 0.403 | 0.272 |
| 9 | −0.121 | 0.064 | −0.102 | 0.112 | 0.351 | 0.254 | −0.127 | 0.042 | −0.066 | 0.037 | 0.337 | 0.27 |
| 10 | 0.006 | 0.069 | 0.05 | 0.115 | 0.401 | 0.263 | 0.072 | 0.1 | 0 | 0.029 | 0.337 | 0.268 |
| 11 | −0.058 | 0.084 | −0.018 | 0.115 | 0.383 | 0.273 | 0.004 | 0.098 | 0.025 | 0.023 | 0.362 | 0.267 |
| 12 | 0.062 | 0.11 | 0.093 | 0.116 | 0.476 | 0.284 | 0.193 | 0.113 | 0.016 | 0.018 | 0.378 | 0.267 |
| 13 | 0.071 | 0.064 | −0.102 | 0.102 | 0.374 | 0.283 | 0.205 | 0.077 | 0.01 | 0.017 | 0.388 | 0.268 |
| 14 | −0.113 | 0.154 | 0.069 | 0.097 | 0.443 | 0.282 | −0.139 | 0.189 | −0.004 | 0.014 | 0.383 | 0.268 |
| 15 | 0.052 | 0.077 | −0.031 | 0.093 | 0.412 | 0.278 | 0.121 | 0.093 | −0.011 | 0.011 | 0.372 | 0.268 |
Appendix A.8. Impulse Response Estimates for AWPI
| Model 1: Baseline Specification (12 Lags) | Model 2: AIC-Selected Lag Specification (6 Lags) | |||||||||||
| Step | LP Response | LP_S.E. | SVAR Response | SVAR_S.E. | SVAR Cumulative Response | SVAR Cumulative S.E. | LP Response | LP_S.E. | SVAR Response | SVAR_S.E. | SVAR Cumulative Response | SVAR Cumulative S.E. |
| 0 | 0.268 | 0.112 | 0.274 | 0.1 | 0.274 | 0.1 | 0.318 | 0.097 | 0.313 | 0.111 | 0.313 | 0.111 |
| 1 | 0.299 | 0.14 | 0.196 | 0.103 | 0.47 | 0.126 | 0.239 | 0.163 | 0.168 | 0.11 | 0.481 | 0.145 |
| 2 | −0.094 | 0.113 | −0.146 | 0.104 | 0.323 | 0.143 | −0.086 | 0.145 | −0.09 | 0.104 | 0.39 | 0.163 |
| 3 | 0.336 | 0.117 | 0.305 | 0.105 | 0.628 | 0.173 | 0.342 | 0.115 | 0.318 | 0.108 | 0.709 | 0.195 |
| 4 | 0.125 | 0.09 | 0.057 | 0.104 | 0.685 | 0.194 | 0.123 | 0.1 | 0.137 | 0.106 | 0.846 | 0.221 |
| 5 | 0.343 | 0.092 | 0.207 | 0.105 | 0.893 | 0.204 | 0.244 | 0.082 | 0.16 | 0.109 | 1.006 | 0.231 |
| 6 | 0.028 | 0.073 | 0.036 | 0.108 | 0.928 | 0.22 | 0.053 | 0.091 | 0.151 | 0.111 | 1.157 | 0.246 |
| 7 | 0.154 | 0.061 | 0.13 | 0.108 | 1.058 | 0.23 | 0.095 | 0.074 | 0.038 | 0.075 | 1.195 | 0.248 |
| 8 | 0.105 | 0.097 | −0.005 | 0.108 | 1.053 | 0.23 | 0.086 | 0.083 | −0.119 | 0.071 | 1.076 | 0.245 |
| 9 | −0.116 | 0.096 | −0.066 | 0.107 | 0.987 | 0.231 | −0.04 | 0.101 | −0.067 | 0.068 | 1.008 | 0.243 |
| 10 | −0.061 | 0.073 | 0.042 | 0.105 | 1.029 | 0.233 | 0.128 | 0.089 | −0.017 | 0.047 | 0.992 | 0.236 |
| 11 | −0.001 | 0.134 | 0.002 | 0.105 | 1.031 | 0.234 | −0.069 | 0.141 | −0.056 | 0.046 | 0.936 | 0.23 |
| 12 | −0.014 | 0.087 | 0.012 | 0.106 | 1.043 | 0.241 | 0.084 | 0.106 | −0.015 | 0.04 | 0.921 | 0.229 |
| 13 | 0.12 | 0.104 | −0.062 | 0.088 | 0.981 | 0.235 | 0.183 | 0.118 | 0.016 | 0.035 | 0.937 | 0.227 |
| 14 | −0.129 | 0.116 | 0.047 | 0.084 | 1.028 | 0.235 | −0.222 | 0.144 | 0.01 | 0.032 | 0.947 | 0.226 |
| 15 | 0.192 | 0.06 | −0.004 | 0.082 | 1.024 | 0.235 | 0.1 | 0.073 | −0.008 | 0.027 | 0.939 | 0.225 |
Appendix A.9. Impulse Response Estimates for MWPI
| Model 1: Baseline Specification (12 Lags) | Model 2: AIC-Selected Lag Specification (6 Lags) | |||||||||||
| Step | LP Response | LP_S.E. | SVAR Response | SVAR_S.E. | SVAR Cumulative Response | SVAR Cumulative S.E. | LP Response | LP_S.E. | SVAR Response | SVAR_S.E. | SVAR Cumulative Response | SVAR Cumulative S.E. |
| 0 | 0.039 | 0.065 | 0.062 | 0.076 | 0.062 | 0.076 | 0.08 | 0.078 | 0.098 | 0.089 | 0.098 | 0.089 |
| 1 | 0.032 | 0.065 | −0.01 | 0.081 | 0.052 | 0.095 | 0.025 | 0.079 | 0.017 | 0.091 | 0.115 | 0.123 |
| 2 | −0.206 | 0.095 | −0.16 | 0.083 | −0.109 | 0.108 | −0.204 | 0.131 | −0.159 | 0.087 | −0.044 | 0.142 |
| 3 | 0.231 | 0.056 | 0.282 | 0.083 | 0.173 | 0.118 | 0.265 | 0.07 | 0.221 | 0.087 | 0.177 | 0.166 |
| 4 | 0.381 | 0.086 | 0.299 | 0.085 | 0.472 | 0.129 | 0.293 | 0.155 | 0.247 | 0.09 | 0.424 | 0.197 |
| 5 | 0.146 | 0.114 | 0.18 | 0.085 | 0.652 | 0.144 | 0.196 | 0.123 | 0.2 | 0.09 | 0.624 | 0.215 |
| 6 | 0.163 | 0.063 | 0.221 | 0.093 | 0.873 | 0.177 | 0.193 | 0.049 | 0.216 | 0.097 | 0.84 | 0.245 |
| 7 | 0.182 | 0.066 | 0.22 | 0.092 | 1.094 | 0.2 | 0.302 | 0.091 | 0.122 | 0.071 | 0.962 | 0.269 |
| 8 | 0.163 | 0.055 | 0.152 | 0.092 | 1.245 | 0.216 | 0.182 | 0.08 | 0.01 | 0.067 | 0.973 | 0.28 |
| 9 | 0.037 | 0.061 | 0.055 | 0.09 | 1.301 | 0.232 | 0.062 | 0.068 | −0.05 | 0.063 | 0.922 | 0.293 |
| 10 | −0.11 | 0.066 | −0.013 | 0.089 | 1.288 | 0.246 | −0.135 | 0.059 | 0.019 | 0.055 | 0.941 | 0.308 |
| 11 | 0.002 | 0.045 | 0.086 | 0.091 | 1.373 | 0.263 | −0.042 | 0.068 | 0.019 | 0.05 | 0.96 | 0.32 |
| 12 | −0.086 | 0.068 | −0.055 | 0.09 | 1.318 | 0.276 | 0.076 | 0.064 | 0.004 | 0.045 | 0.964 | 0.33 |
| 13 | 0.091 | 0.046 | 0.009 | 0.079 | 1.328 | 0.285 | 0.123 | 0.076 | 0.031 | 0.033 | 0.995 | 0.338 |
| 14 | −0.107 | 0.057 | −0.127 | 0.077 | 1.201 | 0.291 | −0.248 | 0.111 | −0.03 | 0.031 | 0.965 | 0.343 |
| 15 | −0.078 | 0.06 | −0.06 | 0.077 | 1.141 | 0.298 | 0.061 | 0.047 | −0.034 | 0.028 | 0.931 | 0.347 |
Appendix A.10. Impulse Response Estimates for FWPI
| Model 1: Baseline Specification (12 Lags) | Model 2: AIC-Selected Lag Specification (6 Lags) | |||||||||||
| Step | LP Response | LP_S.E. | SVAR Response | SVAR_S.E. | SVAR Cumulative Response | SVAR Cumulative S.E. | LP Response | LP_S.E. | SVAR Response | SVAR_S.E. | SVAR Cumulative Response | SVAR Cumulative S.E. |
| 0 | 0.11 | 0.071 | 0.118 | 0.054 | 0.118 | 0.054 | 0.108 | 0.048 | 0.112 | 0.063 | 0.112 | 0.063 |
| 1 | 0.161 | 0.06 | 0.109 | 0.057 | 0.227 | 0.072 | 0.042 | 0.066 | 0.031 | 0.065 | 0.144 | 0.09 |
| 2 | −0.099 | 0.078 | −0.082 | 0.059 | 0.145 | 0.089 | −0.133 | 0.088 | −0.099 | 0.064 | 0.044 | 0.11 |
| 3 | 0.122 | 0.06 | 0.148 | 0.06 | 0.293 | 0.106 | 0.121 | 0.068 | 0.141 | 0.066 | 0.185 | 0.129 |
| 4 | 0.274 | 0.1 | 0.23 | 0.062 | 0.524 | 0.121 | 0.259 | 0.151 | 0.214 | 0.07 | 0.399 | 0.146 |
| 5 | 0.278 | 0.101 | 0.254 | 0.063 | 0.777 | 0.13 | 0.303 | 0.118 | 0.273 | 0.071 | 0.672 | 0.156 |
| 6 | 0.118 | 0.047 | 0.137 | 0.063 | 0.914 | 0.141 | 0.165 | 0.059 | 0.106 | 0.07 | 0.778 | 0.169 |
| 7 | −0.118 | 0.104 | −0.066 | 0.067 | 0.848 | 0.158 | −0.064 | 0.068 | −0.027 | 0.053 | 0.75 | 0.176 |
| 8 | 0.059 | 0.055 | 0.054 | 0.068 | 0.902 | 0.167 | 0.001 | 0.048 | 0.018 | 0.05 | 0.768 | 0.178 |
| 9 | −0.069 | 0.055 | −0.038 | 0.067 | 0.864 | 0.176 | −0.05 | 0.038 | −0.054 | 0.046 | 0.715 | 0.181 |
| 10 | −0.086 | 0.07 | −0.024 | 0.068 | 0.84 | 0.182 | −0.056 | 0.031 | 0.019 | 0.041 | 0.733 | 0.185 |
| 11 | 0.005 | 0.06 | 0.015 | 0.069 | 0.855 | 0.188 | −0.009 | 0.034 | 0.023 | 0.036 | 0.756 | 0.189 |
| 12 | −0.006 | 0.056 | −0.011 | 0.07 | 0.843 | 0.193 | 0.077 | 0.102 | 0.012 | 0.029 | 0.768 | 0.192 |
| 13 | 0.072 | 0.081 | −0.107 | 0.064 | 0.736 | 0.194 | 0.05 | 0.035 | 0.001 | 0.027 | 0.769 | 0.194 |
| 14 | −0.133 | 0.087 | −0.123 | 0.062 | 0.614 | 0.2 | −0.164 | 0.113 | −0.012 | 0.021 | 0.758 | 0.195 |
| 15 | −0.047 | 0.054 | 0.017 | 0.06 | 0.631 | 0.203 | 0.008 | 0.053 | −0.007 | 0.02 | 0.75 | 0.195 |
Appendix A.11. Impulse Response Estimates for CWPI
| Model 1: Baseline Specification (12 Lags) | Model 2: AIC-Selected Lag Specification (4 Lags) | |||||||||||
| Step | LP Response | LP_S.E. | SVAR Response | SVAR_S.E. | SVAR Cumulative Response | SVAR Cumulative S.E. | LP Response | LP_S.E. | SVAR Response | SVAR_S.E. | SVAR Cumulative Response | SVAR Cumulative S.E. |
| 0 | 0.032 | 0.045 | 0.062 | 0.054 | 0.062 | 0.054 | 0.061 | 0.046 | 0.071 | 0.068 | 0.071 | 0.068 |
| 1 | 0.151 | 0.06 | 0.102 | 0.056 | 0.163 | 0.073 | 0.115 | 0.044 | 0.077 | 0.067 | 0.149 | 0.096 |
| 2 | −0.126 | 0.106 | −0.094 | 0.063 | 0.069 | 0.098 | −0.079 | 0.144 | −0.086 | 0.075 | 0.062 | 0.132 |
| 3 | 0.24 | 0.055 | 0.238 | 0.067 | 0.307 | 0.114 | 0.241 | 0.066 | 0.2 | 0.078 | 0.263 | 0.158 |
| 4 | 0.205 | 0.083 | 0.178 | 0.069 | 0.485 | 0.134 | 0.244 | 0.114 | 0.217 | 0.08 | 0.48 | 0.182 |
| 5 | 0.349 | 0.126 | 0.321 | 0.068 | 0.806 | 0.146 | 0.308 | 0.179 | 0.129 | 0.057 | 0.609 | 0.193 |
| 6 | −0.016 | 0.058 | 0.036 | 0.068 | 0.842 | 0.161 | 0.072 | 0.028 | −0.019 | 0.056 | 0.589 | 0.207 |
| 7 | −0.021 | 0.07 | 0.044 | 0.068 | 0.886 | 0.169 | 0.061 | 0.029 | −0.046 | 0.045 | 0.544 | 0.212 |
| 8 | −0.104 | 0.079 | −0.012 | 0.066 | 0.874 | 0.174 | 0.03 | 0.032 | −0.024 | 0.037 | 0.52 | 0.215 |
| 9 | −0.049 | 0.062 | −0.003 | 0.068 | 0.871 | 0.18 | 0.018 | 0.035 | −0.031 | 0.032 | 0.489 | 0.214 |
| 10 | −0.039 | 0.062 | −0.016 | 0.069 | 0.856 | 0.186 | 0.011 | 0.043 | 0.016 | 0.025 | 0.505 | 0.213 |
| 11 | −0.026 | 0.081 | −0.055 | 0.072 | 0.8 | 0.193 | −0.044 | 0.044 | 0.014 | 0.02 | 0.519 | 0.21 |
| 12 | −0.068 | 0.074 | −0.08 | 0.076 | 0.721 | 0.194 | 0.038 | 0.056 | −0.009 | 0.016 | 0.51 | 0.208 |
| 13 | 0.153 | 0.108 | −0.116 | 0.071 | 0.605 | 0.189 | 0.079 | 0.068 | −0.02 | 0.014 | 0.49 | 0.206 |
| 14 | −0.042 | 0.078 | −0.032 | 0.069 | 0.574 | 0.187 | −0.097 | 0.119 | −0.011 | 0.011 | 0.479 | 0.205 |
| 15 | 0.085 | 0.038 | 0.027 | 0.065 | 0.6 | 0.185 | 0.062 | 0.06 | 0.001 | 0.009 | 0.48 | 0.204 |
Appendix A.12. Impulse Response Estimates for OWPI
| Model 1: Baseline Specification (12 Lags) | Model 2: AIC-Selected Lag Specification (4 Lags) | |||||||||||
| Step | LP Response | LP_S.E. | SVAR Response | SVAR_S.E. | SVAR Cumulative Response | SVAR Cumulative S.E. | LP Response | LP_S.E. | SVAR Response | SVAR_S.E. | SVAR Cumulative Response | SVAR Cumulative S.E. |
| 0 | 0.204 | 0.23 | 0.101 | 0.215 | 0.101 | 0.215 | 0.051 | 0.15 | 0.085 | 0.248 | 0.085 | 0.248 |
| 1 | −0.454 | 0.212 | −0.21 | 0.221 | −0.109 | 0.284 | −0.086 | 0.223 | −0.016 | 0.254 | 0.069 | 0.342 |
| 2 | −0.548 | 0.413 | −0.496 | 0.226 | −0.605 | 0.341 | −0.435 | 0.427 | −0.341 | 0.252 | −0.272 | 0.43 |
| 3 | 0.071 | 0.136 | 0.113 | 0.228 | −0.492 | 0.374 | −0.033 | 0.168 | 0.044 | 0.252 | −0.228 | 0.501 |
| 4 | 0.559 | 0.14 | 0.344 | 0.228 | −0.148 | 0.408 | 0.415 | 0.172 | 0.381 | 0.255 | 0.153 | 0.564 |
| 5 | 0.323 | 0.275 | 0.171 | 0.228 | 0.023 | 0.434 | 0.032 | 0.269 | 0.072 | 0.134 | 0.224 | 0.573 |
| 6 | −0.171 | 0.247 | −0.092 | 0.229 | −0.069 | 0.475 | 0.288 | 0.192 | 0.108 | 0.124 | 0.333 | 0.595 |
| 7 | 0.027 | 0.198 | 0.008 | 0.23 | −0.061 | 0.513 | 0.02 | 0.175 | 0.05 | 0.11 | 0.383 | 0.608 |
| 8 | −0.065 | 0.219 | −0.047 | 0.229 | −0.108 | 0.535 | −0.001 | 0.151 | −0.048 | 0.073 | 0.335 | 0.613 |
| 9 | −0.35 | 0.192 | −0.273 | 0.231 | −0.381 | 0.555 | −0.315 | 0.121 | −0.088 | 0.061 | 0.248 | 0.61 |
| 10 | −0.099 | 0.129 | 0.098 | 0.236 | −0.283 | 0.567 | 0.027 | 0.208 | −0.021 | 0.049 | 0.227 | 0.61 |
| 11 | −0.142 | 0.171 | −0.028 | 0.24 | −0.311 | 0.587 | 0.063 | 0.222 | 0.02 | 0.037 | 0.247 | 0.611 |
| 12 | 0.196 | 0.183 | 0.345 | 0.241 | 0.034 | 0.608 | 0.356 | 0.238 | 0.029 | 0.031 | 0.276 | 0.613 |
| 13 | 0.038 | 0.158 | 0.001 | 0.206 | 0.035 | 0.608 | 0.461 | 0.219 | 0.023 | 0.029 | 0.299 | 0.617 |
| 14 | −0.07 | 0.221 | 0.234 | 0.198 | 0.269 | 0.604 | −0.302 | 0.387 | 0.002 | 0.024 | 0.301 | 0.619 |
| 15 | 0.058 | 0.174 | −0.021 | 0.19 | 0.248 | 0.599 | 0.296 | 0.207 | −0.011 | 0.018 | 0.29 | 0.62 |
References
- Bańbura, M.; Bobeica, E.; Hernández, C.M. What Drives Core Inflation? The Role of Supply Shocks. In ECB Working Paper Series; European Central Bank: Frankfurt, Germany, 2023. [Google Scholar]
- Benigno, G.; Di Giovanni, J.; Groen, J.J.; Noble, A.I. The GSCPI: A New Barometer of Global Supply Chain Pressures. In FRB of New York Staff Report; Federal Reserve Bank: New York, NY, USA, 2022. [Google Scholar]
- Aguiluz, E.M.D.; Cunado, J.; de Gracia, F.P. Commodity price shocks, supply chain disruptions and US inflation. Finance Res. Lett. 2023, 58, 104495. [Google Scholar] [CrossRef] [Scilit]
- Ascari, G.; Bonam, D.; Smadu, A. Global supply chain pressures, inflation, and implications for monetary policy. J. Int. Money Finance 2024, 142, 103029. [Google Scholar] [CrossRef] [Scilit]
- Andriantomanga, Z.; Bolhuis, M.A.; Hakobyan, S. Global Supply Chain Disruptions: Challenges for Inflation and Monetary Policy in Sub-Saharan Africa; International Monetary Fund: Washington, DC, USA, 2023. [Google Scholar]
- Carrière-Swallow, Y.; Deb, P.; Furceri, D.; Jiménez, D.; Ostry, J.D. Shipping costs and inflation. J. Int. Money Finance 2023, 130, 102771. [Google Scholar] [CrossRef] [Scilit] [PubMed]
- Albahouth, A.A. The Impact of Supply Chain Disruptions and Global Uncertainty on Inflation Rate in Saudi Arabia. Risks 2025, 13, 54. [Google Scholar] [CrossRef] [Scilit]
- Diaz, E.M.; Cunado, J.; de Gracia, F.P. Global Drivers of Inflation: The Role of Supply Chain Disruptions and Commodity Price Shocks. Econ. Model. 2024, 140, 106860. [Google Scholar] [CrossRef] [Scilit]
- Wang, R. Global Supply Chain Disruptions, Commodity Price Shocks and Inflation in Japan. Int. J. Empir. Econ. 2024, 3, 2450004. [Google Scholar] [CrossRef] [Scilit]
- LaBelle, J.; Santacreu, A.M. Global Supply Chain Disruptions and Inflation During the COVID-19 Pandemic; SSRN 4029211; SSRN (Social Science Research Network): Rochester, NY, USA, 2022. [Google Scholar]
- Liu, Z.; Nguyen, T.L. Global Supply Chain Pressures and US Inflation. FRBSF Econ. Lett. 2023, 14, 1–6. [Google Scholar]
- Tillmann, P. The Asymmetric Effect of Supply Chain Pressure on Inflation. Econ. Lett. 2024, 235, 111540. [Google Scholar] [CrossRef] [Scilit]
- Platitas, R.J.C.; Ocampo, J.C.G. From Bottlenecks to Inflation: Impact of Global Supply-Chain Disruptions on Inflation in Select Asian Economies. Lat. Am. J. Cent. Bank. 2025, 6, 100141. [Google Scholar] [CrossRef] [Scilit]
- Hakan, Y. Global Turbulence and Inflation: Evidence from Emerging Markets; SSRN 5830462; SSRN (Social Science Research Network): Rochester, NY, USA, 2025. [Google Scholar]
- Medina-Espidio, S. Inflation Risk Management with Global Supply Disruptions: Evidence from Mexico. Lat. Am. J. Cent. Bank. 2026, 100213. [Google Scholar] [CrossRef] [Scilit]
- Ye, M.; Mohammed, K.S.; Tiwari, S.; Raza, S.A.; Chen, L. The Effect of the Global Supply Chain and Oil Prices on the Inflation Rates in Advanced Economies and Emerging Markets. Geol. J. 2023, 58, 2805–2817. [Google Scholar] [CrossRef] [Scilit]
- Saidi, D.; El Alami, J.; Hlyal, M. Building Sustainable Resilient Supply Chains in Emerging Economies: Review of Motivations and Holistic Framework. IOP Conf. Ser. Earth Environ. Sci. 2021, 690, 012057. [Google Scholar] [CrossRef] [Scilit]
- Fareed, F.; Rezghi, A.; Sandoz, C. Inflation Dynamics in the Gulf Cooperation Council (GCC): What Is the Role of External Factors? International Monetary Fund: Washington, DC, USA, 2023. [Google Scholar]
- Basher, S.A.; Elsamadisy, E.M. Country Heterogeneity and Long-Run Determinants of Inflation in the Gulf Arab States. OPEC Energy Rev. 2012, 36, 170–203. [Google Scholar] [CrossRef] [Scilit]
- Al-Khathlan, K. Inflation in the Kingdom of Saudi Arabia: The Bound Test Analysis. Afr. J. Bus. Manag. 2011, 5, 10156. [Google Scholar] [CrossRef] [Scilit]
- Jawad, K.A. Inflation in Saudi Arabia: Long and Short Run Determinants. Master’s Thesis, The British University in Dubai, Dubai, United Arab Emirates, 2015. [Google Scholar]
- Finck, D.; Tillmann, P. The Macroeconomic Effects of Global Supply Chain Disruptions. In IMFS Working Paper Series; Goethe University Frankfurt, Institute for Monetary and Financial Stability: Frankfurt, Germany, 2023. [Google Scholar]
- Asadollah, O.; Carmy, L.S.; Hoque, M.R.; Yilmazkuday, H. Geopolitical Risk, Supply Chains, and Global Inflation. World Econ. 2024, 47, 3450–3486. [Google Scholar] [CrossRef] [Scilit]
- Li, D.; Plagborg-Møller, M.; Wolf, C.K. Local Projections Vs. Vars: Lessons from Thousands of Dgps. J. Econom. 2024, 244, 105722. [Google Scholar] [CrossRef] [Scilit]
- Plagborg-Møller, M.; Wolf, C.K. Local Projections and VARs Estimate the Same Impulse Responses. Econometrica 2021, 89, 955–980. [Google Scholar] [CrossRef] [Scilit]
- Jordà, Ò. Estimation and Inference of Impulse Responses by Local Projections. Am. Econ. Rev. 2005, 95, 161–182. [Google Scholar] [CrossRef] [Scilit]
- Mignon, V.; Saadaoui, J. How Do Political Tensions and Geopolitical Risks Impact Oil Prices? Energy Econ. 2024, 129, 107219. [Google Scholar] [CrossRef] [Scilit]

Disclaimer/Publisher’s Note: The statements, opinions and data contained in all publications are solely those of the individual author(s) and contributor(s) and not of MDPI and/or the editor(s). MDPI and/or the editor(s) disclaim responsibility for any injury to people or property resulting from any ideas, methods, instructions or products referred to in the content. |
© 2026 by the authors. Licensee MDPI, Basel, Switzerland. This article is an open access article distributed under the terms and conditions of the Creative Commons Attribution (CC BY) license.