


Abstract
Climate change represents a profound global crisis and the most significant threat to contemporary agricultural systems. This study evaluates the adoption status of Climate-Smart agricultural (CSA) practices among smallholder households and identifies the key factors influencing their adoption in the West Belesa district of Northwest Ethiopia. This study justifies the gaps in CSA adoption. Using a stratified random sampling technique, 400 respondents were selected. The research employed a mixed-methods approach, collecting primary quantitative data through structured surveys, which were then cross-verified with qualitative insights from Focus Group Discussions (FGDs) and Key Informant Interviews (KIIs). Data analysis was performed using descriptive statistics and a binary logistic regression model to isolate the specific economic and institutional drivers of adoption. The results show that 56.3% of the sampled households have adopted at least one CSA practice. However, a significant gender gap was identified, with only 50.5% of female-headed households adopting these practices compared to higher rates among their male counterparts (62%). The binary logit model reveals that adoption is positively, negatively and significantly influenced by farming experience (B = 0.104, odds = 1.110), age (B = −0.065, odds = 0.937),family size (B = −0.216,odds = 0.805), frequency of extension contact (B = −1.721,odds = 0.179), and access to credit (B = −2.073,odds = 0.126). Furthermore, the decision to adopt is strongly tied to the farmer’s information needs and their perception of the technology’s ability to boost productivity.
1. Introduction
Climate change represents a profound global crisis and the most significant threat to contemporary agricultural systems, defined as a statistically significant shift in the mean state or variability of climate patterns persisting over extended periods. These environmental shifts have precipitated a critical decline in essential natural resources, specifically biodiversity, soil health, and water availability, thereby deteriorating the living conditions of millions globally [1,2]. Consequently, global food security is confronting unprecedented challenges that are projected to intensify alongside anthropogenic pressures, such as rapid population growth, urbanization, and economic expansion. These pressures are further exacerbated by the increasing frequency of extreme weather events and climatic variability, including prolonged droughts and devastating floods [3]. For smallholder systems, the primary stressors resulting from these shifts include intensified heat stress, acute water scarcity, and increasing salinity stress, all of which compromise crop physiology and yield stability [4]. Current climate models indicate that following a 0.80 °C rise in global temperatures over the last century, further increases of 1.50 °C to 4.80 °C are anticipated in the coming century [1]. By 2050, these deteriorating conditions are expected to jeopardize the livelihoods of approximately 9 billion people, primarily through the intensification of poverty and chronic hunger in developing nations where environmental and socio-economic vulnerabilities intersect [1,5].
In the Ethiopian context, the vulnerability of the agricultural sector is acutely magnified by a heavy structural reliance on subsistence rain-fed farming, unpredictable rainfall patterns, and recurrent droughts [4,6]. Given that agriculture remains a cornerstone of the national economy, climate-induced disruptions directly jeopardize rural employment, food security, and broader economic stability [2,7]. To mitigate these systemic risks, Climate-Smart Agriculture (CSA) has been promoted as a comprehensive management strategy for crops, livestock, forests, and fisheries that simultaneously addresses the interconnected challenges of food security and climatic variability [8]. In order to achieve food security and to reduce greenhouse gas emissions, there is a need to transform the agricultural production systems to new approaches. FAO at the Hague Conference on Agriculture, Food Security and Climate Change in 2010 defined Climate-Smart Agriculture (CSA) as agriculture that sustainably increases productivity, enhances resilience of livelihoods and ecosystems, reduces and/or removes greenhouse gases (GHGs)and enhances achievement of national food security and development goals. Climate-Smart Agriculture (CSA) is a comprehensive management strategy for crops, livestock, forests and fisheries that tackles the interconnected issues of food security and climate change [8]. It is also an approach to developing the technical, policy and investment conditions to achieve sustainable agricultural development for food security under climate change. It integrates the three dimensions of sustainable development (economic, social and environmental) by jointly addressing food security and climate challenges. The transformation of traditional agricultural production into a Climate-Smart Agricultural approach could be achieved by scaling up and adoption of the practices implemented by farmers [9].
This CSA adoption framework integrates the economic, social, and environmental dimensions of sustainable development through three core pillars: sustainably increasing agricultural productivity and incomes, enhancing adaptive resilience to climate shocks, and reducing or removing greenhouse gas emissions where possible [3]. CSA practices are specifically defined as those enabling farmers to achieve at least two of these three objectives. However, despite the potential of practices such as conservation tillage, crop rotation, and soil-water conservation, empirical evidence suggests that adoption rates in Sub-Saharan Africa, and specifically in Ethiopia, remain significantly low [9,10]. Furthermore, within this landscape of limited adoption, the specific constraints and status of female-headed households have received insufficient scholarly attention, representing a critical gap in current resilience strategies [11].
This study addresses several critical gaps in the existing literature regarding the transition to resilient agriculture. While previous research in Ethiopia has largely focused on isolated technologies within specific sectors, such as coffee-based systems, wheat production, or individual soil-water conservation measures, this paper argues that farmers do not adopt innovations in a vacuum [8,12,13]. In reality, farm households manage climate risks by implementing a complementary mix of CSA practices, including crop rotation, conservation tillage, inorganic fertilizer usage, and improved livestock management, to enhance food security and adapt to environmental shifts [14,15]. Methodologically, we move beyond the standard approach of analyzing single technologies to evaluate the total adoption status of all implemented practices, providing a more realistic reflection of how farmers navigate climate risks across diverse farmlands. To support this analysis, we synthesize three principal theoretical lenses into a holistic conceptual framework: the diffusion innovation theory, which examines the dissemination of information through social systems; the adopter perception paradigm, which emphasizes the farmer’s perceived need and benefit of an innovation; and the Economic Constraint Theory, which addresses how resource distribution and utility maximization influence behavior [16,17]. This integrated approach allows for a comprehensive exploration of why some households adopt resilient practices earlier than others or fail adopting them entirely.
By applying a binary logit model, this study identifies the demographic, economic, and socio-psychological factors that drive or inhibit CSA adoption in the West Belesa District of Northwest Ethiopia. This region presents unique agro-ecological constraints where the adoption of identified CSA practices has historically remained at low levels despite significant government efforts through the Ministry of Agriculture and the Environment, Forest and Climate Change Commission [9,14]. Within this institutional landscape, our framework characterizes adopter perception through demographic variables such as age and education, while diffusion innovation is captured through communication factors like extension contact and media access. Economic constraints are analyzed via livestock ownership, land size, and credit access. Furthermore, while gender dimensions are central to household resilience, the specific adoption behavior of female-headed households in this region remains under-researched and underserved [11]. Consequently, this study provides the first comprehensive empirical evidence in the area, aiming to bridge the gap between theoretical climate policy and practical extension services. By providing actionable insights, the findings seek to support sustainable economic growth and assist farmers in overcoming real-time environmental degradation.
2. Materials and Methods
2.1. Description of the Study Area
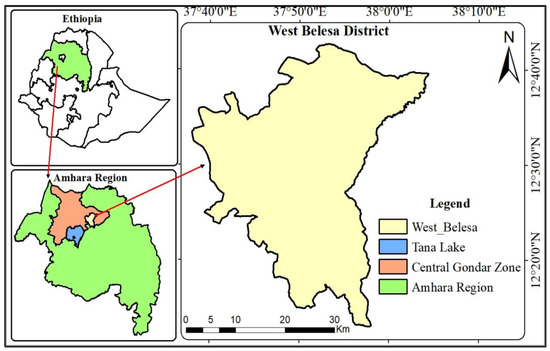
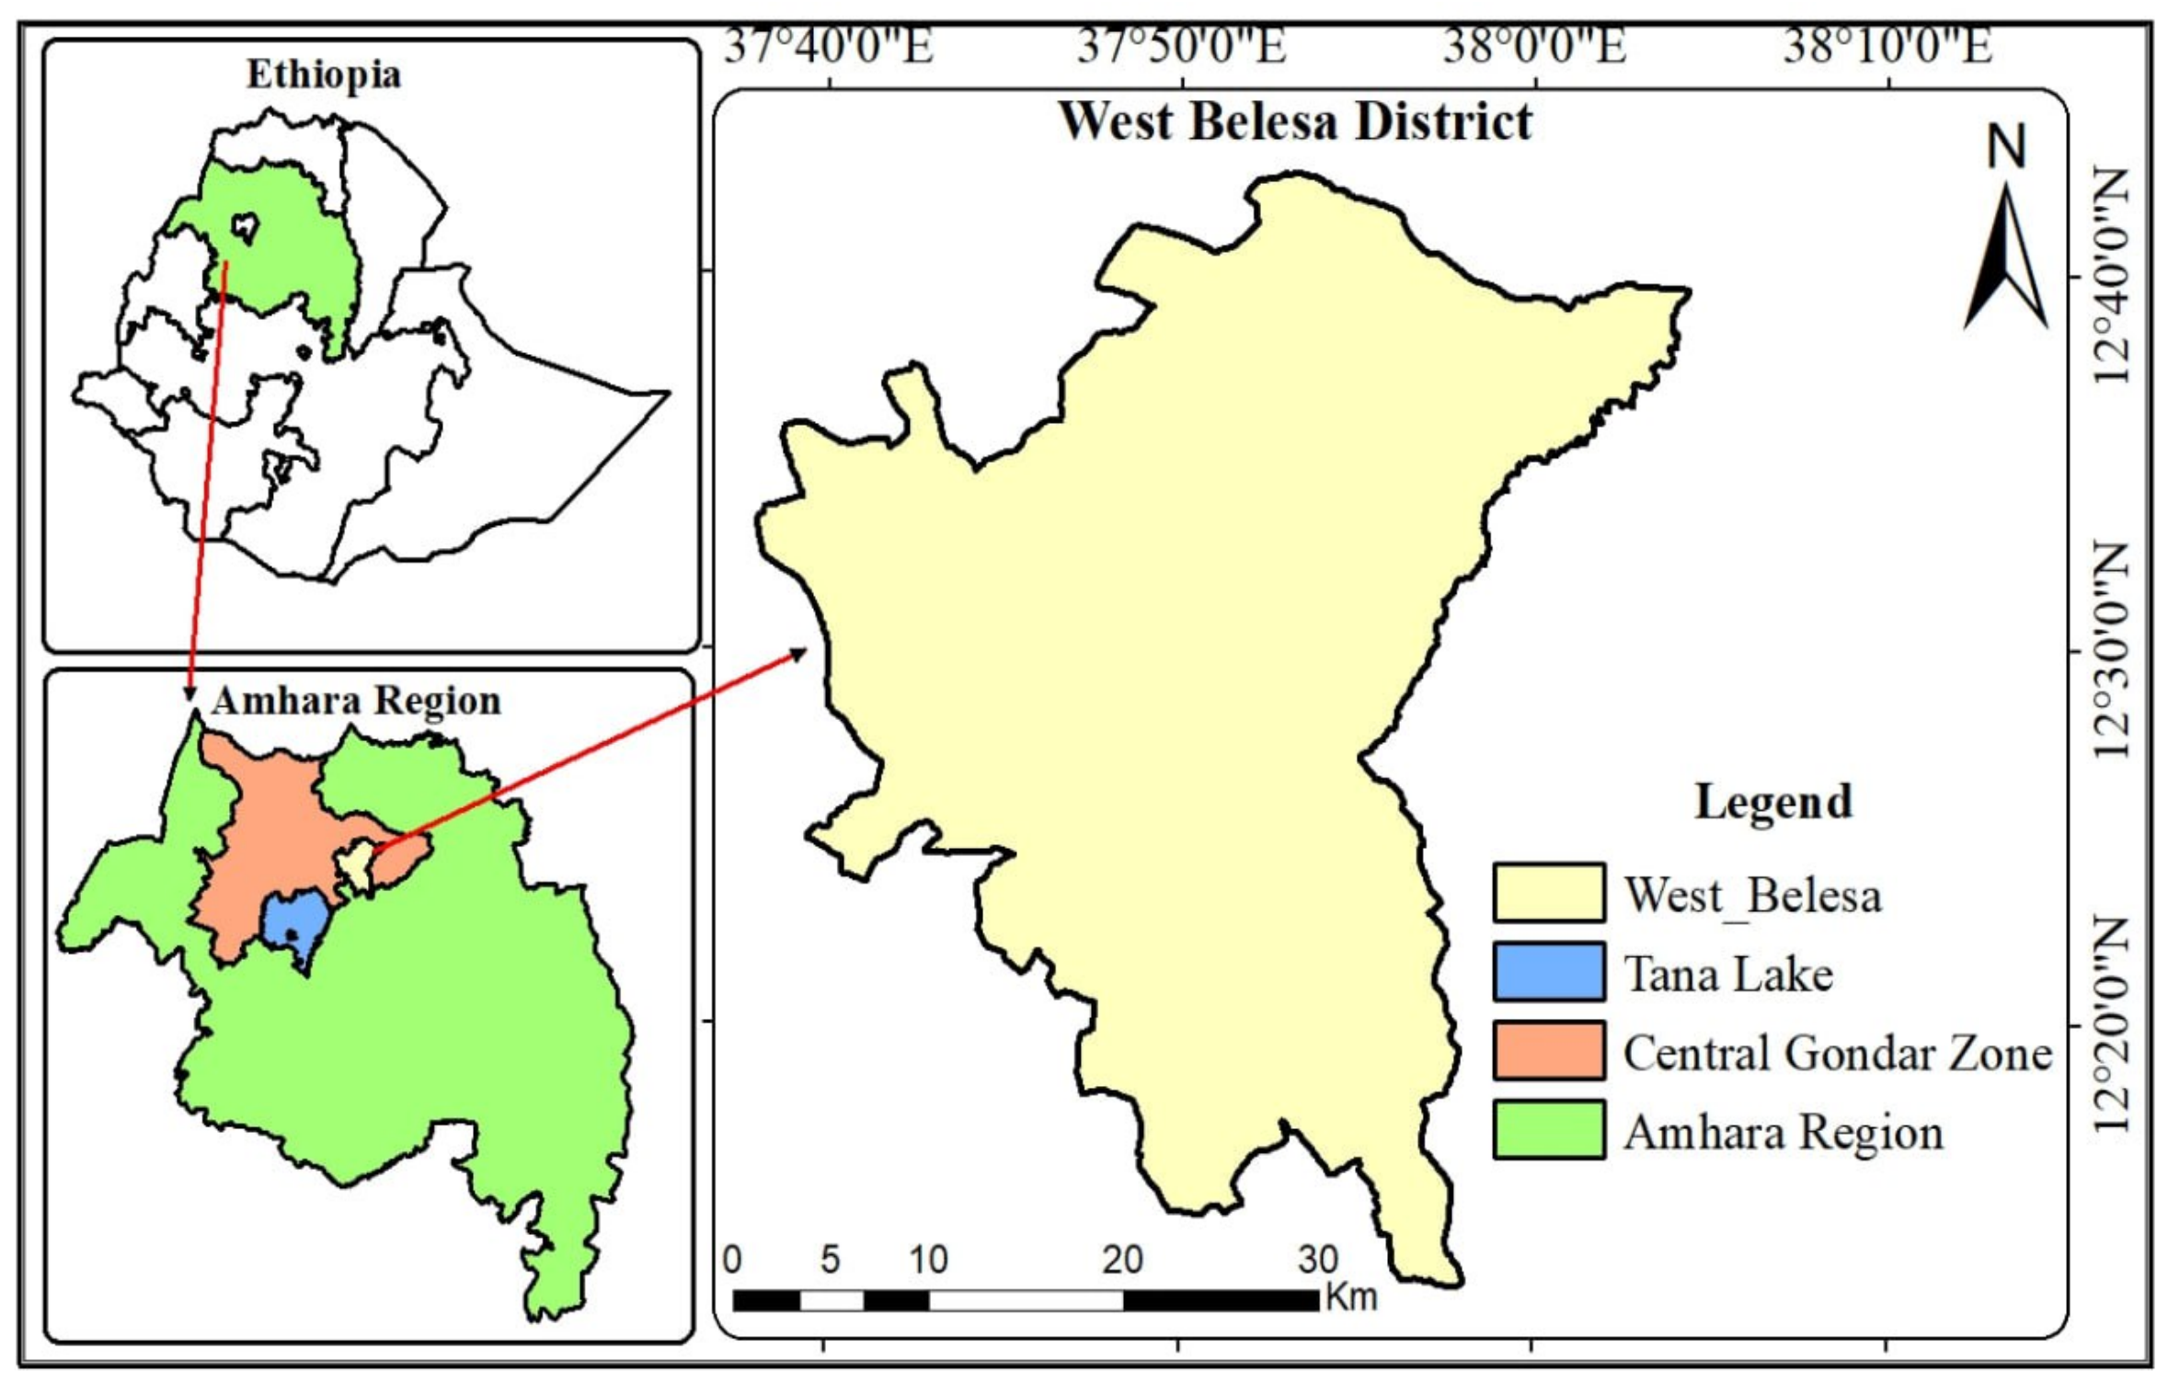
As indicated on Figure 1 below, the study area was the West Belesa District, situated within the Central Gondar Zone of the Amhara National Regional State in Northwest Ethiopia. This district was deliberately selected because its diverse agro-ecological profile makes it an excellent and relevant setting for investigating climate change adaptation [18]. Geographically, West Belesa is precisely located at a latitude and longitude of 12°15′ N and 37°45′ E, respectively, bounded by Wogera to the North, LiboKemkem to the South, Gondar Zuria to the West, and East Belesa to the East.
Figure 1.
Map of West Belesa District.
Climatologically, the district is defined by a primary rainy season from June to August, which is characterized by high, yet intermittently heavy or scarce, rainfall, alongside a high mean monthly temperature of approximately 33.50 °C. Crucially for this research, the district is officially classified into three distinct climatic zones (West Belesa BOF&E, 2021): the Hot Zone (Kola), which constitutes the majority at 60%; the Cold Zone (Dega) at 35%; and the Moderate Zone (Weynādegā), which makes up the remaining 5%. This agro-ecological variation formed the fundamental basis for classifying the study’s research units.
2.2. Research Approach and Design
Methodologically, the study is based on the post-positivist school of thought, specifically adhering to the principle of critical multiplism [19,20]. The central assertion of post-positivism that causes determine effects is highly relevant here [21], as the research aims to assess how Climate-Smart Agricultural (CSA) practices adoption can mitigate these effects. Consistent with this philosophy, the study employs a deductive approach. This approach draws from two theoretical foundations: first, the research is framed by the Adoption Diffusion theory, which guides the analysis of CSA practices implemented on farmlands and how the adoption process is influenced by demographic and economic variables [21].
Following [21], the study used a mixed-methods approach with a cross-sectional survey design. This approach is highly acknowledged for developing synergy by allowing for the neutralization of the limitations of quantitative methods by qualitative ones and vice versa, thereby enhancing the overall confidence and credibility of the findings [22,23]. The quantitative method was mainly employed for collecting and analyzing demographic and socio-economic data, whereas the qualitative method was used for collecting and analyzing participants’ ideas, suggestions, and perceptions about climate change and their use of CSA practices; a strong triangulation of the results was achieved.
2.3. Sampling Procedures and Sample Size Determination
The methodology of this study recognized the impracticality of surveying the entire population, necessitating the use of a sampling survey, which is a fundamental element in quantitative research for ensuring data quality and feasibility when addressing large populations [24,25]. Consequently, this study employed a multi-stage sampling procedure to identify potential respondents and select appropriate Kebeles (the lowest administrative tiers in Ethiopia) and households, thereby ensuring the quality and representativeness of the data. This process began with the purposive selection of the Central Gondar Zone, followed by the West Belesa District, which was chosen due to its significant agro-ecological diversity, persistent food insecurity exacerbated by small land holding size and erratic rainfall [18]. The district then formed the basis for stratification into its three distinct agro-ecological zones: Kolla (comprising 16 Kebeles), Woynadega (14 Kebeles), and Dega (2 Kebeles).
In the next stage, the study utilized a Disproportionate Stratified Systematic Random Sampling technique, specifically employing an Equal Allocation approach where two Kebeles were purposely selected from each of the three strata, resulting in six total sampled Kebeles. This technique was chosen to minimize heterogeneity and potential sampling error.
The final sampling unit was the household level. The overall sampling frame comprised 5396 households across the six selected Kebeles in the three agro-ecological zones. Based on this frame, and considering key determinants such as representation, fund availability, and the need to minimize sampling bias and error [25], 400 households were calculated to be the target sample size (n) (with an additional 27 for contingency against incomplete responses). Balancing the need for representation reduced sampling error and available resources [26].
This sample size was calculated using the simplified formula by [27]:
where n is the sample size, N is the total population size (5396), and e is the desired level of precision, which is set at 5% (0.05).
The 400 sample households were subsequently selected from the Kebele sampling frames using the Probability Proportional to Size (PPS) technique. This two-stage approach using Disproportionate (Equal) allocation at the level of Kebele and PPS at the level of household ensured that while the comparative objectives were met, the final sample of households was distributed proportionally to the population size to ensure fair representation across the selected Kebeles (refer to Table 1).
Table 1.
Sample size for the selected Kebeles.
2.4. Types, Sources, and Methods of Data Collection
To ensure the research is both accurate and broad, a mixed-methods approach was used, combining primary data from the field with secondary data from official records. This dual strategy allows the numerical results to be supported by the actual lived experiences of the farmers. By relying on both primary and secondary data sources, the study provides a complete view of the agricultural landscape. Secondary data were gathered from district reports, agricultural office records, and the published literature, while primary data were collected using the specific tools described below:
2.4.1. Quantitative Data Collection
Quantitative data, which demands the quantification and statistical analysis of results [22], were collected using a structured interview schedule (questionnaire filled by enumerators). This questionnaire was designed to gather relevant demographic, socio-institutional, economic, and biophysical variables pertinent to the study’s objectives. The interview instrument schedule predominantly incorporated closed-ended questions, supplemented by open-ended questions to allow respondents to provide detailed impressions and full context regarding specific issues.
Strict criteria were applied for selecting enumerators, emphasizing their familiarity with the setting and prior experience in enumeration. Consistent with best practices [25], enumerators were required to demonstrate patience, hard work, and perseverance. Preference was given to experienced extension workers from the local office of agriculture.
A pilot study (pre-test) was carried out to verify the validity and reliability of the data collection tools by the researcher on approximately 20 farming households in nearby Kebeles.
2.4.2. Qualitative Data Collection
For this study, Key Informant Interviews (KIIs) and Focus Group Discussions (FGDs) were used to gather qualitative data. This was done to augment and triangulate the findings derived from the quantitative analysis. This mixed-methods approach ensures that the statistical results are grounded in the lived experiences and expert perspectives of the local community and institutional actors.
Focus Group Discussions (FGDs)
Focus Group Discussions served as a vital tool to facilitate dialog on specific research interests, helping to gauge and calibrate divergent results emerging from individual structured interviews and open-ended survey responses [22,28]. To ensure an environment conducive to active participation while maintaining manageability, each group comprised eight participants [29]. Crucially, male and female groups were interviewed separately to account for gender-specific perspectives and social dynamics.
Key Informant Interviews (KIIs)
To provide in-depth, expert perspectives, Key Informant Interviews were conducted with strategically selected individuals using prepared open-ended questionnaires. These informants included selected female heads of households, district-level officers from the Women, Youth, and Children Affairs Office (WSAOs), and relevant district-level Agricultural Officers (DAOs).
The interviews addressed CSA practices and adoption determinants to inform the binary logit model. This involved evaluating the effectiveness of specific technologies, like water conservation and soil or improved seeds, and identifying non-economic barriers to adoption, including labor intensity and cultural norms. By examining how CSA labor demands compete with women’s domestic responsibilities and assessing existing local policy incentives, these interviews provided the qualitative depth necessary to interpret the statistical drivers of technology uptake.
2.5. Methods of Data Analysis
This study used both quantitative and qualitative data analysis methods to fully address the research questions. The raw data were coded, entered, and analyzed using multiple statistical packages, including SPSS Version 25, Microsoft Excel, and STATA/SE Version 14.2.
2.5.1. Quantitative Methods of Data Analysis
To analyze the quantitative data, descriptive statistics and econometric models were primarily employed as dictated by the study’s objectives. Descriptive statistics were employed to summarize and preview the socio-economic, demographic, and other relevant characteristics of the surveyed respondents. Measures such as mean, median, mode, and percentage were utilized based on the nature of the variable and the required presentation format. Furthermore, t-tests (for continuous variables) and chi-square tests (x2 tests) (for categorical variables) were used to test for significant differences and associations between key independent variables and the household’s decision regarding the adoption of Climate-Smart Agricultural (CSA) practices.
For the final stage of analysis, a binary logit model was employed to analyze the specific factors influencing the adoption of CSA. This econometric model is highly effective for research where the outcome is binary (a ‘yes’ or ‘no’ decision).
Binary Logit Model for CSA Adoption Determinants
Utilizing the binary logit model, the factors that influence the adoption of CSA practices by sex were identified. This model is appropriate since the dependent variable, the adoption choice, is dichotomous (‘yes’ or ‘no’),making it a typical case of a binary choice model [30]). The choice of logit over probit is favored due to its straightforward structural shape and more easily interpretable outcomes [31].
- i.
- Theoretical Foundation and Model Specification:
The analysis is based on the Expected Utility Maximization Theory, assuming farmers adopt a CSA practice if the expected utility outweighs that of the conventional practice [32]
The probability of adoption (Pi) is specified using the logistic distribution [33,34,35]:
where Pi is the probability of adoption of CSA practices for the ith farmer and ranges from 0 to 1, e represents the base of natural logarithms, and Zi is the function of a vector of n explanatory variables and is expressed as
where Bo is the intercept and Bi is a vector of unknown slope coefficients.
The relationship between Pi and Xi, which is non-linear, can be written as follows:
The slopes show how the log-odds in favor of using CSA techniques change as the independent variables do. If Pi is the probability of adopting certain behaviors, then 1 − Pi is the chance of not adopting and may be represented as
Dividing Equation (1) by Equation (4) and simplifying it gives
Equation (5) simply represents the odds ratio in favor of adopting CSA techniques. It is the likelihood of the farmer adopting the techniques divided by the probability of not adopting them. Finally, the logit model is calculated by taking the logarithm of Equation (5) as shown below:
where Li is the log of the odds ratio, which is linear in both X and the parameters. Thus, when the stochastic disturbance term Ui is included, the logistic model becomes
zi = βo + β1x1 + β2x2 + … + βnxn + Ui
The Maximum Likelihood Estimation (MLE) procedure is used to estimate this model, which yields unbiased and asymptotically efficient coefficients.
- ii.
- Multi-collinearity Diagnostics: All proposed explanatory variables were examined for multi-collinearity prior to model execution. Variance Inflation Factor (VIF) was used for continuous variables and the contingency coefficient test was used for dummy variables.
- iii.
- Dependent Variable: The dependent variable is a dichotomous measure of CSA adoption, taking a value of 1 if the household head (male or female) has implemented at least one CSA practice on their farmland consistently for the last two years, and 0 otherwise (practiced conventional methods only).
- iv.
- Independent Variables: Based on the literature review, fifteen potential explanatory variables were hypothesized to affect CSA adoption. These factors span household demographic, economic, extension/communication, and socio-psychological characteristics.
2.5.2. Qualitative Methods of Data Analysis
The collected qualitative word-based information, which was gathered through Key Informant Interviews (KII) and Focus Group Discussions (FGDs), was analyzed using the Content Analysis Method. This methodological approach systematically organizes, summarizes, and interprets the verbal data to provide a rich, contextual understanding that supports and informs the quantitative findings [21].
To enhance the trustworthiness and rigor of the qualitative findings, established measures were employed throughout the process, as suggested by [21]. Crucially, triangulation was used where the qualitative data were systematically utilized to cross-verify and enrich the quantitative survey results, ensuring that conclusions were supported by multiple, independent lines of evidence.
3. Results
3.1. Socio-Demographic Profile of Sampled Households
Key continuous variables such as age, total family size, education, and farming experience are analyzed, typically presented using measures of statistical distribution (e.g., mean and standard deviation) in a dedicated table (Table 2). Furthermore, the educational level of the household head is detailed (Table 3).
Table 2.
Distribution of sample respondents based on continuous demographic variables (n = 400).
Table 3.
Education level of sample respondents (n = 400).
A number of adoption studies have suggested that the age of farmers has a significant impact on their adoption of novel agricultural methods and technologies. Table 2 shows that out of 400 sample respondents, the average age was found to be 45 years, with a maximum and minimum of 80 and 23 years of age, respectively. The adopters’ mean age was 47, with a standard deviation of 11, while the non-adopters’ mean age was 44. A t-test was used to determine whether the mean age difference between adopters and non-adopters was statistically significant. At the 5% significance level, the t-test result indicated that the mean age difference between adopters and non-adopters was statistically significant. It was believed that the primary source of labor needed for farm tasks like preparing the soil, planting, weeding, and harvesting was family size. The total number of male and female household members residing within the HH is the total family size in this study. The results of this study indicated that there is a minimum of one family and a maximum of 12 families per house hold in the area, with an average family size of five and two standard deviations (Table 2).
With regard to farming experience, the survey result indicates that, on average (refer to Table 2), about 17.66 years of farm experience were possessed by the sample respondents.
Adoption of technology is linked to education because it is thought to improve farmers’ capacity to gather and evaluate data that aids in decision-making. The adoption of CSA practices is thought to be strongly influenced by a high level of education [36]. The educational status of the majority of the households is comparable. The distribution of total sample respondents in terms of literacy level, as shown in Table 3, indicates that 62.7% are not able to read and write, 31.5% can only read and write, and only 5.8% attended primary school (grades 1–6).
3.2. Economic Characteristics of the Respondents
The minimum landholding size is zero, with a maximum of about 6.75 hectares, and the average landholding size of sample households was 1.5 ha with a standard deviation of 0.82, which is slightly greater than the Amhara regional figure, which is 1.09 ha [37].
According to the results of this study as previewed on Table 4, the sample population’s livestock holdings varied from 0.00 to 19.3 TLU, suggesting that household livestock ownership varies. The sample population’s standard deviation was 3.4 and its average livestock holding was 4 TLU.
Table 4.
Distribution of sample respondents based on continuous economic variables (n = 400).
The dummy economic variables used in this study were participation in non-farm or off-farm activities and access to credit of the household head. To see the association between these variables, a chi-square test was conducted, and the results are shown in Table 5 below.
Table 5.
Association between dummy economic variables with adoption status (n = 400).
One of the most crucial ways to get extra income is through off-farm activities. From the total households as indicated in Table 5 above, 16.5% and 22.8% of the sampled households were engaged in off-farm activities and in non-farm activities, respectively.
Only 47.3% (n = 189) of the sample households had access to financing for the purchase of agricultural supplies, as shown in Table 5 A portion of the sample families utilize cash to buy inputs. Additionally, the table shows that 22.3% of non-adopters and 66.7% of adopters used credit. Regarding access to credit utilization, the chi-square test reveals a statistically significant difference of 1% between adopters and non-adopters. CSA practices are more likely to be adopted by farmers who have access to credit.
3.3. Institutional and Communication Characteristics of Sampled Households
The institutional and communication variables were mainly extension services undertaken to use and adopt the technology like extension agent contact, participation in relevant training programs, and access to mass media. These institutional factors significantly influence the flow and utilization of Climate-Smart information, directly shaping a household’s decision-making process and its ability to implement effective adaptation strategies.
The survey results in Table 6 demonstrate that adopters who have monthly contacts with extension agents account for approximately 73.7%, whereas non-adopters account for 29.7%. The other category of adopters, having contact once a year, accounts for 26.3, and for non-adopters the average value was 70.3%.
Table 6.
Association between extension and comm. variables with adoption status (n = 400).
3.4. Adoption Status and Gender Dimensions of CSA
To analyze the adoption status of households in the Western Belesa district, the study utilized a set of well-established CSA practices that have been previously recognized and implemented nationally as shown in Table 7. These practices were selected based on their identification in various prior research works as being smart in terms of sustainable agricultural production and resilience-building [10,15,38,39,40].
Table 7.
Multi-dimensional CSA practices.
As shown in Table 8, the survey reveals that 56.3% of households have adopted at least one CSA practice. The most common methods include crop diversification and soil-water conservation, which aligns with broader regional trends in Ethiopia [41]. These results suggest that more than half of the farming community is actively seeking ways to adapt to environmental changes. However, a sharp gender divide exists within these adoption rates. Male-headed households exhibit a 62% adoption rate, which is significantly higher than that of female-headed households (Table 8). This gap indicates that gender is a major factor in determining who can successfully implement these technologies.
Table 8.
Status of adoption of CSA practices in West Belesa Woreda, 2023.
3.5. Econometric Analysis of CSA Adoption Determinants
Before running the binary logit model, all the hypothesized explanatory variables were checked for the existence of multi-collinearity problems. VIF (Variance Inflation Factor) was used for testing the association between the hypothesized continuous variables. As indicated on Table 9 below, contingency coefficient tests were used to ascertain the degree of association among dummy variables. The values of contingency coefficients range between 0 and 1, with zero indicating no association between the variables and values close to 1 indicating a high degree of association. The association is said to be high when the value is greater than 0.75. The values of the contingency coefficients were also low. Similarly VIF values displayed in Table 9 show that all the continuous explanatory variables have no serious multi-collinearity problems.
Table 9.
Variance Inflation Factors (VIFs) of the continuous variables.
To move beyond descriptive associations, the binary logit model was employed to identify the significant drivers and the effect of various predictors on the probability of CSA adoption. The model demonstrated strong diagnostic performance, having a high predictive power of 89.5% (Table 10) and with a Likelihood Ratio (LR) chi-square test significant at the 1% level, indicating that the included repressors jointly provide a superior fit compared to a null model.
Table 10.
Binary logit model estimates for factors affecting CSA practices.
Finally, all hypothesized explanatory variables were included in the binary logistic analysis. The model explained about 89.5% of the total variation in the sample for use of CSA practices. Correctly predicted figures for adopters were about 92.5%, while correctly predicted sample size for non-adopters were 85.6%. Among the explanatory variables used in the model, seven variables were significant with respect to adoption of CSA practices with less than 10% of the probability level.
The econometric model results (Table 10) identify seven significant variables. Notably, total family size positively influence adoption (p < 0.01). The results reveal that total family size (p < 0.01) is a primary driver of adoption. Interestingly, the odds ratio for age (0.937) indicates that older farmers are more likely to be non-adopters and the rate of adoption increases more significantly among youth farmers who need innovations and new farming practices.
Farming Experience (odds ratio = 1.110) and access to credit (p < 0.01) were the strongest economic predictors. Remarkably, farmer experience emerged as a more significant predictor than formal education. Every additional year of farming increases the odds of adoption by 11%. This suggests that learning-by-doing is the dominant mechanism for technology uptake in West Belesa. The negative and significant influence of access to credit (p < 0.01) further validates that credit is needed in the area for other purposes rather than initially for Climate-Smart Agricultural practices input purchasing. Finally, the information seeking behavior (p < 0.05) and yield perception (p < 0.10) variables confirm the importance of the adopter perception paradigm.
4. Discussion
The discussion concerning the adoption of CSA practices is framed within the theory of expected utility maximization, which posits that farmers will adopt new practices only when they anticipate that doing so will maximize their overall utility or perceived benefit [31,39]. Consequently, this study operates on the assumption that farmers’ decision to adopt a new CSA practice is a rational choice aimed at maximizing their expected utility, encompassing factors beyond mere financial returns.
Based on the survey results on the characteristics of smallholder farmers, age had a negative and statistically significant effect on the adoption of Climate-Smart Agriculture (CSA) practices (β = −0.065, OR = 0.937, p < 0.05). The estimated odds ratio indicates that, holding other factors constant, each additional year in the age of the household head decreases the odds of adopting CSA practices by approximately 6.3%. This finding suggests that younger farmers are more likely to adopt CSA practices than older farmers.
Regarding age, it could be further explained as younger farmers may be more willing to experiment with new agricultural practices, acquire new information, and take risks associated with innovation. In contrast, older farmers may be more likely to rely on traditional farming methods and may be less inclined to adopt new CSA technologies and practices.
The other results also suggest that the farm household head’s experience is higher in all farming activities since they started the farming business. Farming experience had a positive and statistically significant effect on the adoption of Climate-Smart Agriculture (CSA) practices (β = 0.104, OR = 1.110). The odds ratio indicates that, holding other factors constant, each additional year of farming experience increases the odds of adopting CSA practices by approximately 11.0%. This finding suggests that more experienced farmers are more likely to adopt CSA practices than less experienced farmers.
Experienced farmers act as early adopters within the Innovation-Diffusion framework, utilizing their historical knowledge of local micro-climates to validate the efficacy of CSA practices like crop diversification and drought-tolerant varieties [42,43]. This indicates that the more years are spent on farming, the higher will be the adoption of Climate-Smart Agricultural technologies and practices, which is in line with the studies indicated by [36].
Another result also anticipated that the frequency of interaction between the extension agent and the farmers could be the driving force behind the efficient distribution of sufficient agricultural information to the farmers, which would improve their decision to adopt new agricultural practices and technology. According to the model result, farmers who need more information about new innovations and practices once in every month are more likely to adopt the practices than the farmers who get information once in a year. Farmers’ perceptions about the practices in increasing yield increase the likelihood of adoption of CSA practices. Similar findings of [43] showed that farmers’ perceptions of CSA innovations to reduce the impact of climate change risks such as rising temperatures, increased hailstorms, and increased erratic rainfall result in adoption of CSA innovations.
From the economic variables, access to credit negatively and significantly influenced the likelihood of adoption of CSA practices. Credit access negatively and significantly affected the adoption of Climate-Smart Agriculture (CSA) practices. The estimated coefficient (−2.073) indicates that households with access to credit were less likely to adopt CSA practices than households without access to credit. The odds ratio of 0.126 implies that the odds of adopting CSA practices among households with access to credit were approximately 87.4% lower than the odds among households without access to credit, holding all other factors constant.
This is different from the previous findings of [12,15,44]. When credit is accessible, the perceived risk of crop failure is mitigated, allowing farmers to adopt a bundled (technology packages) approach to CSA (e.g., combining improved seeds with inorganic fertilizers). This result is in contradiction of the findings of [15], which highlighted that credit access is the single most influential factor in shifting farmers from subsistence-oriented to resilience-oriented agriculture. Both farming experience and access to credit results validate the Economic Constraint Theory, suggesting that when capital is available, farmers are eager to utilize their experiential knowledge to mitigate climate risks. This finding contrasts with the conventional expectation that credit facilitates agricultural technology adoption by relaxing financial constraints. A possible explanation is that borrowed funds may be allocated to non-farm activities or immediate household consumption needs rather than investments in CSA technologies [45]. Additionally, concerns about loan repayment and the delayed benefits of some CSA practices may discourage farmers from using credit to support their adoption.
The other economic indicator variable which showed negative and significant value was total family size of the household head. In the labor-intensive context of Northwest Ethiopia, where mechanization is scarce, a larger household provides the human capital necessary for the construction and maintenance of physical soil and water conservation structures. This aligns with the Economic Constraint Theory, where labor availability acts as a shadow price for adoption. Our findings contradict with those of [46], who argue that labor constraints often force smallholders to opt for conventional, low-input methods despite the long-term benefits of CSA.
The information on the qualitative insights from Focus Group Discussions (FGDs) help explain the fact by revealing that female heads of households face a ‘triple-burden’ of constraints. These include insecure land rights, limited access to the heavy labor required for building physical conservation structures, and a lack of training programs specifically designed for women. These findings confirm that while women have a strong desire to adopt resilient farming methods, their actual structural capacity is blocked by local cultural norms and resource gaps [47]. Therefore, the lower adoption rates among women are not due to a lack of interest, but rather a lack of the specific resources and labor needed to put these practices into action.
Information need had a negative and highly statistically significant effect on the adoption of Climate-Smart Agriculture (CSA) practices (β = −6.294, OR = 0.002). The negative coefficient indicates that farmers who reported having information needs were less likely to adopt CSA practices than those who reported no information need. The odds ratio of 0.002 implies that the odds of adopting CSA practices among farmers with information needs were approximately 99.8% lower than the odds among farmers without information needs, holding all other factors constant. This finding suggests that inadequate access to relevant agricultural information constitutes a major barrier to the adoption of CSA practices.
The other interesting result shows how farmers actively seek information and are not just passive recipients of technology; they are active evaluators of utility. If they believe that CSA practices directly reduce the impacts of heat and water stress, they are far more likely to invest in these transitions. As their perception of a practice’s yield-enhancing potential increases, the subjective risk of adoption decreases. This psychological dimension is crucial for policy, suggesting that technical extension is only effective if it successfully shifts a farmer’s mental model regarding climate risk and reward [48].
5. Conclusions and Implications
5.1. Conclusions
The findings of this research illustrate that the adoption of Climate-Smart Agriculture (CSA) in West Belesa is not a random occurrence, but a calculated and sophisticated response to climate variability. It is a multi-dimensional process emerging from the intersection of household labor, technical extension support, financial liquidity (the immediate access to cash or easily convertible assets) and strong institutional linkages. By integrating the Innovation-Diffusion and Economic Constraint Theories, this study provides a robust framework for understanding how farmers transition from conventional methods to resilient agriculture.
Furthermore, while the overall adoption rate of 56.3% is encouraging, it masks a systemic failure in reaching female-headed households. The study result indicates that there is low adoption status of Climate-Smart Agricultural practices in Ethiopia when compared with most African countries which were indicated in previous studies of [13]. The research identifies a pervasive structural gender inequality that creates a significant gap in adoption rates. This disparity does not stem from a lack of interest among female farmers, but from deep-rooted barriers including insecure land rights, restricted access to heavy physical labor, and a historical lack of gender-targeted support. To address this, policy interventions must move beyond general agricultural advice and implement gender-sensitive reforms, such as community-based labor sharing groups and land-tenure protections that specifically empower women.
In addition to this, the model findings revealed that age, farming experience, access to credit, frequency of contact with extension agent, information seeking behavior of the household head, total family size and perception of farmers about CSA in increasing yield strongly influenced and have significant effects on the adoption of Climate-Smart Agricultural practices in northwestern parts of Ethiopia.
Ultimately, having the right information is just as important as having the financial capital to invest. A farmer’s internal mental model of climate risk directly dictates their willingness to invest in new practices. Because frequent extension contact was shown to close the knowledge gap, there is a clear policy need to shift extension services from yearly visits to a consistent monthly technical support model. Only by addressing these financial, social, and informational gaps simultaneously can the district achieve a truly resilient and inclusive agricultural transformation.
5.2. Implications for Research, Practice, and Society
The evidence presented in this study leads to several vital implications for the future of agricultural development and policy in Ethiopia. Regarding practical application, extension services must abandon standardized approaches in favor of specialized strategies that promote labor-saving Climate-Smart technologies. These interventions should be specifically designed for female-headed households (labor-light CSA practices) to bridge the existing twenty-four percent adoption gap and ensure equitable resilience. From a policy perspective, increasing the current adoption rate of fifty-six percent to a significant majority will require the Ethiopian government to integrate climate-risk insurance with existing credit facilities. Such a transformation would reduce the fear of financial failure that currently inhibits non-adopters from transitioning away from conventional methods. On a broader societal level, bridging the gap between theoretical research and field practice necessitates a fundamental shift in recognizing female farmers as primary actors in climate resilience. This shift must ensure that women receive the same technical frequency of extension contact as their male counterparts, thereby fostering a more inclusive and productive agricultural sector capable of withstanding the escalating challenges of global climate change.
Author Contributions
T.P.W. conceived the idea, designed the study, and oversaw data collection, analysis, and manuscript composition. M.T.Z. and K.A.A. contributed by reviewing and revising the manuscript. All authors have read and agreed to the published version of the manuscript.
Funding
This research was funded by the University of Gondar.
Institutional Review Board Statement
This study falls within the category of research exempt from formal ethical review under the relevant national guidelines of the Ministry of Education. According to Section 6.1.14 (Social and Behavioral Research) of the guideline, research involving human participants may be granted a waiver of consent depending on the nature of the study. This study involves interviews about agricultural practices and does not address human health or sensitive social and behavioral issues. No audio or video recordings were made during Focus Group Discussions or household interviews. Before conducting the interviews, official letters were provided to the agricultural district offices, and permission was obtained from the authors’ institution. In addition, Section IX of the guideline (Principles of Environmental Ethics) provides that research activities related to the environment may be considered exempt from ethical review. As the focus of this study is on climate change, it falls within this exempt category. Based on the above provisions, the authors consider that this study does not require formal confirmation from an Institutional Review Board.
Informed Consent Statement
Informed consent was obtained from all subjects involved in the study.
Data Availability Statement
The data presented in this study are available on request from the corresponding author.
Acknowledgments
We are grateful for the willingness and support of the farmer respondents as well as the enumerators who undertook the data collection, and the district officials of the study areas of the West Belesa district who allowed us to carry out interviews, Focus Group Discussions, and logistics arrangements at the sampled Kebeles. Financial support from the University of Gondar was instrumental in facilitating this endeavor.
Conflicts of Interest
The authors declare no conflicts of interest.
References
- Arora, N.K. Impact of climate change on agricultural production and its sustainable solutions. Environ. Sustain. 2019, 2, 95–96. [Google Scholar] [CrossRef] [Scilit]
- Tilahun, G.; Bontider, A.; Yayeh, D. Synergies and trade-offs of climate smart agriculture (CSA) practice selected by smallholder farmers in Geshy watershed, Southwest Ethiopia. J. Reg. Sustain. 2023, 4, 129–138. [Google Scholar] [CrossRef] [Scilit]
- Barasa, P.M.; Botai, C.M.; Botai, J.O.; Mabhaudhi, T. A review of climate-smart agriculture research and applications in Africa. Agronomy 2018, 11, 1255. [Google Scholar] [CrossRef] [Scilit]
- McCarthy, U.; Uysal, I.; Badia-Melis, R.; Mercier, S.; O’Donnell, C.; Ktenioudaki, A. Global food security–issues, challenges and technological solutions. Trends Food Sci. Technol. 2018, 77, 11–20. [Google Scholar] [CrossRef] [Scilit]
- World Bank. Future of Food: Shaping a Climate-Smart Global Food System; World Bank: Washington, DC, USA, 2015. [Google Scholar]
- Ayal, D.Y.; Tilahun, K.; Ture, K.; Zeleke, T.T. Psychological dimensions of climate change: Perceptions, collective efficacy, and responses in Berehet District, north Shewa Ethiopia. Clim. Change 2021, 165, 32. [Google Scholar] [CrossRef] [Scilit]
- Food and Agricultural Organization. Climate Smart Agriculture Case Studies; FAO: Rome, Italy, 2021; pp. 63–64. [Google Scholar]
- Mustefa, B.; Haji, J.; Jemal, K.; Zelek, F. Determinants of adoption of climate smart agricultural technologies in wheat production in Arsi Zone, Oromia Region of Ethiopia. Discov. Food 2024, 4, 8. [Google Scholar] [CrossRef] [Scilit]
- Food and Agricultural Organization. Gender Dimensions of Agricultural and Rural Development: Differentiated Pathways out of Poverty; FAO: Rome, Italy, 2010. [Google Scholar]
- Jirata, M.; Grey, S.; Kilawe, E. Ethiopia Climate Smart Agriculture Scoping Study; Food and Agriculture Organization of the United Nations: Addis Ababa, Ethiopia, 2016. [Google Scholar]
- Kurgat, B.K.; Lamanna, C.; Kimaro, A.; Namoi, N.; Manda, L.; Rosenstock, T.S. Adoption of climate smart agriculture technologies in Tanzania. Front. Sustain. Food Syst. 2020, 4, 55. [Google Scholar] [CrossRef] [Scilit]
- Teklewolde, H.; Tagel, G.; Mintewab, B. Climate smart agricultural practices and gender-differentiated nutrition outcome: An empirical evidence from Ethiopia. World Dev. 2019, 122, 38–53. [Google Scholar] [CrossRef] [Scilit]
- Diro, S.; Tesfaye, A.; Erko, B. Determinants of adoption of climate smart agricultural technologies and practices in the coffee based farming systems of Ethiopia. J. Agric. Food Secur. 2022, 11, 42. [Google Scholar] [CrossRef] [Scilit]
- Tolesa, D. Conservation tillage experiments at Bako Research Centre, West Showa Zone. In Proceedings of the Workshop on Conservation Tillage, Melkasa Research Centre, Nazreth, Ethiopia, 28 February–1 March 2001. [Google Scholar]
- Abyiot, T.; Belay, S.; Bezabih, M. Effects of perceptions on adoption of climate-smart agriculture innovations: Empirical evidence from the upper Blue Nile Highlands of Ethiopia. Int. J. Clim. Change Strateg. Manag. 2022, 14, 293–311. [Google Scholar] [CrossRef] [Scilit]
- Tsige, M.; Synnevåg, G.; Aune, J.B. Gendered constraints for adopting climate-smart agriculture amongst smallholder Ethiopian women farmers. Sci. Afr. 2020, 7, e00250. [Google Scholar] [CrossRef] [Scilit]
- Rogers, E.M. Diffusion of Innovations, 3rd ed.; Macmillan Publishing Co., Inc.: New York, NY, USA, 1983. [Google Scholar]
- Alemayehu, S.; Ayalem, Z.; Sileshi, M.; Zeleke, F. Determinants of the adoption of climate smart agricultural practices by smallholder wheat in north-western Ethiopia. Heliyon 2024, 10, e34233. [Google Scholar] [CrossRef] [Scilit]
- Yehuala, S.; Melak, D.; Mekuria, W. The status of household food insecurity: The case of West Belesa, North Gondar, Amhara Region, Ethiopia. Afr. Health Sci. 2018, 6, 158–166. [Google Scholar]
- Guba, E.G. The alternative paradigm dialogue. In The Paradigm Dialogue; Guba, E.G., Ed.; Sage Publications: Newbury Park, CA, USA, 1990; pp. 17–27. [Google Scholar]
- Lincoln, Y.S.; Guba, E.G. Paradigmatic controversies, contradictions and emerging confluences. In Handbook of Qualitative Research; Denzin, N.K., Lincoln, Y.S., Eds.; Sage Publications: London, UK, 2000. [Google Scholar]
- Creswell, J.W. Research Design: Qualitative, Quantitative, and Mixed Methods Approach, 4th ed.; Sage: Newbury Park, CA, USA, 2014. [Google Scholar]
- Dawson Catherine. Introduction to Research Methods: A Practical Guide for Everyone Undertaking Research Project, 4th ed.; How to Books: Oxford, UK, 2009. [Google Scholar]
- Yeasmin, S.; Rahman, K.F. ‘Triangulation’ Research Method as the Tool of Social Science Research. BUP J. 2012, 1, 154–163. [Google Scholar]
- Magnani, R. Sampling Guide; Food and Nutrition Technical Assistance Project (FANTA): Washington, DC, USA, 1997. [Google Scholar]
- Kothari, C.R. Research Methodology: Methods and Techniques, 3rd ed.; New Age International Publisher: New Delhi, India, 2004. [Google Scholar]
- Yamane, T. Statistics: An Introductory Analysis, 2nd ed.; Harper & Row, Publishers: New York, NY, USA, 1967. [Google Scholar]
- Bernard, H.R. Research Methods Anthropology: Qualitative and Quantitative Approaches, 4th ed.; Rowman & Littlefield Publishers: Lanham, MD, USA, 2006. [Google Scholar]
- Hancock, B.; Windridge, K.; Ockleford, E. An Introduction to Qualitative Research; The NIHR RDS EM/YH: Leicester, UK, 2009. [Google Scholar]
- Adekanmbi, A. Comparison of probit and logit models for Binary response variable with applications to birth data in South-Western, Nigeria. Am. J. Math. Stat. 2017, 7, 199–208. [Google Scholar]
- Puan, O.C.; Hassan, Y.A.; Mashros, N.; Idham, M.K.; Hassan, N.A.; Warid, M.N.M.; Hainin, M.R. Transportation mode choice binary logit model: A case study for Johar Bahru city. In IOP Conference Series: Materials Science and Engineering; IOP Publishing: Bristol, UK, 2019; Volume 527, p. 012066. [Google Scholar] [CrossRef] [Scilit]
- Maguza-Tembo, F.; Abdi-Khalil, E.; Julius, M. Determinants of Climate Smart Agriculture Technology Adoption in the Drought Prone Districts of Malawi using a Multivariate Probit Analysis. Asian J. Agric. Ext. Econ. Sociol. 2017, 16, 112. [Google Scholar] [CrossRef] [Scilit]
- Maddala, G.S. Introduction to Econometrics, 2nd ed.; Macmillan Publishing Company: New York, NY, USA, 1992. [Google Scholar]
- Gujarati, D.N. Basic Economics, 4th ed.; McGraw-Hill: New York, NY, USA, 2003. [Google Scholar]
- Green, H.W. Econometric Analysis, 6th ed.; Prentice Hall: Upper Saddle River, NJ, USA, 2008. [Google Scholar]
- Nyang’au, O.J.; Jema, H.M.; Nelson, M.; Clifton, M.A.N.W. Smallholder farmers’ perception of climate change and adoption of climate smart agricultural practice in Masaba South sub-county, Kisii, Kenya. Heliyon 2021, 7, e06789. [Google Scholar] [CrossRef] [Scilit] [PubMed]
- IFPRI. Land Constraints and Agricultural Intensification in Ethiopia: A Village Level Analysis of High Potential Areas; IFPRI Discussion Paper: Washington, DC, USA, 2013. [Google Scholar]
- Duyen, T.; Ranola, F.; Ole, S.; Reiner, W.; Nguyen, T.; Ngoc, N. Determinants of adoption of climate smart agriculture technologies in rice production in Vietnam. Int. J. Clim. Change Strateg. Manag. 2020, 12, 238–256. [Google Scholar] [CrossRef] [Scilit]
- ICCAS (Integrated Climate Change Adaptation Strategies in Grenada). What is Climate Smart Agriculture? Project Report by UNDP and Giz. Available online: http://www.giz.de (accessed on 2 February 2023).
- Ayenew, B.; Tilahun, A. Factors influencing the adoption of climate smart agricultural practices by small scale farming households in Wondo Genet, Southern Ethiopia. SAGE Open 2022, 12, 113. [Google Scholar] [CrossRef] [Scilit]
- Food and Agricultural Organization. Climate-Smart Agriculture Source Book; FAO: Rome, Italy, 2013. [Google Scholar]
- Negera, M.; Alemu, T.; Hagos, F.; Haileslassie, A. Determinants of Adoption of Climate Smart Agricultural practices among farmers in Bale-Eco region, Ethiopia. Heliyon 2020, 8, e0984. [Google Scholar] [CrossRef] [Scilit] [PubMed]
- Ogisi, O.D.; Begho, T. Adoption of Climate-Smart Agricultural practices in Sub-Saharan Africa: A review of the progress, barriers, gender differences and recommendations. Farming Syst. 2023, 1, 100019. [Google Scholar] [CrossRef] [Scilit]
- Marenya, P.P.; Barrett, C.B. Household-level determinants of adoption of improved natural resources management practices among smallholder farmers in western Kenya. Food Policy 2007, 32, 515–536. [Google Scholar] [CrossRef] [Scilit]
- Abegunde, V.O.; Sibanda, M.; Obi, A. Determinants of The Adoption of Climate-Smart Agricultural Practices by Small-Scale Farming Households in King Cetshwayo District Municipality, South Africa. Sustainability 2019, 12, 195. [Google Scholar] [CrossRef] [Scilit]
- Ouédraogo, M.; Houessionon, P.; Zougmoré, R.B.; Partey, S.T. Up take of Climate Smart Agricultural Technologies and Practices: Actual and Potential Adoption Rates in the Climate-Smart Village Site of Mali. Sustainability 2019, 11, 4710. [Google Scholar] [CrossRef] [Scilit]
- Aryal, J.P.; Rahut, D.B.; Maharjan, S.; Erenstein, O. Factors affecting the adoption of multiple climate-smart agricultural practices in the Indo-Genetic Plains of India. Nat. Resour. Forum 2018, 42, 141–158. [Google Scholar] [CrossRef] [Scilit]
- Teklu, A.; Simane, B.; Bezabih, M. Effectiveness of climate-smart agriculture innovations in small holder agriculture system in Ethiopia. Sustainability 2022, 14, 16143. [Google Scholar] [CrossRef] [Scilit]

Disclaimer/Publisher’s Note: The statements, opinions and data contained in all publications are solely those of the individual author(s) and contributor(s) and not of MDPI and/or the editor(s). MDPI and/or the editor(s) disclaim responsibility for any injury to people or property resulting from any ideas, methods, instructions or products referred to in the content. |
© 2026 by the authors. Licensee MDPI, Basel, Switzerland. This article is an open access article distributed under the terms and conditions of the Creative Commons Attribution (CC BY) license.