


Abstract
This study investigates the evolution of Mainland Chinese outbound tourism destinations from 2000 to 2024 using a longitudinal dataset. While Western and neighboring countries remain significant destinations, the analysis reveals a long-term but uneven and non-linear expansion toward the Global South, including the Pacific Islands, Antarctica, the Middle East, and Africa—challenging conventional geographical and policy-centric narratives. This evolution is conceptualized as a “Dual Expansion” pattern, reflecting the interplay between China’s socio-economic development, evolving tourist agency, and shifting geopolitical landscapes. Theoretically, this paper advances the perspective of “Imagined Regions” to explain how destinations, despite their modest statistical scale, acquire symbolic value as extreme and exotic spaces with alternative modernities. Our framework integrates tourists, state-level steering mechanisms (e.g., the Approved Destination Status system and visa liberalization), and geopolitical macro-drivers to advance a more nuanced understanding of contemporary cross-border mobility. The analysis further extends to international migration studies by conceptualizing tourism as a potential precursor to investment, retirement, and business migration, thereby contributing to broader debates on the tourism–migration nexus.
1. Introduction
Since the turn of the 21st century, Chinese outbound tourism has undergone a remarkable transformation. After the COVID-19 pandemic, outbound travel has gradually recovered, and China remains one of the world’s most significant outbound tourism markets, prompting extensive scholarly interest [1,2]. Historically, geographical proximity, cultural affinity, and mature service infrastructure made neighboring Asian countries the primary destinations [3]. As China integrated into the global economy, long-haul Western destinations gained prominence [4]. However, recent trends indicate a significant and accelerating shift toward the Global South, driven by a confluence of state-led initiatives like the Belt and Road Initiative (BRI) [5] and evolving tourist preferences for novel and culturally distinct experiences [6,7].
Existing research often frames this evolution within monolithic, policy-driven narratives, emphasizing the role of official diplomacy and economic cooperation in opening new destinations [8,9]. While valuable, this perspective risks obscuring the diverse socio-cultural realities of the Global South and the increasingly agentic role of Chinese tourists in selecting destinations beyond state-sanctioned pathways. Moreover, the theoretical tools available to explain why certain destinations—despite their modest statistical significance—acquire such powerful appeal remain underdeveloped. The challenge, therefore, is to move beyond a simplistic “policy-push” or “demand-pull” dichotomy towards a more integrated understanding that acknowledges the interplay between multiple drivers and the symbolic construction of destination appeal.
This paper addresses this gap by posing two central research questions: (1) What are the general patterns and key stages in the evolution of Chinese outbound tourism destinations since 2000? (2) How can this evolution be explained beyond existing geographical and policy-driven narratives, particularly considering the growing significance of the Global South?
To answer these questions, a descriptive statistical analysis is conducted on a dataset tracking Chinese outbound tourist flows across 185 destinations from 2000 to 2024. The findings reveal a “Dual Expansion” pattern characterized by absolute growth in both developed and Global South destinations, alongside a relative shift toward the Global South. To interpret the growing visibility of certain statistically marginal but symbolically prominent destinations, we propose “Imagined Regions” as a theoretical lens rather than an empirically demonstrated mechanism.
This study makes several contributions. First, empirically, it provides the most up-to-date and longitudinal analysis of Chinese outbound destination evolution, capturing the immediate pre-pandemic, pandemic, and post-pandemic periods. Second, theoretically, it develops the “Dual Expansion” framework to describe the observed growth and geographical diversification of destination flows. Drawing on Appadurai’s [10] notion of imagined worlds, it also proposes “Imagined Regions” as an interpretive lens for understanding the complex, multi-layered nature of this evolution, integrating perspectives on state steering, tourist agency, and geopolitical forces. Third, for migration studies, it advances a tentative assumption: the documented tourism patterns may serve as a possible “pre-migration precursor” [11] and a starting point for future research on tourism-to-migration linkages. To ensure transparency in addressing these objectives, we briefly preview how each research question is answered in the empirical sections. RQ1, concerning general patterns and key stages, is addressed in Section 4.1 through a segmented intervention regression centered on three historically informed nodes (2010, 2020, and 2023), with HAC-robust Wald tests of the corresponding parameter changes, and through the descriptive documentation of the “Dual Expansion” pattern (Table 1; Figure 1 and Figure 2). RQ2, concerning explanations beyond policy-centric narratives, is addressed in Section 4.2 and Section 4.3 through the regional analysis of the Global South and the four “New Frontiers” cases, and is then theoretically interpreted in Section 5.1 via the “Imagined Regions” lens and the infrastructure-led model. This paper is structured as follows: Section 2 reviews the relevant literature; Section 3 outlines the methodology and data; Section 4 presents the empirical findings; Section 5 discusses the theoretical and practical implications; and Section 6 concludes the study.
Table 1.
Segmented intervention regression and Wald tests for Chinese outbound tourism, 2000–2024.
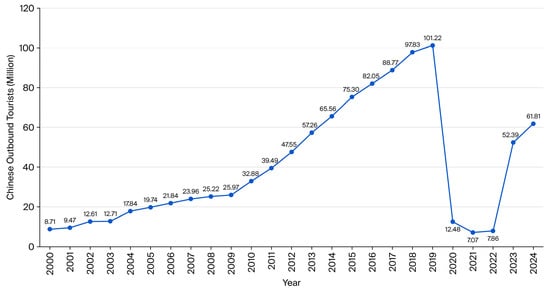
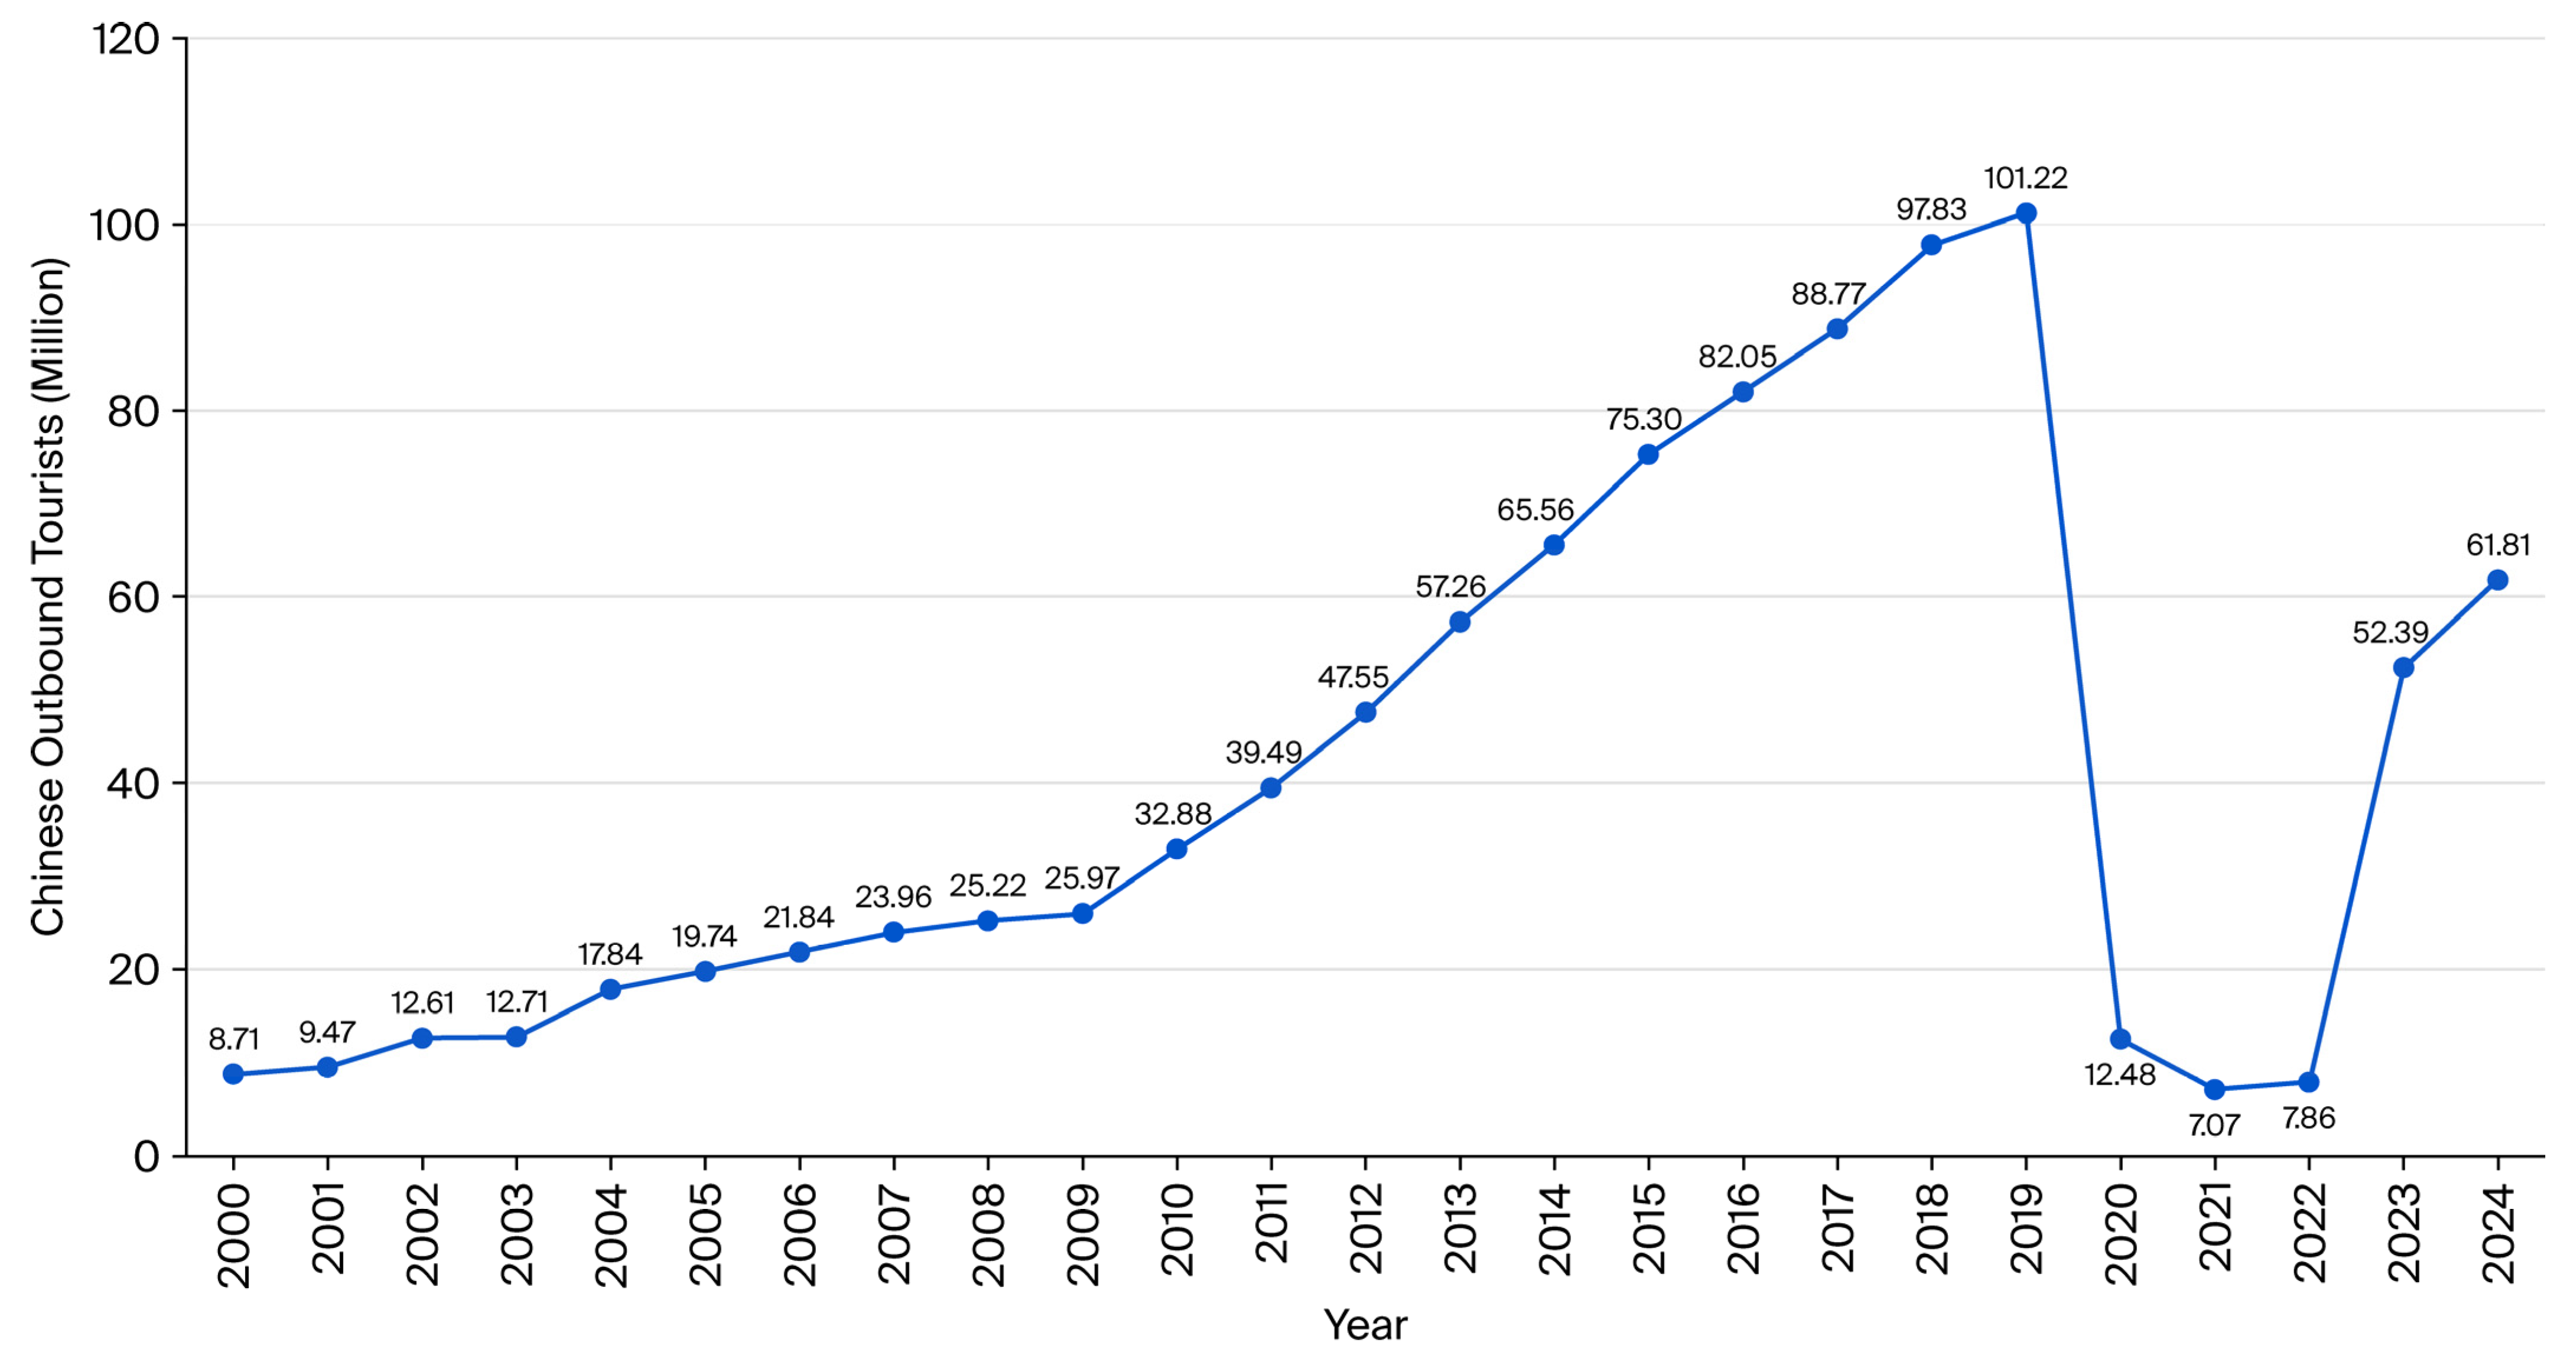
Figure 1.
Number of Chinese outbound tourists (2000–2024).
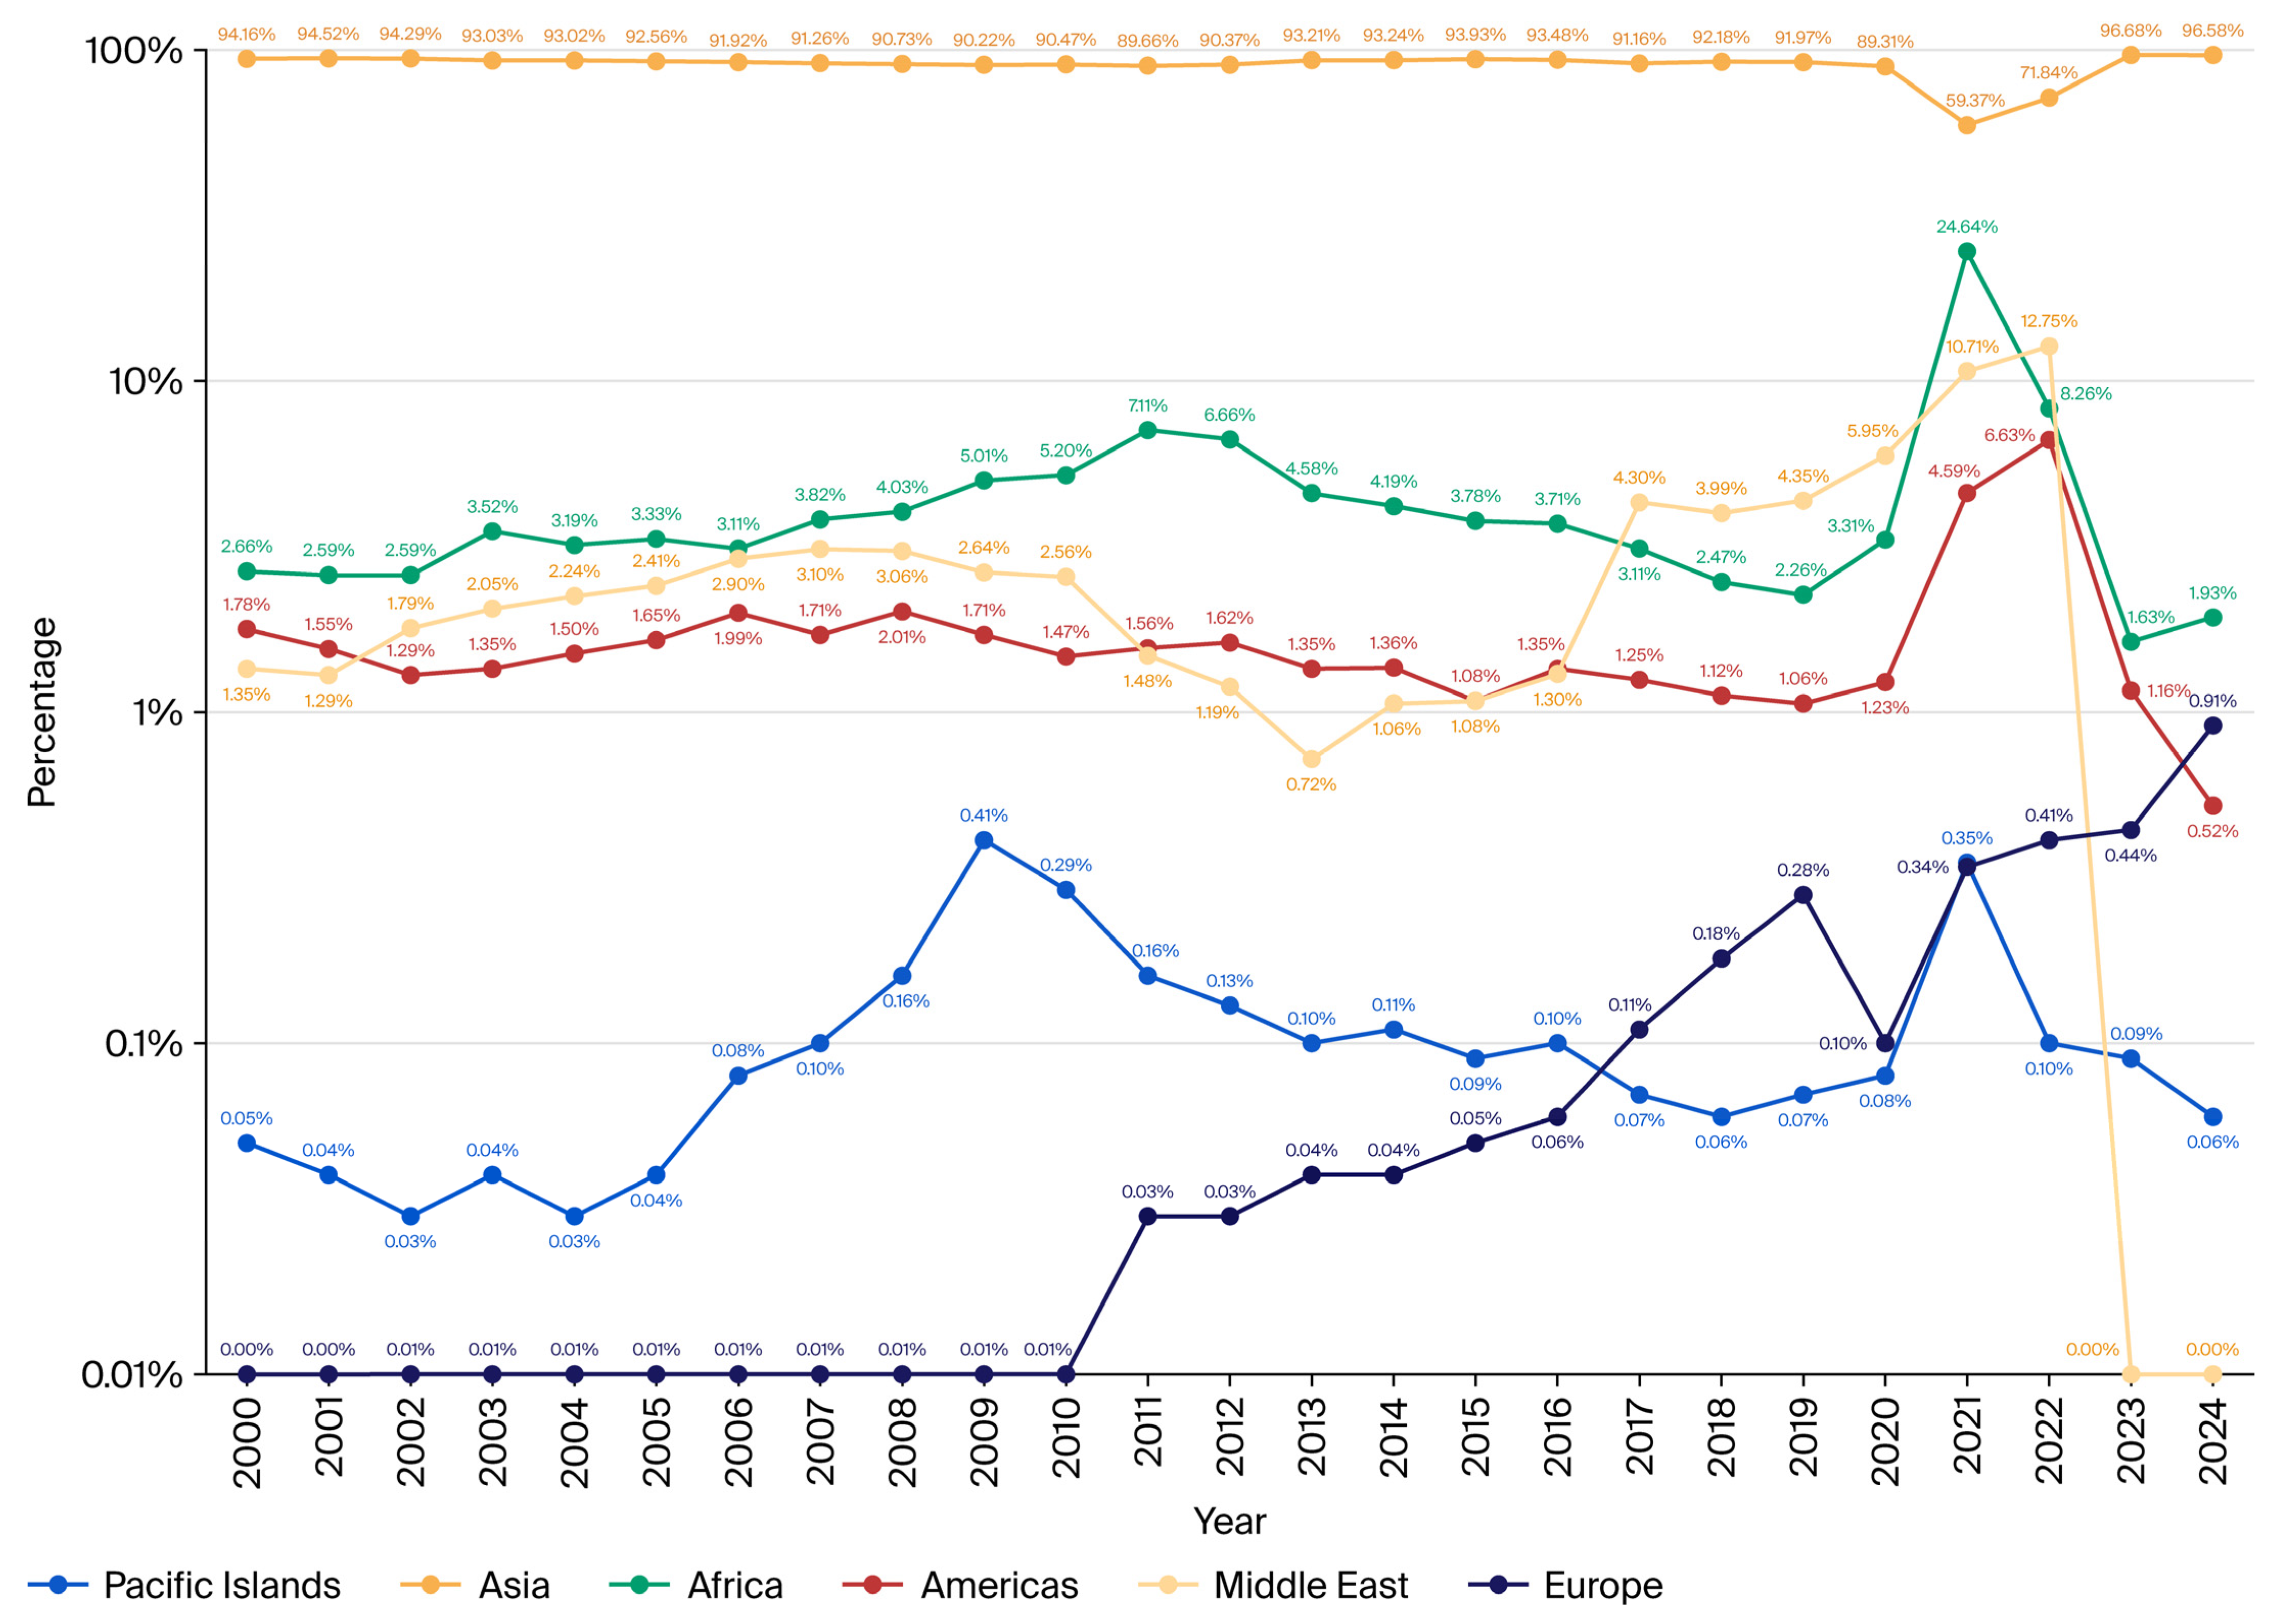
Figure 2.
Percentage of each region according to the destination choices of Chinese tourists to the Global South (2000–2024).
2. Literature Review
2.1. The Grand Narrative of Chinese Outbound Tourism: From Policy to Diversification
The development of Chinese outbound tourism is inextricably linked to the nation’s post-1978 Reform and Opening-up policy [12]. This period saw a dramatic rise in household disposable income, creating the economic foundation for mass outbound travel. Government policy has acted as a powerful steering mechanism, initially restricting travel to “Hong Kong and Macao Tours” and “Border Tours” before the landmark 1997 Approved Destination Status (ADS) policy that liberalized overseas travel, which led to a rapid increase in the number of destinations [8,9,13]. The ADS system has been shown to produce significant increases in arrivals from China, averaging 52% over three years following a designation, with evidence of travel diversion as more countries received ADS [14]. This policy-driven geographical narrative suggests a staged expansion from neighboring countries to Western destinations, culminating in the contemporary diversification influenced by the BRI [5].
However, focusing solely on this grand narrative risks creating a monolithic view of Chinese tourists as passive recipients of state directives. Recent research has documented a marked increase in Chinese tourists’ preference for outbound travel destinations in BRI-participating countries, including Thailand, Singapore, Malaysia, Indonesia, the Philippines, Laos, Vietnam, the United Arab Emirates, Egypt, Russia, and Türkiye [15]. Additionally, as a result of increased BRI cooperation, visa facilitation for countries in Central Asia and the Caucasus has further accelerated this trend [16]. Nevertheless, the extent to which these state-led initiatives fully explain destination choice requires more nuanced theoretical treatment.
2.2. The Rise of the “New Chinese Tourist”: Agency and the Pursuit of Novelty
A parallel body of literature has focused on the changing profile and behavior of Chinese tourists. The “New Chinese Tourist” (NCT) is characterized by a shift away from mass “shopping + sightseeing” towards a desire for deeper cultural immersion, personalized services, and unique experiences [1]. This segment, which often originated from the growing middle and upper classes, is less reliant on official channels and seeks to demonstrate cultural capital through non-traditional, conspicuous, and potentially self-actualizing travel choices [6,7]. Long-haul trips by affluent Chinese travelers now often exceed two weeks, with spending frequently surpassing 100,000 yuan per trip, as demand shifts toward private tours, wellness retreats, niche adventure travel, and tailor-made cultural experiences [17].
This pursuit of novelty is a key driver of the turn towards destinations previously considered marginal, such as Africa or the Pacific Islands, which offer a strong contrast to familiar Asian or Western settings. Africa, in particular, has seen Chinese outbound tourism scale upward around 2010 because of the addition of flights and optimized visa policies [17]. The “Imagined Regions” concept advanced in this paper builds on this idea, positing that these destinations are not merely chosen for their physical attributes but are actively constructed as symbolic spaces by tourists, media, and the tourism industry.
2.3. Destination Image, Imaginary, and the Construction of Places
The “Imagined Regions” concept draws on a rich theoretical tradition in tourism studies and cultural geography, and Appadurai’s [10] notion of “imagined worlds” and “mediascapes” provides a foundational framework for understanding how places are produced through the circulation of images, narratives, and discourses across global media. As Appadurai argued, imagination is not merely an individual faculty but also a “cultural agent” and a socially defined force shaping mobility and aspiration [10]. Tourism destination marketing is designed to communicate an imagined world that is attractive to individuals in specific target audiences, thus creating a “community of sentiment” [18].
The destination image literature has long recognized that tourists’ perceptions of places are constructed through a complex interplay of induced (marketing), organic (media and word of mouth), and complex (actual experience) image formation agents [19,20]. More recent work on “tourism imaginaries” has extended this tradition by examining how imaginaries are co-produced by tourists, industry actors, and media, as well as how they shape not only travel decisions but also broader geopolitical and cultural understandings [18]. Building on these perspectives, this study proposes “Imagined Regions” as a theoretically informed interpretive lens. The concept refers to the possibility that certain destinations—including destinations in the Global South and other frontier settings—may acquire symbolic significance through their association with exclusivity, extreme adventure, exotic authenticity, or alternative modernities. From this perspective, destination choices may be connected to broader processes of identity formation, aspiration, and global positioning.
2.4. Tourism Mobility and Migration Precursors
Mobility studies have long recognized that various forms of movement—tourism, business travel, education, and migration—exist on a continuum [21]. Tourism can act as a “pre-migration precursor” by enabling cross-border social networks to form, lifestyle and investment opportunities to be identified, and knowledge about potential destination countries to be accumulated [11,22]. In the Chinese context, several studies have noted the link between tourist flows and subsequent migration patterns, including student mobility, real estate investment, and retirement migration [23,24]. Thus, the “liquid migration” concept and the role of “mobility pioneers”, whose initial tourist visits pave the way for subsequent temporary or permanent migration, have gained increasing traction in migration scholarship [25].
By explicitly framing the analysis within this framework, the argument here is that the specific patterns of Chinese tourist flow toward the Global South are not merely about leisure but are also potentially laying the groundwork for more permanent forms of transnational engagement. Therefore, the tourism-to-migration linkage is presented as a possible scenario for future research. This extends the analytical relevance of tourism scholarship to core concerns determined in migration studies, an agenda that remains underexplored in the Chinese outbound tourism literature.
3. Methodology
3.1. Data Sources and Measurement
This paper employs a descriptive statistical analysis of annual data on Chinese outbound tourist arrivals, and data were compiled from three primary categories: (1) UNWTO (United Nations World Tourism Organization) Yearbook of Tourism Statistics (2000–2021): This book was the foundational data source for the long-term trend analysis. (2) National Statistical Databases and the UN Tourism Data Dashboard (2022–2024): Publicly available databases from destination countries’ tourism boards and the UNWTO were used to update data for the post-pandemic period. (3) Industry Association Data (e.g., International Association of Antarctica Tour Operators, IAATO): Data from the International Association of Antarctic Tour Operators supplemented missing information for niche destinations. During the 2023–2024 Antarctic tourism season, a record 122,072 visitors arrived on the continent, with Chinese tourists accounting for 9384 of these, marking a record high [26].
In this paper, “tourists” refers to person-times, counting each trip separately to measure outbound frequency, with data prioritized from “Arrivals of non-resident tourists” and “Arrivals of non-resident tourists in all types of accommodation establishments” to ensure authenticity. Following the International Recommendations for Tourism Statistics 2008 [27], international tourism includes outbound and inbound activities; a tourist is an overnight visitor; and a visitor is a traveler outside their usual environment for less than a year for non-employment purposes. The “Global South” is operationalized following the classification of the Finance Center for South-South Cooperation (FCSSC), which comprises 134 developing countries across Africa, Latin America, Asia, the Pacific Islands, and the Caribbean. “Western countries and regions” refer to 62 developed economies in Europe, North America, and Oceania. Non-Western destinations refer to all destinations outside the 62 developed economies in Europe, North America and Oceania, including Hong Kong, Macau, Taiwan, Singapore, South Korea, the Middle East, Central Asia and other non-Western destinations. “Mainland China” is used to specify residents of the People’s Republic of China, excluding Hong Kong, Macao, and Taiwan.
3.2. Analytical Approach
The data are analyzed across three distinct phases to capture the change dynamics: (1) Phase I: Pre-Pandemic Growth (2000–2019): This phase was used to identify the long-term trajectory and secular trends in destination choices. (2) Phase II: Pandemic Disruption (2020–2022): This phase was used to examine the impact of an exogenous shock on existing mobility patterns. (3) Phase III: Post-Pandemic Recovery (2023–2024): This phase was used to assess the resilience and path of recovery and to identify structural shifts.
The analysis identifies the absolute numbers, relative growth rates, and percentage shares of total outbound tourists for different regions and stages.
This paper uses a single segmented intervention regression because it estimates the three prespecified interventions jointly, allows the form of each change to reflect its substantive context, and avoids fitting a separate post-2023 slope from only two annual observations. The dependent variable is the annual number of outbound tourist departures expressed in millions. A level specification was used because the stage framework concerns changes in absolute travel volume and annual increments; the resulting parameters should therefore not be interpreted as breaks in proportional growth.
The model for the annual series from 2000 to 2024 was specified as follows:
where Yt is outbound departures in millions and t = Year − 2000. The term max(t − 10, 0) allows the annual slope to change from 2010. D2020,t equals 1 from 2020 onward, while max(t − 20, 0) allows an additional slope change from 2020. D2023,t equals 1 in 2023–2024 and estimates the immediate level shift associated with reopening. No separate post-2023 slope parameter was estimated because only two post-reopening annual observations are available.
The prespecified node-level hypotheses were H0: β2 = 0 for the 2010 slope change; H0: β3 = β4 = 0 for the joint 2020 level and slope change; and H0: β5 = 0 for the 2023 reopening level shift. Each restriction was evaluated with a Wald F-test:
where R defines the restriction, V is the covariance matrix, and q is the number of restrictions. Ordinary least squares was used for point estimation. Primary inference used a Newey–West heteroskedasticity- and autocorrelation-consistent covariance matrix with a Bartlett kernel, lag 1, and the finite-sample factor n/(n − k). Lag 1 was chosen because the observations are annual and the sample contains only 25 years. HAC inference was selected because temporal dependence and non-constant error variance can make conventional OLS and classical F-test standard errors unreliable.
The Durbin–Watson statistic was used as a descriptive diagnostic for first-order residual correlation, and the Breusch–Pagan LM test was used to assess heteroskedasticity. Because the Breusch–Pagan result indicated non-constant variance, the HAC covariance was used for the primary Wald tests. HC3 heteroskedasticity-robust covariance estimates were also calculated as a leverage-sensitive small-sample robustness check. These diagnostics and robustness procedures evaluate the reliability of inference; they do not select the intervention dates.
Because three prespecified node-level hypotheses were evaluated, a Bonferroni correction was applied to control the family-wise Type I error rate. Unadjusted p-values are reported for transparency and evaluated against α = 0.05/3 = 0.0167. A node was treated as statistically supported only when both the primary HAC(1) test and the HC3 sensitivity test met the corrected threshold.
The three dates correspond to distinct historical interventions: (1) 2010 marked China’s emergence as the world’s second-largest economy and the maturation of the Approved Destination Status system; (2) 2020 captured the COVID-19 shock to international mobility; and (3) 2023 marked border reopening and the resumption of outbound travel. The 2023 coefficient tests an immediate reopening-associated level shift, not a stable post-2023 trend or a causal effect.
The findings are presented in visual formats (figures) and detailed comparative tables. Since early 2023, China’s full border reopening has triggered a pronounced resurgence in outbound travel, with significant implications for global destination markets. It was anticipated that the number of international outbound trips taken by Chinese travelers in 2024 would approximately double relative to 2023 volumes [28].
3.3. Data Limitations
Several data limitations warrant acknowledgment. First, the classification of outbound tourism destination types lacks unified, detailed international statistical standards. The UNWTO divides inbound data into six categories, but there are controversies between countries and international organizations regarding the definition of “tourism.” Second, data completeness is insufficient, as data updates for most developing countries are delayed post-pandemic, making it difficult to accurately assess the scale and recovery of Chinese outbound tourism after the pandemic and the structural changes in destination choices. Third, the reliance on arrival data (person-trips) does not capture the qualitative dimensions of the tourist experience, the purpose of travel (leisure, business, or Visiting Friends and Relatives), or the heterogeneity within the tourist population. Additionally, the analysis of 2023–2024 data for several African sub-regions is limited by missing data, reflecting post-pandemic reporting delays and capacity constraints in the national statistical systems of certain developing countries. These gaps highlight ongoing challenges in tourism data governance in the Global South and underscore the need for enhanced international technical assistance. Finally, the intervention regression is estimated on absolute annual departure volumes. It therefore evaluates changes in the level trajectory rather than proportional-growth breaks. The 2010 inference is scale-sensitive, and the 2023 parameter captures an immediate level shift because only two post-reopening observations are available.
4. Results
4.1. Staged Development and the “Dual Expansion” Phenomenon
The data reveal a clear staged development of Chinese outbound tourism. From 2000 to 2019, the total number of outbound trips grew from 8.7 million to 101.2 million, indicating a 1061.6% increase. This pre-pandemic period was characterized by two distinct sub-phases: steady growth (2000–2009) and rapid expansion (2010–2019). Then, the COVID-19 pandemic (2020–2022) caused a dramatic contraction, with numbers plummeting by 92.2% from 101.2 million in 2019 to 7.8 million in 2022. However, the post-pandemic recovery phase (2023–2024) saw a resurgence, reaching 61.8 million in 2024, representing a recovery of 61% relative to the 2019 level. The recovery for Chinese tourism has been uneven, with a swift and sound rebound in domestic tourism and tepid and partial growth for outbound tourism in 2023 [29] (see Figure 1).
Table 1 shows the prespecified node-level Wald tests from the segmented intervention regression. All three hypotheses meet the Bonferroni-adjusted threshold under the primary HAC(1) covariance and the HC3 sensitivity covariance. The estimated changes refer to the absolute-volume trajectory and are conditional on the other interventions included in the model (see Table 1).
For 2010, the estimated change in the annual slope was +5.779 million departures per year. The HAC(1) Wald test was F(1, 19) = 317.54, p < 0.001; the HC3 sensitivity test was F(1, 19) = 192.06, p < 0.001. Both results pass the Bonferroni-adjusted threshold. This evidence supports 2010 as a change in the annual increment of absolute outbound volume, conditional on the later pandemic and reopening interventions. It should not be generalized to a change in proportional growth.
For 2020, the estimated immediate level shift was −104.324 million departures and the additional slope change was −8.156 million departures per year. These correlated parameters were tested jointly. The HAC(1) Wald test was F(2, 19) = 883.48, p < 0.001, and the HC3 test was F(2, 19) = 324.21, p < 0.001. The results provide strong evidence of a discontinuity in the absolute-volume trajectory associated with the COVID-19 disruption.
For 2023, the reopening-associated level shift was +47.870 million departures. The HAC(1) Wald test was F(1, 19) = 69.16, p < 0.001, and the HC3 sensitivity test was F(1, 19) = 9.05, p = 0.007. Both meet the Bonferroni-adjusted threshold. The result supports 2023 as an immediate reopening node in the absolute-volume series. Because the post-2023 period contains only 2023 and 2024, it does not establish a durable new slope or a causal reopening effect.
This phasic development is accompanied by a fundamental geographical shift. This is conceptualized as a “Dual Expansion” pattern. While the “North” (Western countries) remains a crucial long-haul market, its share of total departures has declined from around 18% in 2000 to merely 8.5% in 2024. Conversely, the non-Western destinations has consolidated its dominance, increasing its share from 82% to over 91% during the same period. This dual expansion is not merely a replacement of one market for another; it also represents simultaneous growth and diversification across a broader spectrum of global regions, with the absolute number of tourists visiting Western destinations also growing substantially even as their relative share declines.
4.2. The Enlarging Role of the Global South
Tourist flows to the Global South have grown faster than the total outbound average, from 2.6 million in 2000 to 36.5 million in 2019, representing a 14-fold increase compared to an 11-fold increase in total outbound. Additionally, its share of total outbound rose from 29.8% to 36.1% in this period. The post-pandemic recovery was stronger for these destinations, solidifying their centrality. As Table 2 shows, the growth in key sub-regions of the Global South far outpaced the total growth rate.
Table 2.
Changes in Chinese tourists to the Global South vs. total outbound by stage (2000–2024).
Regionally, Asia (particularly Southeast Asia) has historically dominated, but the Middle East is emerging as a second major pole. Additionally, while smaller in absolute terms, South Asia and Africa are showing significant niche market potential, as detailed in the regional analyses below. Moreover, Chinese tourists have shown a strong preference for several BRI-participating countries, including Thailand, Singapore, Malaysia, Indonesia, the Philippines, Laos, Vietnam, the United Arab Emirates, Egypt, Russia, and Türkiye [15].
4.3. The Four “New” Frontiers of the Global South
The four regional cases, Pacific Island Countries, Antarctica, Africa, and the Middle East, were selected on the basis of observable growth data. They are among the fastest-growing destinations in the Global South. Between 2000 and 2019, global outbound tourism grew by approximately 1061.6%. Over the same period, Pacific Island Countries grew by approximately 6126%, the Middle East by 4420.2%, and Africa by 1093.8%. Antarctica grew by over 21,000% between 2003 and 2019.
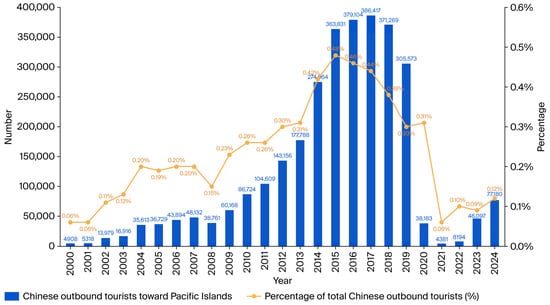
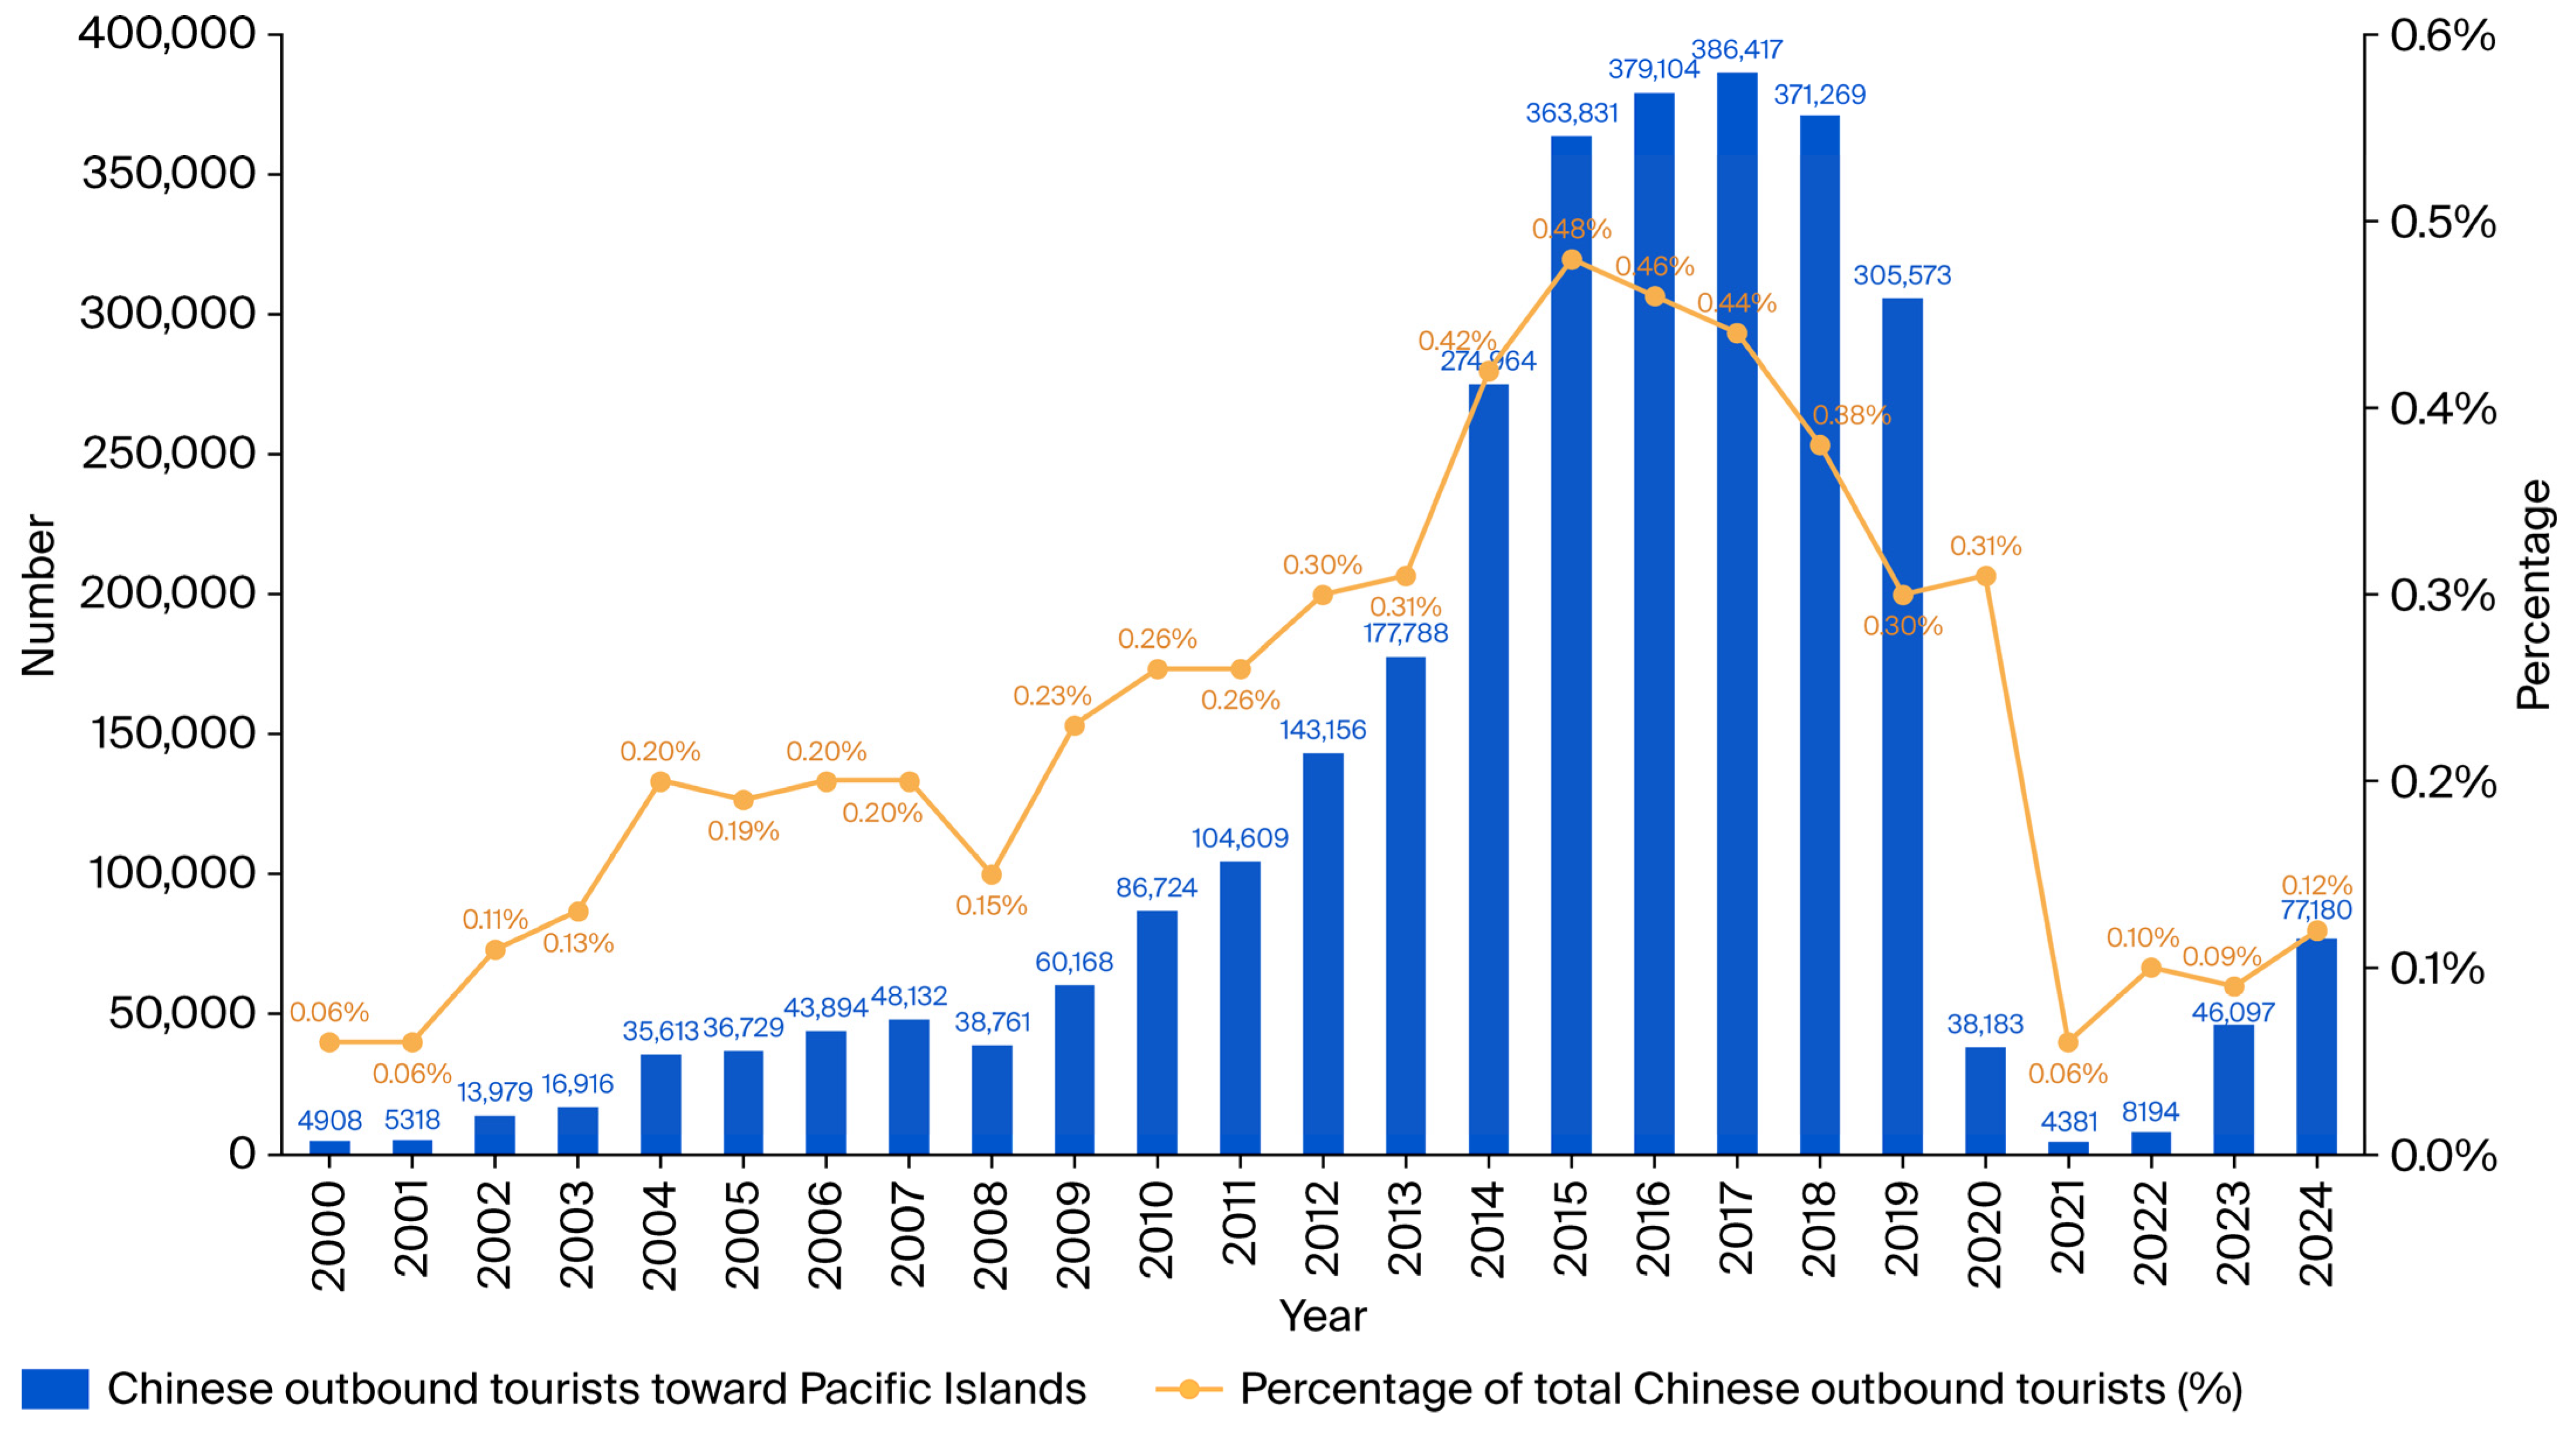
Pacific Island Countries: Symbolism Amidst Fragility. The Pacific Island Countries (PICs) represent a destination characterized by extreme growth and high volatility. Driven by the granting of ADS and diplomatic engagement, tourist numbers exploded by 6126% from 2000 to 2019. However, the pandemic caused a near-total collapse (−97.3% from 2019 to 2022), underscoring the vulnerability of these remote, resource-dependent destinations to external shocks. Moreover, recovery has been slow, reaching only 25.3% of its 2019 level in 2024 (see Figure 3).
Figure 3.
The number of Chinese tourists to Pacific Island Countries and percentage of the total number of Chinese outbound tourists (2000–2024).
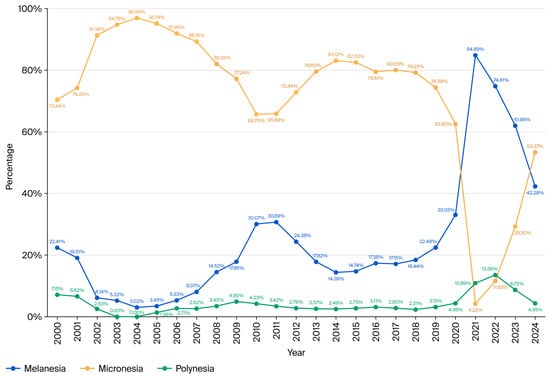
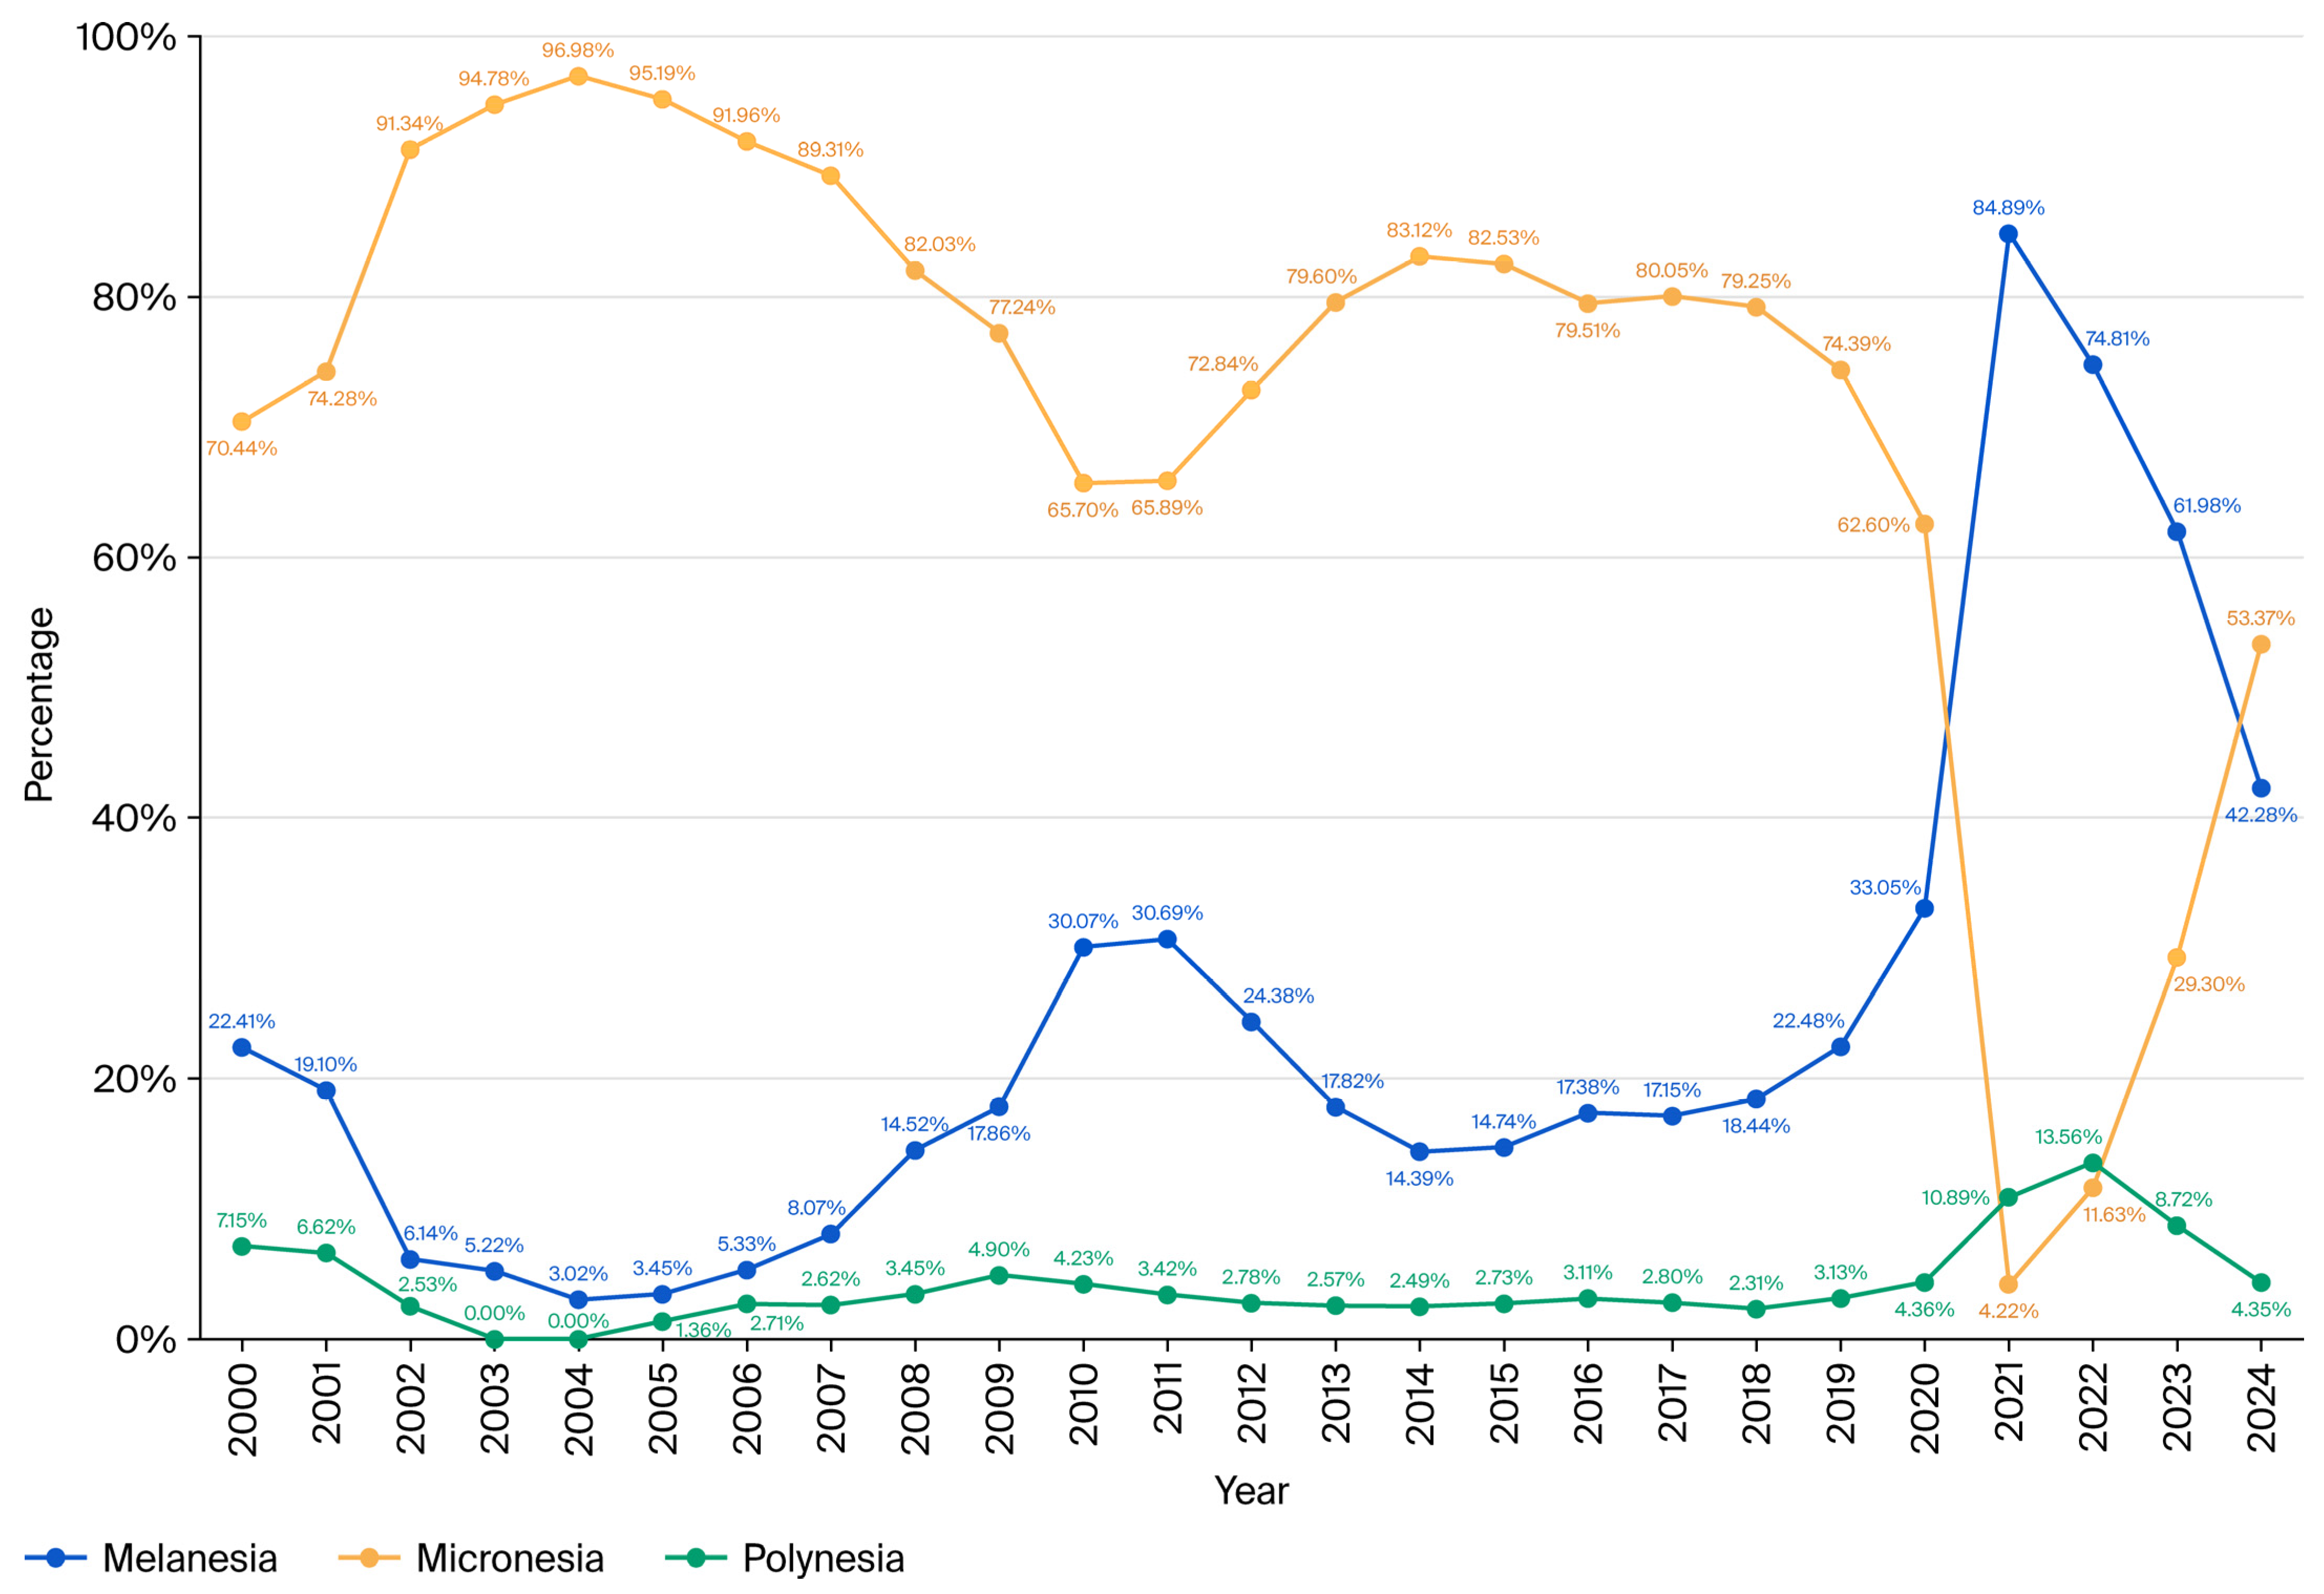
Sub-regionally, three patterns emerge. Micronesia was the most popular destination, with Chinese tourists increasing by 1548.08% from 2000 to 2019 and its tourism industry experiencing the fastest post-2022 recovery. Melanesia saw the largest long-term growth (6475.12% from 2000 to 2019) and became the primary destination during the pandemic, though its recovery has been slower. However, Polynesia has remained a minor destination, with its share consistently below 5%. Key influencing factors include diplomatic and economic cooperation, such as China’s accession to the South Pacific Tourism Organization in 2004 and the granting of ADS to multiple PICs between 2003 and 2006, which drove initial growth. Growth slowed from 2010 to 2019 due to factors like political relations affecting Palau and natural disasters in 2018–2019. Post-pandemic, China has included 10 PICs in its resumed group’s travel list and signed a visa exemption agreement with Samoa, signaling future potential. However, limited direct flight connectivity, apart from routes to Fiji and Samoa, remains a major constraint, increasing costs and reducing travel convenience (see Table 3 and Figure 4).
Table 3.
The number of Chinese tourists to each island group of Pacific Island Countries by stage (2000–2024).
Figure 4.
Percentage of Chinese tourists visiting each island group of Pacific Island Countries relative to the total number of Chinese outbound tourists (2000–2024).
Antarctica: Elite Tourism and Governance Gaps. Polar tourism constitutes the epitome of high-end, symbolic travel. The Chinese market rebounded to 9384 in 2023, ranking third globally and marking a historical high [30]. This demand reflects the growing economic and cultural capital of China’s elite and their pursuit of “extreme” experiences. Data from IAATO show that from 2014 to 2024, the number of Chinese tourists visiting Antarctica grew nearly tenfold [31] (see Table 4).
Table 4.
The number of Chinese outbound tourists to Antarctica by stage (2000–2023).
However, this mobility has outpaced governance. China’s limited participation in IAATO and the absence of specific domestic legislation for Antarctic tourism present a significant sustainability challenge [32]. This case perfectly illustrates the “Imagined Regions” dynamic: the region’s symbolic allure drives demand, but the institutional framework for managing it lags behind. Environmental and behavioral factors also constrain sustainable development, with global warming-driven glacier melting and inappropriate tourist behavior posing significant risks [33]. The persistently high cost of Antarctic travel remains a barrier for most potential tourists, likely limiting market expansion despite growing interest.
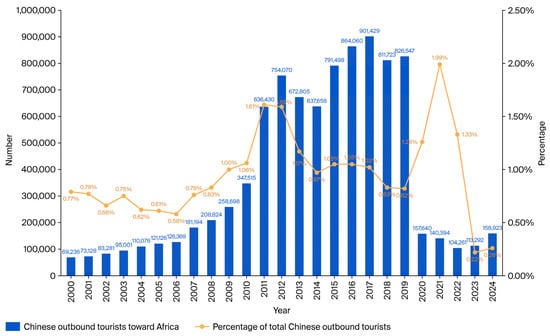
Africa: The “Infrastructure-Led” Model of Tourism Growth. Africa stands as a region where Chinese tourism growth has been significant (1093.8% from 2000 to 2019) but remains a small fraction of total outbound (under 2%). Unlike the top-down ADS model, its growth appears to follow an “infrastructure-led” pattern. Prior Chinese investments in infrastructure (airports, roads, and hotels) for resource extraction and state-owned enterprise projects have created the foundational elements for later tourism flows. China’s outbound tourism to Africa started to scale upward around 2010 due to the addition of flights and optimized visa policies to the continent [34]. With the deepening of the BRI, China and Africa have achieved fruitful results in areas such as facilitating tourism visas, increasing direct flights, enhancing tourism safety and quality, and improving hotel and scenic spot infrastructure (see Figure 5).
Figure 5.
The number of Chinese tourists to Africa and percentage of the total number of Chinese outbound tourists (2000–2024).
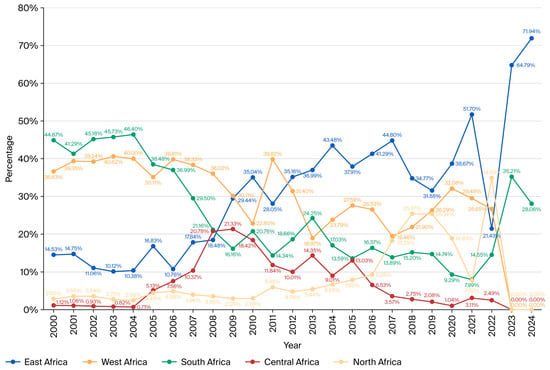
Regionally, preferences have shifted across four sub-periods. In 2000–2009, Southern and Western Africa were primary destinations, though their shares declined, while Eastern Africa saw rapid growth and became the second-largest sub-region. From 2010 to 2019, Eastern Africa held the status of top destination, and Northern Africa emerged as the fastest-growing sub-region, largely due to visa-free policies in Morocco and Tunisia. During the pandemic, Chinese outbound tourists to Eastern and Western Africa declined, while Southern, Central, and Northern Africa saw slight increases in share. In the recovery phase (2023–2024), Eastern Africa rebounded strongly, while Southern Africa saw modest growth, though data gaps for Western and Central Africa limit full assessment. The appeal of Eastern Africa is attributed to political stability, strong diplomatic ties with China, mature tourism offerings, favorable visa policies, and direct flights. Conversely, security incidents, health crises, and incomplete data in recent years have posed challenges to growth and measurement (see Table 5 and Figure 6).
Table 5.
The number of Chinese tourists to each sub-region of Africa by stage (2000–2024).
Figure 6.
Percentage of Chinese tourists visiting different African sub-regions (2000–2024).
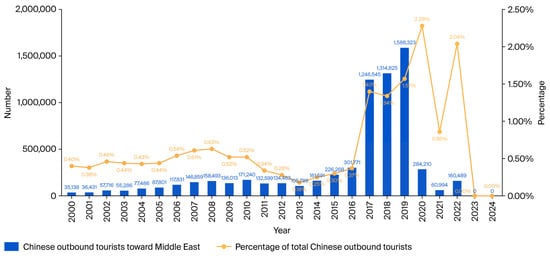
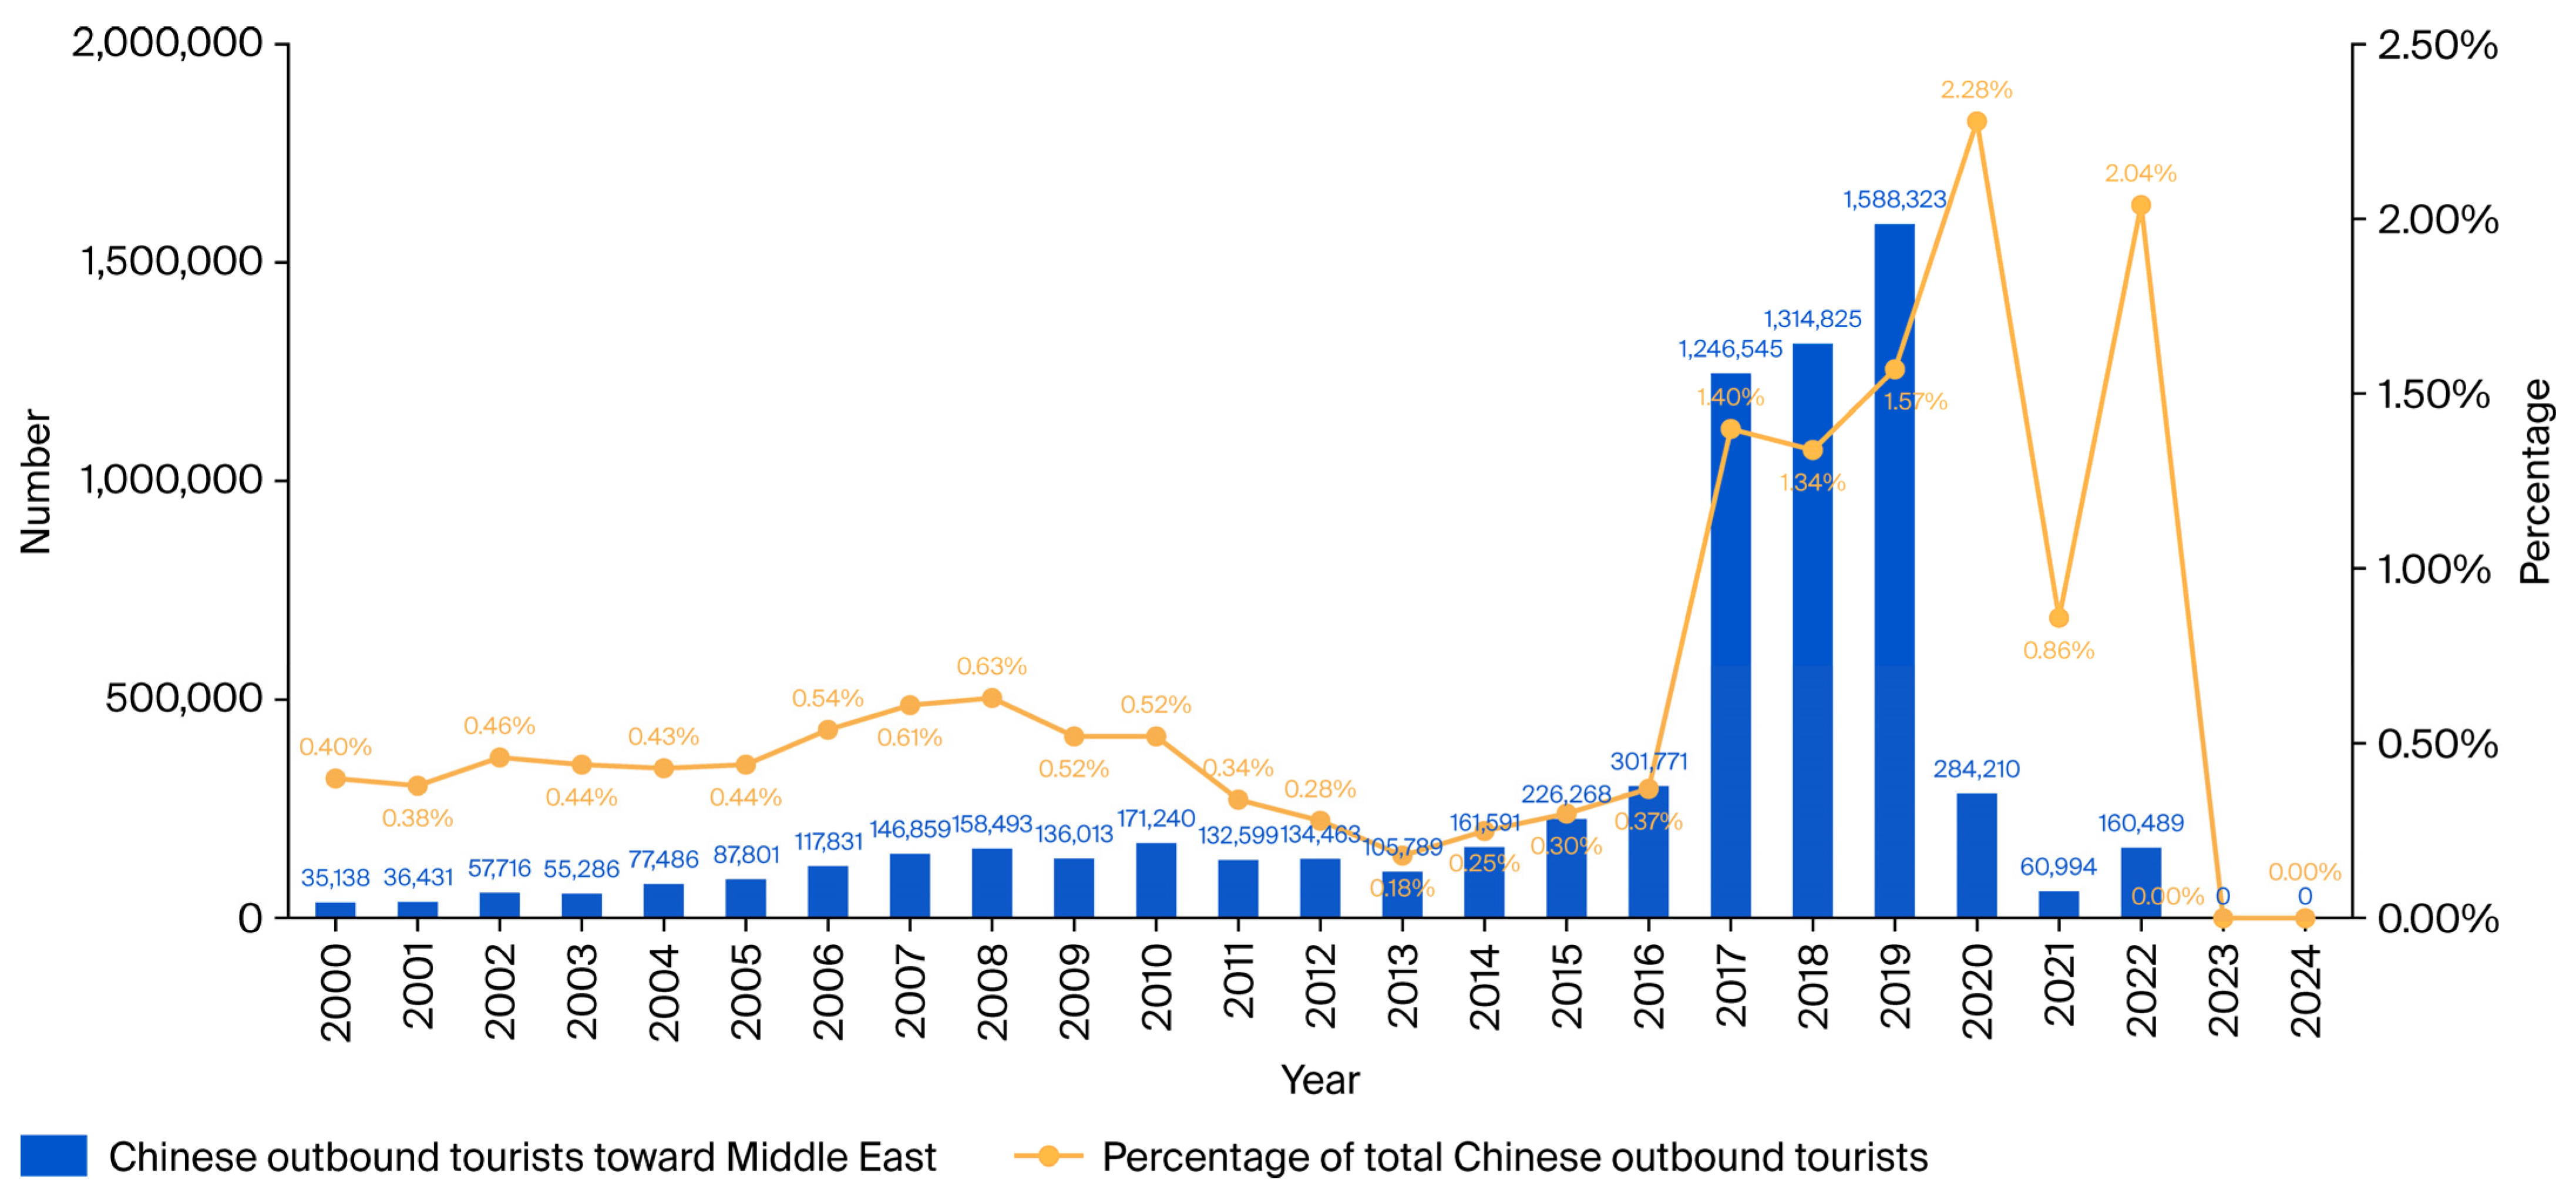
The Middle East: Geopolitics and Rapid Ascent. The Middle East experienced the third-highest regional growth (4420.2% from 2000 to 2019) due to a variety of factors. However, the Arab Spring caused a temporary downturn (2011–2013), demonstrating the region’s political volatility. The subsequent rapid expansion (2014–2019) was propelled by BRI cooperation, aggressive visa facilitation (e.g., UAE, Saudi Arabia), and increased flight connectivity. The post-COVID period shows strong recovery potential, as highlighted by record arrivals to Saudi Arabia in 2024 following ADS agreements (see Table 6 and Figure 7).
Table 6.
The number of Chinese tourists to the Middle East by stage (2000–2022).
Figure 7.
The number of Chinese tourists to the Middle East and percentage of the total number of Chinese outbound tourists (2000–2024).
Destination preferences within the region reveal key patterns. Egypt, a long-established cultural destination, saw Chinese outbound tourist numbers grow by 1984.77% from 2000 to its 2017 peak. Saudi Arabia emerged as a popular destination, with Chinese outbound tourism growing 1280.16% from 2000 to 2019; the 2024 ADS agreement and e-visa policy in 2025 propelled arrivals to a record 140,000, making China Saudi Arabia’s second-largest source market [35]. The UAE attracted Chinese outbound tourists after 2017 through luxury offerings, digital marketing, and visa-free access, nearing one million arrivals by 2019. Additionally, countries like Oman and Qatar are also gradually gaining favor. Looking ahead, tourism cooperation prospects remain strong, as underscored by initiatives like the 2025 ASEAN–China–GCC Summit statement emphasizing high-quality tourism development, signaling continued growth potential for Chinese travel to the Middle East [36] (see Table 6 and Figure 7).
5. Discussion
5.1. Theoretical Implications
The findings challenge the singular, policy-driven narrative of Chinese outbound tourism expansion. By revealing the “Dual Expansion” pattern and the emergence of “Imagined Regions,” a more nuanced theoretical framework that integrates multiple drivers is offered.
Conceptualizing “Imagined Regions”. Drawing on Appadurai’s [10] notion of “imagined worlds” and the destination image and tourism imaginaries literature, this study proposes “Imagined Regions” as an interpretive lens for understanding how destinations examined in this study, particularly the Pacific Island Countries and Antarctica, may acquire symbolic significance as spaces associated with exoticism, extremity, exclusivity, adventure, and alternative modernities. Such meanings may be co-constructed through tourism marketing, social media platforms such as Rednote (Xiaohongshu) and Douyin, and tourists’ interpretations. However, the arrival data used in this study do not directly measure symbolic construction, identity work, media imaginaries, or tourists’ motivations. These proposed mechanisms therefore require further investigation through qualitative research, surveys, and social-media content analysis.
The concept extends existing theoretical frameworks in three significant ways. First, unlike the broader category of a “destination image,” which tends to focus on perceptions of specific attributes, “Imagined Regions” emphasize the process by which entire regions are symbolically constituted as distinct ontological categories—spaces that are fundamentally other and therefore desirable precisely for their otherness. Second, building on Salazar’s [18] work on tourism imaginaries, the concept highlights how these constructions are not merely imposed by marketing actors but are also co-produced through the circulation of images, narratives, and discourses across multiple platforms, including state media, commercial marketing, and user-generated content. Third, the concept captures the dynamic interplay between symbolic construction and material reality: these regions are imagined in ways that may diverge significantly from their on-the-ground realities, creating a productive tension that drives continued tourist interest.
The pursuit of these images is not merely leisure; it is also a form of identity work, enabling Chinese tourists to signal social status, cultural sophistication, and a cosmopolitan outlook [7]. The growing number of Chinese travelers to Antarctica—from 38 in 2003 to 9384 in 2023—exemplifies how an “Imagined Region” can acquire cachet precisely because of its perceived inaccessibility and extremity. Similarly, the appeal of Pacific Island destinations lies in what they represent—a pristine, alternative modernity—rather than in their sheer statistical weight. This theoretical lens moves the analysis beyond simple destination marketing to a socio-cultural analysis of how travel choices shape and reflect evolving Chinese identities and aspirations.
The Interplay between Tourist Agency, State Steering, and Geopolitics. The “Dual Expansion” framework posits that the evolution is not a unidirectional process driven by a single force but the emergent outcome of a dynamic interplay: (1) Tourist Agency: The rise of NCT signifies a growing bottom-up force. Tourists are not passive recipients of state policies; they actively seek diverse, personalized, and often non-traditional experiences, driving demand for destinations like Antarctica and the Middle East. Long-haul trips by affluent Chinese travelers now frequently exceed two weeks, with spending surpassing 100,000 yuan per trip, as demand shifts toward private tours, wellness retreats, niche adventure travel, and tailor-made cultural experiences [17]. (2) State Steering: Simultaneously, top-down state-level mechanisms—the ADS system, bilateral visa agreements, and diplomatic initiatives like the BRI—actively create the structural conditions for this mobility, channeling tourists towards “friendly” nations and providing the institutional infrastructure that makes travel viable. The ADS system has been shown to produce significant increases in arrivals from China, averaging 52% over three years following designation [14]. The granting of ADS to multiple PICs between 2003 and 2006 directly catalyzed the initial growth in that region, while the 2024 ADS agreement with Saudi Arabia exemplifies how state-level tourism diplomacy creates enabling conditions for market expansion. (3) Geopolitical Macro-Drivers: These processes do not occur in a vacuum. The post-COVID landscape, with its heightened US–China tensions, has influenced the relative attractiveness of Western vs. non-Western destinations. The slower recovery in the US and Europe, contrasted with the rapid ascent of the Middle East, is partially a reflection of these macro-political dynamics. The 2025 ASEAN–China–GCC Summit joint statement further signals continued political commitment to tourism cooperation.
This integrated perspective provides a more holistic and rigorous explanation than either a purely policy-centric or demand-driven account could offer. It suggests that destination choices are not made in a political vacuum; rather, they are embedded in shifting geopolitical landscapes that act as macro-drivers of mobility. Acknowledging this dimension enhances the timeliness and policy relevance of the discussion.
Infrastructure-Led Tourism: Development Projects as Precursors to Leisure Travel. The statistical growth of Chinese tourism in regions such as Africa and the Pacific Islands cannot be fully understood without recognizing the foundational role of China’s prior development projects. As noted, limited direct flight connectivity remains a major constraint for Pacific Island destinations, with only Fiji and Samoa having direct routes from China. This contrasts sharply with regions that have received substantial Chinese infrastructure investment.
In Africa, Chinese-built airports, roads, and hotels—initially serving state-owned enterprises and expatriate workers—have subsequently created the physical and service infrastructure that facilitates leisure tourism. This “business-to-leisure” or “infrastructure-led” pattern suggests that Chinese outbound mobility to the Global South often follows a predictable sequence: first, state-led economic engagement (FDI, construction projects, and resource extraction); second, the establishment of expatriate communities and Chinese-friendly hospitality ecosystems; and third, the emergence of leisure tourism flows. Acknowledging this structural pathway provides a holistic, more contextual explanation for the growth observed in non-traditional destinations than a purely demand-side account.
Extension to Migration Studies: Tourism as a Precursor to Migration. The findings offer an empirical foundation for theorizing tourism as a significant “pre-migration precursor” [11]. The expansion of Chinese tourism into the Global South is likely to be followed by deeper forms of transnational engagement. The documented infrastructure-led pattern in Africa is a clear example: economic investment by Chinese firms fosters the creation of infrastructure and expatriate communities, which in turn facilitate leisure tourism and, eventually, more permanent forms of investment and lifestyle migration.
A three-stage model linking tourism and migration is proposed: (1) Stage 1: Mobility Initiation. Tourism serves as the initial contact, enabling Chinese travelers to assess business opportunities, real estate markets, and quality of life in countries previously peripheral to their global imagination. This is a central function of the “Imagined Regions,” which convert symbolic interest into material exploration. (2) Stage 2: Network Formation. Tourism facilitates the development of cross-border social, professional, and commercial networks. These networks, which include local intermediaries and diaspora communities, lower the transaction costs for subsequent, more permanent forms of mobility. (3) Stage 3: Migration Crystallization. These networks and accumulated knowledge can then catalyze more permanent moves, including retirement migration (to warmer climates), investment migration (through property purchase or business acquisition), educational migration (for children), and skilled or business migration (seeking new economic opportunities).
These specific cases demonstrate this model in its nascent form. Chinese property purchases in Dubai, student mobility to the Middle East, and the growth of Chinese-owned businesses in African nations all point to the evolution of tourism into more embedded migration patterns. The rapid growth of Chinese tourism to the Middle East, for example, has already been accompanied by increased Chinese property purchases in Dubai and business registrations in Saudi Arabia’s special economic zones.
By explicitly linking the analysis to this framework, this study aims to extend the analytical relevance of tourism to core concerns in migration studies, contributing to provide a theoretically grounded and empirically informed agenda for investigating how tourism flows may contribute to the emergence of migration corridors. This agenda remains underexplored in the Chinese outbound tourism literature and offers a promising direction for future longitudinal and mixed-methods research.
5.2. Practical Implications
The changing geography of Chinese outbound tourism has significant policy and industry implications. (1) Tourism Diplomacy and Destination Branding: China should leverage the growing appeal of the Global South as a cornerstone of its “tourism diplomacy.” By deepening cultural and tourism cooperation with BRI and Global South countries, it can foster mutual understanding and soft power. For destinations, this means moving beyond a purely extractive model of tourism to one focused on co-creating culturally distinctive, high-value products. Differentiated branding that speaks to the NCT’s desire for authentic and immersive experiences is crucial. Destinations need culturally distinctive products to meet Chinese tourists’ growing demand for immersive and personalized experiences. (2) Infrastructure and Governance: The “infrastructure-led” pattern observed in Africa and the constraints in the Pacific Islands highlight a critical need. To realize the tourism potential of the Global South, there must be strategic investment in transportation (direct flights), hospitality, and digital infrastructure. Concurrently, governance capacity must be enhanced. For emerging markets like Antarctica, this requires China to actively engage in international governance bodies like IAATO and develop a domestic legal framework to ensure sustainable and responsible tourism. Given the relatively weak risk resistance of Global South destinations, they should reinforce risk management to shorten post-disaster or post-epidemic recovery periods. (3) Data Transparency and Resilience: The data gaps identified in this study, particularly for developing countries, hamper effective policies and planning. The UNWTO and its members should prioritize standardizing statistical definitions and improving data collection and publication, especially in the Global South. Furthermore, given the demonstrated vulnerability of these destinations (e.g., PICs in 2020–2022), resilience planning—diversifying source markets and creating adaptive tourism strategies—is essential for sustainable development.
6. Conclusions
This study has traced the remarkable evolution of Mainland Chinese outbound tourism destinations from 2000 to 2024, revealing a significant shift towards the Global South, conceptualized as a “Dual Expansion” pattern. This concept denotes two analytically distinct but simultaneous processes: absolute growth in flows to both Western and Global South destinations, such that the North is not displaced but continues to expand in absolute terms; and a relative redistribution of shares toward the Global South, with Western destinations declining from approximately 18% to 8.5% and non-Western destinations rising from 82% to over 91%. It thus captures not a zero-sum substitution but a dual-track expansion characterized by concurrent growth and diversification. This evolution is not a simple, policy-driven story but a complex phenomenon shaped by the interplay between growing tourist agency, strategic state steering, and shifting geopolitical landscapes.
Theoretically, the perspective of “Imagined Regions” has been advanced to explain the symbolic attraction of destinations whose statistical weight belies their cultural and social significance. Grounded in Appadurai’s [10] work on imagined worlds and the destination image/imaginary literature, this concept captures how places like Antarctica and the Pacific Islands are actively produced in the Chinese imagination as repositories of the exotic, the extreme, and alternative modernities—a co-construction involving tourism marketing, social media, and the interpretive work of tourists themselves. This concept remains a theoretically informed proposition that requires future empirical testing. The descriptive patterns are empirically documented, and the segmented intervention model provides HAC- and HC3-robust support for parameter changes at the three prespecified nodes in the absolute-volume trajectory. The 2010 result concerns an absolute slope change, the 2020 result a joint level and slope disruption, and the 2023 result an immediate level shift rather than a durable post-reopening trend. The explanatory concepts of “Imagined Regions,” the tripartite interplay of agency–state–geopolitics, and the tourism-to-migration precursor model are theoretically proposed interpretations. They are advanced to guide future research rather than to claim causal demonstration from the present data.
By integrating this with a discussion on migration precursors, it has been shown that the patterns of tourist mobility documented here may be the leading edge of deeper forms of transnational migration. The findings serve as a critical reference for policymakers aiming to leverage tourism for diplomacy and economic development, as well as for industry stakeholders seeking to meet the evolving demands of the world’s most important outbound market. The evolution of Chinese outbound tourist destinations since the Reform and Opening-up policy exhibits a “Dual Expansion to the Global South and North,” reflecting both the global implications of China’s development and the growing agency of Chinese tourists in seeking multifaceted experiences worldwide. More significantly, for migration studies, this paper argues that tourist mobility should be understood as a potential precursor to deeper forms of transnational engagement. Although this study does not contain migration, investment, or individual-level trajectory data and therefore cannot empirically establish a tourism-to-migration sequence, the patterns documented provide a starting point for future research on whether and how tourism flows may crystallize into migration corridors between China and the Global South.
Finally, the geographical redistribution documented here carries significant implications for sustainable destination development, particularly regarding carrying capacity, infrastructure pressure, and crisis resilience in ecologically sensitive and governance-weak destinations. These challenges, however, are neither caused by Chinese outbound tourism alone nor confined to a single-source market; they are structural challenges of global tourism governance requiring coordinated responses across multiple actors and scales.
7. Limitations and Future Research
This study has several limitations. First, the reliance on quantitative arrival data (person-trips) does not measure the qualitative dimensions including tourist experience, media representations, symbolic meanings, tourist motivations, or the heterogeneity within the tourist population. It is difficult to accurately analyze the purpose of outbound tourism using current data. Second, data completeness remains a notable challenge. Reporting lags in some developing countries of the Global South limit the granularity and timeliness of the analysis. For example, the results for some sub-regions in 2023–2024 remain partial, reflecting post-pandemic reporting delays and capacity constraints in national statistical systems. In this regard, no interpolation or imputation was undertaken. We would suggest that for data of this scale and temporal span, particularly where developing countries are concerned, gaps in a small number of years or countries are difficult to avoid entirely, but they do not affect the exploration of long-term and overall regularities. Third, the macro-level analysis cannot account for the micro-level, subjective factors that drive individual destination choice. Due to space limitations, this article only discusses the characteristics of Chinese outbound tourism destination changes from a big data perspective and has not deeply explored the subjective factors behind destination change through qualitative research. Consequently, all explanatory propositions advanced in Section 5.1 should be understood as interpretive frameworks consistent with, but not deductively derived from, the aggregate arrival data. Establishing the mechanisms underlying the observed patterns—symbolic construction, identity work, network formation, and migration crystallization—requires micro-level, qualitative, and longitudinal data that lie beyond the scope of the present study.
Future research could address these limitations in the following ways: (1) Qualitative and ethnographic studies could explore how Chinese tourists perceive and construct the “exoticism” of Global South destinations and how these perceptions translate into willingness to invest, relocate, or build cross-border networks. (2) Micro-level quantitative analysis could use survey data to model the determinants of Global South destination choices at the individual level, incorporating factors like cultural capital, media consumption, and social network influence. (3) Longitudinal migration studies, including panel studies or in-depth case studies (e.g., on specific expatriate communities in Africa or the Middle East), could be conducted to trace the trajectory from a tourist visit to more permanent forms of migration, thereby testing the three-stage model proposed here. (4) Comparative analysis could compare the patterns of Chinese outbound mobility with those of other major outbound markets (e.g., US and Germany) to identify what is unique or generalizable about the Chinese case.
Author Contributions
M.A.: conceptualization, data curation, formal analysis, and writing—original draft; J.W.: formal analysis and writing—review and editing; L.G.: methodology, supervision, and writing—review and editing. All authors have read and agreed to the published version of the manuscript.
Funding
This research received no external funding.
Institutional Review Board Statement
Not applicable.
Informed Consent Statement
Not applicable.
Data Availability Statement
The original data presented in the study are openly available in United Nations Digital Library System and UN Tourism at https://digitallibrary.un.org/ and https://www.untourism.int/tourism-data/un-tourism-tourism-dashboard (accessed on 29 January 2025). Restrictions apply to the availability of these data. Data were obtained from The International Association of Antarctica Tour Operators (IAATO) and are available at https://iaato.org/news-room/data-statistics (accessed on 20 May 2025) with the permission of IAATO.
Conflicts of Interest
The authors declare no conflict of interest.
References
- Arlt, W.G. The second wave of Chinese outbound tourism. Tour. Plan. Dev. 2013, 10, 126–133. [Google Scholar] [CrossRef] [Scilit]
- Jin, X.; Wang, Y. Chinese outbound tourism research: A review. J. Travel Res. 2016, 55, 440–453. [Google Scholar] [CrossRef] [Scilit]
- Keating, B.; Heung, V.; Huang, S.; Kriz, A. A systematic review of the Chinese outbound tourism literature: 1983–2012. J. Travel Tour. Mark. 2015, 32, 2–17. [Google Scholar] [CrossRef] [Scilit]
- Zhu, D.; Xu, H.; Jiang, L. Behind buying: The Chinese gaze on European commodities. Asia Pac. J. Tour. Res. 2016, 21, 293–311. [Google Scholar] [CrossRef] [Scilit]
- Liu, Z.; Zheng, P.; Wang, J.J.; Zhao, Y. Impact mechanism of the Belt and Road Initiative on China’s outbound tourism flow. Resour. Sci. 2022, 44, 2356–2372. [Google Scholar] [CrossRef] [Scilit]
- Bao, J.; Jin, X.; Weaver, D. Profiling the elite middle-age Chinese outbound travellers: A 3rd wave? In Current Issues in Asian Tourism: Volume II; Routledge: Abingdon, UK, 2018; pp. 125–138. [Google Scholar] [CrossRef] [Scilit]
- Li, M.Z.; Stodolska, M. Beyond luxury consumption: The meaning and meaning-making mechanism in conspicuous outbound tourism. J. Leis. Res. 2022, 53, 687–704. [Google Scholar] [CrossRef] [Scilit]
- Dai, B.; Jiang, Y.; Yang, L.; Ma, Y. China’s outbound tourism: Stages, policies and choices. Tour. Manag. 2017, 58, 253–258. [Google Scholar] [CrossRef] [Scilit]
- Tse, T.S.M. Chinese outbound tourism as a form of diplomacy. Tour. Plan. Dev. 2013, 10, 149–158. [Google Scholar] [CrossRef] [Scilit]
- Appadurai, A. Modernity at Large: Cultural Dimensions of Globalization; University of Minnesota Press: Minneapolis, MN, USA, 1996. [Google Scholar]
- King, R. Towards a new map of European migration. Int. J. Popul. Geogr. 2002, 8, 89–106. [Google Scholar] [CrossRef] [Scilit]
- Lim, C.; Wang, Y. China’s post-1978 experience in outbound tourism. Math. Comput. Simul. 2008, 78, 450–458. [Google Scholar] [CrossRef] [Scilit] [PubMed]
- Zhang, B.H.; Lai, B. An overview of the internationalization process of Chinese outbound tourism. Int. J. Tour. Hosp. Manag. 2009, 25, 16–20. [Google Scholar] [CrossRef]
- Arita, S.; Edmonds, C.; Croix, S.L.; Mak, J. Impact of Approved Destination Status on Chinese travel abroad: An econometric analysis. Tour. Econ. 2011, 17, 983–996. [Google Scholar] [CrossRef] [Scilit]
- People’s Daily. BRI Participating Countries Gain Popularity Among Chinese Tourists. Available online: https://en.people.cn/n3/2023/1102/c90000-20092289.html (accessed on 28 July 2026).
- Yicai Global. BRI Member Countries Grow in Popularity Among Chinese Tourists. Available online: https://www.yicaiglobal.com/news/trips-to-countries-along-bri-grow-in-popularity-among-chinese-tourists (accessed on 27 July 2026).
- China Daily. Cruise Firm Rides China’s Shift to Experiential Travel. Available online: https://www.chinadaily.com.cn/a/202605/11/WS6a013719a310d6866eb47deb.html (accessed on 29 July 2026).
- Salazar, N.B. Tourism imaginaries: A conceptual approach. Ann. Tour. Res. 2012, 39, 863–882. [Google Scholar] [CrossRef] [Scilit]
- Echtner, C.M.; Ritchie, J.R.B. The meaning and measurement of destination image. J. Tour. Stud. 1991, 2, 2–12. Available online: https://www.academia.edu/1799708/The_meaning_and_measurement_of_destination_image (accessed on 5 May 2026).
- Gallarza, M.G.; Saura, I.G.; García, H.C. Destination image: Towards a conceptual framework. Ann. Tour. Res. 2002, 29, 56–78. [Google Scholar] [CrossRef] [Scilit]
- Sheller, M.; Urry, J. The new mobilities paradigm. Environ. Plan. A 2006, 38, 207–226. [Google Scholar] [CrossRef] [Scilit]
- Hall, C.M.; Müller, D.K. (Eds.) Tourism, Mobility, and Second Homes: Between Elite Landscape and Common Ground; Channel View Publications: Bristol, UK, 2004; Volume 15. [Google Scholar]
- Ong, A. Neoliberalism as Exception: Mutations in Citizenship and Sovereignty; Duke University Press: Durham, NC, USA, 2006. [Google Scholar] [CrossRef] [Scilit]
- Ley, D. Millionaire Migrants: Trans-Pacific Life Lines, 1st ed.; Wiley-Blackwell: Hoboken, NJ, USA, 2010. [Google Scholar] [CrossRef] [Scilit]
- Engbersen, G.; Snel, E. Liquid migration: Dynamic and fluid patterns of post-accession migration flows. In Mobility in Transition: Migration Patterns After EU Enlargement, 1st ed.; Glorius, B., Grabowska-Lusinska, I., Kuvik, A., Eds.; Amsterdam University Press: Amsterdam, The Netherlands, 2013. [Google Scholar]
- Yang, F. Polar Tourism Comes in from the Cold. China Daily Hong Kong. Available online: https://www.chinadailyhk.com/hk/article/620298 (accessed on 26 July 2026).
- United Nations, Department of Economic and Social Affairs. International Recommendations for Tourism Statistics 2008 (Series M No. 83/Rev.1). 2010. Available online: https://unstats.un.org/unsd/publication/seriesm/seriesm_83rev1e.pdf (accessed on 26 July 2026).
- Zhang, H.; Liu, Y.; Liu, X.; Liu, A.; Lin, V.S. Forecasting Chinese outbound tourism recovery: A Triple-layer forecast combination framework. Ann. Tour. Res. 2026, 116, 104079. [Google Scholar] [CrossRef] [Scilit]
- Economist Intelligence Unit. In Charts: China’s Outbound Tourism in 2024. Available online: https://www.eiu.com/n/in-charts-chinas-outbound-tourism-in-2024/ (accessed on 26 July 2026).
- Jing Daily. Chinese Tourists Drive Record Antarctica Visits in 2023-24. Available online: https://jingdaily.com/intels/2024-10/25/chinese-tourists-drive-record-antarctica-visits-in-2023-24 (accessed on 26 July 2026).
- IAATO. IAATO Overview of Antarctic Vessel Tourism: The 2023-24 Season, and Preliminary Estimates for 2024-25 (IP 102 Rev.1). Antarctic Treaty Consultative Meeting 46. Available online: https://iaato.org/system/files/2025-01/ATCM46_ip102_rev1_e_IAATO-Overview-of-Antarctic-Vessel-Tourism-The-2023-24-Season-and-Preliminary-Estimates-for-2024-25.pdf (accessed on 27 July 2026).
- Guan, S.; Liu, D. Study on the industrial governance of Antarctic tourism with the view of global governance. Polar Res. 2022, 34, 81–89. [Google Scholar] [CrossRef]
- He, Y.; Liu, C. Environmental Impacts and Sustainable Development of Antarctic Tourism: The Chinese Tourists’ Perspectives. In Towards Sustainable and Resilient Tourism Futures; Köchling, A., Seeler, S., van der Merwe, P., Postma, A., Eds.; Erich Schmidt Verlag GmbH & Co. KG: Berlin, Germany, 2023; Volume 1. [Google Scholar] [CrossRef] [Scilit]
- China Daily. Chinese Visitors Answer Africa’s Call of the Wild. Available online: https://www.chinadaily.com.cn/a/202409/09/WS66de376aa3103711928a6c0f.html (accessed on 29 July 2026).
- ECNS. Middle East Attracts Growing Number of Outbound Chinese Tourists. Available online: https://www.ecns.cn/news/cns-wire/2025-05-29/detail-iherwsih6787842.shtml (accessed on 15 June 2025).
- Xinhua. Full Text: Joint Statement of the ASEAN-China-GCC Summit. State Council of the People’s Republic of China. Available online: https://english.www.gov.cn/news/202505/28/content_WS6836d4f8c6d0868f4e8f2ef8.html (accessed on 15 June 2025).

Disclaimer/Publisher’s Note: The statements, opinions and data contained in all publications are solely those of the individual author(s) and contributor(s) and not of MDPI and/or the editor(s). MDPI and/or the editor(s) disclaim responsibility for any injury to people or property resulting from any ideas, methods, instructions or products referred to in the content. |
© 2026 by the authors. Licensee MDPI, Basel, Switzerland. This article is an open access article distributed under the terms and conditions of the Creative Commons Attribution (CC BY) license.