


Abstract
This study examines how green credit policies, specifically the green credit guidelines (GCGs) implemented in 2012, influence corporate sustainable innovation. This study employs a quasi-natural experiment approach, utilizing data from Chinese listed companies between 2005 and 2023, to examine the differential impact of the GCGs on high-polluting enterprises versus energy-efficient enterprises. The study uses a Difference-in-Differences (DID) methodology to explore how policy-induced changes in financing conditions affect firms’ innovation behaviors, particularly in terms of green patent applications. This study uses a mechanism to understand the role of R&D investment and access to long-term financing in driving these changes. And this study considers heterogeneity across firm ownership types and industry competition to investigate the varying effects of the GCGs. By identifying the causal pathways through which green credit policies influence innovation, this study contributes to the understanding of how environmental policies shape corporate behavior and innovation outcomes.
1. Introduction
As global environmental issues become increasingly severe, green finance, as an important tool for promoting sustainable development, has gradually attracted widespread attention from policymakers around the world. The green credit guidelines (GCGs), implemented since 2012 in China, have become an important policy measure to promote corporate sustainable innovation and environmental protection. Green credit optimizes the allocation of credit resources, encourages banks to provide funds to environmentally responsible companies, and limits the financing scale of highly polluting companies, thereby guiding firms toward low-carbon, green technologies [1,2,3]. However, despite numerous studies on the impact of green credit policies on financing and investment decisions, there remains a significant research gap regarding how these policies influence corporate sustainable innovation, especially in terms of differentiated effects across different types of companies. Some studies suggest that green credit policies promote short-term financing for highly polluting firms, but due to constraints on long-term project investments, the innovation capacity of these firms may be limited [4]. In contrast, under green credit policies, environmentally friendly enterprises typically gain stronger innovation capabilities [5]. However, there is a lack of systematic empirical research in the existing literature on how green credit policies affect the sustainable innovation behaviors of highly polluting and energy-efficient firms within the Chinese context.
Following Boons and Lüdeke-Freund [6] and Ketata et al. [7], we define sustainable innovation as the implementation of new products, processes, or practices that generate environmental and social value while creating economic returns. Sustainable innovation adopts a broader perspective that encompasses environmental stewardship, social responsibility, and economic viability [8,9]. In the context of the GCGs, banks evaluate firms not just on emissions but on comprehensive Environmental and Social (E&S) risks [10]. Therefore, the innovation outcomes observed under this policy represent strategic responses aimed at achieving long-term sustainability across environmental, social, and economic dimensions.
This paper aims to fill this research gap by exploring the impact of the GCGs on corporate sustainable innovation. By analyzing data from Chinese listed companies between 2005 and 2023, this study employs the Difference-in-Differences (DID) approach to assess the differences in green patent applications and sustainable innovation performance between high-pollution firms and energy-efficient firms before and after the implementation of the GCGs. The empirical results show that, following the implementation of the GCGs, high-pollution firms experienced a 12.46% reduction in green patent applications and a 20.60% decline in sustainable innovations, while energy-efficient firms benefited from the policy, with green patent applications increasing by 45.17% and sustainable innovations rising by 31.40%. Further robustness checks confirm these findings, and the use of placebo regressions and Propensity Score Matching (PSM) enhances the accuracy of sample selection.
Additionally, this paper uses mechanistic analysis to explain how the GCGs hinder sustainable innovation by highly polluting companies through two closely related channels. First, the GCGs resulted in a notable decrease in long-term financing available to highly polluting firms, particularly regarding long-term debt. This indicates that banks have adopted a strategy of shortening loan terms to mitigate long-term credit risks in highly polluting enterprises. Although short-term loans remained relatively stable, the decrease in long-term loans directly affected the funding of these firms, especially for sustainable innovation projects that rely on long-term capital. Long-term loans are generally used to finance innovation projects with extended R&D phases and longer repayment periods. The reduction in bank loans hindered these firms’ ability to secure the financing needed to sustain the green technology development.
Moreover, with the reduction in long-term bank loans, the intensity of R&D investment by highly polluting enterprises has significantly declined. The financial pressure led firms to cut back on their R&D expenditures, especially in green technology development. This phenomenon suggests that financial constraints weakened the firms’ investment in innovation. Due to insufficient long-term capital, enterprises are compelled to allocate their limited resources toward short-term activities or debt repayment, resulting in reduced investment in green technology innovation programs that yield greater long-term benefits. This mechanism demonstrates how the GCGs constrains the innovative capabilities of firms with high pollution levels via two main pathways: reducing research and development expenditures and limiting access to financing for the long term.
These studies deepen our understanding of the immediate impact of green credit policies on corporate innovation and open new pathways for exploring how such policies affect firms across different industries. Based on the above findings, the following sections will focus on outlining the core contributions of this paper, including insights into the policy mechanisms and implications for future policy design.
First, this study explores the impact of the green credit policy on corporate innovation, focusing on the advancements made in the realm of sustainable innovation. Previous research has primarily examined how the green credit policy affects corporate investment strategies and debt management practices, but its influence on corporate R&D activities remains underexplored. The prevailing view states that the policy constrains the R&D efforts of firms in high-polluting industries [3,4,11]. However, by comparing the innovation responses of high-polluting enterprises and energy-efficient enterprises, this paper reveals significant differences in their reactions to the policy. In particular, high-polluting firms experienced a decline of 12.46% in green patent applications, while energy-efficient firms saw an increase of 45.17% in patent submissions. This striking contrast provides new empirical evidence that deepens the current understanding of how green credit policy operates. By revealing how different types of enterprises respond to green credit policy, particularly in the innovation sector, it fills a key gap in the literature.
Furthermore, this study delves into how green credit policies influence the R&D strategies and long-term financing choices of highly polluting enterprises, thereby affecting their R&D investments. The findings show that the green credit policy facilitates long-term funding for these firms, while short-term loans have little effect on their innovation capacity. This implies that short-term debt requires companies to prioritize debt repayment, offering limited support for long-term R&D initiatives. In contrast, long-term loans provide stable funding that can sustain substantial investments in R&D and foster sustainable innovation. These results contrast with existing studies, which have often generalized the relationship between loan maturity and innovation. Previous research has discussed the impact of debt structure on innovation but rarely focused on the weak connection between short-term debt and sustainable innovation [4,5]. By highlighting the limited impact of short-term debt and the critical role of long-term financing in promoting sustainable innovation, this paper fills a gap in the literature. It also offers practical insights for refining future green credit policies, particularly regarding how to stimulate innovation by adjusting loan terms.
Finally, the principal findings of this research indicate that while the green credit policy has significantly hindered innovation in high-polluting firms, it has promoted innovation in energy-efficient firms. The study also reveals an inequality effect, where state-owned enterprises (SOEs) are less affected by the policy compared to private firms, especially those operating in competitive markets. This research contributes by systematically analyzing the innovation gaps between high-polluting and energy-efficient firms and highlighting the differences in the policy’s effects on various firm types. This analysis enhances the empirical understanding of how the green credit policy impacts corporate innovation and emphasizes the need for policy design to account for firm type and market competition to promote sustainable innovation effectively. Furthermore, the study validates the concept of credit market segmentation in the market segmentation theory [12], demonstrating that SOEs, with their greater access to financing and policy support, are less impacted by the GCGs, while private firms and SMEs in competitive markets face greater innovation challenges due to limited access to funding. These findings underscore the importance of equitable resource allocation in future policy design to prevent exacerbating industrial structural imbalances.
The subsequent discussion will be structured as follows: In Section 2, an outline of the relevant background regarding GCGs is provided, and the formulation of research hypotheses is predicated on the findings of preceding studies. In Section 3, a thorough discussion of the empirical modeling approach applied in this research is provided. Section 4 details the research outcomes and incorporates robustness checks, whereas Section 5 offers an extensive analysis of the influence of the GCGs on companies, focusing on financing limitations and the processes associated with R&D decision-making. Section 6 expands the discourse by investigating how the impacts of the GCGs differ among various ownership types and levels of market competition. Finally, the study summarizes the key findings and considers the implications for policy.
2. Policy Background and Theoretical Assumptions
2.1. Policy Background
Since China’s economic reform and opening up, the country has experienced rapid economic development, but this has been accompanied by increasingly severe environmental pollution and resource depletion. Finding a balance between economic growth and environmental protection has become a major challenge in China’s modernization process. As an important tool for promoting environmental governance and sustainable development, green credit has gradually gained the attention of the government and has become an integral part of the policy framework.
In 1995, the People’s Bank of China issued the “Notice on Implementing Environmental Credit Policies and Strengthening Environmental Responsibility”, proposing that financial institutions should consider environmental risks and begin guiding banks to participate in green credit. However, due to the policy’s reliance on voluntary participation by banks and the lack of a systematic incentive mechanism, its effectiveness was limited.
Until 2012, with the release of the GCGs, green credit policies reached a major turning point, marking the entry of China’s green credit policies into a more systematic and standardized phase. The issuance of the GCGs provides financial institutions with a clear operational framework, requiring banks to incorporate environmental risk assessments into their lending decisions. It also explicitly states that priority should be given to financing green, low-carbon, and energy-efficient projects, while restricting loans to highly polluting enterprises.
From a practical perspective, since 2012, China’s green credit has made significant progress. By the second quarter of 2025, the total amount of green loans had reached 42.39 trillion yuan, a 21.95% increase compared to the previous year. In 2024, China’s carbon market completed the trading of 189 million tons of carbon emission quotas, valued at 18.114 billion yuan. These achievements are based on the green credit policy framework established by the GCGs.
From a policy standpoint, the implementation of the GCGs is not only a further improvement of the green credit system but also a significant shift in the Chinese government’s policy tools for environmental governance and green sustainable development. It occupies a unique and important position in the development of China’s green finance. The release of the GCGs marks the transition of China’s green finance from early exploration to a more mature policy phase, promoting corporate sustainable innovation and financing for environmental projects. It aims to drive sustainable innovation in enterprises, finance environmental projects, and foster the innovative development of green financial products and services.
In this background, this paper aims to delve into how the GCGs promote corporate sustainable innovation by restricting financing support for high-polluting enterprises, filling the gap in the existing literature regarding the impact of green credit policies on corporate innovation. Through empirical analysis of data from listed companies, this study will reveal the differences in innovation responses among different types of firms under the green credit policy, particularly highlighting performance disparities in sustainable innovation between highly polluting enterprises and energy-saving and environmentally friendly.
2.2. Theoretical Assumption
2.2.1. The Role of Green Credit in Corporate Innovation
Presently, there are two primary perspectives on the correlation between corporate innovation and government environmental policies. One view suggests that excessively stringent environmental policies can diminish corporate efficiency, which in turn impacts their innovation strategies [13]. Aghion et al. [14] discovered through their research on the link between regulatory policies and corporate innovation in France that government regulations notably hindered the innovation efficiency of firms.
On the other hand, some argue that appropriate environmental regulations can promote corporate innovation. Porter & Van [15] introduced the Porter Hypothesis, which has two versions. The strong version suggests that strict environmental regulations drive major technological innovation by encouraging firms to develop more efficient technologies, thus enhancing their competitiveness and operational efficiency. This version posits that regulations create opportunities for firms to gain a competitive advantage through sustainable innovation [16,17,18]. Xie et al. [19] using data from China, demonstrated that stringent environmental regulations not only do not hinder innovation but actually enhance firms’ competitive advantage. This provides strong support for the robust version of the Porter hypothesis. In contrast, the weak version argues that while environmental regulations may impose compliance costs, they still promote incremental innovation. This occurs primarily by compelling businesses to adapt existing technologies and refine processes to meet regulatory standards, rather than driving disruptive breakthroughs [20]. Rousselière et al. [21] combined both the strong and weak versions of the Porter Hypothesis, suggesting that appropriate environmental policies can actively drive innovation and profitability, with this effect being more pronounced in small and medium-sized enterprises.
Building on these theoretical foundations, particularly the Porter Hypothesis framework, we adopt the concept of sustainable innovation to systematically analyze the impacts of environmental credit policies. Sustainable innovation represents a paradigm shift from traditional innovation approaches, encompassing environmental stewardship, social responsibility, and economic viability simultaneously [8]. The GCGs aim to reshape corporate behavior across multiple dimensions beyond purely environmental outcomes. The policy does not merely restrict financing for polluters; it fundamentally redirects capital flows to incentivize comprehensive sustainability transformations [9]. Consequently, the heterogeneous effects of the GCGs on different firm types can be better understood through the lens of sustainable innovation rather than narrow environmental compliance metrics.
As one of the government’s policies to strengthen environmental regulation, the GCGs participate in corporate environmental governance by establishing an environmental risk assessment system and restricting bank financing to high-polluting firms [22]. Overall, this policy has improved China’s green financial infrastructure and promoted regional sustainable innovation [23,24]. Previous studies have shown that government regulation is crucial in promoting green technological innovation and the development of environmentally sustainable enterprises [25]. By establishing a comprehensive legal and policy framework, particularly through green credit policies offering low-cost financing opportunities, governments can effectively promote the rapid development of sustainable technologies and industries [26,27].
Furthermore, numerous studies have demonstrated significant variation in how the green credit policy impacts firms [5,28]. For example, highly polluting firms, which are subject to more stringent government regulation, tend to show a decline in firm performance and innovation capacity during the early stages of the policy [11]. Significant effects only become apparent in the later stages of policy implementation [29]. In contrast, firms that focus on energy efficiency and can attract more green credit investments see a considerable increase in innovation output over the short run [30]. Moreover, this heterogeneity effect is also evident among firms with different ownership structures. Yu et al. [31] found that private enterprises experience more significant negative impacts than their state-owned counterparts. Building upon this, we formulate the following hypothesis:
H1:
Green credit limits sustainable innovation in high-polluting firms while promoting it in energy-efficient ones.
2.2.2. The Impact of Green Credit on Corporate Financial Decisions
A key component of the GCGs is the redistribution of financial resources through banking institutions. This mechanism restricts lending to highly polluting enterprises, aiming to optimize resource allocation and promote environmental and social responsibility among financial institutions [32]. Research has shown that this policy significantly influences banks’ investment decisions, channeling more capital into energy-efficient, low-carbon, and sustainable innovation enterprises, thus promoting the development of green industries [5,33]. This financial strategy not only strengthens bank support for environmental projects but also accelerates the green transformation of businesses.
Scholars hold differing opinions on how green credit affects highly polluting enterprises. Some studies indicate that green credit has exacerbated the financial difficulties faced by these enterprises, forcing them to accelerate the implementation of green technologies to meet stricter environmental regulations [34].This mechanism enables firms to initiate sustainable innovation transformations in the short term, laying the foundation for their long-term sustainability through green financial initiatives and other means [35,36].
Other studies indicate that while green credit policies may promote short-term sustainable innovation, they may suppress investment and technological development in other critical sectors over the long term [4]. For example, companies may overemphasize sustainable innovation while neglecting advancements in other long-term technologies. This could undermine their overall innovation capabilities and market competitiveness [37]. Therefore, green credit policies must strike a balance between promoting short-term innovation and supporting long-term technological development to mitigate potential negative effects [38].
In the face of these challenges, understanding broader dynamic mechanisms is crucial. Recent studies emphasize how the allocation of credit influences innovation, with network structure serving as an important factor in explaining this mechanism. Liu et al. [39] used social network analysis to reveal how changes in global agricultural trade networks affect investment decisions. They elucidated how the allocation of green credit within financial networks impacts innovation outcomes. Additionally, Choi et al. [40] applied dynamic Bayesian network models to explore the long-term effects of changes in investment networks on corporate strategies and innovation. These studies highlight the critical role of network dynamics in resource allocation, helping us understand how green credit policies impact innovation through the credit allocation mechanism, especially in high-polluting firms.
Based on the above literature on the impact of credit allocation on innovation, we propose the following hypothesis:
H2:
Green credit reduces sustainable innovation in high-polluting firms by changing how credit is allocated.
2.2.3. Green Credit and R&D Decision-Making
Green credit not only provides financial support for environmental initiatives but also has a significant impact on corporate R&D decision-making processes. Existing research shows that green credit is not merely a tool for funding; it plays an important guiding role in corporate R&D direction, investment decisions, and technological innovation [41,42,43]. Moreover, under the pressure of financing constraints and government regulation, highly polluting enterprises are often forced to undertake R&D transformations. They mitigate the negative impacts through sustainable innovation [44].
However, the uncertainty surrounding the sustainable innovation R&D cycle may lead high-polluting firms to face short-term financing challenges, which in turn affects their long-term R&D decisions [45,46]. Specifically, high-polluting firms engaged in sustainable innovation often face higher R&D risks and longer development cycles. While green credit can provide short-term funding, firms may choose to allocate limited resources to projects that show quicker results due to the longer and more uncertain sustainable innovation R&D cycles. This may lead them to neglect R&D activities that are crucial for long-term technological accumulation and structural transformation [4].
Furthermore, the green credit policy could lead firms to place greater emphasis on meeting environmental standards in their R&D decisions, rather than pursuing technological breakthroughs or seeking long-term competitiveness. Especially in highly polluting industries, as the funding provided by green credit is often limited to technologies and projects that meet environmental standards, firms may concentrate their R&D resources on the sustainable transformation of existing technologies rather than on fundamental innovations. This concept of “sustainable innovation” is more of an adaptive adjustment to existing technologies rather than a radical technological revolution, thereby restricting the depth and breadth of innovation [47].
This limitation is particularly evident in the R&D strategies of high-polluting firms, where the green credit policy, by reallocating R&D resources, may restrict these firms’ innovation potential [48]. Martiny [49] argues that while sustainable innovation may advance significantly in the short term, this limitation may affect firms’ investments in other key technological areas in the long run. Therefore, green credit policies not only impact firms’ short-term innovation but also limit the innovation potential of high-polluting firms in broader technological fields by guiding their R&D strategies [50]. This analysis leads to our third hypothesis:
H3:
Green credit, by influencing corporate R&D strategies, limits the innovation potential of high-polluting firms.
2.2.4. Overview of Hypotheses on Green Credit’s Impact on Corporate Behavior
This study presents and evaluates three hypotheses: initially, that the green credit policy hinders the innovation potential of firms with high pollution levels by limiting their access to financial resources; and secondly, this policy promotes financial support for companies focused on environmental sustainability, which in turn fosters advancements in green technology through adjustments in the framework of bank lending; thirdly, green credit influences corporate R&D decisions, especially the R&D priorities of highly polluting firms, thus constraining the range and intensity of their sustainable innovation.
Figure 1 illustrates how the policy on green credit affects corporate actions, encompassing sustainable innovation, financing decisions, and research and development strategies. It highlights how green credit affects R&D expenditures and innovation in high-polluting firms by limiting their access to long-term funding. This figure provides a visual overview of how green credit influences corporate innovation and decision-making through adjustments in bank lending practices.
Figure 1.
Mechanism Analysis Framework.
In the following section, we will conduct an empirical examination of the three hypotheses and analyse the distinct impacts of the GCGs on sustainable innovation, financing decisions, and R&D strategies within firms that are high polluters. By analyzing data and evaluating models, we will investigate the functionality of green credit in different types of firms and industry contexts, providing empirical evidence that can aid in policy formulation.
To help readers better understand the overall structure of this paper, we have provided a logic diagram outlining in Figure 2 to show the key steps and connections between the theoretical analysis, empirical testing, and conclusions.
Figure 2.
Logic Diagram Outlining.
3. Research Framework
3.1. Empirical Model and Variable Description
3.1.1. Empirical Model
To assess how the GCGs affect both highly polluting firms and those focusing on energy efficiency and environmental sustainability, we develop the subsequent Difference-in-Differences model:
Here, represents the innovation output of firm i in industry k and year t. The dummy variable identifies whether a firm i is a highly polluting firm, and indicates whether a firm i belongs to the energy-efficient and environmentally responsible companies. The vector encompasses an array of time-varying firm-specific control variables, as listed in Section 3.1.4. We include firm fixed effects (), industry fixed effects (), and year fixed effects (). The term is the idiosyncratic error. Standard errors are grouped at the firm level to address possible serial correlation and variations in firm-specific heteroskedasticity.
The coefficients of primary interest are and , which uncovers the causal repercussions of the policy on highly polluting corporations and firms in the energy-efficient and environmentally responsible firms, respectively.
3.1.2. Dependent Variable
Following the framework of sustainable innovation [8,9,51], we use green patents as tangible indicators of firms’ efforts to develop innovations that address environmental challenges while maintaining economic viability. These patents reflect the technological dimension of sustainable innovation, capturing firms’ responses to policy-induced pressures for environmental improvements.
To measure sustainable innovation performance, we use two distinct indicators: the total number of green patent applications (green) and the count of specific green invention applications (green_inv). These indicators are commonly used in green credit research, reflecting firms’ sustainable innovation efforts [52,53]. Unlike granted patents, which are subject to more administrative processes, application counts provide a more accurate representation of firms’ innovation efforts.
We acknowledge that relying solely on patent data as a proxy for innovation may limit the scope of the analysis. While patents offer a reliable measure of innovation, they may not fully capture other forms of innovation, such as technological advancements that are not patented or are yet to be granted. For this reason, we chose patent applications as a proxy, given their objective nature and accessibility. However, we recognize that patent data alone does not account for all innovative activities, and therefore, future research could expand the analysis by including other innovation indicators such as R&D investment, technology transfer, or market applications, which can further validate the conclusions and enrich the analysis.
Due to the irregular distribution of patent submissions, we compute the natural logarithm of the result derived from dividing 1 by the total number of green patent applications that have been filed. The CNRDS classifies green patents based on patent categories and the WIPO green inventory, utilizing data from all patents submitted by publicly traded companies. Similarly, in the context of green invention innovation, its worth is determined by taking the natural logarithm of the quotient of 1 and the overall count of filed green invention patent applications.
3.1.3. Independent Variables
We define two distinct treatment groups to ensure that any negative treatment effect observed for highly polluting firms is not confounded by positive policy impacts on energy-efficient and environmentally responsible firms in the control group.
Highly polluting firms are identified by matching their industries with the environmental high-risk sectors designated by the Ministry of Environmental Protection in 2008. Energy-efficient and environmentally responsible firms are identified based on the corresponding sector listed on the East Money website.
We establish two separate treatment groups to ensure that any negative effects observed for highly polluting firms are not influenced by the positive policy impacts on energy-efficient and environmentally focused firms in the control group.
Highly polluting firms are classified by matching their industries with the list of high-risk environmental sectors provided by the Ministry of Environmental Responsibility in 2008. Firms in the energy-efficient and environmental sector are classified according to the relevant sector listed on the East Money website.
For the post variable, we define it as the year following the introduction of the GCGs, starting in 2012, which marks the policy’s implementation (period 0). Thus, this variable takes the value of 1 for data from 2012 onward and 0 for earlier years.
3.1.4. Control Variables
Based on earlier studies [53,54], we utilize the following control variables to ensure the accuracy and robustness of the model. Each control variable is selected based on theoretical background and empirical research support, aiming to control for other factors that may influence corporate innovation, thereby reducing confounding biases and ensuring that we can independently estimate the effect of the green credit policy.
Corporate age (Inage): Measured by taking the natural logarithm of the difference between the current year and the year the company was founded, plus one. This variable reflects the development stage of the firm, as more mature firms typically have more resources and experience to cope with policy changes, which may result in different innovation capacities compared to newer firms.
Corporate size (size): Indicated by the natural logarithm of the firm’s total assets. Literature suggests that firm size is closely related to innovation capacity. Larger firms usually have more financial, technical, and human resources, which may lead to more active participation in sustainable innovation.
Financial leverage (lev): Measured by the ratio of total liabilities to total assets. Financial leverage reflects the capital structure and financial risk of the company. Higher leverage levels can restrict a firm’s ability to invest in innovation, especially in sustainable innovation, which requires long-term financial support.
Operational cash flow (cf): Defined as net operating cash flow relative to total assets. Cash flow directly impacts a company’s liquidity and investment capacity, providing essential information about the availability of funds when responding to green credit policies.
Profitability (roa): Calculated as net income divided by total assets. Profitability is a crucial indicator of a firm’s innovation potential because more profitable companies can allocate more resources to sustainable innovation, and their strong financial condition may make them more likely to access green financing.
Shareholding concentration (Top1): Represented by the percentage of shares held by the principal shareholder in relation to total shares. Shareholding concentration can influence decision-making efficiency and strategic direction within the firm.
Growth capacity (growth): Measured by the percentage change in operational revenue. Growth capacity reflects a firm’s need for innovation investment. Firms with higher growth rates are more likely to invest in innovation to maintain their competitive edge.
Fixed asset ratio (fixed): Defined as the ratio of fixed assets to total assets. The fixed asset ratio reflects a firm’s capital structure. A higher ratio suggests a greater need for funds, which is important for sustainable innovation that requires significant investment.
Liquidity ratio (liq): Reflects the ratio of liquid assets to total assets. Firms with higher liquidity are more flexible in responding to policy changes, especially in the context of green credit policies, and may be more capable of investing in sustainable innovation.
CEO dual role (Dual): A binary variable that takes the value of 1 if the board chairperson also serves as the general manager, and 0 otherwise. The dual role of the CEO can influence decision-making efficiency and innovation strategy, particularly when adjusting to policy changes.
By controlling for these variables, we are able to more accurately capture the effect of the green credit policy on corporate sustainable innovation while avoiding potential biases from omitted variables. This ensures that our analysis results are more externally valid.
Table 1 provides the definitions and detailed measurement approaches for the variables listed above.
Table 1.
Variable Definition.
3.2. Identification Strategy
3.2.1. Data Sources
This research investigates how the GCGs influence the advancement of sustainable innovation within industries that are significant contributors to pollution, as well as their influence on energy efficiency and environmental awareness within businesses. Utilizing firm-level panel data encompassing all publicly traded companies from 2005 to 2023, the research draws information from the CNRDS database and supplements it with additional green-related data obtained from the CSMAR database.
To improve the robustness of our results, we first excluded companies classified as ST, ST*, or PT within the studied timeframe, as well as those operating in the financial and real estate industries. Firms with data available solely before 2011 or exclusively after 2012 were also removed from the analysis. Lastly, we performed winsorization on all continuous variables at the level of enterprises, applying it to the 1st and 99th percentiles. The resulting dataset includes 30,342 observations from 1922 unique firms across different firm-years, creating an unbalanced panel.
Figure 3 presents two separate graphs: the left side shows fluctuations in green patent applications for the sample firms around 2012, while the right side depicts the pattern of green invention applications during the same period. It shows a marked decline in patent applications from highly polluting enterprises post-2012 compared to general enterprises. Meanwhile, energy-efficient and environmentally friendly enterprises not only maintained a higher volume of patent applications than general enterprises but also exhibited a widening gap after 2012. These observed patterns provide clear direction for our subsequent empirical analysis.
Figure 3.
Different enterprises’ number of green patents and green invention patents.
3.2.2. Statistical Description
The descriptive statistics for the sample, comprising a total of 30,342 observations across firm-years, are presented in Table 2. In the following analysis, green patent applications (lngreen and lngreen_inv) serve as our measures of sustainable innovation output, as established in Section 3.1.2. The average number of green patent applications (lngreen) is recorded at 0.864. The standard deviation is calculated to be 1.246, with a minimum value of 0 and a maximum value of 7.447. This suggests that most companies exhibit minimal involvement in sustainable innovation, with only a few highlighting significant innovation results. In a similar vein, the average for green invention patent applications (lngreen_inv) is 0.598, accompanied by a standard deviation of 1.049 and a peak of 7.197, which reveals a comparable distribution trend in green invention innovation, suggesting that most firms tend to have quite restricted sustainable innovation activities.
Table 2.
Descriptive statistics.
Moreover, Table 2 shows that approximately 36% of the firms belong to high-pollution industries (pol), while only 8.8% of the firms belong to the energy-efficient and environmentally friendly industry (es). This suggests that most of the firms in the sample are from high-pollution industries. The mean value of the post-policy implementation period variable (post) is 0.713, suggesting that most of the sample firms are in the post-policy period, providing a sufficient sample basis for studying the policy effects.
Table 3 shows a negative correlation between highly polluting firms (pol) and sustainable innovation variables (lngreen at −0.091, lngreen_inv at −0.097) indicates that firms in polluting industries exhibit weaker performance in sustainable innovation. Conversely, the positive correlation between energy-efficient and environmentally responsible firms (es) and sustainable innovation variables (lngreen at 0.152, lngreen_inv at 0.116) suggests that environmentally conscious firms demonstrate stronger performance in sustainable innovation. These findings align with real-world observations. The relationship between corporate financing (particularly long-term loans) and sustainable innovation can also be inferred from Table 3, where a positive correlation is observed between the leverage ratio (lev) and sustainable innovation, with values of 0.186 and 0.164 for lngreen and lngreen_inv, respectively. This suggests that highly leveraged companies may have more resources available for investing in sustainable innovation. Nonetheless, this result also illustrates how the GCGs affect polluting firms. When long-term loans decrease, companies will face the risk of high-leverage pollution, thereby reducing R&D investment. Therefore, the observed correlation between leverage ratio and sustainable innovation may indicate the adverse impact of reduced loan availability on innovation capacity.
Table 3.
Correlation analysis.
4. Empirical Results
4.1. Initial Regression Outcomes
Table 4 shows the initial outcomes of the regression analysis. Control variables are excluded in columns (1) and (3), while columns (2) and (4) incorporate firm-level control variables. It is evident that the coefficients for both highly polluting firms and environmentally conscious firms, in relation to sustainable innovation, decrease, although the difference compared to the original coefficients remains small. This helps alleviate concerns regarding potential firm-level confounding factors.
Table 4.
Primary results.
The results reveal a stark contrast in the innovation outcomes of energy-efficient and high-polluting firms under the GCGs. Column (2) shows that for energy-efficient firms, the GCGs led to a 45.17% increase in green patent applications, highlighting a significant positive shift in their sustainable innovation activities. This increase reflects both the direct financial benefits of green credit and the strategic alignment of these firms with sustainability objectives. Conversely, high-polluting firms experienced a 12.46% decrease in green patent applications, suggesting that the financial constraints imposed by the GCGs limited their access to funding, hindering their ability to invest in long-term, high-risk sustainable innovation projects. This decline indicates not only a reduction in innovation activities but also a long-term challenge for these firms in adapting to stricter environmental regulations, potentially diminishing their competitiveness in the green technology market.
Furthermore, in column (4), the GCGs resulted in a 31.4% increase in green invention patents from energy-efficient firms, while causing a 20.6% decrease in invention patents from high-polluting firms. This demonstrates that the policy is more effective in fostering fundamental, sustainable innovations in firms already aligned with green goals. In contrast, high-polluting firms are likely diverting resources from radical technological advancements to meet regulatory standards, focusing on incremental improvements rather than pursuing more disruptive innovations requiring substantial investment. This shift further accentuates the policy’s contrasting effects on innovation in different types of firms.
This analysis shows that while the GCGs successfully promote sustainable innovation in energy-efficient firms, it has a restrictive effect on the sustainable innovation efforts of high-polluting firms. These findings support Theoretical Hypothesis 1, which posits that the GCGs promote innovation in energy-efficient firms while limiting it in high-polluting ones, primarily due to the financial constraints and regulatory pressures imposed on the latter.
4.2. Pre-Treatment Trend Test
Mitigating potential bias in the DID approach requires confirming that, before the GCGs were introduced, a parallelism in innovation trends was observed between companies in green credit-affected industries and their counterparts in other sectors. This assumption is tested using an event study, with the model estimated as follows:
Here, act as a function that indicates a value of 1 when the time period in relation to 2012 is T, and 0 in all other situations. All other variables and fixed effects are defined identically to those in the baseline regression specification, model (1). When conducting the parallel trend test, this paper collapses pre-treatment periods beyond the fourth period into the fourth period pre-treatment, and similarly clusters post-treatment periods beyond the 4th period into the 4th period post-treatment.
The estimates for are plotted in Figure 4. The year before 2012 was implemented as the reference group. In the pre-treatment period, the treatment effect on highly polluting firms is statistically insignificant for both green patent submissions (a) and green invention patent submissions (b), which indicates parallel changes in the outcomes among pre-periods across firms. However, the estimated coefficients become significantly negative in two outcomes after the implementation of the green credit guideline policy, which can support our hypothesis H1.
Figure 4.
Pre-treatment trend test on high-polluting firms. (a) green patents applied; (b) green invention patents applied. Notes: The 95% confidence interval is indicated by the range of the coefficient estimates.
Furthermore, Figure 5 illustrates the parallel trend tests for energy-efficient and environmentally sustainable firms. The trend graph is derived using Beck’s (2010) [55] methodology, with the pre-treatment mean removed. The outcomes reveal that, subsequent to the policy being put into effect, both green patent and green invention patent applications from energy-efficient and environmentally sustainable firms increased in comparison to the treatment group. Furthermore, the estimated coefficients for the periods before the implementation of the GCGs are nearly zero, suggesting parallel trends in green (invention) patents during the pre-treatment period.
Figure 5.
Pre-treatment trend analysis for energy-efficient and environmentally sustainable firms. (a) green patents applied; (b) green invention patents applied. Notes: The 95% confidence interval is indicated by the range of the coefficient estimates.
4.3. Placebo Test for Identification Validation
While our baseline integrates a diverse range of firm-specific features and encompasses multiple fixed effects, unobserved confounding factors correlated with the policy treatment could still potentially affect the estimated impact of the GCGs on firm outcomes. To examine whether omitted variable bias could affect the identification process, we perform a placebo test. The specific process involves randomly assigning treatment statuses to a set of firms. This random assignment is designed to mimic a real-world scenario where firms are randomly selected for a particular treatment. After the random assignment of treatment statuses, we construct a pseudo-policy interaction term. This term is calculated based on the randomly assigned treatment statuses and is intended to serve as a benchmark for comparison with the actual policy interaction term in our main analysis. Under the null hypothesis—that unobserved confounders have no substantial impact—the estimated coefficient of the placebo treatment variable ought to approximate zero in statistical terms.
We implement a structured randomization approach: the treatment groups for highly polluting firms and energy-efficient, environmentally responsible companies are reassigned randomly, ensuring that the total number of treated firms remains constant. The coefficients for the placebo are generated through this process, which is repeated 500 times to create an empirical distribution. In each iteration, the regression model is re-estimated using the same specification (1) as in the baseline analysis.
As shown in Figure 6 and Figure 7, the coefficients from the placebo regressions are concentrated around zero, with their magnitudes being significantly smaller than those in the baseline analysis. This result indicates that the significant effects observed in our main analysis are unlikely to be driven by unaccounted-for firm-level heterogeneity. The placebo test, therefore, bolsters the robustness of our causal interpretation and affirms that the observed policy impacts are likely genuine, supporting the reliability of our conclusions regarding the effects of the GCGs.
Figure 6.
Placebo test on high-polluting firms. (a) green patents applied; (b) green invention patents applied.
Figure 7.
Placebo test on energy-saving and environmental protection firms. (a) green patents applied; (b) green invention patents applied.
To mitigate potential bias arising from the non-random assignment of samples to treatment and control groups, we use Propensity Score Matching (PSM) as a robustness check. This technique helps ensure that the treatment and control groups are comparable on observable characteristics before the treatment. We perform separate analyses for both highly polluting firms (HPF) and energy-efficient, environmentally responsible firms (EEEF), employing both kernel matching and 2-nearest neighbor matching methods. In both matching methods, we use the full set of control variables from the baseline model as covariates to ensure a comprehensive matching process.
For kernel matching, we apply the Epanechnikov kernel function, a well-known tool in non-parametric regression and matching. This function assigns higher weights to control units that are closer to the treated unit, creating a smooth and continuous matching process. For the 2-nearest neighbor matching, we estimate propensity scores using a Logit model, which summarizes the probability of a unit being in the treatment group based on observed covariates. By using this method, we find the two most similar control units for each treated unit, thereby enhancing the matching precision.
In the case of highly polluting firms, we first conduct a preprocessing step using Mahalanobis distance matching across all covariates to reduce multidimensional bias. After this step, we apply kernel or nearest neighbor matching to the adjusted dataset to ensure higher matching precision and a more reliable comparison between the treated and control groups.
Figure 8 and Figure 9 display the balance tests for highly polluting and energy-efficient, environmentally sustainable firms, respectively. The results indicate that upon using kernel matching and 2-nearest neighbor methods, a conspicuous diminution in the disparities among standardized covariates is observed between the treatment group and the control group. While small differences remain in a few variables, the overall distribution of characteristics becomes much more similar, fulfilling the balancing condition necessary for causal inference.
Figure 8.
Propensity Score Matching Balance Analysis for highly polluting Firms. (a) Kernel matching; (b) 2-Nearest neighbors matching.
Figure 9.
Propensity Score Matching Balance Analysis for Energy-Efficient and Environmentally Responsible Firms. (a) Kernel matching; (b) 2-Nearest neighbors matching.
Using the matched samples generated through PSM, we re-estimate our regression models with appropriate weighting. Table 5 presents the results related to enterprises with high pollution levels, while Table 6 contains the data for firms that prioritize energy efficiency and environmental sustainability. The findings indicate that the estimates from these matched samples align closely with our initial predictions, both in terms of magnitude and statistical significance. This consistency strengthens our confidence that the main findings are not influenced by systematic differences in pre-treatment characteristics between the treated and control groups, further supporting the robustness and validity of the GCGs’ effects.
Table 5.
High-polluting Firms PSM.
Table 6.
Energy Saving Firms PSM.
Furthermore, because there are relatively few energy-efficient and environmentally sustainable firms, and to avoid confounding their effects with those of highly polluting firms in further analyses, these firms were excluded from the heterogeneity and mechanism analyses.
4.4. Additional Robustness Tests
4.4.1. Excluding Interference from Concurrent Policies
In order to ensure that the effects we estimate are not influenced by other important environmental regulations present during the sample period, we conduct various sample restriction tests. To control for the influence of concurrent policies, we remove observations that could have been substantially affected by two major regulations: “Ten Atmospheric Measures” and the Environmental Protection Tax Law.
Since the list of high-priority cities under the Ten Atmospheric Measures was updated in 2017, we limit the analysis to the pre-2017 period to maintain a consistent definition of treatment and control groups. This method enables us to isolate the impact of the GCGs from the localized and intense regulatory pressure created by the air pollution policy.
In Table 7, the regression results using this restricted sample, as displayed in columns (1) and (2), still show a statistically significant negative coefficient for highly polluting firms and a positive coefficient for energy-efficient and environmentally sustainable firms. This pattern aligns with our baseline results, which implies that the key results remain unaffected by the simultaneous introduction of the Ten Atmospheric Measures.
Table 7.
Eliminating the Impact of Other Policies.
Additionally, we exclude firms located in the 12 provinces that enacted higher tax rates under the 2018 Environmental Protection Tax Law. The results presented in Columns (3) and (4) of Table 7 consistently reinforce the conclusion that the GCGs exerted a unique and separate influence on corporate innovation.
These sample restriction approaches enhance the credibility of our identification strategy by minimizing potential contamination from other major environmental regulations, thereby strengthening the causal interpretation of our main results.
Finally, in order to address possible serial correlation in the error terms occurring over time within the same company, we implement clustering adjustments at the firm level in the primary regression analysis. However, it is plausible that unobserved regional shocks or policy implementations at broader geographic levels could introduce spatial correlation in the residuals, which may not be fully captured by firm-level clustering alone.
4.4.2. Clustering Robustness Check
To examine whether our inference is sensitive to the choice of clustering level, we conduct robustness checks by re-estimating the model while clustering standard errors at two more aggregate levels: province-year and city-year. This approach allows us to control for correlated shocks within the same province or city across years, as well as common time-varying factors specific to each region.
The results shown in Table 8, particularly in columns (1) to (4), suggest that the coefficients of interest are significant in both statistical and economic contexts, and are consistent across different levels of clustering. Specifically, the adverse impact of the GCGs on firms with high pollution levels, along with the beneficial effect on companies that prioritize energy efficiency and environmental responsibility, remains valid both statistically and economically. This consistency provides further assurance that our baseline results are not influenced by arbitrary choices in clustering errors and that they remain robust under alternative assumptions about within-group correlations.
Table 8.
Additional robustness tests.
4.4.3. IV Estimation
In response to concerns about potential endogeneity, we conducted a robustness check using Instrumental Variables (IV) estimation. For high-polluting firms, we constructed an instrument based on the pre-treatment industry-level pollution average. Pollution data, sourced from firms’ annual reports, was standardized into common coal equivalents. Industries with pollution levels above the median were assigned a value of 1, while industries below the median were assigned a value of 0. This approach ensures that the instrument captures the industry’s general pollution intensity, which is less likely to be influenced by firm-specific factors.
For energy-saving and environmentally friendly firms, we used electricity consumption as the instrument. This is because the identification of these firms is more closely linked to specific firm characteristics, such as their energy consumption, rather than their industry affiliation. Firms with electricity consumption below the median were categorized as energy-saving firms, while those above the median were not. This method provides a clear distinction between firms with differing energy efficiency levels.
The IV regression results, as shown in Table 9, confirm that the effects of green credit policies remain consistent with our main findings. The coefficients for both highly polluting and energy-efficient firms are statistically significant, reinforcing the robustness of our results. These findings further support the validity of our analysis, indicating that the relationship between green credit policies and innovation outcomes is not driven by endogeneity, but rather reflects the actual effects of the policy.
Table 9.
IV estimation.
4.4.4. Extended Sample Period
To further test the robustness of our results, we extended the sample period through 2024. This additional check ensures that our findings hold even with a longer timeframe. As presented in Table 10, the estimated effects from this extended sample are consistent with those observed in the original analysis. Specifically, the coefficients for both highly polluting and energy-efficient firms remain significant and retain their magnitude, indicating that the impact of the GCGs on corporate innovation continues to be stable over time. This consistency across different sample periods strengthens the reliability of our conclusions, further validating the robustness of green credit policies’ impact on corporate innovation.
Table 10.
Extend the sample period to 2024.
5. Mechanism
According to the literature, corporate R&D activities are mainly funded through external sources [56]. A well-established positive relationship exists between external financing and the intensity of corporate innovation activities [57]. In the financial system of China, external financing for firms is significantly facilitated by bank credit. As innovation investment is a crucial driver of corporate innovation outcomes, we examine two potential channels through which the GCGs might influence environmentally sustainable innovation: the R&D expenditure pathway and the bank credit pathway.
To rigorously test these pathways, we adopt a classical mediation analysis framework and estimate the following model using a difference-in-differences approach:
Within this framework, the mediating variables include two metrics for R&D investment (RDS, indicating R&D spending in relation to total revenue, and RDA, representing R&D expenditures compared to total assets) alongside six indicators of bank financing that demonstrate both the size and the maturity of bank loans (bank_a, bank_l, Lloan_ta, Lloan_tl, Sloan_ta, and Sloan_tl).
Table 11 indicates that the GCGs resulted in decreased R&D spending and long-term borrowing by highly polluting firms. Specifically, highly polluting firms saw a marked decline in RDS (0.87%) and RDA (0.42%) after the policy implementation. Furthermore, there was a noticeable reduction in long-term loans, both in terms of total assets (Lloan_ta) and total liabilities (Lloan_tl).
Table 11.
Mechanism tests.
This pattern is consistent with a broader banking strategy to mitigate long-term credit risks associated with highly polluting firms. By shortening loan maturities, banks limit their exposure to the long-term financial risks of these firms, while still offering short-term financing to monitor their behavior. This strategy aligns with the stricter regulatory environment created by the GCGs.
These findings suggest a causal pathway in which the GCGs’ impact on credit allocation—especially the reduction in long-term loans—directly influences the R&D strategies of highly polluting firms. The limited access to long-term financing constrains their ability to invest in long-term innovation projects, leading to a decrease in R&D spending. However, the causal relationship between reduced long-term loans and decreased R&D spending is not purely linear. The reduction in long-term loans does not just affect R&D spending in isolation; it also shifts firms’ strategic focus toward short-term financial survival, often at the expense of long-term sustainable innovation. This dual effect highlights how financial constraints, in tandem with changes in credit allocation, reshape firms’ innovation strategies, limiting their ability to invest in green technologies.
Firstly, we distinguish between short-term and long-term loans to assess how the GCGs influence sustainable innovation through credit allocation. The data presented in Columns (3) and (4) of Table 12 shows that the GCG policy has minimal impact on short-term loans. In contrast, Columns (1) and (2) reveal a significant reduction in long-term loans, which are crucial for supporting sustainable innovation efforts in highly polluting firms. This decline suggests that the primary mechanism through which the GCGs affect innovation in polluting firms is the reduction in long-term financial support, which is vital for funding innovation projects with longer development cycles.
Table 12.
Exploring the Role of Short-Term and Long-Term Loans in Credit Allocation.
Beyond the two primary mechanisms identified—(1) a direct reduction in R&D investment intensity, and (2) a decline in long-term bank financing—we also explore additional potential transmission pathways that could further explain the policy’s effects on innovation. For example, changes in market competition due to the policy could exacerbate the negative impact on sustainable innovation by increasing firms’ short-term profit pressures. This competitive pressure may divert resources away from long-term R&D projects and into immediate operational needs. Moreover, government enforcement of stricter environmental regulations might further restrict firms’ ability to invest in sustainable innovation, as compliance with environmental standards could divert resources from R&D activities.
Taken together, these findings suggest that the contraction in sustainable innovation output among highly polluting firms operates primarily through two interrelated channels: (1) a direct reduction in R&D investment intensity, and (2) a decline in long-term bank financing, which is particularly crucial for sustaining innovation projects with extended gestation periods. Moreover, the interaction between these two mechanisms creates a reinforcing cycle that hinders long-term innovation. The evidence also underscores the dual impact of environmental credit regulations, affecting both real investment decisions and financial constraints. This comprehensive analysis suggests that environmental credit policies like the GCGs can have far-reaching effects on corporate innovation, not only through direct financing restrictions but also through the strategic realignment of firms’ priorities in response to these constraints.
6. Heterogeneity
In this section, we investigate the potential variation in effects across different firm characteristics. Previous studies indicate that elements like ownership structure [58,59] and market competition [60] play a significant role in shaping corporate R&D investment decisions and may thus influence the policy’s effectiveness. To explore these heterogeneous impacts systematically, we apply an extended difference-in-differences model with interaction terms:
In this model denotes indicators of heterogeneity based on two factors: ownership structure and industry competition. For ownership differences, is set to 1 for enterprises owned by the government (SOEs), reflecting variations in financing limitations and political affiliations. Regarding competition, is given a value of 1 for companies functioning in sectors where the Herfindahl–Hirschman Index (HHI) surpasses the annual median threshold. The HHI is derived through a computational process that entails aggregating the squared values of the individual market shares of all the entities operating within the relevant market, which are determined by the total assets of firms within each industry. Higher HHI values suggest more market concentration.
6.1. Ownership Heterogeneity
Columns (1) and (2) in Table 13 present ownership-related heterogeneity. The interaction term pol × post × SOE exhibits a significant positive coefficient, with this effect being statistically significant at the 1% level for total green patent applications. These results suggest that the impact of the GCGs on innovation is less pronounced for state-owned enterprises (SOEs) compared to non-state-owned enterprises (non-SOEs).
Table 13.
Ownership-related and Industry Competition Heterogeneity tests.
This pattern can be attributed to several institutional and economic factors. SOEs generally benefit from preferential access to credit and stronger government support, shielding them from the direct constraints imposed by green credit policies. These advantages allow SOEs to maintain their financial stability and competitiveness without needing to adjust their strategies significantly in response to green credit restrictions [61]. Therefore, state-owned enterprises have responded relatively mildly to policy changes. This is because they rely less on market-based financing and are better equipped to withstand external pressures driving innovation.
In contrast, non-SOEs typically face stricter financing constraints and are subject to greater market discipline. These firms rely more heavily on external financing and are more sensitive to changes in credit allocation. The significant positive coefficients for non-SOEs suggest that they are more responsive to the GCGs, likely driven by the need to adjust their investment strategies to secure financing and maintain their competitive edge. For non-SOEs, the urgency of innovation and meeting environmental standards is increasingly evident. This is because their access to credit is more directly linked to their innovation capabilities and compliance with green standards.
6.2. Industry Competition Heterogeneity
In this section, we further investigate whether market competition amplifies the suppressive effect of green credit policies on innovation. The underlying hypothesis is that firms operating in industries with higher levels of competition face greater pressure to preserve short-term profits. This urgency may discourage them from pursuing long-term sustainable innovation projects, which often involve significant upfront costs and uncertain future returns.
Our analysis shows significant positive coefficients for the triple interaction term pol × post × HHI in columns (3) and (4) of Table 13, indicating that the negative impact of the GCGs on innovation is more pronounced in industries characterized by higher levels of competition. This indicates that in highly competitive industries, companies are more focused on immediate financial performance and therefore reluctant to invest in high-risk, long-term sustainable innovation projects required to meet stricter environmental standards. In contrast, firms in less competitive industries may face fewer pressures to prioritize short-term profits, allowing them more flexibility to engage in sustainable innovation and absorb the long-term costs associated with it.
The heterogeneity observed in this analysis highlights a key economic rationale: in industries with higher competition, firms may perceive sustainable innovation as a risky, long-term investment with uncertain returns. The financial strain imposed by both market forces and regulatory pressures creates a situation where firms opt for strategies that yield quicker, more predictable results, often at the expense of more transformative, sustainable innovations. This dynamic reinforces the idea that the incentive structure in competitive markets leads firms to focus on immediate survival rather than on long-term strategic shifts toward sustainability.
6.3. Firm-Level Heterogeneity
In the analysis of firm size, we categorize firms based on their total assets, using the median to differentiate between large and small firms. Columns (1) and (2) of Table 14 show that larger firms are more significantly affected by the GCGs due to their greater reliance on external credit. The positive and significant coefficient on the interaction term pol × post × H suggests that larger firms experience a stronger adverse effect from the policy compared to smaller firms. This result highlights that large firms are more sensitive to the constraints imposed by green credit policies, as their reliance on external credit for financing sustainable innovation makes them more vulnerable to shifts in credit allocation.
Table 14.
Firm-level Heterogeneity.
Columns (3) and (4) of Table 14 show the heterogeneity of firms under different financing constraints. We use a financing constraint index (WW) to categorize firms based on their access to credit. The positive and significant coefficient on the interaction term pol × post × H reveals that firms facing tighter financing constraints are more adversely affected by the policy. This result is consistent with the size-based heterogeneity, as firms with greater financing constraints are more likely to suffer from restricted access to credit under green credit policies. Firms with limited access to external financing are thus more impacted by the policy’s limitations, exacerbating their innovation challenges.
These additional analyses provide a more nuanced understanding of how the green credit policy affects firms with different characteristics. By incorporating heterogeneity based on firm size and financing constraints, this result enhances the robustness of the paper and offers deeper insights into the varied impacts of green credit policies at the firm level.
6.4. Regional Heterogeneity
In response to the suggestion regarding regional heterogeneity, we have expanded our analysis to explore how the green credit policy impacts firms in different regions. We examine two key dimensions of regional variation: economic activity and environmental quality.
For economic activity, we use pre-policy nighttime light intensity as a proxy for regional economic activity, categorizing regions into two groups: those with economic activity above the median and those below the median. The results in Table 15, Column (1) and Column (2) show that firms located in regions with higher economic activity are less constrained by the GCGs. This is likely due to greater access to financing from alternative sources, suggesting that green credit policies have a weaker impact on firms in economically vibrant regions, as they have more financing options available to them. The positive coefficient on the interaction term pol × post × H further indicates that the policy’s effect on innovation is less pronounced in regions with high economic activity, as these firms may face fewer barriers to innovation due to better access to resources.
Table 15.
Regional Heterogeneity.
For environmental quality, we measure it using pre-policy urban wastewater treatment rates as a proxy for environmental conditions. In Column (3) and Column (4) of Table 15, we find that firms in regions with better environmental conditions—indicated by higher wastewater treatment rates—experience smaller reductions in sustainable innovation following the policy shock. The interaction term pol × post × H shows that firms in more environmentally conscious regions tend to have a stronger positive response to green credit policies, indicating that they are more likely to embrace sustainable innovation and face less hindrance from the policy.
These regional heterogeneity analyses help us better understand the differential impact of green credit policies across regions. Our results show that firms in more economically active regions and those in areas with better environmental conditions are better positioned to adapt to green credit policies and continue their innovation efforts.
7. Conclusions
This research contributes to the growing literature on sustainable innovation by examining how the GCGs shape corporate innovation strategies. Our findings reveal that sustainable innovation exhibits heterogeneous responses to credit policy interventions, with these variations contingent upon firms’ initial environmental positioning. Our findings indicate that after the introduction of the green credit policy, there was a notable rise in sustainable innovation activities observed among these firms, particularly within those that prioritize energy efficiency and environmental awareness. Specifically, patent applications for green technologies and green invention patents from ESFs increased by 45.17% and 31.40%, respectively, whereas highly polluting firms experienced a decline of 12.46% in green patent applications and a 20.60% drop in green invention filings.
This study further reveals that the decline in innovation within highly polluting firms primarily stems from two main factors: a decrease in R&D spending and a reallocation of bank credit. Specifically, the implementation of the policy resulted in a decline in the R&D intensity of highly polluting firms. Additionally, these firms faced a substantial decline in long-term bank financing, particularly in the reduction of loans to highly polluting companies, which further constrained their ability to fund long-term innovation projects. These findings emphasize the critical role of long-term financing in sustaining sustainable innovation, revealing a trade-off between immediate financial pressures and long-term technological progress.
Heterogeneity analysis reveals that the policy’s effects vary significantly across different types of firms and sectors. SOEs are less affected by the GCGs due to their easier access to funding, while non-SOEs face greater innovation constraints. Firms in highly competitive sectors are pressured to prioritize short-term profits; this leads them to adopt a more cautious approach toward sustainable innovation and exacerbates the negative impacts of such policies. Furthermore, significant differences exist between enterprises of varying sizes: large enterprises are better equipped to handle financial constraints, while small enterprises are more vulnerable. Regional differences also play a significant role, firms in regions with stronger market activity and environmental conditions tend to adapt better, while those in less developed regions face more challenges in implementing sustainable innovation.
In conclusion, the GCGs have successfully promoted sustainable innovation in energy-efficient firms but have had a negative impact on the innovation of highly polluting firms. This study highlights the need for nuanced policy design that considers the heterogeneity of firms. Policymakers should recognize the unintended consequences for polluting firms and consider targeted interventions, such as providing long-term financing support or offering incentives for innovation, to mitigate the negative effects on their innovation capacity. Given the challenges SMEs face in accessing long-term financing, the government should introduce more flexible financing support measures to meet their specific needs. Measures such as interest rate subsidies or credit guarantees could incentivize SMEs to invest in sustainable innovation, which would help address their financing difficulties and promote a broader adoption of green technologies.
Moreover, policymakers should focus on balancing short-term financing needs with the requirement for long-term investments in green technologies. While short-term loans may be necessary for operational cash flow, it is important to prioritize long-term financing solutions for sustainable innovation projects. A sustainable mix of short and long term financing options would help firms navigate financial constraints while continuing to invest in innovation.
Furthermore, given that this policy impacts different industries in varying ways, the government should develop tailored green credit frameworks for each sector, taking into full consideration the financial dynamics and competitive pressures within each industry. Such an approach would ensure that green credit policies are more effective in promoting innovation across diverse industries. This study also acknowledges the limitations of excluding SMEs from the analysis due to data constraints. Future research could explore the effects of the GCGs on SMEs, which may have different responses based on their unique financial constraints and market positions. Future studies could examine other potential mechanisms through which the GCGs impact innovation, such as government regulatory enforcement, market demand for green products, and the role of corporate governance. Expanding the scope of the analysis to include these factors could provide a more comprehensive understanding of how green credit policies influence corporate behavior and innovation in the long term.
Author Contributions
Conceptualization, J.W. and X.S.; methodology, J.W. and X.S.; software, X.S.; validation, X.S. and W.Q.; formal analysis, J.W., X.S. and W.Q.; investigation, J.W.; resources, X.S. and W.Q.; data curation, J.W. and X.S.; writing—original draft preparation, J.W. and X.S.; writing—review and editing, J.W. and W.Q.; supervision, J.W. All authors have read and agreed to the published version of the manuscript.
Funding
This research was funded by National Social Science Fund of China, grant number 22XJY012.
Institutional Review Board Statement
Not applicable.
Informed Consent Statement
Not applicable.
Data Availability Statement
The raw data supporting the conclusions of this article will be made available by the authors on request.
Acknowledgments
We thank the anonymous reviewers for their careful reading of our manuscript and their insightful comments and suggestions.
Conflicts of Interest
The authors declare no conflicts of interest.
References
- United Nations Framework Convention on Climate Change. Paris Agreement; United Nations Framework Convention on Climate Change: Bonn, Germany, 2015. [Google Scholar]
- Benkraiem, R.; Dubocage, E.; Lelong, Y.; Shuwaikh, F. The effects of environmental performance and green innovation on corporate venture capital. Ecol. Econ. 2023, 210, 107860. [Google Scholar] [CrossRef] [Scilit]
- Huang, Z.; Gao, N.; Jia, M. Green credit and its obstacles: Evidence from China’s green credit guidelines. J. Corp. Financ. 2023, 82, 102441. [Google Scholar] [CrossRef] [Scilit]
- Zhang, S.; Wu, Z.; Wang, Y.; Hao, Y. Fostering green development with green finance: An empirical study on the environmental effect of green credit policy in China. J. Environ. Manag. 2021, 296, 113159. [Google Scholar] [CrossRef] [Scilit] [PubMed]
- Wen, H.; Lee, C.-C.; Zhou, F. Green credit policy, credit allocation efficiency and upgrade of energy-intensive enterprises. Energy Econ. 2021, 94, 105099. [Google Scholar] [CrossRef] [Scilit]
- Boons, F.; Lüdeke-Freund, F. Business models for sustainable innovation: State-of-the-art and steps towards a research agenda. J. Clean. Prod. 2013, 45, 9–19. [Google Scholar] [CrossRef] [Scilit]
- Ketata, I.; Sofka, W.; Grimpe, C. The role of internal capabilities and firms’ environment for sustainable innovation: Evidence for Germany. RD Manag. 2014, 45, 60–75. [Google Scholar] [CrossRef] [Scilit]
- Cillo, V.; Petruzzelli, A.M.; Ardito, L.; Del Giudice, M. Understanding sustainable innovation: A systematic literature review. Corp. Soc. Responsib. Environ. Manag. 2019, 26, 1012–1025. [Google Scholar] [CrossRef] [Scilit]
- Adams, R.; Jeanrenaud, S.; Bessant, J.; Denyer, D.; Overy, P. Sustainability-oriented Innovation: A Systematic Review. Int. J. Manag. Rev. 2016, 18, 180–205. [Google Scholar] [CrossRef] [Scilit]
- China Banking Regulatory Commission. Notice of the China Banking Regulatory Commission on Issuing the Green Credit Guidelines; China Banking Regulatory Commission: Beijing, China, 2012. [Google Scholar]
- Hu, G.; Wang, X.; Wang, Y. Can the green credit policy stimulate green innovation in heavily polluting enterprises? Evidence from a quasi-natural experiment in China. Energy Econ. 2021, 98, 105134. [Google Scholar] [CrossRef] [Scilit]
- Bekaert, G.; Harvey, C.; Lundblad, C.; Siegel, S. What Segments Equity Markets? Rev. Financ. Stud. 2011, 24, 3841–3890. [Google Scholar] [CrossRef] [Scilit]
- Gollop, F.M.; Roberts, M.J. Environmental Regulations and Productivity Growth: The Case of Fossil-fueled Electric Power Generation. J. Political Econ. 1983, 91, 654–674. [Google Scholar] [CrossRef] [Scilit]
- Aghion, P.; Bergeaud, A.; Reenen, J. The Impact of Regulation on Innovation. Am. Econ. Rev. 2023, 113, 2894–2936. [Google Scholar] [CrossRef] [Scilit]
- Porter, M.E.; van der Linde, C. Toward a New Conception of the Environment-Competitiveness Relationship. J. Econ. Perspect. 1995, 9, 97–118. [Google Scholar] [CrossRef] [Scilit]
- Horbach, J. Determinants of environmental innovation—New evidence from German panel data sources. Res. Policy 2008, 37, 163–173. [Google Scholar] [CrossRef] [Scilit]
- Rubashkina, Y.; Galeotti, M.; Verdolini, E. Environmental regulation and competitiveness: Empirical evidence on the Porter Hypothesis from European manufacturing sectors. Energy Policy 2015, 83, 288–300. [Google Scholar] [CrossRef] [Scilit]
- Du, K.; Cheng, Y.; Yao, X. Environmental regulation, green technology innovation, and industrial structure upgrading: The road to the green transformation of Chinese cities. Energy Econ. 2021, 98, 105247. [Google Scholar] [CrossRef] [Scilit]
- Xie, R.-H.; Yuan, Y.-J.; Huang, J.-J. Different Types of Environmental Regulations and Heterogeneous Influence on “Green” Productivity: Evidence from China. Ecol. Econ. 2017, 132, 104–112. [Google Scholar] [CrossRef] [Scilit]
- Lanoie, P.; Laurent-Lucchetti, J.; Johnstone, N.; Ambec, S. Environmental Policy, Innovation and Performance: New Insights on the Porter Hypothesis. J. Econ. Manag. Strategy 2007, 20, 803–842. [Google Scholar] [CrossRef] [Scilit]
- Rousselière, S.; Coisnon, T.; Hassan, M.; Musson, A.; Rousselière, D. Beyond Porter hypothesis: Empirical evidence of heterogeneous and contextual economic returns of eco-innovations on a sample of European SMEs. J. Clean. Prod. 2024, 484, 144329. [Google Scholar] [CrossRef] [Scilit]
- Chen, D.; Shi, D.; Qi, D. International comparison of green finance statistical standards and China’s practice. Stat. Res. 2025, 42, 75–87. [Google Scholar]
- Irfan, M.; Razzaq, A.; Sharif, A.; Yang, X. Influence mechanism between green finance and green innovation: Exploring regional policy intervention effects in China. Technol. Forecast. Soc. Change 2022, 182, 121882. [Google Scholar] [CrossRef] [Scilit]
- Wang, X.; Wang, Y. Research on green credit policy enhancing green innovation. Manag. World 2021, 37, 173–188+111. [Google Scholar]
- Bian, C.; Chu, Z.; Sun, Z. Environmental regulation promotes policy simulation research on green technology innovation of enterprises. J. Ind. Technol. Econ. 2021, 40, 12–22. [Google Scholar]
- Wang, W.; Yang, M.; Li, X. Does external pressure promote corporate green innovation?—The dual influence of government supervision and media monitoring. Ind. Econ. Rev. 2021, 12, 66–81. [Google Scholar]
- García-Sánchez, A.; Rama, R. New challenges in European innovation partnerships: SOEs, POEs and foreign MNEs during crises. Eurasian Bus. Rev. 2024, 14, 1053–1092. [Google Scholar] [CrossRef] [Scilit]
- Lv, C.; Fan, J.; Lee, C.-C. Can green credit policies improve corporate green production efficiency? J. Clean. Prod. 2023, 397, 136573. [Google Scholar] [CrossRef] [Scilit]
- Xu, B.; Lin, B. Green credit and green technology innovation: Impact mechanism and nonlinear effect test. Environ. Impact Assess. Rev. 2025, 110, 107652. [Google Scholar] [CrossRef] [Scilit]
- Si, L.; Cao, H. Can green credit policy improve corporate environmental social responsibility?—From the perspectives of external pressure and internal concern. China Ind. Econ. 2022, 137–155. [Google Scholar]
- Yu, C.-H.; Wu, X.; Zhang, D.; Chen, S.; Zhao, J. Demand for green finance: Resolving financing constraints on green innovation in China. Energy Policy 2021, 153, 112255. [Google Scholar] [CrossRef] [Scilit]
- Udeagha, M.C.; Muchapondwa, E. Green finance, fintech, and environmental sustainability: Fresh policy insights from the BRICS nations. Int. J. Sustain. Dev. World Ecol. 2023, 30, 633–649. [Google Scholar] [CrossRef] [Scilit]
- Ding, N.; Ren, Y.; Zuo, Y. Is the green credit policy worth the cost or worth the wish?—PSM-DID cost efficiency analysis from the perspective of resource allocation. J. Financ. Res. 2020, 112–130. [Google Scholar]
- Su, D.; Lian, L. Does green credit affect the investment and financing behavior of heavily polluting enterprises? J. Financ. Res. 2018, 123–137. [Google Scholar]
- Hossain, M.R.; Rao, A.; Sharma, G.D.; Dev, D.; Kharbanda, A. Empowering energy transition: Green innovation, digital finance, and the path to sustainable prosperity through green finance initiatives. Energy Econ. 2024, 136, 107736. [Google Scholar] [CrossRef] [Scilit]
- Dai, J.; Mehmood, U.; Nassani, A.A. Empowering sustainability through energy efficiency, green innovations, and the sharing economy: Insights from G7 economies. Energy 2025, 318, 134768. [Google Scholar] [CrossRef] [Scilit]
- Lu, J.; Yan, Y.; Wang, T. A study on the micro-effect of green credit policy: Based on the perspective of technological innovation and resource reallocation. China Ind. Econ. 2021, 174–192. [Google Scholar]
- Heijs, J.; Guerrero, A.J.; Huergo, E. Understanding the Heterogeneous Additionality of R&D Subsidy Programs of Different Government Levels. Ind. Innov. 2021, 29, 533–563. [Google Scholar] [CrossRef] [Scilit]
- Liu, Y.; Zhang, L.; Failler, P.; Wang, Z. The Dynamic Evolution of Agricultural Trade Network Structures and Its Influencing Factors: Evidence from Global Soybean Trade. Systems 2025, 13, 279. [Google Scholar] [CrossRef] [Scilit]
- Choi, J.; Lee, C.; Oh, M.-S. Discovering causal relationships among financial variables associated with firm value using a dynamic Bayesian network. Data Sci. Financ. Econ. 2025, 5, 1–18. [Google Scholar] [CrossRef] [Scilit]
- Xie, T.; Liu, J. How does green credit affect China’s green economic growth? China Popul. Resour. Environ. 2019, 29, 83–90. [Google Scholar]
- Gillan, S.L.; Koch, A.; Starks, L.T. Firms and social responsibility: A review of ESG and CSR research in corporate finance. J. Corp. Financ. 2021, 66, 101889. [Google Scholar] [CrossRef] [Scilit]
- Xie, J.; Abbass, K.; Li, D. Advancing eco-excellence: Integrating stakeholders’ pressures, environmental awareness, and ethics for green innovation and performance. J. Environ. Manag. 2024, 352, 120027. [Google Scholar] [CrossRef] [Scilit]
- Chen, G.; Ding, S.; Zhao, X. China’s green financial policy, financing costs and corporate green transformation: From the perspective of the central bank’s collateral policy. J. Financ. Res. 2021, 75–95. [Google Scholar]
- Bilyay-Erdogan, S.; Danisman, G.O.; Demir, E. ESG performance and investment efficiency: The impact of information asymmetry. J. Int. Financ. Mark. Inst. Money 2024, 91, 101919. [Google Scholar] [CrossRef] [Scilit]
- Agrawal, R.; Agrawal, S.; Samadhiya, A.; Kumar, A.; Luthra, S.; Jain, V. Adoption of green finance and green innovation for achieving circularity: An exploratory review and future directions. Geosci. Front. 2024, 15, 101669. [Google Scholar] [CrossRef] [Scilit]
- Ding, J.; Li, Z.; Huang, J. Can green credit policy promote corporate green innovation?—From the perspective of policy effect differentiation. J. Financ. Res. 2022, 55–73. [Google Scholar]
- Daugaard, D.; Ding, A. Global Drivers for ESG Performance: The Body of Knowledge. Sustainability 2022, 14, 2322. [Google Scholar] [CrossRef] [Scilit]
- Martiny, A.; Taglialatela, J.; Testa, F.; Iraldo, F. Determinants of environmental social and governance (ESG) performance: A systematic literature review. J. Clean. Prod. 2024, 456, 142213. [Google Scholar] [CrossRef] [Scilit]
- Cabaleiro-Cerviño, G.; Mendi, P. ESG-driven innovation strategy and firm performance. Eurasian Bus. Rev. 2024, 14, 137–185. [Google Scholar] [CrossRef] [Scilit]
- Kneipp, J.; Gomes, C.; Bichueti, R.; Frizzo, K.; Perlin, A.P. Sustainable innovation practices and their relationship with the performance of industrial companies. Rev. Gestão 2019, 26, 94–111. [Google Scholar] [CrossRef] [Scilit]
- Ma, Y.; Chen, D. How green credit policies drive green innovation: Evidence from a natural experiment in China. J. Econ. Behav. Organ. 2025, 239, 107265. [Google Scholar] [CrossRef] [Scilit]
- Li, H.; Zhao, L. Corporate Dual-Organizational Performance and Substantive Green Innovation Practices: A Quasi-Natural Experiment Analysis Based on ESG Rating Events. Sustainability 2025, 17, 8897. [Google Scholar] [CrossRef] [Scilit]
- Sun, S.; Lian, S. The role of director network in enhancing corporate debt financing: Evidence from China’s A-share listed companies. Nankai Bus. Rev. 2018, 21, 18–30. [Google Scholar]
- Beck, T.; Levine, R.; Levkov, A. Big Bad Banks? The Winners and Losers from Bank Deregulation in the United States. J. Financ. 2010, 65, 1637–1667. [Google Scholar] [CrossRef] [Scilit]
- Czarnitzki, D.; Hottenrott, H. R&D investment and financing constraints of small and medium-sized firms. Small Bus. Econ. 2011, 36, 65–83. [Google Scholar] [CrossRef] [Scilit]
- Ayyagari, M.; Demirguc-Kunt, A.M.V.; Maksimovic, V. Firm Innovation in Emerging Markets: The Role of Finance, Governance, and Competition. J. Financ. Quant. Anal. 2011, 46, 1545–1580. [Google Scholar] [CrossRef] [Scilit]
- Cai, X.; Lu, Y.; Wu, M.; Yu, L. Does environmental regulation drive away inbound foreign direct investment? Evidence from a quasi-natural experiment in China. J. Dev. Econ. 2016, 123, 73–85. [Google Scholar] [CrossRef] [Scilit]
- Zhang, D. Green financial system regulation shock and greenwashing behaviors: Evidence from Chinese firms. Energy Econ. 2022, 111, 106064. [Google Scholar] [CrossRef] [Scilit]
- Lin, B.; Pan, T. The impact of green credit on green transformation of heavily polluting enterprises: Reverse forcing or forward pushing? Energy Policy 2024, 184, 113901. [Google Scholar] [CrossRef] [Scilit]
- Wang, Z.; Bian, B.; Zhu, C.; Lu, Y.; Wang, J. Green credit policy’s impact on polluting firms’ market performance: The role of financing constraints. Front. Environ. Econ. 2025, 4, 1611379. [Google Scholar] [CrossRef] [Scilit]
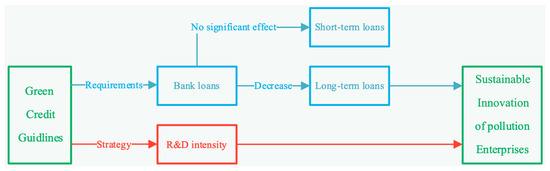
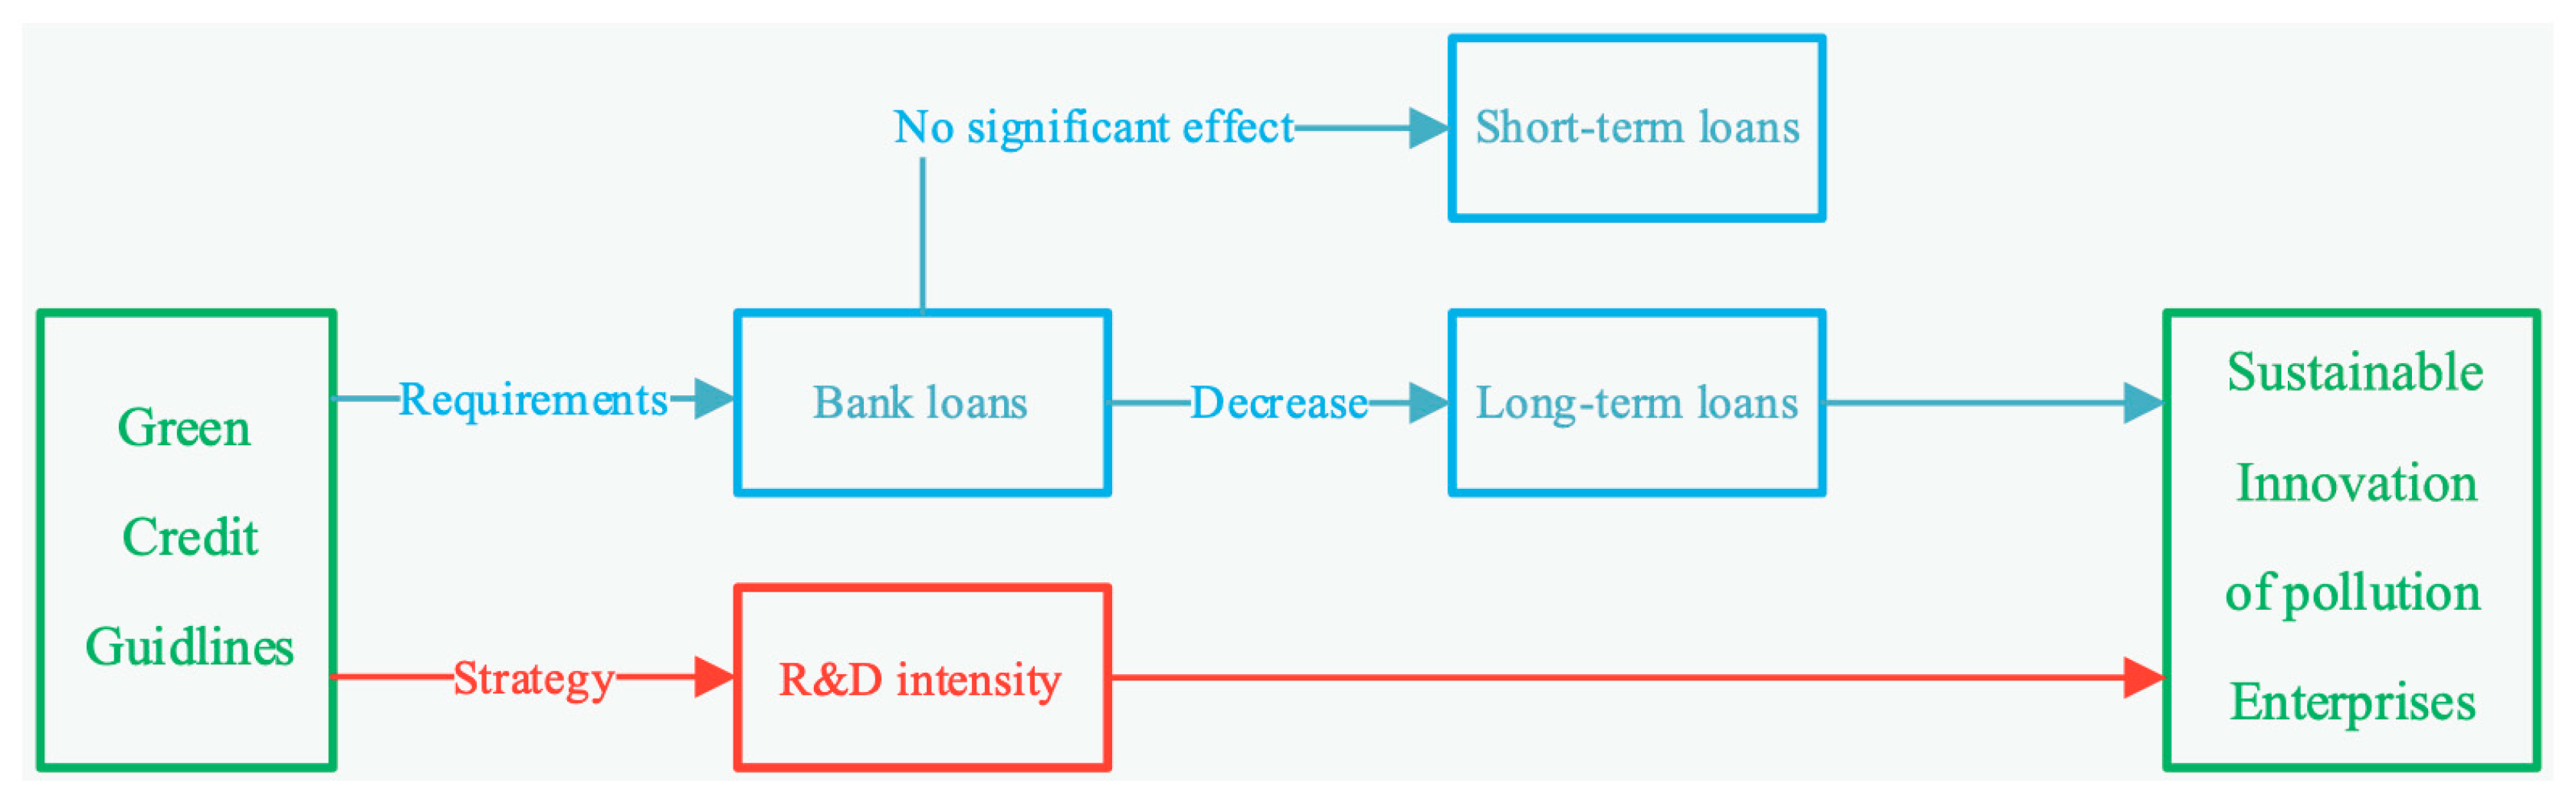
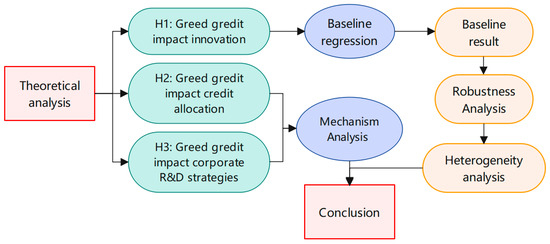
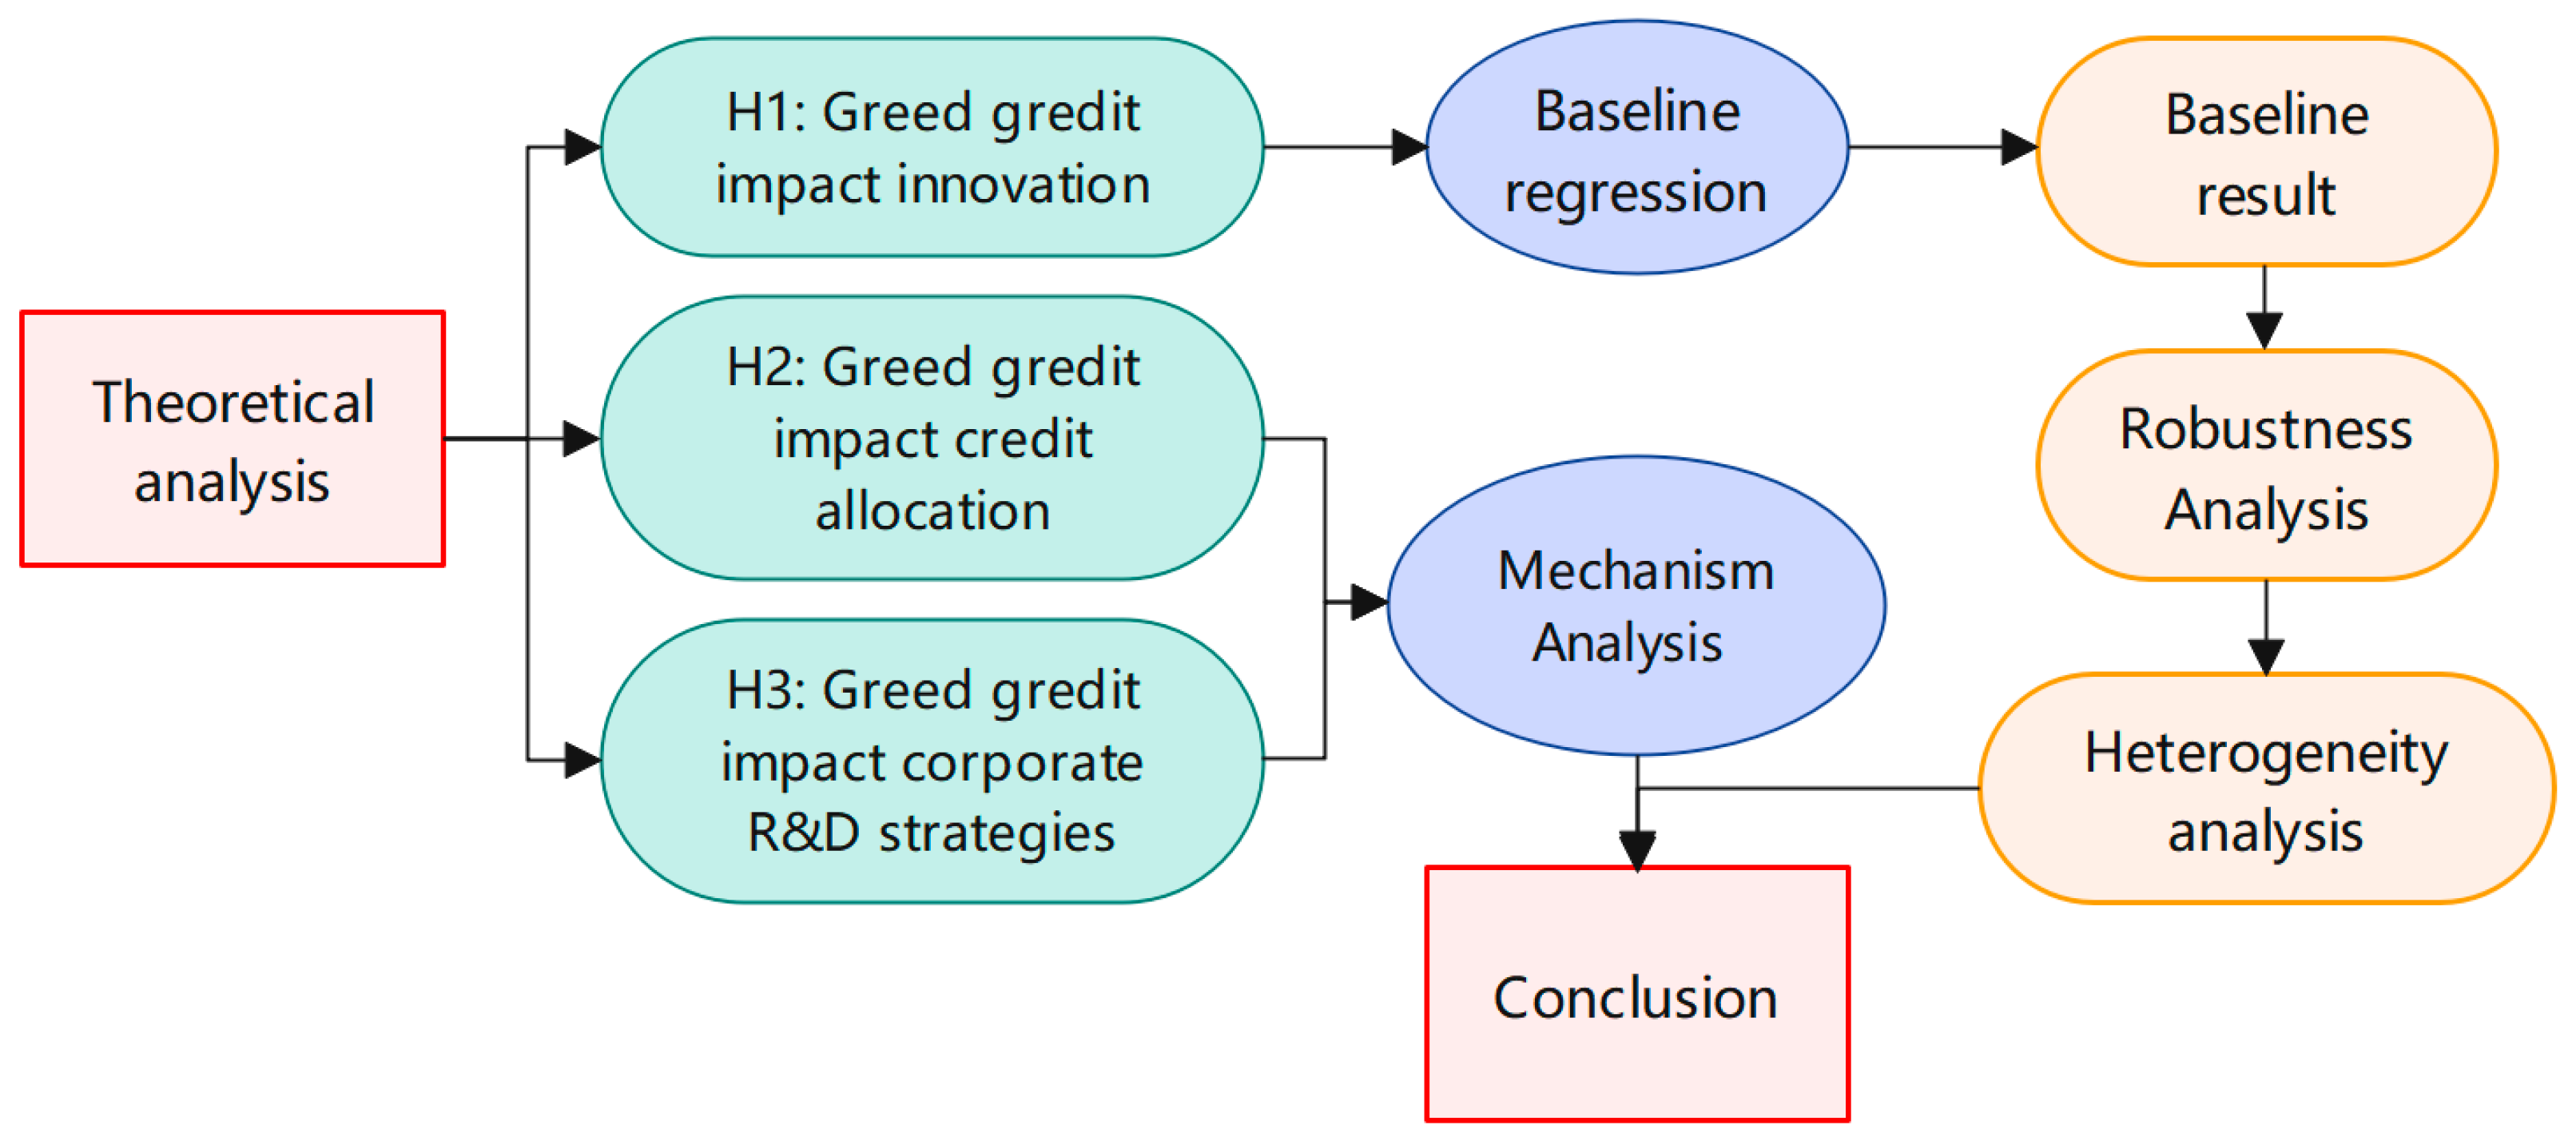
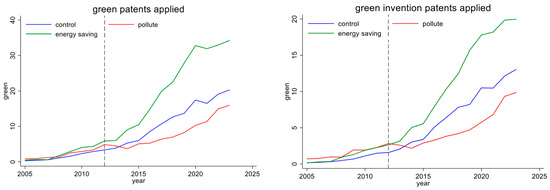
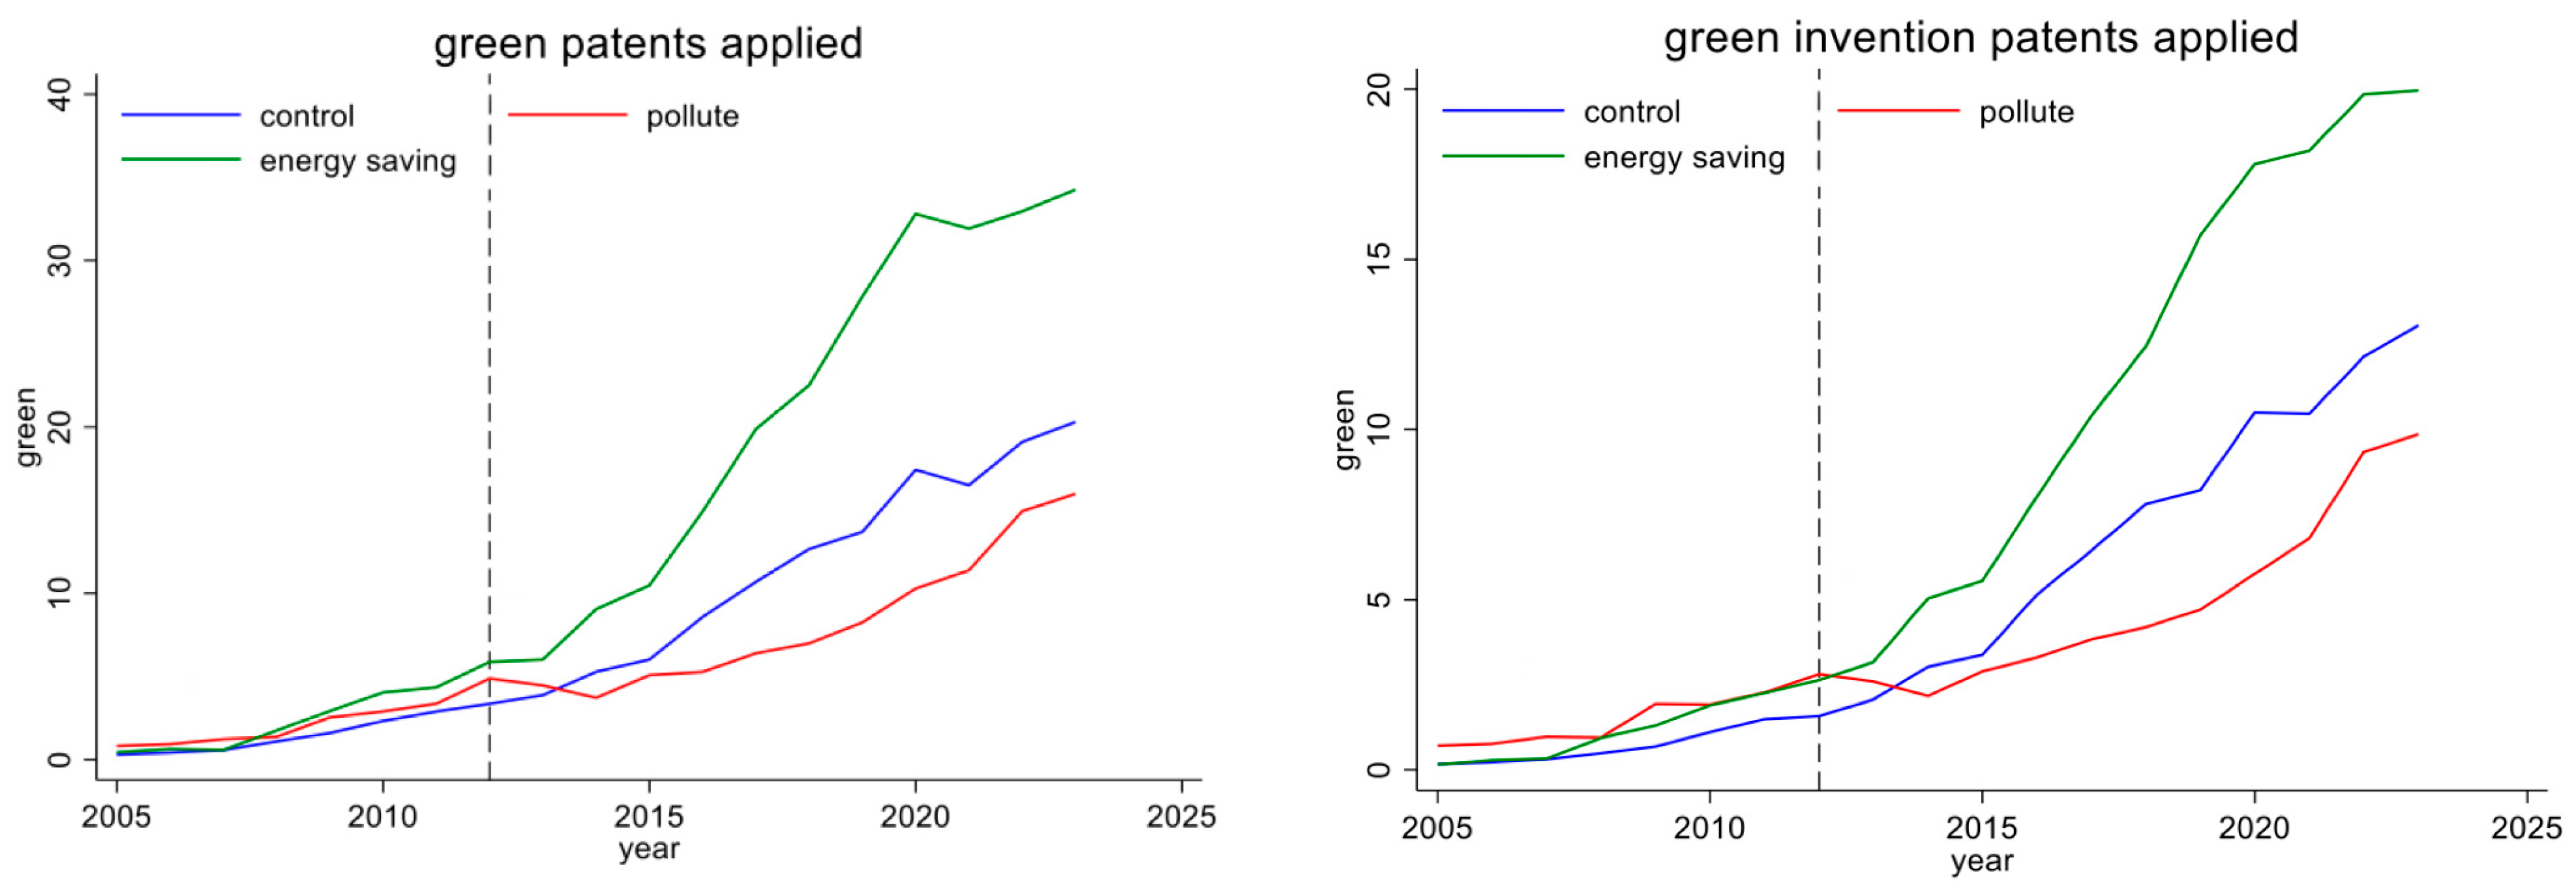
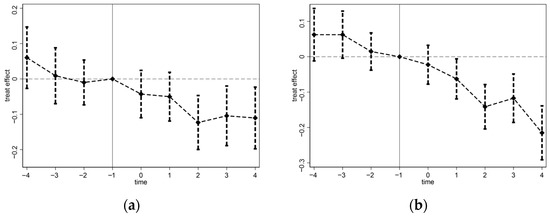
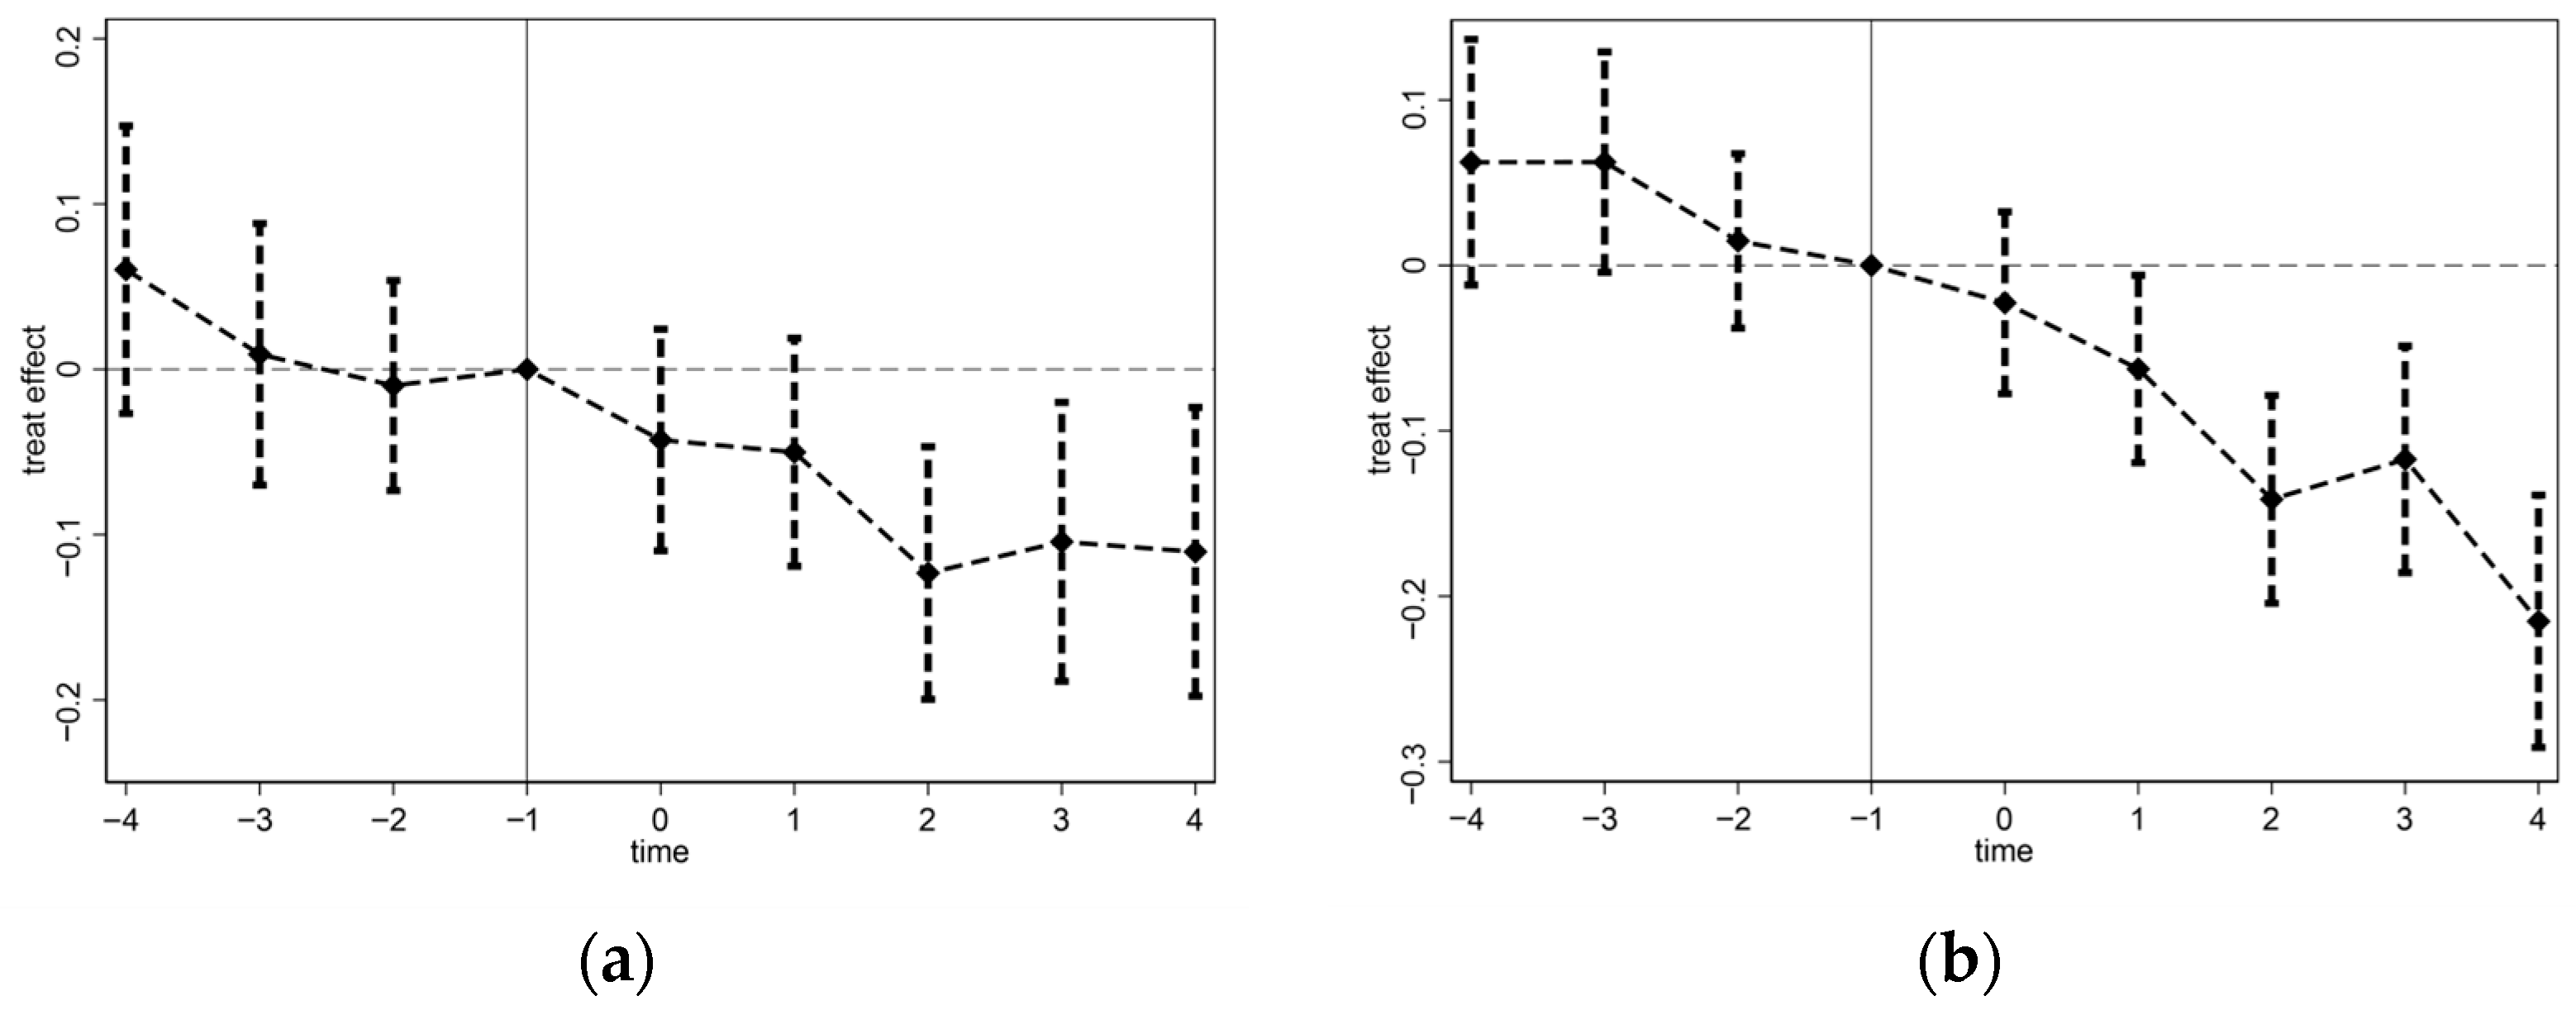
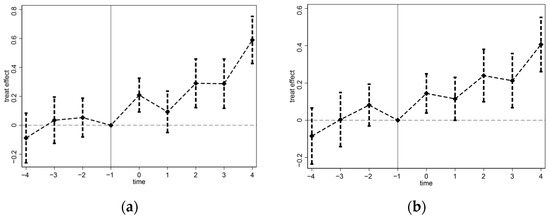
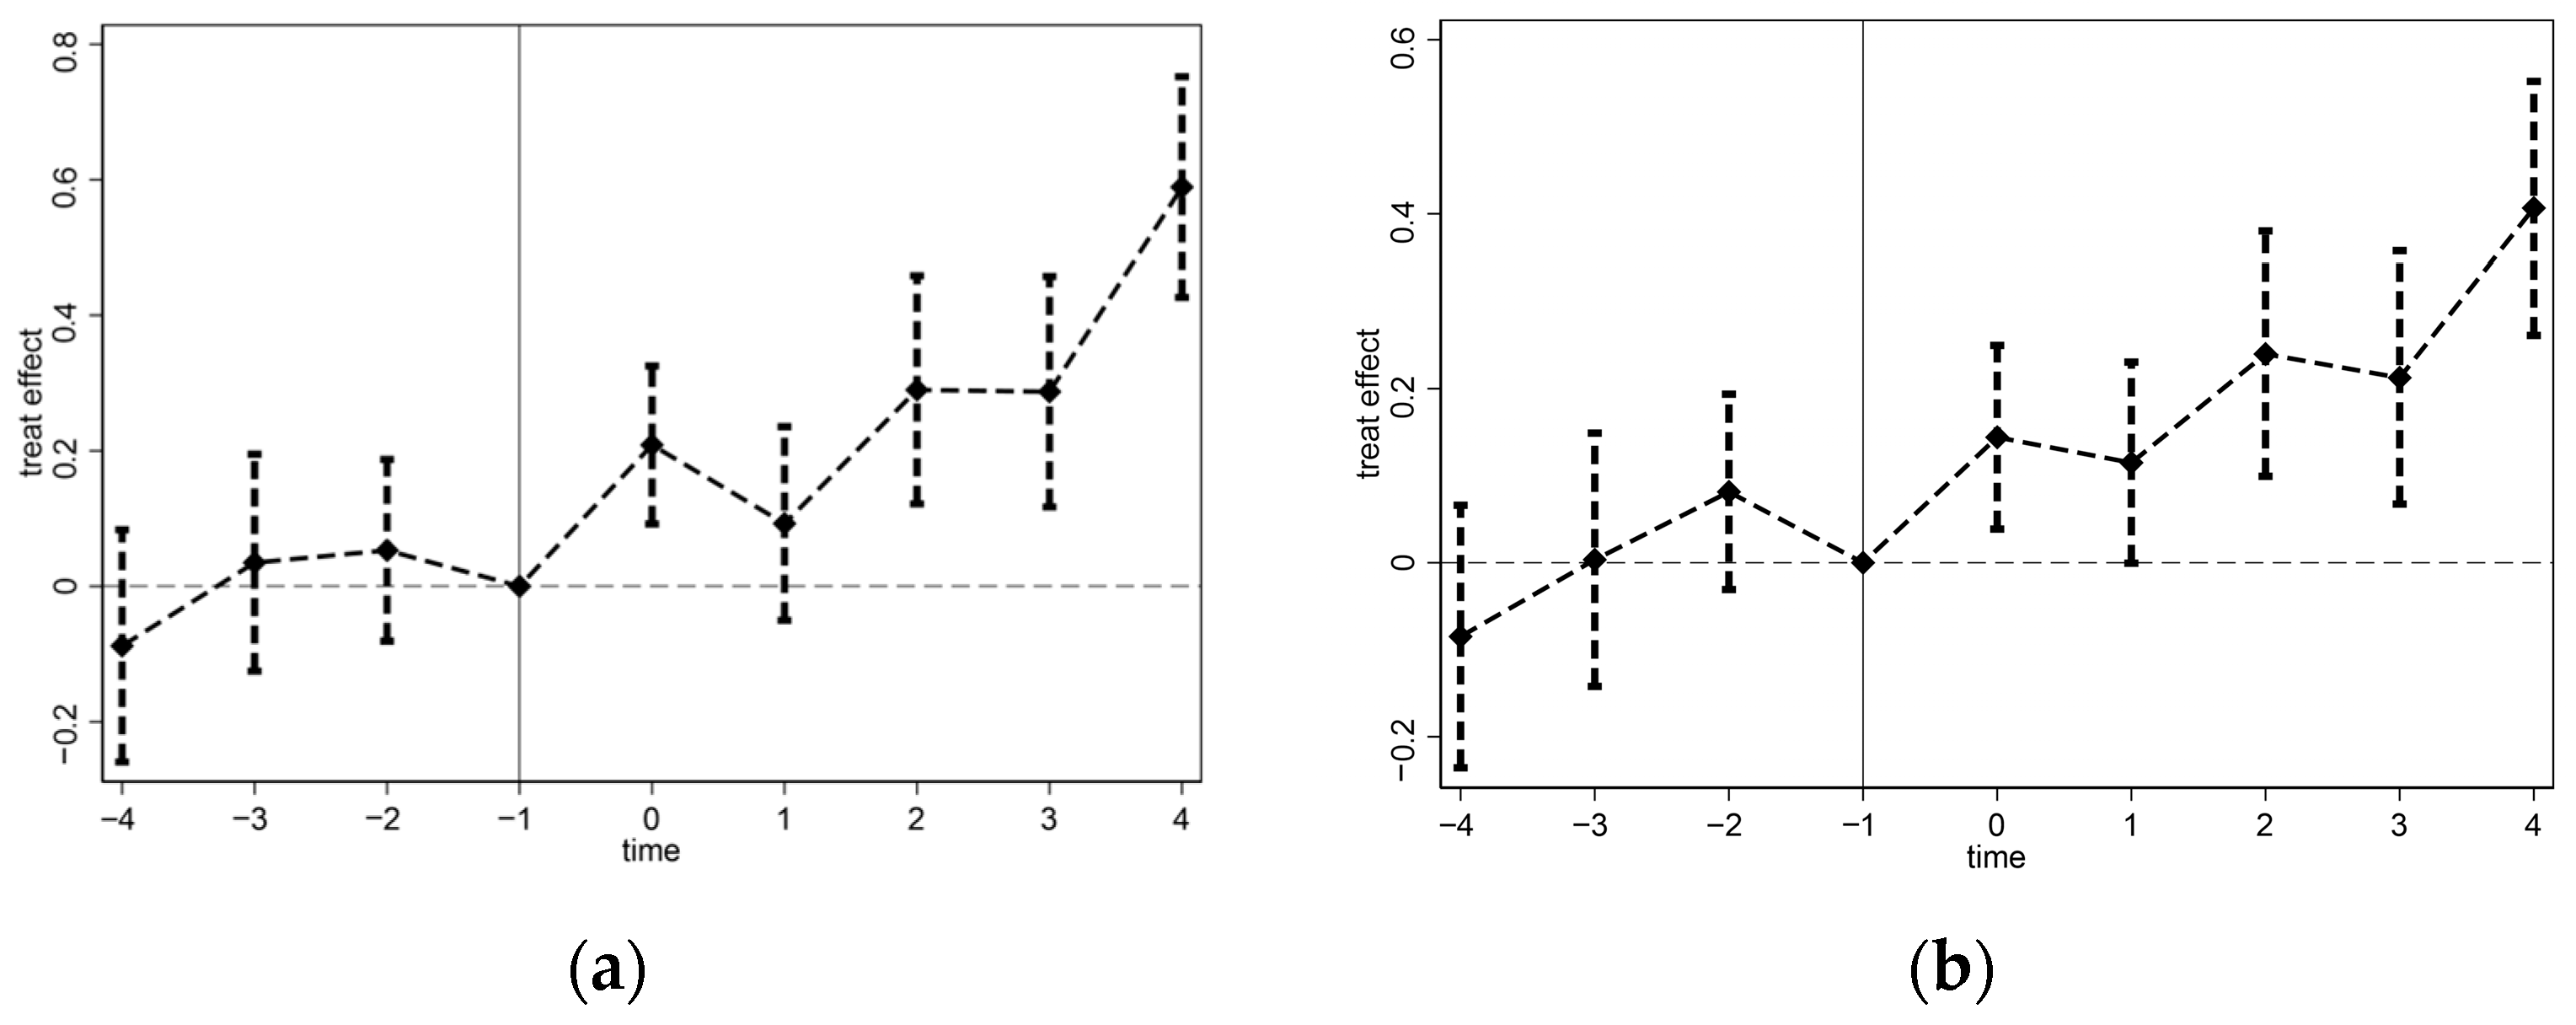
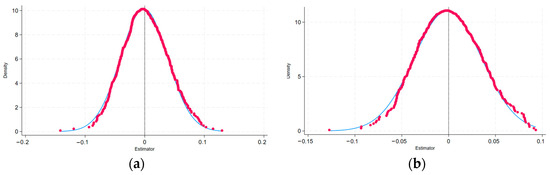
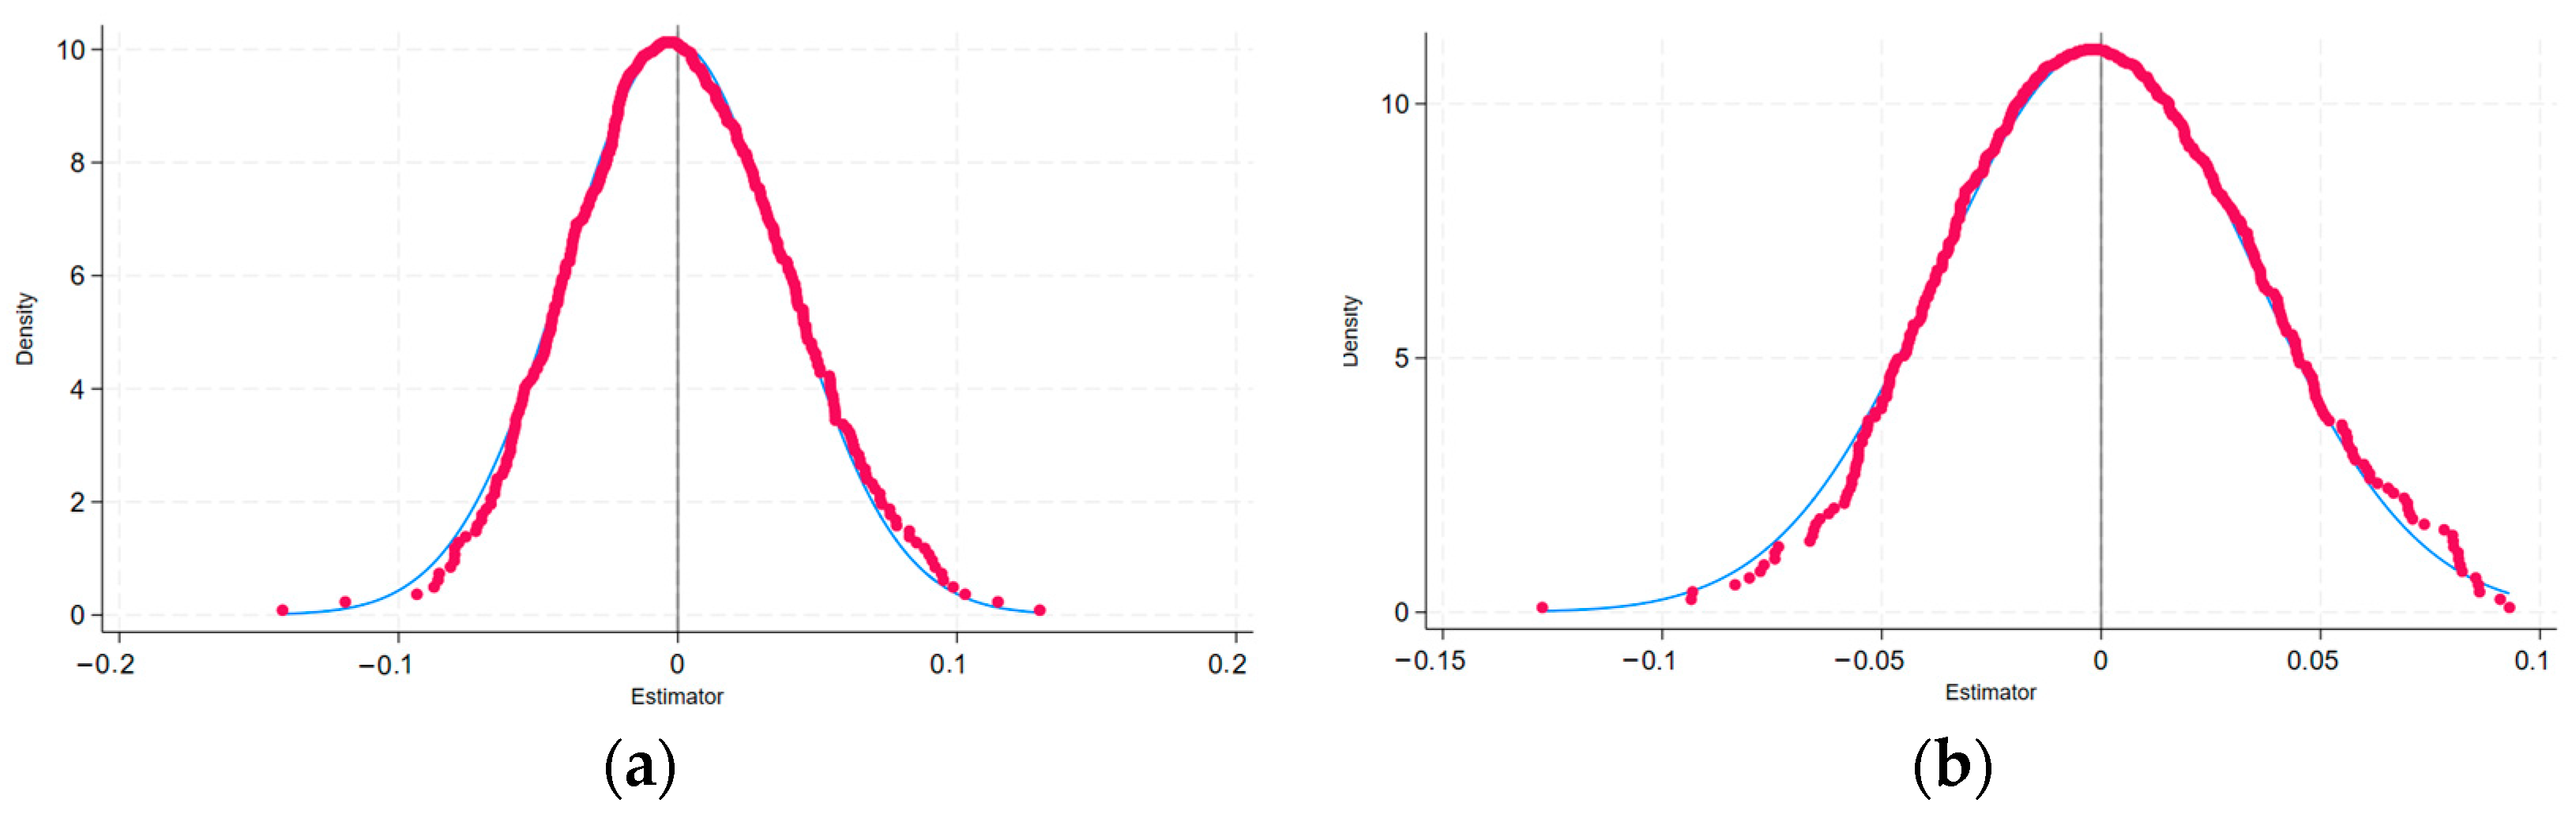
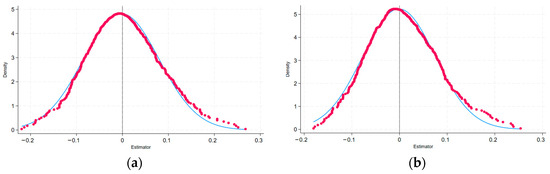
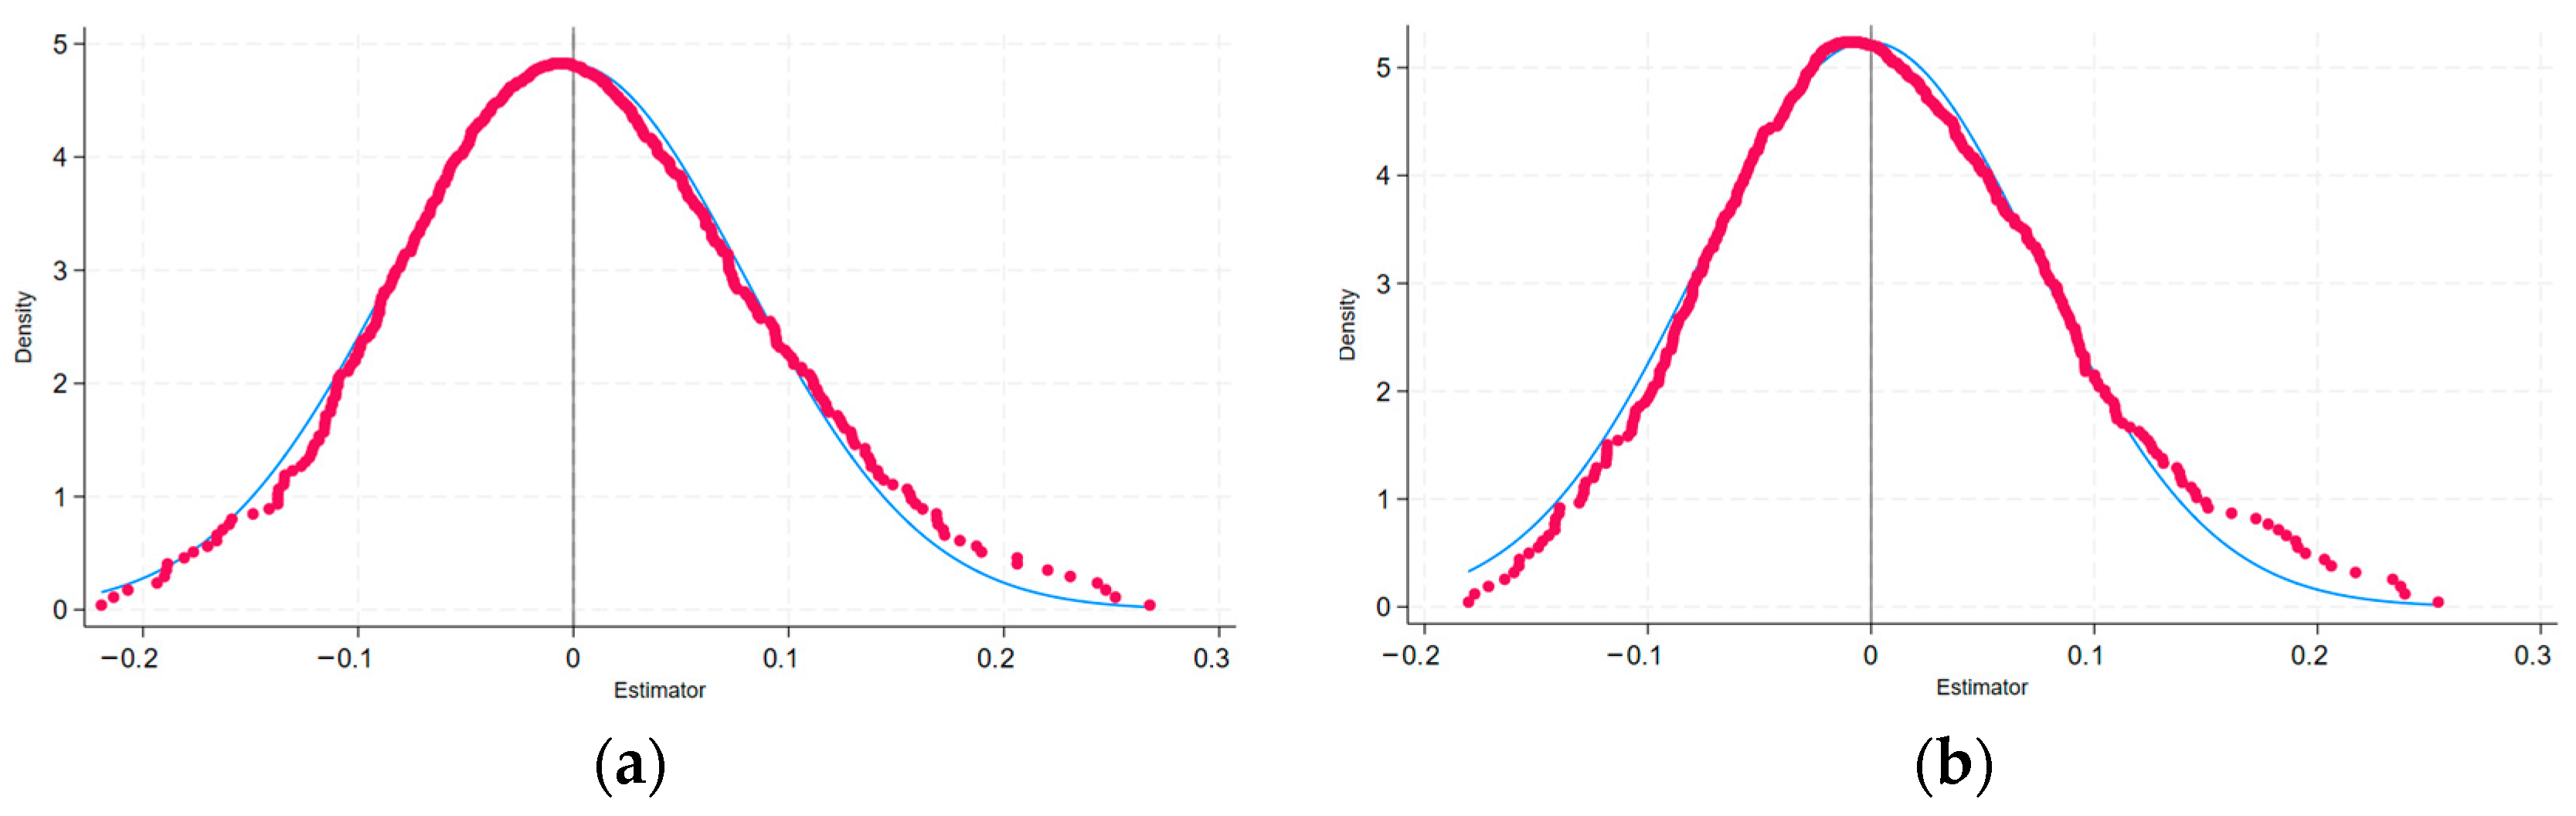
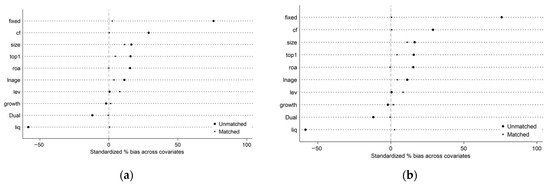
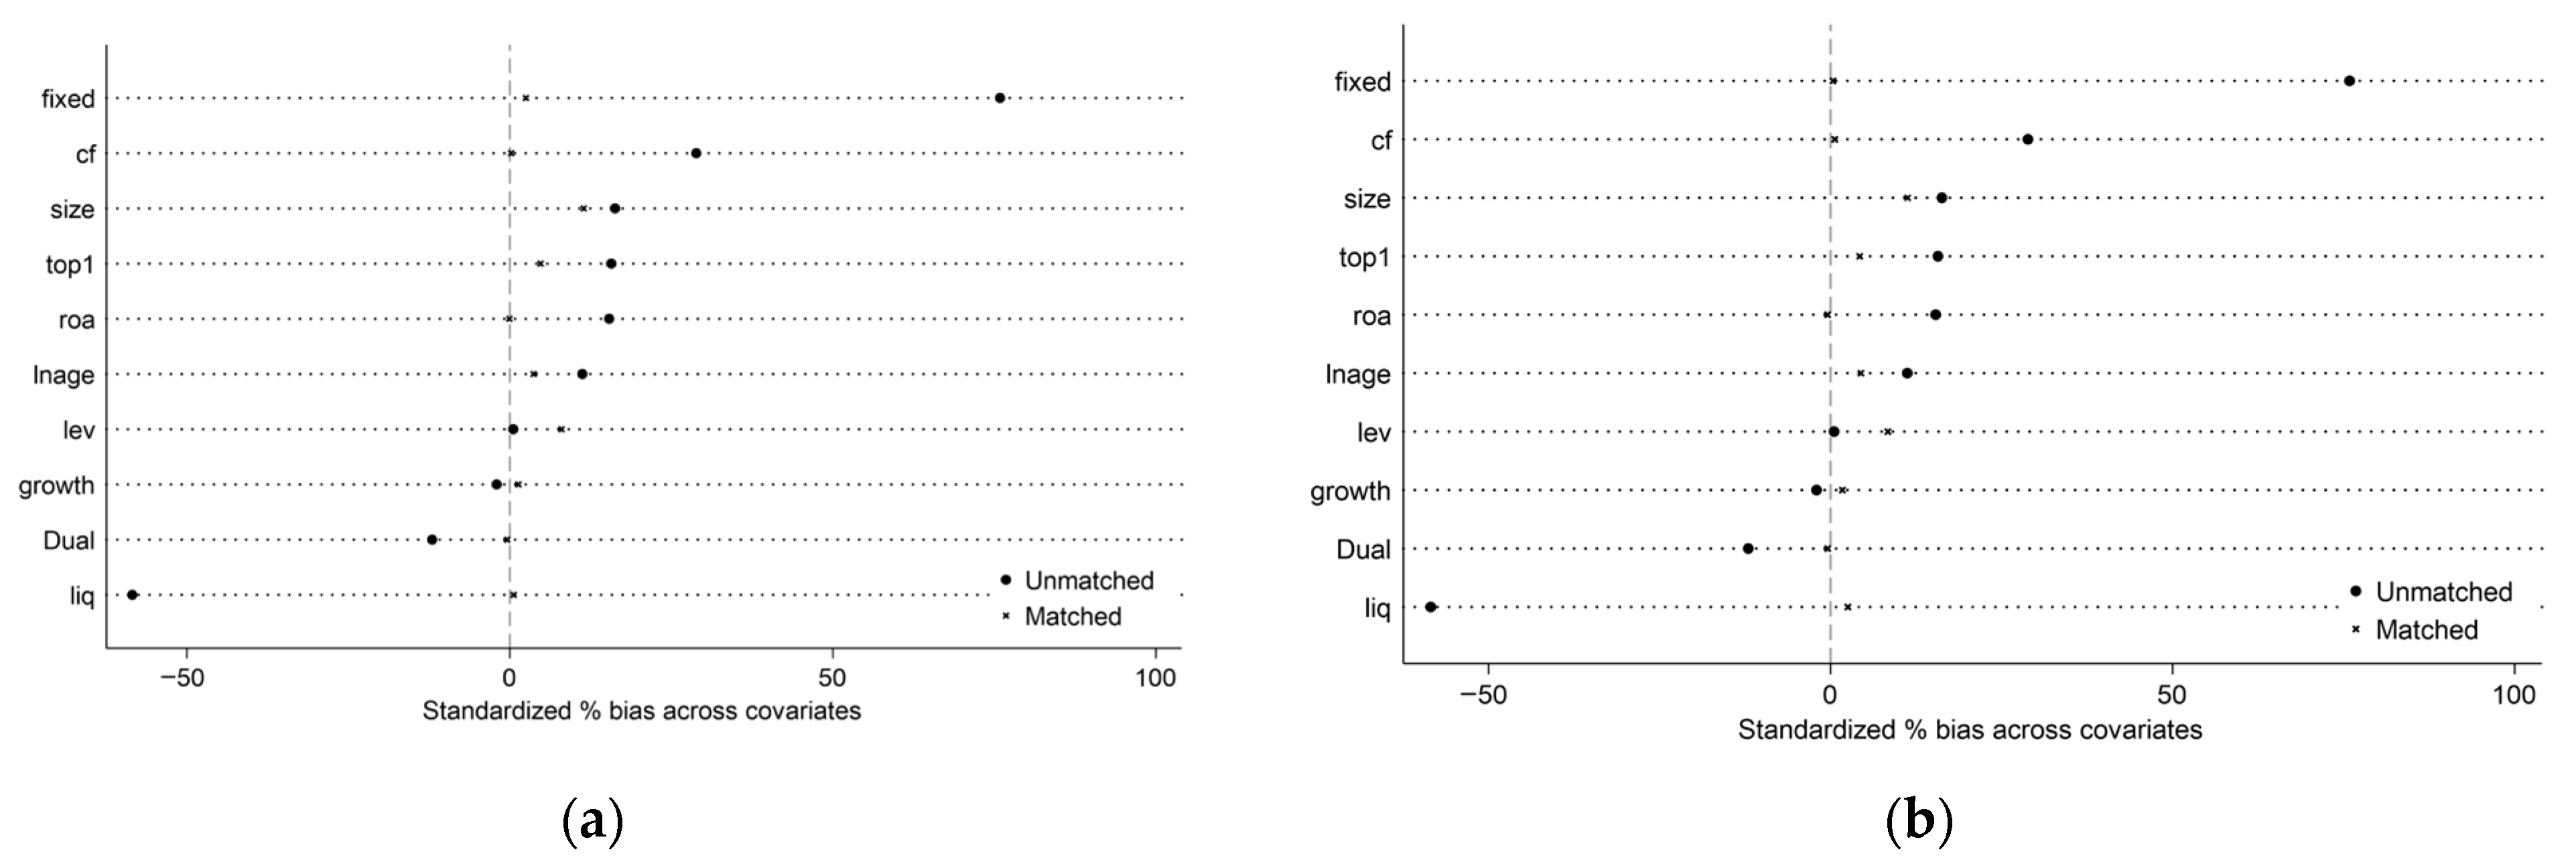
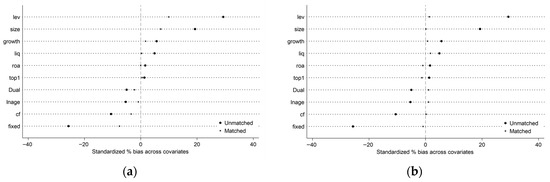

Disclaimer/Publisher’s Note: The statements, opinions and data contained in all publications are solely those of the individual author(s) and contributor(s) and not of MDPI and/or the editor(s). MDPI and/or the editor(s) disclaim responsibility for any injury to people or property resulting from any ideas, methods, instructions or products referred to in the content. |
© 2026 by the authors. Licensee MDPI, Basel, Switzerland. This article is an open access article distributed under the terms and conditions of the Creative Commons Attribution (CC BY) license.