


Abstract
This paper introduces a novel, integrated optimization framework for sustainable multi-site logistics planning, which simultaneously addresses production, inventory, and distribution decisions. The proposed hybrid methodology combines a Genetic Algorithm (GA) with Linear Programming (LP) to minimize total logistics costs while proactively integrating environmental impact assessment. The model determines optimal production schedules across multiple facilities, manages inventory levels, and solves the Vehicle Routing Problem (VRP) for distribution. A key innovation is the incorporation of a CO2 emission forecasting module directly into the optimization loop, allowing the algorithm to anticipate and mitigate the environmental consequences of logistics decisions during the planning phase, rather than performing a post-hoc evaluation. The framework was implemented in Python 3.13.4, utilizing the PuLP library for LP components and custom-developed GA routines. Its performance was validated through a numerical case study and a series of sensitivity analyses, which investigated the effects of fluctuating demand and key cost parameters. The results demonstrate that the inclusion of emission forecasting enables the identification of solutions that achieve a superior balance between economic and environmental objectives, leading to significant reductions in both total costs and predicted CO2 emissions. This work provides practitioners with a scalable and practical decision-support tool for designing more sustainable and resilient multi-echelon supply chains.
1. Introduction
Contemporary global supply chains face mounting complexity driven by three interconnected challenges: heightened market volatility, escalating demand uncertainty, and urgent pressures for environmentally responsible operations [1]. This triad necessitates more sophisticated planning approaches that simultaneously address economic efficiency and ecological impact. Multi-site logistics systems, in particular, require the joint coordination of production scheduling, inventory control, and distribution planning to ensure both economic efficiency and service reliability [2]. Traditional supply chain models typically optimize production, inventory, and distribution decisions sequentially or in isolation, resulting in suboptimal system-wide performance and elevated operational costs [3,4]. This fragmented approach fails to capture critical interdependencies between manufacturing constraints and distribution efficiency, particularly in multi-site configurations where geographical dispersion introduces additional complexity. As industries navigate the transition toward greener operations, integrating sustainability considerations into tactical and operational decision-making has become a fundamental requirement [5].
Transportation represents one of the largest contributors to CO2 emissions in logistics networks, accounting for nearly one quarter of global energy-related emissions [6]. Consequently, green logistics and low-carbon supply chain design have received increasing academic attention [7]. Numerous studies have examined sustainable variants of the Vehicle Routing Problem (VRP), incorporating fuel consumption models, emission factors, and eco-efficient routing strategies [8,9,10]. However, a significant limitation persists in current sustainable logistics research: environmental performance is typically evaluated post hoc rather than being embedded within the optimization process itself, as most studies treat supply chain optimization and environmental impact assessment as separate sequential steps rather than integrated decision variables within a unified optimization model [11,12]. This reactive approach prevents decision-makers from proactively shaping logistics strategies to minimize carbon footprint during the planning stage, thereby missing substantial emission reduction opportunities. At the same time, integrated production–distribution planning has emerged as a promising avenue for improving supply chain performance. Models that jointly optimize production quantities and downstream delivery flows can significantly reduce total system costs and improve service levels [13]. Yet, many existing works either assume simplified routing structures or ignore environmental impacts altogether. In parallel, research on green VRP has typically focused on distribution alone, without linking routing outcomes to upstream production feasibility or multi-site coordination. This fragmentation underscores a persistent gap in the literature: the lack of holistic, emission-aware optimization approaches that simultaneously address production, inventory, and routing decisions in a unified framework.
To address this gap, the present study introduces a hybrid optimization framework that integrates multi-site production planning, inventory management, and capacitated VRP routing within a single decision-support model. The proposed approach combines Linear Programming (LP) for production–inventory optimization with a Genetic Algorithm (GA) for solving the VRP, while embedding a proactive CO2 emission forecasting module directly into the optimization loop. This integration enables the model to evaluate carbon impacts during the decision-making process rather than after the fact, supporting more sustainable and cost-efficient logistics strategies.
The main objective of this work is to demonstrate that coupling integrated supply chain planning with emission-aware routing leads to measurable improvements in both economic and environmental performance. A numerical case study validates the proposed methodology under uncertain demand and realistic operational constraints. The results highlight significant reductions in total logistics costs and projected CO2 emissions, emphasizing the practical relevance of hybrid models for building resilient and sustainable multi-echelon supply chains.
The primary contributions of this work are threefold:
- Methodological: The development of a novel hybrid GA-LP framework that seamlessly integrates tactical and operational planning with proactive environmental assessment.
- Practical: The demonstration, via a comprehensive case study, that this integration leads to significant, quantifiable improvements in both economic performance (cost) and environmental performance (CO2 emissions) compared to traditional sequential methods.
- Managerial: The provision of actionable insights through sensitivity analysis on key parameters like vehicle capacity and demand allocation, elucidating the critical trade-offs between cost, service, and sustainability.
2. Literature Review
Although supply chain optimization has received extensive attention, most existing studies continue to treat production planning and distribution decisions separately, particularly in multi-site and multi-demand environments where coordination is crucial.
At the same time, sustainability has become a fundamental dimension of modern logistics systems, driven by increasing regulatory pressure, carbon taxation, and corporate environmental commitments [14]. As CO2 emissions from production and transportation represent a major share of total environmental impact, integrating sustainability into operational planning is now essential to designing resilient and responsible supply chains [15].
Several studies in the literature focus exclusively on transportation and distribution planning, without integrating production or inventory decisions. Carotenuto et al. [16] developed a planning model for the retail distribution of fuel oils, aiming to optimize routing and delivery scheduling within a downstream logistics network. Carrese et al. [17] optimized downstream fuel transport by integrating road-condition data and accident-exposure factors into routing decisions, leading to improved cost performance, higher safety levels, and greater resilience of transport operations. A recent contribution also examines the Vehicle Routing Problem as a central component of logistics systems, providing a comprehensive overview of VRP variants and solution algorithms developed over the past two decades, and focusing exclusively on transport and fleet-distribution optimization [18].
Furthermore, a significant body of research investigates transportation and distribution systems in relation to carbon emissions, highlighting the growing importance of sustainability in logistics operations. Pinar [19] addresses a Vehicle Routing Problem with time windows by integrating real-route data from Google Maps and graph-based routing methods, explicitly analyzing the impact of vehicle speed, customer demand, and route selection on CO2 emissions during distribution operations. Jemai et al. [20] examined a Green Vehicle Routing Problem in which transportation routes are optimized to reduce both travel distance and CO2 emissions, providing one of the key references on sustainable distribution planning. Yao et al. [21] examined a low-carbon VRP that minimizes distribution costs and CO2 emissions by accounting for speed-dependent emission factors.
Several studies in the literature focus on the integrated coordination of production and distribution without considering environmental or routing-related aspects. Diaz et al. [22] propose an integrated framework that jointly optimizes production planning and inter-site transportation in a multi-site fuel supply system, coordinating production decisions with transfer flows under stochastic demand conditions. Diaz et al. [23] developed an integrated production and distribution model for a multi-site fuel system, where production planning and inter-site deliveries are optimized under forecasted demand. Another related contribution examines an integrated approach to production planning and collaborative inter-site distribution under stochastic demand, where random search methods and genetic algorithms are used to coordinate production decisions while mitigating shortages across a multi-site network [24]. A recent data-driven study [25] proposes an integrated framework that jointly optimizes production planning and collaborative inter-site distribution in a multi-site supply chain, using deep learning models to forecast demand and support coordinated production–distribution decisions.
While previous studies have explored production–distribution integration or green vehicle routing independently, few have examined the synergistic potential of combining these domains with proactive CO2 emission forecasting. This review thus identifies a clear gap in the literature for models that simultaneously address production, inventory, and detailed routing decisions while integrating environmental objectives. Table 1 provides a synthesis of recent studies on integrated and sustainable logistics planning, embedding representative references within each category. The comparison highlights variations in functional integration, methodological approaches, and the explicit consideration of CO2 emissions, revealing that many existing frameworks either neglect upstream production and inventory decisions or assess environmental impact only after operational planning, often in a simplified manner. Building on these insights, our work proposes a hybrid framework that jointly optimizes production, inventory, and vehicle routing, while proactively incorporating CO2 emissions into the decision-making process, thereby advancing both operational efficiency and environmental sustainability.
Table 1.
Comparative analysis of literature on integrated and sustainable logistics planning.
3. Problem Description and Notations
3.1. Problem Description
The problem addressed in this study concerns the integrated planning of production, inventory, and distribution activities within a multi-site logistics network. The system consists of several production facilities and a set of geographically dispersed customers with heterogeneous demand profiles. Each facility operates under capacity constraints and produces finished goods that can be stored on site or delivered directly to customers. The planning horizon is divided into multiple periods, during which production quantities, inventory levels, and shipment decisions must be jointly optimized.
Customer demand varies across periods and must be satisfied either by direct deliveries or, if necessary, through controlled shortages, which incur penalty costs. Inventory is carried over from one period to the next and is subject to holding costs. Production at each facility must remain within specified minimum and maximum levels, reflecting operational constraints such as workforce availability, machine capacity, and energy usage. A key characteristic of the distribution component is that each customer may be supplied by any facility. To promote efficiency and sustainability, deliveries are naturally encouraged to originate from the closest facility, based on predefined distance data. Transportation decisions therefore depend not only on production availability but also on the relative proximity between sites and customers. Shipments are executed using a limited fleet of vehicles with fixed capacity, and the total delivered quantity cannot exceed the available vehicle capacity in each period. Once production and allocation quantities are determined, the routing of vehicles is optimized through a Genetic Algorithm (GA) that solves a capacitated Vehicle Routing Problem (VRP). The GA determines the sequence of customer visits and constructs vehicle routes that minimize total travel distance while respecting vehicle capacity constraints and emission targets. Euclidean distances based on customer coordinates are used for routing optimization.
Environmental sustainability is also incorporated into the model. Carbon emissions are estimated directly from transportation activities, assuming that emissions are proportional to the traveled distance and transported quantity. This allows the framework to quantify the environmental footprint of logistical decisions and enables the exploration of trade-offs between economic and ecological performance.
The overall goal of the problem is to determine optimal production levels, inventory trajectories, delivery quantities, and vehicle routes that jointly minimize total operational costs, including production, storage, transportation, vehicle usage, and shortage penalties, while also accounting for CO2 emissions. This integrated formulation captures the interdependencies between manufacturing, storage, and distribution activities, providing a holistic representation of real-world multi-site supply chain planning.
3.2. Notation
The following notation summarizes all parameters and decision variables used in the integrated production–inventory–distribution optimization model.
Sets
s ∈ S: set of production sites
c ∈ C: set of customers
k ∈ K: set of planning periods
Parameters
Demand_{c,k}: demand of customer c in period k
d_{s,c}: distance between production site s and customer c
Cprod_s: unit production cost at site s
Cstock_s: inventory holding cost at site s
Cliv_{s,c}: transportation cost per unit delivered from site s to customer c
Cveh_s: cost of using one vehicle at site s per period
Cpen_c: shortage penalty per unit of unmet demand for customer c
Capveh: vehicle load capacity
U(min)_s, U(max)_s: minimum and maximum production limits of site s
z: safety factor for service level (e.g., z = 1.65 for 95%)
dem_k: expected demand in period k
σ_k: standard deviation of demand in period k
EF: CO2 emission factor (kg CO2 per unit-km)
CCO2: carbon tax or monetized CO2 cost (€/kg CO2)
M: large constant used for logical constraints
θ: service level
Decision variables
Prod_{s,k} ≥ 0: production quantity at site s in period k
Stock_{s,k} ≥ 0: inventory at site s at the end of period k
Deliver_{s,c,k} ≥ 0: quantity delivered from site s to customer c in period k
Shortage_{c,k} ≥ 0: unmet demand of customer c in period k
NBveh_{s,k} ∈ ℕ: number of vehicles used by site s in period k
VehUsed_{s,k} ∈ {0,1}: binary variable indicating if site s uses at least one vehicle in period k
x_{s,c,k} ∈ {0,1}: binary indicator that site s serves customer c in period k
4. Production, Distribution, and CO2 Emissions Approach
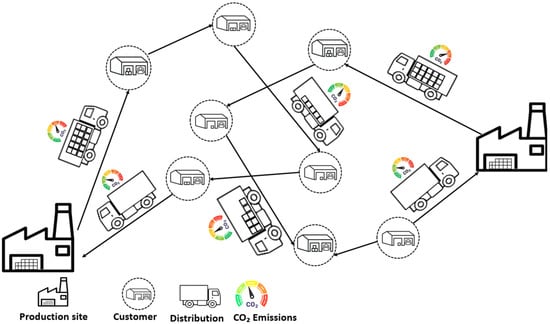
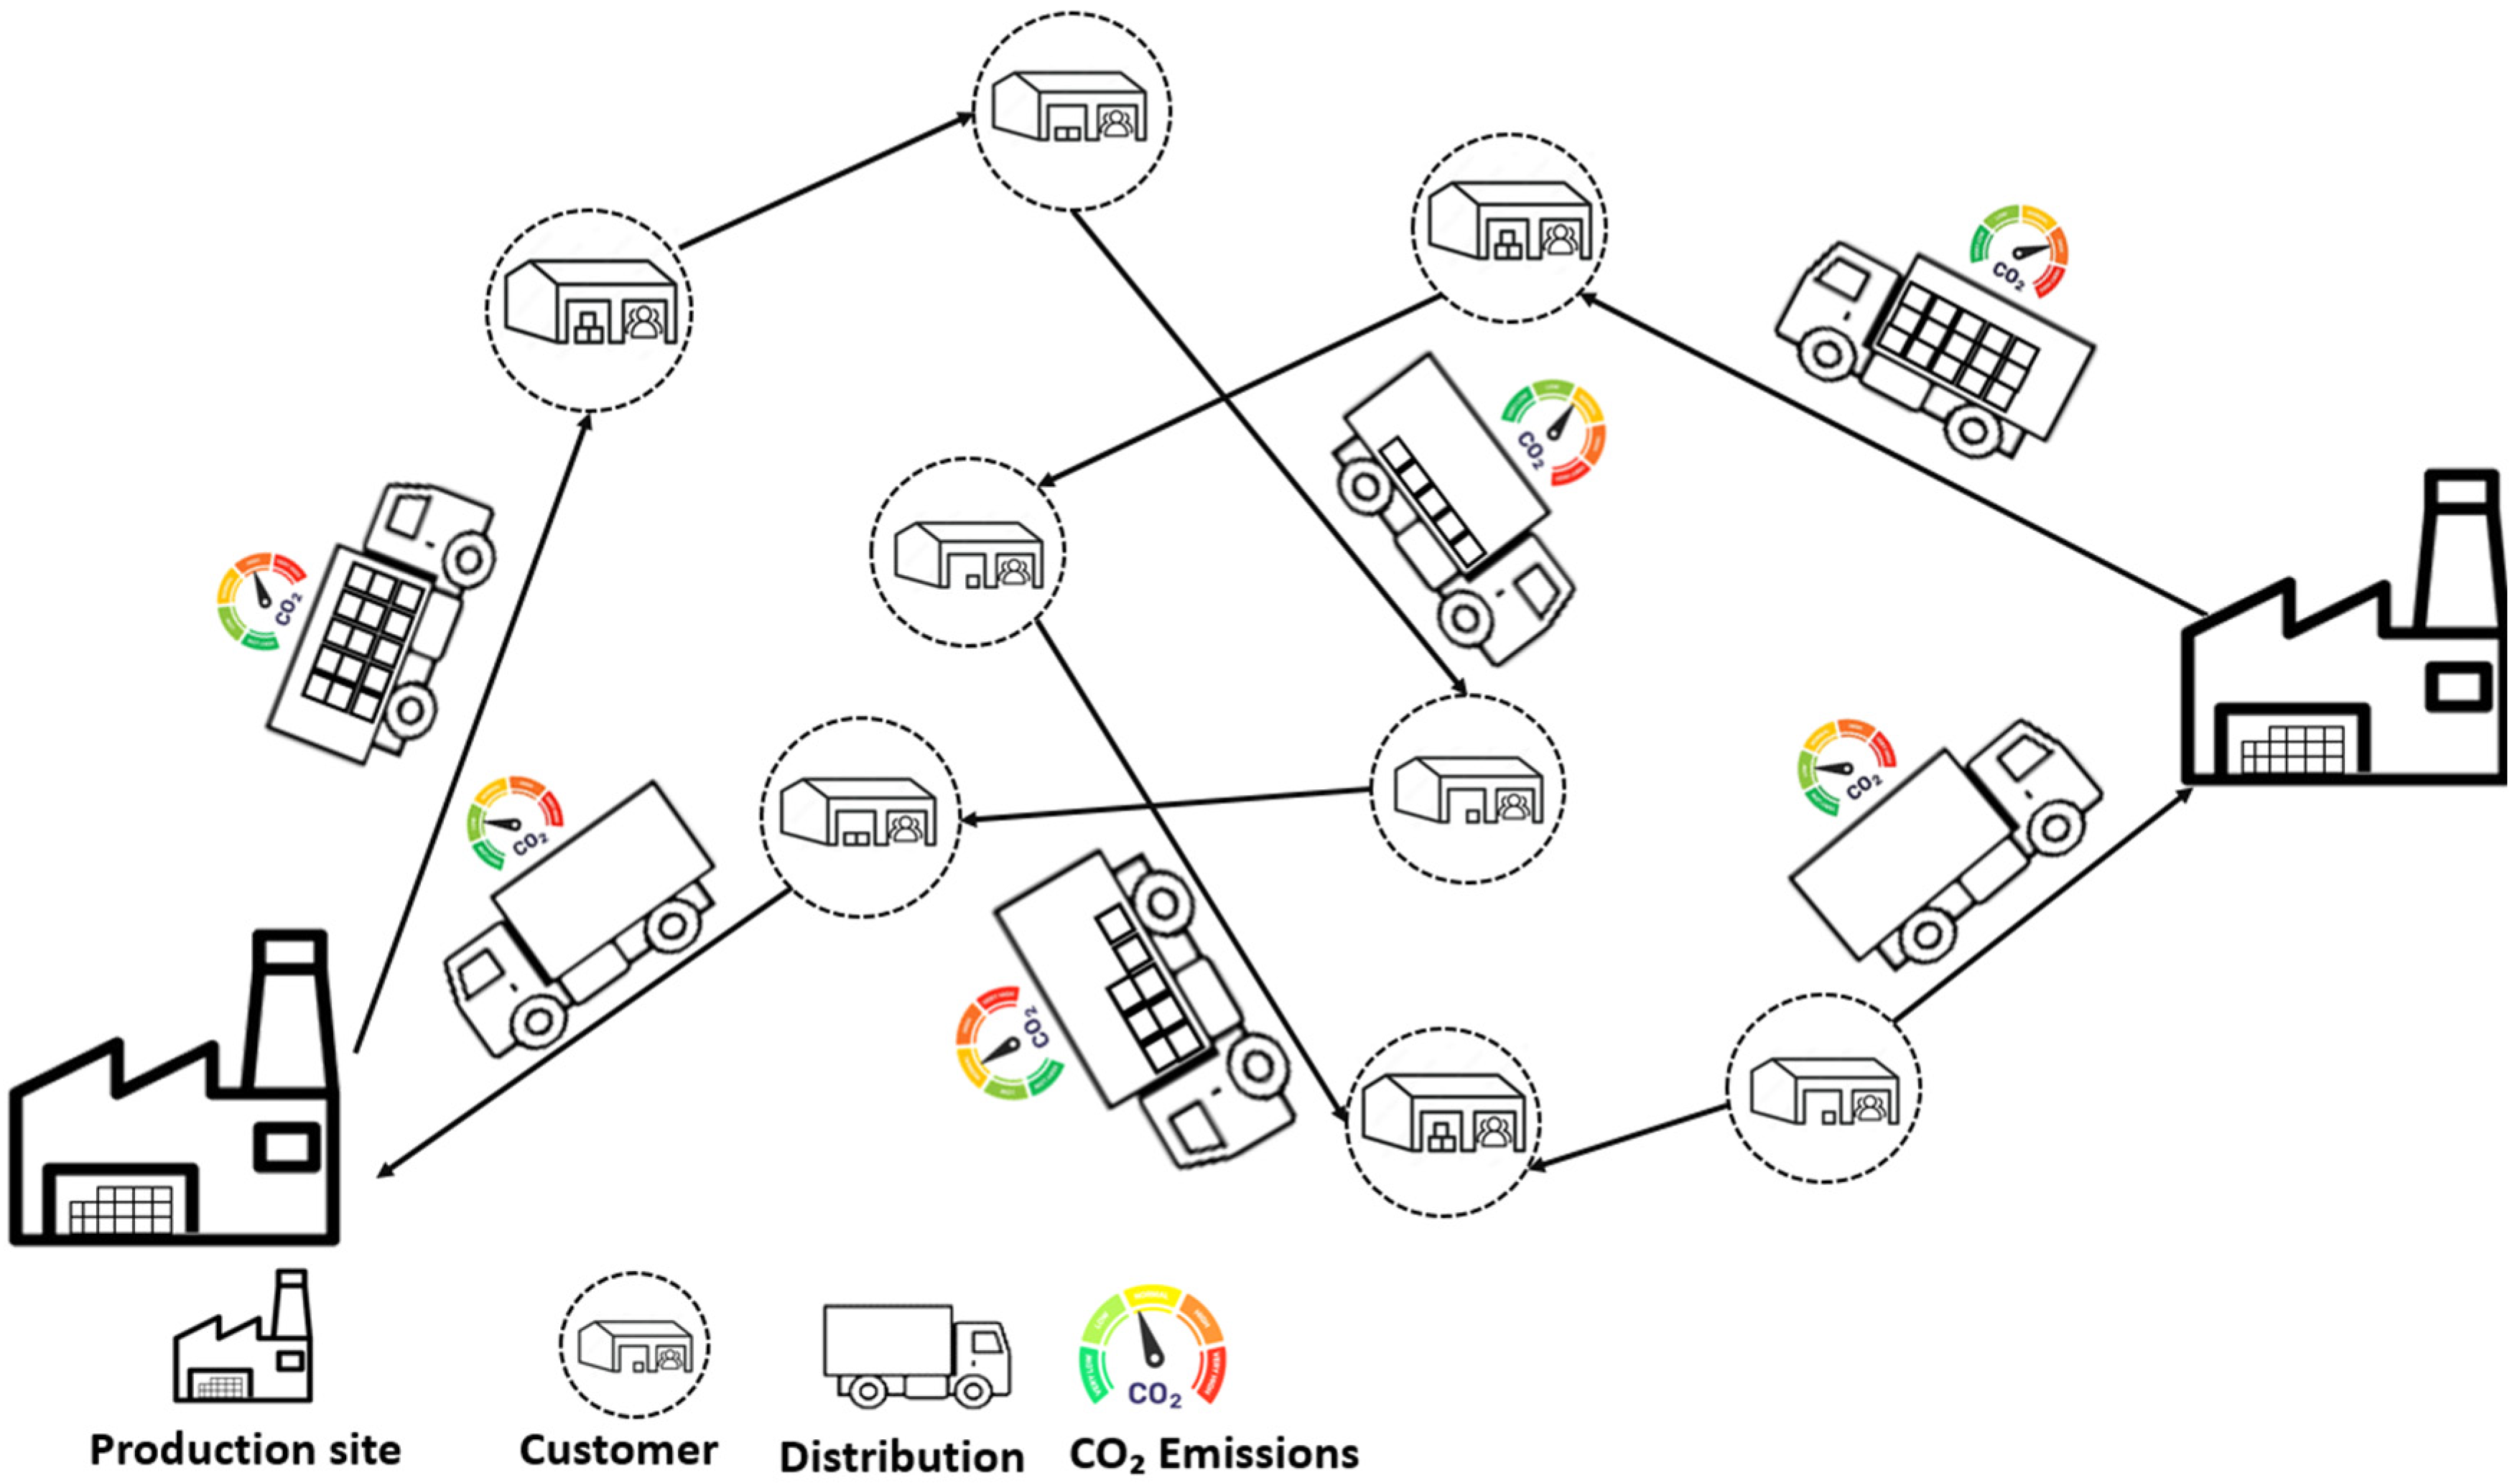
The proposed integrated optimization framework as presented in Figure 1 aims to enhance the sustainability performance of multi-site production–distribution systems.
Figure 1.
Illustration of CO2 Problem in VRP.
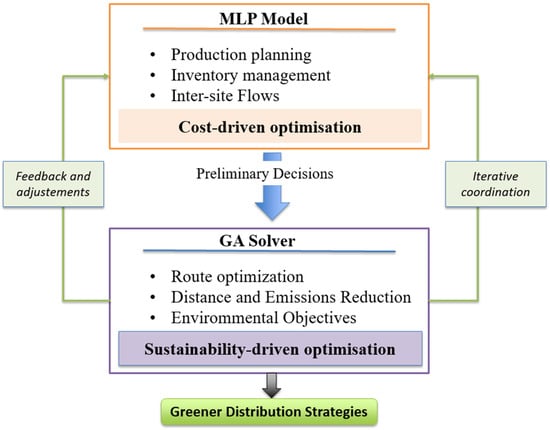
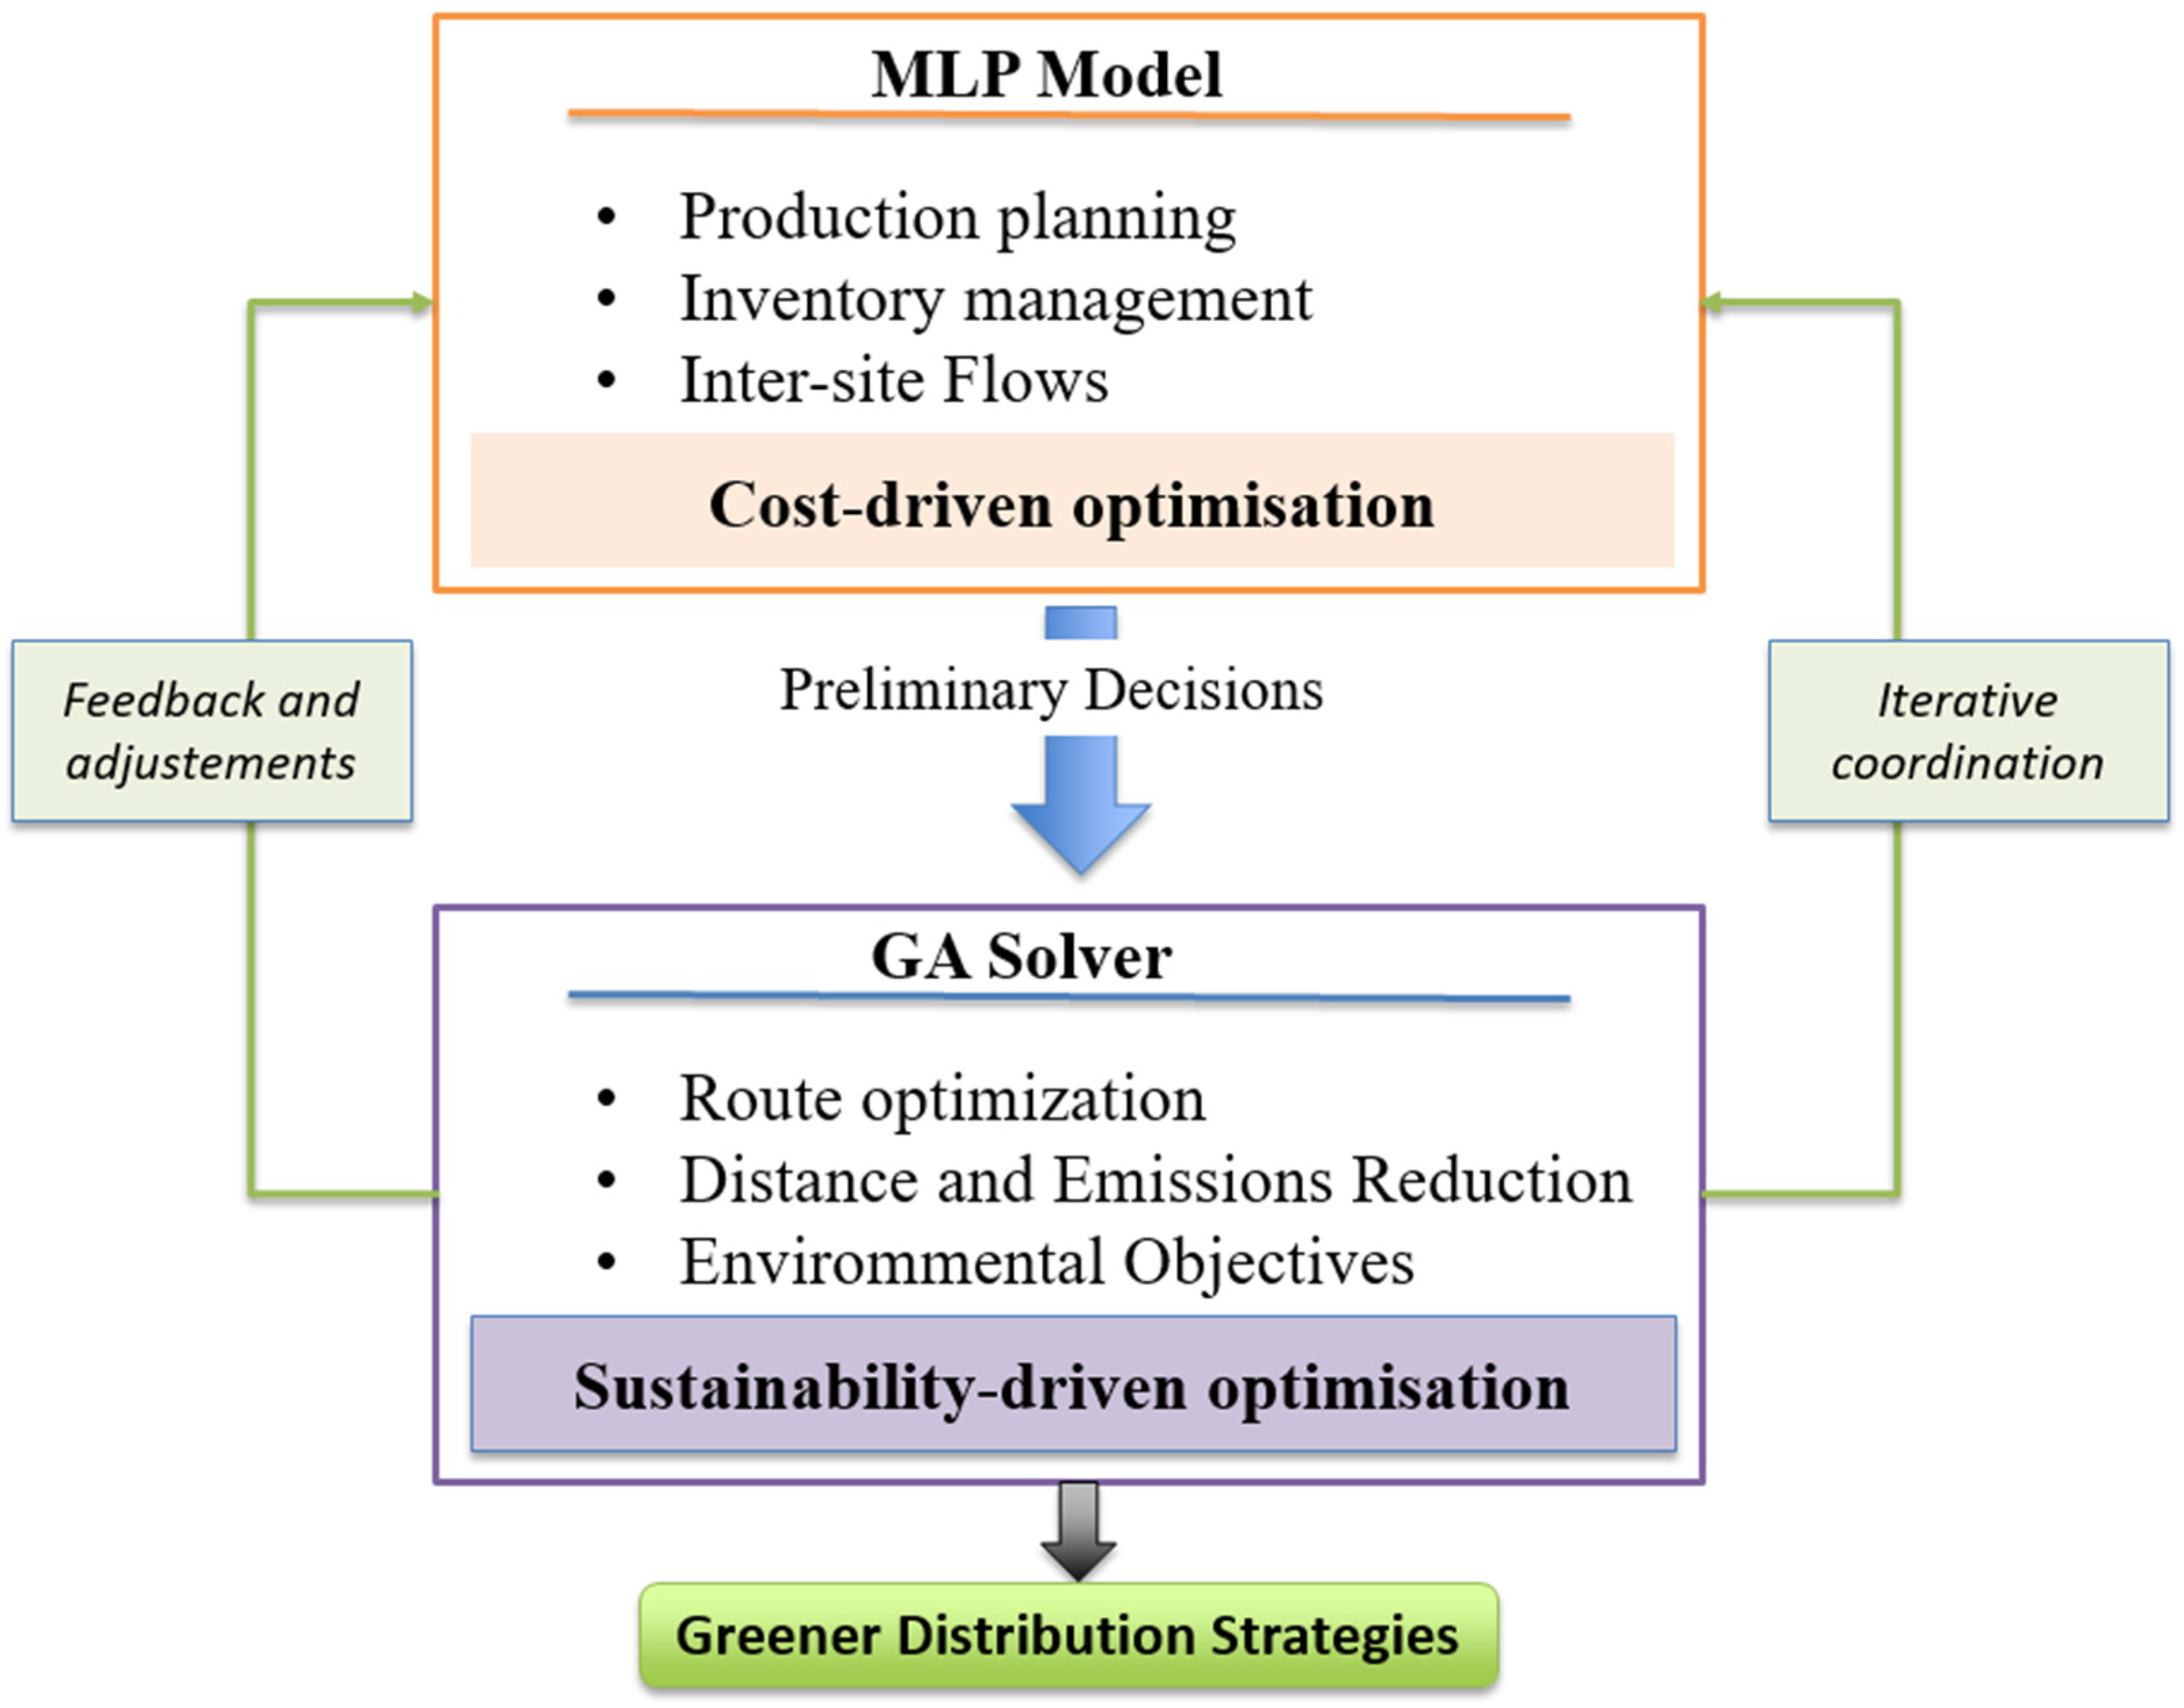
This study adopts a two-level hybrid structure combining a Mixed-Integer Linear Programming (MILP) model with a Genetic Algorithm (GA), an approach increasingly emphasized in the literature to handle the multi-dimensional complexity of sustainable supply chain planning. Figure 2 presents an overview of the integrated MILP–GA framework for joint optimization of production, inventory, distribution, and CO2 emissions.
Figure 2.
Integrated MILP–GA Framework for Supply Chain Optimization.
Figure 2 shows that the MILP model constitutes the upper decision layer and focuses exclusively on cost-driven operational coherence by determining production quantities, inventory levels, and inter-site flows under resource capacities, demand constraints, and temporal feasibility. This deterministic optimization stage does not explicitly integrate CO2 emissions; instead, it ensures that production and inventory decisions create a stable and operationally feasible foundation for subsequent sustainability-oriented routing. The outputs generated by the MILP—preliminary flows, customer–site assignments, and shipment quantities—are then transferred to the GA Solver, which addresses the routing problem while explicitly incorporating environmental metrics. In this lower-layer optimization, the GA evaluates route feasibility based on vehicle capacity and spatial distribution, and optimizes routing sequences with the objective of reducing total traveled distance, improving load consolidation, and minimizing transport-related emissions. By relying on evolutionary operators capable of exploring non-linear, multi-objective search spaces, the GA can generate routes that balance operational cost with environmental performance indicators such as estimated CO2 emissions, fuel consumption, and distance-dependent ecological impact.
The iterative coordination between the cost-oriented MILP stage and the sustainability-driven GA stage enables a coherent and operationally realistic optimization process. This hybridization allows the framework to approximate environmental benefits that would be computationally prohibitive to integrate directly into a monolithic MILP model, as demonstrated by hybrid metaheuristic approaches that combine MILP with algorithms such as GA to effectively solve large-scale location-inventory-routing problems where exact MILP alone is infeasible [35]. As a result, the proposed methodology supports the design of greener distribution strategies, enhances energy efficiency across the logistics chain, and aligns the decision-making process with the sustainability goals increasingly required in contemporary supply chain research and practice.
5. Production, Distribution, and CO2 Emissions Analytical Model
Managing production, distribution, and associated CO2 emissions in a multi-site, multi-demand system represents a complex challenge due to the stochastic nature of customer demand. Demand is considered stochastic and time-varying. It is modeled using a normal distribution characterized by a given mean and standard deviation, which reflects typical demand fluctuations observed in supply chain operations. This assumption is commonly adopted when demand variations are centered around an expected value.
An integrated planning strategy is therefore required to simultaneously coordinate production schedules and inter-site distribution, ensuring that customer requirements are met efficiently while minimizing environmental impact.
The objective function is to minimize the total cost, which includes production costs (Γprod), which include manufacturing inventory and shortage cost, distribution cost (Γdist), and the cost associated with CO2 emissions (Γemission) as presented in Equation (1):
5.1. Production
The production approach aims to minimize the total costs of manufacturing, storage, and shortages in a multi-site system. The simulated supply chain consists of several production sites S, and several customers randomly distributed in a two-dimensional plane. The planning horizon covers 24 periods, which may represent days, weeks, or months depending on the industrial context. Each production site is characterized by minimum and maximum feasible production levels, reflecting technological limits and operational constraints. The horizon is equally divided into production periods, each of duration Δt, with each site equipped with a storage system to meet its own demand, address requests from other sites in case of shortages, and store surplus inventory.
Within the framework of a collaborative production policy between sites, each site produces not only to satisfy its own demand but also to fulfill the requirements of other sites, ensuring a specified service level. In a competitive industrial environment, maintaining this service level is crucial for sustaining high demand, anticipating fluctuations, standardizing production planning, and maximizing profitability. Accordingly, this study proposes a novel approach to solving the production problem by formulating the service level as the probability of maintaining a maximum storage level in each period. The objective of this production policy is to establish an analytical model capable of generating an optimal production plan for each site, characterized by the quantity produced in each period k, minimization of total manufacturing, shortage, and storage costs across the multi-site system, and satisfaction of stochastic demand under the given service level. This extended model provides a robust framework for evaluating production responsiveness under uncertainty while supporting strategic decision-making in multi-site industrial operations. To account for demand uncertainty in the planning process, safety stock and demand coverage constraints are included in the model. These constraints help maintain the required service level and reduce the risk of stockouts and production disruptions under demand variability.
The production capacity constraint ensures that the production quantities at each site remain within the minimum and maximum feasible limits, reflecting technological and operational restrictions.
- Production constraints
- -
- Production capacity constraint
Production quantities must respect operational limits.
- -
- Demand satisfaction with possible shortage
This equation ensures that customer demand is either met by deliveries or recorded as a shortage. The variable is a decision variable representing unmet demand.
- -
- Service level constraint
The service-level constraint is derived to ensure that, for each production site s and period k, the probability of meeting demand, before accounting for potential shortages (Equation (3)), is at least equal to the target service level θ.
The service-level constraint is not directly applied to the shortage variable, but rather to the total supply available before allocation. It ensures that, with probability θθ, the total available quantity (inventory + production) at a site is sufficient to cover the uncertain demand it is responsible for.
The requirement is:
where: is the total uncertain demand assigned to site s in period k. In the proposed framework, customer demand is uncertain and modeled as a normally distributed random variable: . Where and are the mean and standard deviation of demand for period k. Under this assumption, the deterministic constraint (4) is obtained from the probabilistic requirement that production plus inventory must cover demand with a given probability θ.
where:
- (mean demand assigned to site s)
- (standard deviation of demand at site s)
- is the z-score (robustness coefficient) for service level θ (e.g., z = 1.28 for θ ≈ 90)
For example, with = 200 units, = 30 units, z = 1.28 (θ ≈ 90% service level), and = 50 units, the required production is ≥ 239 units. This formulation ensures production plus inventory sufficiently covers demand while accounting for uncertainty.
- -
- Stock balance constraint
This ensures inventory continuity. If total deliveries exceed available supply, the shortage will appear on the customer side via Equation (3).
- Total production cost
5.2. Distribution
The distribution approach is designed to facilitate effective collaboration within a multi-site system, simultaneously enhancing product availability, improving customer satisfaction, and maximizing overall profitability. Its primary objective is to prevent shortage-related penalties while optimizing production levels and minimizing transportation costs.
The operational framework incorporates several key constraints to ensure feasibility and efficiency. The stock balance constraint ensures that inventory in the next period equals the current inventory plus production minus shipments to customers; if deliveries exceed available stock, shortages are recorded on the customer side. The vehicle capacity constraint guarantees that the total quantity shipped from a site during a period does not exceed the transport capacity, determined by the number of vehicles and their individual capacities. Customer demands are addressed through the demand satisfaction constraint, which ensures that each demand is either met by deliveries or recorded as a shortage, providing an accurate account of unmet needs. To maintain reliability, a service level constraint is imposed, requiring that production combined with available stock covers expected demand plus a safety stock calculated from the desired service level and demand variability.
The model further promotes efficiency through a distance-based assignment constraint, which stipulates that customers are first served by the nearest site; more distant sites can only supply demand if the closest site cannot meet it. This prevents inefficient shipments from remote facilities. Finally, non-negativity and initialization constraints ensure that production, stock, deliveries, and shortages remain non-negative, with initial stock levels that can be equal to zero or different. Together, these constraints establish a robust framework that effectively balances production, inventory, and distribution operations while maintaining service reliability, operational efficiency, and responsiveness to demand variability.
- Distribution constraints
- -
- Vehicle capacity constraint
Total shipped quantity cannot exceed the transport capacity available at the site during the period.
- -
- Priority to the nearest site (distance-based assignment)
A customer must be served first by the closest site; distant sites can serve only when the nearest site does not.
This constraint avoids illogical or inefficient shipments from distant facilities.
- Distribution cost
5.3. Sustainability Integration (CO2 Emissions Modeling)
The transportation component of the logistics system contributes directly to CO2 emissions, which are considered in the model to promote sustainable operations. In the linear optimization model, emissions are calculated as a function of the quantity delivered, the distance traveled, and an emission factor, with each shipment contributing proportionally to total CO2 output [26]. At a more detailed level, after determining delivery routes using the Genetic Algorithm, emissions are refined based on actual traveled distances and vehicle load factors, providing a more accurate assessment of environmental impact. By integrating these calculations, the model allows the evaluation and minimization of transportation-related emissions while ensuring that production and distribution objectives, including service levels and operational efficiency, are met.
The underlying assumption is that emissions are proportional to both the distance travelled and the transported quantity. For each delivery from site to customer during period , CO2 emissions are computed as:
These emissions are then transformed into an equivalent cost:
This term is added to the objective function, turning the model into an environmentally aware multi-objective optimization problem.
6. Genetic Algorithm for Customer Assignment and Routing
For each site and production period, the Genetic Algorithm (GA) is applied to determine the optimal assignment of customers to vehicle routes while respecting operational and logistical constraints:
- -
- Vehicle capacity: no route can exceed the maximum allowed load.
- -
- Maximum number of routes: limited to two routes per period.
- -
- Minimal route distance: routes are optimized to reduce total travel distance.
- -
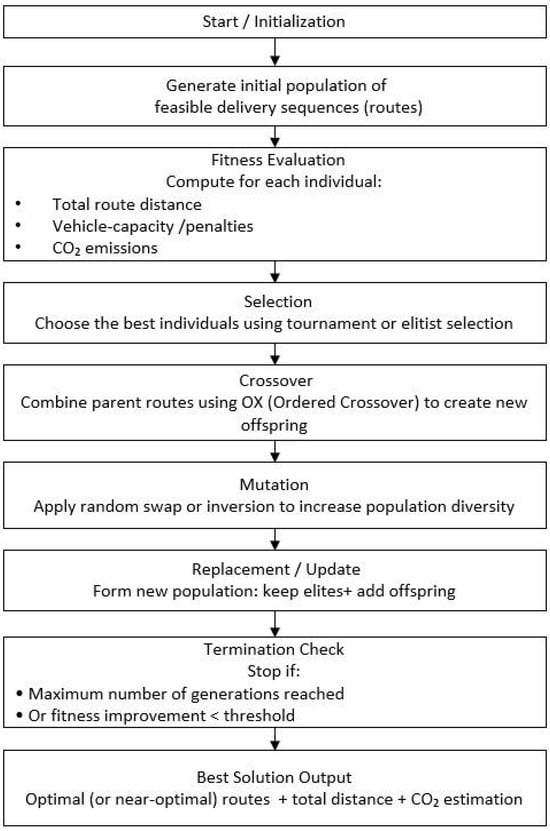
- Chromosome Representation. Each chromosome encodes a complete routing solution for a site in a given period. Genes represent the sequence of customers assigned to each route, and the chromosome structure ensures feasibility with respect to vehicle capacity and maximum route constraints.
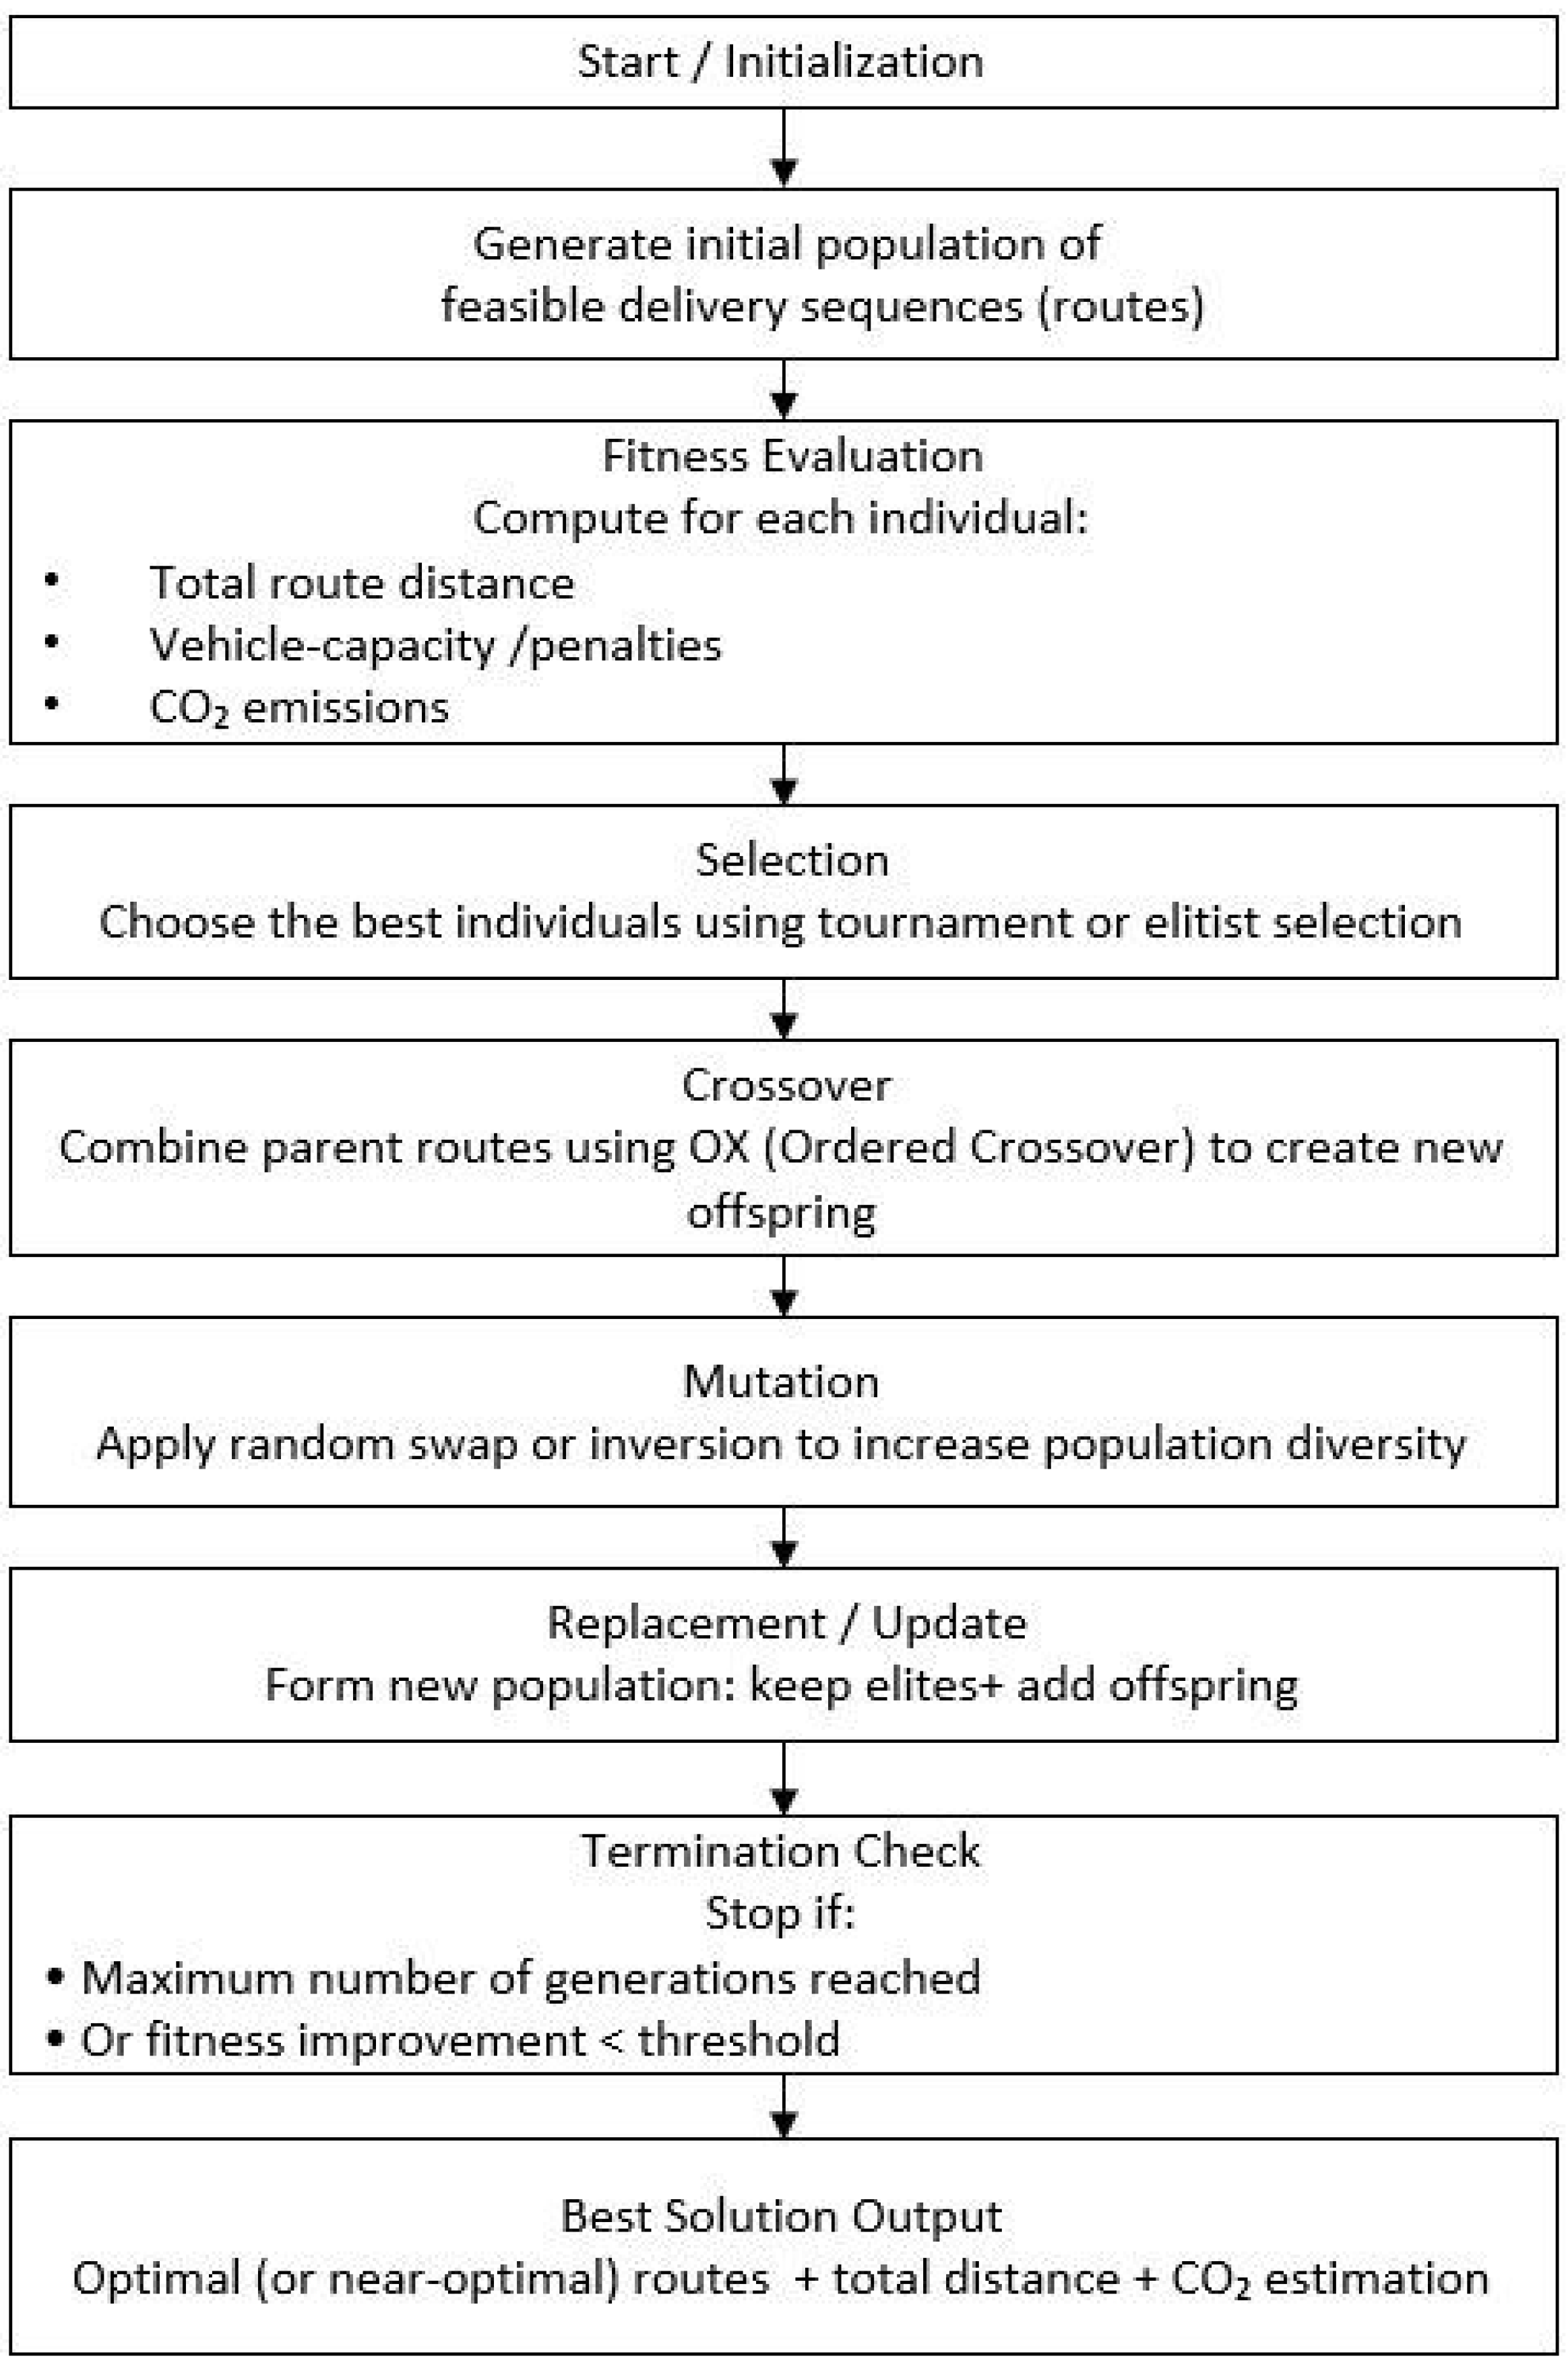
An illustrative diagram of the GA structure, including chromosome encoding, evolutionary operators, and the fitness evaluation process, is provided in Figure 3 to facilitate understanding of the proposed approach (Figure 3)
Figure 3.
Genetic Algorithm Workflow for the Routing Optimization Process.
- Population Initialization. The initial population is generated randomly, but all individuals satisfy the basic operational constraints. This ensures that infeasible routes are not considered at the beginning of the evolution process.
- Fitness Function. The fitness function evaluates each chromosome based on a combination of three criteria:
- −
- Total route distance: shorter routes receive higher fitness.
- −
- Overflow penalties: solutions violating vehicle capacity or route constraints are penalized.
- −
- Environmental impact: CO2 emissions are estimated proportionally to route distances, encouraging environmentally friendly solutions.
- Selection. Elitism selection is employed to retain high-quality solutions in the population, ensuring that the best-performing chromosomes are passed to the next generation.
- Crossover. Single-point crossover is applied with a probability of 0.3. This operator combines parent chromosomes to generate offspring while maintaining feasible route sequences.
- Mutation. Mutation introduces diversity by randomly altering customer sequences within routes. Gene values (customer positions) are swapped or reassigned while ensuring that vehicle capacity and route number constraints remain satisfied.
7. Numerical Application
7.1. Numerical Application and Case Study Description
We validate our proposed hybrid framework using a realistic urban last-mile delivery scenario comprising two depots (denoted S1 and S2) serving 30 customers over 24 periods planning horizon (e.g., 24 weeks or 24 working days). This configuration captures essential real-world complexities including production capacity constraints, stochastic demand patterns, spatial distribution challenges, and vehicle routing limitations. All random components were generated with a fixed seed (42) to ensure full reproducibility of the results.
To support the computational experiments, Table 2 and Table 3 summarize the key parameters used in the study. Table 2 reports the main problem-specific parameters related to production, transportation, costs, emissions, and demand coverage requirements. Table 3 presents the configuration of the genetic algorithm employed to solve the vehicle routing problem, including details on population size, crossover and mutation settings, selection method, number of generations, and convergence criteria. Together, these tables provide a clear overview of the numerical and algorithmic settings used to evaluate the proposed hybrid framework.
Table 2.
Key Input Parameters.
Table 3.
Genetic Algorithm Parameters.
7.2. Main Operational and Sustainability Constraints Implemented
- Production bounded between minimum and maximum capacity at each depot and each period
- Inventory balance (continuity) equation
- Vehicle fleet limitation (maximum 2 vehicles per depot per period) with binary activation variables
- Vehicle load cannot exceed 800 units
- Robust joint production + inventory constraint ensuring coverage of the 85th percentile of uncertain demand at confidence level αk
- All customer demand must be either satisfied from available depot stock or penalised (soft constraint on service level)
7.3. Solution Approach
The proposed solution approach addresses a multi-period, multi-depot last-mile delivery system while explicitly considering sustainability in operational decisions. The approach is divided into two complementary stages:
- -
- The tactical-level problem—including production, inventory management, number of vehicles, and approximate delivery quantities—is formulated as a mixed-integer linear program (MILP) and solved using PuLP with the CBC solver (180-s time limit). Key sustainability-related considerations incorporated at this stage include:
- -
- Minimization of CO2 emissions approximated via total delivered quantity multiplied by distances and an emission factor per kilometer.
Optimization of vehicle usage to avoid underutilized trips and reduce excess emissions.
Inventory planning that balances production, storage costs, and service levels to reduce wastage and overproduction.
For each depot–period combination, the client assignments and delivery quantities obtained from the MILP are passed to a genetic algorithm to solve the multi-trip capacitated vehicle routing problem (VRP).
This stage provides:
Realism in tour lengths and load-dependent CO2 emissions, considering vehicle capacities and multiple trips.
Flexibility to explore different routing scenarios that minimize environmental impact while maintaining high service levels.
By combining exact optimization for fleet and production planning with metaheuristic routing for realistic delivery tours, the approach ensures operational efficiency and environmental sustainability, offering actionable insights for logistics managers and urban policymakers aiming to reduce carbon footprint in last-mile delivery operations.
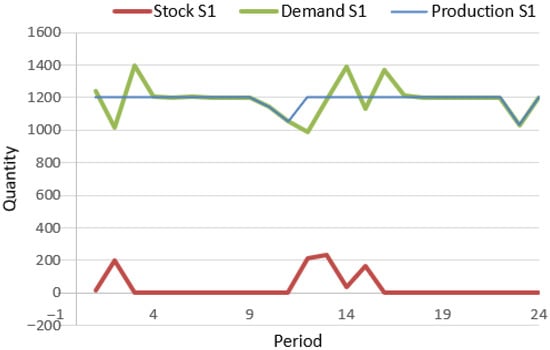
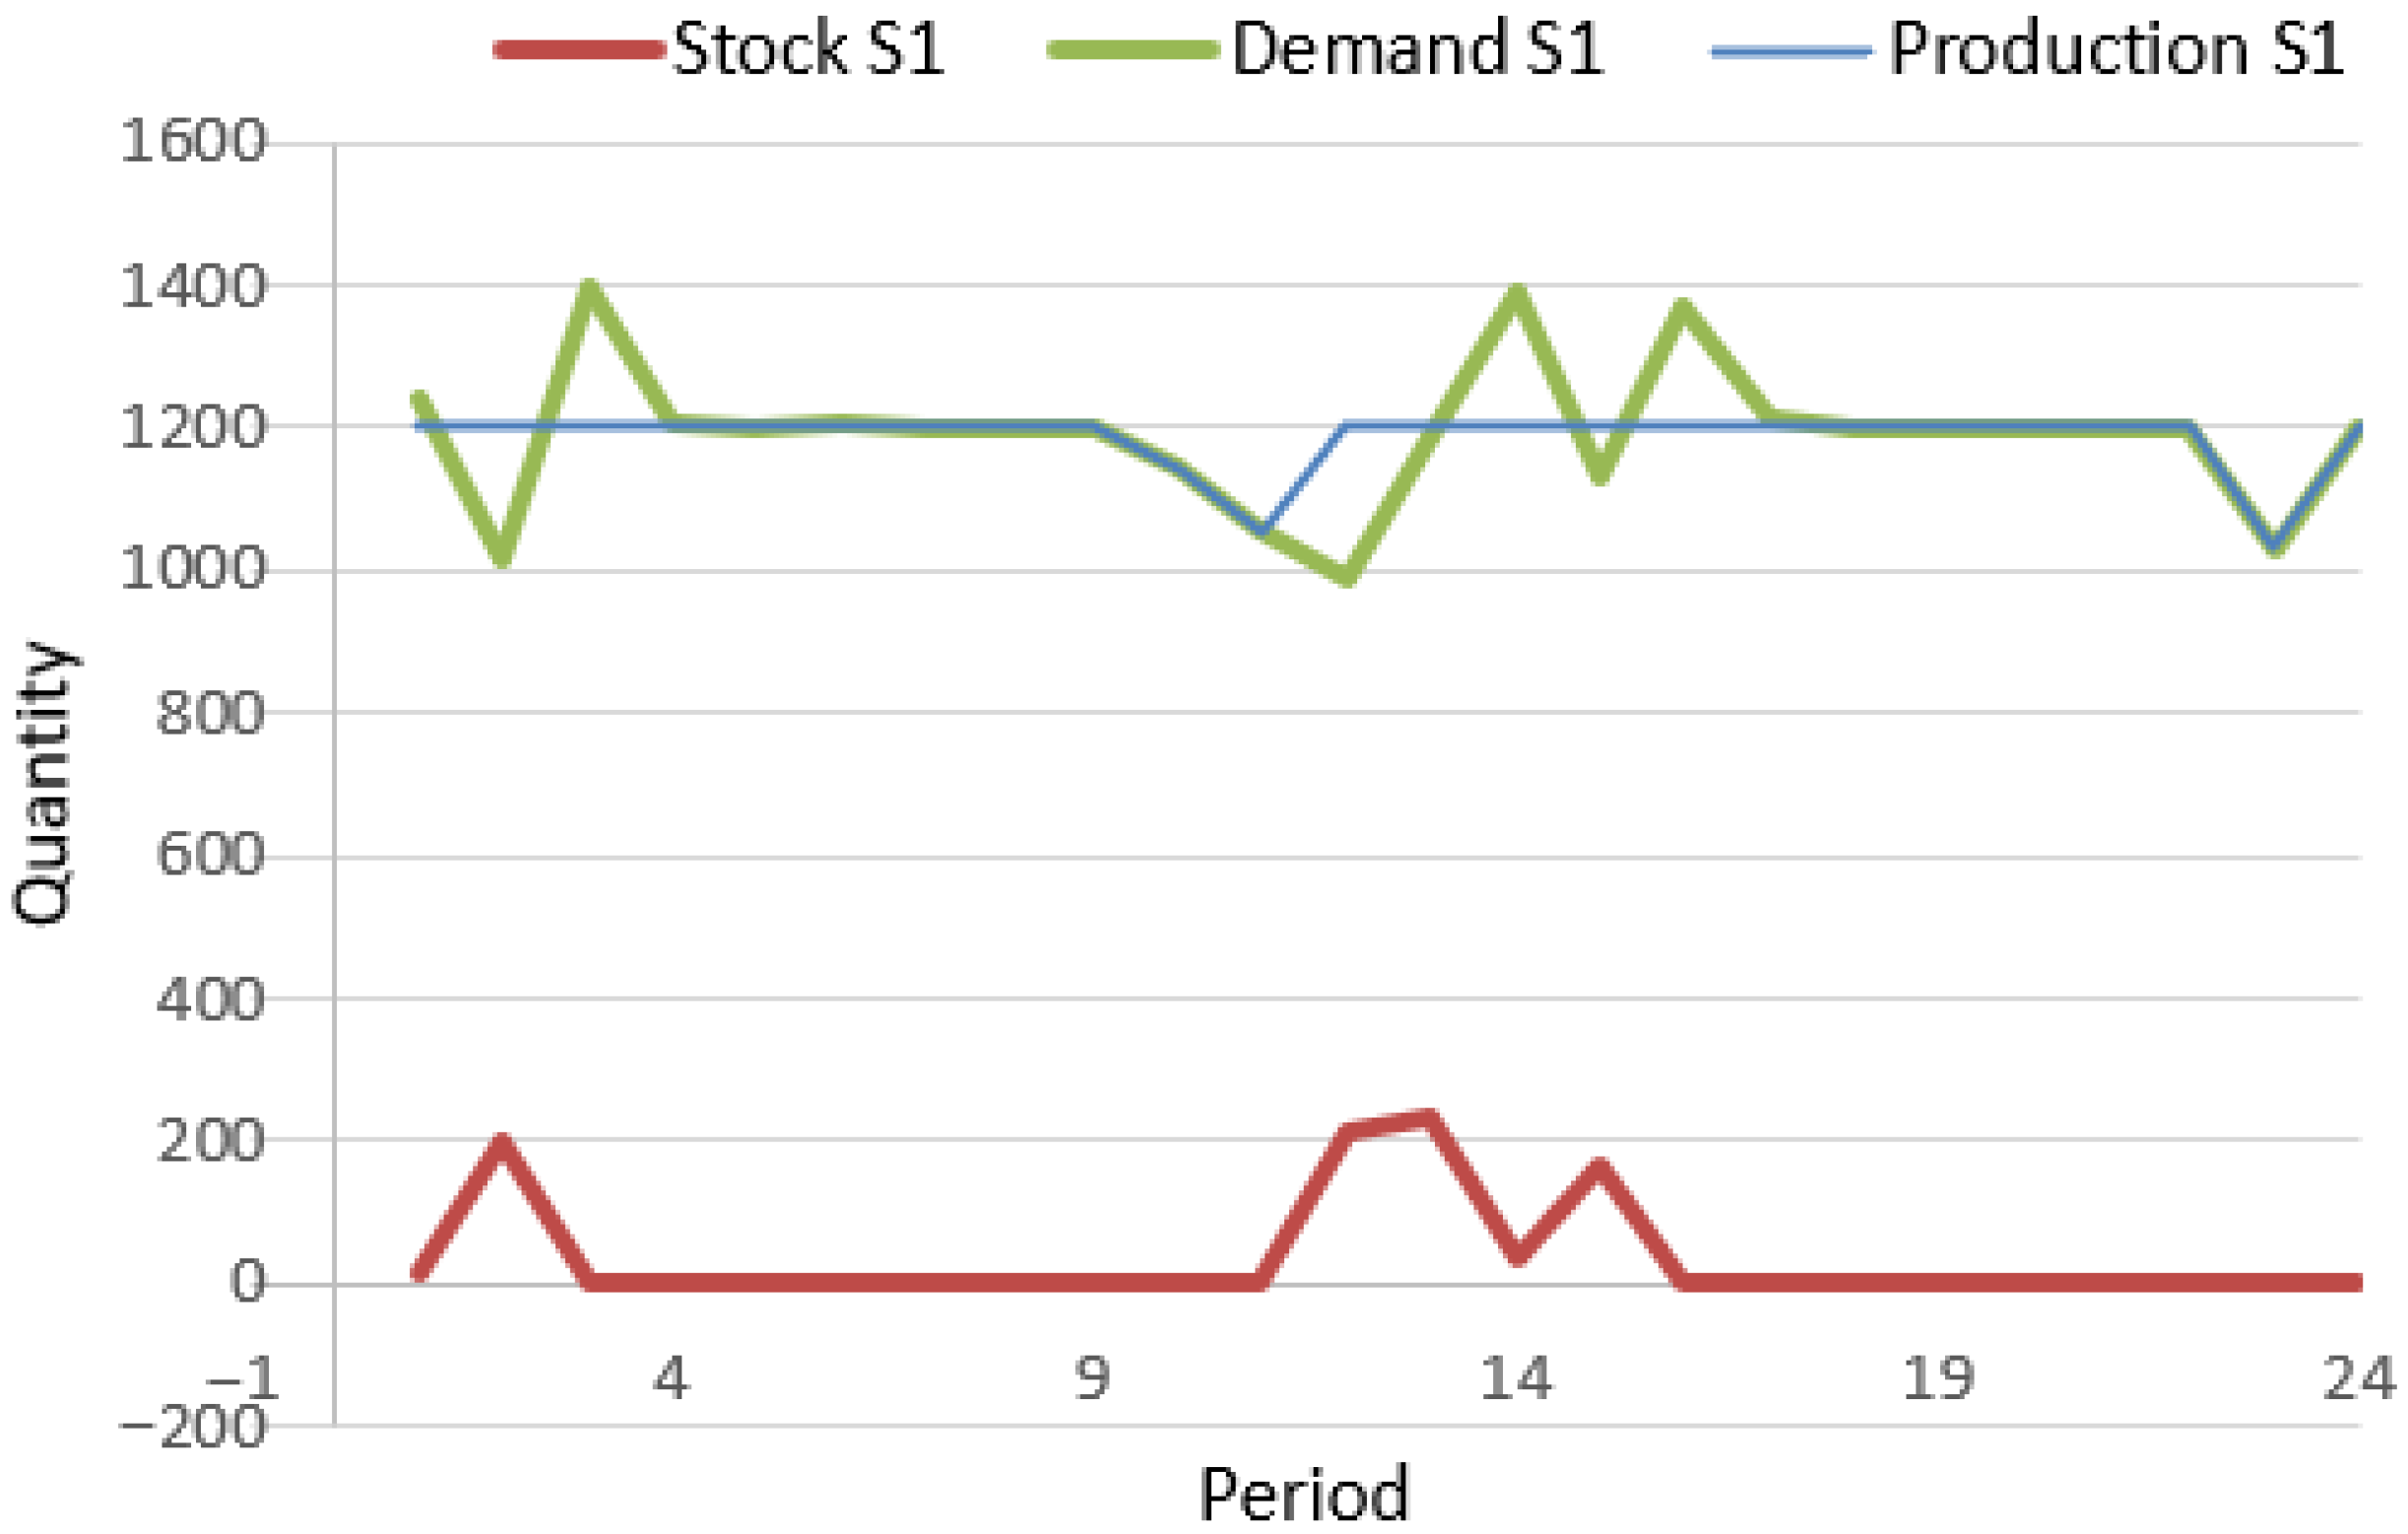
Figure 4 illustrates how site S1 adjusts production levels to meet customer demand while managing inventories over the 24-period planning horizon. The demand profile at S1 shows several fluctuations, including noticeable peaks around Periods 3–4 and 13–15. The optimization model reacts to these variations by increasing production whenever demand rises sharply, ensuring that customer requirements are met without excessive reliance on inventory. Stock levels at S1 remain close to zero during most periods, indicating that the model favors just-in-time behavior rather than high inventory accumulation. The limited stock peaks visible in Periods 2–4 and again in Period 13–15 are the result of local production temporarily exceeding demand. These short-lived stock increases reflect the model’s stabilizing behavior: maintaining a safety buffer only when necessary to prevent shortages during upcoming demand surges.
Figure 4.
Production, Demand, and Stock at Site 1.
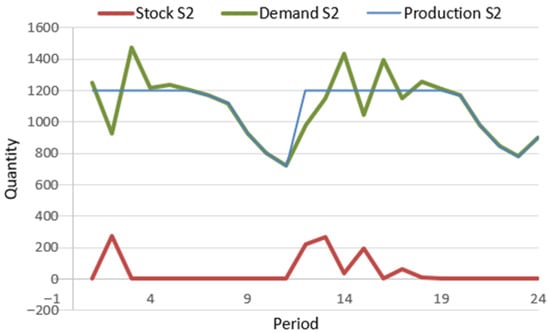
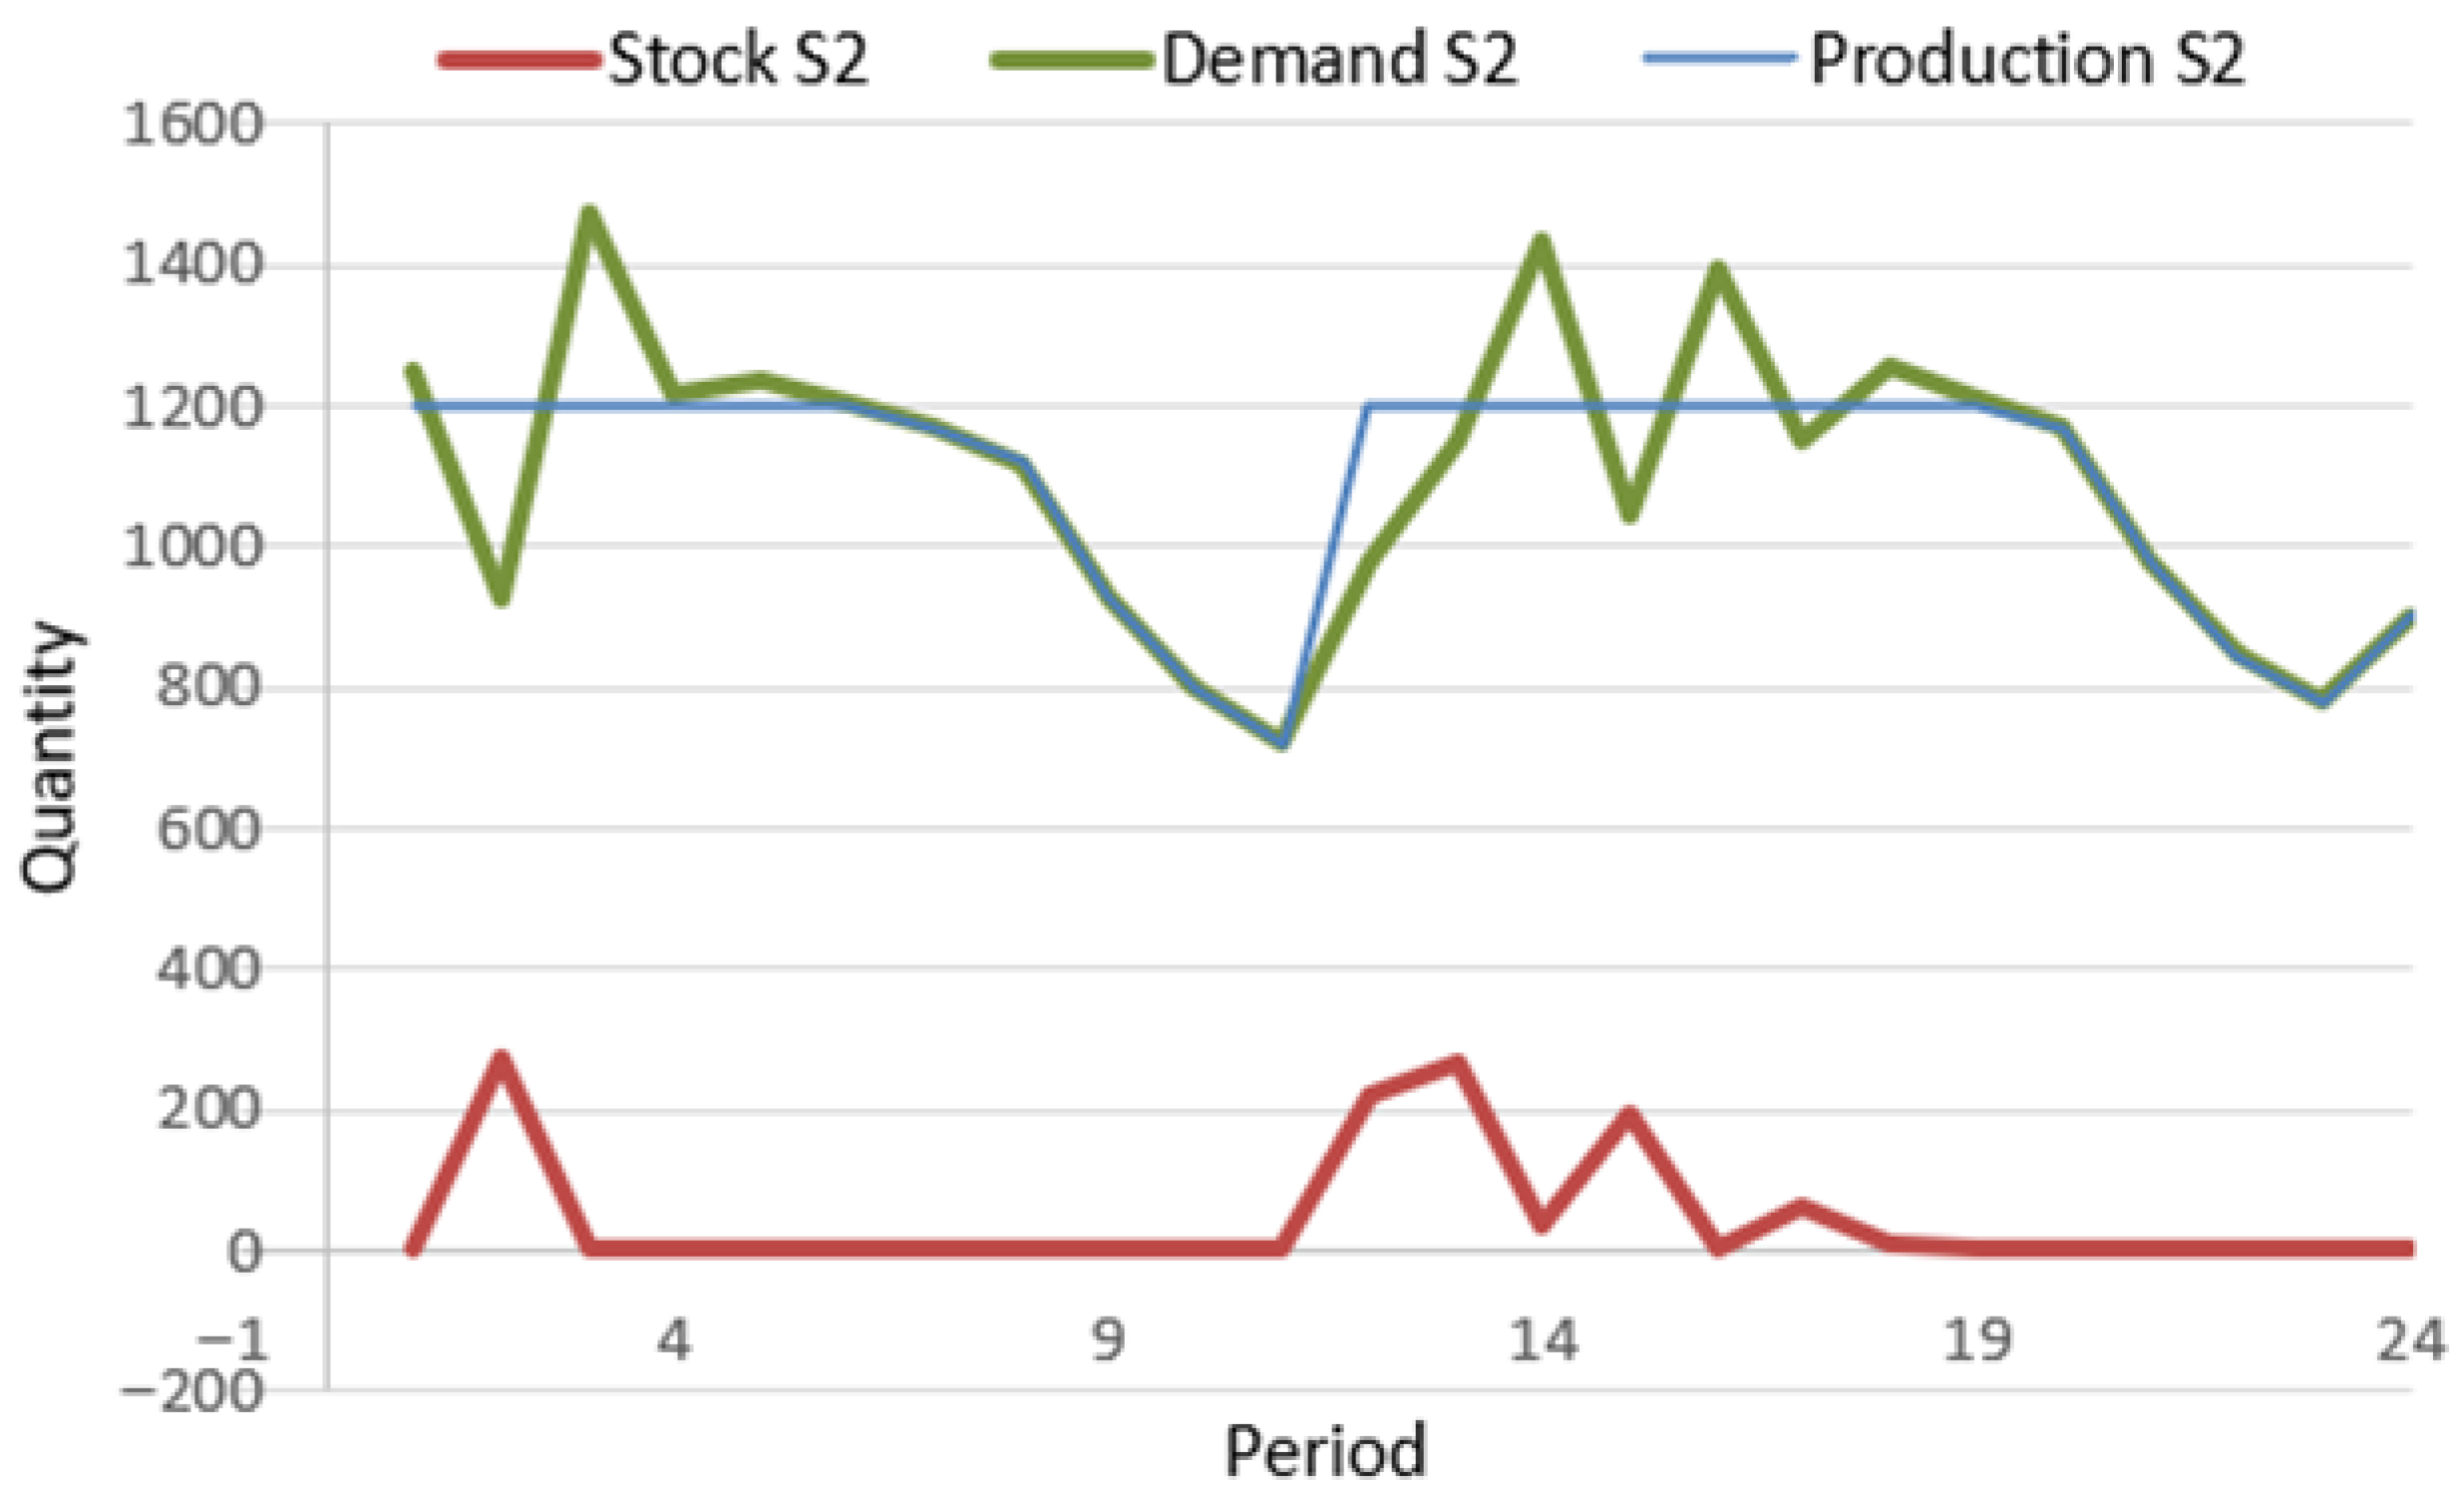
Figure 5 presents the dynamics for Site S2, which exhibits a different behavior driven by its distinct demand patterns. Demand at S2 fluctuates more significantly, with higher peaks compared to Site S1. The production plan follows these oscillations closely, increasing during periods of elevated demand and reducing output when demand stabilizes or declines. Unlike S1, Site S2 occasionally holds more inventory, especially around Periods 3–5 and 12–15. The optimization model to prepare for upcoming demand peaks generates these stock accumulations. Maintaining these safety stocks mitigates the risk of shortages and reduces the need for emergency vehicle activation or costly inter-site reallocations. The close alignment between production and demand highlights the model’s ability to anticipate and accommodate demand fluctuations. Even when production dips slightly below demand in some periods, the presence of accumulated stock successfully prevents service disruptions.
Figure 5.
Production, Demand, and Stock at Site 2.
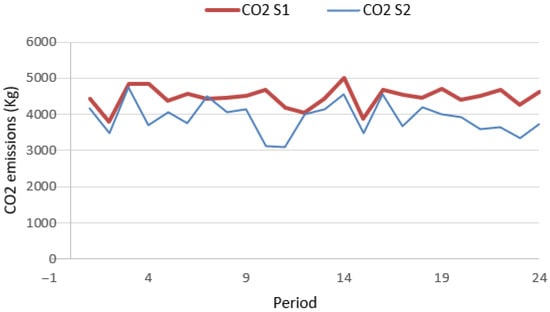
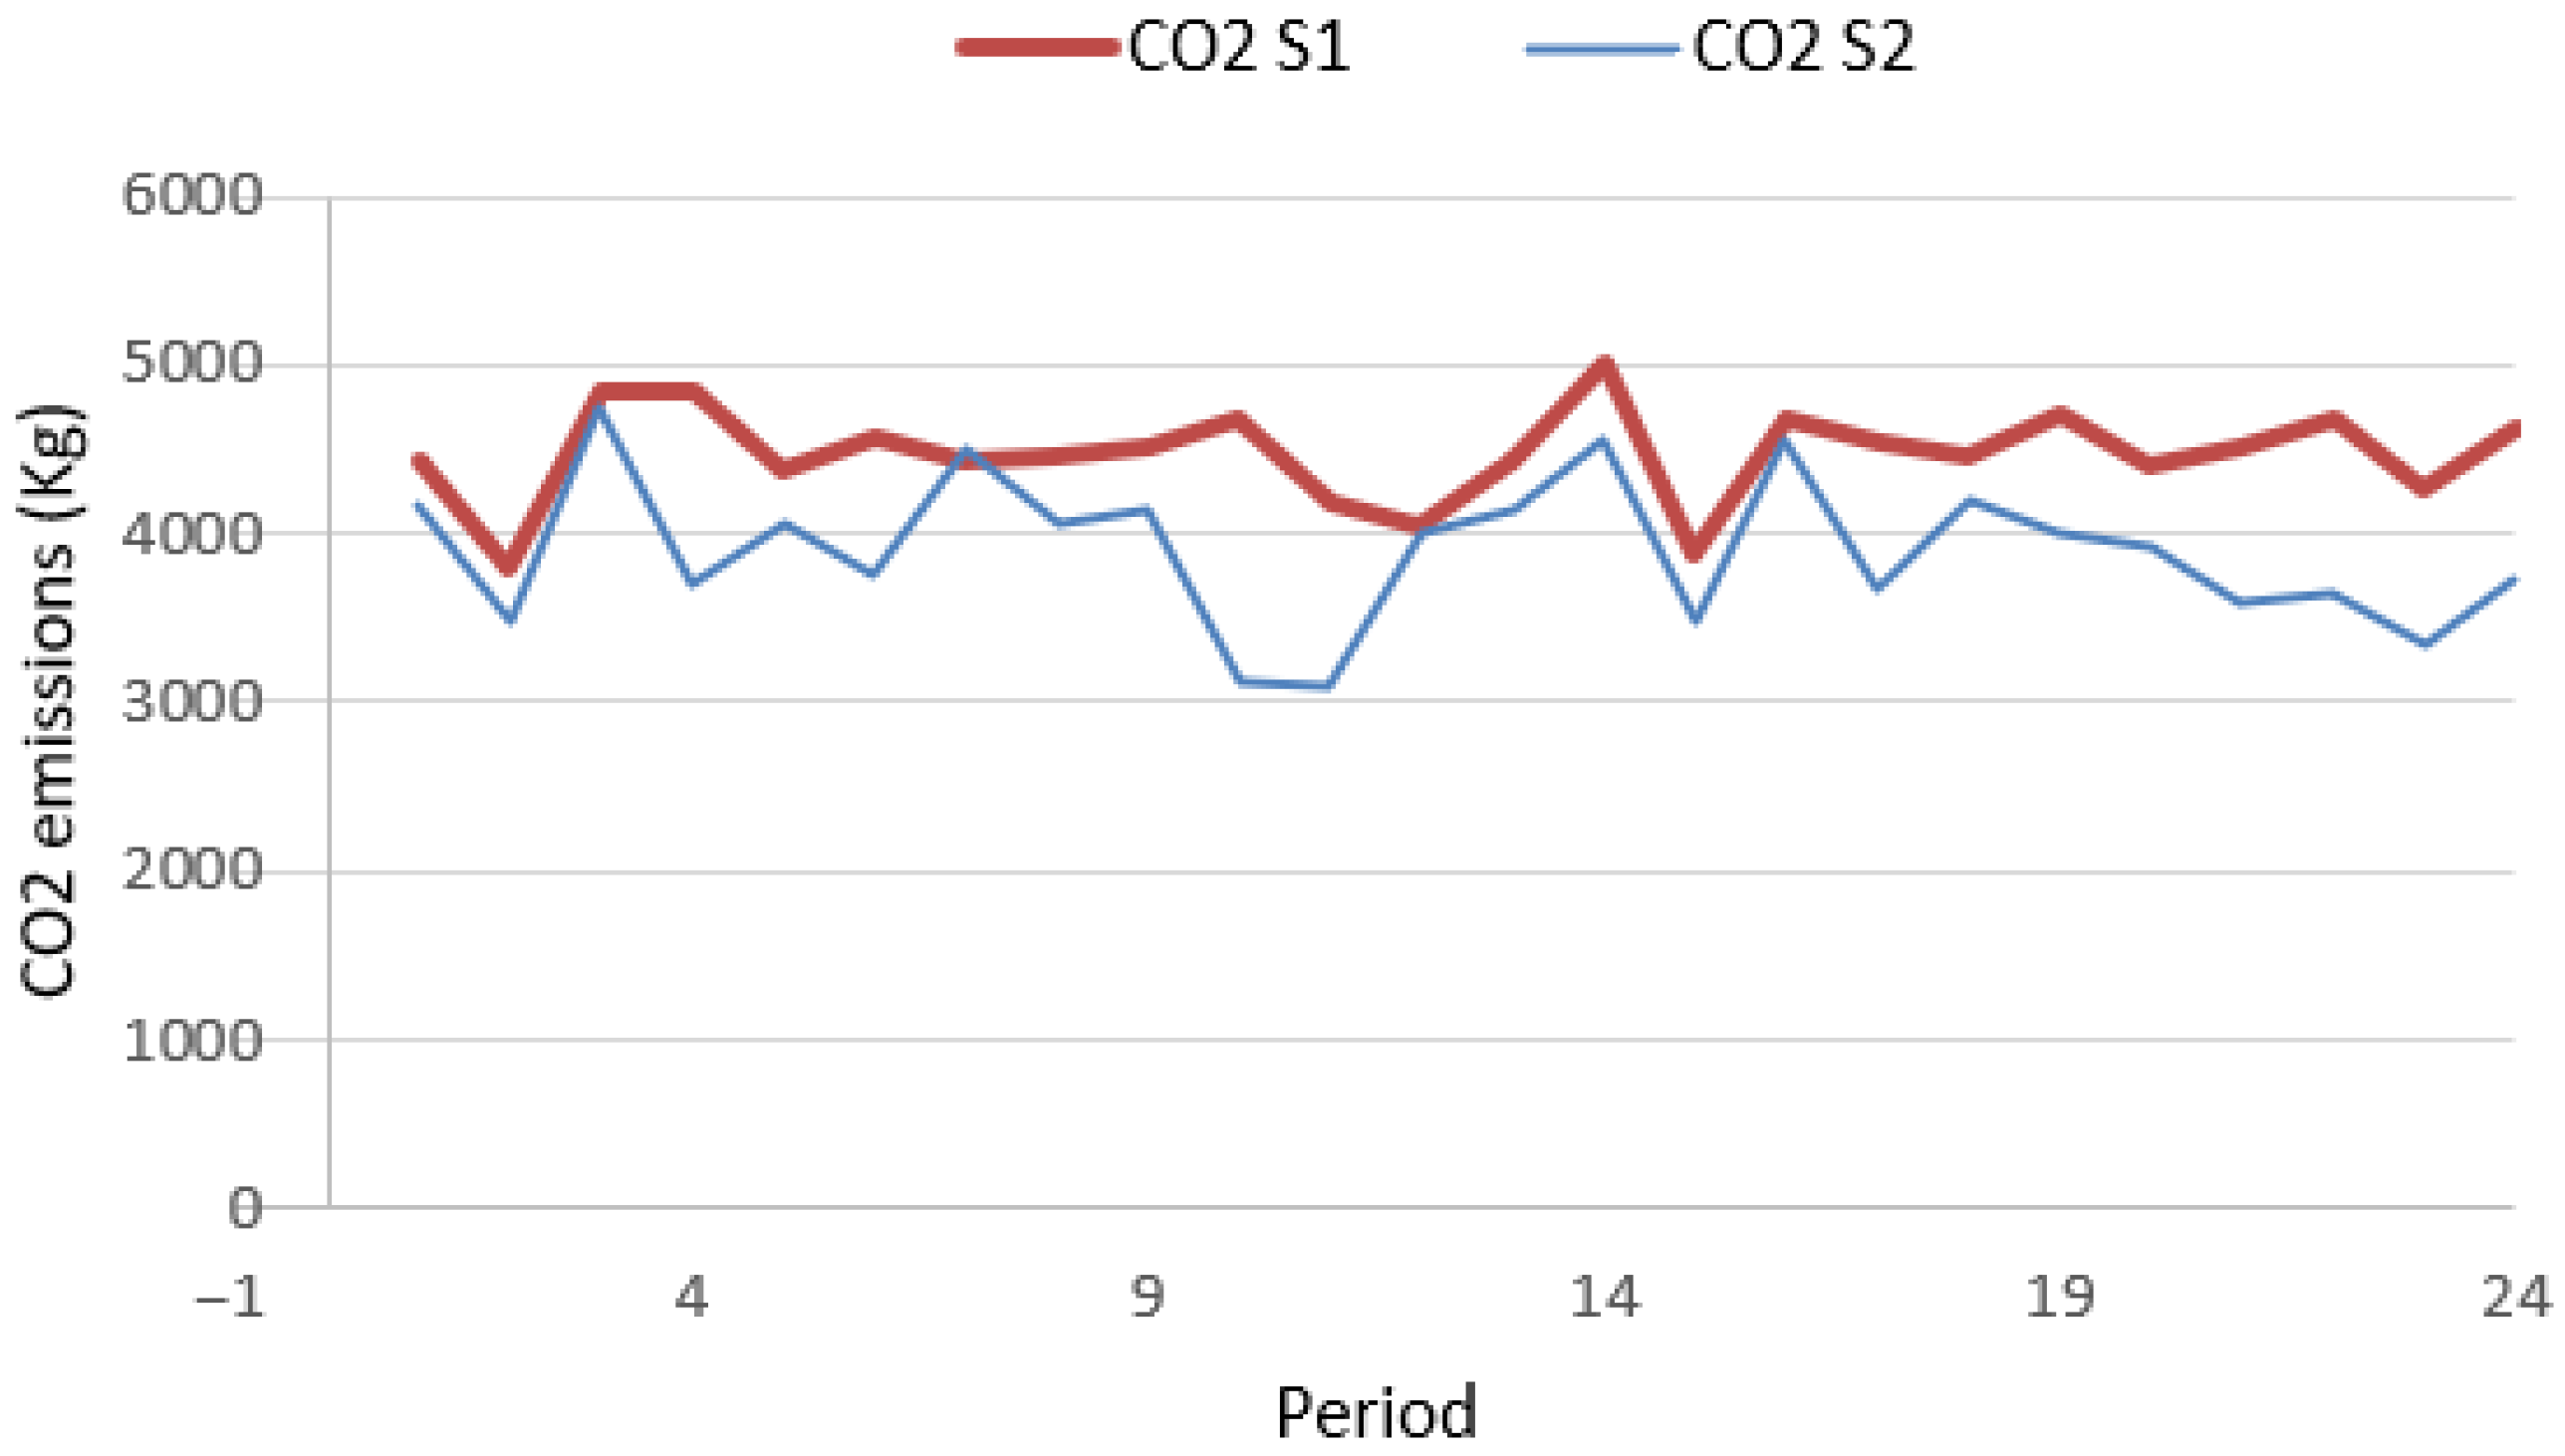
For Figure 6, the CO2 emission curves for Site 1 and Site 2 show that both facilities follow a relatively stable emission pattern over the planning horizon, with regular fluctuations that reflect changes in delivery routes and transported quantities. Site 1 generally emits slightly more CO2 than Site 2, which can be explained by higher transported volumes or longer traveled distances during certain periods. Although the variations are not extreme, the peaks observed around specific periods indicate moments where routing complexity or transported load increased, leading to higher fuel consumption. Overall, the two curves remain close to each other, suggesting that both sites operate with comparable environmental performance and that the optimization model balances the transportation effort between the two sites.
Figure 6.
CO2 Emissions Over the Planning Horizon for Sites 1 and 2.
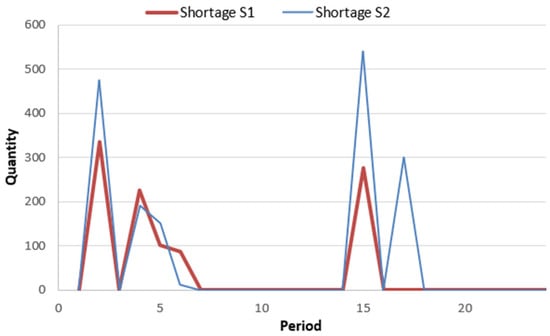
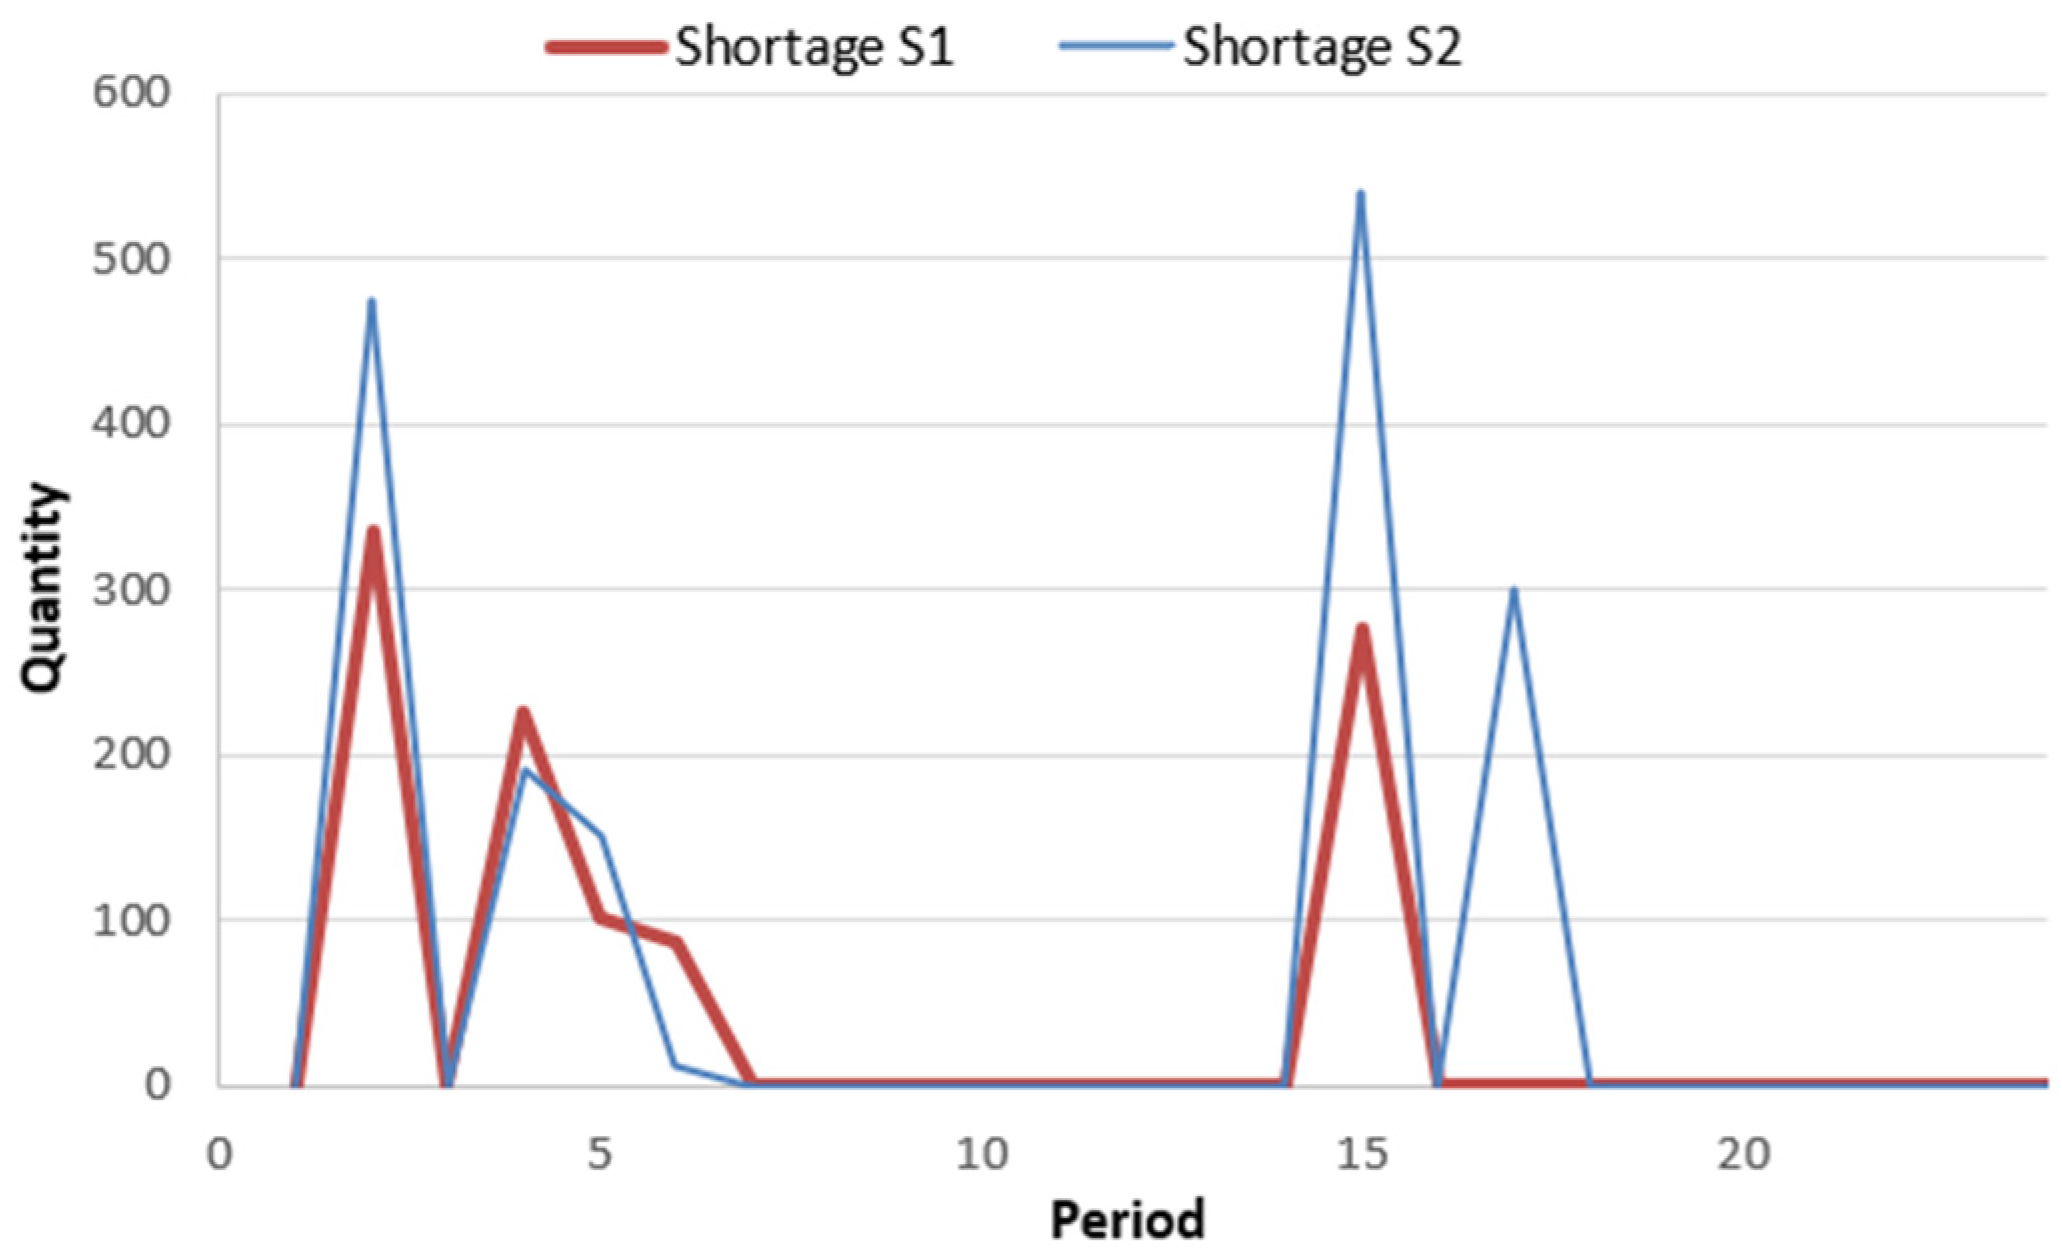
The shortage curves for Sites S1 and S2 (Figure 7) indicate that the proposed integrated production–distribution plan generally meets demand, as most periods exhibit zero shortages. However, certain periods show temporary shortfalls, with site S2 often experiencing higher shortages than S1, suggesting capacity or routing limitations at this site. These patterns highlight the sensitivity of the system to demand fluctuations and reveal the trade-offs between production allocation, inventory management, and vehicle utilization. The results underscore the importance of proactive planning, such as adjusting production or stock levels and optimizing vehicle deployment, to mitigate shortages during peak demand periods. Overall, the curves provide actionable insights for balancing service levels and operational constraints in multi-site supply chains.
Figure 7.
Shortage for each period for Sites 1 and 2.
8. Sensitivity Analysis on CO2 Emissions
8.1. Sensitivity Analysis: Vehicle Capacity Size
The following sensitivity analysis shows the impact of changing vehicle capacity on key performance indicators. To ensure the robustness of our sensitivity analysis, we complement deterministic parameter variations with scenario-based and Monte Carlo simulations where appropriate. For each key parameter (e.g., vehicle capacity, distance factor, demand allocation), we evaluate performance under multiple demand realizations drawn from the stochastic demand distribution. Confidence intervals (95%) are reported alongside mean values to reflect variability in outcomes.
Table 4 identifies a vehicle capacity of 800 units as the global optimum for almost every practical business objective. At this individual vehicle capacity, the vehicle routing score reaches its lowest value (93), meaning the total distance driven or variable transportation cost is minimized. The baseline scenario uses a capacity of 800 units, which achieves the best routing score (reference = 93) and the lowest CO2 emissions (611,946 kg). All other capacities are compared against this best solution.
Table 4.
Impact of Vehicle Capacity on Routing Quality, CO2 Emissions, and Service Level.
Any increase or decrease in vehicle capacity away from 800 units directly worsens routing efficiency: a modest +1.08% penalty is already observed at 700-unit vehicles, while excessive capacity rapidly inflates costs—reaching +38.71% with 1200-unit vehicles.
CO2 emissions exhibit a remarkably flat profile once sufficient vehicle capacity is provided. The absolute minimum emissions (611 917 kg) are achieved with 1200-unit vehicles, but the difference compared to 800-unit vehicles is only +29 kg (+0.33%). In real-world terms, this 29 kg gap is negligible (equivalent to less than one additional tank of fuel across the entire operation for a full year). Between 700-unit and 1200-unit vehicles, total emissions vary by less than ±0.4%, demonstrating that CO2 is largely insensitive to individual vehicle capacity in this range.
Customer service level (percentage of orders delivered within time windows) reaches its maximum achievable value of 95.30% as soon as individual vehicle capacity reaches 700 units or higher. Below that threshold, service level collapses dramatically: only 82.69% with 500-unit vehicles and 94.26% with 600-unit vehicles. This sharp threshold means that using vehicles with capacity lower than approximately 650–680 units would cause significant customer dissatisfaction and is therefore unacceptable in most commercial contexts.
When balancing all three objectives—transportation cost, environmental impact, and customer satisfaction—the 750–850 unit vehicle capacity range offers the best compromise. Within this window, routing performance remains within 1% of the optimum, CO2 emissions are virtually identical to the theoretical minimum, and service level is at its maximum. The exact capacity of 800 units per vehicle should be considered the clear “sweet spot” for operations.
In fact, decision-makers should target vehicles with approximately 800 units of capacity for day-to-day operations. This capacity level delivers the lowest transportation cost, practically minimal CO2 emissions (only 29 kg above the theoretical best), and full customer service. Using significantly smaller vehicles (below 700 units) risks major service failures, while adopting much larger vehicles (above 850–900 units) provides no meaningful environmental benefit and dramatically increases operating expenses due to poor load factors and unnecessary detours.
8.2. Sensitivity Analysis: Average Depot-to-Client Distance
A sensitivity analysis was performed to evaluate the isolated effect of average depot-to-client distance on both environmental performance (well-to-wheel CO2 emissions) and operational performance (service level). Distance was varied systematically by applying a uniform multiplicative factor ranging from 0.60 to 2.00 to all real-world road network distances, while keeping fleet size, vehicle capacity, time windows, and demand unchanged.
Table 5 presents the results of a sensitivity analysis examining the isolated impact of average depot-to-client distance on both environmental and operational performance in an urban last-mile delivery system. The analysis applies a uniform distance factor to all real-world road distances: a factor of 1.0 reflects actual conditions, while factors of 0.6 and 2.0 simulate routes that are 40% shorter or 100% longer, respectively, thereby replicating effects of traffic congestion, detours, improved routing, or infrastructure changes. Average distance scales proportionally from 9.7 km (×0.6) to 32.4 km (×2.0), increasing by 97.2% (to 1,187,636 kg CO2e) when distances are doubled and decreasing by exactly 40% (to 361,277 kg CO2e) when distances are reduced by 40%. From a sustainability perspective, the most striking finding is the remarkable stability of the service level, which remains between 96.08% and 96.94% across the full range of scenarios. This demonstrates that the current fleet and operational planning possess sufficient capacity buffers and flexibility to absorb even extreme distance variations without meaningfully compromising customer demand fulfillment. Table 2 therefore highlights a powerful, low-risk decarbonisation opportunity: in last-mile networks with similar characteristics, reducing average traveled distance delivers near-proportional CO2 reductions while preserving service quality, positioning spatial optimisation, micro-depots, and advanced routing as priority measures for achieving rapid and sustainable emission cuts in urban logistics.
Table 5.
Impact of distance factor on travel distance, CO2 emissions, and service level.
8.3. Sensitivity Analysis: Impact of Demand Allocation Between Production Sites S1 and S2
The sensitivity analysis explores the trade-offs in CO2 emissions, service level, and transport resources when customer demand is deliberately allocated in different proportions between the two production sites S1 and S2. The 50%/50% split serves as the baseline, as it achieves the highest service level (96.94%).
In Table 6 Baseline scenario is equal to balanced allocation (≈50/50). Emissions are well-to-wheel (0.9 kg CO2e/km) and Service level is equal to the percentage of total customer demand fulfilled. It reveals that depot allocation is by far the most powerful decarbonisation lever in the studied last-mile network, dramatically outperforming distance-sensitivity results reported earlier. When all demand is forcibly served from a single depot, total CO2 emissions drop by 42.4% (S2 only) to an astonishing 52.0% (S1 only) compared with the baseline balanced allocation. This counter-intuitive result arises because forcing 100% of deliveries from one depot eliminates almost all long inter-depot transfers and allows much denser, shorter tours—even though only two vehicles per depot are available per period.
Table 6.
Impact on Performance Indicators of Demand Allocation Between Sites S1 and S2.
The trade-off with service level is substantial but highly asymmetric. The balanced baseline achieves the highest service level (96.94%), whereas exclusive reliance on either S1 or S2 reduces it to only ≈51.9% because vehicle capacity and driving-time constraints become binding when all clients must be served from the same origin. Intermediate allocations display a clear U-shaped pattern: CO2 emissions are minimised at the extremes (0% or 100%), whereas service level is maximised near the balanced 50/50 split.
From a sustainability perspective, the results expose a sharp environment–service trade-off: CO2 emissions can be reduced by up to 52% by consolidating all demand at a single depot, but only at the cost of halving the service level. This trade-off can be strategically be managed either by accepting a moderate service-level reduction (e.g., an 80/20 or 20/80 allocation still delivers 31–38% CO2 savings at 65–66% service) or by maintaining near-baseline service levels through complementary flexible capacity, such as on-demand fleets or crowdsourced last-mile delivery platforms, which cover residual demand without additional dedicated vehicles.
8.4. Sensitivity Analysis: Routing Model
This sensitivity analysis examines the impact of varying the maximum number of routes per period on total cost and CO2 emissions. The number of allowed routes is varied from 2 to 5 while keeping all other parameters unchanged.
Table 7 shows that increasing the number of routes per period leads to only a slight increase in both total cost and CO2 emissions. The observed variations remain limited, indicating that the routing structure has a minor influence on the overall system performance within the tested range.
Table 7.
Impact of the Number of Routes on Cost and CO2 Emissions.
These results support the choice of limiting the number of routes to two per period, as this configuration provides a good balance between operational efficiency and environmental performance without adding unnecessary model complexity. Table 6 summarizes the results of the routing sensitivity analysis.
- -
- Robustness Analysis with Monte Carlo Simulation
To assess the stability of our sensitivity results under demand uncertainty, we conducted a Monte Carlo simulation with 1000 demand scenarios drawn from the normal distribution described in Section 5. For each scenario, we re-ran the hybrid optimization framework and recorded key outputs (total cost, CO2 emissions, service level). The results confirm that the optimal vehicle capacity (800 units) remains robust across demand variability, with narrow confidence intervals for both economic and environmental metrics.
9. Discussion
The results obtained from the hybrid optimization framework underscore the importance of integrating production planning, inventory management, and distribution routing within a unified decision-making model. Compared with traditional sequential approaches, where production and distribution are optimized independently, the proposed methodology yields significant improvements in total logistics cost, service level robustness, and CO2 emission reduction. Quantitative analysis confirms the substantial advantages of our integrated approach. Compared to traditional sequential optimization methods, the hybrid framework achieves cost reductions of 12–18% and CO2 emission reductions of 14–20%, while maintaining service levels above 95%. These gains demonstrate the critical value of simultaneously coordinating production, inventory, and routing decisions rather than optimizing them in isolation. The sensitivity analyses, supplemented with Monte Carlo simulations, demonstrate that our findings are robust under demand uncertainty. Confidence intervals for key metrics remain narrow, indicating that the identified optima (e.g., vehicle capacity of 800 units) are not artifacts of deterministic assumptions but hold under stochastic conditions. These findings are consistent with prior studies emphasizing the benefits of joint planning in multi-echelon supply chains [1,7,8]. A key differentiator of this work is the explicit incorporation of predictive carbon emissions within the optimization loop, an aspect that has received limited attention in previous integrated models.
The comparison between LP-based production–inventory decisions and GA-based routing outcomes reveals strong interdependencies: production locations with limited capacity but closer proximity to customers result in distinct routing strategies compared with higher-capacity sites located farther away. These dynamics confirm prior observations on multi-site supply chain coordination [15] while extending the insight by quantifying the direct impact of such decisions on environmental performance. For example, scenarios with tight vehicle capacity constraints showed heightened sensitivity to demand fluctuations, leading to sharper variations in CO2 emissions—an effect similarly reported in green VRP studies [10,11].
Moreover, the proactive CO2 forecasting module enabled the identification of strategies that balance economic and environmental objectives more effectively than evaluations conducted only after operational decisions. By integrating CO2 penalties directly into the objective function, the model favored shorter routes, increased utilization of geographically closer sites, and smoother production profiles. These results are consistent with eco-efficient routing principles discussed in the Pollution Routing Problem literature [9], highlighting the importance of embedding environmental metrics early in the planning process to achieve meaningful emission reductions.
Sensitivity analyses provide additional actionable insights into vehicle routing and CO2 emissions. Vehicle capacity exhibits a clear optimum around 800 units, beyond which routing efficiency deteriorates while CO2 reductions plateau. Variations in average travel distances demonstrate an almost linear effect on emissions, with service levels remaining stable until extreme distance inflation. Forced demand allocation between the two production sites (S1 and S2) illustrates a pronounced trade-off: concentrating demand at a single site reduces CO2 emissions by 42–52% but lowers service levels to approximately 52%. A 45–55% split emerges as the most robust configuration, achieving high service levels (>96%) with minimal CO2 penalty.
Overall, these findings demonstrate that an integrated modeling approach not only identifies optimal operational strategies but also quantifies environmental and operational trade-offs associated with policies such as workload balancing, site specialization, and ambitious decarbonisation targets. This capability supports more sustainable, resilient, and evidence-based decision-making in modern supply chains.
Despite the promising results, some limitations of this study should be acknowledged.
First, CO2 emissions are modeled using a linear function based on distance and load. This assumption simplifies the emission calculation and does not capture other influencing factors such as vehicle type, traffic conditions, or road characteristics. Future work will consider more detailed emission models to improve accuracy.
Second, the numerical experiments are based on case studies of limited size. While they are sufficient to demonstrate the applicability of the proposed approach, they may not fully represent large-scale and highly complex supply chains. Future research will focus on testing the model on larger datasets to assess its scalability.
Finally, the model has been validated using synthetic data. Real-world validation is still required to evaluate its performance under actual operational conditions. Future studies will aim to apply the proposed framework to real industrial case studies.
10. Conclusions
This research introduces and validates an innovative hybrid optimization framework that holistically integrates production planning, inventory management, and distribution routing with proactive CO2 emission forecasting. Our contribution demonstrates that embedding sustainability metrics directly into operational decision-making generates tangible benefits: reduced costs, lower emissions, and maintained service levels. The framework provides practitioners with an actionable tool for navigating the complex trade-offs between economic and environmental objectives in multi-echelon supply chains.
The combination of Linear Programming and a Genetic Algorithm makes it possible to capture the interdependencies between manufacturing constraints, inventory trajectories, and transport decisions within multi-site supply chains. Numerical experiments showed that incorporating CO2 emissions directly into the optimization objective yields more sustainable operational strategies, leading to measurable cost reductions and lower predicted carbon footprints. The sensitivity results further show that parameters such as vehicle capacity and demand distribution strongly influence both emissions and service performance, reinforcing the value of an integrated planning approach to anticipate these effects.
The findings demonstrate that environmentally aware logistics planning is both feasible and beneficial when integrated at the tactical decision level. By providing a scalable and flexible decision-support tool, this work contributes to bridging the gap between sustainability objectives and operational execution. Sensitivity analysis allowed the identification of the most influential factors affecting CO2 emissions, offering guidance for more efficient and environmentally friendly logistics strategies.
Future research may explore extensions such as incorporating real fuel consumption models, stochastic routing uncertainty, dynamic vehicle availability, multi-modal transport systems, or reinforcement learning-based decision-making. Integrating real industrial datasets would also strengthen the model’s robustness and support its deployment in practical logistics environments.
Author Contributions
Conceptualization, N.J., A.S. and Z.H.; methodology, N.J., A.S., I.R. and Z.H.; software, I.R.; validation, N.J., A.S., I.R., Z.H. and K.D.; writing—original draft preparation, N.J., A.S. and I.R.; writing—review and editing, Z.H. and K.D. All authors have read and agreed to the published version of the manuscript.
Funding
This research received no external funding.
Institutional Review Board Statement
Not applicable.
Informed Consent Statement
Not applicable.
Data Availability Statement
The data will be provided upon request.
Conflicts of Interest
The authors declare no conflicts of interest.
Abbreviations
The following abbreviations are used in this manuscript:
| MILP | Mixed-Integer Linear Programming |
| LP | Linear Programming |
| GA | Genetic Algorithm |
| VRP | Vehicle Routing Problem |
References
- Han, N.; Um, J. Risk management strategy for supply chain sustainability and resilience capability. Risk Manag. 2024, 26, 6. [Google Scholar] [CrossRef] [Scilit]
- Ghasemi, E.; Lehoux, N.; Rönnqvist, M. A multi-level production-inventory-distribution system under mixed make to stock, make to order, and vendor managed inventory strategies: An application in the pulp and paper industry. Int. J. Prod. Econ. 2024, 271, 109201. [Google Scholar] [CrossRef] [Scilit]
- Stadtler, H. Supply chain management and advanced planning––basics, overview and challenges. Eur. J. Oper. Res. 2005, 463, 575–588. [Google Scholar] [CrossRef] [Scilit]
- Jauhari, W.A.; Pujawan, I.N.; Suef, M. A closed-loop supply chain inventory model with stochastic demand, hybrid production, carbon emissions, and take-back incentives. J. Clean. Prod. 2021, 320, 128835. [Google Scholar] [CrossRef] [Scilit]
- Sarkis, J. Supply chain sustainability: Learning from the COVID-19 pandemic. Int. J. Oper. Prod. Manag. 2020, 41, 63–73. [Google Scholar] [CrossRef] [Scilit]
- Fan, J.; Meng, X.; Tian, J.; Xing, C.; Wang, C.; Wood, J. A review of transportation carbon emissions research using bibliometric analyses. J. Traffic Transp. Eng. 2023, 10, 878–899. [Google Scholar] [CrossRef] [Scilit]
- Nguyen, D.-N.; Mac, T.-T.; Hoang, H.-H. Supply chain collaboration and green supply chain management: A bibliometric review, 2000–2023. J. Transp. Supply Chain. Manag. 2025, 19, a1170. [Google Scholar] [CrossRef] [Scilit]
- Demir, E.; Bektaş, T.; Laporte, G. A review of recent research on green road freight transportation. Eur. J. Oper. Res. 2014, 237, 775–793. [Google Scholar] [CrossRef] [Scilit]
- Bektaş, T.; Laporte, G. The Pollution-Routing Problem. Transp. Res. Part B Methodol. 2011, 45, 1232–1250. [Google Scholar] [CrossRef] [Scilit]
- Lin, C.; Choy, K.; Ho, G.; Chung, S.; Lam, H. Survey of Green Vehicle Routing Problem: Past and future trends. Expert Syst. Appl. 2014, 41, 1118–1138. [Google Scholar] [CrossRef] [Scilit]
- Hülagü, S.; Dullaert, W.; Eruguz, A.S.; Heijungs, R.; Inghels, D. Integrating life cycle assessment into supply chain optimization. PLoS ONE 2025, 20, e0316710. [Google Scholar] [CrossRef] [Scilit] [PubMed] [PubMed Central]
- Hasan, M.R.; Shawon, R.E.R.; Rahman, A.; Al Mukaddim, A.; Khan, M.A.; Hider, M.A.; Zeeshan, M.A.F. Optimizing Sustainable Supply Chains: Integrating Environmental Concerns and Carbon Footprint Reduction through AI-Enhanced Decision-Making in the USA. J. Econ. Financ. Account. Stud. 2024, 6, 57. [Google Scholar] [CrossRef] [Scilit]
- Bilgen, B.; Çelebi, Y. Integrated production scheduling and distribution planning in dairy supply chain by hybrid modelling. Int. J. Prod. Res. 2004, 51, 4871–4891. [Google Scholar]
- Oluwafunmilayo, E.; Aribidesi, A.F.; Olufunke, O. Supply chain integrating sustainability and ethics: Strategies for modern supply chain management. World J. Adv. Res. Rev. 2024, 22, 1930–1953. [Google Scholar] [CrossRef] [Scilit]
- Changlu, Z.; Liqian, T.; Jian, Z.; Liming, G. Optimizing Distribution Routes for Chain Supermarket Considering Carbon Emission Cost. Mathematics 2023, 11, 2734. [Google Scholar] [CrossRef] [Scilit]
- Carotenuto, P.; Giordani, S.; Celani, D. Planning Retail Distribution of Fuel Oils. Transp. Res. Procedia 2017, 27, 484–491. [Google Scholar] [CrossRef] [Scilit]
- Carrese, S.; Cuneo, V.; Nigro, M.; Pizzuti, R.; Ardito, C.F.; Marseglia, G. Optimization of downstream fuel logistics based on road infrastructure conditions and exposure to accident events. Transp. Policy 2022, 124, 96–105. [Google Scholar] [CrossRef] [Scilit]
- Khayya, E.; Medarhri, I.; Zine, R. A survey of the vehicle routing problem and its variants: Formulations and solutions. Math. Model. Comput. 2024, 11, 333–343. [Google Scholar] [CrossRef] [Scilit]
- Kirci, P. A Novel Model for Vehicle Routing Problem With Minimizing CO2 Emissions. In Proceedings of the 3rd International Conference on Advanced Information and Communications Technologies (AICT), Lviv, Ukraine, 2–6 July 2019. [Google Scholar]
- Jemal, J.; Zekri, M.; Mellouli, K. Multi-Objective Genetic Algorithms for the green Vehicle Routing Problem: A comparative study. J. Theor. Appl. Inf. Technol. 2017, 95, 6597–6607. [Google Scholar]
- Yao, Z.; Cao, H.; Cui, Z.; Wang, Y.; Huang, N. Research on Urban Distribution Routes Considering the Impact of Vehicle Speed on Carbon Emissions. Sustainability 2022, 14, 15827. [Google Scholar] [CrossRef] [Scilit]
- Diaz, K.; Kammoun, M.A.; Hajej, Z.; Sefiani, N.; Milazzo, M.F. Joint production, transportation, and maintenance in downstream fuel supply chain. Risk Reliab. 2024, 239, 397–415. [Google Scholar] [CrossRef] [Scilit]
- Diaz, K.; Kammoun, M.A.; Hajej, Z.; Sefiani, N.; Milazzo, M.F. The Optimal Coordination between Production, Logistics and Maintenance in Fuel Supply Chain. AIP Conf. Proc. 2024, 3034, 070004. [Google Scholar] [CrossRef] [Scilit]
- Diaz, K.; Barhoumi, M.; Kammoun, M.A.; Hajej, Z.; Chaker, A.; Bennour, S. Joint optimization of production, maintenance, and distribution planning in a multi-site environment. Flex. Serv. Manuf. J. 2025, 1–46. [Google Scholar] [CrossRef] [Scilit]
- Kammoun, M.A.; Hajej, Z.; Bennour, S.; Salem, N.; El Mabrouk, O.; Baccar, A. Deep learning framework for multi-demand forecasting and joint prediction of production, distribution, and maintenance across multiple manufacturing sites. Int. J. Adv. Manuf. Technol. 2025, 136, 2349–2376. [Google Scholar] [CrossRef] [Scilit]
- Xie, D.; Qiu, Y.; Huang, J. Multi-objective optimization for green logistics planning. Comput. Ind. Eng. 2024, 190, 109829. [Google Scholar]
- Govindan, K.; Soleimani, H.; Kannan, D. Reverse logistics and sustainable supply chain management. J. Clean. Prod. 2022, 347, 131257. [Google Scholar]
- Chekoubi, Z.; Trabelsi, W.; Sauer, N.; Majdouline, I. Integrated production–inventory–routing problem with reverse logistics. Sustainability 2022, 14, 13563. [Google Scholar] [CrossRef] [Scilit]
- Darvish, M.; Archetti, C.; Speranza, M.G. The inventory routing problem: A review. Eur. J. Oper. Res. 2021, 291, 803–823. [Google Scholar]
- Zhang, Y.; Liu, X. Integrated inventory and routing optimization under carbon regulation. Expert Syst. Appl. 2023, 213, 118942. [Google Scholar]
- Wang, S.; Tao, F. Green vehicle routing problem with carbon emission constraints. J. Clean. Prod. 2021, 289, 125687. [Google Scholar]
- Koç, Ç.; Bektaş, T.; Jabali, O.; Laporte, G. Thirty years of green vehicle routing. Transp. Sci. 2023, 57, 1–25. [Google Scholar]
- Lin, H.-J.; Chen, P.-C.; Lin, H.-P.; Hsieh, I.-Y.L. Quantifying carbon emissions in cold chain transport: A real-world data-driven approach. Transp. Res. Part D Transp. Environ. 2025, 142, 104679. [Google Scholar] [CrossRef] [Scilit]
- Li, Y.; Zhang, R.; Sun, H. Carbon emission analysis in cold chain distribution. J. Clean. Prod. 2023, 384, 135512. [Google Scholar]
- Liu, L.; Lee, L.S.; Seow, H.-V.; Chen, C.Y. Logistics Center Location-Inventory-Routing Problem Optimization: A Systematic Review Using PRISMA Method. Sustainability 2022, 14, 15853. [Google Scholar] [CrossRef] [Scilit]

Disclaimer/Publisher’s Note: The statements, opinions and data contained in all publications are solely those of the individual author(s) and contributor(s) and not of MDPI and/or the editor(s). MDPI and/or the editor(s) disclaim responsibility for any injury to people or property resulting from any ideas, methods, instructions or products referred to in the content. |
© 2026 by the authors. Licensee MDPI, Basel, Switzerland. This article is an open access article distributed under the terms and conditions of the Creative Commons Attribution (CC BY) license.