


Abstract
With the acceleration of global climate change and urbanization, urban resilience has become a critical issue. This study, based on the Pressure-State-Response (PSR) model, constructs an urban resilience evaluation index system for Sanming City. Indicator weights are determined by combining the Analytic Hierarchy Process (AHP) and the entropy weight method. Spatial analysis methods, such as spatial autocorrelation, kernel density estimation, standard deviation ellipses, and geographic detectors, are employed to explore spatial–temporal analysis and driving factors of urban resilience. The results show the following: (1) from 2014 to 2022, Sanming’s urban resilience index initially increased and then declined; (2) the spatial distribution of urban resilience is uneven, with high-resilience areas concentrated in the city center and southeast, while the northwest is relatively low; (3) Local Moran’s I analysis confirms significant positive spatial autocorrelation, with regional differences gradually expanding; (4) geographic detector analysis reveals that NDVI, monthly maximum precipitation, nighttime light index, annual average PM2.5 concentration, and impervious surface ratio are key drivers of urban resilience; (5) factor interactions show nonlinear enhancement, with ecological and climatic–environmental factors interacting as key drivers of urban resilience changes.
1. Introduction
Natural disasters are frequent in China, especially in the southeastern coastal regions. These areas are influenced by both monsoon climates and marine environments, resulting in a dual impact that leads to frequent floods and prominent geological disaster hazards, as well as threats from low-temperature freezing and high-temperature droughts [1]. The concurrent occurrence of multiple disasters not only exacerbates the risks of disaster chains but also severely impacts urban operations and residents’ daily lives [2,3]. Against this backdrop, urban resilience has become a central issue of concern. As the key to cities’ capacities to withstand disasters, reduce losses, and recover quickly, urban resilience is directly linked to sustainable urban development and the overall stability of society [4].
Urban resilience refers to a city’s ability to maintain or rapidly recover its essential functions under the impact of natural disasters. In recent years, it has become a research hotspot [5,6]. Research on resilience to single disaster types has made significant progress in various fields, especially through measures such as infrastructure development, emergency response, and post-disaster recovery, which allow for the rapid restoration of urban functions. For instance, early studies have primarily focused on the response to single types of disasters, such as earthquakes, floods, and typhoons, to assess urban resilience. Flood resilience studies have optimized the identification of high-risk areas and infrastructure layout using artificial neural networks, Geographic Information Systems (GISs), and multi-scale assessment models [7,8,9]; earthquake resilience research has focused on spatial vulnerability analysis and the integration of post-disaster recovery strategies [10,11,12]; heatwave resilience studies have emphasized the role of green infrastructure in mitigating heatwaves [13]; and wind disaster resilience research has concentrated on infrastructure wind-resistance performance and rapid recovery mechanisms [14].
As disaster types and risks become increasingly complex and interwoven, the traditional paradigm of studying single disasters has gradually revealed its limitations, failing to effectively address the comprehensive impacts of multiple and compound disaster risks on urban systems. The risks faced by cities are often crosscutting, cascading, and non-linear [15,16]. For example, extreme weather events and social pandemic crises often interact, forming complex disaster compound effects [17]. In such cases, resilience assessments for single disaster types cannot effectively capture the interrelationships and cumulative effects among these disasters [18,19].
To address this complex scenario, recent research has gradually shifted towards assessing urban resilience in the context of multi-hazard compound events, particularly focusing on the interactions between different types of disasters and their multidimensional impacts on urban systems. In this process, scholars have clarified two distinct types, “overlapping disasters” and “interacting disasters,” to more accurately characterize the relationships between disaster events. “Overlapping disasters” refer to different disaster events occurring simultaneously in time or space without direct interaction between them. For example, floods and typhoons might happen at the same time or place, but their effects are independent and do not mutually trigger or exacerbate each other. In contrast, “interacting disasters” involve direct interaction effects between disasters, such as heavy rain from a typhoon worsening flood disasters, or secondary disasters triggered by earthquakes (e.g., landslides, fires), causing more complex impacts on urban systems. Interactive disasters typically amplify the overall effects of disasters, further increasing the challenges for urban systems to respond to disasters and making resilience requirements even more stringent [20,21].
This shift marks a transformation in research perspectives from assessing the impact of single-hazard events on urban resilience to focusing on the comprehensive effects of interactions and synergies between multiple disasters on urban systems. In the context of multiple disasters, research on urban resilience not only continues the evaluation of infrastructure and recovery capabilities from single disaster studies but also involves the analysis of system dynamics, interdependencies, and synergistic effects [22,23]. Scholars have recognized that in multi-disaster scenarios, disasters not only directly impact urban infrastructure, economic systems, and social structures, but the interactions between different disasters often trigger and amplify each other’s effects, significantly increasing the vulnerability of urban systems [20,24]. Therefore, assessing resilience at the system level and identifying key vulnerable links in a multi-disaster environment has become an important direction for current research [25,26].
The mainstream research paradigm has shifted from single disaster assessments to comprehensive evaluations of chain risks from multiple disasters, focusing on the interaction effects of events such as typhoons, heavy rainfall, and urban flooding [27,28]. In terms of modeling methods, experimental studies have applied dynamic Bayesian neural networks combined with artificial intelligence to demonstration areas of 5 km2, which are capable of performing rolling updates to infrastructure resilience curves for roads, pipelines, and power grids within about 30 min [29]. However, these technologies remain in the pilot phase, facing significant limitations in data and computing power for city-wide promotion. The feasibility and effectiveness of practical applications still require further validation. In spatial analysis, existing research has combined generalized weighted regression (GWR) with spatial machine learning, achieving an R2 ≈ 0.81 fitting accuracy in high-density data regions such as the core 16 cities of the Yangtze River Delta, and produced 1 km grid resilience hotspot–coldspot maps to illustrate vulnerability and resilience differences across different regions. However, this accuracy depends on high-resolution input data, and its application in different regions may face challenges related to data adaptation and model generalizability, posing certain uncertainties [11]. Additionally, existing research has successfully conducted flood–heatwave digital twin simulations with 1 m resolution and 1 s time step in a 5 km2 demonstration area. However, the application of similar technologies in large-scale urban environments still faces bottlenecks in data collection and computing resources, remaining in the experimental stage and not ready for immediate widespread adoption at the city level [30]. With the continuous advancement of methodology, research perspectives have gradually expanded to analyze the key driving factors affecting urban resilience. In terms of research perspectives, existing studies have expanded their focus from a single instance of physical infrastructure to a “building-infrastructure-society” coupled system, beginning to explore the exposure of vulnerable groups and linking it to SDG-11 goals. However, current empirical research is mostly limited to data-intensive high-density cities, with cases still in the stage of continuous accumulation [31]. In the analysis of driving factors, scholars have employed various methods to identify key factors influencing urban resilience. Single-factor analysis has gradually proven insufficient in revealing the deeper mechanisms of resilience formation. As a result, recent studies have introduced more multidimensional factor interaction analysis methods. For example, methods such as geographic detectors can reveal interaction effects between different factors. Some researchers have assessed the urban resilience of the Beijing–Tianjin–Hebei urban agglomeration and analyzed the coupling and coordination relationships between subsystems. The results show that factors such as infrastructure and ecological environment have a significant impact on urban resilience [32]. Moreover, factor analysis and system dynamics modeling have been used to further identify dynamic factors in the evolution of urban resilience and their mechanisms. Specifically, scholars commonly use the following methods to identify and assess driving factors: First, spatial autocorrelation analysis reveals the clustering effects of urban resilience in different geographic areas, identifying the spatial distribution of high- and low-resilience regions, providing scientific evidence for resilience improvement strategies [33]. Second, multi-attribute decision analysis, combined with weight assessments, offers a quantitative, multidimensional evaluation framework for urban resilience [34]. Additionally, big data analysis and machine learning methods have begun to be widely applied in urban resilience research, allowing the identification of potential resilience factors through large volumes of historical disaster data and enabling the prediction and simulation of future disaster scenarios [35]. For instance, in response to Typhoon “Krathon” in 2024, a study combined GIS with the random forest algorithm to assess the future flood susceptibility of Keelong City. The model achieved an accuracy rate of 97.45%, providing decision support for emergency resource deployment [36]. Other studies have successfully simulated the “physical-social” coupled resilience of 1.8 million buildings in the San Francisco Bay Area under the scenario of a 7.0 magnitude Hayward earthquake [37]. Some researchers are adapting this framework to the Sichuan–Yunnan seismic belt to overcome the limitations of traditional elastic-plastic time-history analysis, which only focuses on the “individual building-earthquake” aspect [38].
Although significant progress has been made in the integration of methods and spatial analysis in urban resilience research in the context of multiple disasters in recent years, there are still several common and key limitations. First, current research often focuses on mega-city clusters or economically developed regions such as the Yangtze River Delta and Beijing–Tianjin–Hebei, with insufficient attention given to medium and small cities. This leads to limited applicability and generalizability of resilience assessment models in regions with complex topography and intertwined disaster chains [39]. Second, most studies continue to focus on “disaster overlap” instead of “disaster interaction,” lacking dynamic modeling of the cascading effects and nonlinear amplification mechanisms of disaster chains. As a result, it is difficult to truly reflect the impact pathways of the interactions between multiple disasters on urban systems [40]. Third, some studies over-rely on machine learning models, such as random forests and neural networks. Although these models perform well in prediction accuracy, they often lack the ability to explain local disaster dynamics [41]. These model-driven forecasting methods face significant limitations when providing decision support, making it challenging to offer realistic, actionable policy guidance and practical solutions for local emergency responses and spatial planning.
The PSR framework provides a systematic assessment tool for evaluating urban resilience in multi-hazard contexts. The PSR model, with its clear causal chain, offers simplicity and effectiveness in integrating multi-source spatial indicators, and has proven suitable for assessing urban resilience under multiple disaster scenarios. Specifically, the pressure layer of the PSR framework can simultaneously incorporate the intensities of different disaster events, such as typhoons, floods, and heatwaves, comprehensively reflecting the impact of disasters; the state layer quantifies the current status of ecology, infrastructure, and socio-economic conditions, assessing the vulnerability and resilience of urban systems; the response layer evaluates the effectiveness of coordinated policies and engineering measures under multiple disasters. Therefore, this study will construct an evaluation indicator system based on the PSR framework to reveal the resilience evolution mechanism under the interaction of multiple disasters, providing theoretical support for further strategies to enhance urban resilience.
Based on these challenges, this study uses Sanming City in Fujian Province as a case study, employing the PSR model and multidimensional analysis methods to systematically explore the dynamic characteristics and spatial evolution patterns of urban resilience in the context of multiple disasters. By integrating multi-source data and spatial analysis techniques, this study reveals the resilience distribution characteristics of Sanming City and identifies key vulnerable areas. The aim of this research is to fill the theoretical and practical gaps in multi-disaster resilience studies and provide scientific evidence for disaster resistance planning in coastal cities in southeastern China.
2. Materials and Methods
2.1. Study Area
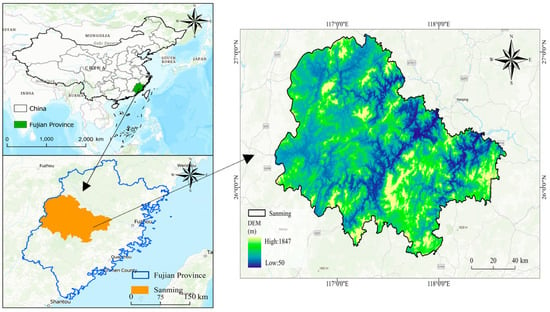
Sanming City is situated in the northwestern part of Fujian Province, within China’s southeastern coastal region. Affected by a subtropical monsoon climate blending oceanic and continental characteristics, the city faces frequent extreme weather events like typhoons and heavy rainfall. Summer months feature concentrated precipitation and convective storms, often triggering cascading disasters such as mountain floods, landslides, and mudflows [42,43]. The long-term superposition effect of multiple disaster chains has made Sanming City one of with high disaster exposure and significant vulnerability in the southeast coast (Figure 1). Extreme weather events often cause large-scale disasters and severe losses. A notable example is 12 June 2022, which had a continuous heavy rainfall event, causing widespread geological disasters affecting 120,200 people, damage to crops and infrastructure, and economic losses exceeding CNY 1.349 billion. These challenges highlight the critical need for enhanced risk assessment and resilience strategies in Sanming City to advance disaster prevention, mitigation, and sustainable development.
Figure 1.
Location of the study area.
2.2. Data Sources and Preprocessing
This study utilizes four primary data categories, ecological data, infrastructure data, socio-economic-population data, and meteorological data, spanning the period from 2014 to 2022. Ecological data comprise the NDVI, PM2.5 concentrations, and impervious surface area; infrastructure data include drainage pipe density, water supply pipe density, and road networks; socio-economic-population data encompass population density, Points of Interest, GDP spatial distribution, and nighttime light intensity; meteorological data cover rainfall, temperature, and wind speed. The data sources are detailed in Table 1. Considering that some original data have high spatial resolution, to balance computational efficiency and spatial detail, this study resampled all raster data to a uniform 3 km × 3 km spatial scale to ensure consistency and comparability of the analysis [44,45,46,47]. Due to the lack of spatial GDP distribution data for 2022, linear interpolation was used to supplement the missing data. Although economic fluctuations might occur in 2022 due to the pandemic, considering that Sanming City’s annual economic growth is relatively stable, the linear interpolation assumption can reasonably reflect the spatial GDP distribution characteristics of that year. Additionally, geological hazard risk points data only cover 2020; these are treated as static indicators, assuming little change over the study period, neglecting dynamic changes such as new risk points caused by natural factors, human activities, or worsening of existing risks in recent years.
Table 1.
Data sources.
2.3. Establishment of the Urban Resilience Assessment System
2.3.1. Conceptual Framework for Urban Resilience Assessment
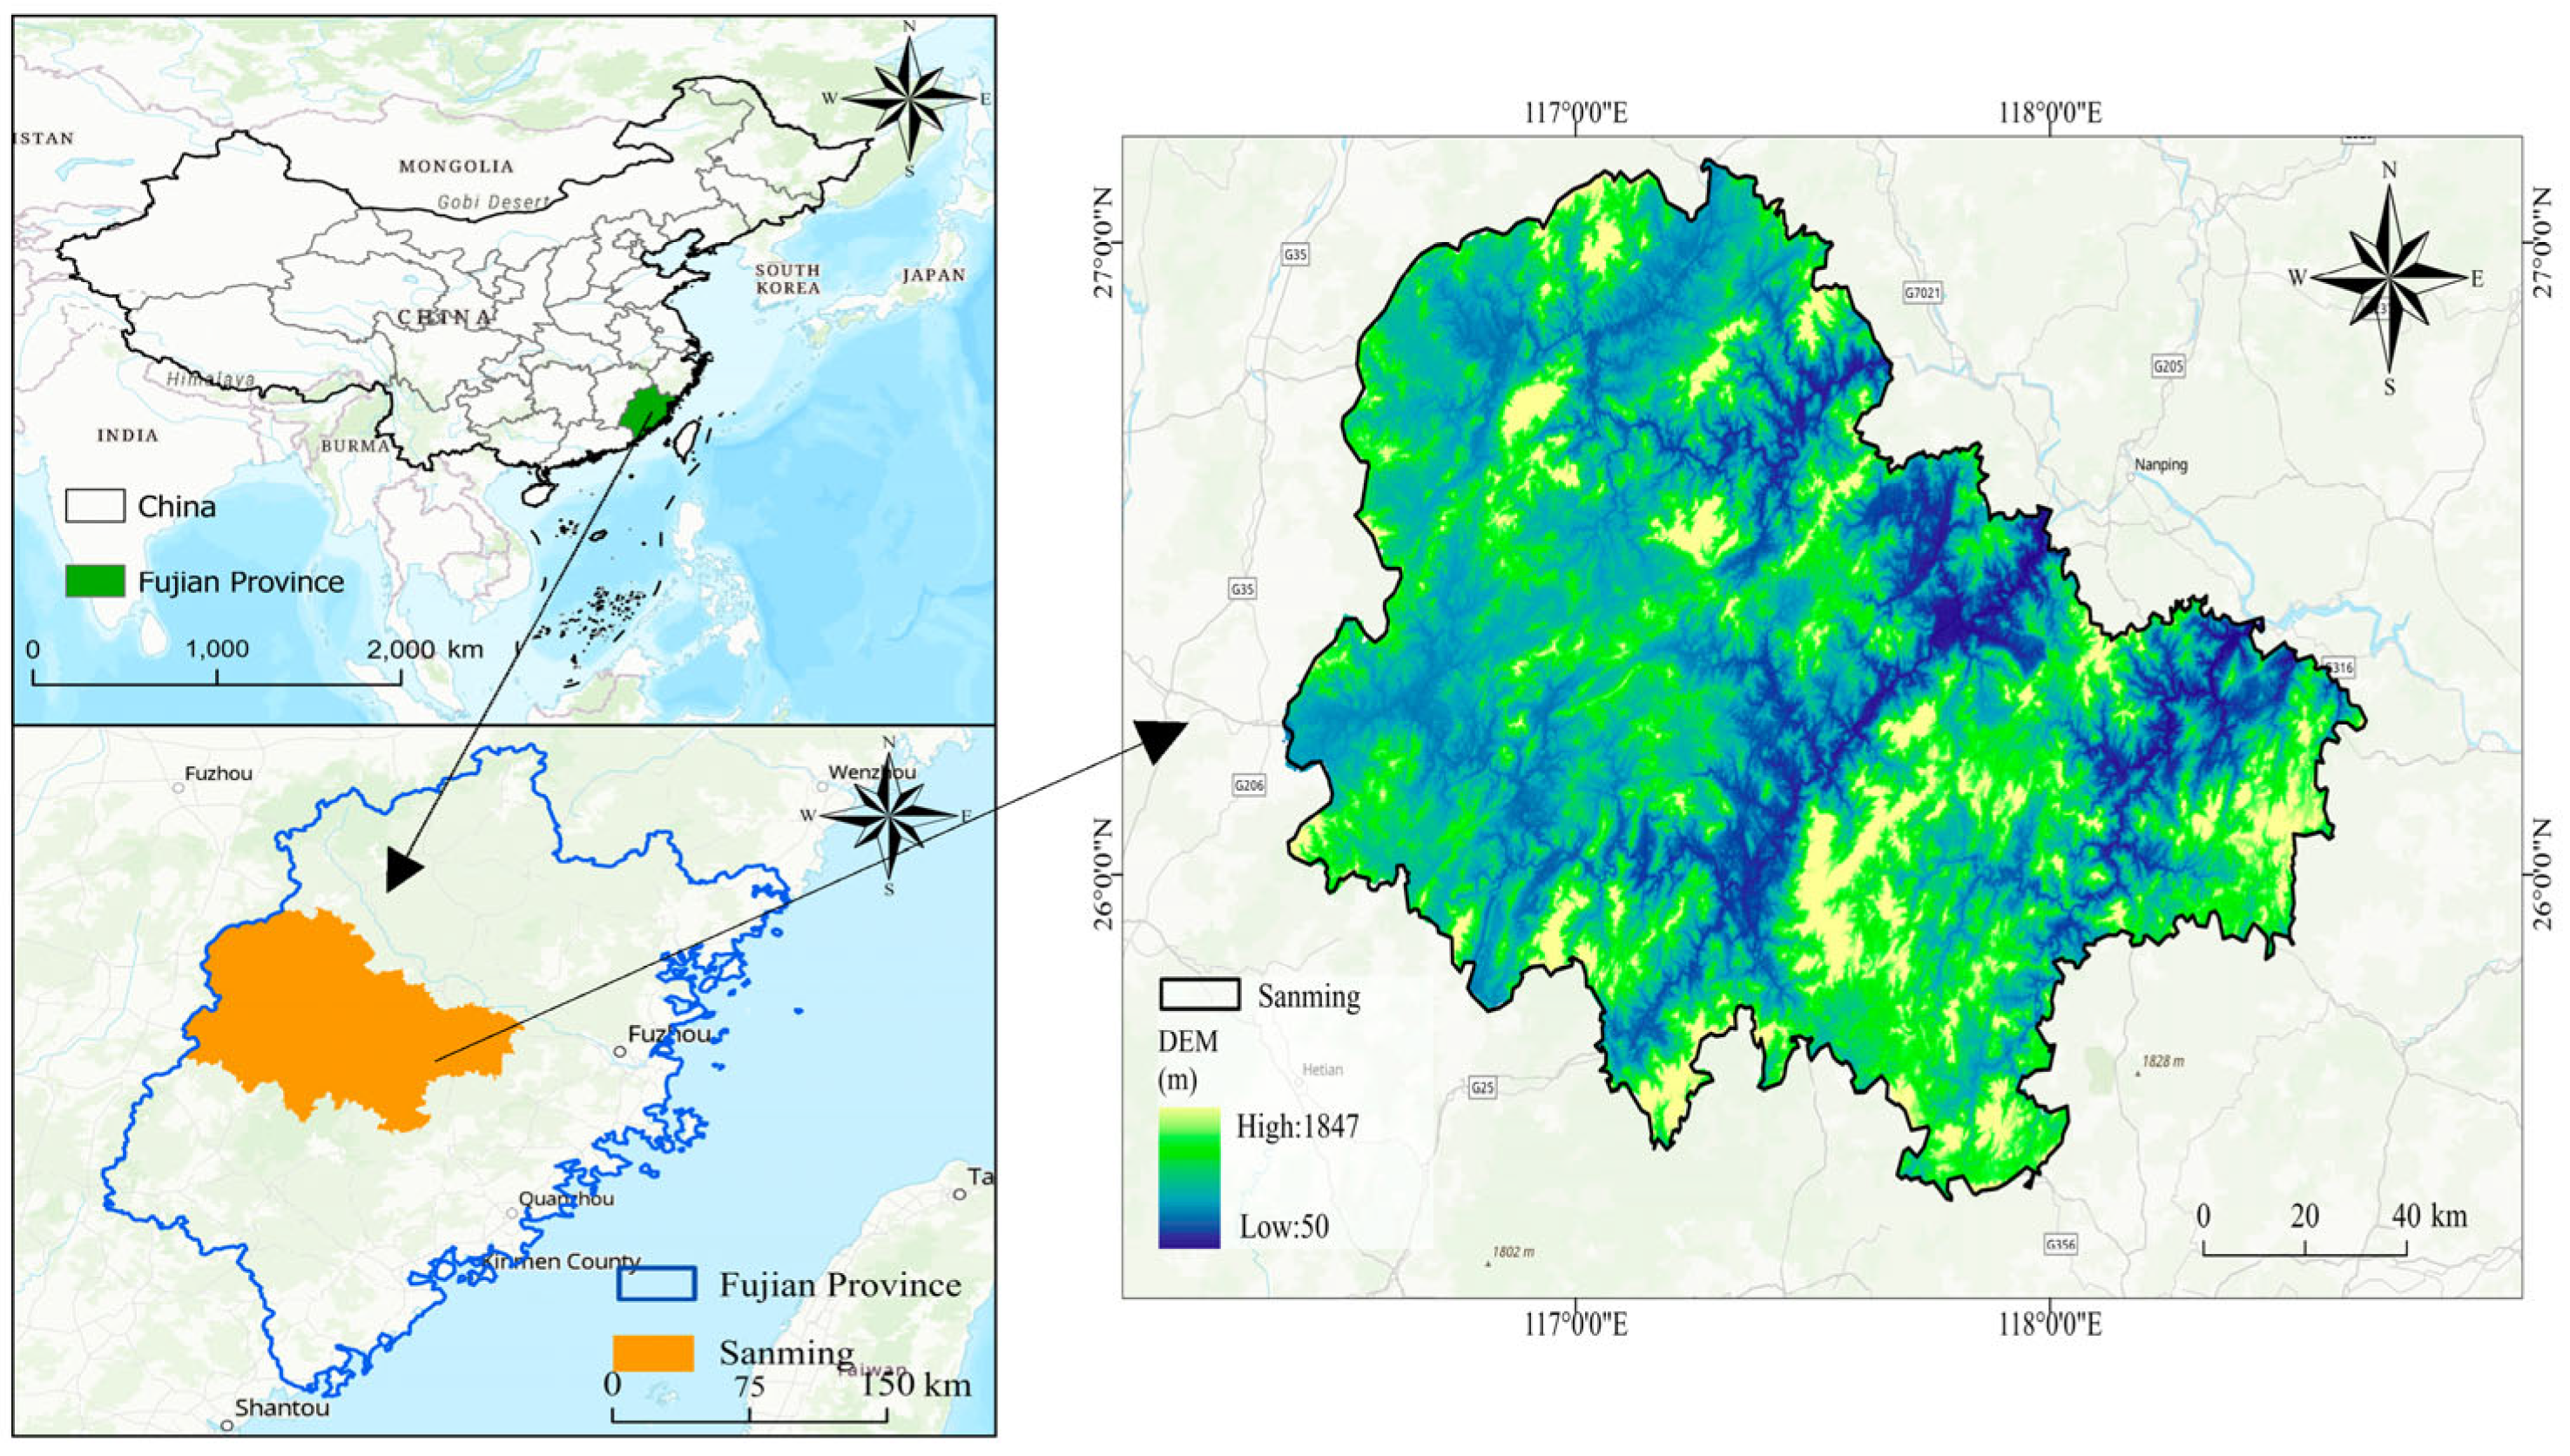
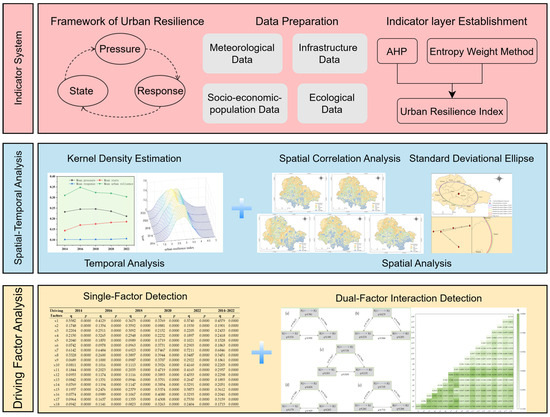
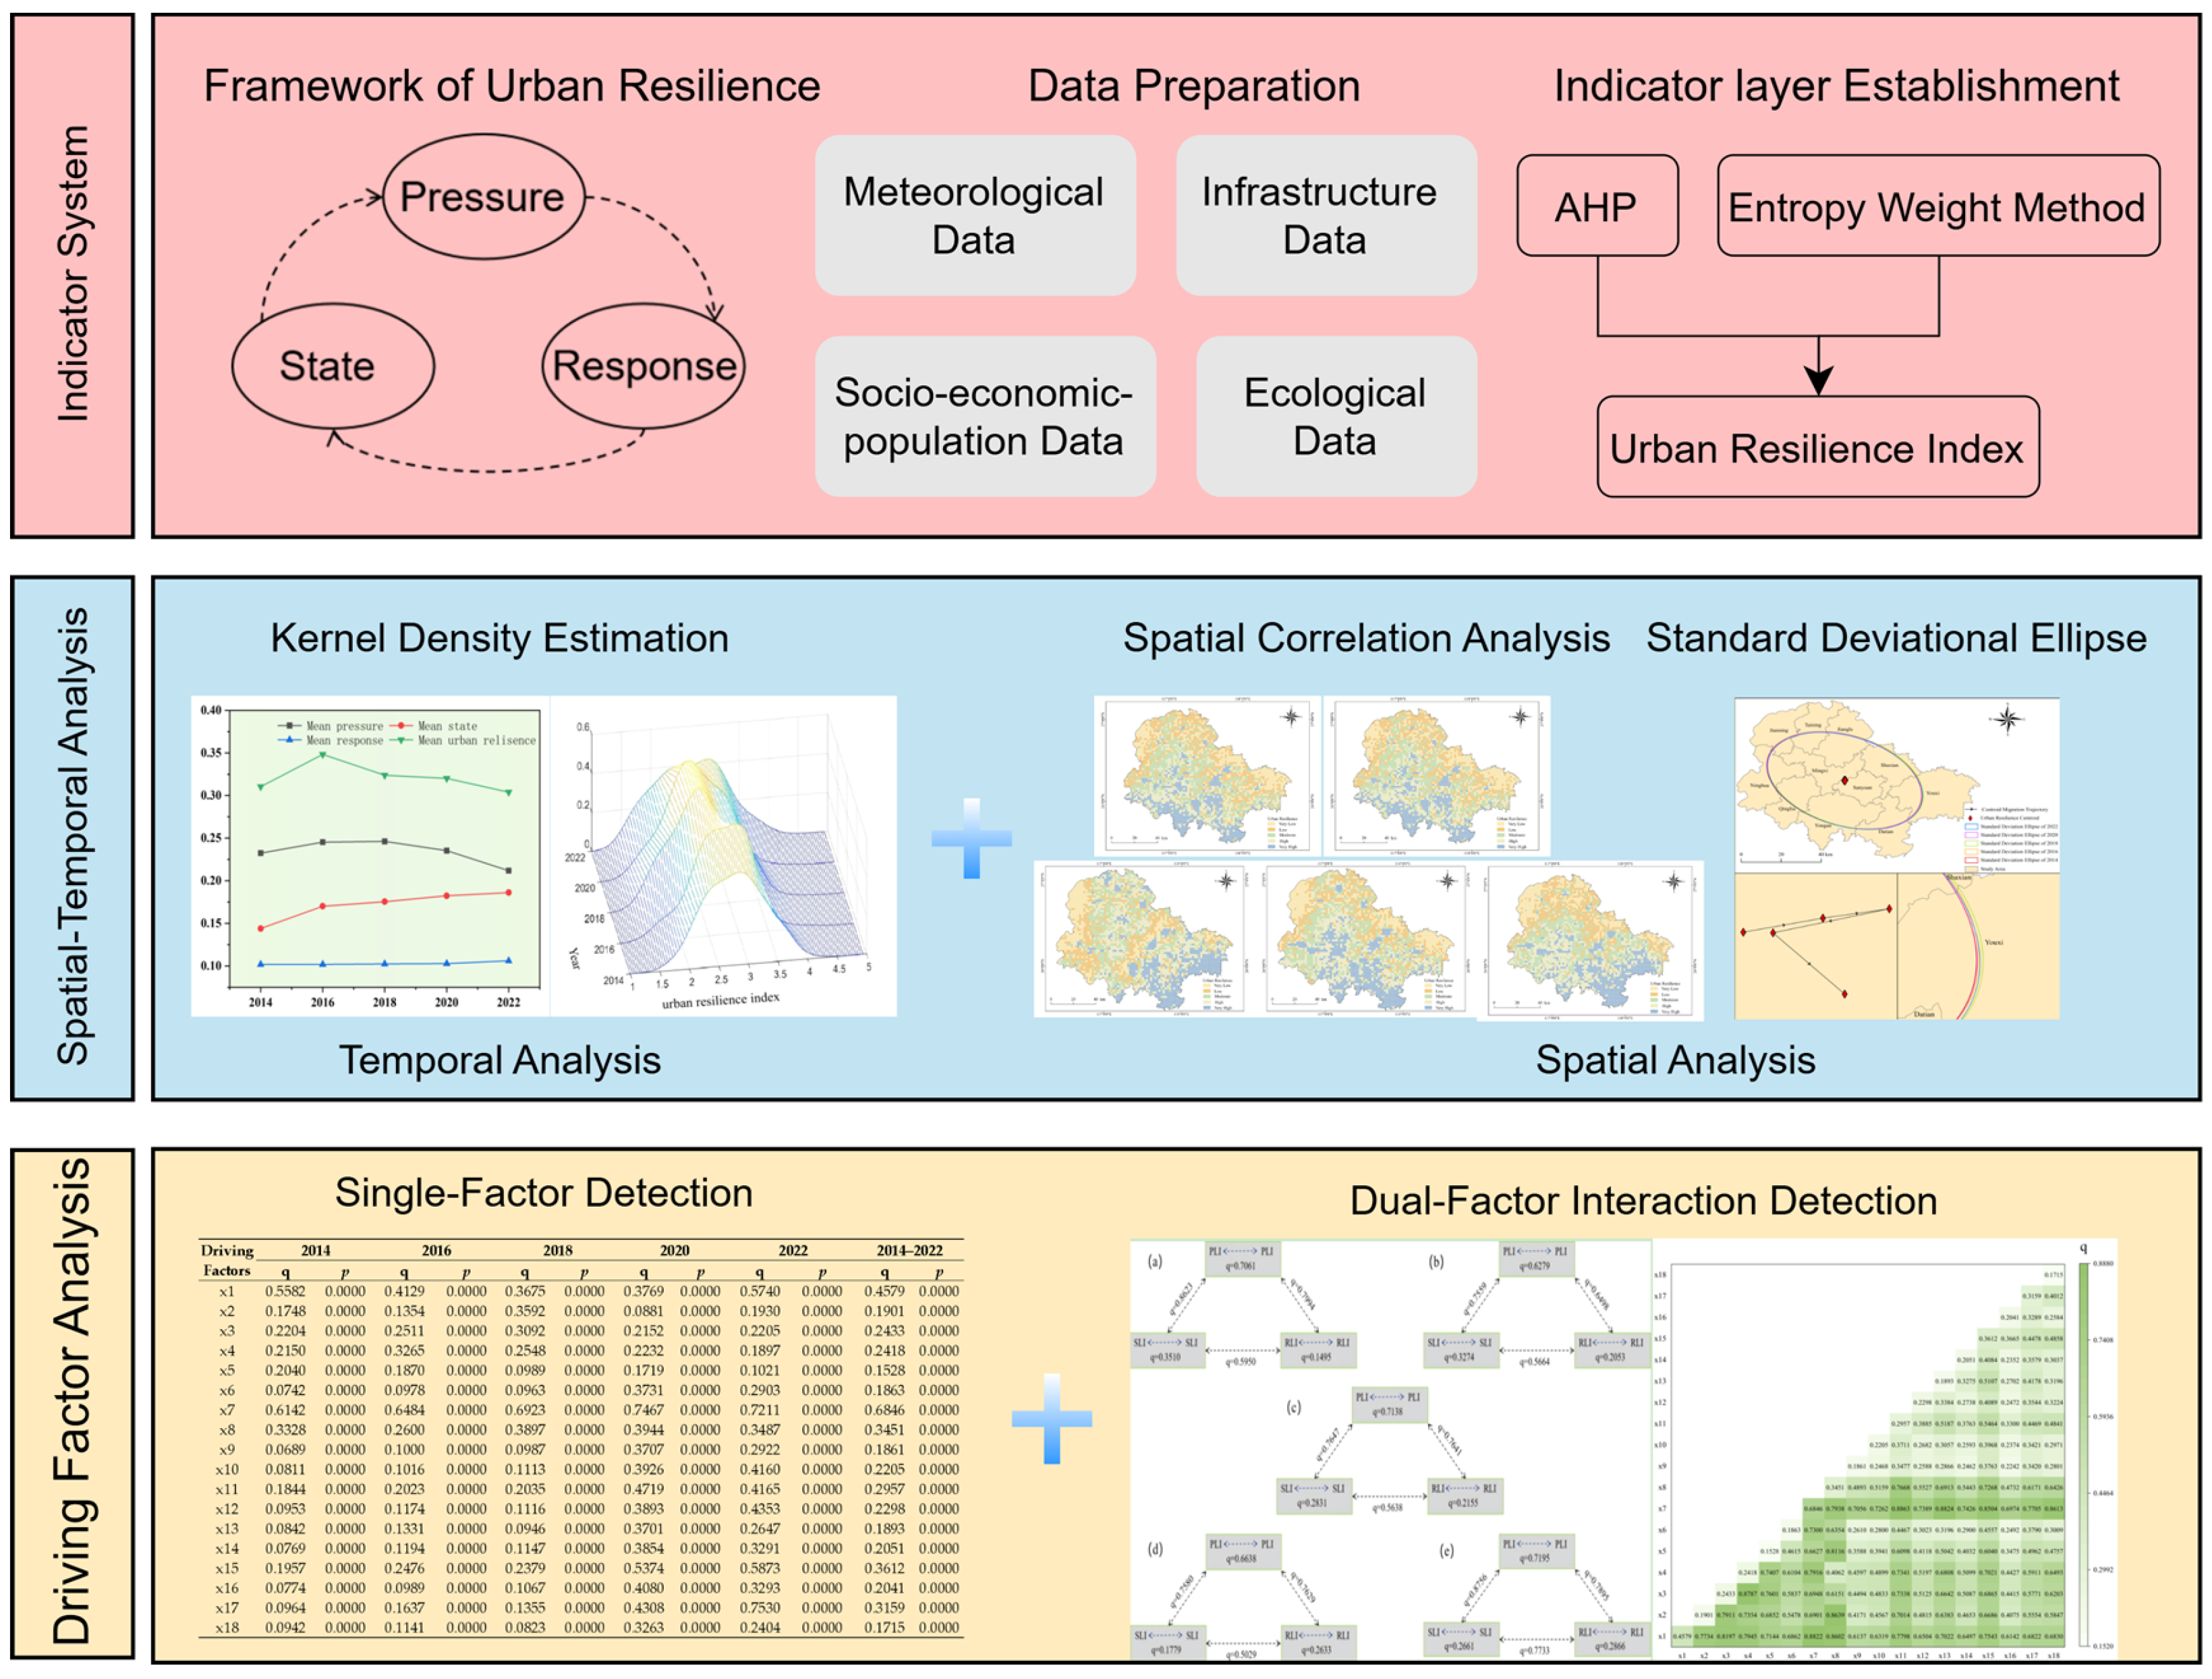
This study develops a conceptual framework for urban resilience assessment grounded in the PSR model, designed to analyze the dynamic adaptive capacity of urban systems under multi-hazard contexts. The framework integrates multi-source data and employs multi-method analysis across three core modules: indicator system construction, spatial–temporal analysis, and driving factor identification.
In the analysis process, the index system construction module first collects meteorological, infrastructure, socio-economic-population, and ecological data, followed by preprocessing of these data. The weights of indicators are then determined by combining the Analytic Hierarchy Process (AHP) with the entropy weight method, balancing expert subjective judgments with objective data characteristics to generate an initial urban resilience index. Subsequently, the spatial–temporal analysis module conducts kernel density estimation (KDE), spatial autocorrelation, and standard deviation ellipse analyses on this index to reveal the evolution trend of resilience in a time series and its spatial pattern and center-of-gravity migration trajectory. Finally, the driving factor identification module introduces the geographic detector for single-factor and double-factor interaction detection, quantifying the contribution of each factor to resilience differences and their synergistic effects, thereby analyzing the key driving mechanisms of urban resilience changes. The framework emphasizes the dynamic feedback mechanisms between the pressure layer (external disturbances), state layer (system conditions), and response layer (intervention and recovery capacity). By linking stressors, system states, and adaptive actions, this structure provides theoretical and methodological support for assessing urban resilience and its spatial–temporal analysis. The framework is illustrated in Figure 2.
Figure 2.
Research contents and analytical framework for urban resilience assessment.
2.3.2. Construction of the Urban Resilience Indicator System
The urban resilience indicator system is constructed based on the PSR framework, which was first proposed by Friend and Rappaport in 1979. Initially applied to environmental management assessments, the PSR framework has since been widely adopted in urban resilience research [48]. The PSR framework systematically reveals the dynamic interactions between natural, social, and economic systems under disaster shocks through three layers: pressure, state, and response. The pressure layer quantifies external disasters (such as typhoons, floods, and geological hazards) and population pressure that disturb the urban system; the state layer describes the current condition of the urban system, including ecological health, infrastructure completeness, and economic development level, which are the results of pressure and the basis for responses; and the response layer reflects societal and policy interventions, such as infrastructure optimization and ecological protection strategies, which mitigate pressure or enhance the state through feedback mechanisms, thus improving urban resilience. Compared to other frameworks, the PSR framework demonstrates higher applicability in assessing urban resilience under multi-disaster contexts due to its simplicity and clear causal logic. However, this framework may oversimplify the capturing of feedback complexity and nonlinear coupling relationships, potentially underestimating the interdependencies and dynamic complexity within the system [49,50].
Based on this framework, this study develops an urban resilience indicator system for Sanming City, considering the multi-disaster context (including typhoons, floods, and geological hazards). The system includes three layers—pressure, state, and response—comprising 18 indicators that reflect natural disaster pressure, population pressure, the current status of urban systems, and post-disaster recovery capabilities. The selection of indicators is based on urban resilience theory, regional disaster characteristics, and support from the literature to ensure scientific rigor and relevance. The weights of the indicators are optimized using the AHP–entropy weight method, combining subjective judgment with objective data characteristics, enhancing the reliability of the evaluation results. The indicator system and weights are shown in Table 2.
Table 2.
Urban resilience indicator system and weights (weights are calculated using the AHP and entropy weight method, “+” indicates a positive effect on urban resilience, “−” indicates a negative or counteracting effect).
2.3.3. Multi-Criteria Decision-Making Method for Urban Resilience Index
- 1.
- AHP and Entropy Weight Combination Method
To reasonably measure the relative importance of each indicator to urban resilience, this study adopts a combined weighting method combining AHP with the entropy weight method. AHP determines the subjective weights of indicators through expert judgment, while the entropy weight method calculates objective weights based on data distribution, quantifying the degree of dispersion of indicator information. By integrating subjective experience with objective characteristics, more scientific and reliable weights are generated for subsequent urban resilience index calculations.
- 2.
- KDE
To analyze the spatial and temporal distribution characteristics of urban resilience in Sanming City, this study employs the KDE method. KDE is a non-parametric probability density estimation method that can smoothly present the data distribution morphology by placing kernel functions around each data point and performing weighted averages without assuming specific types of data distributions. This study uses the KDE method to reveal the dynamic evolution rules of the resilience index, identify central tendencies, spatial differences, and extreme value regions of resilience levels, providing a visualization and quantitative basis for understanding the spatial–temporal changes in urban resilience. The mathematical formulation of KDE is as follows:
The function is referred to as the “kernel function,” and represents the bandwidth. In this study, the kernel density function employed is the Gaussian kernel.
- 3.
- Spatial Autocorrelation Analysis
To reveal the spatial distribution pattern of urban resilience in Sanming City, this study adopts the spatial autocorrelation analysis method. Global Moran’s I can measure the spatial correlation of resilience values across the entire study area, reflecting whether the resilience index shows a spatial aggregation or dispersion trend. Local Moran’s I is used to analyze the local correlation between individual spatial units and their neighborhoods, helping to identify high–high clusters (concentrations of high-resilience areas), low–low clusters (concentrations of low-resilience areas), and outliers, providing a basis for discovering differences in urban resilience spatial patterns and potential risk areas [51]. The formula for these analyses is as follows:
In the formula, and represent the global spatial autocorrelation and local spatial autocorrelation, respectively. denotes the number of 3 km × 3 km grids in the study area. is an spatial weight matrix. and represent attribute values, while denotes the average value of the attribute.
- 4.
- Spatial Directional Distribution Analysis
To reveal the spatial distribution trend and directional change of urban resilience in Sanming City, this study adopts the standard deviation ellipse analysis method. This method can describe the main direction, length, short axis, and diffusion range of the resilience spatial distribution by calculating the spatial gravity center and distribution dispersion degree of the resilience index, thereby intuitively reflecting the spatial characteristics of concentrated or dispersed urban resilience. Through standard deviation ellipse analysis, the migration trajectory of the spatial gravity center of urban resilience can be tracked, providing a scientific basis for understanding urban development and risk distribution [52]. The formula for calculating the standard deviation ellipse is as follows:
Among them, and are the spatial position coordinates of each element, and are the arithmetic means, while and are the centers of the ellipse.
Among them, and are the differences between the average center and the coordinates of .
Among them, and represent the standard deviations along the -axis and -axis, respectively.
2.3.4. Identification of Urban Resilience Driving Factors
The geographic detector model is used to identify and evaluate the key factors affecting urban resilience through single-factor and double-factor interaction analyses. Single-factor analysis measures the individual contribution of each independent variable to urban resilience, while double-factor interaction analysis further reveals synergistic effects between variables, quantitatively assessing how multidimensional factors jointly influence resilience. To ensure the accuracy of the analysis results, all continuous variables are divided into five levels using the natural breakpoint method. By maximizing inter-class variance and minimizing intra-class variance, similar values are clustered in the same category and significantly different values are assigned to different categories, making the differences between categories more pronounced, facilitating the geographic detector’s identification of the impact and interactions of various variables on resilience. To verify robustness, the same dataset is divided into four levels and q-values are recalculated; the results differ by no more than 2%, indicating that the 5-level division does not significantly affect the analysis results. By comparing q-values of different variable combinations, this method can intuitively reveal the roles and interaction mechanisms of ecology, infrastructure, socio-economic, and meteorological factors in urban resilience. The formula for calculation is as follows:
q represents the degree to which a driving factor influences the spatial–temporal differences in resilience. The higher the value, the more significant the driving effect of the factor on resilience; the lower the value, the weaker the effect. Nh and N represent the sample size of the h-th level and the total sample size. and σ2 represent the variance of the h-th level and the overall variance of the study area.
3. Results
3.1. Spatial–Temporal Analysis of Urban Resilience
3.1.1. Temporal Analysis
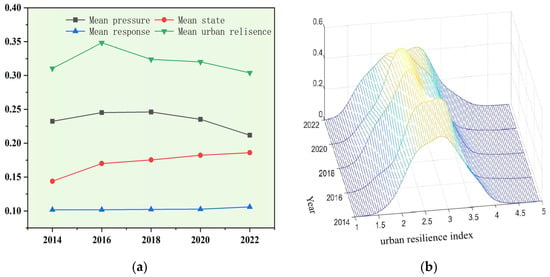
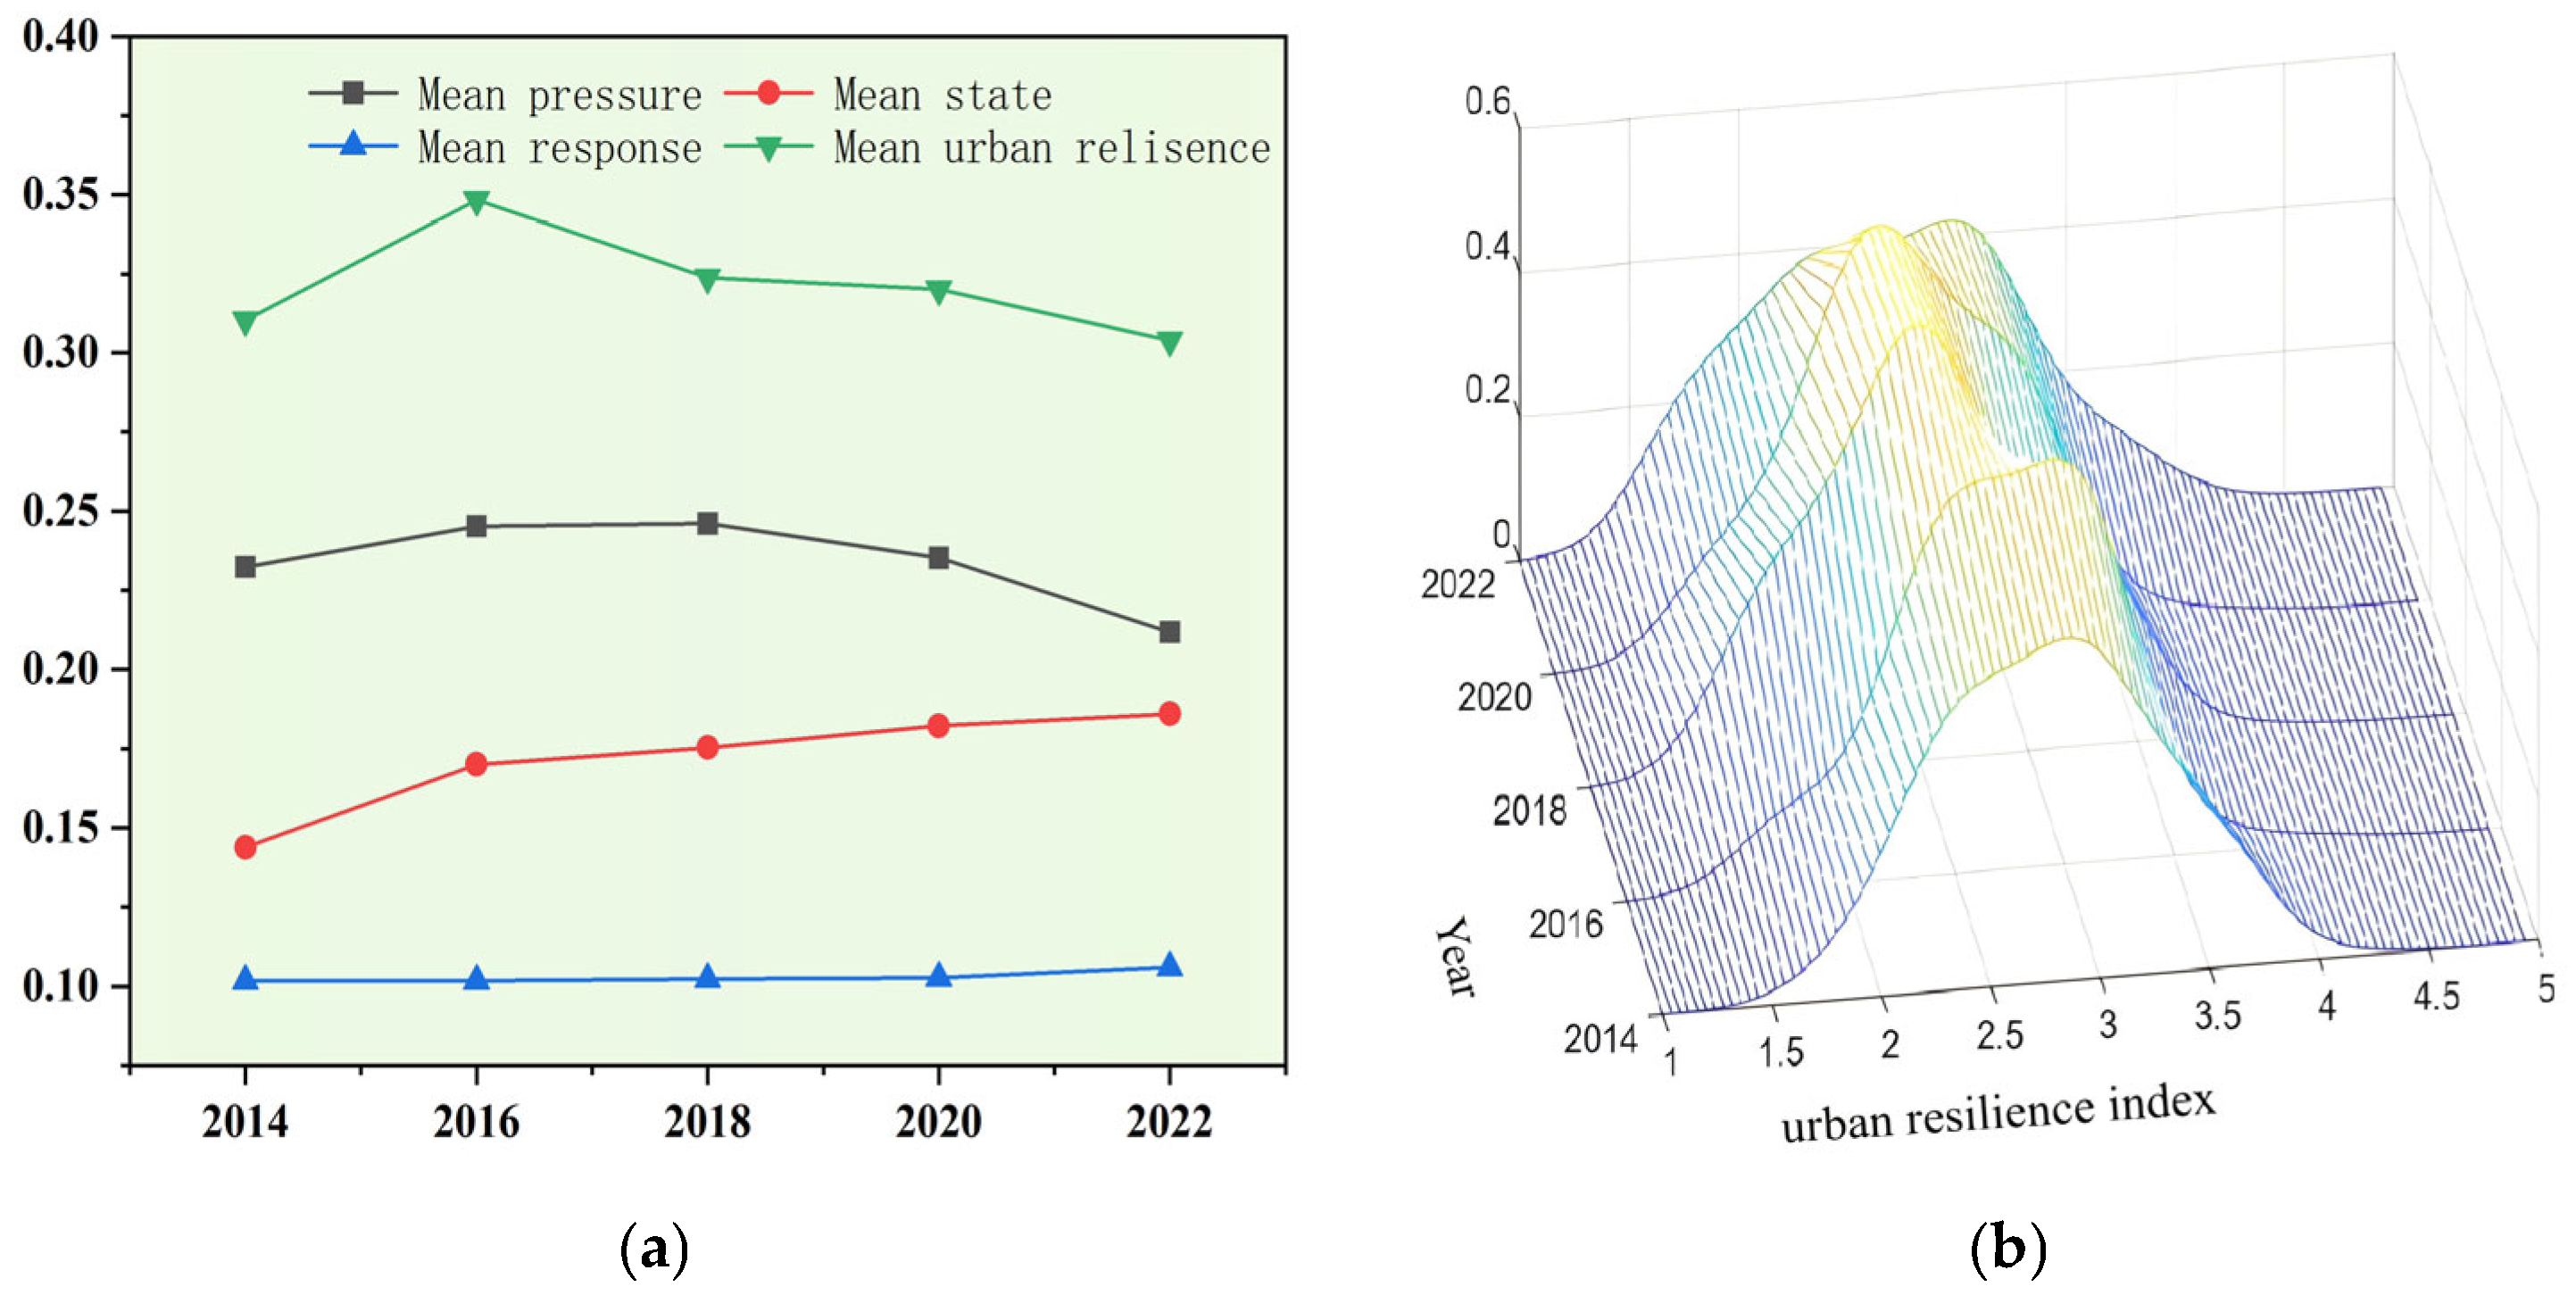
Figure 3a shows the temporal variation trends of the average resilience index and the three dimensions of the PSR model for Sanming City from 2014 to 2022. The average resilience index increased from 0.3104 in 2014 to its peak of 0.3483 in 2016, then decreased to 0.3039 in 2022, presenting a dynamic trend of “rising then falling,” but remained above 0.30, indicating that the city maintained a continuous capacity to resist disturbances.
Figure 3.
Evolution characteristics of the urban resilience index in Sanming City: (a) temporal variation trend, (b) three-dimensional kernel density results of resilience levels.
From 2014 to 2016, Sanming City was continuously affected by multiple typhoon-rainstorm events such as “Matmo,” “Phoenix,” “Soudelor,” “Dujuan,” and “Moratti,” with the annual average number of rainstorm days significantly higher than the historical mean. The resulting economic losses were relatively high, causing a significant rise in the pressure index. Following focused implementation of post-disaster policies focused on strengthening weak links in water conservation, measures such as embankment reinforcement, drainage pump station, and pipeline network renovation likely improved urban flood control infrastructure levels, alleviating flood pressures and contributing to the rise of the state indicator. Meanwhile, accelerated development of flood control and drainage planning and emergency management systems, along with enhanced construction of storage facilities, dredging of flood-prone areas, and monitoring and early warning capabilities, led to simultaneous increases in both the state and response indicators. Since 2018, the frequency and intensity of extreme typhoons and rainstorms have noticeably declined, with the average pressure index continuing to decrease; at the same time, the growth rate of municipal infrastructure construction has slowed down, and the construction of the response layer has tended towards saturation. Although the state and response indicators still show slow upward trends, the positive coupling effect within the pressure–state–response system has weakened, resulting in a moderate decline in the overall urban resilience index.
The average resilience index can reflect the overall evolutionary trend of the city, but as a mean value, it is difficult to characterize internal spatial heterogeneity. On the premise of maintaining temporal continuity, KDE can quantitatively describe the distribution pattern, polarization degree, and tail extension characteristics of resilience values within the city, thereby supplementing the spatial concentration-dispersion features that cannot be revealed by the average index. This achieves a “trend and distribution” dual-dimensional comprehensive presentation of urban resilience evolution. Figure 3b uses Matlab 2022b to measure the three-dimensional kernel density results of resilience levels in Sanming City over the study period. From a spatial evolution perspective, the center of the kernel density function shifts to the right over time, indicating an overall improvement in resilience levels. The number of peaks remains single, showing that the spatial distribution of resilience is relatively concentrated and does not exhibit a trend of multiple centers or differentiation. After reaching a high value in 2016, the main peak gradually declined, and the curve shifted from being tall and narrow to short and wide, suggesting that the spatial differences in resilience have expanded, and the absolute differences may have intensified. The proportion of high-resilience areas (≥4.0) remains low, and uneven regional development has not yet led to significant clustering of high values; the imbalance mainly manifests as differentiation within the low- and moderate-resilience intervals. Furthermore, the improvement in resilience was most pronounced in 2016, but the subsequent downward trend is noticeable, with limited progress, reflecting the potential sustainability limitations of resilience enhancement. The expansion of regional differences may stem from uneven infrastructure development, differences in ecological restoration effects, and changes in external pressures. Overall, resilience exhibited an evolutionary trajectory of first increasing and then decreasing over the study period, reaching a local peak in 2016, and the spatial distribution became more dispersed, with increasing regional imbalances in development.
3.1.2. Spatial Evolution Analysis
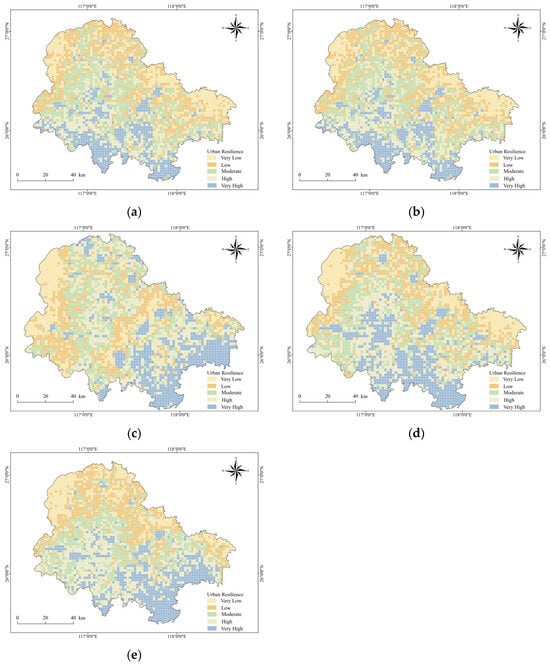
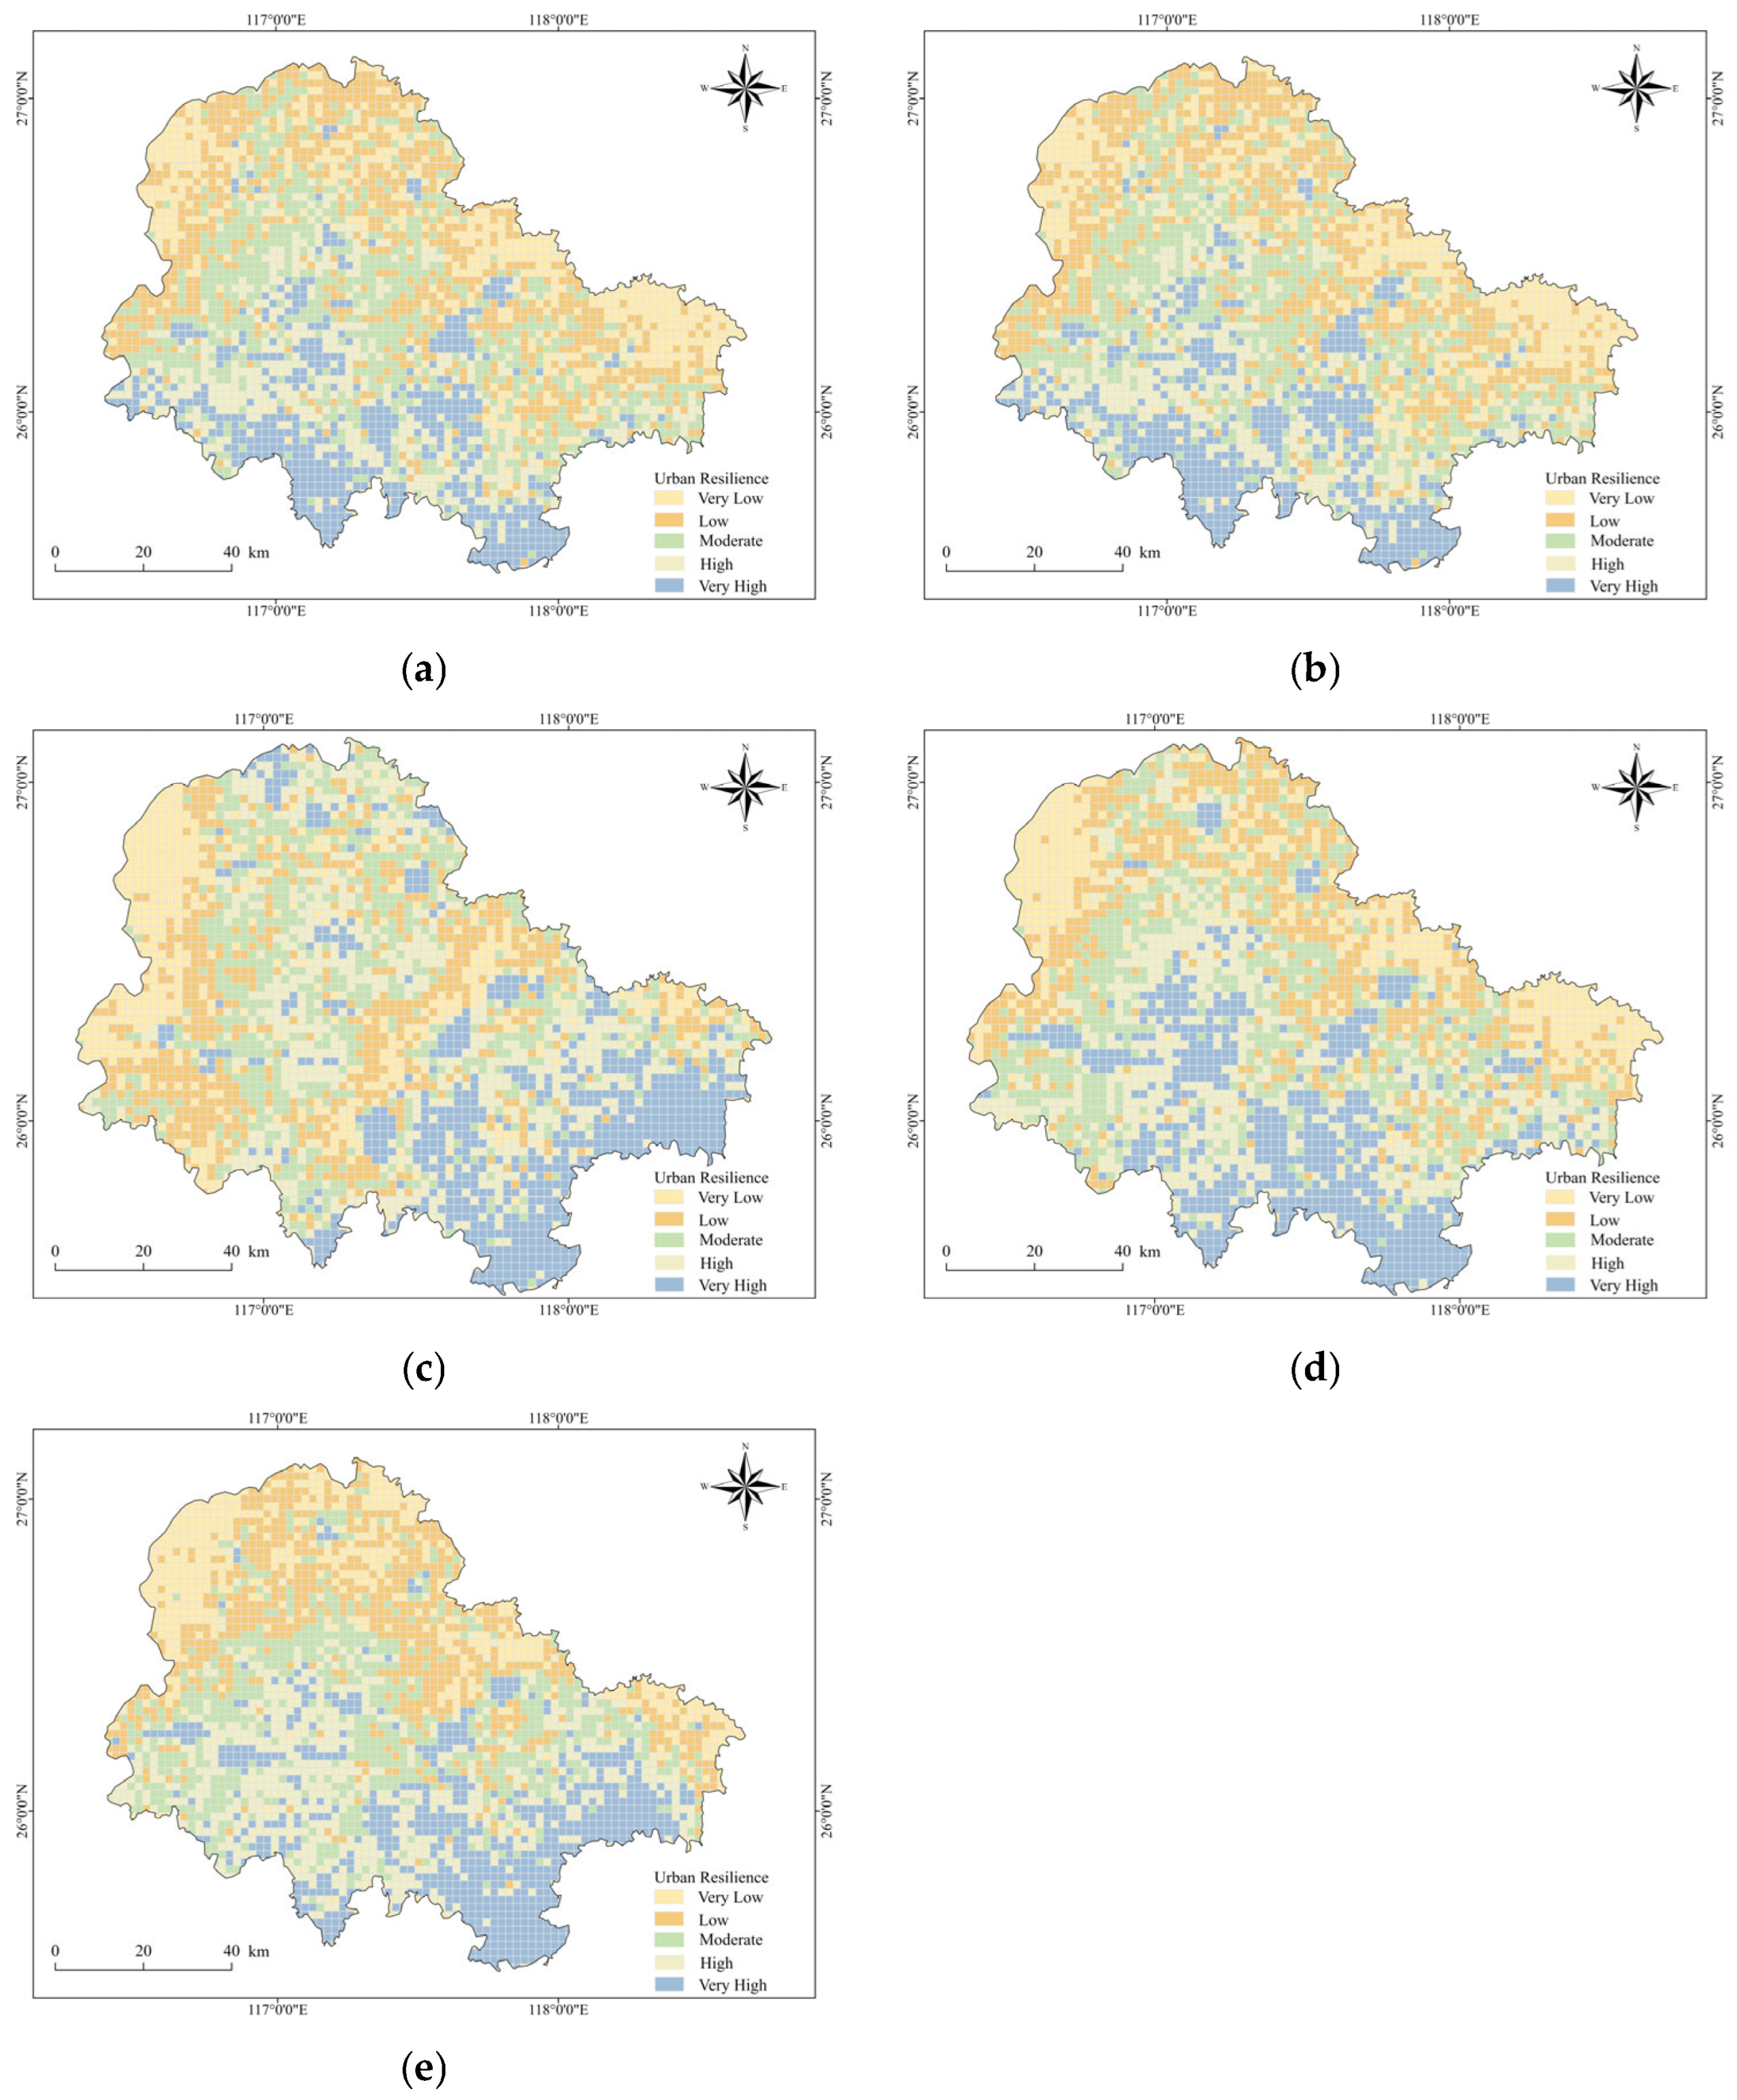
Sanming City’s urban resilience is categorized into five levels—very low, low, moderate, high, and very high (Figure 4)—using the natural breakpoint method. Overall, the city exhibits a “high in the southeast, stable in the central area, low in the northwest” spatial pattern: The northwest has relatively low resilience with significant dynamic fluctuations; the central area shows steady improvement, mostly at moderate and higher resilience levels; and the southeast consistently enhances its resilience. Spatial distributions across different years indicate that high-resilience areas are mainly concentrated in the city center and the southern region, while low-resilience areas are primarily located on the northwestern edge. At the beginning of the study (2014), higher- and very-high-resilience areas were concentrated in the city center and southern regions, showing a linear distribution. By 2016, both high- and low-resilience areas had expanded significantly, with clear spatial differentiation. The low-resilience areas in the northwest were characterized by weak infrastructure and severe ecological fragmentation. In the event of extreme rainfall or geological disasters, the city’s pipeline and road networks had weak risk resistance, leading to risk spillover. High-resilience areas were primarily concentrated in the central and southern regions, closer to the city center, where infrastructure was relatively complete and the ability to respond to risk impacts was stronger. By 2018, high-resilience areas in Sanming City were mainly concentrated in the southeast and city center regions, with a decrease in concentration and increased dispersion. Low-resilience areas expanded, which was closely related to the natural disasters and environmental risks the city faced, particularly typhoons, heavy rains, floods, and landslides. In mountainous areas and along river systems, where natural disasters are frequent, infrastructure was fragile and ecological degradation was severe, resulting in insufficient recovery capacity after disasters. In the later stages of the study (2020 and 2022), the spatial distribution of high-resilience areas was mainly influenced by rainfall distribution and infrastructure development. High-resilience areas were predominantly concentrated in the southern and central regions, forming a clear spatial contrast with the low-resilience areas in the northwest.
Figure 4.
Spatial distribution map of urban resilience in Sanming City: (a) 2014, (b) 2016, (c) 2018, (d) 2020, (e) 2022.
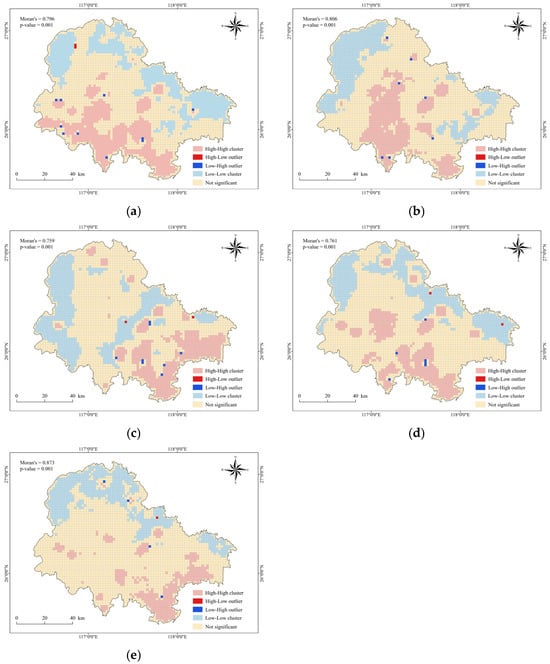
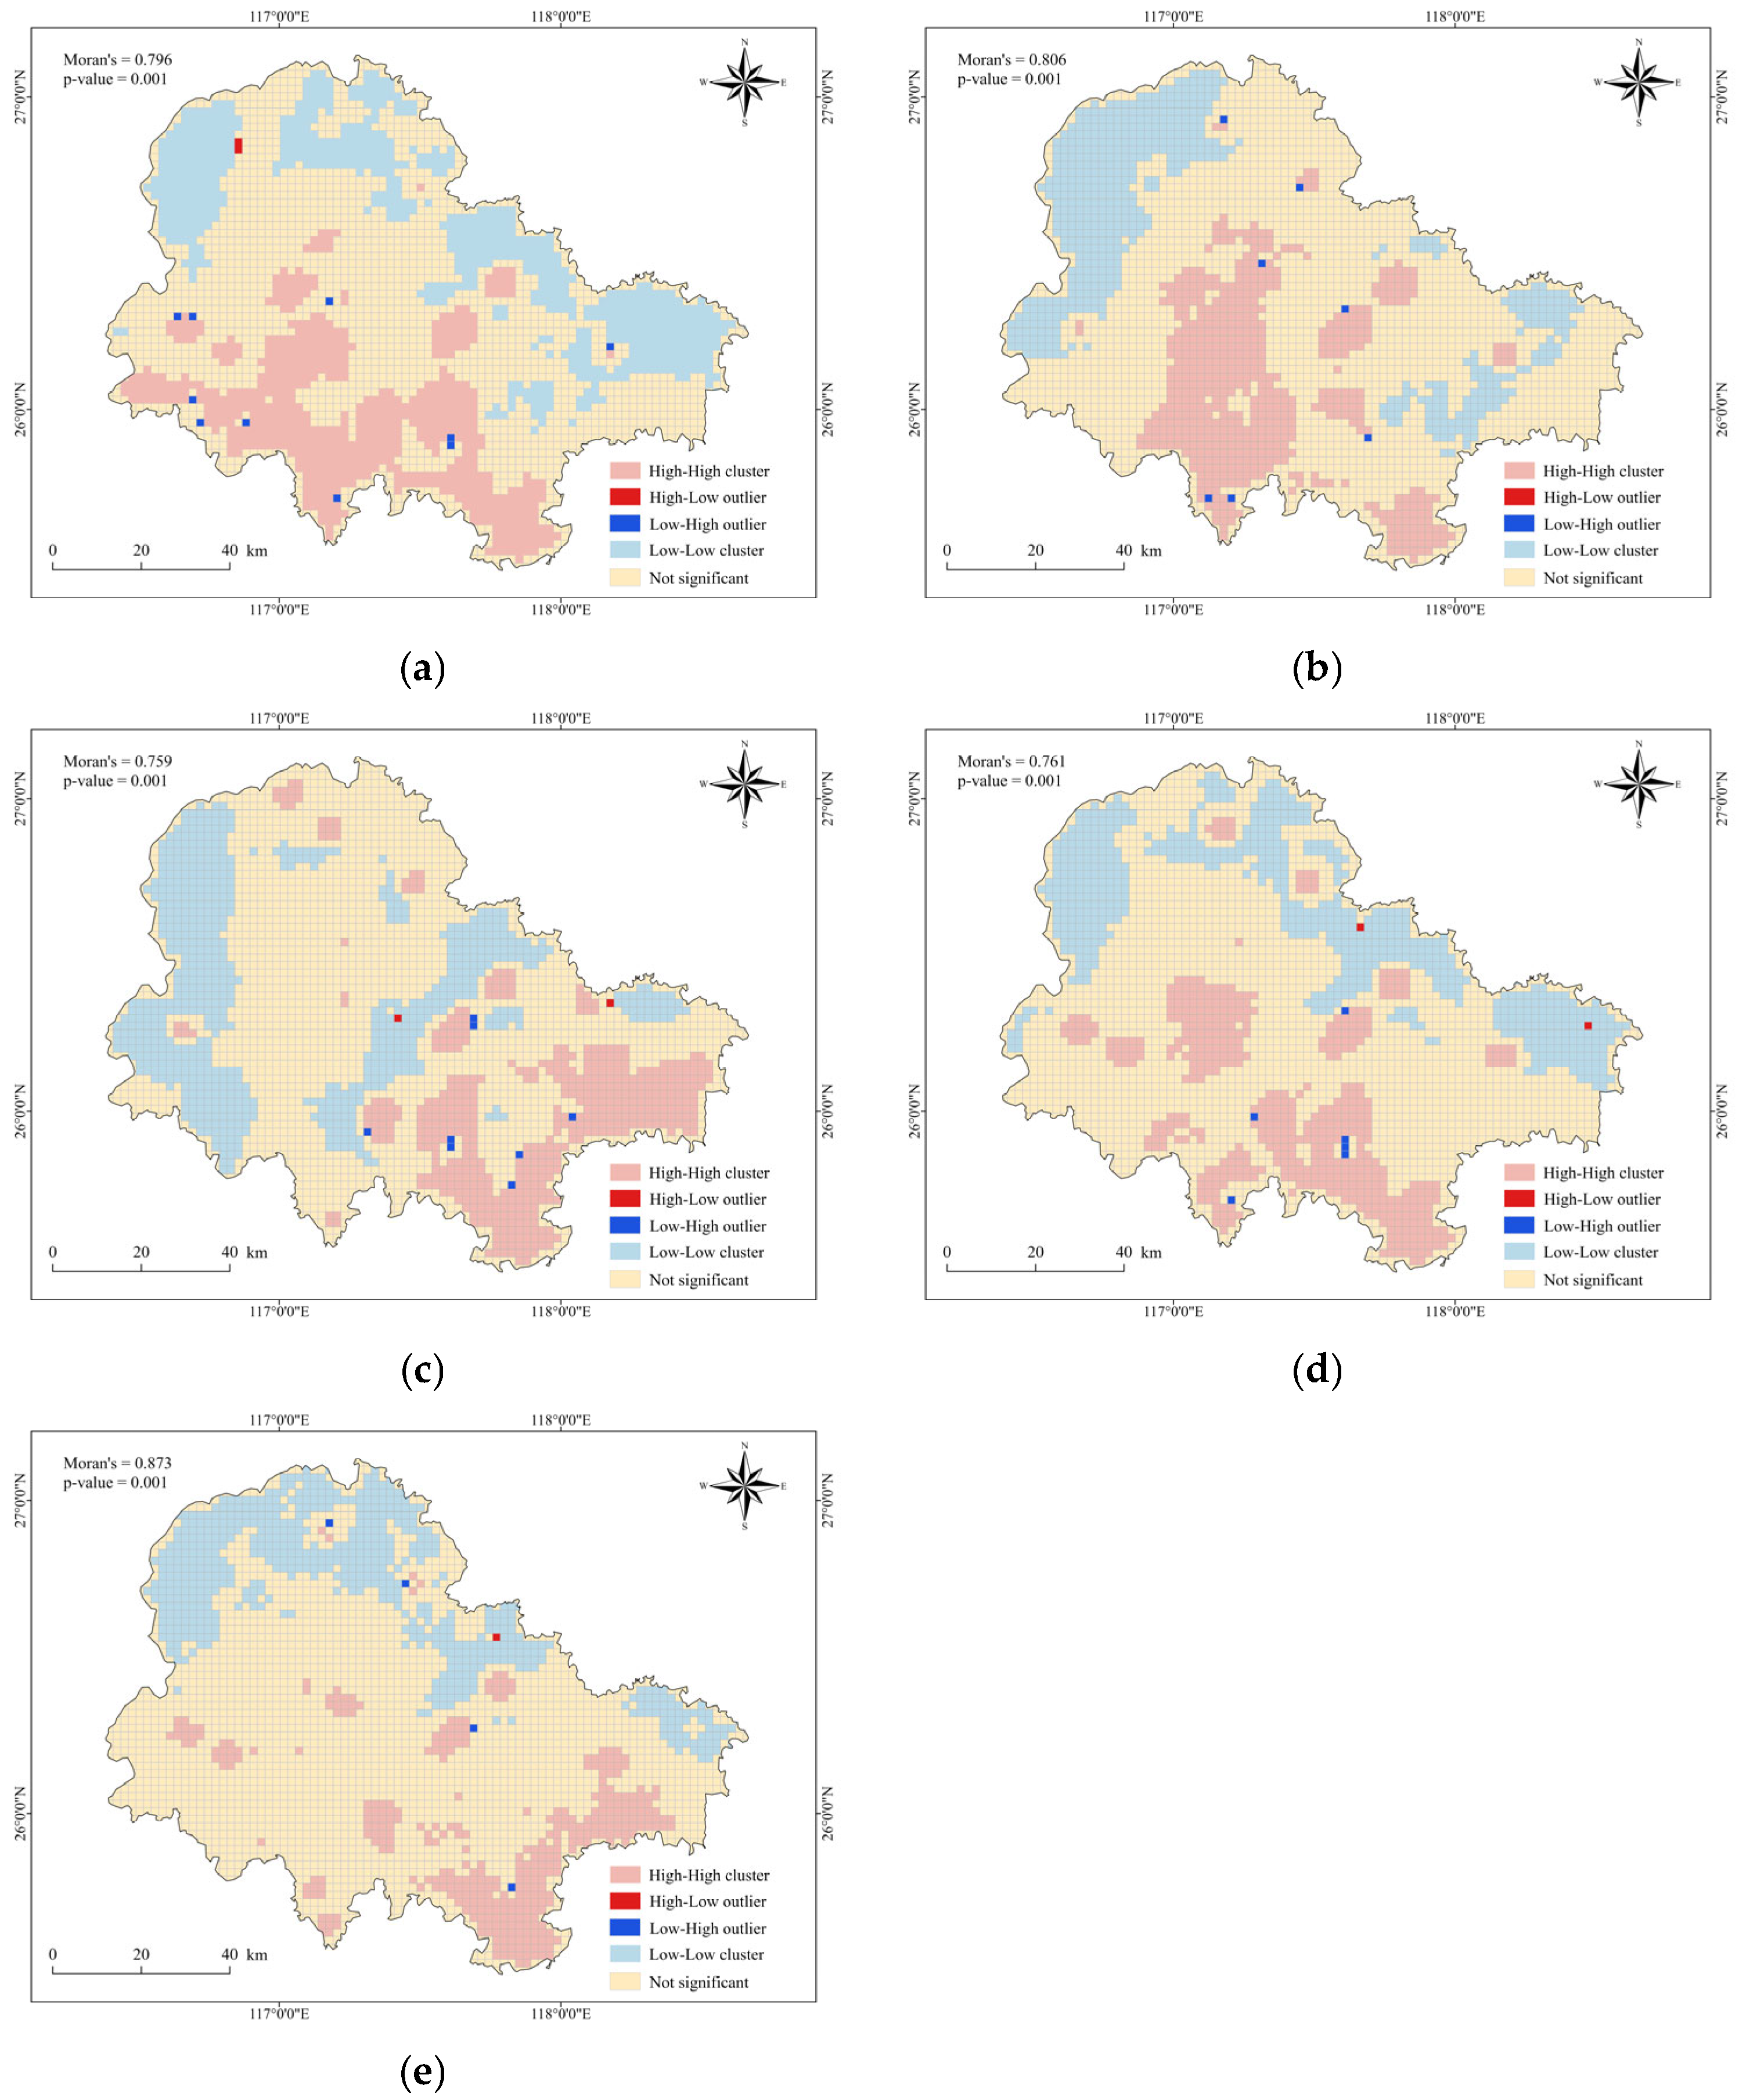
The study on urban resilience in Sanming City, utilizing data from 2014, 2016, 2018, 2020, and 2022, employs the Local Moran’s I index to analyze spatial autocorrelation. The findings reveal significant positive spatial autocorrelation in urban resilience across the city, with the Local Moran’s I index ranging between 0.759 and 0.873 for each year. This indicates that areas with similar levels of urban resilience tend to cluster together. Spatial clustering patterns are classified into four types: high–high, low–high, high–low, and low–low. These clusters provide insight into regional variations in urban resilience. The northwest region consistently exhibits a low–low clustering pattern throughout the study period. This region faces challenges such as higher precipitation and weaker infrastructure construction, leading to lower urban resilience. In contrast, the southeast region demonstrates a high–high clustering trend. This area benefits from stronger infrastructure and emergency response capabilities, enabling it to recover more rapidly when faced with external shocks, thus exhibiting higher urban resilience. This clear spatial differentiation underscores the need for targeted interventions to enhance urban resilience. Specifically, strengthening infrastructure development in the northwest region is urgently needed to improve its resilience level and overall disaster resistance capacity. By focusing on these identified clusters and their underlying factors, Sanming City can work towards a more resilient and balanced urban environment capable of withstanding and recovering from external shocks more effectively (Figure 5).
Figure 5.
LISA cluster map of urban resilience in Sanming City: (a) 2014, (b) 2016, (c) 2018, (d) 2020, (e) 2022.
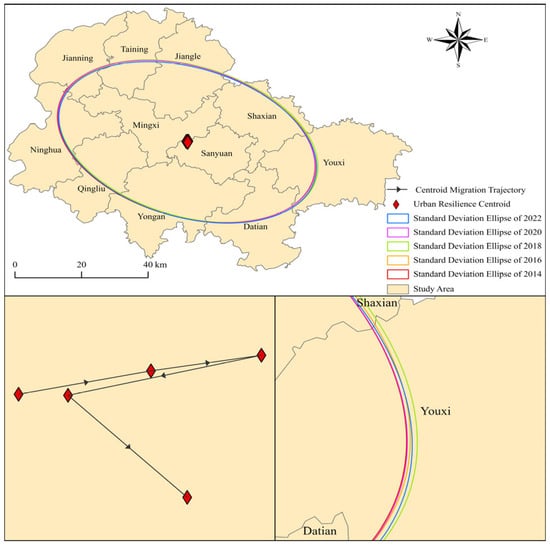
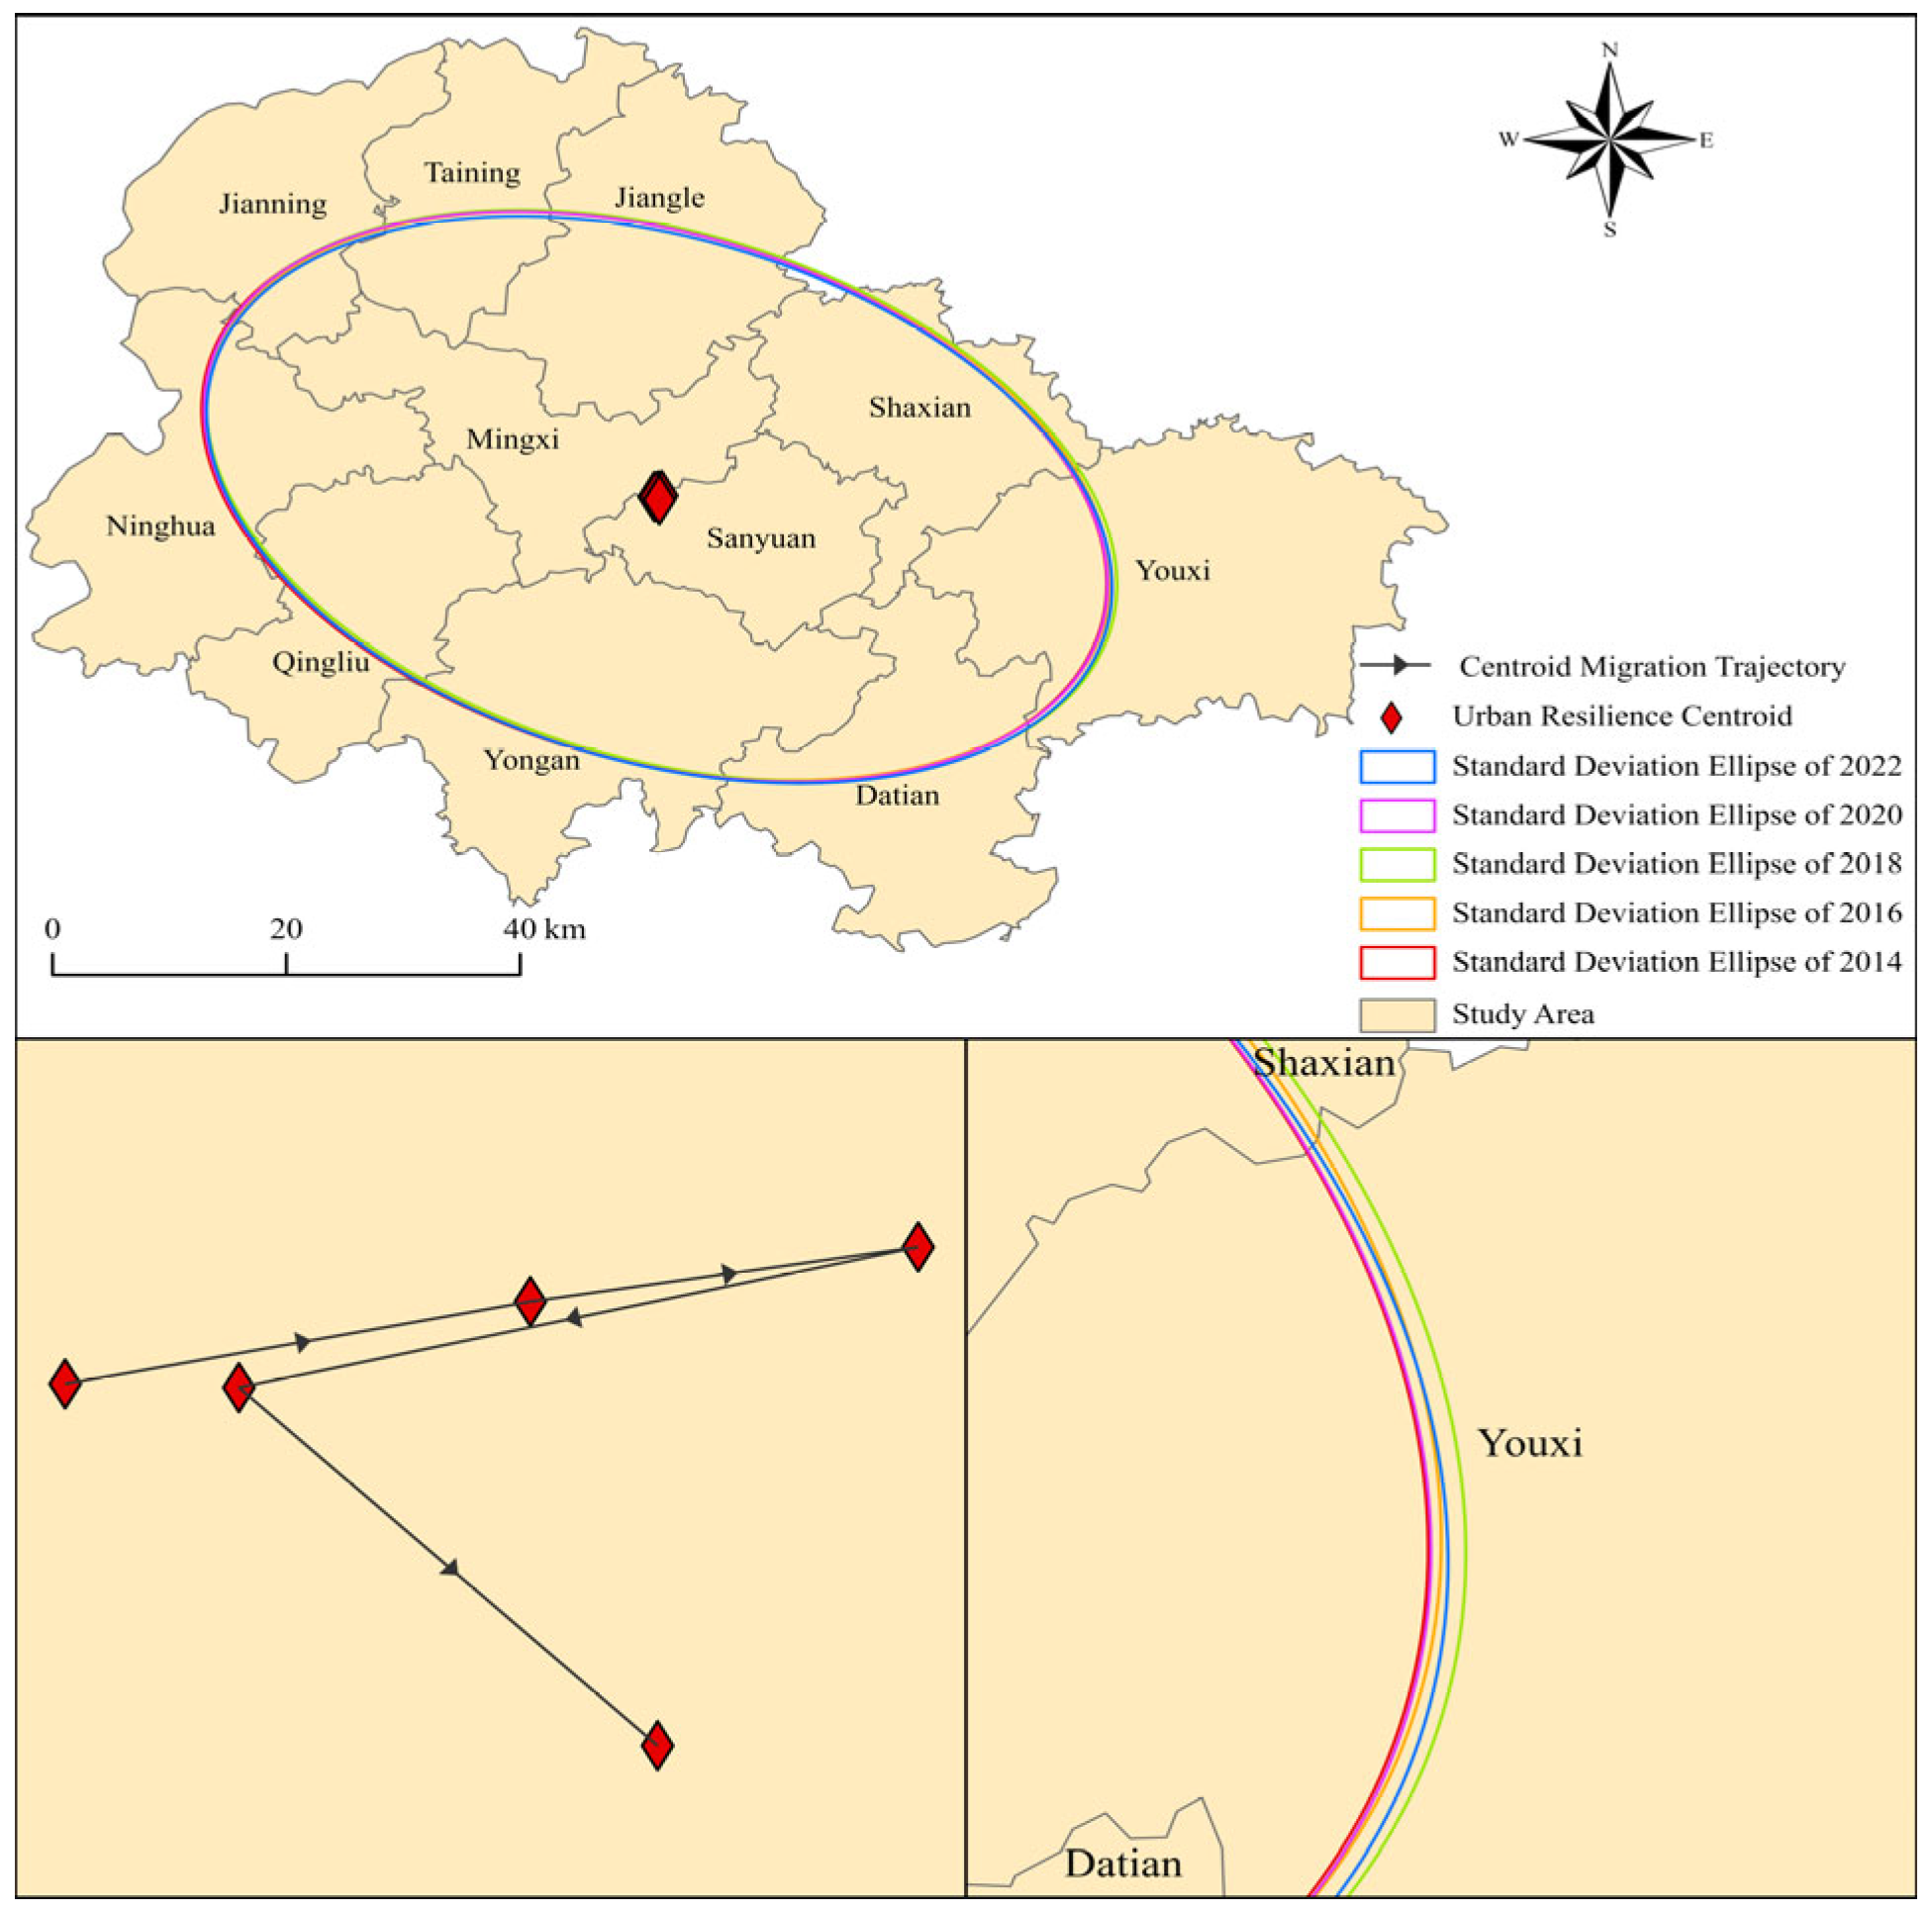
Using ArcGIS 10.8.1 software, the spatial migration of the urban resilience center of gravity in Sanming City from 2014 to 2022 was analyzed, as shown in Figure 6. The results indicate that, overall, the center of gravity showed a trend of migration toward the southeast. Specifically, from 2014 to 2016, the center of gravity of urban resilience in Sanming City shifted toward the northeast, which was related to the accelerated infrastructure development and economic growth in the region. Between 2016 and 2018, the center of gravity continued to migrate northeast, strengthening the city’s disaster prevention and emergency response capabilities. However, starting in 2018, the center of gravity of urban resilience shifted toward the southwest, with a more significant displacement occurring between 2018 and 2020. This shift is likely linked to infrastructure improvements, the implementation of environmental protection policies, and the increased efforts in post-disaster reconstruction in the southwestern region. From 2020 to 2022, the center of gravity shifted again toward the southeast, indicating that the urban resilience level in that direction had further improved.
Figure 6.
Urban resilience center-of-gravity migration in Sanming City.
3.2. Analysis of the Drivers of Urban Resilience
3.2.1. Single-Factor Detection
This study employs the geographic detector model to analyze the spatial distribution pattern of the urban resilience index in Sanming City from 2014 to 2022. The model treats urban resilience level as the dependent variable and various resilience dimension factors as independent variables. The analysis is conducted using the overall average values (2014–2022) and the values for specific years (2014, 2016, 2018, 2020, and 2022) as representatives. The results of the single-factor geographic detection are shown in Table 3.
Table 3.
Average q-values of Single Factors.
From the single-factor detection results, all factors pass the significance test with p < 0.01, indicating that these factors are significantly related to urban resilience. From 2014 to 2022, the top five factors influencing urban resilience were NDVI > monthly maximum precipitation > nighttime light index > annual average PM2.5 concentration > impervious surface area. Among these, NDVI (q = 0.6142–0.7467) exhibited the strongest explanatory power, with an average q-value of 0.6846. Good vegetation cover effectively enhances urban ecological regulation functions, thereby improving resilience to environmental pressures. In this context, improvements in urban green spaces and ecological environments are regarded as key factors in strengthening resilience. The monthly maximum precipitation (q = 0.3675–0.5740) serves as a core factor in the pressure layer, with its high q-value reflecting the “pressure-driven” effect of extreme rainfall on resilience spatial differentiation: the greater the intensity of heavy rainstorms, the more significant the differences in urban responses across drainage, storage, and early warning systems, thereby exacerbating the uneven distribution of resilience through spatial disparities in exposure risks. The nighttime light index (q = 0.1957–0.5873), with an average q-value of 0.3612, is a key indicator reflecting the economic recovery capacity after disasters and represents the socio-economic development status of cities. The brightness of nighttime lights is usually closely related to economic activities; therefore, its relationship with resilience reveals the importance of economic functions and social recovery capabilities in cities facing post-disaster recovery. The annual average PM2.5 concentration (q = 0.3451) was negatively correlated with resilience. High PM2.5 concentrations not only pose threats to residents’ health but also damage ecosystem functions, weakening the natural resilience of cities. This finding indicates that improving air quality and strengthening environmental governance are important factors in enhancing urban resilience. The q-mean value of the impervious surface ratio was 0.3159. The expansion of impervious surfaces weakens the infiltration and storage capacity of the underlying surface, exacerbating surface runoff and flood risks under heavy precipitation conditions. In Sanming City, construction land is concentrated in river valleys and gentle areas, where impervious surfaces highly overlap with flood-prone areas, making them a significant factor limiting the enhancement of urban resilience. These five key factors drive the spatial–temporal analysis of urban resilience in Sanming City through multidimensional coupling mechanisms involving ecological regulation, extreme climate pressure, economic recovery, and impervious surface expansion. In addition, the average q-values of other factors exceeded 0.15, indicating that they jointly influence urban resilience in Sanming from multiple social, economic, and environmental dimensions.
3.2.2. Dual-Factor Interaction Detection
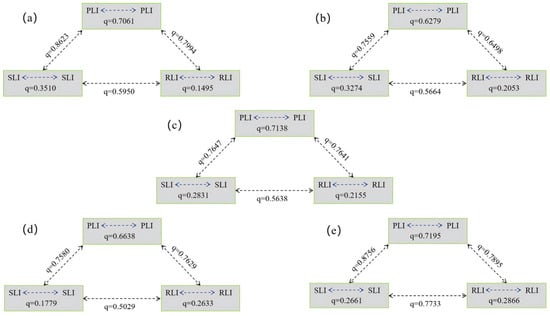
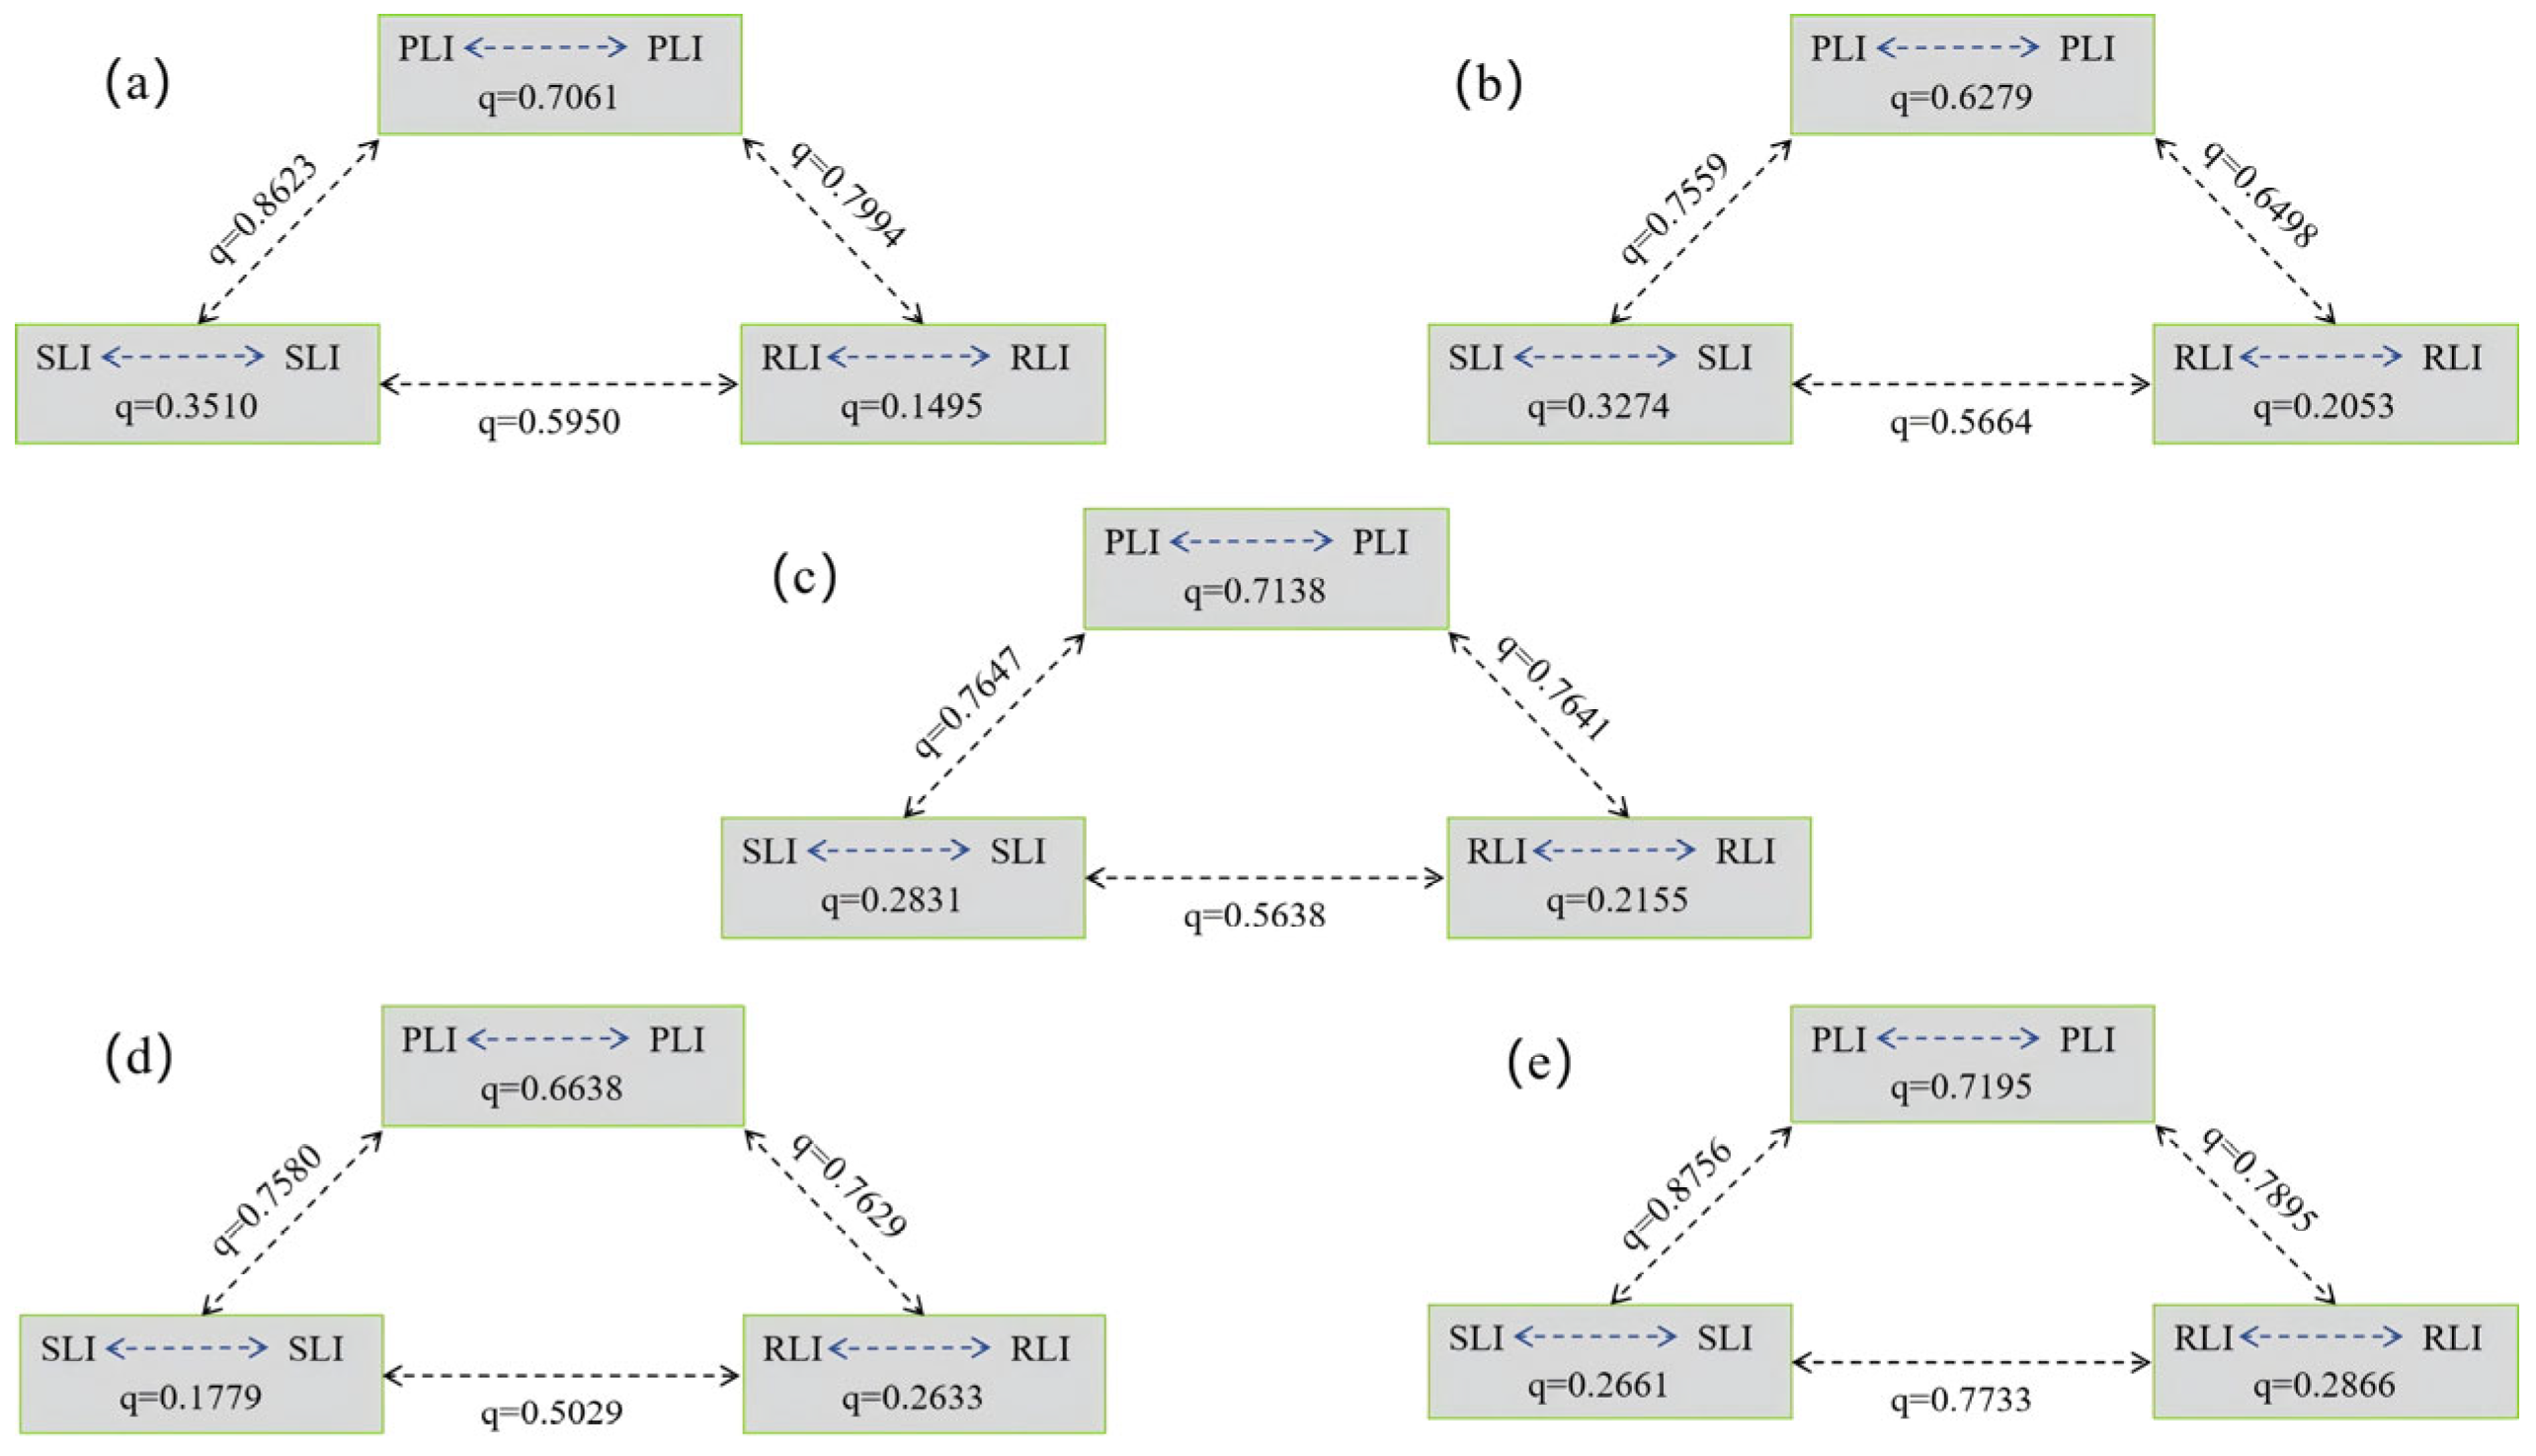
Figure 7 illustrates the results of the two-factor interaction between the average pressure index (PLI), average state index (SLI), and average response index (RLI) of Sanming City. Specifically, the interaction q-value of PLI increased from 0.7061 in 2014 to 0.7195 in 2022, displaying a periodic fluctuation pattern of “decrease—increase—decrease—increase.” This indicates that external disturbances have a dominant driving effect on resilience patterns. The interaction q-value of RLI increased monotonically from 0.1495 to 0.2866, reflecting the growing explanatory power of the combined response capabilities, including infrastructure, public services, and the nighttime economy, on the spatial differentiation of resilience. This change suggests that during the study period, the interaction between PLI and RLI gradually strengthened, reflecting the increasing interdependence between the pressure and response layers. Meanwhile, the interaction q-value of SLI decreased from 0.3510 to 0.2661, showing a significant decline between 2014 and 2020, followed by a slight rebound in 2022. This reflects the weakening phase of the explanatory power of the system’s state on resilience, followed by a self-repair process.
Figure 7.
Interaction detection results of the PLI, SLI, and RLI: (a) 2014, (b) 2016, (c) 2018, (d) 2020, (e) 2022.
In terms of cross-layer interactions, the interaction q-value between PLI and SLI ranged from 0.7559 to 0.8756, the interaction q-value between PLI and RLI ranged from 0.6498 to 0.7994, and the interaction q-value between SLI and RLI ranged from 0.5029 to 0.7733. These changes indicate that the interactions between different indicator layers generally strengthened during the study period, reflecting the increasing connectivity between layers, particularly the deepening interaction between the pressure and response layers. Overall, the q-values of the cross-layer interactions fluctuated between 0.5029 and 0.8756, suggesting that urban resilience is influenced by the complex interweaving and interaction of multiple factors from the pressure, state, and response layers. Moreover, over time, the interaction between different layers was continuously enhanced, driving the overall change in urban resilience.
To further reveal the interactions between factors at different levels and analyze the interaction between specific variables, by quantifying the interaction effects between variables, we can further uncover the multidimensional interdependence of factors in the pressure layer, state layer, and response layer.
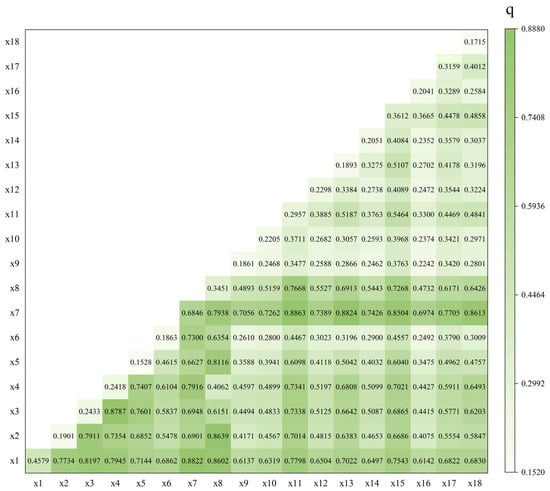
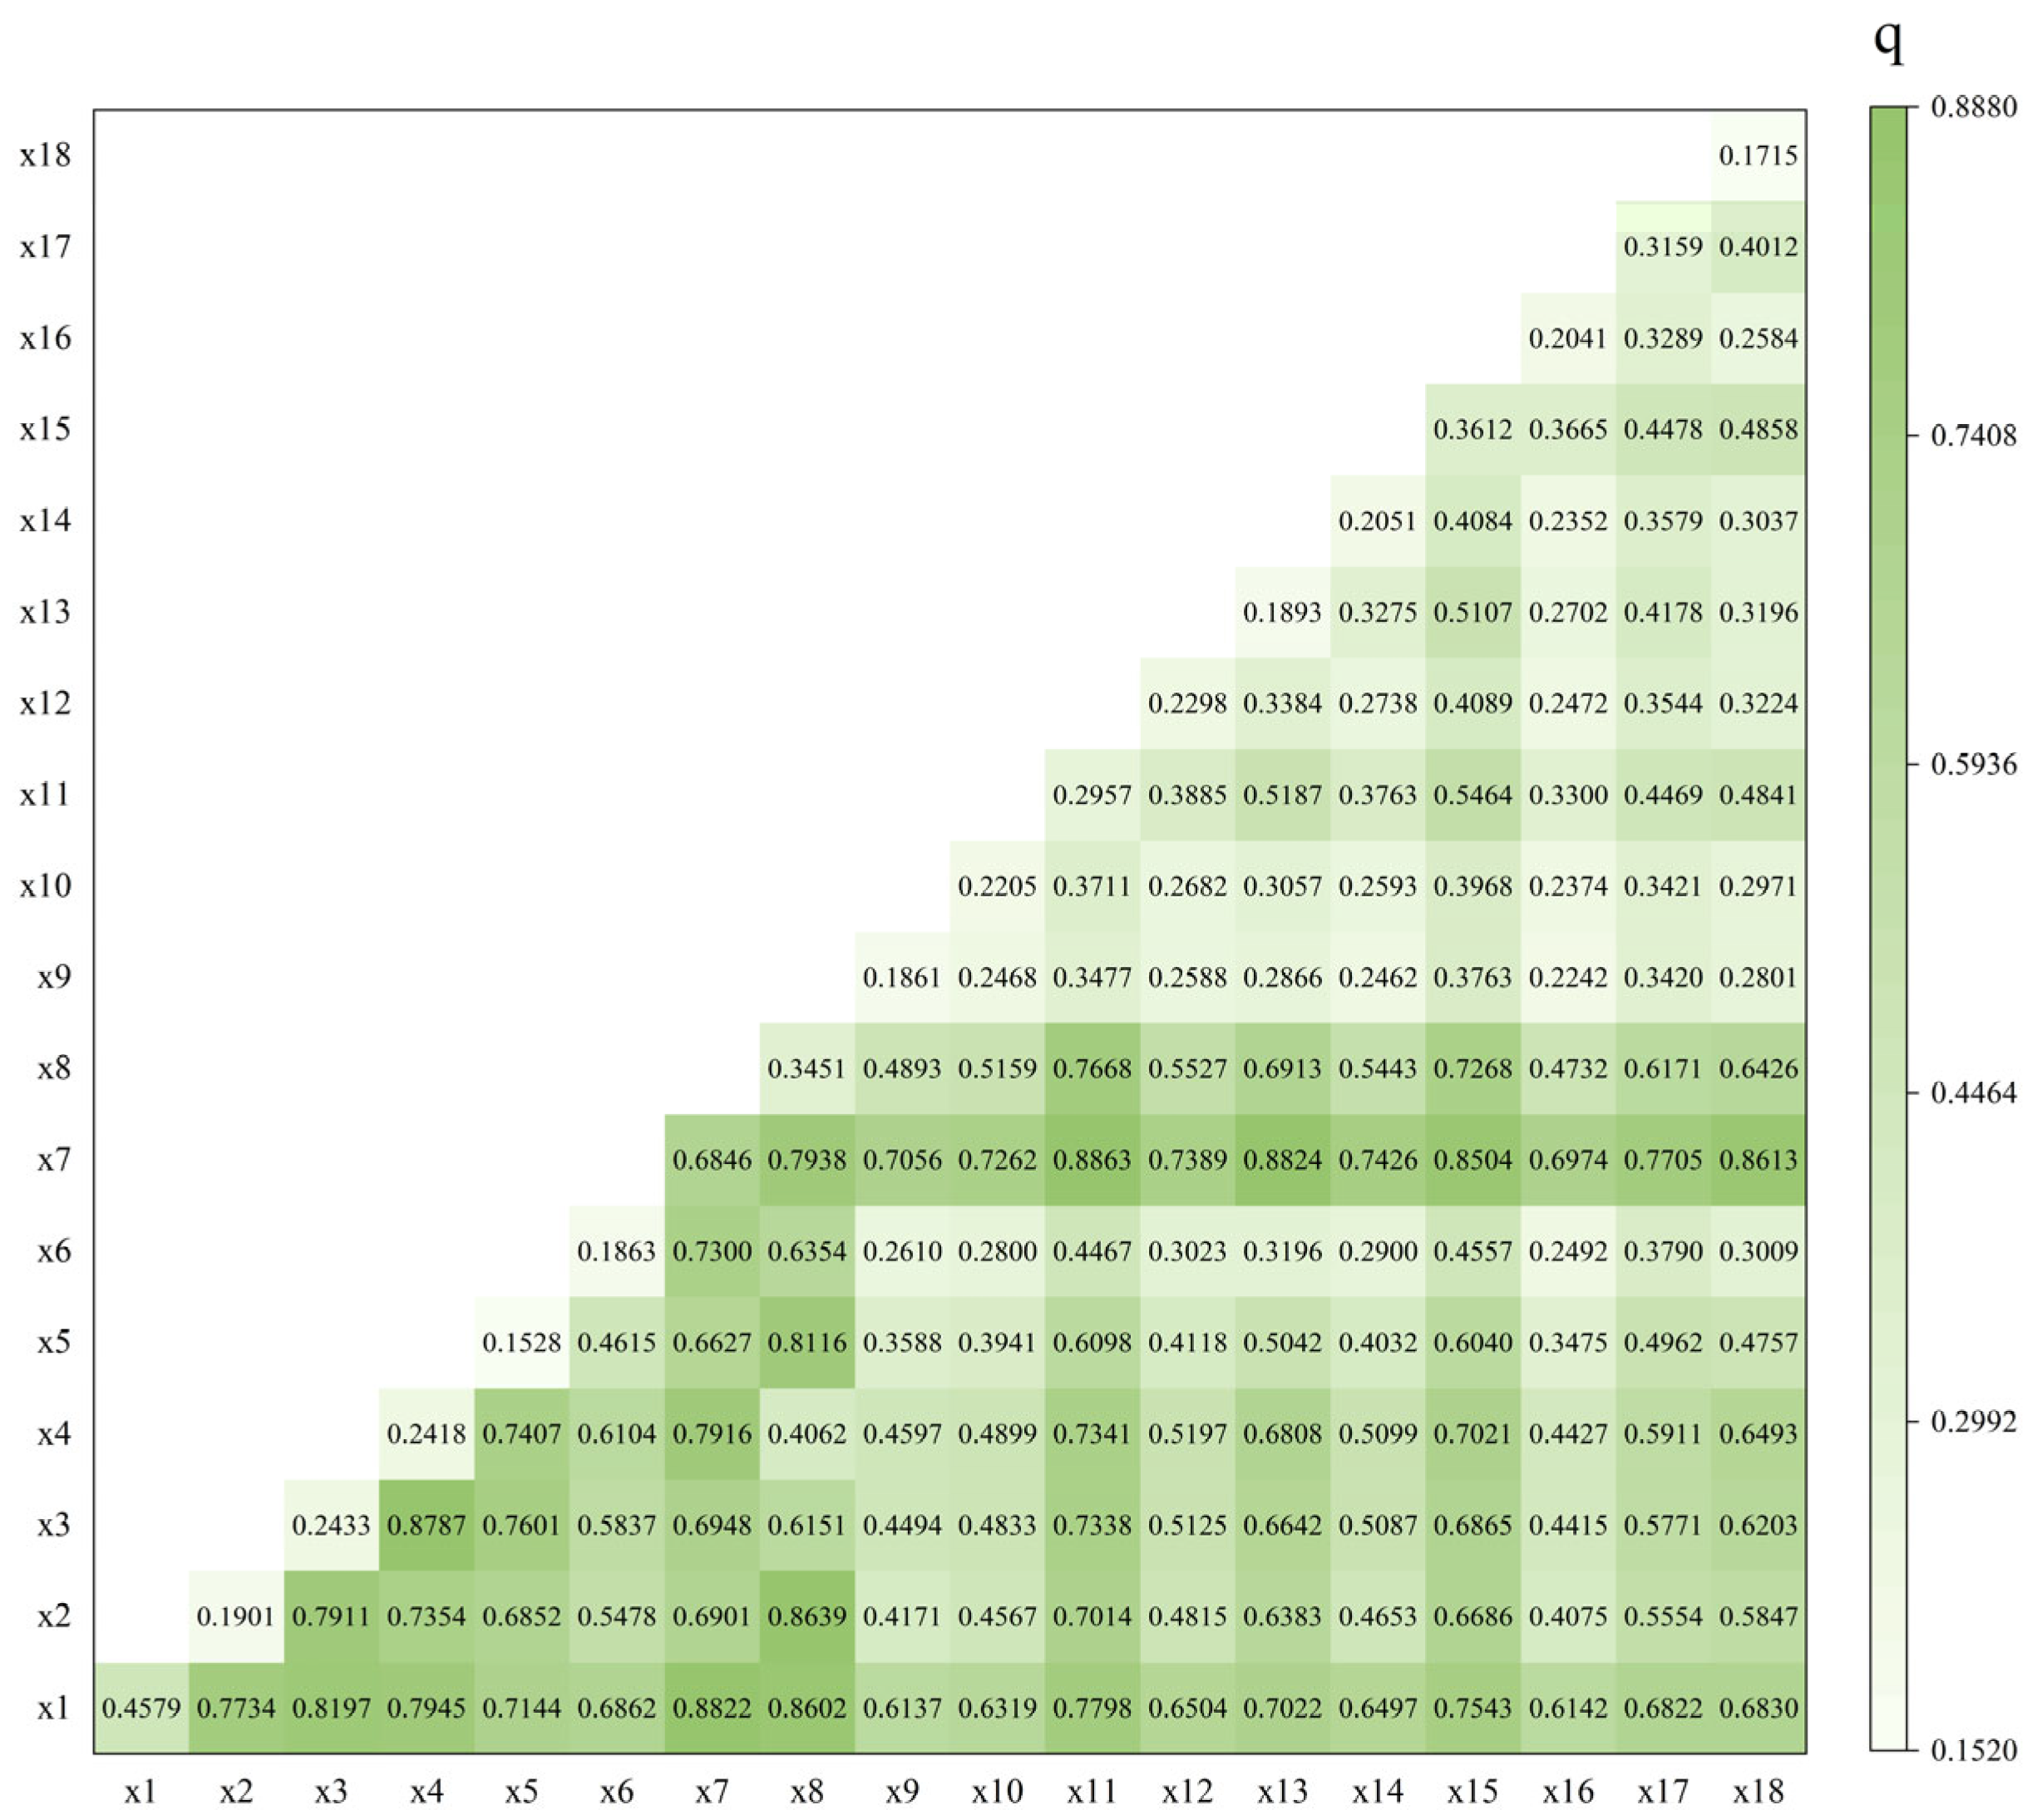
In the study of urban resilience in Sanming City, the interaction and synergistic effects between driving factors were quantified, revealing the complexity and multidimensional nature of the urban system. According to the analysis results from 2014 to 2022 (Figure 8), the interaction between any two factors is greater than the effect of a single factor alone. The interaction intensity and nonlinear enhancement effects between the 18 driving factors (x1–x18) exhibited significant regularity. This nonlinear enhancement effect implies that when multiple factors interact, their combined impact far exceeds the simple sum of individual effects. This highlights the need for holistic consideration of interrelated factors rather than focusing on a single factor to achieve more effective resilience enhancement. Notably, the interactions between the NDVI (x7), annual average PM2.5 concentration (x8), and monthly maximum precipitation (x1) with other factors were particularly prominent, with q-values exceeding 0.8 in some cases. For example, interactions involving NDVI (x7) showed that road feasibility (x11) had the highest q-value of 0.8863, followed by water pipeline density (x13) at 0.8824, monthly maximum precipitation (x1) at 0.8822, drainage pipeline density (x18) at 0.8613, and nighttime light index (x15) at 0.8504. These interactions highlight the significant interdependencies between vegetation cover and various urban infrastructure and climatic factors, reinforcing its central role in enhancing urban resilience.
Figure 8.
Average q-value results of the two-factor interaction detection.
These results indicate that vegetation cover has a significant interdependence with climate factors, disaster risk factors, and air quality factors, playing a central role in enhancing urban resilience. Good vegetation cover not only helps mitigate the urban heat island effect and reduce air pollution, but also effectively enhances the water resource regulation capacity, improving the city’s ability to adapt to and recover from extreme climate events. Furthermore, the interaction between monthly maximum precipitation (x1) and other climate and ecological factors also demonstrates a stable synergistic mechanism, with q-values ranging from 0.6137 to 0.8822. This further suggests that there is a significant nonlinear enhancement effect between precipitation and climate variables. Especially in terms of inducing secondary disasters (such as floods, landslides, etc.) and affecting the stability of urban infrastructure, changes in precipitation, in combination with climate factors (such as annual wind speed, daily maximum and minimum temperatures), may intensify the frequency and severity of extreme weather events, thereby having a profound impact on the city’s emergency response and post-disaster recovery capabilities. Therefore, the high interactivity between ecological factors and climate-environment factors is identified as the primary driving mechanism behind changes in urban resilience.
Combining the results of spatial analysis, to address the low-resilience pattern in the northwest of Sanming City, efforts should focus on improving road accessibility, enhancing drainage and water supply networks, and strengthening the disaster resistance of key public facilities, while simultaneously, promoting ecological restoration and green infrastructure construction, such as restoring river channels and wetland storage functions to achieve synergistic effects between “grey” and “green” infrastructure. Enhancing infrastructure resilience and ecological functions is expected to strengthen the disaster resistance and recovery capacity of the northwest region, thereby providing support for the overall optimization of urban resilience across the city.
4. Conclusions
This study constructed a city resilience indicator system for Sanming City from 2014 to 2022 based on the AHP–entropy weight method, integrating kernel density estimation, spatial autocorrelation analysis, standard deviation ellipse, and geographic detector methods. It systematically explored the spatial–temporal analysis of resilience and its driving factors in a multi-disaster context. By synthesizing these analytical approaches, the study achieved several key findings: Firstly, in constructing the urban resilience assessment framework, the PSR model combined with the AHP–entropy weight method was employed to optimize weights. This hybrid approach integrates subjective expertise with objective data characteristics, ensuring scientific rigor and reliability in resilience evaluation, thereby laying a robust foundation for subsequent analyses. Secondly, examining the spatial–temporal analysis patterns of resilience, the study utilized kernel density estimation, spatial autocorrelation analysis, and standard deviation ellipse methods. These revealed the spatial clustering characteristics of resilience and the stable trend of its centroid. The findings indicated that Sanming City’s resilience exhibited a “rising then falling” dynamic pattern, with the resilience index increasing from 0.3104 in 2014 to a peak of 0.3483 in 2016 before declining. This trajectory suggests that cities stabilize after experiencing certain pressures. Further analysis showed distinct spatial differences between high-resilience areas in the city center and southeast versus low-resilience regions in the northwest, with this spatial pattern remaining relatively stable over the study period. Thirdly, when investigating the drivers of resilience change, single-factor analysis using the geographic detector identified five critical variables influencing resilience: NDVI, monthly maximum precipitation, nighttime light intensity, annual average PM2.5 concentration, and impervious surface area. Dual-factor interaction analysis revealed strong synergistic effects between ecological factors and climatic/environmental factors, particularly the collaborative impact of infrastructure factors (such as road accessibility and water conservancy facilities) with ecological restoration measures on shaping resilience evolution. Overall, the resilience pattern in Sanming City is shaped by multiple interdependent factors, especially infrastructure density, ecological conditions, and socioeconomic factors, which significantly influence the spatial distribution of resilience. For the low-resilience areas in the northwest, we recommend enhancing infrastructure development, improving road accessibility, and strengthening the disaster resistance capacity of public facilities. At the same time, efforts should be made to reinforce ecological restoration and green infrastructure, such as restoring the water storage function of wetlands and promoting the synergistic effect of “gray-green” infrastructure. This approach will enhance the disaster resistance and recovery capacity of the region.
Author Contributions
Conceptualization, S.S. and W.O.; methodology, Y.L.; software, Y.L.; validation, Y.L., Y.Z., and J.L.; formal analysis, W.H.; investigation, Z.X.; resources, Y.Z.; data curation, W.O.; writing—original draft preparation, Y.Z.; writing—review and editing, Y.L.; visualization, S.S.; supervision, Y.Z.; project administration, Y.Z.; funding acquisition, J.L. and Z.X. All authors have read and agreed to the published version of the manuscript.
Funding
This work was supported by National Key R&D Program of China [Grant Number 2024YFC3016802], and National Institute of Natural Hazards, Ministry of Emergency Management of China (Grant Number: ZDJ2025-09).
Institutional Review Board Statement
Not applicable.
Informed Consent Statement
Not applicable.
Data Availability Statement
Restrictions apply to the availability of these data. The data were Obtained from third parties and are available from the authors after obtaining permission from them. These third parties are noted in the Acknowledgments.
Acknowledgments
The datasets were provided by National Tibetan Plateau/Third Pole Environment Data Center (http://data.tpdc.ac.cn, accessed on 5 October 2025), National Cryosphere Desert Data Center (http://www.ncdc.ac.cn, accessed on 22 September 2025), Geographic remote sensing ecological network platform (http://gisrs.cn, accessed on 22 September 2025), Resource and Environmental Science Data Platform (http://www.resdc.cn, accessed on 5 October 2025), and National Earth System Science Data Center (https://www.geodata.cn, accessed on 21 September 2025).
Conflicts of Interest
The authors declare no conflicts of interest.
References
- Gao, Y.; Li, X.; Chen, X.; Wang, L. Extreme Wave and Storm Surge Characteristics in the Southeastern Coastal and Offshore Regions of China. Sci. Rep. 2025, 15, 26915. [Google Scholar] [CrossRef] [Scilit] [PubMed]
- Li, Z.; Li, H.; Zhang, Z.; Dai, C.; Jiang, S. Influence of Building Collapse on Pluvial and Fluvial Flood Inundation of Metro Stations in Central Shanghai. Nat. Hazards Earth Syst. Sci. 2024, 24, 3977–3990. [Google Scholar] [CrossRef] [Scilit]
- Zhang, Y.; Li, X.; Liu, Q. Advancing Urban Resilience: A Multi-Hazard Risk Perspective on Frontier Evolution, Research Hotspots, and Practical Exploration. Urban Clim. 2025, 60, 102342. [Google Scholar] [CrossRef] [Scilit]
- Almulhim, A.I. Building Urban Resilience Through Smart City Planning: A Systematic Literature Review. Smart Cities 2025, 8, 22. [Google Scholar] [CrossRef] [Scilit]
- Meerow, S.; Newell, J.P.; Stults, M. Defining Urban Resilience: A Review. Landsc. Urban Plan. 2016, 147, 38–49. [Google Scholar] [CrossRef] [Scilit]
- Feng, X.; Xiu, C.; Li, J.; Zhong, Y. Measuring the Evolution of Urban Resilience Based on the Exposure–Connectedness–Potential (ECP) Approach: A Case Study of Shenyang City, China. Land 2021, 10, 1305. [Google Scholar] [CrossRef] [Scilit]
- Wang, Y.; Meng, F.; Liu, H.; Zhang, C.; Fu, G. Assessing Catchment Scale Flood Resilience of Urban Areas Using a Grid Cell Based Metric. Water Res. 2019, 163, 114852. [Google Scholar] [CrossRef] [Scilit]
- Rifat, S.A.A.; Liu, W. Predicting Future Urban Growth Scenarios and Potential Urban Flood Exposure Using Artificial Neural Network-Markov Chain Model in Miami Metropolitan Area. Land Use Policy 2022, 114, 105994. [Google Scholar] [CrossRef] [Scilit]
- Wei, Q.; Zhang, H.; Chen, Y.; Xie, Y.; Yin, H.; Xu, Z. City Scale Urban Flooding Risk Assessment Using Multi-Source Data and Machine Learning Approach. J. Hydrol. 2025, 651, 132626. [Google Scholar] [CrossRef] [Scilit]
- Doğan, A.; Başeğmez, M.; Aydın, C.C. Assessment of the Seismic Vulnerability in an Urban Area with the Integration of Machine Learning Methods and GIS. Nat. Hazards 2025, 121, 9613–9652. [Google Scholar] [CrossRef] [Scilit]
- Rahimi, F.; Sadeghi-Niaraki, A.; Ghodousi, M.; Choi, S.-M. Spatial-Temporal Modeling of Urban Resilience and Risk to Earthquakes. Sci. Rep. 2025, 15, 8321. [Google Scholar] [CrossRef] [Scilit]
- Wang, N.; Sun, B.; Chen, H. The Seismic Resilience-Based Methodology of Regional Building Function Recovery Assessment. Soil Dyn. Earthq. Eng. 2024, 180, 108601. [Google Scholar] [CrossRef] [Scilit]
- Ma, W.; Yu, Z.; Yang, W.; Zhang, Y.; Hu, Y.; Hu, J.; Zhang, H.; Yang, G. Optimizing Vegetation and Building Configurations for Streetscape Heat Mitigation: A Multi-Scale Analysis under Extreme Heat. Build. Environ. 2025, 283, 113331. [Google Scholar] [CrossRef] [Scilit]
- Mazumder, R.K.; Enderami, S.A.; Sutley, E.J. A Novel Framework to Study Community-Level Social and Physical Impacts of Hurricane-Induced Winds through Synthetic Scenario Analysis. Front. Built Environ. 2023, 9, 1005264. [Google Scholar] [CrossRef] [Scilit]
- Wang (Lisa), W.; Van De Lindt, J.W.; Rosenheim, N.; Cutler, H.; Hartman, B.; Sung Lee, J.; Calderon, D. Effect of Residential Building Wind Retrofits on Social and Economic Community-Level Resilience Metrics. J. Infrastruct. Syst. 2021, 27, 04021034. [Google Scholar] [CrossRef] [Scilit]
- Taheri, B.; Molzahn, D.K.; Grijalva, S. Improving Distribution System Resilience by Undergrounding Lines and Deploying Mobile Generators. Electr. Power Syst. Res. 2023, 214, 108804. [Google Scholar] [CrossRef] [Scilit]
- Sharifi, A. Urban Resilience Assessment: Mapping Knowledge Structure and Trends. Sustainability 2020, 12, 5918. [Google Scholar] [CrossRef] [Scilit]
- Gill, A.J.C.; Duncan, M.; Ciurean, R.; Smale, L.; Stuparu, D.; Schlumberger, J.; de Ruiter, M.; Tiggeloven, T.; Gottardo, S.; Mysiak, J.; et al. D1.2/Handbook of Multi-Hazard, Multi-Risk Definitions and Concepts; British Geological Survey: Keyworth, UK, 2022. [Google Scholar]
- Ouyang, M.; Wang, Z. Resilience Assessment of Interdependent Infrastructure Systems: With a Focus on Joint Restoration Modeling and Analysis. Reliab. Eng. Syst. Saf. 2015, 141, 74–82. [Google Scholar] [CrossRef] [Scilit]
- Stolte, T.R.; Koks, E.E.; De Moel, H.; Reimann, L.; Van Vliet, J.; De Ruiter, M.C.; Ward, P.J. VulneraCity–Drivers and Dynamics of Urban Vulnerability Based on a Global Systematic Literature Review. Int. J. Disaster Risk Reduct. 2024, 108, 104535. [Google Scholar] [CrossRef] [Scilit]
- Julià, P.B.; Ferreira, T.M. From Single- to Multi-Hazard Vulnerability and Risk in Historic Urban Areas: A Literature Review. Nat. Hazards 2021, 108, 93–128. [Google Scholar] [CrossRef] [Scilit]
- Gong, W.; Jiang, J.; Yang, L. Dynamic Risk Assessment of Compound Hazards Based on VFS–IEM–IDM: A Case Study of Typhoon–Rainstorm Hazards in Shenzhen, China. Nat. Hazards Earth Syst. Sci. 2022, 22, 3271–3283. [Google Scholar] [CrossRef] [Scilit]
- Merz, B.; Kuhlicke, C.; Kunz, M.; Pittore, M.; Babeyko, A.; Bresch, D.N.; Domeisen, D.I.V.; Feser, F.; Koszalka, I.; Kreibich, H.; et al. Impact Forecasting to Support Emergency Management of Natural Hazards. Rev. Geophys. 2020, 58, e2020RG000704. [Google Scholar] [CrossRef] [Scilit]
- Zhou, S.; Zhai, G. A Multi-Hazard Risk Assessment Framework for Urban Disaster Prevention Planning: A Case Study of Xiamen, China. Land 2023, 12, 1884. [Google Scholar] [CrossRef] [Scilit]
- Aerts, J.C.J.H.; Botzen, W.J.; Clarke, K.C.; Cutter, S.L.; Hall, J.W.; Merz, B.; Michel-Kerjan, E.; Mysiak, J.; Surminski, S.; Kunreuther, H. Integrating Human Behaviour Dynamics into Flood Disaster Risk Assessment. Nat. Clim. Chang. 2018, 8, 193–199. [Google Scholar] [CrossRef] [Scilit]
- Anelli, D.; Tajani, F.; Ranieri, R. Urban Resilience against Natural Disasters: Mapping the Risk with an Innovative Indicators-Based Assessment Approach. J. Clean. Prod. 2022, 371, 133496. [Google Scholar] [CrossRef] [Scilit]
- Huang, X.; Wang, N. An Adaptive Nested Dynamic Downscaling Strategy of Wind-Field for Real-Time Risk Forecast of Power Transmission Systems during Tropical Cyclones. Reliab. Eng. Syst. Saf. 2024, 242, 109731. [Google Scholar] [CrossRef] [Scilit]
- Bakhtiari, S.; Najafi, M.R.; Goda, K.; Peerhossaini, H. A Dynamic Bayesian Network Approach to Characterize Multi-Hazard Risks and Resilience in Interconnected Critical Infrastructures. Reliab. Eng. Syst. Saf. 2025, 257, 110815. [Google Scholar] [CrossRef] [Scilit]
- Chen, X.; Yu, L.; Lin, W.; Yang, F.; Li, Y.; Tao, J.; Cheng, S. Urban Resilience Assessment from the Multidimensional Perspective Using Dynamic Bayesian Network: A Case Study of Fujian Province, China. Reliab. Eng. Syst. Saf. 2023, 238, 109469. [Google Scholar] [CrossRef] [Scilit]
- Hlal, M.; Baraka Munyaka, J.-C.; Chenal, J.; Azmi, R.; Diop, E.B.; Bounabi, M.; Ebnou Abdem, S.A.; Almouctar, M.A.S.; Adraoui, M. Digital Twin Technology for Urban Flood Risk Management: A Systematic Review of Remote Sensing Applications and Early Warning Systems. Remote Sens. 2025, 17, 3104. [Google Scholar] [CrossRef] [Scilit]
- Almulhim, A.I.; Sharifi, A.; Aina, Y.A.; Ahmad, S.; Mora, L.; Filho, W.L.; Abubakar, I.R. Charting Sustainable Urban Development through a Systematic Review of SDG11 Research. Nat. Cities 2024, 1, 677–685. [Google Scholar] [CrossRef] [Scilit]
- Sun, J.; Zhai, N.; Mu, H.; Miao, J.; Li, W.; Li, M. Assessment of Urban Resilience and Subsystem Coupling Coordination in the Beijing-Tianjin-Hebei Urban Agglomeration. Sustain. Cities Soc. 2024, 100, 105058. [Google Scholar] [CrossRef] [Scilit]
- Li, C.; Han, H.; Cui, N.; Lan, P.; Zhang, K.; Zhou, X.; Guo, L. Spatiotemporal Dynamics and Spatial Correlation Patterns of Urban Ecological Resilience across the Yellow River Basin in China. Sci. Rep. 2024, 14, 31286. [Google Scholar] [CrossRef] [Scilit]
- Liang, Y.; Cheng, Y.; Ren, F.; Du, Q. Urban Resilience Assessment Framework and Spatiotemporal Dynamics in Hubei, China. Sci. Rep. 2024, 14, 31391. [Google Scholar] [CrossRef] [Scilit] [PubMed]
- Chen, Y.; You, W.; Ou, L.; Tang, H. A Review of Machine Learning Techniques for Urban Resilience Research: The Application and Progress of Different Machine Learning Techniques in Assessing and Enhancing Urban Resilience. Syst. Soft Comput. 2025, 7, 200269. [Google Scholar] [CrossRef] [Scilit]
- Liu, C.-Y.; Ku, C.-Y.; Tsai, M.-H.; You, J.-Y. AI-Driven GIS Modeling of Future Flood Risk and Susceptibility for Typhoon Krathon under Climate Change. Comput. Model. Eng. Sci. 2025, 144, 2969–2990. [Google Scholar] [CrossRef] [Scilit]
- Zhuang, H. Analytic and Topological Realizations of the Invariant Thom-Smale Complex. arXiv 2023, arXiv:2311.10417. [Google Scholar]
- Shirai, K.; Horii, J.; Fujimori, T. Optimal Sliding Force Characteristics of Friction Dampers for Seismic Response Control of Building Structures Considering Sway-Rocking Motion. Soil Dyn. Earthq. Eng. 2021, 149, 106892. [Google Scholar] [CrossRef] [Scilit]
- Estoque, R.C.; Ooba, M.; Togawa, T.; Hijioka, Y.; Murayama, Y. Monitoring Global Land-Use Efficiency in the Context of the UN 2030 Agenda for Sustainable Development. Habitat Int. 2021, 115, 102403. [Google Scholar] [CrossRef] [Scilit]
- Raj, A.; Dubey, A.; Malla, M.A.; Kumar, A. Pesticide Pestilence: Global Scenario and Recent Advances in Detection and Degradation Methods. J. Environ. Manage. 2023, 338, 117680. [Google Scholar] [CrossRef] [Scilit]
- Gevaert, C.M.; Carman, M.; Rosman, B.; Georgiadou, Y.; Soden, R. Fairness and Accountability of AI in Disaster Risk Management: Opportunities and Challenges. Patterns 2021, 2, 100363. [Google Scholar] [CrossRef] [Scilit]
- Wang, H.; Wang, B.-B.; Cui, P.; Ma, Y.-M.; Wang, Y.; Hao, J.-S.; Wang, Y.; Li, Y.-M.; Sun, L.-J.; Wang, J.; et al. Disaster Effects of Climate Change in High Mountain Asia: State of Art and Scientific Challenges. Adv. Clim. Chang. Res. 2024, 15, 367–389. [Google Scholar] [CrossRef] [Scilit]
- Huang, L.; Chen, T.; Deng, Q.; Zhou, Y. Reasoning Disaster Chains with Bayesian Network Estimated Under Expert Prior Knowledge. Int. J. Disaster Risk Sci. 2023, 14, 1011–1028. [Google Scholar] [CrossRef] [Scilit]
- Zhang, R.; Li, Y.; Li, C.; Chen, T. A Complex Network Approach to Quantifying Flood Resilience in High-Density Coastal Urban Areas: A Case Study of Macau. Int. J. Disaster Risk Reduct. 2025, 119, 105335. [Google Scholar] [CrossRef] [Scilit]
- Liu, Z.; Chen, H.; Liu, E.; Hu, W. Exploring the Resilience Assessment Framework of Urban Road Network for Sustainable Cities. Phys. Stat. Mech. Its Appl. 2022, 586, 126465. [Google Scholar] [CrossRef] [Scilit]
- Dong, W.; Zhou, Y.; Guo, D.; Chen, Z.; Wang, J. Evaluation of Urban Infrastructure Resilience Based on Risk–Resilience Coupling: A Case Study of Zhengzhou City. Land 2025, 14, 530. [Google Scholar] [CrossRef] [Scilit]
- Li, Z.; Yan, W. Service Flow Changes in Multilayer Networks: A Framework for Measuring Urban Disaster Resilience Based on Availability to Critical Facilities. Landsc. Urban Plan. 2024, 244, 104996. [Google Scholar] [CrossRef] [Scilit]
- Fu, L.; Ding, M.; Zhang, Q. Flood Risk Assessment of Urban Cultural Heritage Based on PSR Conceptual Model with Game Theory and Cloud Model—A Case Study of Nanjing. J. Cult. Herit. 2022, 58, 1–11. [Google Scholar] [CrossRef] [Scilit]
- Chen, M.; Jiang, Y.; Wang, E.; Wang, Y.; Zhang, J. Measuring Urban Infrastructure Resilience via Pressure-State-Response Framework in Four Chinese Municipalities. Appl. Sci. 2022, 12, 2819. [Google Scholar] [CrossRef] [Scilit]
- Zhang, C.; Zhou, Y.; Yin, S. Interaction Mechanisms of Urban Ecosystem Resilience Based on Pressure-State-Response Framework: A Case Study of the Yangtze River Delta. Ecol. Indic. 2024, 166, 112263. [Google Scholar] [CrossRef] [Scilit]
- Anselin, L. Local Indicators of Spatial Association—LISA. Geogr. Anal. 1995, 27, 93–115. [Google Scholar] [CrossRef] [Scilit]
- Lefever, D.W. Measuring Geographic Concentration by Means of the Standard Deviational Ellipse. Am. J. Sociol. 1926, 32, 88–94. [Google Scholar] [CrossRef] [Scilit]

Disclaimer/Publisher’s Note: The statements, opinions and data contained in all publications are solely those of the individual author(s) and contributor(s) and not of MDPI and/or the editor(s). MDPI and/or the editor(s) disclaim responsibility for any injury to people or property resulting from any ideas, methods, instructions or products referred to in the content. |
© 2026 by the authors. Licensee MDPI, Basel, Switzerland. This article is an open access article distributed under the terms and conditions of the Creative Commons Attribution (CC BY) license.