


Abstract
Recreational spaces in industrial parks are essential components of sustainable urban development, as they contribute to environmental quality, social well-being, and the transformation of production-oriented areas into livable urban environments. This study aims to develop a spatial attractiveness evaluation framework tailored to recreational spaces in industrial parks, to identify and compare the key factors influencing attractiveness across different recreational space types, and to reveal the functional complementarity and underlying mechanisms among these spaces. Taking Suzhou Industrial Park (SIP) as a case study, a three-dimensional evaluation framework integrating spatial attributes, experiential perception, and place identity was constructed using GIS-based spatial analysis, questionnaire surveys, and the analytic hierarchy process (AHP). The spatial attractiveness of nature-dominated, mixed-type, and artificial-dominated recreational spaces was systematically evaluated and compared. The results show that experiential perception and place identity exert a stronger influence on spatial attractiveness than objective spatial attributes. Nature-dominated spaces primarily support ecological restoration and psychological recovery, mixed-type spaces facilitate diverse social and leisure activities, and artificial-dominated spaces are more suited to short-duration, high-frequency use, demonstrating clear functional complementarity. These findings highlight the necessity of type-specific strategies for enhancing recreational spaces in industrial parks and emphasize their role in supporting environmentally, socially, and functionally sustainable urban development. The proposed framework provides a transferable approach for evaluating and optimizing recreational spaces in other functionally mixed urban contexts.
1. Introduction
Industrial parks are comprehensive urban spaces that integrate production, living, recreation, business, and cultural functions [1], and have become important carriers for the restructuring of modern urban spatial structures and the optimization of regional governance [2]. The emergence of such integrated spaces responds to the trend of “de-functionalization” in urban development and aligns with contemporary planning concepts such as the “compact city,” “mixed land use,” and the “15-min living circle” [3]. Industrial parks contain diverse spatial types, among which recreational spaces are particularly important for breaking the pattern of “production enclaves” [4] and enhancing spatial livability [5]. Green spaces, water bodies, slow-traffic systems, and public open spaces within industrial parks not only help alleviate the environmental pressure generated by high-density industrial development [6], but also improve the health and sense of belonging of the population [7,8]. These recreational spaces contribute to sustainable urban development by supporting ecological resilience, biodiversity conservation, and resource-efficient land use, aligning with international sustainability goals. Moreover, the enhancement of spatial attractiveness in recreational spaces helps stimulate users’ emotional identification and foster “perceivable publicness,” which constitutes a critical support for the transformation of industrial parks from single-purpose production spaces to diversified urban spaces [9,10]. Therefore, it is essential to systematically incorporate recreational spaces as a strategic element in industrial park planning.
Scholars have widely acknowledged the importance of recreational spaces in urban environments, examining their functions and impacts from diverse perspectives. In recent years, research in this field has gradually shifted from emphasizing basic environmental and social functions to a more comprehensive exploration of users’ experiential perceptions and emotional responses. A growing body of evidence indicates that recreational spaces not only enhance physical and mental health by alleviating stress and cognitive fatigue but also strengthen social interaction, promote social cohesion, and boost subjective well-being [11,12,13,14,15,16]. Existing studies highlight that the quality of recreational spaces is critical to shaping urban vitality and competitiveness [17,18]. Only high-quality public spaces are capable of attracting sustained use, thereby stimulating the economic and cultural vitality of surrounding areas and strengthening overall urban competitiveness [19]. Concurrently, there has been a growing focus on the emotional experiences, memory associations, and symbolic identities tied to recreational spaces, moving beyond a sole emphasis on their physical environments [20,21]. This indicates that whether a recreational space fosters place attachment and a sense of belonging is central to its long-term appreciation and continued use [22]. As a result, the focus of related research has expanded from objective spatial attributes—such as green coverage, facility provision, and accessibility—to subjective dimensions of perception, including esthetic evaluation, comfort, activity experience, and emotional attachment [23]. This shift reflects a broader trend in urban public space research toward integrating environmental psychology, social sustainability, and place theory, highlighting experiential perception and place identity as core concepts for understanding why certain urban public spaces are both attractive and sustainably viable.
To identify the key factors influencing the attractiveness performance of public spaces, early studies focused primarily on the urban physical environment. These studies indicate that urban transportation systems, street connectivity, and pedestrian friendliness are important prerequisites for public space use, while building façades and streetscapes influence people’s willingness to engage with public spaces [24,25,26,27]. As users’ willingness to stay is closely related to activity support, interest, spatial scale, and comfort [28], public spaces must provide appropriate spatial proportions, rich edge details, and diverse activity facilities in order to stimulate exploration and use [29,30]. In addition, Jacobs [31] emphasized that functional diversity, population density, and the frequency of building renewal form the foundation for maintaining public space attractiveness. Only when different functions—such as residential, commercial, and recreational uses [32]—are superimposed in time and space can all-day, multi-user participation be sustained [33]. This view is consistent with Sepe’s [34] argument that public spaces should possess flexibility and diversity to accommodate different activity patterns. However, these studies predominantly conceptualize attractiveness from a physical or functional perspective, providing limited insight into how users interpret and emotionally respond to spatial environments. In response to this limitation, recent research has increasingly applied methods such as big data analytics, GIS-based spatial analysis, and emotion quantification to examine public space attractiveness. These approaches enable more effective capture of spatial configurations, use intensity, and behavioral patterns [19]. But many of these studies emphasize measurable spatial performance while treating users’ experiential perception as a secondary outcome, rather than as a core explanatory mechanism. Although emerging research highlights affective responses, social interactions, and cultural affiliations as key mediating factors between subjective perception and spatial attractiveness [35], how these mediating mechanisms operate across different recreational space types within integrated urban environments has not been sufficiently examined.
Although substantial progress has been made in evaluating the attractiveness of public spaces and identifying their influencing factors, existing studies have largely concentrated on traditional urban parks [11,12,13,14,15,16,17,18]. In contrast, recreational spaces in industrial parks—characterized by strong functional integration, diverse user groups, and hybrid spatial forms embedded in production-oriented environments—have received relatively limited scholarly attention. While recent studies increasingly emphasize experiential perception and place-related dimensions [36], there remains a lack of systematic research examining how objective spatial attributes, experiential perception, and place identity interactively shape spatial attractiveness in the specific context of industrial parks. Most existing studies tend to focus on one or two dimensions in isolation, which limits their explanatory power in highly integrated urban environments. Moreover, the coexistence of multiple recreational space types within industrial parks implies substantial variation in spatial functions, usage patterns, and experiential outcomes; however, comparative empirical analyses across different recreational space types within a unified industrial park framework remain scarce [37]. Based on the proportion of natural and artificial elements, recreational spaces can be classified into nature-oriented, human-oriented, and mixed types [38]. Some studies have shown that, compared with urban environments, activities conducted in natural settings are associated with more pronounced reductions in negative emotions such as anxiety and fatigue [39,40]. Compared with urban green spaces, wilderness environments are more likely to evoke positive emotions [41,42]. Nevertheless, existing research has yet to provide a systematic and integrative understanding of the differential attractiveness effectiveness of various recreational space types, particularly with regard to how their spatial characteristics and perceptual mechanisms contribute to functional complementarity within industrial parks [43].
Taken together, integrating recreational space design and evaluation into industrial parks is not only critical for enhancing user experiences but also essential for promoting environmentally and socially sustainable urban development. existing studies provide valuable insights into the determinants of public space attractiveness, yet they remain insufficient for explaining the performance of recreational spaces within highly integrated industrial park environments. In particular, the lack of an integrated evaluation framework limits the understanding of how different types of recreational spaces function and complement one another. Moreover, few empirical studies have conducted comparative analyses across multiple recreational space types within a single industrial park context using both spatial data and perception-based assessments. Addressing these gaps is essential for advancing both theoretical understanding and practical guidance for the planning and renewal of recreational spaces in industrial parks. Accordingly, the objectives of this study are as follows:
- Develop a spatial attractiveness evaluation framework tailored to recreational spaces in industrial parks by integrating GIS-based spatial analysis and perception-based assessment;
- Identify and compare the key factors influencing spatial attractiveness across nature-dominated, mixed-type, and artificial-dominated recreational spaces;
- Reveal the functional complementarity and underlying mechanisms of attractiveness among different recreational space types, and propose type-specific optimization strategies.
2. Materials and Methods
2.1. Study Area
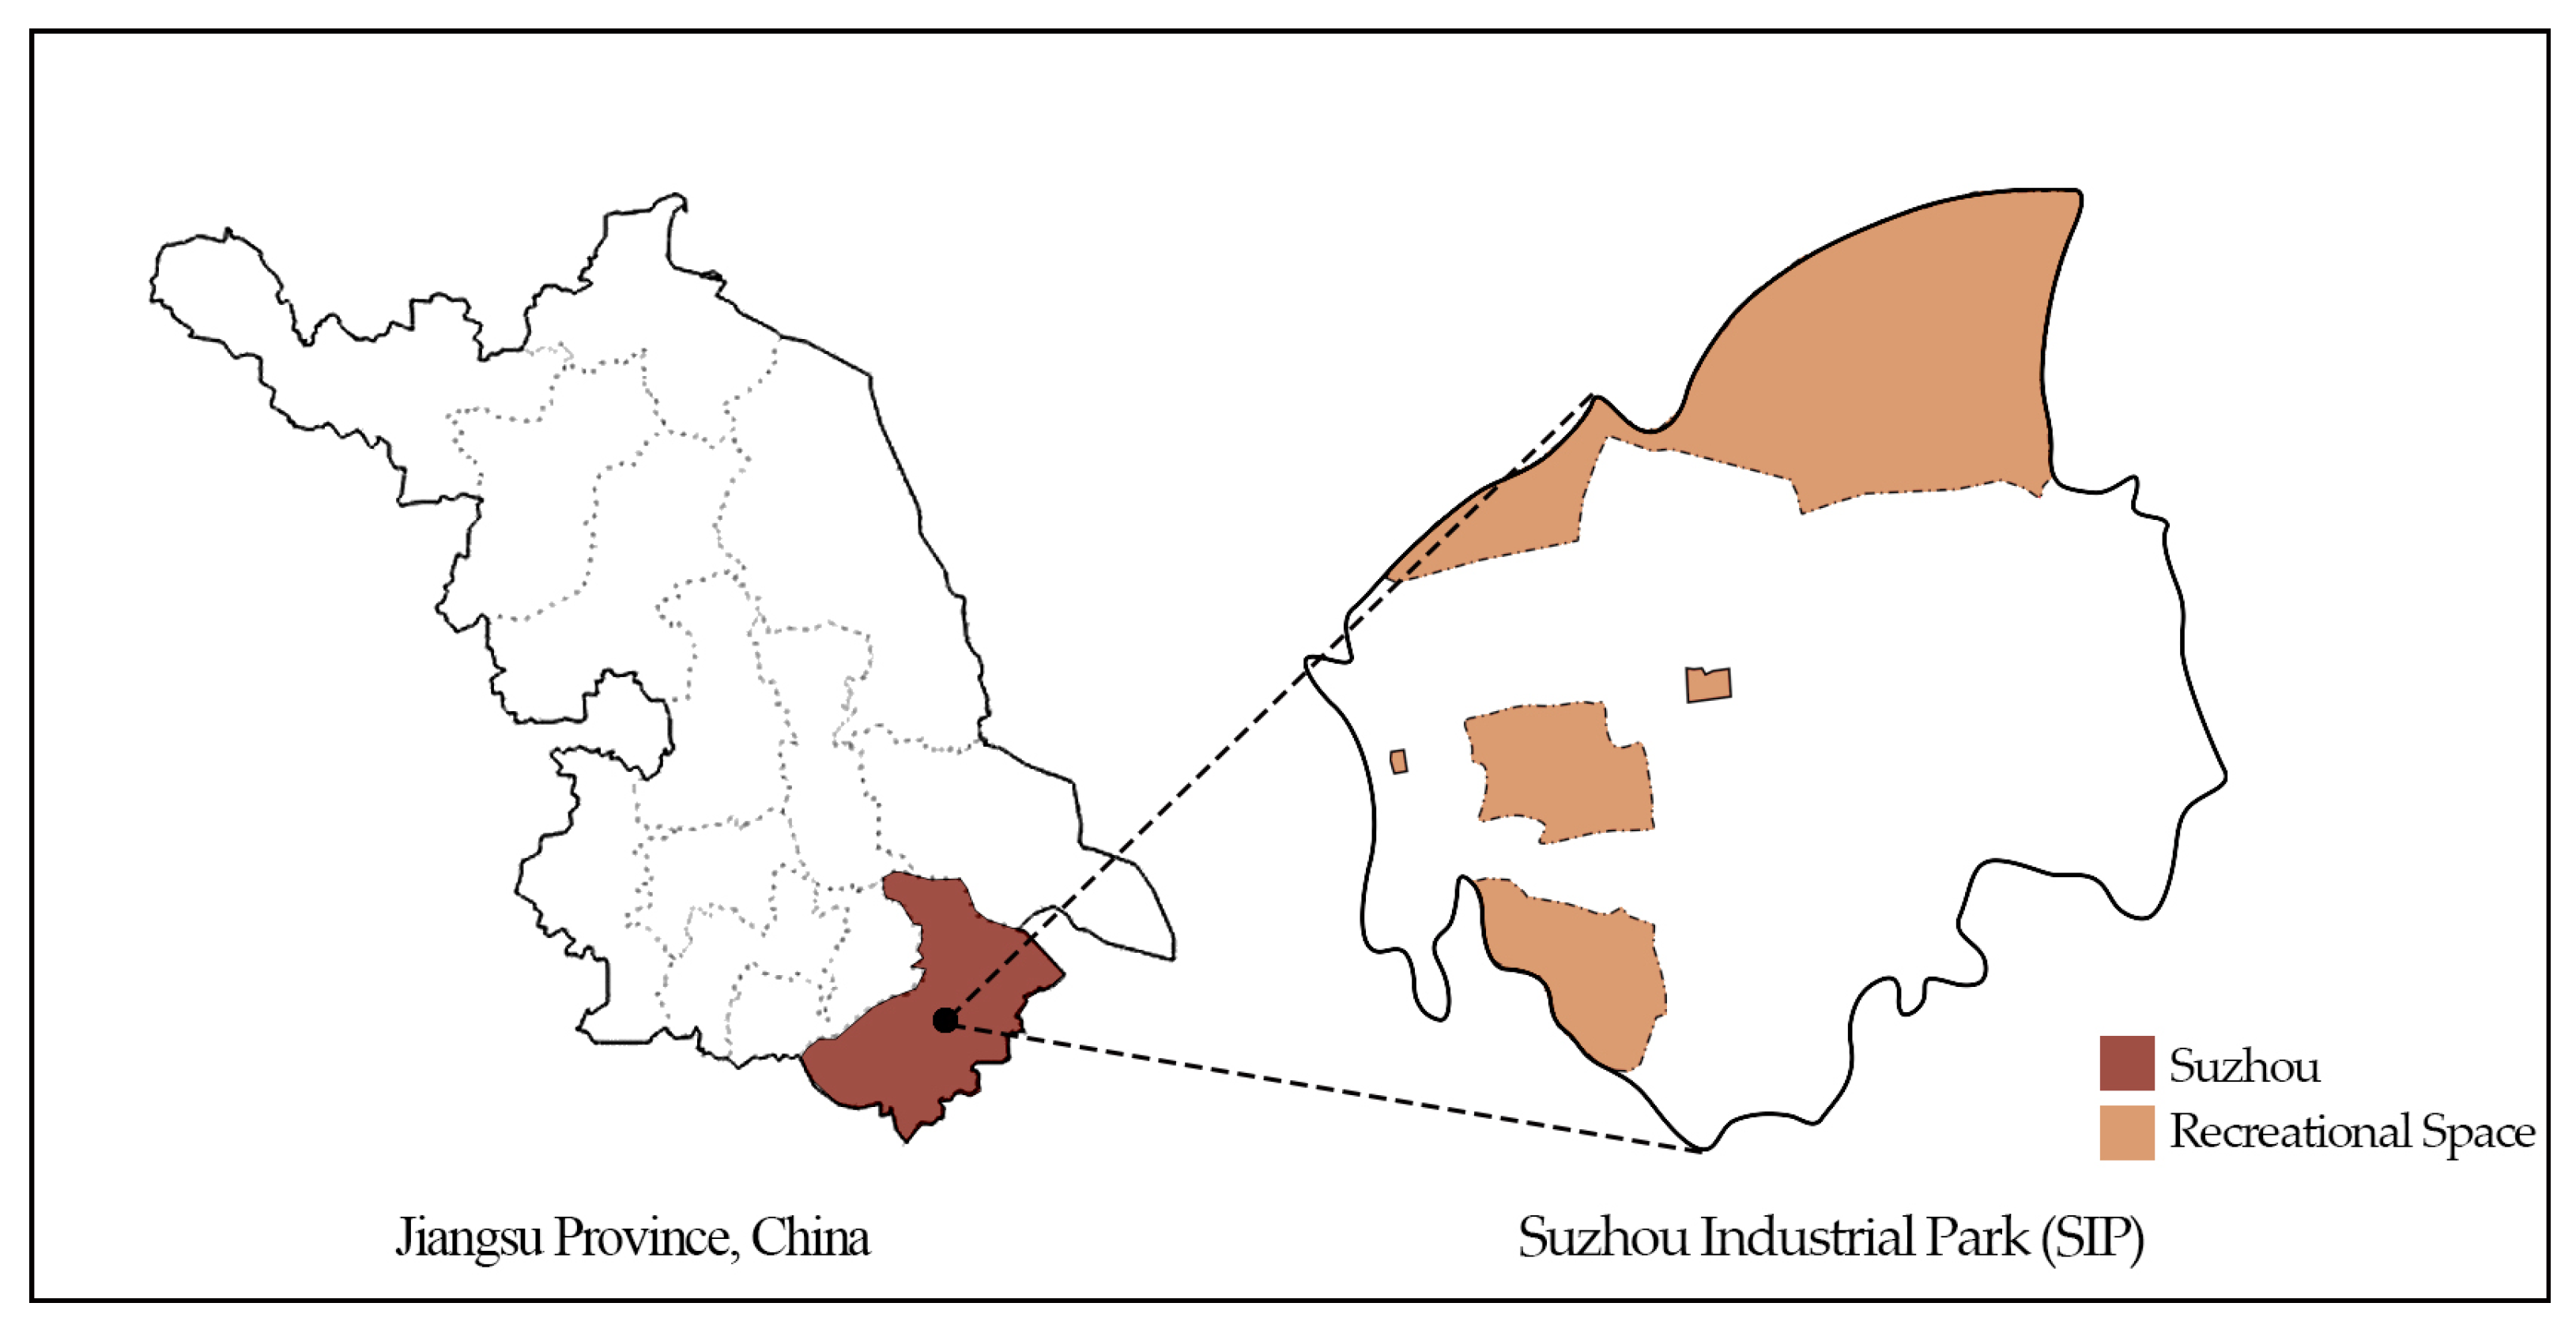
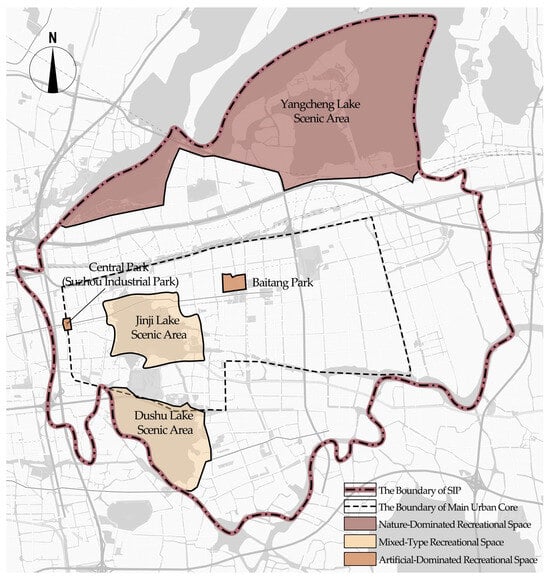
This study was conducted in Suzhou Industrial Park (SIP), Jiangsu Province, China (Figure 1). SIP is a major cooperative project between the governments of China and Singapore, covering an area of 278 km2 and possessing abundant recreational resources. Referring to established classification criteria [38], recreational spaces were divided into three categories in this study: nature-dominated recreational spaces, in which natural environmental components are predominant with limited human intervention; mixed-type recreational spaces, in which natural and artificial environments are relatively balanced; and artificial-dominated recreational spaces, in which built facilities and structures are dominant, with natural elements serving primarily as embellishments.
Figure 1.
Location of the study area in Suzhou, China.
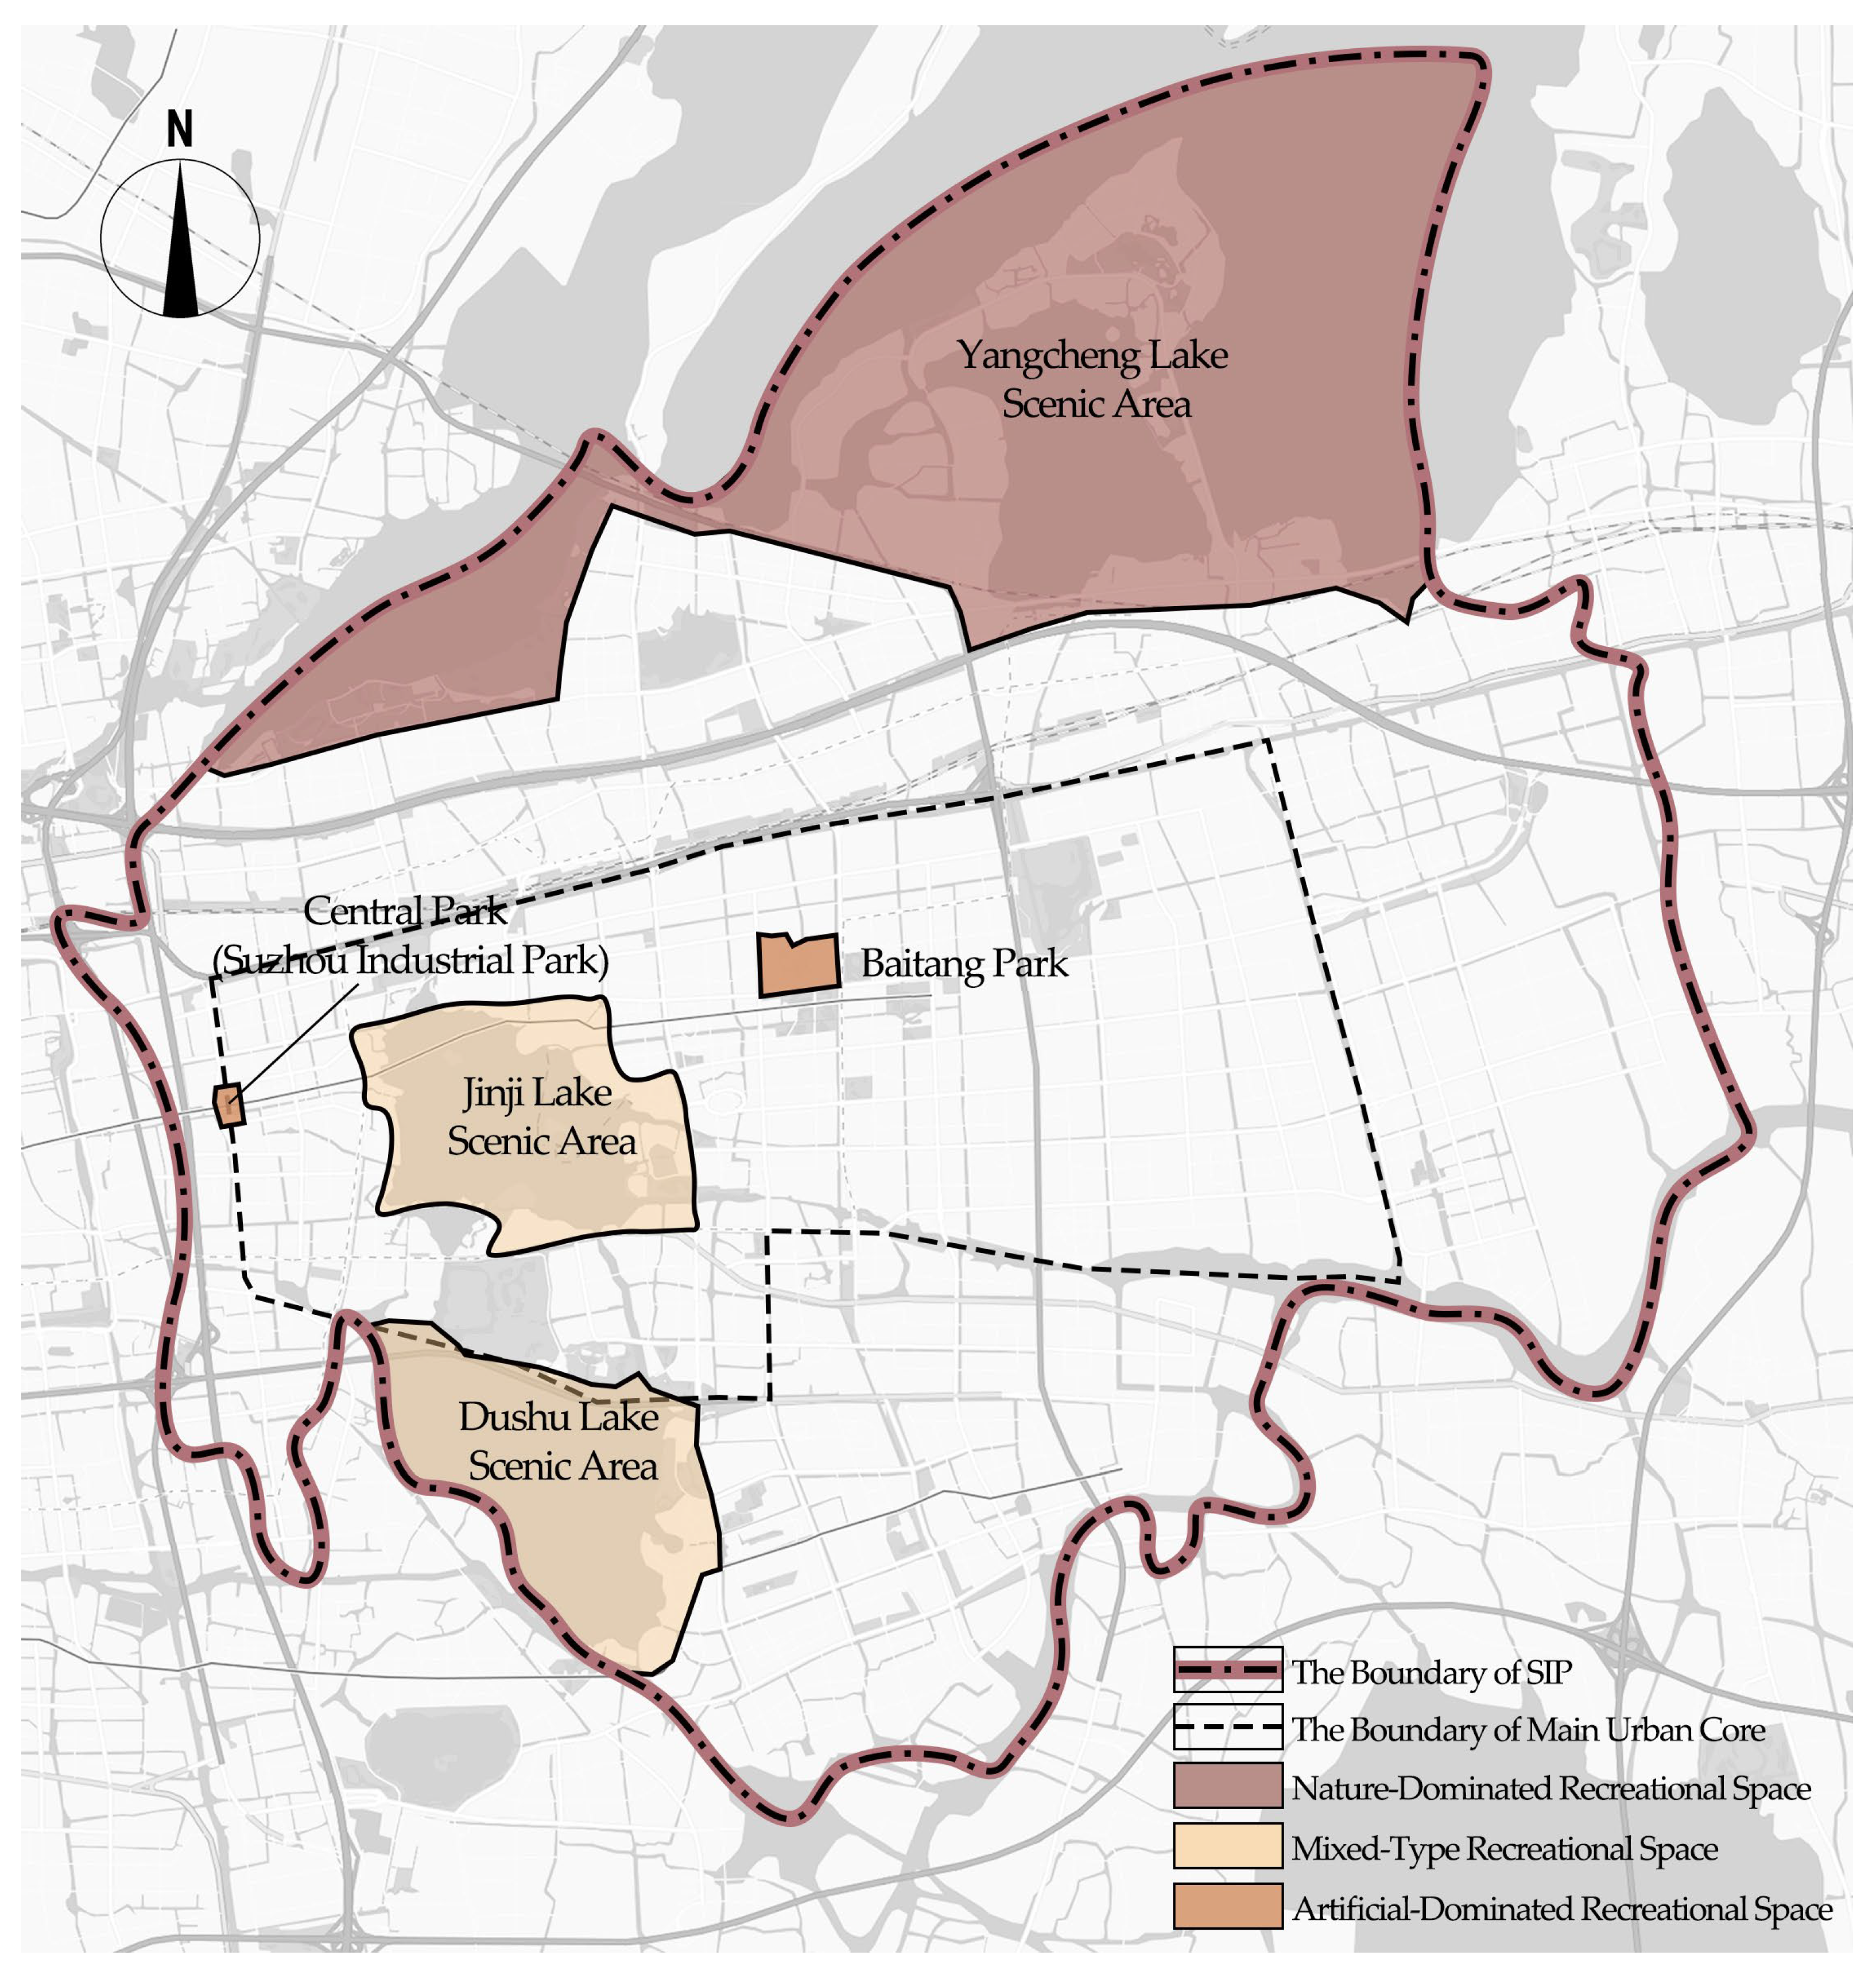
Five representative recreational spaces within the park were selected as study areas (Figure 2), including the three major lakes—Jinji Lake, Dushu Lake, and Yangcheng Lake—as well as Central Park and Baitang Park. The classification of the five recreational spaces is presented in Table 1.
Figure 2.
Location of recreational spaces.
Table 1.
Classification of recreational spaces in SIP.
2.2. Framework Construction
This study analyzes the spatial attractiveness of recreational spaces by constructing an evaluation system combined with demand statistics. In previous studies, the analytic hierarchy process (AHP) has been widely applied to similar research topics [44,45]. These demonstrate that AHP is effective in addressing the factors influencing the effectiveness of spatial attractiveness in recreational spaces.
2.2.1. Dimension Selection
In this study, spatial attractiveness is evaluated from three dimensions: spatial attributes, experiential perception, and place identity. This evaluation framework follows the stimulus–organism–response (S–O–R) model, in which spatial attributes (objective stimulus) influence users’ perceived environmental qualities (organism), which subsequently shape place identity (response). The subjective perception and intention dimensions are constructed based on validated scales in environmental psychology and place-related research. Perception and intention can only be captured through user-reported data, as they represent internal cognitive and emotional responses that cannot be directly measured by objective spatial metrics.
- Spatial attributes refer to the objective physical properties and environmental elements of space. This dimension emphasizes externally observable or measurable characteristics, such as spatial scale, form, boundary definition, complexity, accessibility, and facility provision [46]. Together, these factors determine the functional performance and physical quality of space and constitute the basic conditions for attracting users and supporting their stay.
- Experiential perception refers to users’ subjective experiences during spatial use. It involves not only the direct perception of physical characteristics, but also the resulting esthetic evaluations, emotional responses, and perceptions of psychological safety [27]. This dimension reveals how space, through visual, tactile, and atmospheric cues, influences users’ psychological responses and spatial preferences.
- Place identity refers to the sense of meaning and identity that people develop in relation to a space. It is mainly reflected in two aspects: place meaning and place attachment.
2.2.2. Indicator Selection
Existing studies have evaluated spatial attractiveness from multiple disciplinary perspectives, including transportation studies, environmental behavior research, and urban planning. Drawing on internationally validated environmental psychology scales and considering the specific characteristics of recreational spaces [27,47,48], this study selects representative influencing factors with high occurrence frequency in the literature to construct the evaluation system (Table 2). The recreational space spatial attractiveness evaluation system is defined with spatial attractiveness as the goal layer (A), the three dimensions as the criteria layer (B), and ten influencing factors as the indicator layer (C).
Table 2.
Spatial attractiveness evaluation system for recreational spaces.
2.3. Data Sources
The data used in this study can be classified into three types: a, b, and c. Type a refers to the indicator scores under spatial attributes (B1), which were obtained through GIS-based spatial analysis. Type b represents the indicator weights derived from expert surveys. Type c refers to the indicator scores and spatial demand conditions associated with experiential perception (B2) and place identity (B3), which were collected through questionnaire surveys.
2.3.1. Spatial Attribute Indicators Based on GIS-Based Spatial Analysis
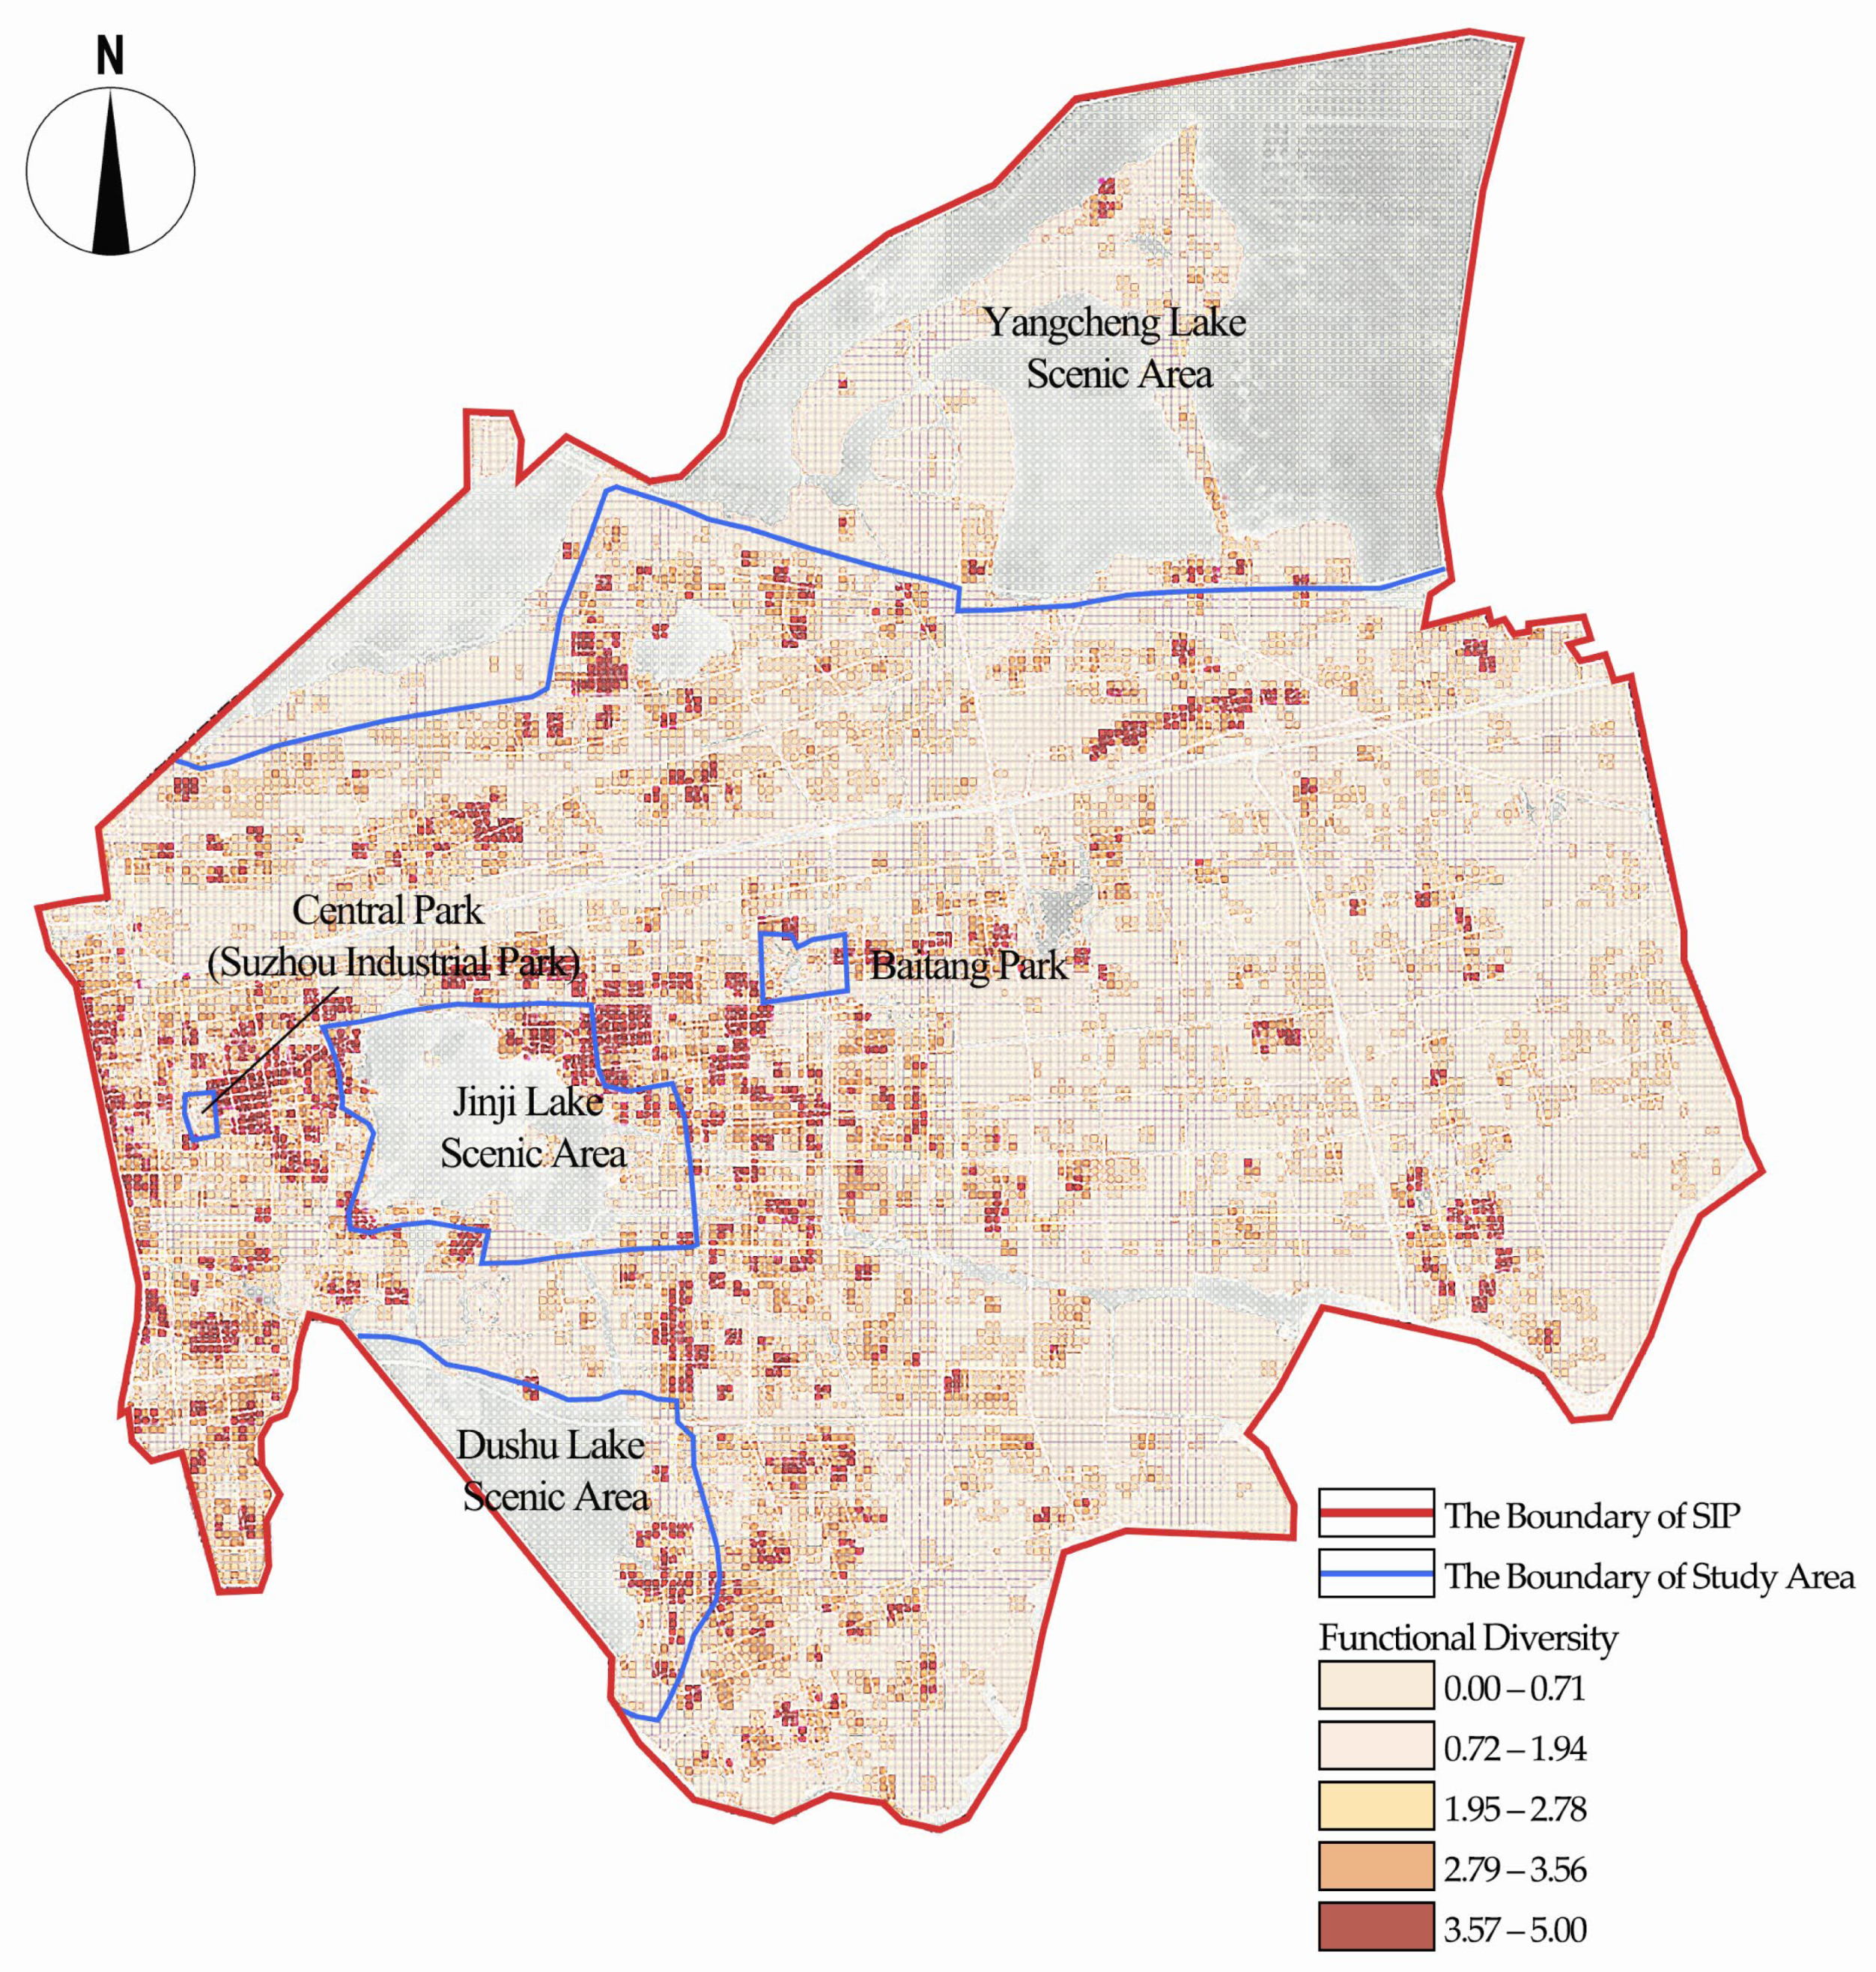
Functional diversity: Python 3.13 was used to collect 1,048,576 points of interest (POI) data representing different types of urban land use within the study area. The POI data were imported into ArcGIS 10.2, and the study area was divided into rectangular grid cells with a width of 100 m. The functional diversity of each grid cell was then calculated using Shannon’s Diversity Index (SHDI) (Figure 3) [49]. The formula is as follows:
In the formula, represents the functional diversity of a grid cell, is the proportion of type within the grid cell, and is the total number of POI types in the grid cell. The results are shown in Figure 4, where lower values indicate areas that are vacant or dominated by a single function, while higher values indicate greater functional mixing. The average value of the land grid cells covered by each recreational space was then calculated to obtain the functional diversity of each recreational space.
Figure 3.
Illustration of functional diversity.
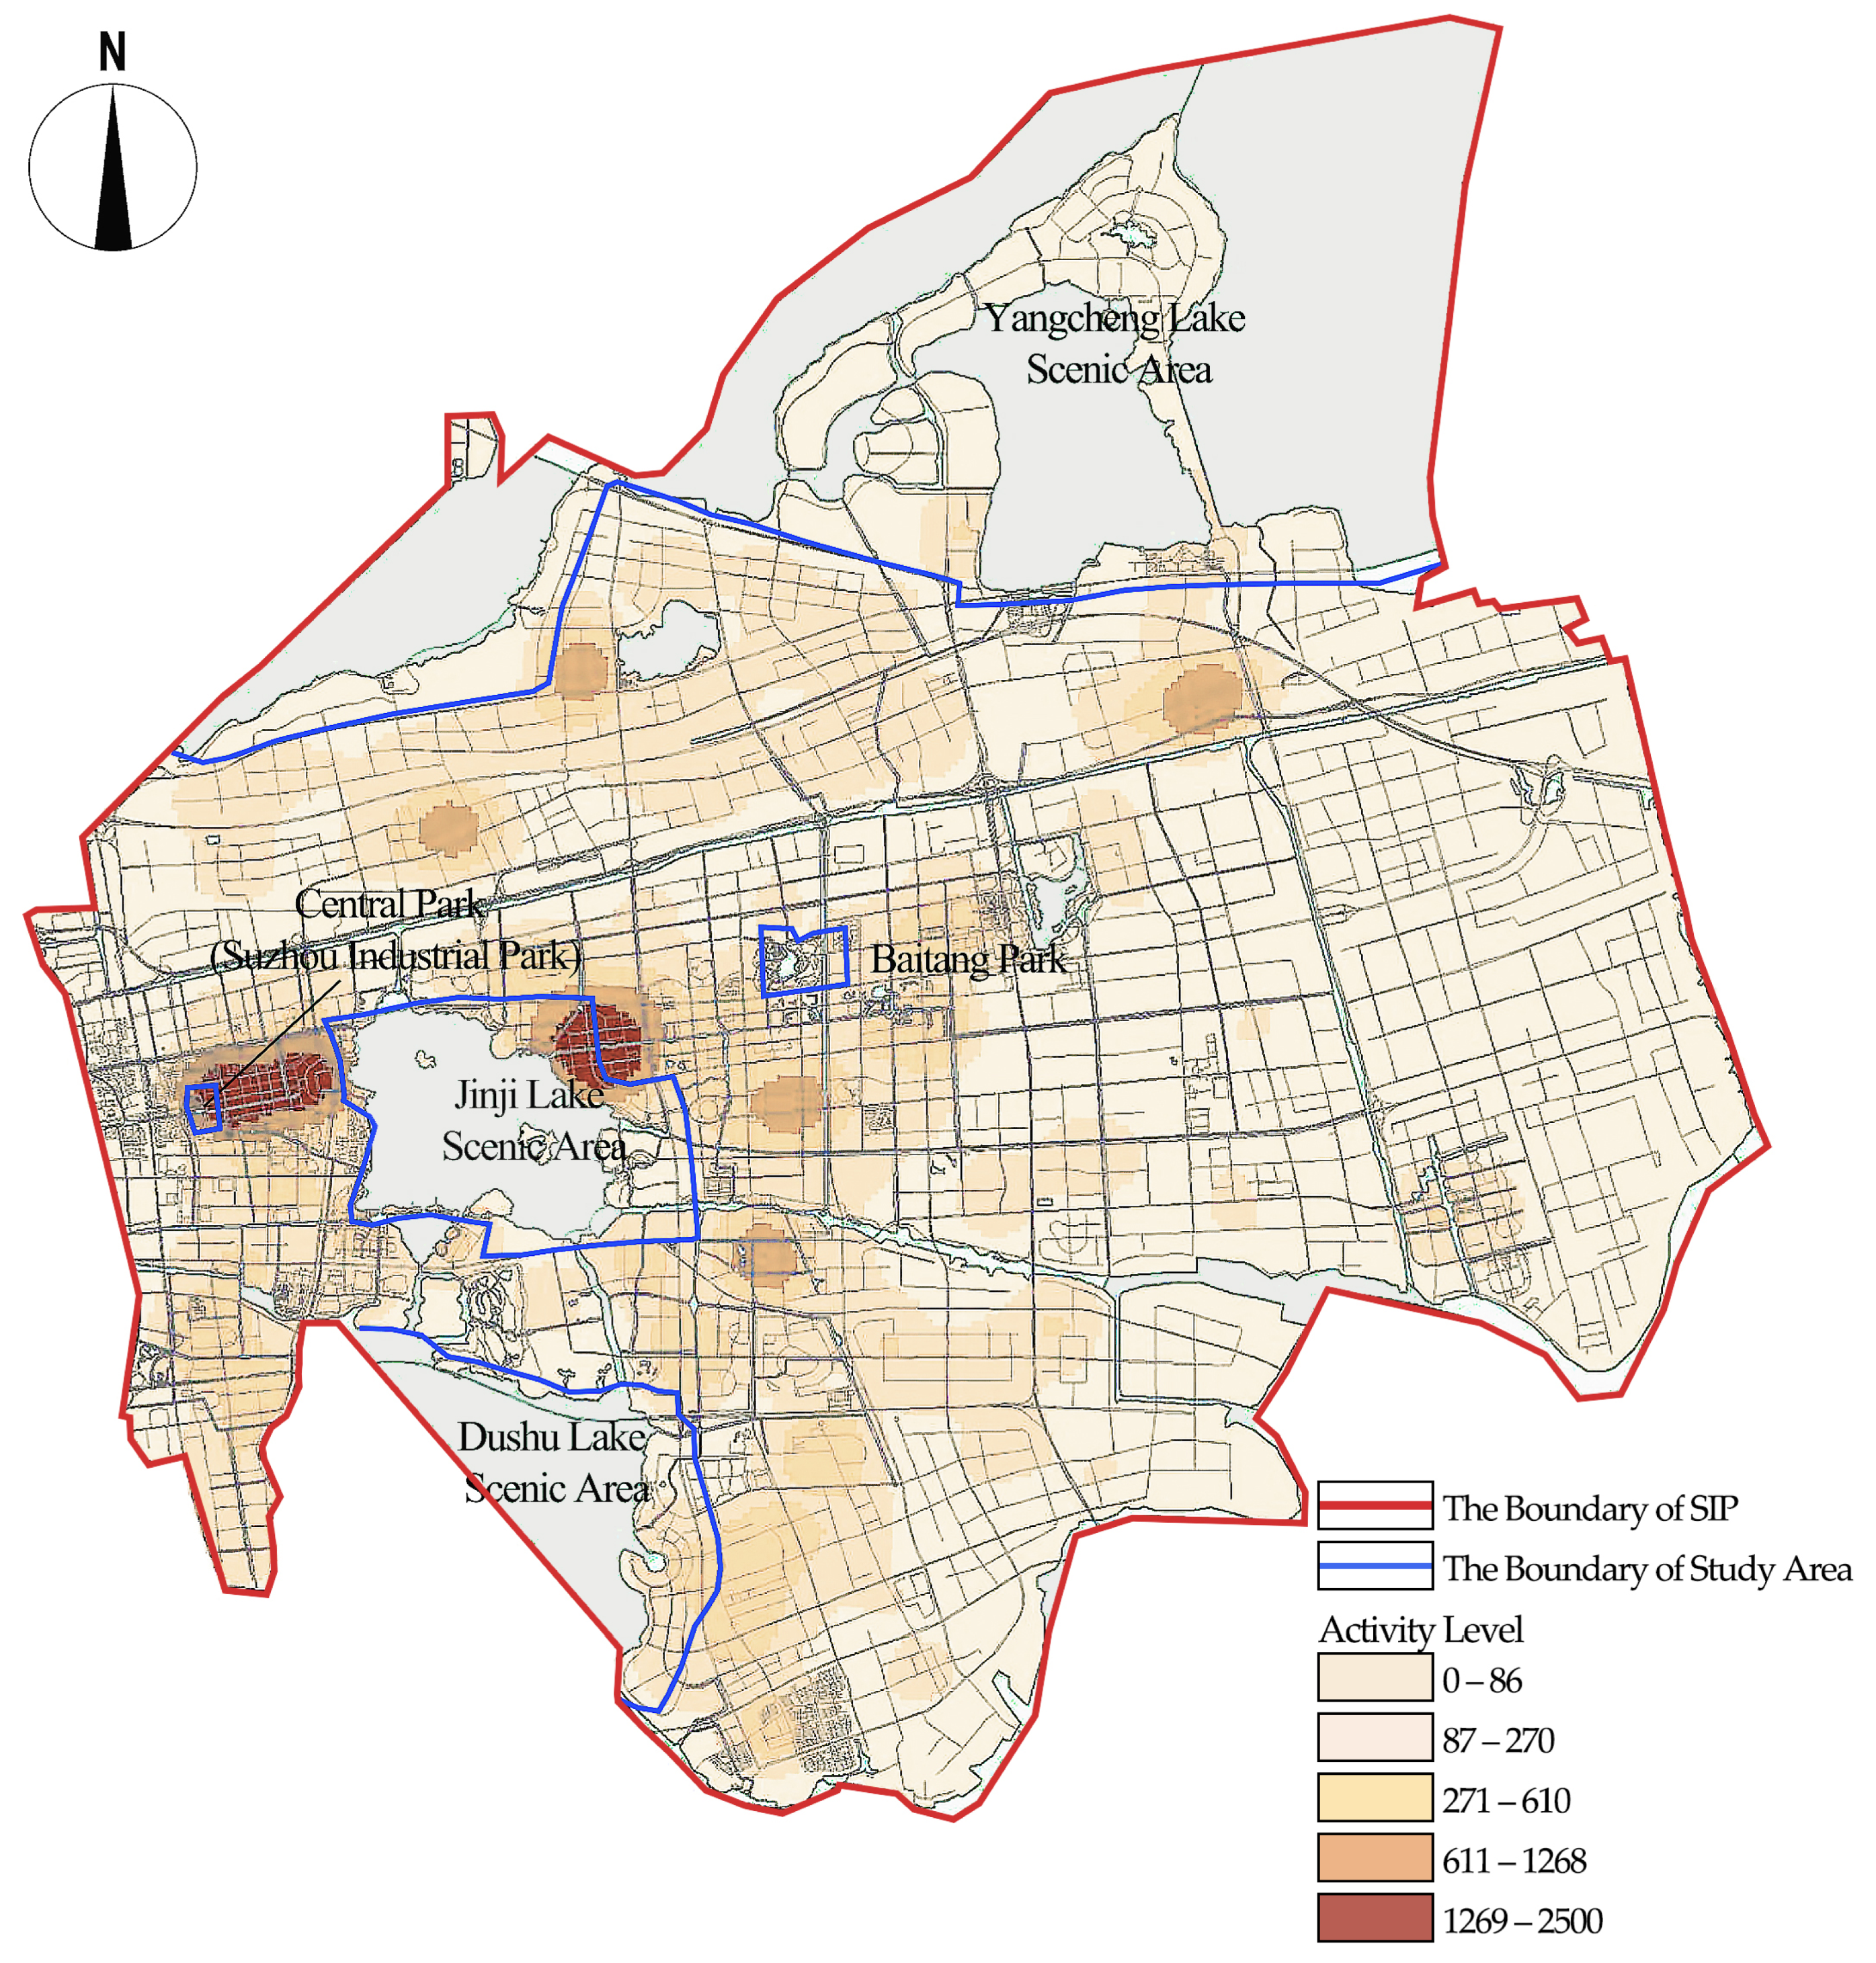
Activity Level: Python was used to collect 36,898 POI data points representing various service facilities within the study area. The POI data were imported into ArcGIS, and kernel density estimation (KDE) was applied to calculate activity levels (Figure 4) [50]. The formula is as follows:
In the formula, represents the kernel density at location , is the weight of point (default = 1), is the bandwidth of the kernel function, and is the distance between location and point . The results are shown in Figure 5. The average value of the land area within each recreational space was then calculated to obtain the activity level of each recreational space.
Figure 4.
Illustration of activity level.
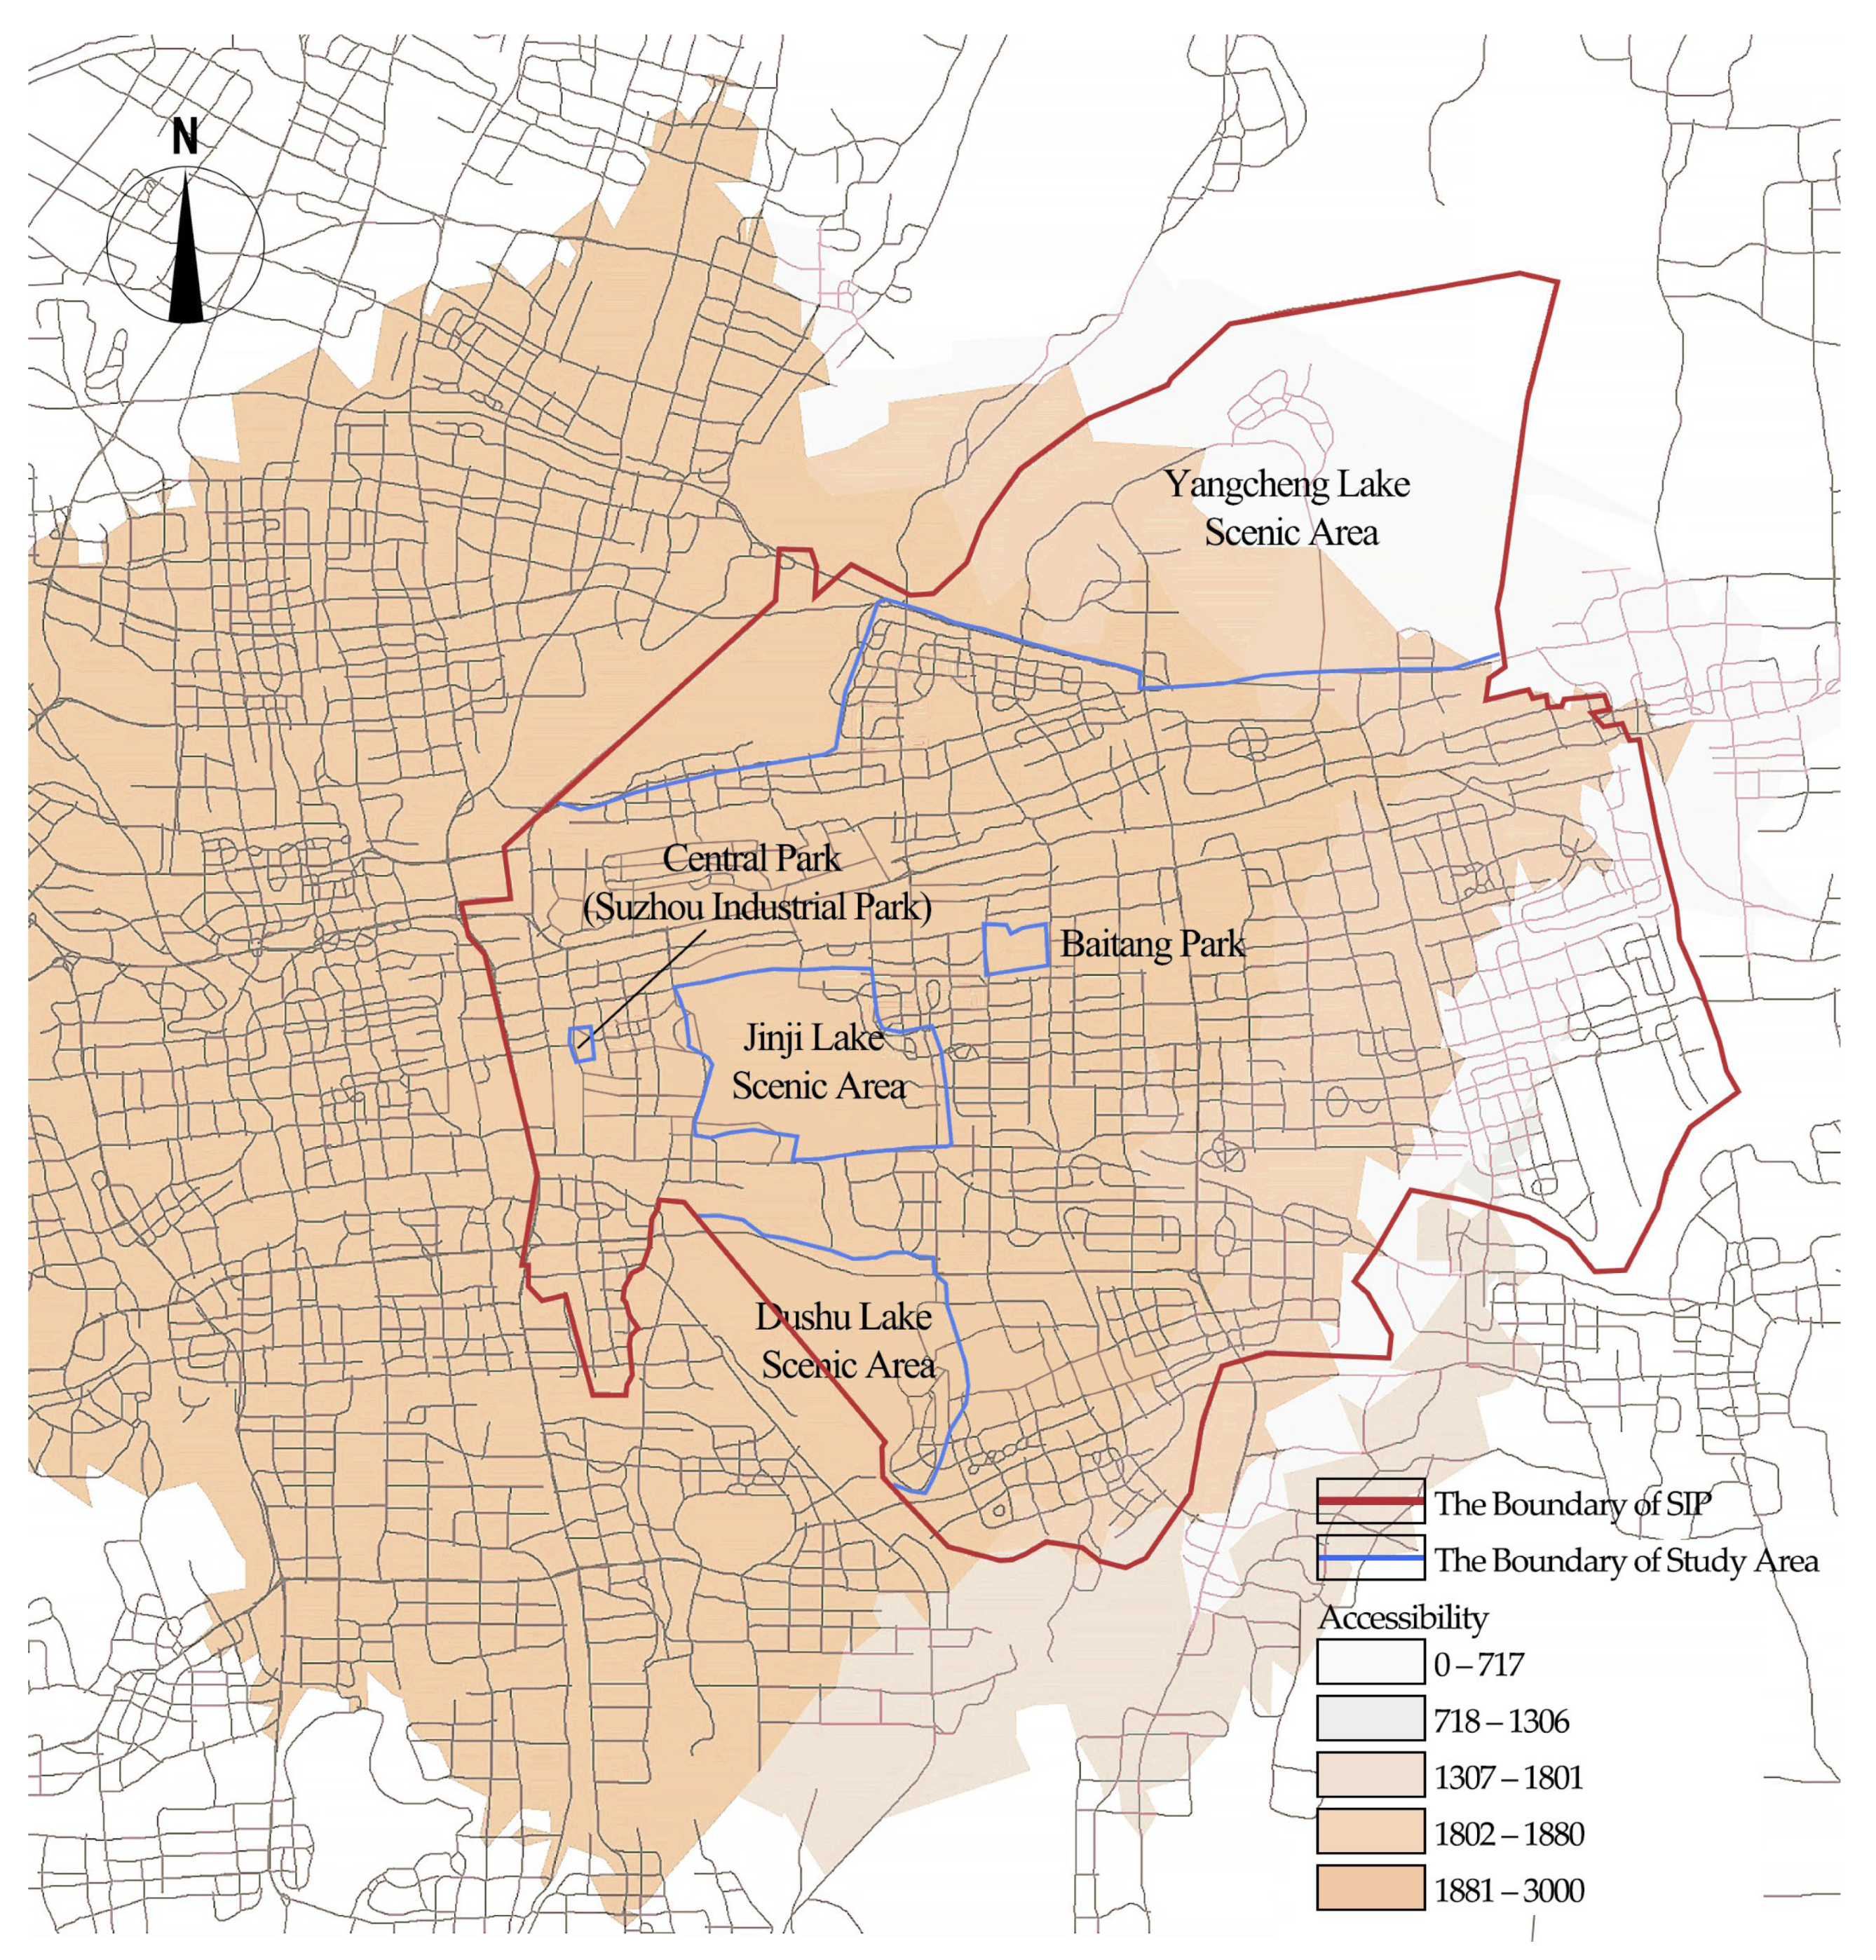
Accessibility: Based on the POI data of service facilities described above, a road network analysis model was constructed. All roads were classified and their centerlines extracted. By default, urban arterials are connected to secondary roads, and elevated roads are connected to expressways. The travel speeds were set as follows: 60 km/h for urban arterials, 40 km/h for urban secondary roads, and 80 km/h for elevated roads and expressways [51,52]. The formula is as follows:
In the formula, represents the accessibility value at location , is the kernel function (default = 1), and is the distance between location and point . To reduce calculation errors, the road buffer range was expanded from SIP to the boundary of Suzhou city. The results are shown in Figure 5.
Figure 5.
Illustration of accessibility.
Landmark Prominence: Python was used to collect discussions on urban landmarks in SIP from Rednote v.8.67.0.66e305b in 2024. Urban landmarks with more than 200 posts were identified (Table 3). The landmarks located within each recreational space were then summed to calculate landmark prominence [19] using the following formula:
In the formula, represents the landmark prominence of space , is the total number of posts for landmarks within the boundary of recreational space , and is the total number of posts for all urban landmarks in the industrial park .
Table 3.
Urban landmarks in SIP and their post counts.
2.3.2. Indicator Weights Based on Expert Surveys
Fifteen professionals and scholars in architecture and urban planning were invited to conduct pairwise comparisons of indicators at the same hierarchical level. Based on the Saaty 1–9 scale, judgment matrices were constructed, and the weights of each indicator were then calculated. Consistency of the matrices was verified using the consistency ratio (CR < 0.10) to ensure rationality (Table 4). For synthesizing opinions from multiple experts, the geometric mean was used to aggregate individual judgment matrices into a group judgment matrix, producing the final weights. The formula is as follows:
In the formula, represents the comparison value between indicators and provided by the -th expert in the aggregated judgment matrix, and is the number of experts.
Table 4.
Indicator weights.
2.3.3. Experiential Perception and Place Identity Data Based on Questionnaires
The study sites included five representative recreational spaces in SIP. A systematic intercept sampling approach was employed to recruit questionnaire respondents, whereby individuals encountered at regular intervals along the circulation paths were invited to complete the questionnaire [53]. Only those who met the predefined inclusion criteria—namely, having visited the recreational space at least once and being able to fully understand the questionnaire and participate voluntarily—were included in the survey.
A structured questionnaire consisting of closed-ended questions was employed and organized into three sections: respondent information, subjective evaluation indicators, and spatial demand. The subjective evaluation indicators were adapted from established environmental psychology scales to fit the characteristics of recreational spaces. Each indicator included 2–4 specific items, which respondents rated on a 5-point Likert scale; scores were then aggregated to obtain the indicator score. Spatial demand items were used to support and interpret the indicator scores but were not considered evaluation sub-items. Each indicator included 3–5 spatial demand items, which were also rated using a 5-point Likert scale. The correspondence between items and indicators was reviewed by three domain experts to ensure scientific validity [54,55].
Prior to the formal survey, a pilot survey was conducted to pretest the questionnaire. The purpose of the pilot survey was to assess the clarity, wording, and logical structure of the questionnaire items, as well as to identify any potentially ambiguous or biased expressions. Based on feedback from the pilot participants, minor revisions were made to improve the accuracy and comprehensibility of the questions. The finalized questionnaire was then used for the formal data collection.
Cronbach’s alpha was calculated using IBM SPSS Statistics 27.0 to assess the overall reliability of the questionnaire (Table 5), resulting in a value of 0.889, indicating high reliability. Additionally, the KMO measure was 0.847 and Bartlett’s test of sphericity was significant at p < 0.01 (Table 6), further confirming the structural validity of the questionnaire.
Table 5.
Questionnaire reliability.
Table 6.
Questionnaire validity.
Additionally, for ease of analysis, all indicator values were rescaled to the range [20, 100]. The formula is as follows:
In the formula, is the transformed value, is the original value, and and are the minimum and maximum values of the original range, respectively.
3. Results
3.1. Respondent Information
The survey was conducted from 8 to 12 May 2024, covering both weekdays and weekends, as well as peak and off-peak periods, to ensure sample diversity. During the survey, 200 questionnaires were distributed and 190 were returned, yielding a response rate of 95%. After excluding incomplete responses, 188 valid questionnaires remained, with an effective rate of 98.9%.
The demographic information of respondents is summarized in Table 7. The statistics indicate that 55% of respondents were female and 45% were male. More than half of the respondents (60%) were aged between 18 and 35. Approximately 46% of respondents reported frequent visits to recreational spaces. Additionally, most respondents (73%) spent 1 to 3 h per visit in these spaces.
Table 7.
Descriptive statistics of respondent information.
3.2. Factor Weight Analysis
As shown in Table 8, at the criteria layer (B), the indicators are ranked by weight from highest to lowest as follows: place identity, spatial attributes, and experiential perception. Within spatial attributes (B1), the factor with the greatest influence on the spatial attractiveness of recreational spaces is activity level (C2), reflecting that users pay more attention to the frequency of various activities occurring in the space. Within experiential perception (B2), the most influential factor is activity support (C7), indicating that users focus on whether the space can accommodate different types of activities. Within place identity (B3), the most influential factor is place meaning (C9), highlighting that users value whether the space possesses unique significance.
Table 8.
Ranking of indicator weights.
Considering the overall ranking at the indicator layer (C), the factors with the greatest impact on recreational space attractiveness are activity level, place meaning, and place attachment, whereas functional diversity and accessibility have relatively lower influence.
3.3. Comparison of Indicator Scores Among Different Types
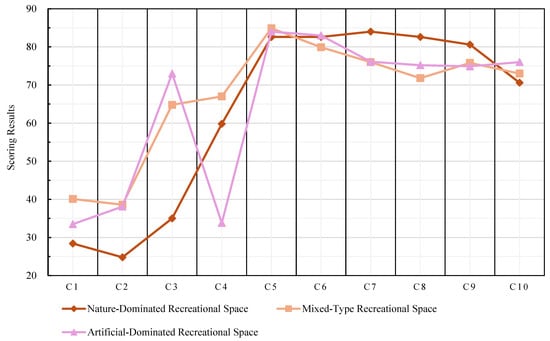
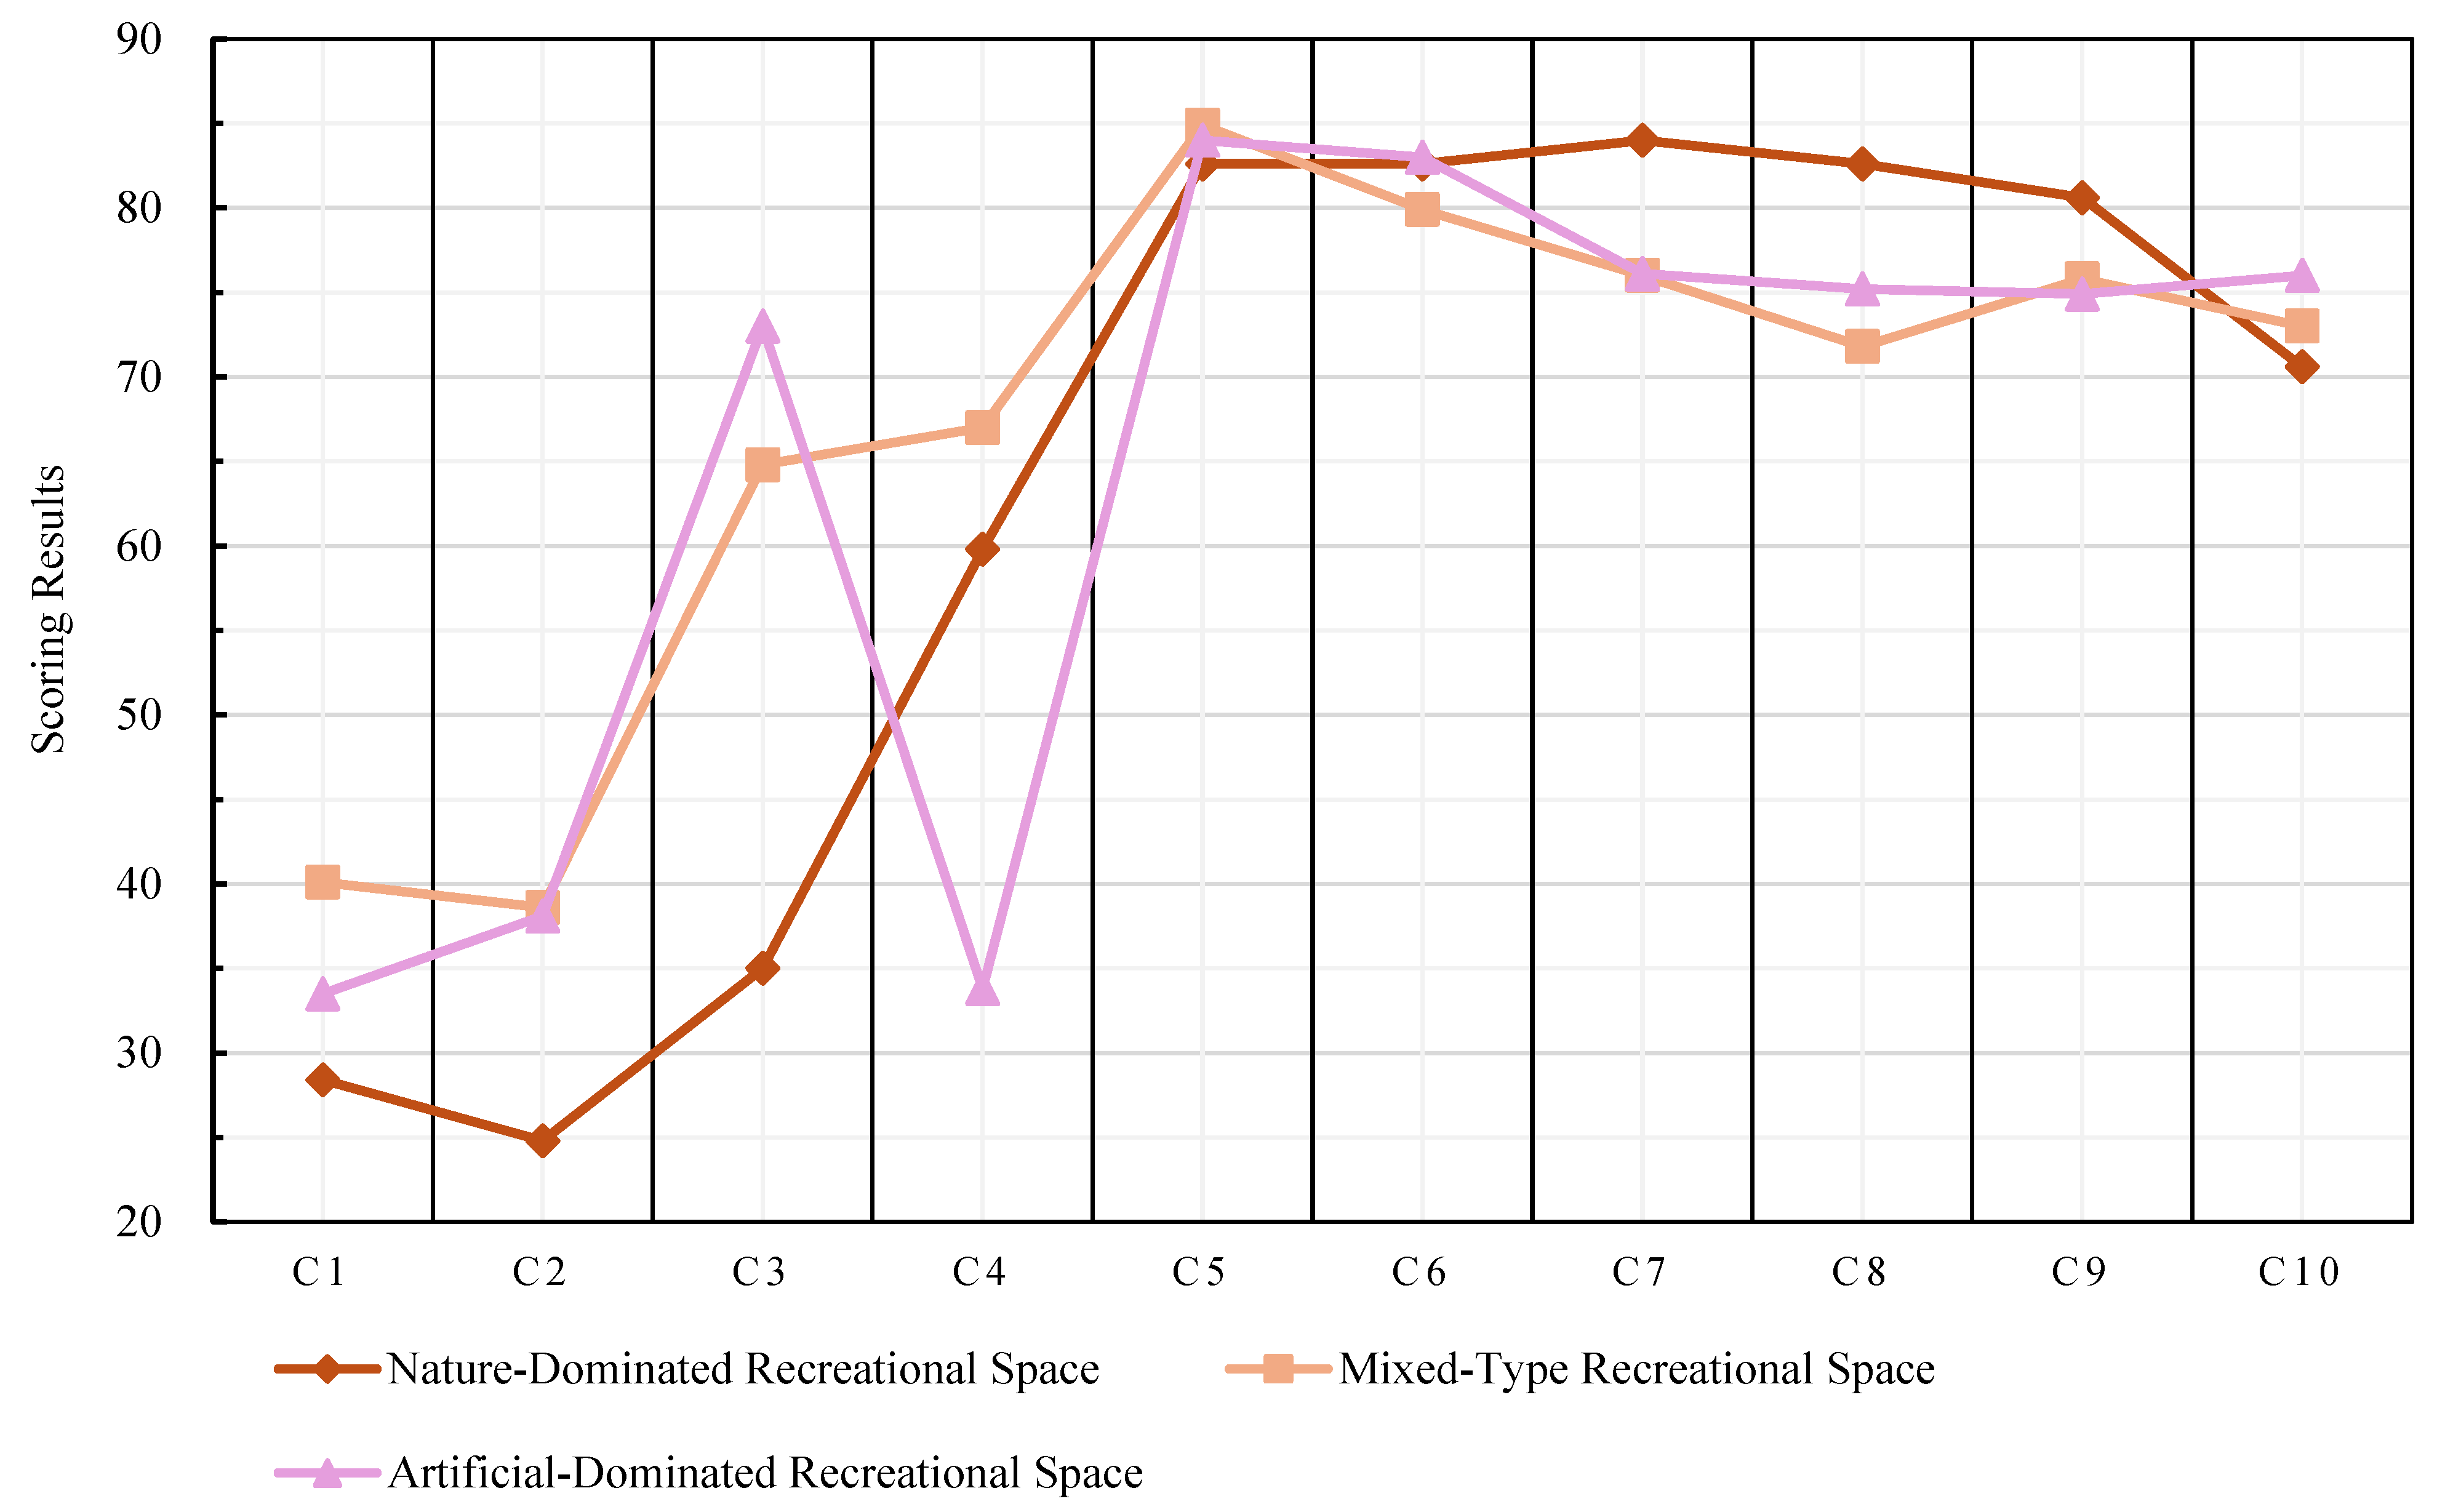
The visualization of recreational space attractiveness evaluation results is shown in Figure 6. Regarding spatial attributes, mixed-type recreational spaces exhibit higher functional diversity than the other two types, whereas nature-dominated recreational spaces have the most homogeneous functions. Additionally, the activity level and accessibility of mixed-type and artificial-dominated recreational spaces are significantly higher than those of nature-dominated spaces. Nature-dominated and mixed-type spaces also show more pronounced landmark features and higher recognition. In terms of experiential perception, overall ratings for visual esthetics and comfort are high across all three types. Compared with the other two types, nature-dominated recreational spaces score higher on activity support and place meaning, indicating that they better accommodate diverse user needs and enhance space utilization efficiency. Regarding place identity, the degree of emotional connection established by users is similar across the three types, but nature-dominated recreational spaces have slightly higher scores in place meaning, reflecting stronger perceived spiritual connotations and spatial uniqueness.
Figure 6.
Indicator-layer scores.
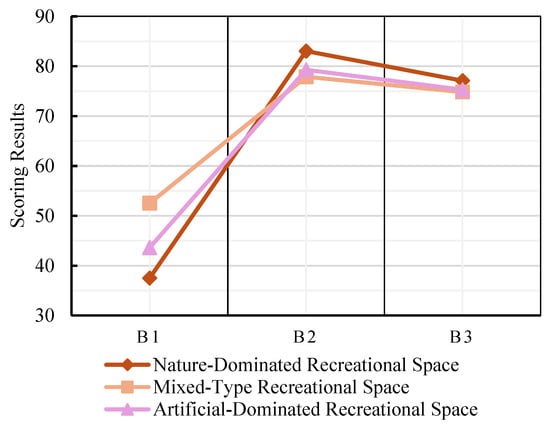
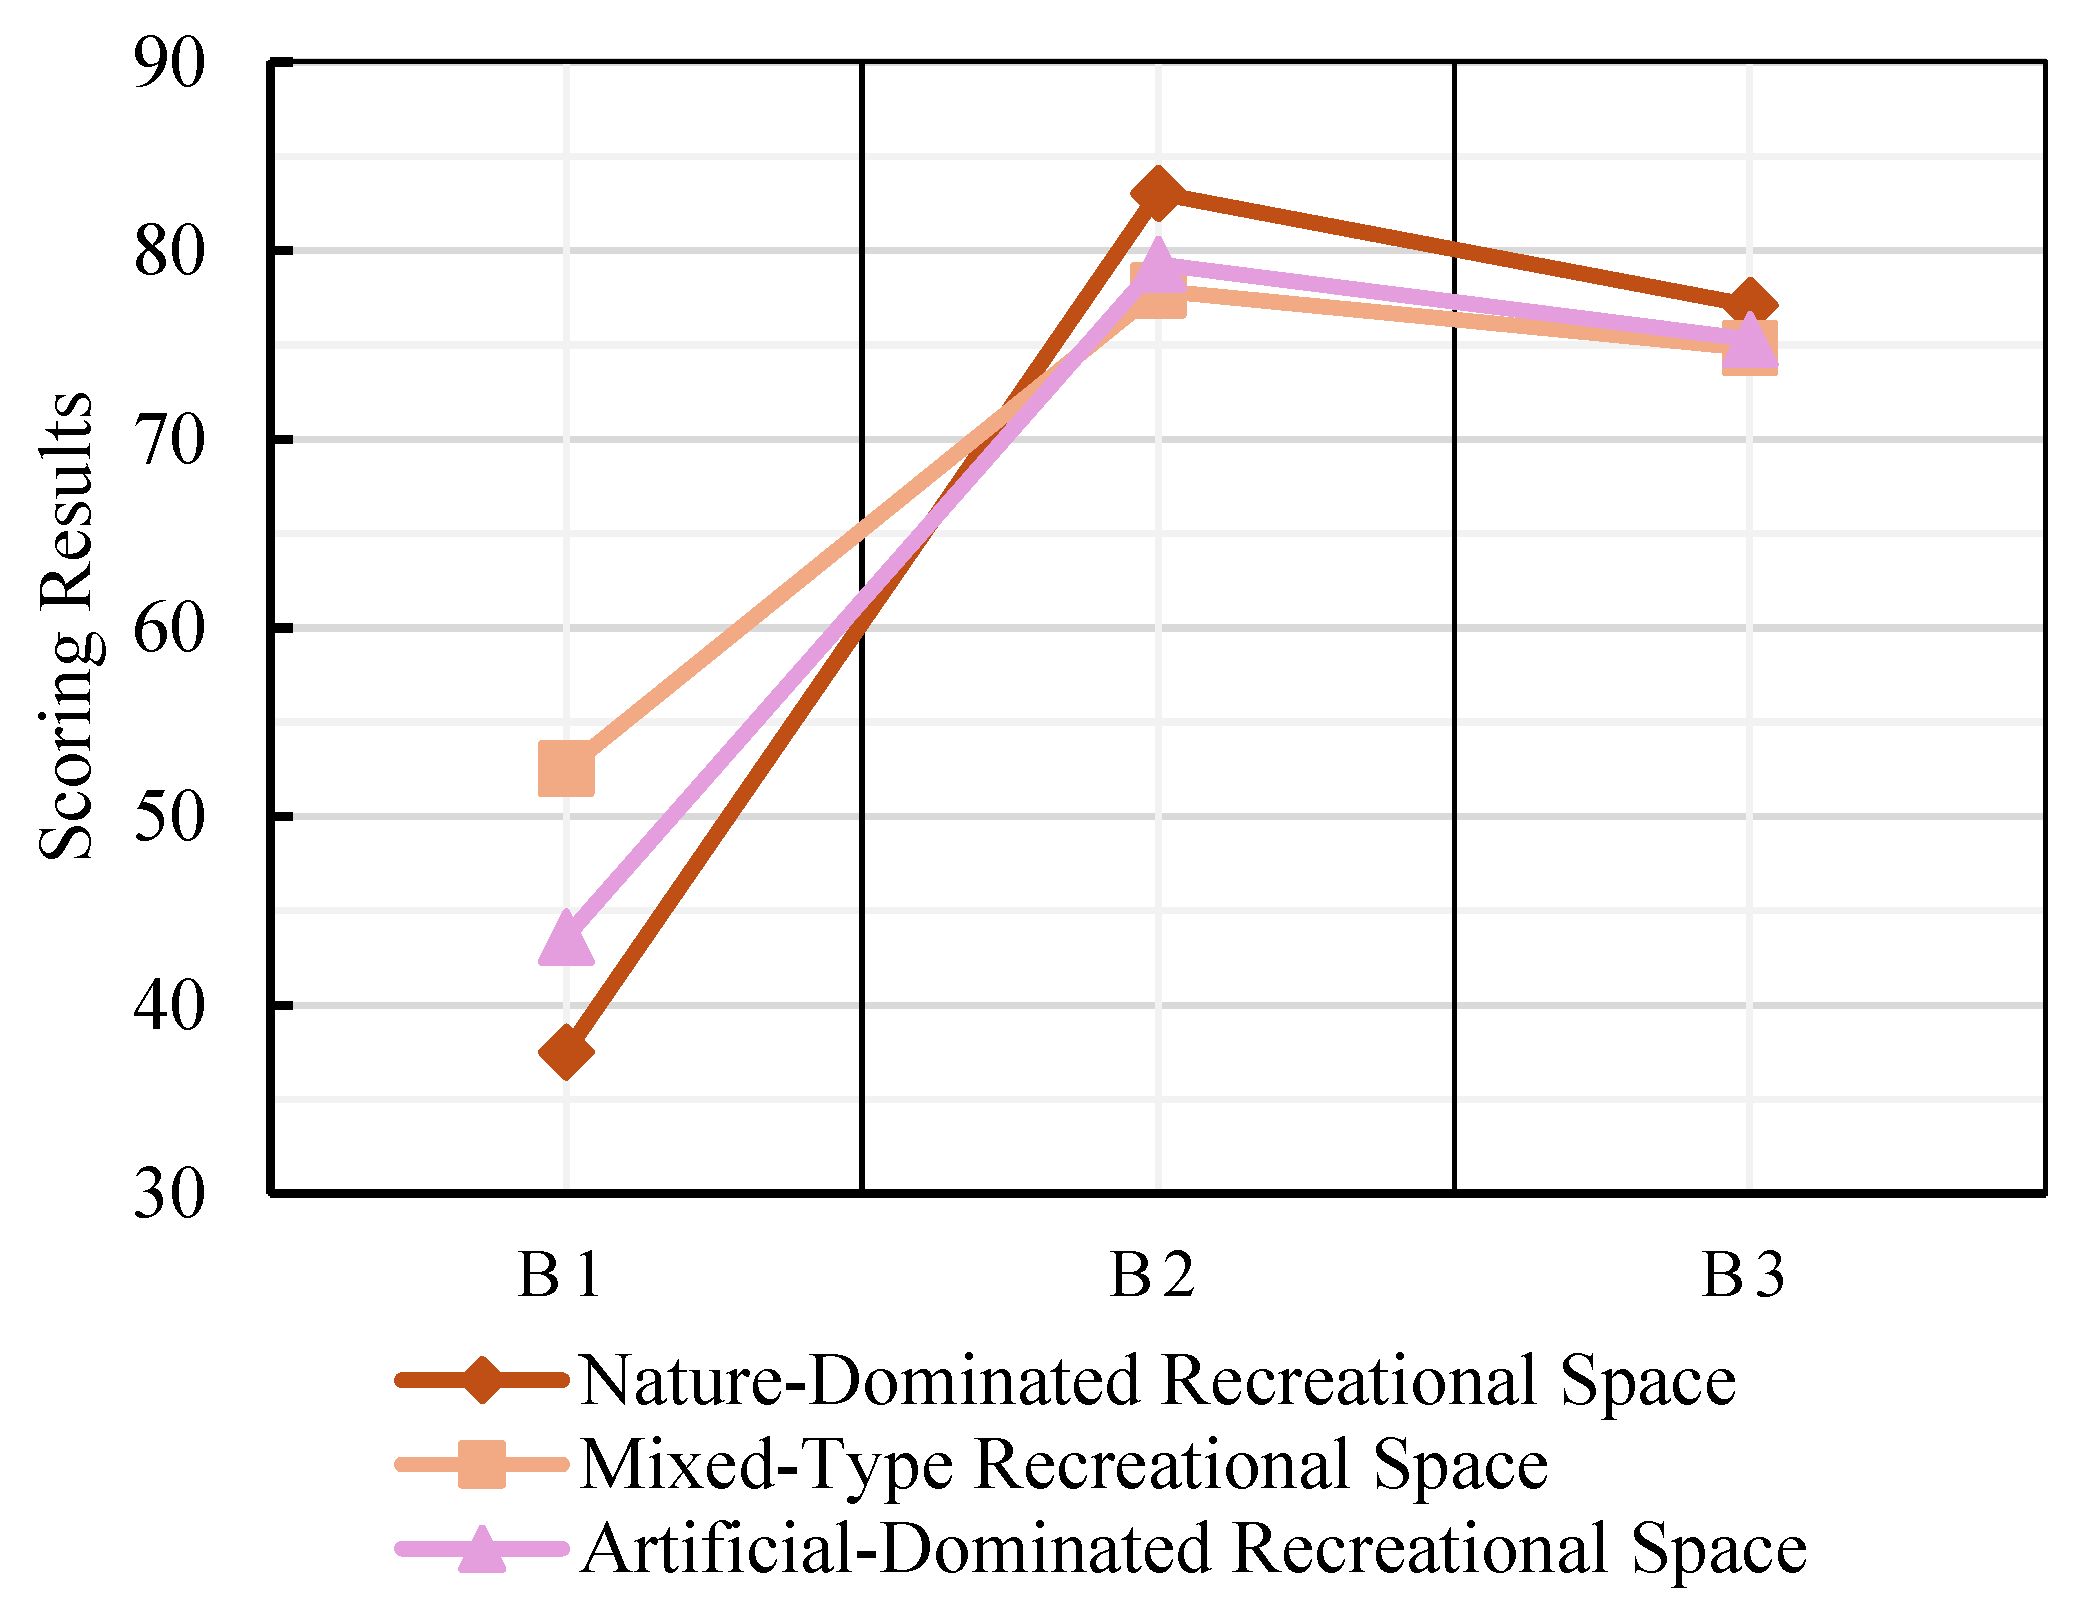
Overall (Figure 7), spatial attribute scores are much lower than those of experiential perception and place identity, with experiential perception consistently receiving the highest scores. Compared with the other two types, nature-dominated recreational spaces have the lowest spatial attribute scores but the highest experiential perception and place identity scores.
Figure 7.
Criteria-layer scores.
3.4. Identification of Key Factors
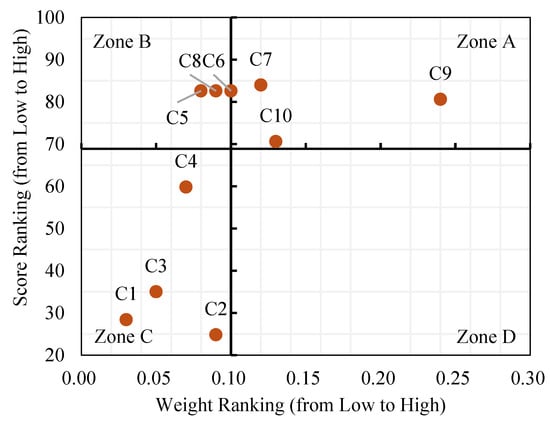
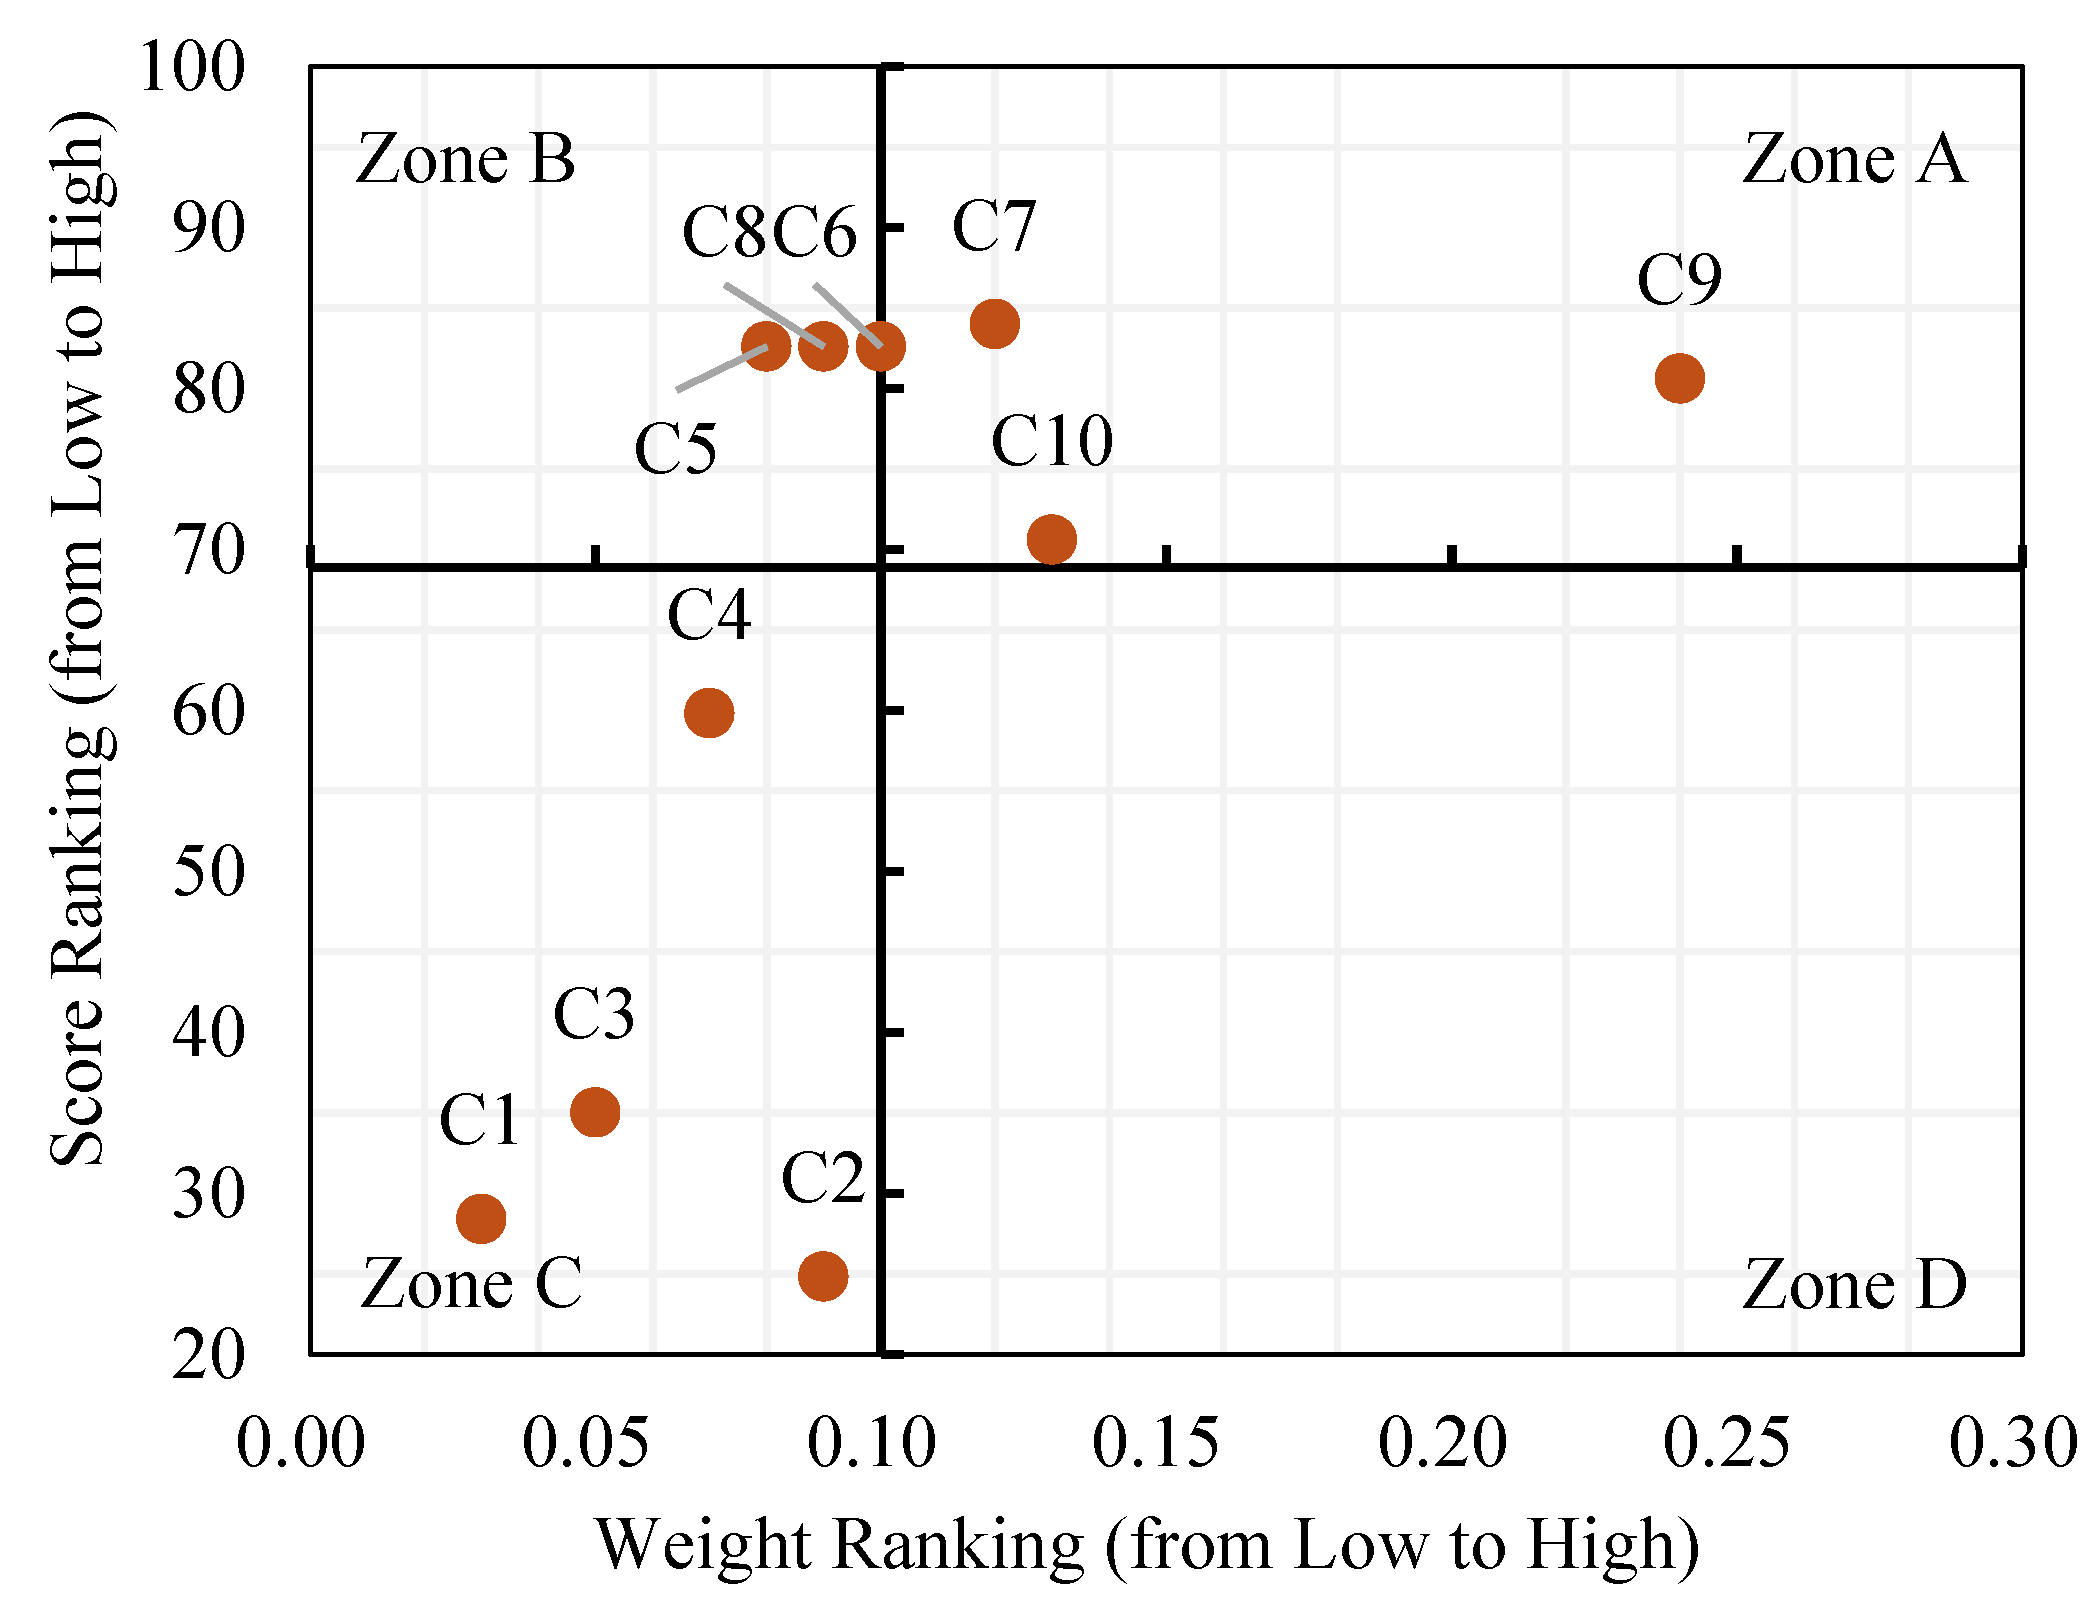
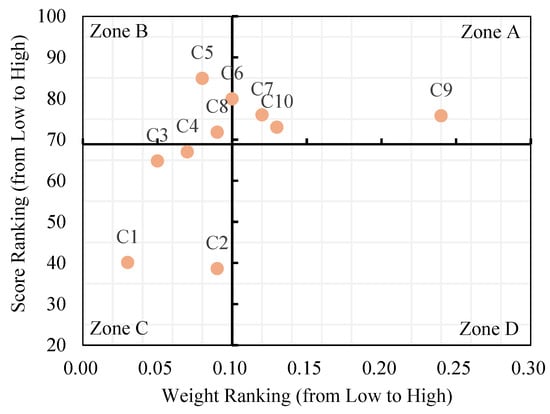
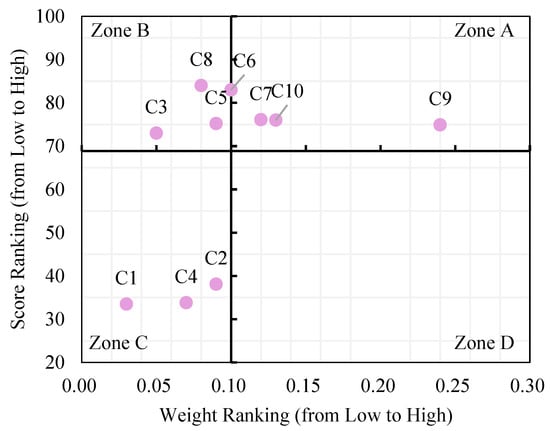
Importance-Performance Analysis (IPA) was applied to evaluate the factors influencing recreational space attractiveness. The horizontal axis represents indicator weight, reflecting factor importance, while the vertical axis represents indicator score, reflecting performance. Zone A denotes the advantage area (high weight, high score), Zone B the maintenance area (low weight, high score), Zone C the opportunity area (low weight, low score), and Zone D the improvement area (high weight, low score).
As shown in Figure 8, Figure 9 and Figure 10, factors in the maintenance area (Zone B) and advantage area (Zone A) are mostly from the experiential perception and place identity dimensions. Activity level (C7), place meaning (C9), and place attachment (C10) for all three types of recreational spaces fall within the advantage area (Zone A), indicating that industrial park recreational spaces perform strongly in experiential perception and place identity. These three factors constitute the core drivers of recreational space attractiveness. Moreover, no factors fall within the improvement area (Zone D) for any of the three types, suggesting that there are no significant shortcomings in environmental quality or place experience in the current recreational spaces.
Figure 8.
Weight–score analysis for nature-dominated recreational spaces.
Figure 9.
Weight–score analysis for mixed-type recreational spaces.
Figure 10.
Weight–score analysis for artificial-dominated recreational spaces.
3.5. Demand Analysis of Different Types of Recreational Spaces
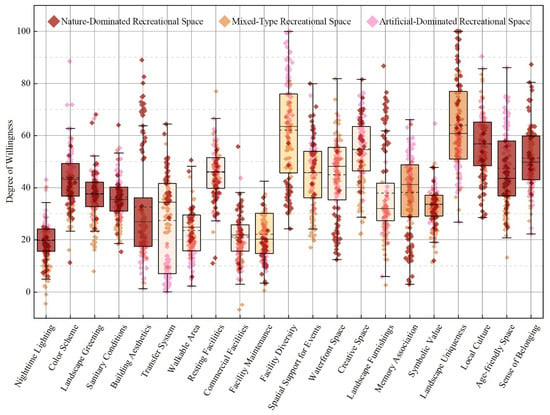
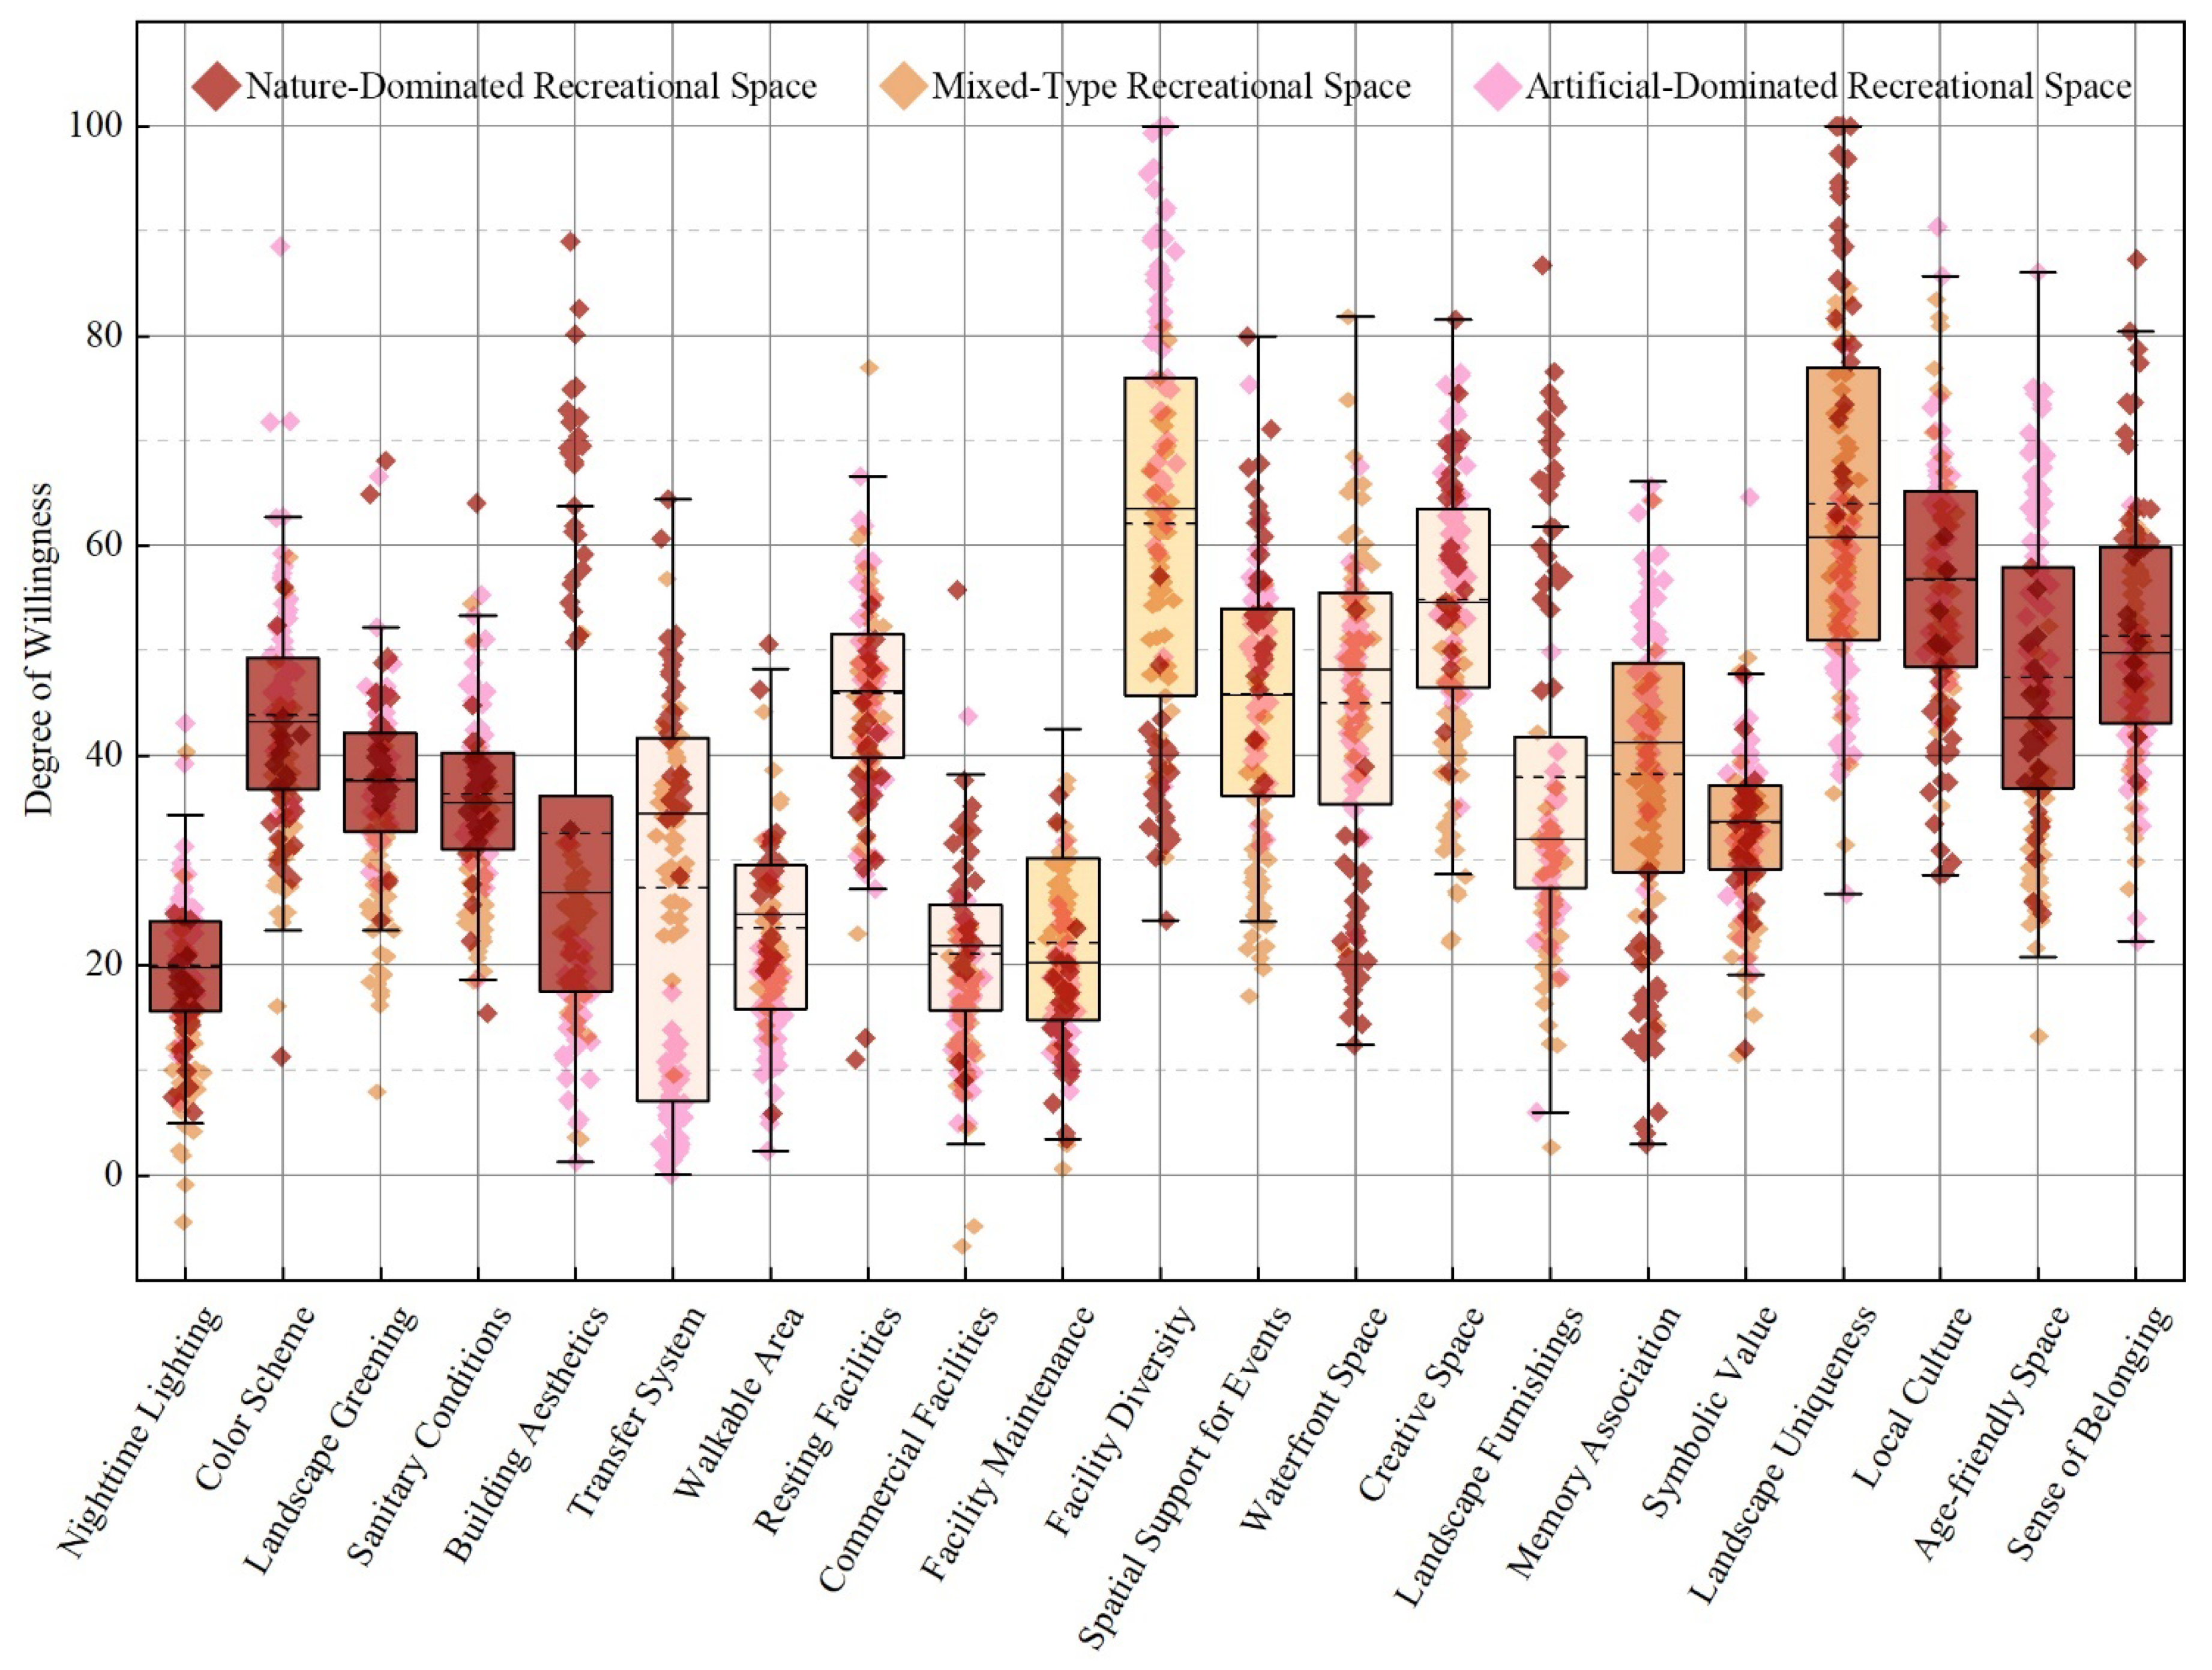
The demands of different types of recreational spaces vary. Visualization of respondents’ spatial needs (Figure 11), combined with field surveys and questionnaires, reveals the following patterns:
Figure 11.
Analysis of spatial demands.
Esthetic quality: Nature-dominated spaces show the highest demand for architectural image and landscape greening, indicating that the visual appeal of natural spaces primarily derives from ecological landscape quality. Mixed-type and artificial-dominated spaces show higher demand for color coordination and environmental hygiene, reflecting that spaces with greater artificial intervention lead users to focus more on landscape design and maintenance.
Comfort: Nature-dominated spaces exhibit prominent demand for walking paths and connection systems, indicating that accessibility and walking experience remain key factors affecting usage. Artificial-dominated spaces have the lowest demand in these aspects, suggesting their close integration with the urban road network and public transportation.
Activity support: Nature-dominated spaces have high demand for activity support and facility diversity, reflecting their role in accommodating a wide range of outdoor activities that require richer facilities and organized space. Mixed-type spaces show prominent demand for facility diversity and maintenance, indicating high usage intensity and sensitivity to facility quality. Artificial-dominated spaces show lower overall demand for activity facilities but higher demand for facility variety, highlighting insufficient infrastructure.
Interest: Nature-dominated spaces exhibit high demand for landscape features and creative spaces, suggesting the need for distinctive landscapes and interactive experiences to enhance engagement. Mixed-type spaces show strong demand for waterfront areas, creative spaces, and landscape features, reflecting their multifunctional and experiential diversity. Artificial-dominated spaces emphasize demand for waterfront and creative spaces, indicating a need to compensate for limited natural landscape through specialized facilities.
Place meaning: Nature-dominated spaces display very high demand for landscape uniqueness, confirming that natural scenery is the primary source of visual attraction.
Place attachment: Nature-dominated spaces show higher demand for all-age friendliness and sense of belonging, indicating stronger appeal to multi-generational users. Artificial-dominated spaces show the highest demand for local cultural elements, highlighting the need for cultural expression to foster place attachment.
4. Discussion
4.1. Determinants of Attractiveness in Industrial Park Recreational Spaces
The results show that spatial attractiveness in SIP is jointly shaped by spatial attributes, experiential perception, and place identity, with experiential perception having the greatest influence. This aligns with recent user-perception frameworks that emphasize subjective experience as a key determinant of public space quality [36]. However, in the context of industrial parks, users tend to assess recreational spaces less in terms of physical form alone and more in terms of whether these spaces can offer a brief psychological escape from work-oriented environments. This indicates that attractiveness mechanisms established for traditional urban parks cannot be directly applied to functionally mixed industrial settings without contextual adjustment. This context-specific insight advances prior research by highlighting how industrial park conditions moderate perceptual appraisal.
The results suggest that experiential perception—such as comfort and activity support—has a stronger influence on overall attractiveness than individual spatial indicators. This finding aligns with previous research indicating that experiential qualities frequently outweigh purely morphological attributes in shaping public space preference [56]. At the same time, spatial attributes such as accessibility remain fundamental prerequisites for space use, supporting existing studies that emphasize the role of physical structure in facilitating attraction and activity.
Although not the most dominant, place identity plays a stabilizing role in supporting long-term attachment and repeated use, consistent with findings that emotional bonds with place enhance continued engagement [57]. However, the formation of place identity within SIP recreational spaces appears more fragile than in contexts with established cultural narratives, underscoring the need for deliberate cultural and design strategies to cultivate shared meaning and identity. These differentiated effects indicate that attractiveness in industrial park environments emerges from the dynamic interaction among spatial structure, experiential perception, and identity formation rather than any single dimension in isolation.
These findings provide an analytical foundation for understanding the functional complementarity observed among different types of recreational spaces in SIP, and, through an integrated evaluation framework, allow for a more comprehensive multidimensional study of public spaces, offering context-specific insights into recreational space performance in mixed-use urban environments.
4.2. Functional Complementarity Among Recreational Space Types in SIP
The results reveal a clear pattern of functional complementarity among different types of recreational spaces in SIP. Nature-dominated spaces primarily support ecological experience and psychological restoration, mixed-type spaces facilitate diverse social and leisure activities, and artificial-dominated spaces are more suitable for short-term use and everyday social interaction.
For nature-dominated recreational spaces, higher scores in experiential perception—particularly in comfort and visual quality—indicate that users value these spaces mainly for their restorative and ecological qualities. This finding is consistent with studies showing that natural elements play an important role in stress reduction and emotional recovery [11,12,13,14]. In the context of SIP, however, these spaces are embedded within a production-oriented environment, which makes their restorative function especially salient. As a result, their attractiveness is not only linked to intrinsic natural qualities, but also to their ability to provide a clear experiential contrast to surrounding work-related settings.
Mixed-type recreational spaces exhibit the strongest functional complementarity, as they combine natural elements, cultural facilities, and commercial services. Users tend to rate mixed-type spaces highly when different functions are perceived as coherent, convenient, and supportive of a variety of activities, rather than merely being collocated. This suggests that functional complementarity in mixed spaces depends on coordinated spatial organization and activity support, which enable users of different ages and purposes to share the same environment without conflict [32].
In contrast, artificial-dominated recreational spaces show a higher dependence on spatial attributes such as accessibility, which is consistent with findings from studies in transit-oriented and high-density urban contexts [58]. These spaces are frequently used for brief breaks, social encounters, or transitional activities during daily routines. they provide convenient opportunities for short-duration use that align with the fast-paced rhythm of industrial park life.
Taken together, the findings indicate that functional complementarity among recreational space types in SIP arises from differentiated combinations of spatial attributes, experiential perception, and place identity. Each space type fulfills distinct user needs and usage patterns, and their combined presence contributes to a more complete and resilient recreational system. By demonstrating how different recreational spaces support complementary functions within an industrial park context, this study extends existing public space research and provides an empirical basis for understanding recreational space organization in functionally mixed urban environments.
4.3. Generalizable Evaluation Logic for Recreational Space Attractiveness in Industrial Parks
While the empirical analysis focuses on SIP, the findings offer broader insights into how recreational space attractiveness can be evaluated in industrial park contexts beyond a single case. By integrating spatial attributes, experiential perception, and place identity, this study contributes to the identification of common evaluative criteria that are applicable across functionally mixed and employment-oriented urban environments. Such an evaluative perspective is applicable to both Chinese and international industrial park contexts.
The SIP case confirms that spatial attributes—particularly accessibility—constitute fundamental preconditions for recreational space use. This finding is consistent with a wide range of international studies [24,25,26]. However, the SIP results further indicate that in industrial park settings, the role of spatial attributes is primarily enabling rather than determining. High-quality spatial configuration alone does not guarantee high attractiveness.
Across all types of recreational spaces in SIP, experiential perception emerges as the most influential determinant of overall attractiveness. This convergence suggests that experiential perception represents a broadly shared evaluative logic. In industrial park environments, experiential perception takes on additional significance due to work settings and time constraints.
Place identity plays a less immediate but stabilizing role in shaping recreational space attractiveness. The SIP case demonstrates that symbolic meaning, cultural expression, and users’ sense of belonging primarily influence long-term attachment and repeated use rather than short-term attractiveness. At the same time, the relatively fragile place identity observed in some SIP recreational spaces reflects a common challenge faced by newly developed industrial parks worldwide, where historical depth and cultural narratives are often limited [59]. This implies that place identity should be evaluated not only by existing symbolic features. It should also consider the capacity of spaces to support identity formation over time through repeated use, shared experiences, and social interaction.
5. Conclusions
This study focused on the SIP and systematically evaluated the attractiveness of three types of recreational spaces—nature-dominated, mixed-type, and artificial-dominated—based on a constructed three-dimensional evaluation framework integrating spatial attributes, experiential perception, and place identity.
5.1. Key Findings and Implications
The results indicate that the attractiveness of recreational spaces in industrial parks is jointly shaped by spatial attributes, experiential perception, and place identity, with experiential perception playing the primary role in overall attractiveness. Different types of spaces exhibit functional complementarity: nature-dominated spaces primarily provide restorative and ecological experiences, contributing to environmental sustainability; mixed-type spaces support diverse social and leisure activities, enhancing social cohesion and well-being; and artificial-dominated spaces cater to short-duration, high-frequency use, promoting functional sustainability. Although overall attractiveness scores are similar across space types, the underlying mechanisms and user needs differ substantially, highlighting the necessity of type-specific strategies in the development and management of industrial park recreational spaces.
From a practical perspective, nature-dominated spaces should maintain ecological quality while improving accessibility and experiential variety; mixed-type spaces should adopt integrated spatial layouts and provide diverse amenities to support multiple user groups; and artificial-dominated spaces should focus on functional convenience and subtle cultural expression to enhance engagement. Collectively, these findings provide a generalizable framework for planning and evaluating recreational spaces in other functionally mixed urban contexts, linking empirical insights to broader urban design and policy applications [32,36].
5.2. Limitations and Future Research
Despite its contributions, this study has several limitations that offer opportunities for future research. First, the questionnaire survey and AHP analysis provided a systematic means to capture user perceptions and to quantify subjective evaluations. Future studies could complement such subjective assessments with objective measurements, including sensor data, geospatial analysis, or big data approaches, to further validate and enrich the findings. Second, the current framework comprises three dimensions, but subsequent research could refine and expand the indicator hierarchy to reveal more nuanced spatial and social dynamics. Finally, while this study focused on SIP, the proposed framework may be applicable to other contexts. Future research should test the model in diverse industrial and mixed-use environments to assess its generalizability.
By explicitly acknowledging these limitations while emphasizing the scientific rationale and robustness of the current methodology, future research can further enhance the practical relevance, reliability, and applicability of recreational space evaluation in multifunctional urban environments.
Author Contributions
Conceptualization, C.H., L.Z. and Z.X.; Data curation, C.H., L.Z. and C.M.; Formal analysis, C.H. and L.Z.; Funding acquisition, L.Z. and Z.X.; Investigation, L.X., Z.C. and C.M.; Methodology, C.H. and Z.X.; Project administration, L.Z.; Resources, C.H., L.X. and Z.C.; Software, L.X., Z.C. and C.M.; Supervision, L.Z. and Z.X.; Validation, C.H., L.X., Z.C. and Z.X.; Visualization, C.H. and L.Z.; Writing—original draft, C.H. and L.Z.; Writing—review and editing, C.H. and L.Z. All authors have read and agreed to the published version of the manuscript.
Funding
This research was funded by the Planning and Construction Committee of Suzhou Industrial Park (AS13810524).
Institutional Review Board Statement
The study was conducted in accordance with the Declaration of Helsinki, and the protocol was approved by the Ethics Committee of Soochow University (Approval No. SUDA20251010H18) on 10 October 2025. All participants provided informed consent prior to participation.
Informed Consent Statement
Informed consent was obtained from all participants involved in this study. Participants were fully informed of the nature and purpose of the research, the procedures they would undergo, any potential risks or discomforts, and their right to withdraw from this study at any time without penalty. The confidentiality and anonymity of participants were ensured, and data were collected and stored in a manner that protects privacy.
Data Availability Statement
The original contributions presented in this study are included in the article. Further inquiries can be directed to the corresponding author.
Conflicts of Interest
The authors declare no conflicts of interest.
References
- Ding, X.; Zheng, F.; Lyu, G.; Feng, B. An exploration of the spatial and temporal factors influencing industrial park vitality using multi-source geospatial data. Sci. Rep. 2025, 15, 29584. [Google Scholar] [CrossRef] [Scilit]
- Yigitcanlar, T.; Lönnqvist, A. Benchmarking knowledge-based urban development performance: Results from the international comparison of Helsinki. Cities 2013, 31, 357–369. [Google Scholar] [CrossRef] [Scilit]
- Neuman, M. The compact city fallacy. J. Plan. Educ. Res. 2005, 25, 11–26. [Google Scholar] [CrossRef] [Scilit]
- Zhang, S.; Lan, T.; Wu, W. Exploring the influence and impact factors of park green spaces on urban functional spatial agglomeration: A case study of Hangzhou. Sustainability 2025, 17, 1734. [Google Scholar] [CrossRef] [Scilit]
- Russo, A. Urban green spaces and healthy living: A landscape architecture perspective. Urban Sci. 2024, 8, 213. [Google Scholar] [CrossRef] [Scilit]
- Li, R.; Liu, X.; Li, M. Spatial vitality assessment of urban post-industrial landscapes using multi-source data: A case study of Beijing Shougang Park. Land 2025, 14, 1859. [Google Scholar] [CrossRef] [Scilit]
- Wolch, J.R.; Byrne, J.; Newell, J.P. Urban green space, public health, and environmental justice: The challenge of making cities ‘just green enough’. Landsc. Urban Plan. 2014, 125, 234–244. [Google Scholar] [CrossRef] [Scilit]
- Liu, C.; Wang, T.Y.; Yuizono, T. Assessing the landscape visual quality of urban green spaces with multidimensional visual indicators. Urban For. Urban Green. 2025, 106, 128727. [Google Scholar] [CrossRef] [Scilit]
- Chen, J.; Duan, X.; Zhang, W.; Li, X.; Feng, H.; Zhou, R.; Zhu, R. A study on the perception evaluation of public spaces in urban historic waterfront areas based on AHP–cloud modelling: The case of the Xiaoqinhuai Riverside Area in Yangzhou. Land 2025, 14, 2402. [Google Scholar] [CrossRef] [Scilit]
- Wang, Z.; Sheng, K.; Li, D.; Man, T.; Zhang, X.; He, Y.; He, G. Cultural topography of publicness: Assessment of the publicness of public spaces in traditional settlements. PLoS ONE 2025, 20, e0332755. [Google Scholar] [CrossRef] [Scilit]
- Xu, T.; Nordin, N.A.; Aini, A.M. Urban green space and subjective well-being of older people: A systematic literature review. Int. J. Environ. Res. Public Health 2022, 19, 14227. [Google Scholar] [CrossRef] [Scilit]
- Zhao, Z.; He, Q.; Zhang, Y.; Liu, S.; Yang, Y. Assessing cross-cultural urban park emotional wellbeing impact in Shanghai and London. Sci. Rep. 2025, 15, 18892. [Google Scholar] [CrossRef] [Scilit] [PubMed]
- Maas, J.; Verheij, R.A.; Groenewegen, P.P.; de Vries, S.; Spreeuwenberg, P. Green space, urbanity, and health: How strong is the relation? J. Epidemiol. Community Health 2006, 60, 587–592. [Google Scholar] [CrossRef] [Scilit] [PubMed]
- Ulrich, R.S. View through a window may influence recovery from surgery. Science 1984, 224, 420–421. [Google Scholar] [CrossRef] [Scilit] [PubMed]
- Wan, C.; Shen, G.Q.; Choi, S. Underlying relationships between public urban green spaces and social cohesion: A systematic literature review. City Cult. Soc. 2021, 24, 100383. [Google Scholar] [CrossRef] [Scilit]
- Cardinali, M.; Beenackers, M.A.; Fleury-Bahi, G.; Bodénan, P.; Petrova, M.T.; van Timmeren, A.; Pottgiesser, U. Examining green space characteristics for social cohesion and mental health outcomes: A sensitivity analysis in four European cities. Urban For. Urban Green. 2024, 93, 128230. [Google Scholar] [CrossRef] [Scilit]
- Montgomery, J. Making a city: Urbanity, vitality and urban design. J. Urban Des. 1998, 3, 93–116. [Google Scholar] [CrossRef] [Scilit]
- Wu, G.; Yang, D.; Niu, X.; Mi, Z. The impact of park green space areas on urban vitality: A case study of 35 large and medium-sized cities in China. Land 2024, 13, 1560. [Google Scholar] [CrossRef] [Scilit]
- Mohamed, A.A.; Kronenberg, J. Users’ experiences of park accessibility and attractiveness based on online review analytics. Sci. Rep. 2025, 15, 4268. [Google Scholar] [CrossRef] [Scilit]
- Lai, Y.; Wang, P.; Wen, K. Exploring the impact of public spaces on social cohesion in resettlement communities from the perspective of experiential value: A case study of Fuzhou, China. Buildings 2024, 14, 3141. [Google Scholar] [CrossRef] [Scilit]
- Aelbrecht, P.; Stevens, Q. Conclusion: Emerging knowledge at the intersection of public space design and social cohesion. In Public Space Design and Social Cohesion; Aelbrecht, P., Stevens, Q., Eds.; Routledge: London, UK, 2019; pp. 317–347. [Google Scholar]
- Wang, Y.; Hou, X.; Wang, X.; Fan, W. Public perception of urban recreational spaces based on large vision–language models: A case study of Beijing’s Third Ring Area. Land 2025, 14, 2155. [Google Scholar] [CrossRef] [Scilit]
- Quintana, M.; Liu, F.; Torkko, J.; Gu, Y.; Liang, X.; Hou, Y.; Ito, K.; Zhu, Y.; Abdelrahman, M.; Toivonen, T.; et al. It is not always greener on the other side: Greenery perception across demographics and personalities in multiple cities. arXiv 2025, arXiv:2512.17186. [Google Scholar] [CrossRef] [Scilit]
- Liu, J.; Huang, Z.; Wu, X.; Hou, Q. Optimization of urban village public space vitality based on complex network. Sci. Rep. 2025, 15, 15392. [Google Scholar] [CrossRef] [Scilit] [PubMed]
- Li, L.; Wang, L. Insights into people’s perceptions towards urban public spaces through analysis of social media reviews: A case study of Shanghai. Buildings 2025, 15, 3033. [Google Scholar] [CrossRef] [Scilit]
- Handy, S.L. Understanding the link between urban form and nonwork travel behavior. J. Plan. Educ. Res. 1996, 15, 183–198. [Google Scholar] [CrossRef] [Scilit]
- Nasar, J.L. Urban design aesthetics: The evaluative qualities of building exteriors. Environ. Behav. 1994, 26, 377–401. [Google Scholar] [CrossRef] [Scilit]
- Samavati, S.; Desmet, P.M.; Ranjbar, E. Happy urban public spaces: A systematic review of the key factors affecting citizen happiness in public environments. Cities Health 2025, 9, 112–128. [Google Scholar] [CrossRef] [Scilit]
- Zahnow, R. Social infrastructure, social cohesion and subjective wellbeing. Wellbeing Space Soc. 2024, 7, 100210. [Google Scholar] [CrossRef] [Scilit]
- Wang, Y.; Peng, W.; Huang, Y.; Yang, T.; Du, X.; Wang, X.; Zhang, Z.; Zhu, L. Research on the design strategies of public outdoor spaces in government centers from a health perspective. Buildings 2024, 14, 1505. [Google Scholar] [CrossRef] [Scilit]
- Jacobs, J. The uses of city neighborhoods. In The Urban Sociology Reader; Jacobs, J., Ed.; Routledge: London, UK, 2012; pp. 50–57. [Google Scholar]
- Qi, J.; Mazumdar, S.; Vasconcelos, A.C. Understanding the relationship between urban public space and social cohesion: A systematic review. Int. J. Community Well-Being 2024, 7, 155–212. [Google Scholar] [CrossRef] [Scilit]
- Istrate, A.L.; Mitchell, A.; Russell, P.; Murphy, S. Comparative analyses of publicness in urban squares within a diversifying metropolis. Urban Des. Int. 2024, 1–19. [Google Scholar] [CrossRef] [Scilit]
- Sepe, M. Contemporary approaches to healthy and livable public spaces: Proximity, flexibility, and diversification. Urban Des. Int. 2025, 30, 115–129. [Google Scholar] [CrossRef] [Scilit]
- Su, C.; Wang, X.; Wang, Y.; Chen, Y.; Dai, F.; Chen, X. Mediating roles of cultural perception and place attachment in the landscape–wellbeing relationship: Insights from historical urban parks in Wuhan, China. Land 2025, 14, 1176. [Google Scholar] [CrossRef] [Scilit]
- Song, Y.; Fernandez, J.; Wang, T. Understanding perceived site qualities and experiences of urban public spaces: A case study of social media reviews in Bryant Park, New York City. Sustainability 2020, 12, 8036. [Google Scholar] [CrossRef] [Scilit]
- Wong, P.H.; Kourtit, K.; Nijkamp, P. A meta-analysis of neighbourhood interventions on subjective wellbeing and mental health. Appl. Res. Qual. Life 2025, 1–37. [Google Scholar] [CrossRef] [Scilit]
- Su, P.; Dang, N. Attraction categories and spatial characteristics in recreational belt around metropolis: Beijing case study. Geogr. Res. 2004, 23, 403–410. [Google Scholar]
- Bai, Z.; Zhang, S.; He, H.; Xu, M. Nature perception and positive emotions in urban forest parks enhance subjective well-being. Sci. Rep. 2025, 15, 31457. [Google Scholar] [CrossRef] [Scilit]
- Hua, J.; Ren, C.; Yin, S.; Chen, W.Y. Effects of urban greenspaces on public health and wellbeing: Serial mediation model of objective and subjective measures. Urban For. Urban Green. 2025, 106, 128753. [Google Scholar] [CrossRef] [Scilit]
- Joye, Y.; Bolderdijk, J.W. An exploratory study into the effects of extraordinary nature on emotions, mood, and prosociality. Front. Psychol. 2015, 5, 1577. [Google Scholar] [CrossRef] [Scilit]
- Wicks, C.; Barton, J.; Orbell, S.; Andrews, L. Psychological benefits of outdoor physical activity in natural versus urban environments: A systematic review and meta-analysis of experimental studies. Appl. Psychol. Health Well-Being 2022, 14, 1037–1061. [Google Scholar] [CrossRef] [Scilit]
- Beute, F.; Marselle, M.R.; Olszewska-Guizzo, A.; Andreucci, M.B.; Lammel, A.; Davies, Z.G.; de Vries, S. How do different types and characteristics of green space impact mental health? A scoping review. People Nat. 2023, 5, 1839–1876. [Google Scholar] [CrossRef] [Scilit]
- Cheng, Q. Research on improving urban park green space landscape quality based on public psychological perception: A comprehensive AHP-TOPSIS-POE evaluation of typical parks in Jinan City. Front. Psychol. 2025, 16, 1418477. [Google Scholar] [CrossRef] [Scilit] [PubMed]
- Mao, Z.; Wang, W.; Ren, Z.; Zhang, D.; He, X. Recreational attractiveness of urban parks and implications for their management: A case study in Changchun, China. Chin. Geogr. Sci. 2022, 32, 456–466. [Google Scholar] [CrossRef] [Scilit]
- Lynch, K. Reconsidering the image of the city. In Cities of the Mind: Images and Themes of the City in the Social Sciences; Rodwin, L., Hollister, R.M., Eds.; Plenum Press: New York, NY, USA, 1984; pp. 151–161. [Google Scholar]
- Hartig, T.; Korpela, K.; Evans, G.W.; Gärling, T. A measure of restorative quality in environments. Scand. Hous. Plan. Res. 1997, 14, 175–194. [Google Scholar] [CrossRef] [Scilit]
- Korpela, K.M.; Hartig, T.; Kaiser, F.G.; Fuhrer, U. Restorative experience and self-regulation in favorite places. Environ. Behav. 2001, 33, 572–589. [Google Scholar] [CrossRef] [Scilit]
- Martínez-Núñez, C.; Martínez-Prentice, R.; García-Navas, V. Land-use diversity predicts regional bird taxonomic and functional richness worldwide. Nat. Commun. 2023, 14, 1320. [Google Scholar] [CrossRef] [Scilit]
- Maghfira, Z.W.; Sutriadi, R.; Perdana, A.B. Assessing urban functional area delineation: POI data and KDE analysis in Pekanbaru. Comput. Urban Sci. 2025, 5, 33. [Google Scholar] [CrossRef] [Scilit]
- Gianfranco, F.; Mariangela, D.; Patrizia, S.; Edoardo, P.; Massimiliano, P. A GIS-supported methodology for the functional classification of road networks. Transp. Res. Procedia 2023, 69, 368–375. [Google Scholar] [CrossRef] [Scilit]
- Yuan, J.; Wang, H.; Fang, Y. Identification of critical links in urban road network based on GIS. Sustainability 2023, 15, 14841. [Google Scholar] [CrossRef] [Scilit]
- Li, J.; Fu, J.; Gao, J.; Zhou, R.; Wang, K.; Zhou, K. Effects of the spatial patterns of urban parks on public satisfaction: Evidence from Shanghai, China. Landsc. Ecol. 2023, 38, 1265–1277. [Google Scholar] [CrossRef] [Scilit]
- Torabi, Z.A.; Rezvani, M.R.; Hall, C.M.; Davani, P.; Bakhshaei, B. Place identity and environmental conservation in heritage tourism: Extending the theory of planned behavior to Iranian rural heritage villages. Tour. Hosp. 2025, 6, 150. [Google Scholar] [CrossRef] [Scilit]
- Mela, A.; Tousi, E.; Varelidis, G. Assessing urban public space quality: A short questionnaire approach. Urban Sci. 2025, 9, 56. [Google Scholar] [CrossRef] [Scilit]
- Wang, L.; Md Sani, N.; Wang, Y.; Xie, X.; Zhang, X.; Sun, D.; Zhang, Y. Subjective experience and perception of urban-inland blue spaces in urban parks and individual well-being: Evidence from Xi’an, China. Front. Public Health 2025, 13, 1621437. [Google Scholar] [CrossRef] [Scilit]
- Zeng, Y.; Wang, J. Green space and sense of place: A systematic review. Reg. Sci. Environ. Econ. 2025, 3, 1. [Google Scholar] [CrossRef] [Scilit]
- Carmona, M.; de Magalhães, C.; Hammond, L. Public Places—Urban Spaces: The Dimensions of Urban Design, 2nd ed.; Routledge: London, UK, 2018. [Google Scholar]
- Jiang, Z.; Qi, Z.; Chen, L.; Xu, L.; Wan, D.; Burak-Gajewski, P.; Zawisza, R.; Liu, L. External spatial morphology of creative industries parks in the industrial heritage category based on spatial syntax: Taking Tianjin as an example. Buildings 2024, 14, 559. [Google Scholar] [CrossRef] [Scilit]


Disclaimer/Publisher’s Note: The statements, opinions and data contained in all publications are solely those of the individual author(s) and contributor(s) and not of MDPI and/or the editor(s). MDPI and/or the editor(s) disclaim responsibility for any injury to people or property resulting from any ideas, methods, instructions or products referred to in the content. |
© 2026 by the authors. Licensee MDPI, Basel, Switzerland. This article is an open access article distributed under the terms and conditions of the Creative Commons Attribution (CC BY) license.