


Abstract
Large regulated rivers are increasingly affected by combined main-stem dam regulation and tributary disturbances, which reshape sediment connectivity and alter downstream sediment delivery. Existing studies have established that large reservoirs reduce sediment load, but how intensive main-stem regulation and tributary-scale human activities jointly reshape the runoff–sediment regime entering the Three Gorges Reservoir (TGR) remains insufficiently clarified. Based on monthly runoff and sediment data from 1957 to 2024 at major stations in the upper Yangtze River, this study examines the stage-wise alteration, main-stem–tributary contrast, intra-annual redistribution, and statistical explanatory factors of TGR inflow sediment. Results show that annual runoff changed weakly, whereas sediment load decreased significantly at all stations, with major breakpoints in 1998 and 2013 for the main stem and TGR inflow. After the lower Jinsha River cascade entered operation, main-stem sediment supply was strongly disrupted, and TGR inflow sediment decreased by 84.1% compared with the pre-1998 period. In contrast, tributaries with limited sediment-retention capacity retained strong episodic sediment-supply potential during wet years. Reservoir regulation altered the intra-annual delivery pattern, reducing flood-season runoff proportions and markedly weakening flood-season sediment load from Xiangjiaba. The statistical explanatory analysis indicates that reservoir capacity and the normalized difference vegetation index (NDVI) are strongly associated with the long-term sediment decline, whereas precipitation accounts for a larger share of the interannual variability. These findings suggest that the present TGR inflow boundary is no longer a simple reduced-sediment condition, but a reorganized regime controlled by main-stem sediment supply disruption and tributary residual sediment pulses. This study provides a scientific basis for sediment management and future assessments of cascade-reservoir joint operation.
1. Introduction
Large regulated rivers are increasingly affected by combined main-stem dam regulation, tributary-scale disturbances, and changing sediment-source conditions. Sediment continuity controls reservoir sustainability, channel adjustment, and downstream river health [1]. In large regulated basins, dams and cascade reservoirs disrupt sediment connectivity and reduce suspended sediment delivery at regional to global scales [2,3,4]. Similar declines occur in heavily regulated river systems, where altered flow regimes, sediment trapping, and changing source availability reshape downstream sediment fluxes [5,6,7]. Recent studies further indicate that dam operation and flood-event regulation can modify sediment delivery pathways and temporal variability [8,9]. These findings suggest that sediment reduction in regulated rivers should be interpreted not only as a decrease in total sediment load, but also as a reorganization of sediment connectivity, source–sink relationships, and delivery timing.
The upper Yangtze River (UYZR) is a typical large regulated river system in which main-stem cascade reservoirs and tributary-scale human activities jointly affect runoff–sediment processes. Within the UYZR, these responses exhibit pronounced spatial complexity. The main-stem Jinsha River (JSR) shows increasing runoff influenced by cryospheric melt [10], whereas major tributaries, including the Minjiang River (MJR), Tuojiang River (TJR), Jialing River (JLR), and Wujiang River (WJR), generally exhibit declining runoff patterns [11,12,13]. Such spatial differences in runoff variation may disrupt the balance between sediment supply and transport capacity [14,15]. Meanwhile, previous studies have shown that reservoir-cluster sediment trapping has drastically reduced sediment load across the UYZR by up to 96%, establishing reservoir operation as a dominant control on basin-scale runoff–sediment relationships [16].
The impoundment and operation of cascade reservoirs in the lower JSR around 2013 fundamentally altered the sediment inflow regime of the Three Gorges Reservoir (TGR, [17]). Unlike single reservoirs, large reservoir cascades progressively disconnect upstream sediment sources from downstream reaches through cumulative trapping and coordinated regulation [1,18,19]. This process alters not only total sediment load but also sediment delivery timing and the relative contributions of the main stem and tributaries. Previous basin-scale attribution studies have primarily emphasized long-term sediment reduction in the UYZR [20]. However, for river research and management, a more process-oriented issue is how the post-2013 cascade-reservoir system has reorganized the TGR inflow boundary.
Cascade reservoirs in the lower JSR intercept substantial sediment from the JSR, historically the dominant sediment source of the UYZR [13,21,22]. Recent studies further demonstrate that large dams in the UYZR have modified sediment and associated material fluxes, as well as suspended sediment characteristics [17,23,24]. These changes are particularly important because tributaries and flood events can become increasingly influential in sediment delivery after the main-stem sediment supply is strongly reduced [15,25]. By trapping sediment, the lower JSR cascade reservoirs shift the TGR inflow sediment contribution from the JSR main stem toward tributary-dominated residual inputs. Meanwhile, the runoff sources of these tributaries remain relatively stable. Consequently, the TGR inflow exhibits a spatial decoupling of runoff and sediment sources under cascade-reservoir regulation [26,27]. This shift implies that tributaries with weaker sediment-retention capacity, such as the TJR and Hengjiang River (HJR), may become important sediment sources during wet years [28]. Existing studies have predominantly focused on early impoundment stages or annual-scale sediment reduction, highlighting the need to directly link intra-annual sediment distribution, tributary sediment pulses, and flood-event responses to post-2013 cascade-reservoir operation.
This study uses hydrological and sediment records extending up to 2024 from major UYZR control stations to examine how combined main-stem regulation and tributary-scale human activities have reshaped the runoff–sediment regime entering the TGR. Rather than treating sediment decline as the sole response, this study focuses on the reorganization of the TGR inflow boundary under intensive human regulation. Specifically, this study aims to: (1) identify stage-wise alterations in runoff and sediment load across the main stem and major tributaries; (2) examine the contrast between the strongly regulated JSR main stem and tributaries with different sediment-retention capacities; (3) evaluate changes in the intra-annual distribution of runoff and sediment delivery to the TGR; and (4) use regression-based attribution as supporting statistical evidence to interpret the relative explanatory importance of reservoir regulation, vegetation recovery, and precipitation variation. By linking sediment-load changes to main-stem sediment-supply disruption, tributary residual sediment pulses, and intra-annual delivery reorganization, this study provides new insights into sediment connectivity and sediment management in large regulated river systems. From a sustainability perspective, maintaining sediment continuity while balancing flood control, hydropower generation, navigation, and ecological functions is essential for the long-term resilience of large regulated river systems such as the Yangtze River (YZR).
2. Study Area
The Yangtze River (YZR), one of the world’s largest rivers by runoff and sediment load, spans approximately 6300 km with a catchment area of 1.8 × 10⁶ km2. The YZR generates an average annual runoff of 878.2 × 10⁹ m3 and transports 134 × 106 t of sediment load. The reach from the source to Yichang is defined as the upper YZR (UYZR), extending for about 4500 km and draining a basin of approximately 1.0 × 10⁶ km2 [13]. The UYZR is fed by several major tributaries, including the Minjiang River (MJR), Tuojiang River (TJR), and Jialing River (JLR) on the left bank, and the Hengjiang River (HJR) and Wujiang River (WJR) on the right bank. These tributaries differ greatly in drainage area, lithology, rainfall regime, reservoir development, and sediment-supply capacity, making the UYZR a spatially heterogeneous sediment source area for the TGR (Figure 1).
Figure 1.
Distribution of major hydrological stations and large reservoirs in the upper Yangtze River basin. (The detailed information on the reservoirs in Figure 1 is provided in Supplementary Material Table S1; source: hydrological and reservoir data provided by the Bureau of Hydrology, Changjiang Water Resources Commission; map prepared by the authors). The black, purple, orange, light-blue, and green reservoir labels distinguish reservoirs in the Jinsha, Yalong, Minjiang, Jialing, and Wujiang river systems, respectively. Reservoir abbreviations are listed in Table S1; station abbreviations are defined in Table 1.
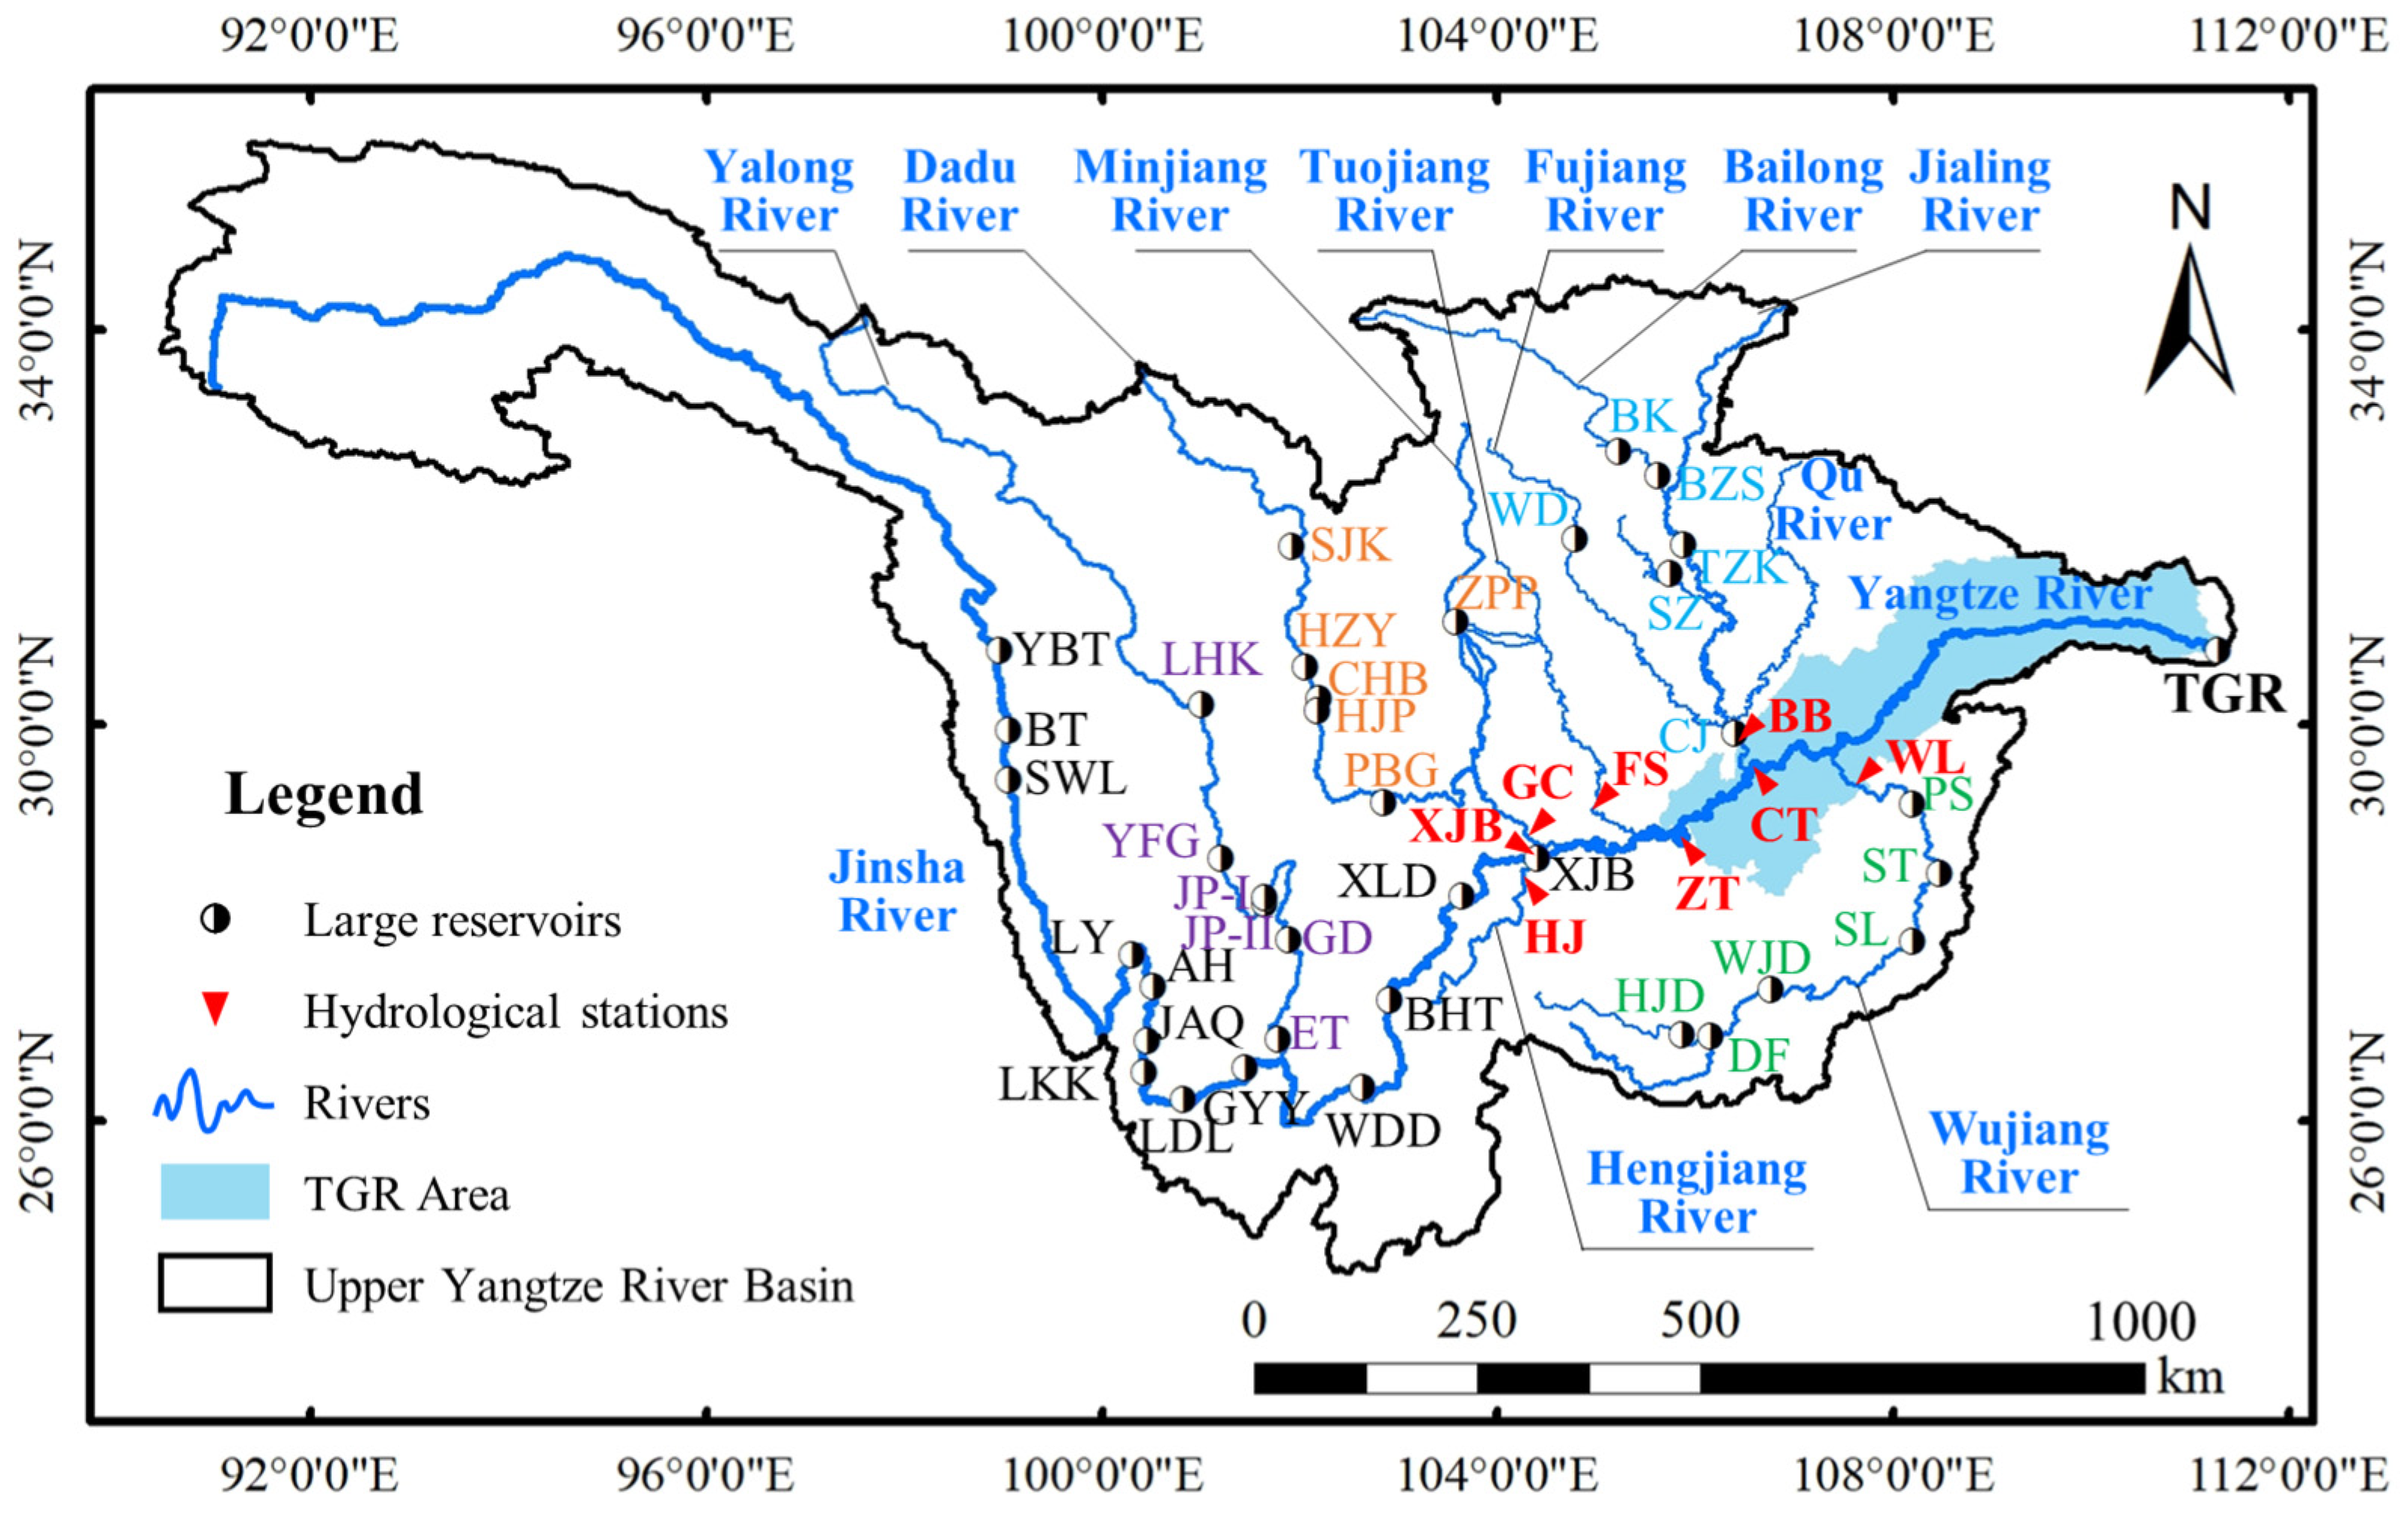
Table 1.
Basic information on major hydrological stations.
Owing to its large elevation drop and abundant hydropower resources, the UYZR has become one of the most intensively regulated river systems in China. However, this regulation is spatially uneven. The main-stem JSR contains over ten high-dam reservoirs with large storage capacities, forming a strongly regulated sediment-transfer corridor. By contrast, many tributary basins feature a mixture of large, medium, and small reservoirs, low-head hydropower stations, navigation structures, soil and water conservation engineering, and channel sand extraction. This distinct contrast between strong main-stem cascade regulation and heterogeneous tributary disturbances provides an ideal setting for examining the reshaping of the TGR inflow water–sediment regime.
Among these, the TGR stands as the largest water conservancy project in the world. As the key controlling project on the UYZR, the TGR serves multiple functions, including flood control, navigation, power generation, and water supply. As of December 2024, the TGR had cumulatively impounded over 220 × 109 m3 of floodwater and generated more than 1.7 × 10¹² kWh of electricity, contributing to a reduction in carbon emissions equivalent to 1.49 × 10⁹ t of CO2 [29].
3. Data and Methods
3.1. Data Sources
This study utilized a multi-source dataset comprising hydrological and sediment data, precipitation data, soil and water conservation measures, and reservoir capacity information. Continuous daily discharge and suspended sediment transport rate records from 1 January 1957 to 31 December 2024 were available for all major control stations (XJB, HJ, GC, FS, BB, WL, ZT, and CT; Table 1) and were obtained from the Bureau of Hydrology, Changjiang Water Resources Commission. No missing daily records occurred during the study period. Daily runoff volume was calculated by multiplying the daily mean discharge by 86,400 s, and daily suspended sediment load was calculated by multiplying the daily mean sediment transport rate by the same time interval. Monthly runoff and suspended sediment load were obtained by summing the corresponding daily values, and annual totals were subsequently obtained by summing the monthly values. No interpolation was required because the daily series used in this study were complete. These stations represent the major control sections of the JSR, HJR, MJR, TJR, JLR, WJR, and the main stem upstream of the TGR. Monthly precipitation data for meteorological stations in the UYZR were obtained from the Resource and Environmental Science Data Platform (www.resdc.cn). Data regarding soil and water conservation measures in the UYZR tributaries were sourced from the Yangtze River Basin Soil and Water Conservation Bulletin. The Normalized Difference Vegetation Index (NDVI) dataset, with a temporal resolution of 15 days and a spatial resolution of 8 km, was retrieved and preprocessed using the Google Earth Engine (GEE) cloud-computing platform (Google LLC, Mountain View, CA, USA), accessed through its web-based Code Editor. Additionally, aggregated sand-mining statistics for several representative stages of the XJB–CT reach were collected.
3.2. Methods
- (1)
- Trend Analysis
The nonparametric Mann–Kendall (M–K) test is widely used to detect monotonic trends in hydrometeorological time series [30,31]. Given observations xt (t = 1, 2, …, n), the M–K statistic S is defined as:
where n is the sequence length; sgn(x) is the sign function:
Repeated observations were treated as ties and explicitly accounted for in the standard deviation, which was calculated using Equation (3):
where g is the number of tied groups and tp is the number of observations in the pth tied group. For n > 10, the standardized statistic Z for the M–K test is:
The standardized statistic Z follows a standard normal distribution. A positive (negative) Z indicates an increasing (decreasing) monotonic trend. When |Z| ≥ 1.96, the confidence level for the trend change exceeds 95%.
Because serial correlation can affect the variance of the M–K statistic, serial dependence was diagnosed after detrending each series using Sen’s slope. The lag-1 autocorrelation coefficient of the detrended rank series was compared with the approximate 95% confidence limits of ±1.96/√n. For series exhibiting significant serial correlation, the Hamed–Rao modified Mann–Kendall test was applied to adjust the variance of the M–K statistic using the significant autocorrelation coefficients of the detrended ranks [32]. For series without significant serial correlation, the conventional tie-corrected M–K test was retained.
The magnitude of each monotonic trend was further quantified using Sen’s slope [33]:
where β represents the median annual rate of change. The corresponding 95% confidence interval was estimated from the ordered pairwise slopes.
- (2)
- Abrupt Change Detection
Cumulative anomaly analysis was used to screen candidate abrupt changes in the water and sediment series [13,34]. For X = xt (t = 1, 2, …, n), the cumulative anomaly value at time i is denoted as Mi.
where represents the mean value of sequence X.
Cumulative anomaly analysis was applied to the annual runoff and sediment-load series at each station. Changes in the slope of the cumulative-anomaly curve indicate departures from the long-term mean, and local slope reversals or pronounced bends were used to screen candidate breakpoints. The final stage boundaries were determined by jointly considering the statistical indications and the timing of major engineering interventions.
The statistical significance of the candidate breakpoints was subsequently evaluated by two-phase segmented linear regression [35,36,37]. For each candidate breakpoint, the series was fitted with separate linear trends on either side of the breakpoint, and the significance of the trend change was assessed with an F-test comparing this full model with a reduced model in which the two slopes are constrained to be equal. A breakpoint was regarded as statistically supported when p < 0.05, and the fitted segment slopes were reported as the stage-wise trends. For series containing two breakpoints, each breakpoint was tested sequentially within the corresponding subinterval to avoid interference from the other structural transition. Under the null hypothesis of equal slopes, the test statistic follows an F distribution with 1 and n − 4 degrees of freedom. The magnitude of the trend change was quantified as Δb = b2 − b1, where b1 and b2 denote the fitted slopes of the two segments, and its 95% confidence interval was estimated from the regression standard error. The sensitivity of the stage-wise results to the selected engineering-stage boundaries was evaluated by shifting both boundaries by ±1 year and recalculating the stage-wise sediment changes.
- (3)
- Periodicity Testing
Wavelet analysis provides time–frequency localization and is highly suitable for detecting nonstationary periodicities in hydrological series. The Morlet wavelet is commonly applied for this purpose [38].
For a series x(t), the continuous wavelet transform is expressed as:
where a represents the scale inversely proportional to frequency, b denotes the time translation, ψ(⋅) is the Morlet mother wavelet, and (⋅)∗ denotes complex conjugation. The wavelet transform coefficient Wf (a, b) characterizes the periodic signal intensity at scale a and time b. A positive Wf (a, b) signifies a positive phase of the sequence, whereas a negative value indicates a negative phase. Furthermore, the magnitude of the periodic fluctuation is proportional to the absolute value of Wf (a, b). To integrate the scale-dependent energy distribution over time, the wavelet variance is defined as:
where the wavelet variance Var (a) quantifies the intensity of periodic variation at a specific scale a. The scale corresponding to the peak value of the wavelet variance identifies the primary period of the sequence.
- (4)
- Multiple Regression
Multiple regression-based attribution has been widely used to quantify the relative effects of climatic and anthropogenic drivers on runoff and sediment variations in river basins [39,40]. In this study, multiple linear regression was used to evaluate the statistical associations between the annual TGR inflow sediment load and three candidate drivers: basin precipitation, vegetation conditions, and upstream reservoir regulation. The analysis covered 1982–2024, the period over which all variables were simultaneously available. The annual sediment load was log-transformed as ln(SL + 1) to reduce skewness and mitigate the influence of extreme values. The annual attribution model is expressed as:
where SL is annual sediment load, βi denotes the coefficient of each independent variable, Zi is a standardized independent variable, and ε is the residual term.
Three predictors were considered. Annual precipitation is the basin-mean precipitation over the UYZR (mm), calculated from meteorological stations using control-area-weighted averaging. NDVI is the annual spatial mean NDVI over the UYZR. Cumulative reservoir capacity is the total storage capacity of the reservoirs upstream of the TGR (109 m3), excluding the storage of the TGR itself. All predictors were standardized prior to regression to ensure coefficient comparability across variables with different units and magnitudes, and multicollinearity was assessed using the variance inflation factor (VIF) [41].
The relative explanatory importance of the predictors was quantified using the LMG (Shapley value) decomposition of the model R2. For each predictor, the incremental R2 was computed for every possible ordering in which the predictors could enter the regression and then averaged over orderings. The relative explanatory share of predictor j was obtained as:
where Ij denotes the mean incremental R2 attributable to predictor j; Cj denotes the relative explanatory share attributable to predictor j, and p is the total number of predictors. Because the Ij values sum to the model R2, the resulting percentages represent relative statistical explanatory importance within the fitted model. The attribution is therefore interpreted as integrated statistical evidence rather than a strict causal partitioning.
Model assumptions and robustness were further evaluated using a series of diagnostic procedures. Residual serial dependence was assessed using the Durbin–Watson statistic and the Ljung–Box test, and heteroscedasticity was examined using the Breusch–Pagan and White tests. Because heteroscedasticity was detected, HC3 heteroscedasticity-robust standard errors and 95% confidence intervals were reported for the baseline regression coefficients. Influential observations were screened using Cook’s distance with 4/n as the diagnostic threshold, and the robustness of the fitted relationships was examined by refitting the model after individually removing the influential observations. Temporal generalizability was further evaluated using leave-period-out validation based on four contiguous engineering-related periods (1982–1990, 1991–2002, 2003–2012, and 2013–2024), with each period withheld in turn and predictor standardization estimated from the corresponding training data only.
Because cumulative reservoir capacity and NDVI exhibit pronounced long-term trends, the robustness of the results was further examined under alternative temporal specifications. Residual autocorrelation in the level model was assessed using the Durbin–Watson statistic and the Ljung–Box test, and an additional regression with AR(1) errors was fitted. The analysis was then repeated after linear detrending and after first differencing, both with AR(1) errors. The signs, statistical significance, and relative explanatory importance of the predictors were compared across these specifications.
The analysis was conducted at an annual integrated scale without imposing a process-specific lag structure. The regression is therefore interpreted as an annual-scale statistical explanatory analysis rather than a process-based representation of lagged sediment responses.
- (5)
- Calculation of TGR Inflow Runoff and Sediment Load
The long-term runoff and suspended sediment inflow to the TGR were calculated from major control stations located at the principal upstream inflow boundaries of the TGR: ZT on the YZR, BB on the JLR, and WL on the WJR. For any annual or seasonal period t, the TGR inflow runoff and sediment load were calculated as:
where Rinflow,t and Winflow,t denote the runoff and suspended sediment load entering the TGR during period t, respectively. ZT represents the main-stem inflow upstream of the JLR and WJR confluences, whereas BB and WL represent the additional inflows from the JLR and WJR, respectively.
4. Results
4.1. Interannual Variations and Spatial Differences in Runoff and Sediment
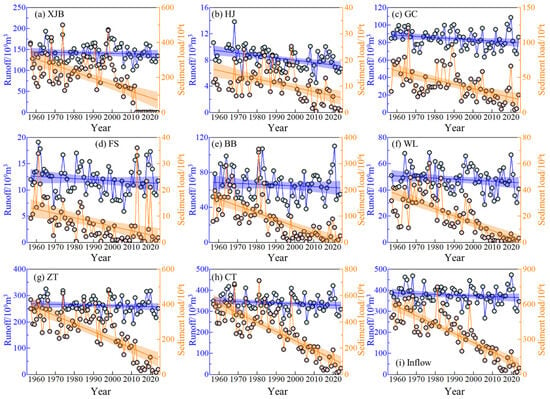
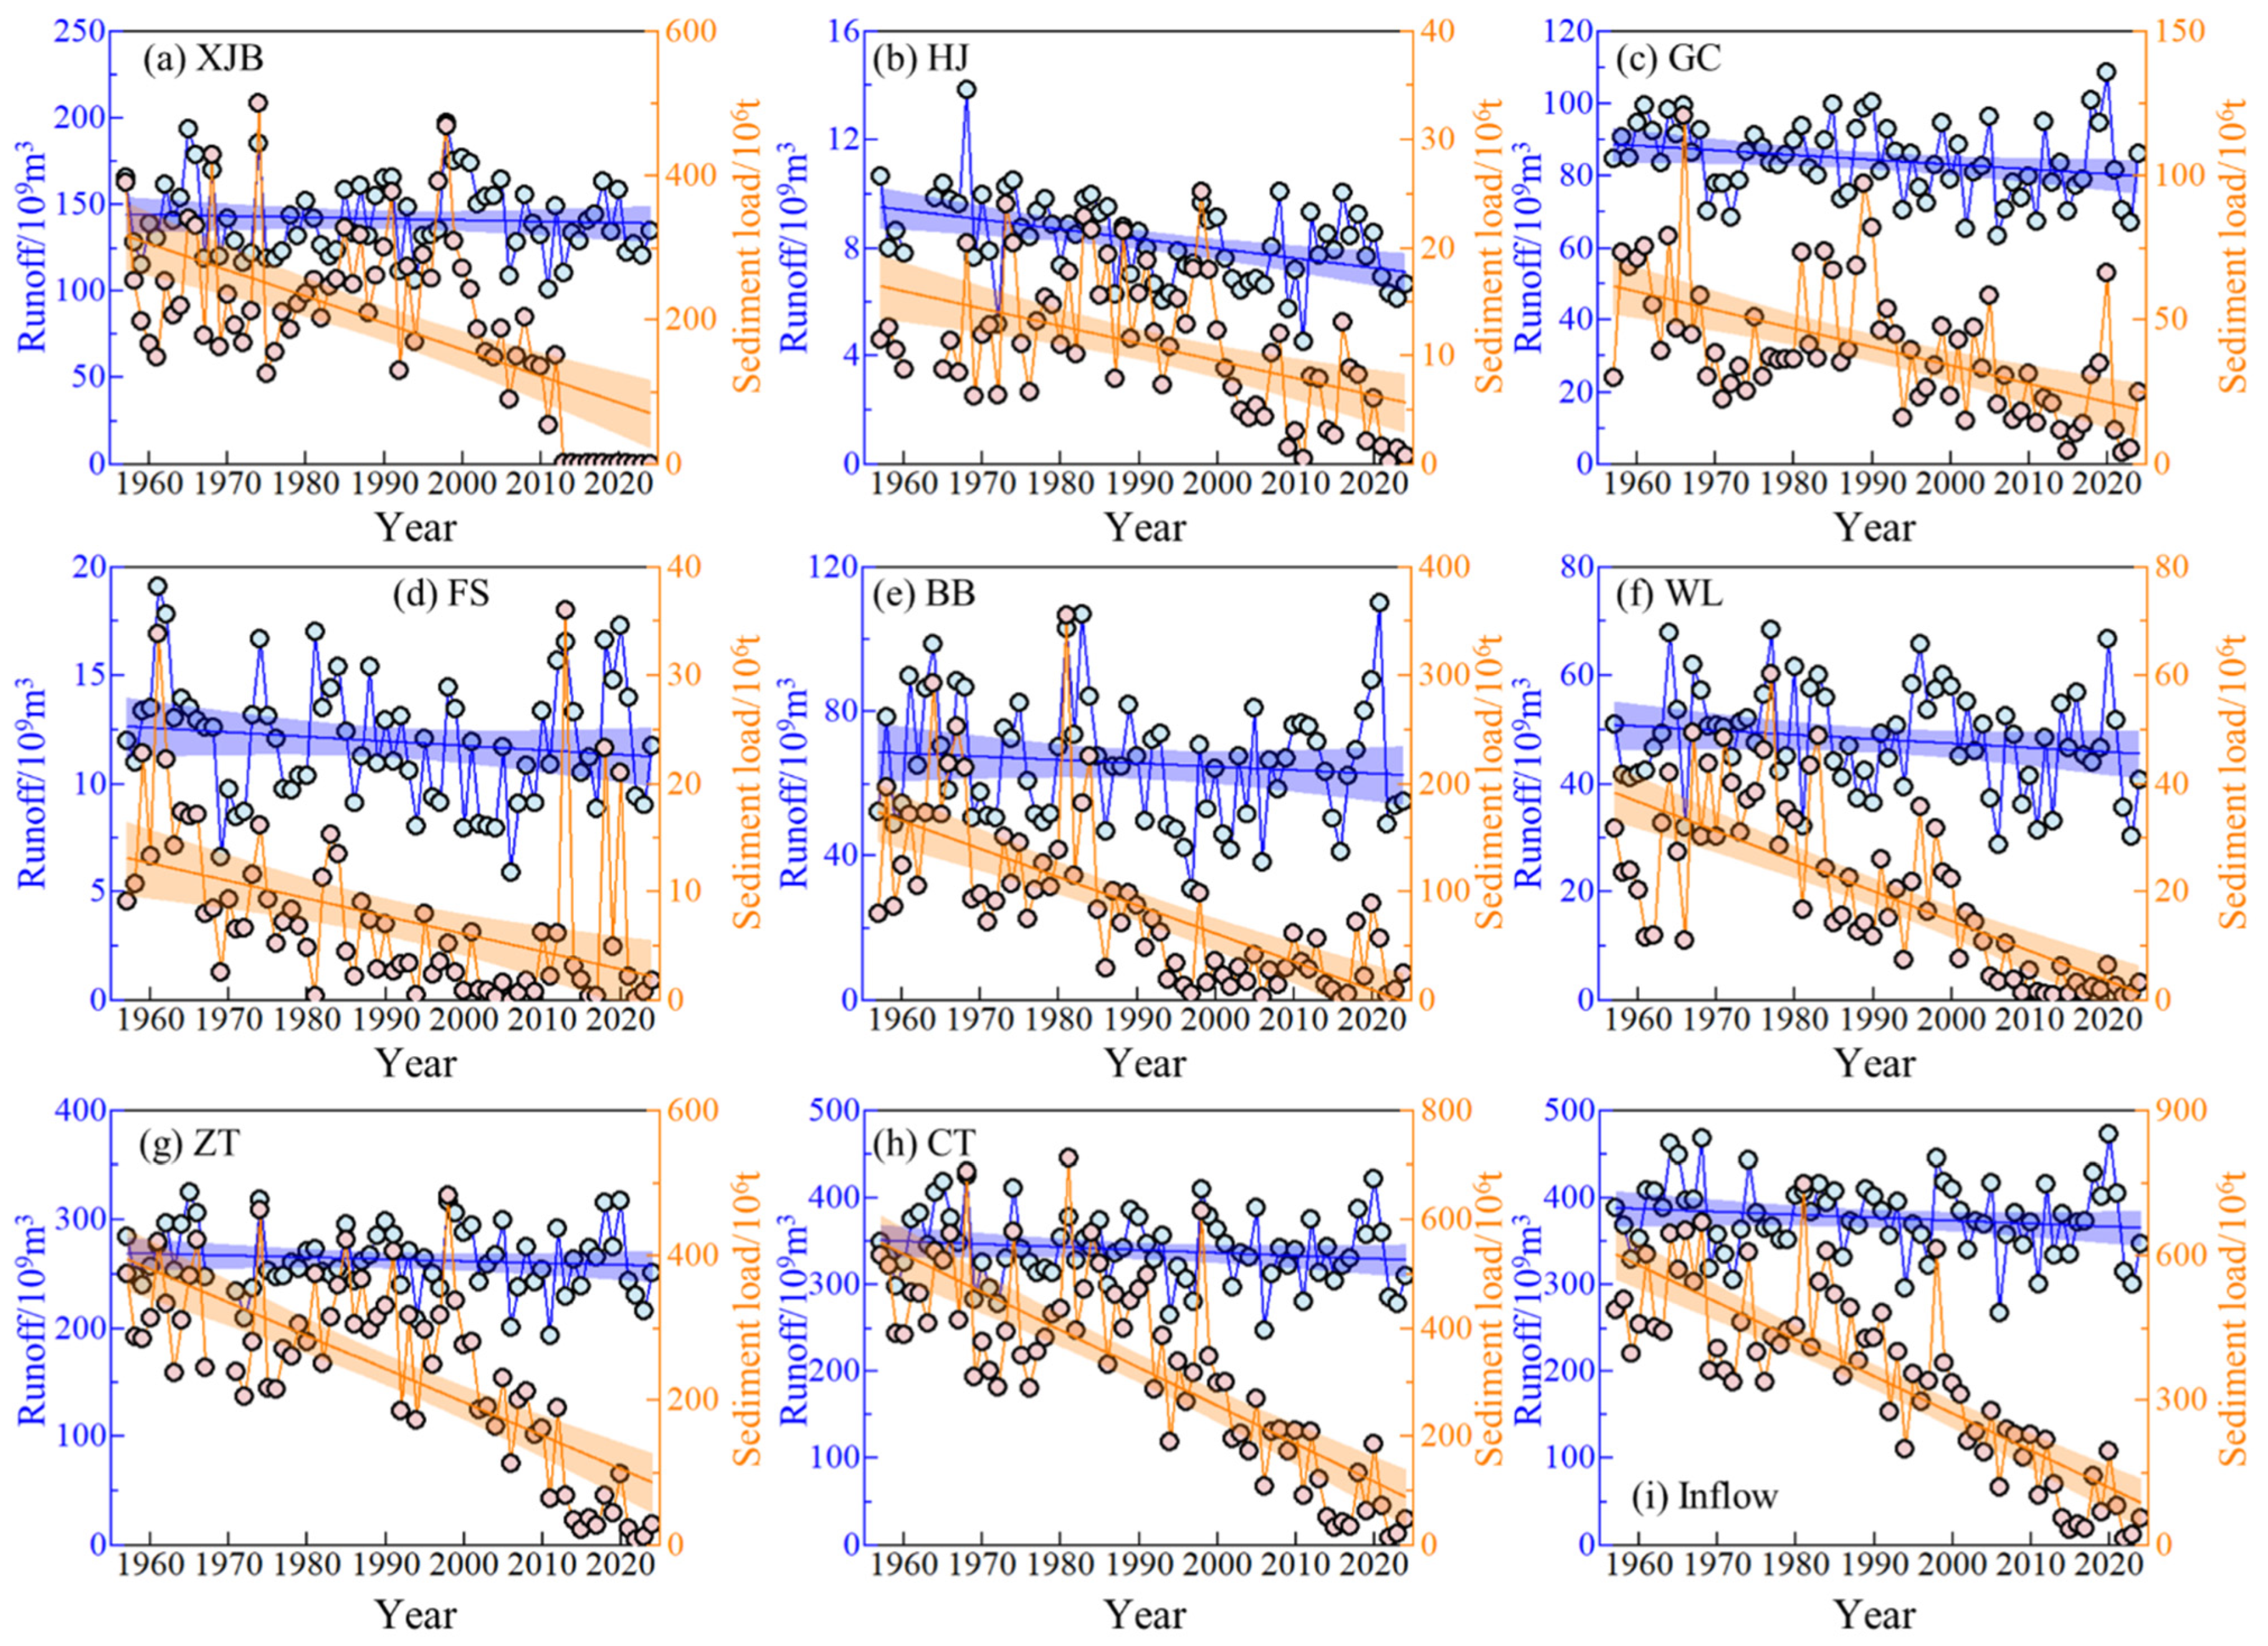
Figure 2 illustrates the interannual variations in runoff and sediment load at major control stations within the UYZR. The statistical significance of these trends was assessed using the Mann–Kendall test, with detailed results presented in Table 2 and Supplementary Table S3. Annual runoff exhibited comparatively weak long-term trends at most stations. Significant decreasing trends were detected at HJ and GC, whereas the remaining stations showed no statistically significant monotonic runoff trend. In contrast, annual sediment load decreased significantly at all stations after accounting for ties and serial correlation (p < 0.05). This contrast indicates that the present water–sediment regime is not primarily controlled by runoff reduction, but rather by altered sediment availability, sediment trapping, and transfer-pathway disruption under intensive regulation [20,42].
Figure 2.
Temporal variations in annual runoff and sediment load. Panels (a–i) correspond to XJB, HJ, GC, FS, BB, WL, ZT, CT, and the inflow to the TGR, respectively. Light-blue circles and blue connecting lines show annual runoff (left axis), while pink circles and orange connecting lines show annual sediment load (right axis). The straight blue and orange lines show the corresponding fitted linear trends. The blue and orange shaded bands represent the 95% confidence intervals of the corresponding fitted linear trends.
Table 2.
Results of the trend and abrupt change analyses in annual runoff and sediment load.
These stations exhibited distinct temporal patterns of sediment variation. XJB experienced periodic oscillations prior to 2000, followed by a rapid decline after the lower JSR cascade began operation in 2013. ZT and CT displayed consistent main-stem declines, reflecting the downstream propagation of reduced sediment supply. Tributary stations showed more heterogeneous responses: HJ and WL declined continuously, whereas BB decreased markedly after 1990 but experienced a wet-year reversal in 2018 and 2020. Additionally, episodic high-magnitude sediment transport events occurred at GC in 2020 and at FS in 2013, 2018, and 2020. These differences indicate that the TGR inflow regime integrates both main-stem sediment disconnection and tributary event-scale supply.
The TGR inflow series used throughout this study was calculated as the sum of runoff and suspended sediment load measured at ZT, BB, and WL, following the equations given in Section 3.2 (Figure 2). The TGR inflow runoff showed only a slight overall decrease amid multi-year oscillations, whereas the TGR inflow sediment load decreased substantially after 1998, generally remaining below 300 × 106 t. Post-2013, the sediment load reached the 1998–2012 average level only during the wet years of 2018 and 2020, remaining below 100 × 106 t in most other years. This behavior suggests that post-2013 sediment delivery to the TGR has become increasingly dependent on wet-year and tributary pulses rather than on continuous main-stem supply.
4.2. Abrupt Changes and Stage-Wise Variations in Sediment Load
Cumulative anomaly analysis identified distinct candidate change points in the annual sediment-load series. For XJB, ZT, CT, and the TGR inflow, the common breakpoints in 1998 and 2013 were further validated using two-phase segmented linear regression, and significant changes in sediment-load trends were detected at both breakpoints (p < 0.05 for all four series). For the TGR inflow, the fitted trend changed from −4.07 × 10⁶ t·yr−1 before 1998 to −19.65 × 10⁶ t·yr−1 during 1998–2012, and then to −2.06 × 10⁶ t·yr−1 after 2013; the corresponding slope changes were −15.58 × 10⁶ t·yr−1 at 1998 (95% CI: −28.19 to −2.97 × 10⁶ t·yr−1; F(1,52) = 6.15, p = 0.0164) and +17.59 × 10⁶ t yr−1 at 2013 (95% CI: 1.31 to 33.88 × 10⁶ t·yr−1; F(1,23) = 5.00, p = 0.0354). The 1998 transition therefore represents an acceleration of the sediment decline, whereas the post-2013 period is characterized by persistently low sediment delivery following the sharp reduction associated with intensified cascade-reservoir regulation. Shifting the engineering-stage boundaries by ±1 year resulted in first-to-final-stage sediment-load reductions of 81.6–85.3% for the TGR inflow, compared with 84.1% under the adopted 1998/2013 boundaries, indicating that the principal stage-wise decline was insensitive to small shifts in the boundary years.
The corresponding candidate change years for the tributary stations were 2000 for HJ, 2006 for GC, 1985 and 2013 for FS, 1985 and 1998 for BB, and 1984 and 2008 for WL. The synchronous 1998 and 2013 breakpoints along the main stem and for the TGR inflow highlight the basin-scale influence of major engineering regulation, whereas the asynchronous tributary breakpoints reflect heterogeneous reservoir construction timing, distinct basin disturbance histories, and extreme sediment-producing floods.
Following the identification of these change points, the runoff and sediment-load series at each station were partitioned into distinct stages. The results reveal that sediment dynamics were altered in both the main stem and tributaries, albeit with different response modes. Main-stem stations were characterized by abrupt and persistent sediment reductions associated with large reservoir impoundment, whereas several tributaries retained stronger event-driven variability.
Table 2 summarizes the mean annual sediment load for each period. For the TGR inflow, the mean value decreased from 457 × 106 t prior to 1998 to 259 × 106 t during 1998–2012, and further declined to 72.7 × 10⁶ t post-2013. At XJB, the average annual sediment load decreased by 99.3% after 2013 relative to the preceding period, indicating a strong disconnection of main-stem sediment transfer from the lower JSR to downstream reaches.
In contrast to the main-stem decline, FS exhibited an increase in mean annual sediment load post-2013. This response is attributed to high-intensity floods and the limited sediment-trapping capacity in the TJR basin [28]. Rather than being a simple exception to the basin-wide sediment reduction, this result indicates that tributaries lacking large sediment-retaining reservoirs may serve as important episodic residual sediment sources for the TGR under wet-year conditions.
4.3. Multi-Scale Variability of Runoff and Sediment Load
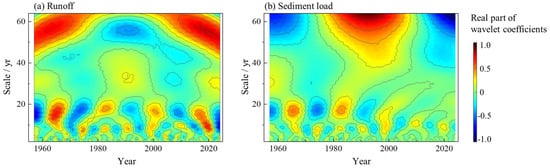
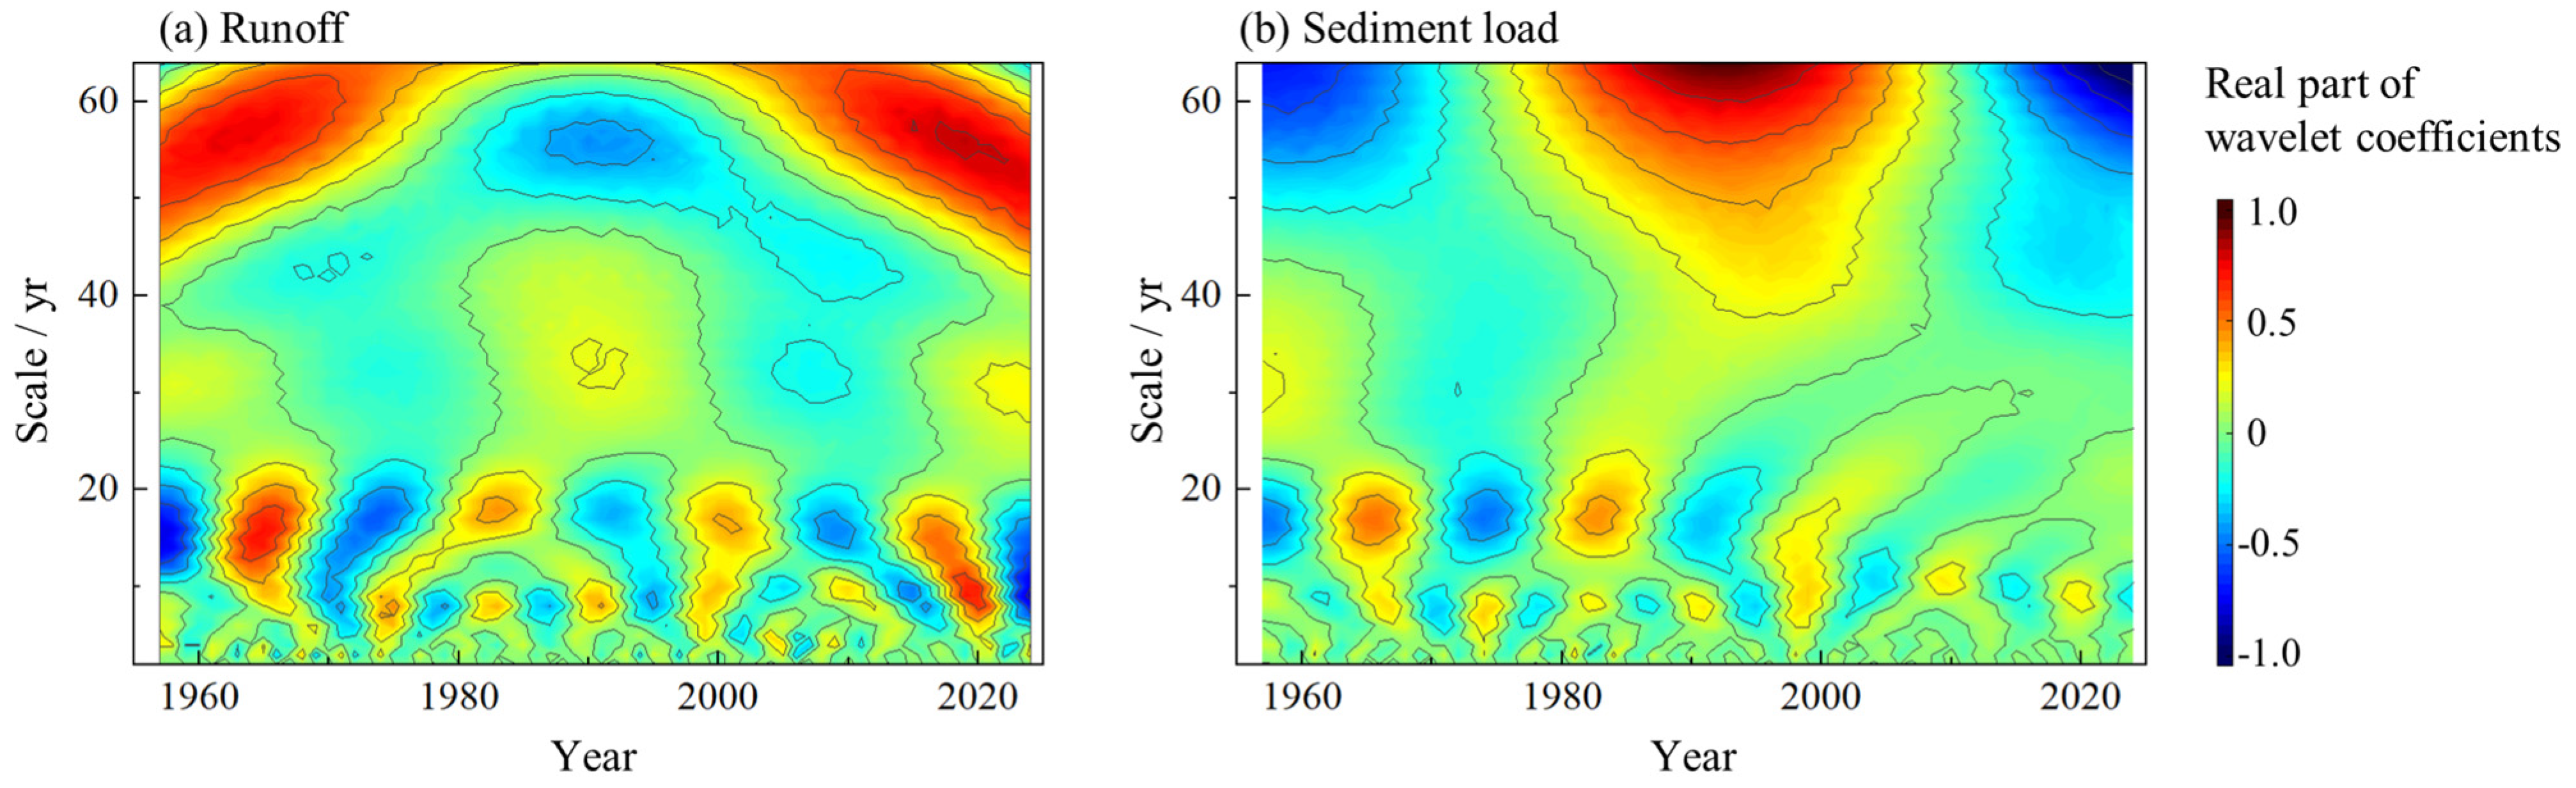
Wavelet analysis was applied to the TGR inflow runoff and sediment load to identify their multi-scale variability (Figure 3). Furthermore, wavelet variance analysis was utilized to pinpoint these primary cycles by identifying the time scales corresponding to the variance peaks for each station. The most significant peak denotes the primary period, succeeded by the secondary, tertiary, and occasionally quaternary periods in descending order of variance magnitude. The main periods identified for all stations are summarized in Table S2.
Figure 3.
Real part of wavelet coefficients of annual runoff and sediment load of the inflow to the TGR: (a) runoff; and (b) sediment load.
For the TGR inflow, both runoff and sediment load exhibited dual main periods: a common main period of approximately 9 years, alongside a roughly 16-year main period for runoff and a 17-year main period for sediment load. The common 9-year main period indicates a shared hydroclimatic fluctuation, whereas the longer-period differences suggest that sediment load was additionally modulated by sediment availability, tributary inputs, and reservoir regulation [15].
Across the major stations, these main periods varied considerably (Table S2). For sediment load, main-stem stations like ZT and CT exhibited main periods of 16 and 6 years, and 23 and 8 years, respectively. In contrast, tributary stations showed highly localized cycles, such as 35, 24, and 8 years for GC; 27 and 7 years for FS; 29 and 6 years for WL; and complex main periods of 20, 9, and 3 years for BB.
This spatial heterogeneity in main periods further supports the interpretation that TGR sediment inflow is an integrated response of differently regulated sub-basins rather than a uniform basin-wide signal [43].
4.4. Intra-Annual Distribution of Runoff and Sediment Load
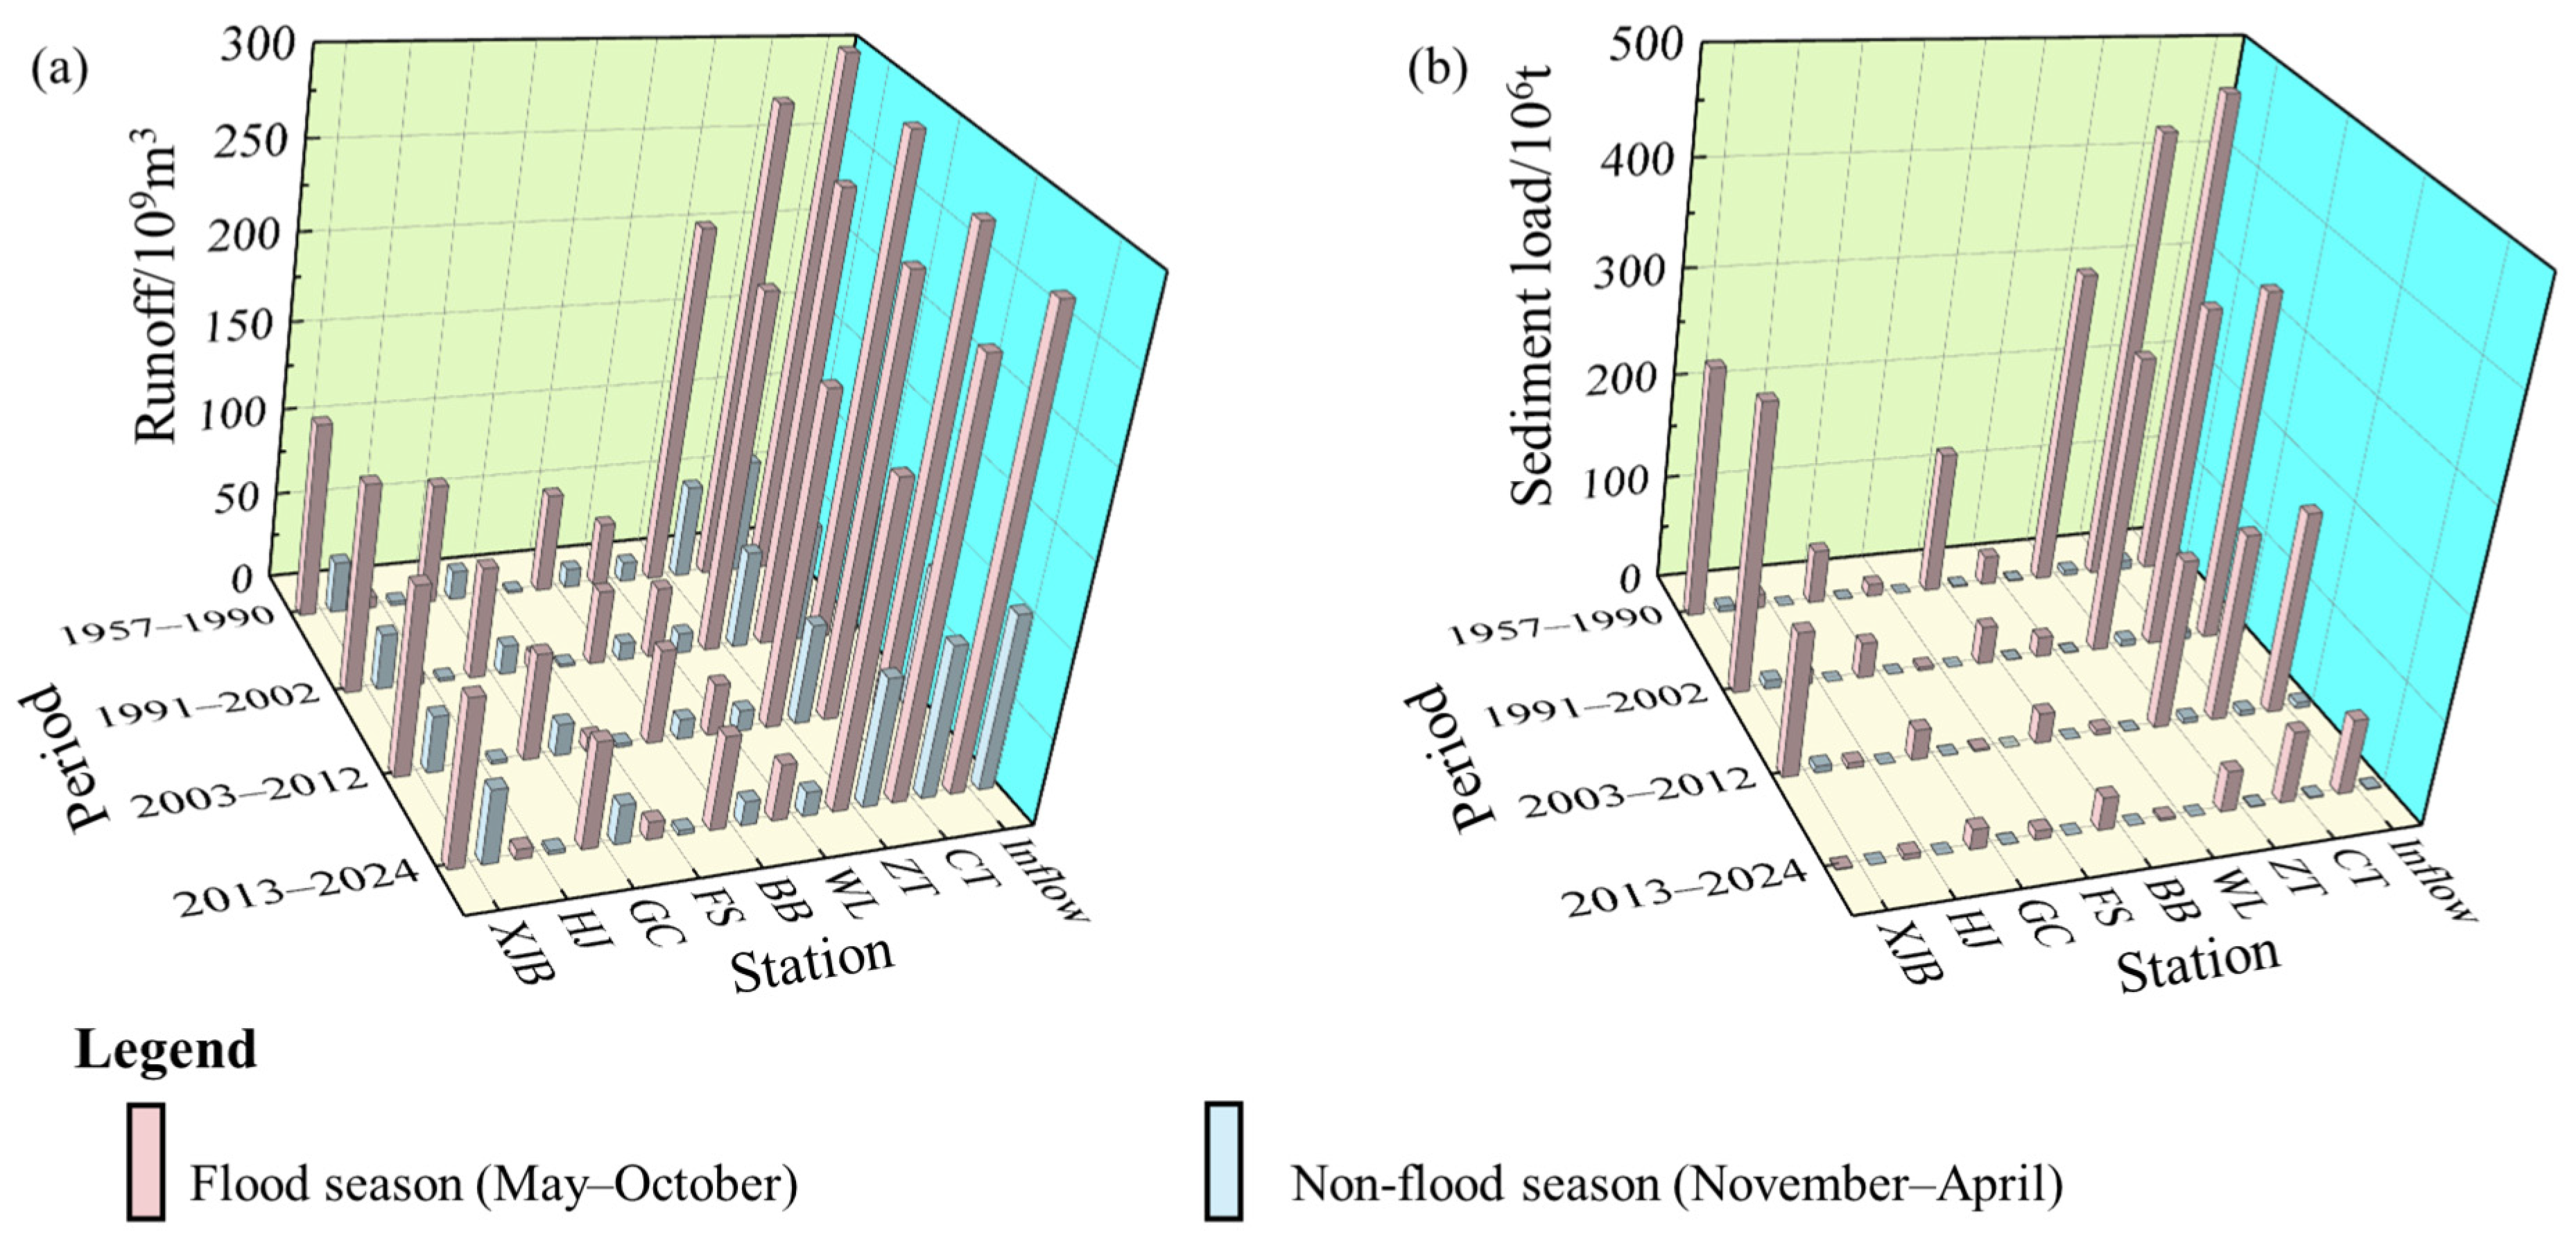
To evaluate how engineering regulation affects the intra-annual distribution of water and sediment delivery to the TGR, hydrological records from the main stem and tributaries were segmented into four periods aligned with key engineering stages: the natural baseline and early engineering-impact period (1957–1990), the TGR construction phase (1991–2002), the initial TGR operation phase (2003–2012), and the post-2013 period marked by the operation of lower JSR cascades and joint cascade scheduling across the Yangtze River basin. The UYZR is a typical rainstorm-driven river, with the rainy season from May to October defining the flood season across the basin [42,44].
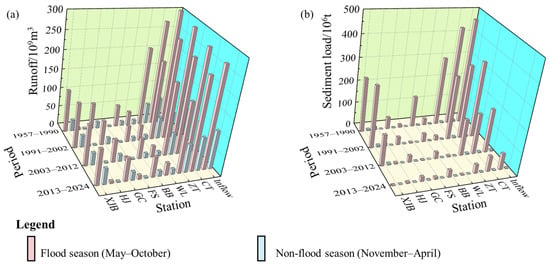
Figure 4a shows flood-season and non-flood-season runoff at each station across different periods. Except for XJB after 2013, the flood-season runoff proportion exceeded 70% at all other stations. Before 2013, flood-season runoff proportions remained relatively stable among the stations. After increasingly extensive joint reservoir operations began, annual runoff distribution was altered, and flood-season runoff proportions decreased at all stations due to floodwater storage and non-flood-season water replenishment [45,46].
Figure 4.
Seasonal partitioning of runoff and sediment load between the flood season (May–October) and non-flood season (November–April) across different periods: (a) runoff; and (b) sediment load.
Figure 4b illustrates flood-season and non-flood-season sediment loads across the different periods. Unlike runoff, sediment load remained strongly concentrated during the flood season at most stations, with proportions exceeding 97% except at XJB and WL. At XJB, progressive basin-wide reservoir development increased the sediment share during the non-flood season. Following the onset of intensive lower JSR cascade regulation around 2013, the JSR sediment regime was substantially regulated, decreasing the flood-season sediment proportion from over 95% to 85.7% [44]. At WL, the rainy season begins earlier than in other basins, increasing sediment load as early as April and resulting in a slightly lower proportion under the unified flood-season definition.
Overall, the post-2013 period was characterized by generally lower flood-season runoff proportions at multiple stations and a pronounced redistribution of sediment delivery from the JSR. At the TGR inflow scale, runoff showed a clearer seasonal redistribution, whereas suspended sediment delivery remained strongly concentrated during the flood season. These contrasting responses indicate that intensive reservoir regulation has modified the seasonal organization of the inflow boundary primarily through runoff redistribution and changes in the main-stem sediment-delivery regime.
5. Discussion
5.1. Hydroclimatic Background and Basin-Wide Soil and Water Conservation
The UYZR has evolved into a strongly regulated water–sediment system under the combined influence of main-stem cascade reservoirs, tributary engineering, basin-wide soil and water conservation, vegetation recovery, and channel sand extraction. Therefore, the decline in TGR sediment inflow should be interpreted as a systemic reorganization of sediment supply, delivery pathways, and seasonal transfer windows [20,47]. In this framework, precipitation provides the hydroclimatic transport background, while basin-wide ecological restoration and reservoir regulation fundamentally determine whether sediment remains available and connected to downstream reaches.
- (1)
- Hydroclimatic Background
Precipitation remains the primary driver of runoff generation and event-scale sediment mobilization [8,42,48]. Figure S1 illustrates the long-term precipitation distribution across UYZR tributaries and the double-mass relationships between annual precipitation, runoff, and sediment load. These relationships provide the hydroclimatic background for interpreting the regulated sediment regime, but are insufficient to fully explain the multi-decadal sediment decline.
Precipitation increased in the JSR, MJR, and JLR basins but decreased in the TJR and WJR basins, although none of these trends was statistically significant at the 95% confidence level. The precipitation–runoff double-mass curves maintained stable positive relationships; the general linearity and stable slopes suggest relatively minor anthropogenic interference in runoff generation [49,50]. In contrast, the precipitation–sediment double-mass curves exhibited segmented characteristics with visible turning points, signifying apparent anthropogenic influence. However, the linearity maintained within each segment indicates stable precipitation–sediment yield relationships driven by consistent underlying surface conditions during each respective period [51,52,53]. Overall, these features show that the linkage between rainfall input and sediment output was progressively modified by engineering regulation and basin-wide soil and water conservation.
Across major UYZR tributaries, annual precipitation showed no statistically significant trend, and annual runoff generally showed weak trends, with significant decreases at HJ and GC (Table 2), whereas annual sediment load changed substantially. In the TJR basin, the post-2013 increase in sediment load was more closely related to event-scale rainstorm and flood processes during wet years than to a persistent increase in precipitation. Thus, precipitation primarily modulates event-scale sediment delivery, whereas the long-term reshaping of TGR sediment inflow requires explanation through changes in sediment availability (via basin-wide restoration) and transport connectivity (via reservoir regulation).
- (2)
- Basin-Wide Soil and Water Conservation and Ecological Restoration
Human activities across the basin, particularly soil and water conservation projects and ecological restoration initiatives, have substantially reduced hillslope sediment availability throughout the UYZR [54,55]. While these measures do not directly account for all temporal variations in TGR inflow sediment, they establish a fundamentally lower sediment-supply background upon which reservoir regulation and flood events subsequently operate.
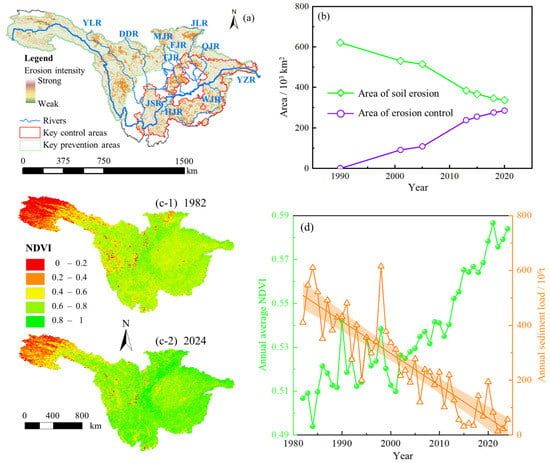
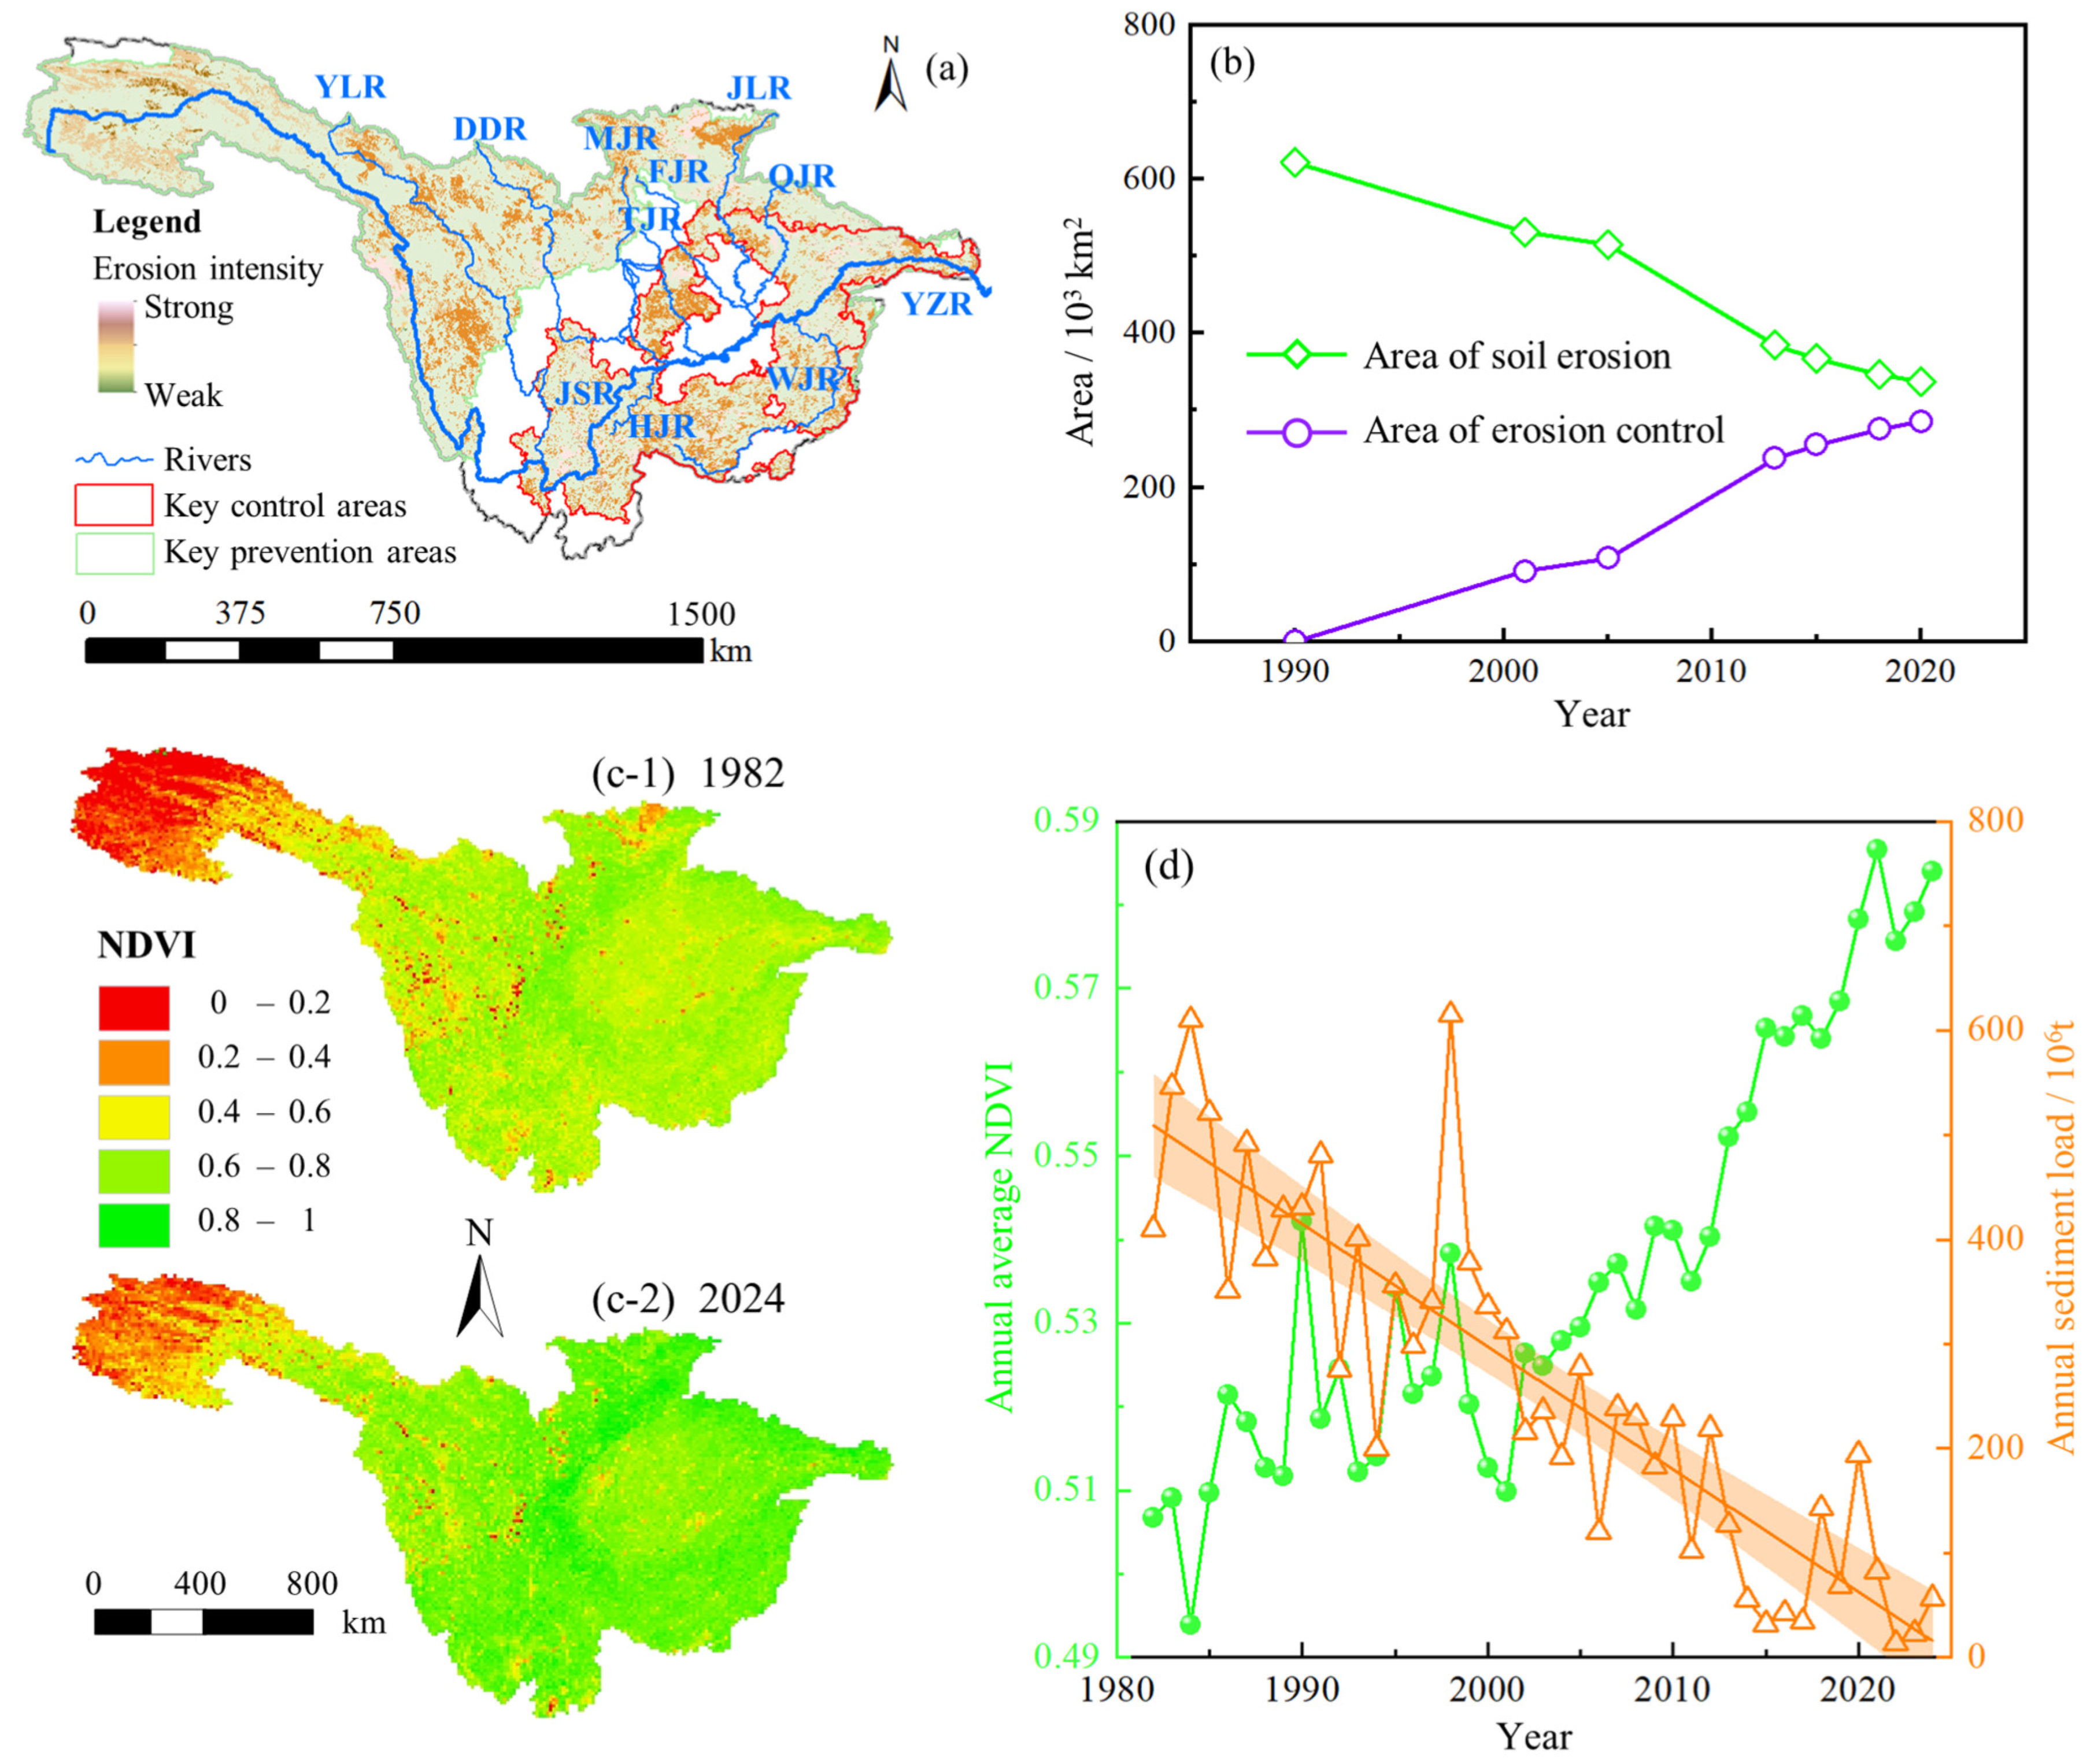
Soil and water conservation measures have been systematically implemented since 1989, beginning with the Changzhi Project in key regions encompassing the lower JSR, upper JLR, TGR area, and upper WJR [56]. The Natural Forest Resource Protection Project was initiated in 1998 across the Aba, Ganzi, and Liangshan prefectures in Sichuan Province, followed after 2006 by additional national and international conservation programs. The national key soil and water conservation areas across the UYZR are shown in Figure 5a.
Figure 5.
Soil erosion control, vegetation recovery, and their relationship with TGR sediment inflow in the UYZR Basin: (a) distribution of national key control and prevention areas for soil erosion; (b) area affected by soil erosion and cumulative area under erosion control; (c-1) annual average NDVI in 1982; (c-2) annual average NDVI in 2024; and (d) temporal variations in annual NDVI of the UYZR basin and annual sediment inflow to the TGR. Source: soil and water conservation data from the Yangtze River Basin Soil and Water Conservation Bulletin; NDVI data processed using Google Earth Engine; hydrological and sediment data provided by the Bureau of Hydrology, Changjiang Water Resources Commission. Figure prepared by the authors. In panel (a), YLR, DDR, MJR, TJR, FJR, QJR, HJR, and WJR denote the Yalong, Dadu, Minjiang, Tuojiang, Fujiang, Qujiang, Hengjiang, and Wujiang rivers, respectively. In panel (d), green circles and connecting lines show annual mean NDVI (left axis), and orange triangles and connecting lines show annual sediment load (right axis); the straight orange line shows the fitted linear trend in sediment load, with the orange shaded band representing its 95% confidence interval.
The area affected by soil erosion decreased substantially across the UYZR after 1990. The total eroded area declined from 622 × 103 km2 in 1990 to 337 × 103 km2 by 2020, representing a net reduction of 45.8% (Figure 5b). This long-term decline reflects the cumulative effects of terracing, afforestation, economic orchard establishment, grassland development, closed-field management, conservation tillage, and broader ecological restoration initiatives [57,58,59].
The increase in vegetation cover and the implementation of ecological restoration programs have been widely recognized as important controls on hillslope sediment supply in the Three Gorges Reservoir area and the wider Yangtze River basin [58,60,61]. NDVI effectively characterizes vegetation coverage and serves as an indirect indicator of soil erosion potential across the UYZR [62,63]. Comparisons between 1982 and 2024 reveal widespread NDVI increases across the lower JSR, MJR, TJR, JLR, WJR, and TGR areas (Figure 5c-1,c-2). Furthermore, a negative correlation exists between TGR inflow sediment load and UYZR NDVI (Figure 5d), suggesting that vegetation recovery was associated with reduced sediment delivery to the TGR [42,64]. However, its role should be interpreted in conjunction with subsequent reservoir regulation and channel storage depletion.
5.2. Reservoir Regulation, Sand Extraction, and Sediment Disconnection
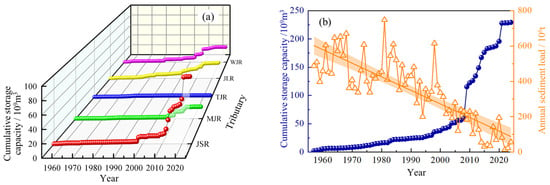
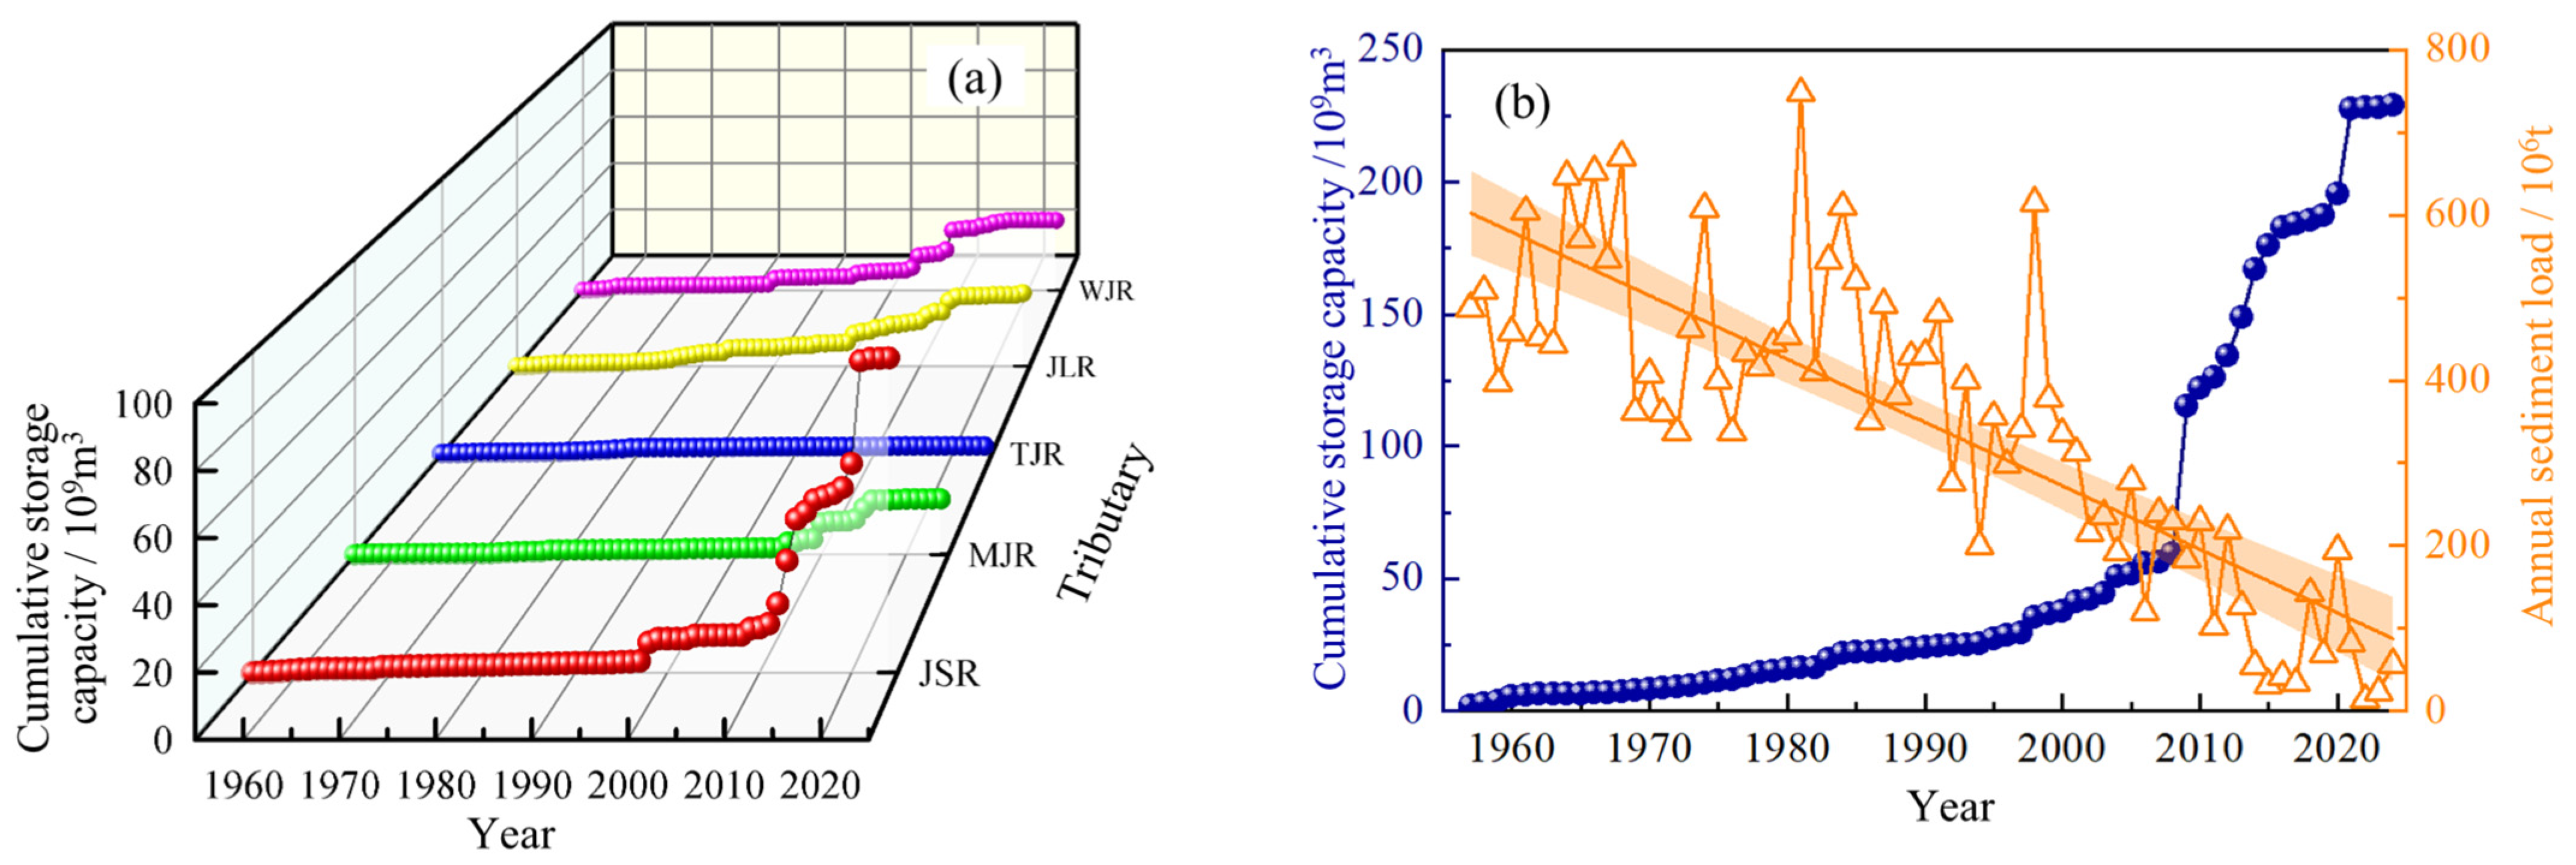
The UYZR, a pivotal hydropower base for China, is characterized by abundant water resources. A significant shift in reservoir construction occurred after 2000 [27,65], with the cumulative reservoir capacity across major tributaries growing rapidly (Figure 6a). Prior to this, the JSR and major tributaries were primarily regulated by small-to-medium reservoirs with limited and short-lived trapping effects. After 2000, the rapid development of cascade reservoirs fundamentally altered downstream sediment continuity and reduced sediment delivery to the TGR [64,66,67].
Figure 6.
Reservoir storage development and its relationship with sediment inflow to the TGR: (a) cumulative reservoir storage capacity in major tributaries of the UYZR basin; (b) temporal variations in cumulative reservoir storage capacity and annual sediment inflow to the TGR. In panel (b), blue circles and connecting lines show cumulative reservoir storage capacity (left axis), and orange triangles and connecting lines show annual sediment load (right axis); the straight orange line shows the fitted linear trend in sediment load, with the orange shaded band representing its 95% confidence interval.
The commissioning of Xiangjiaba (2012) and Xiluodu (2013) on the lower JSR substantially enhanced sediment retention, resulting in a 99% reduction in the average annual sediment load at XJB from 2013 to 2024 compared with the preceding period [68]. This sediment load reduction pattern was mirrored in other basins following the construction of large reservoirs, namely Zipingpu and Pubugou in the MJR, Baozhusi and Wudu in the JLR, and Silin, Hongjiadu, and Goupitan in the WJR [13]. These large-scale projects intercept substantial amounts of suspended sediment, abruptly altering the sediment load regime, as exemplified by the abrupt change observed in the MJR after Zipingpu Reservoir became operational in 2006 [8]. In stark contrast, the TJR is characterized by numerous smaller navigation and hydropower hubs exerting a limited effect on sediment trapping [28]. Furthermore, the spatial distribution of reservoir capacity is highly uneven. Within the MJR, the major capacity increment is concentrated on its tributary, the Dadu River (Figure 1). Similarly, in the JLR, few large reservoirs regulate its main tributaries, the Fujiang and Qujiang rivers. Consequently, the sediment-trapping effects in these specific sub-basins, alongside the TJR, remain considerably lower than those in the highly regulated JSR and WJR. This implies that the MJR, TJR, and JLR may experience intense sediment transport processes, such as severe soil erosion or landslide-induced sediment production during wet years, thereby serving as the primary sediment sources for the TGR.
The inverse relationship between TGR inflow sediment load and cumulative reservoir storage capacity (Figure 6b) indicates that large reservoirs act primarily by disconnecting upstream sediment from downstream transfer pathways. The aggregate storage capacity in the UYZR, excluding the TGR, has exceeded 229 × 109 m3, with large reservoirs accounting for over 94% of this volume. Sediment regulation characteristics are highly dependent on reservoir scale: small and medium-sized reservoirs exhibit limited interception capabilities and rapidly attain siltation equilibrium, whereas large reservoirs impose a sustained and basin-scale disruption of sediment connectivity [28,42].
Channel sand extraction constitutes another crucial anthropogenic factor influencing basin sediment dynamics by directly removing in-channel sediment storage [69,70,71]. To quantify this effect, the channel-scale sediment budget of the XJB–CT reach was calculated as ΔW = Wtrib + WXJB−CT − WSE − WCT, where positive ΔW denotes net deposition, whereas negative values indicate net erosion or release from unresolved reach-scale storage. Because ungauged lateral inputs and intermediate storage changes were not independently observed, ΔW is interpreted as a residual rather than a direct measurement of channel erosion or deposition. Between 2013 and 2018, the average annual extraction volume upstream of CT reached 26.69 × 10⁶ t, equivalent to 36.9% of the TGR sediment inflow. As shown in Table 3, before 2013, extraction volumes remained lower than natural sedimentation; however, after 2013, the CT sediment load declined below cumulative tributary inputs, shifting the XJB–CT reach into a sediment-deficit condition. Extensive sand extraction affects not only the main stem but also various tributary levels across the UYZR [70]. Notably, in other tributaries, these effects do not directly manifest as reduced sediment load entering the Yangtze River, but rather as decreased sedimentation within low-head reservoirs [72].
Table 3.
Sediment budget upstream of the Cuntan station (106 t).
Collectively, these processes indicate that the main-stem sediment pathway to the TGR has been strongly disconnected. Although the JSR continues to serve as a vital runoff corridor, its capacity to deliver sediment downstream has been severely curtailed by cascade reservoirs and channel sediment depletion. This spatial decoupling between water delivery and sediment transfer is central to the reshaped TGR inflow regime.
5.3. Tributary Residual Sediment Supply and Integrated Statistical Interpretation
With the main-stem sediment pathway substantially weakened, the relative importance of tributary-derived residual sediment increased, particularly during wet years. Tributary responses were highly heterogeneous due to differences in reservoir capacity, low-head hydropower development, basin-wide ecological restoration, rainfall regimes, and channel sediment storage among basins. The TJR provides a clear example, as the FS station exhibited a post-2013 increase in mean annual sediment load despite the overall decline in basin-wide sediment yield, reflecting high-intensity floods and limited sediment-trapping capacity.
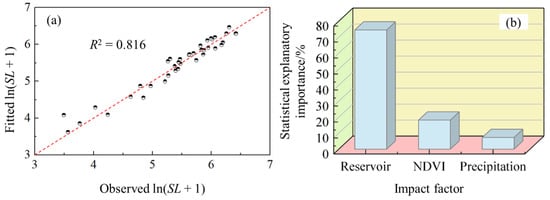
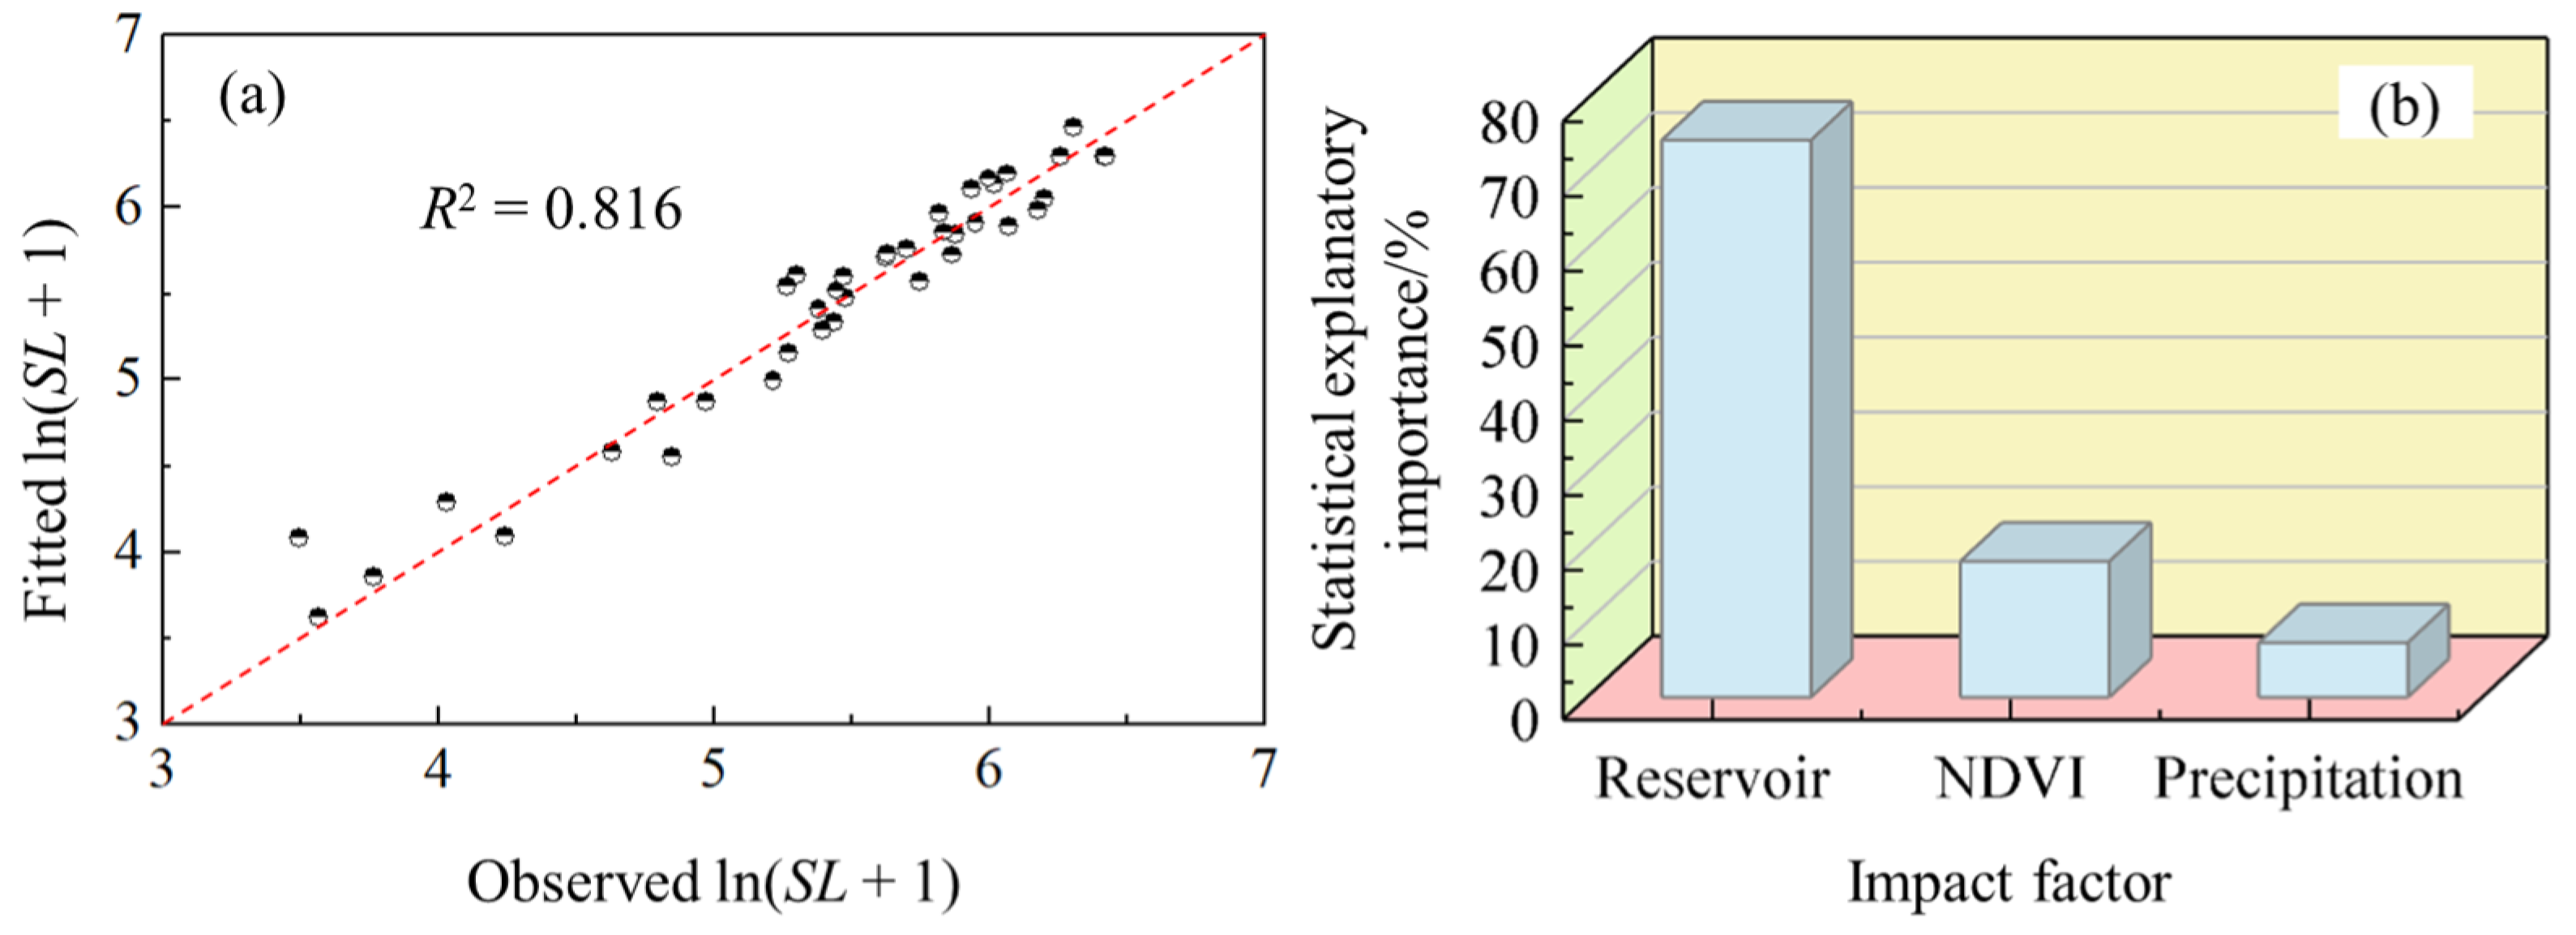
The regression-based explanatory analysis provided additional statistical evidence for the long-term evolution of TGR sediment inflow. Constrained to the 1982–2024 period, over which annual sediment load, precipitation, reservoir capacity, and NDVI data were simultaneously available, the baseline level model explained 81.6% of the variance in the log-transformed annual sediment load (Figure 7a). The LMG (Shapley value) decomposition attributed 74.5% of the explained variance to cumulative upstream reservoir capacity, 18.2% to NDVI, and 7.3% to precipitation (Figure 7b). These percentages represent relative explanatory importance within the baseline-level model rather than causal contributions, and should be interpreted with particular caution because reservoir capacity and NDVI both exhibit pronounced upward long-term trends and moderate collinearity.
Figure 7.
Statistical explanatory analysis of annual TGR sediment inflow during 1982–2024: (a) observed and fitted log-transformed sediment load, ln(SL + 1), from the baseline level model; and (b) model-dependent relative explanatory importance derived from LMG/Shapley decomposition of R2. In panel (a), each circle represents one year, and the red dashed line is the 1:1 reference line.
The baseline residuals showed no statistically significant lag-1 autocorrelation (Ljung–Box p = 0.080), whereas heteroscedasticity was detected by both the Breusch–Pagan (p = 0.0015) and White (p = 0.0299) tests; inference was therefore based on HC3 heteroscedasticity-robust standard errors. Under this specification, the standardized coefficient was positive for precipitation (β = 0.245, 95% CI: 0.093–0.398, p = 0.0024) and negative for NDVI (β = −0.430, 95% CI: −0.774 to −0.085, p = 0.0159) and cumulative upstream reservoir capacity (β = −0.473, 95% CI: −0.871 to −0.075, p = 0.0211). The corresponding VIF values were 1.09, 4.46, and 4.29, respectively (Supplementary Table S4). Influence diagnostics identified several relatively influential years, but no observation had a Cook’s distance exceeding 1, and individually removing the identified years did not alter the signs of the three regression coefficients. Leave-period-out validation yielded a pooled held-out R2 of 0.648, although predictive performance was weaker when the entire post-2013 period was withheld. The model is therefore used primarily to characterize statistical associations among long-term sediment inflow and its potential controls, rather than as a causal attribution or an out-of-period predictive model.
The sensitivity analyses further revealed a clear dependence on temporal scale. After linear detrending, the relative explanatory shares of precipitation, NDVI, and reservoir capacity were 44.4%, 21.3%, and 34.3%, respectively, whereas first differencing increased the precipitation share to 89.2%, with reservoir-capacity change accounting for 10.7% and NDVI change contributing little additional explanatory information. Regressions with AR(1) errors reproduced the positive precipitation association and the negative reservoir-capacity association, although the independent NDVI effect became statistically insignificant. Taken together, these results indicate that reservoir development is strongly associated with the long-term reduction in sediment inflow, whereas precipitation predominantly controls the interannual variability; the statistical contribution of NDVI is the most sensitive to the treatment of the common long-term trend and should therefore be interpreted cautiously.
The statistical association with reservoir capacity is physically consistent with the disruption of sediment connectivity, particularly along the lower JSR and other heavily regulated reaches. A similar linkage emerges for NDVI, whose contribution likely reflects the long-term reduction in hillslope sediment availability under large-scale ecological restoration and soil conservation. Precipitation, by contrast, appears to capture primarily event-scale modulation, including episodic tributary sediment pulses during wet years. Of note is the relatively small precipitation share in the baseline level model. After detrending and first differencing, however, the precipitation share increased substantially, indicating that precipitation primarily modulates interannual sediment variability, whereas reservoir development and vegetation recovery are more strongly associated with the multi-decadal decline [13,73,74]. Such a result is broadly consistent with previous attribution studies indicating that sediment decline in the Yangtze River basin is primarily controlled by dam construction and landscape restoration, whereas precipitation variability mainly modulates interannual fluctuations [55,75]. Although sand extraction was excluded from the annual regression due to data limitations, stage-scale sediment budgets indicate that post-2013 sand extraction further aggravated the XJB–CT sediment deficit. Collectively, these results demonstrate that the TGR inflow boundary is controlled by the strongly regulated main-stem sediment disconnection, reduced basin-wide sediment supply, and tributary event-scale residual delivery.
5.4. Limitations and Future Perspectives
The present study focuses on the long-term evolution of runoff and sediment fluxes entering the TGR and on the redistribution of sediment sources under intensive basin regulation. The results indicate that progressive sediment interception by the upper-basin reservoir system, particularly along the lower JSR, has substantially weakened main-stem sediment delivery, while several major tributaries, including the MJR, TJR, and JLR, retain relatively greater sediment-supply potential during wet years. This change in the spatial composition of sediment inflow provides an updated boundary-condition perspective for TGR sediment management.
However, the present dataset does not support a quantitative assessment of how specific reservoir operating rules produce the observed changes in flood attenuation, seasonal water redistribution, or sediment-routing opportunities. Separating climate-driven runoff variability from regulation-driven redistribution would require coordinated reservoir-operation records, including release processes, reservoir levels, flood-control storage, and joint-operation schedules, together with event-scale observations covering representative dry, normal, wet, and extreme-flood years. Similarly, quantitative evaluation of sediment-routing or deposition responses would require a hydrological–hydrodynamic or sediment transport modeling framework constrained by long-term channel geometry, flow velocity, sediment-size characteristics, and reservoir operation data.
Consequently, the management implications identified here concern changes in the spatial and temporal characteristics of the TGR inflow boundary rather than specific operating prescriptions. Future studies should couple the long-term sediment-source framework established here with reservoir-operation scenarios and event-scale hydrodynamic simulations to evaluate how tributary-dominated sediment inputs interact with flood-control requirements and potential sediment-routing windows. Such analyses would also allow explicit consideration of trade-offs among flood control, sediment management, hydropower generation, navigation, water supply, and ecological-flow objectives under different hydrological conditions.
6. Conclusions
Based on long-term runoff and sediment records from 1957 to 2024, this study investigated the runoff–sediment regime entering the Three Gorges Reservoir under intensive regulation in the upper Yangtze River. The main conclusions are summarized as follows.
- (1)
- The upper Yangtze River has transitioned into a strongly regulated runoff–sediment regime, characterized by minimal changes in annual runoff, substantial sediment-load reduction, and altered intra-annual water–sediment delivery.
- (2)
- Main-stem regulation has weakened sediment transfer from the Jinsha River, whereas tributaries with limited sediment-retention capacity still retain episodic sediment-supply potential, becoming important sediment sources for the TGR during wet years.
- (3)
- Within the regression framework, reservoir capacity was the largest explanatory factor for the sediment inflow reduction to the TGR, followed by NDVI and precipitation, with a clear timescale dependence: reservoir capacity and NDVI dominated the multi-decadal decline, whereas precipitation accounted for more of the interannual variability. Nevertheless, extreme rainstorms can still generate substantial episodic sediment inputs in specific wet years.
Supplementary Materials
The following supporting information can be downloaded at: https://www.mdpi.com/article/10.3390/su18199987/s1, Table S1. Large reservoirs in the upper Yangtze River basin (excluding the TGR). Table S2. Main periods of annual runoff and sediment load in the UYZR. Table S3. Mann–Kendall trend statistics and Sen’s slope estimates for annual runoff and suspended sediment load at major stations and TGR inflow. Table S4. Standardized regression coefficients with robust 95% confidence intervals and multicollinearity diagnostics for the baseline level model of TGR sediment inflow. Figure S1. Temporal variations in precipitation and double-mass curves of precipitation–runoff and precipitation–sediment load in the main tributaries of the upper Yangtze River Basin.
Author Contributions
Conceptualization, Z.W. and S.L.; methodology, Z.W.; formal analysis, Z.W.; data curation, Y.Z.; writing—original draft preparation, Z.W.; writing—review and editing, C.Y.; supervision, S.L.; funding acquisition, S.L. and L.Z. All authors have read and agreed to the published version of the manuscript.
Funding
This work was supported by the National Natural Science Foundation of China (U25A20360), Chongqing Municipal Education Commission Science and Technology Research Project (KJQN202500737), and the National Natural Science Foundation of China (U2040218).
Institutional Review Board Statement
Not applicable.
Informed Consent Statement
Not applicable.
Data Availability Statement
The data that support the findings of this study are available from the corresponding author upon reasonable request.
Conflicts of Interest
The authors declare no conflicts of interest.
References
- Sun, X.; Tian, L.; Fang, H.; Walling, D.E.; Huang, L.; Park, E.; Li, D.; Zheng, C.; Feng, L. Changes in Global Fluvial Sediment Concentrations and Fluxes between 1985 and 2020. Nat. Sustain. 2025, 8, 142–151. [Google Scholar] [CrossRef] [Scilit]
- Bastia, F.; Equeenuddin, S.M. Spatio-temporal Variation of Water Flow and Sediment Discharge in the Mahanadi River, India. Glob. Planet. Change 2016, 144, 51–66. [Google Scholar] [CrossRef] [Scilit]
- Meade, R.H.; Moody, J.A. Causes for the Decline of Suspended-Sediment Discharge in the Mississippi River System, 1940–2007. Hydrol. Process. 2010, 24, 35–49. [Google Scholar] [CrossRef] [Scilit]
- Wang, H.; Bi, N.; Saito, Y.; Wang, Y.; Sun, X.; Zhang, J.; Yang, Z. Recent Changes in Sediment Delivery by the Huanghe (Yellow River) to the Sea: Causes and Environmental Implications in Its Estuary. J. Hydrol. 2010, 391, 302–313. [Google Scholar] [CrossRef] [Scilit]
- Chua, S.D.X.; Lu, X.X. Sediment Load Crisis in the Mekong River Basin: Severe Reductions Over the Decades. Geomorphology 2022, 419, 108484. [Google Scholar] [CrossRef] [Scilit]
- Li, Q.; Gray, K.E.; Jaisi, D.P. Relative Roles of Sediment Transport and Localized Erosion on Phosphorus Load in the Lower Susquehanna River and Its Mouth in the Chesapeake Bay, USA. J. Geophys. Res. Biogeosci. 2022, 127, e2022JG006944. [Google Scholar] [CrossRef] [Scilit]
- Zhong, K.; Zheng, F.; Liu, G.; Zhang, X.; Qin, C.; Xu, X. Effects of Variations in Precipitation Extremes on Sediment Load in the Second Songhua River Basin, Northeast China. J. Soils Sediments 2023, 23, 1971–1984. [Google Scholar] [CrossRef] [Scilit]
- Wang, Z.; Li, D.; Liu, S.; Han, J.; Xian, R. Sediment Transport Characteristics at the Flood-Event Scale in the Minjiang River Basin, China. Hydrol. Res. 2025, 56, 13–28. [Google Scholar] [CrossRef] [Scilit]
- Zhang, X.; Zhang, M.; Zhang, C.; Sun, Z.; Zhao, B. Impact of the Xiaolangdi Reservoir Operation on Water–Sediment Transport and Aquatic Organisms in the Lower Yellow River during Flood Events. Sustainability 2025, 17, 8136. [Google Scholar] [CrossRef] [Scilit]
- Liu, W.; Li, Y.; Li, D.; Lin, P.; Wang, X.; Pritchard, H.D.; Kraaijenbrink, P.D. Impacts of Changes in Climate, Cryosphere, and Vegetation on Freshwater Supply in the Southeastern Tibetan Plateau. J. Hydrol. 2025, 661, 133713. [Google Scholar] [CrossRef] [Scilit]
- Guo, W.; Hu, J.; Wang, H. Analysis of Runoff Variation Characteristics and Influencing Factors in the Wujiang River Basin in the Past 30 Years. Int. J. Environ. Res. Public Health 2021, 19, 372. [Google Scholar] [CrossRef] [Scilit] [PubMed]
- Zhai, H.; Wang, M.; Shen, D.; Hu, B.; Li, Y. Analysis of Runoff Variation and Driving Factors in the Minjiang River Basin over the Last 60 years. J. Water Clim. Change 2022, 13, 3675–3691. [Google Scholar] [CrossRef] [Scilit]
- Zhou, Y.; Li, D.; Lu, J.; Yao, S.; Yan, X.; Jin, Z.; Liu, L.; Lu, X.X. Distinguishing the multiple controls on the decreased sediment flux in the Jialing River basin of the Yangtze River, Southwestern China. CATENA 2020, 193, 104593. [Google Scholar] [CrossRef] [Scilit]
- Jin, Z.; Feng, L.; Liu, Y.; Liu, Y.; Xu, D.; Liu, Z. Impact of Dam Construction on Sediment Transport Capacity: A Case Study of the Three Gorges Reservoir. Hydrol. Process. 2024, 38, e15147. [Google Scholar] [CrossRef] [Scilit]
- Zhang, W.; Ren, J.; Chen, Y.; Yuan, J.; Li, X.; Zhu, J. The Important Role of Tributaries and Flood Events in Sediment Transport: A Study on the Spatiotemporal Variability of Water and Sediment Discharge Upstream and Downstream of the Three Gorges Reservoir. CATENA 2024, 234, 107594. [Google Scholar] [CrossRef] [Scilit]
- Chen, Y.; Wang, Y.-G. Variations in Basin Sediment Yield and Channel Sediment Transport in the Upper Yangtze River and Influencing Factors. J. Hydrol. Eng. 2019, 24, 05019016. [Google Scholar] [CrossRef] [Scilit]
- Liu, J.; Zhang, W.; Shen, Y.; Wang, X. Dramatic sediment load changes and sedimentation characteristics upstream of the Three Gorges Dam due to the large reservoirs construction. Front. Earth Sci. 2024, 18, 565–578. [Google Scholar] [CrossRef] [Scilit]
- Dethier, E.N.; Renshaw, C.E.; Magilligan, F.J. Rapid Changes to global River Suspended Sediment Flux by Humans. Science 2022, 376, 1447–1452. [Google Scholar] [CrossRef] [Scilit] [PubMed]
- Yunus, A.P.; Masago, Y.; Boulange, J.; Hijioka, Y. Natural and Anthropogenic Forces on Suspended Sediment Dynamics in Asian Estuaries. Sci. Total Environ. 2022, 836, 155569. [Google Scholar] [CrossRef] [Scilit] [PubMed]
- Duan, L.; Tian, Y.; Zhang, S.; Wang, X.; Li, C.; Chen, M. Statistical studies of the characteristics and key influencing factors of sediment changes in the upper Yangtze River over the past 60 years. Geomorphology 2024, 466, 109414. [Google Scholar] [CrossRef] [Scilit]
- Li, D.; Lu, X.X.; Yang, X.; Chen, L.; Lin, L. Sediment Load Responses to Climate Variation and Cascade Reservoirs in the Yangtze River: A Case Study of the Jinsha River. Geomorphology 2018, 322, 41–52. [Google Scholar] [CrossRef] [Scilit]
- Liu, S.; Li, D.; Liu, D.; Zhang, X.; Wang, Z. Characteristics of Sedimentation and Sediment Trapping Efficiency in the Three Gorges Reservoir, China. CATENA 2022, 208, 105715. [Google Scholar] [CrossRef] [Scilit]
- Jiang, P.; Dong, B.; Huang, G.; Tong, S.; Zhang, M.; Li, S.; Zhang, Q.; Xu, G. Study on the Sediment and Phosphorus Flux Processes Under the Effects of Mega Dams Upstream of Yangtze River. Sci. Total Environ. 2023, 860, 160453. [Google Scholar] [CrossRef] [Scilit] [PubMed]
- Liu, J.; Zheng, H.; Shen, Y.; Xing, B.; Wang, X. Variation in Sediment Sources and the Response of Suspended Sediment Grain Size in the Upper Changjiang River Basin Following the Large Dam Constructions. Sci. Total Environ. 2023, 904, 166869. [Google Scholar] [CrossRef] [Scilit] [PubMed]
- Liu, S.; Li, D.; Wang, Z.; Zhang, P.; Wang, D.; Yang, S.; Hu, J.; Xu, Z.; Yang, X. Exploring the changes in the ratio of the sediment concentration to the sediment transport capacity in mountainous rivers: A case study of the Upper Yangtze River. J. Hydrol. 2025, 660, 133501. [Google Scholar] [CrossRef] [Scilit]
- Tian, Q.; Xu, K.H.; Dong, C.M.; Yang, S.L.; He, Y.J.; Shi, B.W. Declining sediment discharge in the yangtze river from 1956 to 2017: Spatial and temporal changes and their causes. Water Resour. Res. 2021, 57, e2020WR028645. [Google Scholar] [CrossRef] [Scilit]
- Yan, H.-C.; Zhang, X.-F.; Xu, Q.-X. Unprecedented sedimentation in response to emerging cascade reservoirs in the upper Yangtze River Basin. CATENA 2022, 209, 105833. [Google Scholar] [CrossRef] [Scilit]
- Wang, Z.; Liu, S.; Li, D.; Wang, D.; Zhu, L.; Yang, C. The impact of High-Intensity earthquakes on sediment transport characteristics during flood events: A Case study of rivers in the Longmenshan region. J. Hydrol. 2026, 671, 135288. [Google Scholar] [CrossRef] [Scilit]
- Xinhua News Agency. The Three Gorges Project Has Achieved Remarkable Benefits since Its Commencement 30 Years Ago. 2024. Available online: https://www.gov.cn/yaowen/tupian/202412/content_6992599.htm#1 (accessed on 13 August 2026). (In Chinese)
- Kendall, M.G. Rank Correlation Methods, 4th ed.; Charles Griffin: London, UK, 1975. [Google Scholar]
- Mann, H.B. Nonparametric Tests against Trend. Econometrica 1945, 13, 245–259. [Google Scholar] [CrossRef] [Scilit]
- Hamed, K.H.; Rao, A.R. A modified Mann–Kendall trend test for autocorrelated data. J. Hydrol. 1998, 204, 182–196. [Google Scholar] [CrossRef] [Scilit]
- Sen, P.K. Estimates of the Regression Coefficient Based on Kendall’s Tau. J. Am. Stat. Assoc. 1968, 63, 1379–1389. [Google Scholar] [CrossRef]
- Oliveira, K.S.S.; Quaresma, V.d.S. Temporal Variability in the Suspended Sediment Load and Streamflow of the Doce River. J. S. Am. Earth Sci. 2017, 78, 101–115. [Google Scholar] [CrossRef] [Scilit]
- Lund, R.; Reeves, J. Detection of Undocumented Changepoints: A Revision of the Two-Phase Regression Model. J. Clim. 2002, 15, 2547–2554. [Google Scholar] [CrossRef] [Scilit]
- Tomé, A.R.; Miranda, P.M.A. Piecewise Linear Fitting and trend Changing Points of Climate Parameters. Geophys. Res. Lett. 2004, 31, L02207. [Google Scholar] [CrossRef] [Scilit]
- Wang, H.; Saito, Y.; Zhang, Y.; Bi, N.; Sun, X.; Yang, Z. Recent Changes of Sediment Flux to the Western Pacific Ocean from Major Rivers in East and Southeast Asia. Earth-Sci. Rev. 2011, 108, 80–100. [Google Scholar] [CrossRef] [Scilit]
- Grossmann, A.; Morlet, J. Decomposition of Hardy Functions into Square Integrable Wavelets of Constant Shape. SIAM J. Math. Anal. 1984, 15, 723–736. [Google Scholar] [CrossRef] [Scilit]
- Wang, J.; Li, Y.; Wang, S.; Li, Q.; Li, M. Determining relative contributions of climate change and multiple human activities to runoff and sediment reduction in the eastern Loess Plateau, China. CATENA 2023, 232, 107376. [Google Scholar] [CrossRef] [Scilit]
- Zhao, G.; Mu, X.; Jiao, J.; Gao, P.; Sun, W.; Li, E.; Wei, Y.; Huang, J. Assessing response of sediment load variation to climate change and human activities with six different approaches. Sci. Total Environ. 2018, 639, 773–784. [Google Scholar] [CrossRef] [Scilit] [PubMed]
- Kroll, C.N.; Song, P. Impact of Multicollinearity on Small Sample Hydrologic Regression Models. Water Resour. Res. 2013, 49, 3756–3769. [Google Scholar] [CrossRef] [Scilit]
- Liu, S.; Wang, D.; Miao, W.; Wang, Z.; Zhang, P.; Li, D. Characteristics of Runoff and Sediment Load During Flood Events in the Upper Yangtze River, China. J. Hydrol. 2023, 620, 129433. [Google Scholar] [CrossRef] [Scilit]
- Chen, P.; Lu, J.; Jin, Z.; Zhou, Y.; Tang, R.; Liu, Z.; Han, Q. Spatiotemporal Evolution Characteristics and Influencing Factors of Incoming Water and Sediment in Three Gorges Reservoir. In Proceedings of PIANC Smart Rivers 2022; Lecture Notes in Civil Engineering; Springer: Singapore, 2022; Volume 264. [Google Scholar] [CrossRef] [Scilit]
- Tian, Q.; Xu, K.H.; Wang, Y.P.; Liang, C.J. Dam Impacts on Seasonality of Water and Sediment Transport in Intensively Managed River Basins: A Case Study of the Yangtze River. J. Geophys. Res. Earth Surf. 2022, 127, e2021JF006573. [Google Scholar] [CrossRef] [Scilit]
- Chai, Y.; Zhu, B.; Yue, Y.; Yang, Y.; Li, S.; Ren, J.; Xiong, H.; Cui, X.; Yan, X.; Li, Y. Reasons for the homogenization of the seasonal discharges in the Yangtze River. Hydrol. Res. 2020, 51, 470–483. [Google Scholar] [CrossRef] [Scilit]
- Yang, L.; Zeng, S.; Xia, J.; Wang, Y.; Huang, R.; Chen, M. Effects of the Three Gorges Dam on the downstream streamflow based on a large-scale hydrological and hydrodynamics coupled model. J. Hydrol. Reg. Stud. 2022, 40, 101039. [Google Scholar] [CrossRef] [Scilit]
- Yang, H.; Yang, S.; Xu, K.; Milliman, J.; Wang, H.; Yang, Z.; Chen, Z.; Zhang, C. Human impacts on sediment in the Yangtze River: A review and new perspectives. Glob. Planet. Change 2018, 162, 8–17. [Google Scholar] [CrossRef] [Scilit]
- Zhang, H.; Meng, C.; Wang, Y.; Wang, Y.; Li, M. Comprehensive evaluation of the effects of climate change and land use and land cover change variables on runoff and sediment discharge. Sci. Total Environ. 2020, 702, 134401. [Google Scholar] [CrossRef] [Scilit] [PubMed]
- Ben-Zvi, A. Laboratory examination of linearity in rainfall–runoff relationships. Hydrol. Sci. J. 2020, 65, 1794–1801. [Google Scholar] [CrossRef] [Scilit]
- Zhou, J.; Xue, D.; Yang, L.; Liu, C.; Wei, W.; Yang, X.; Zhao, Y. Quantify the impacts of climate variability and anthropogenic activities on runoff: With an improved double mass curve method. J. Geogr. Sci. 2023, 33, 2237–2256. [Google Scholar] [CrossRef] [Scilit]
- Liu, Y.; Wang, F.; Lin, Y.; Cao, L.; Zhang, S.; Ge, W.; Han, J.; Chen, H.; Shi, S. Assessing the contributions of human activities to runoff and sediment transport change: A method for break point identification in double mass curves based on model fitting. J. Hydrol. Reg. Stud. 2023, 50, 101589. [Google Scholar] [CrossRef] [Scilit]
- Wang, J.; Chi, Y.; Zhang, S.; Shi, B.; Zhang, L.; Du, C.; Li, X.; Li, B.; Yang, L.; Huang, L.; et al. Quantitative attribution of seasonal runoff variations in the Yellow River Basin under unsteady conditions using a modified Budyko framework. J. Hydrol. 2026, 675, 135588. [Google Scholar] [CrossRef] [Scilit]
- Wang, J.; Zhang, S.; Chi, Y.; Shi, B.; Li, X.; Li, B.; He, P. Divergent hydrological responses of multi-depth soil moisture variability to multiple factors on the Loess Plateau, China. J. Hydrol. 2026, 670, 135226. [Google Scholar] [CrossRef] [Scilit]
- He, M.; Guo, Q.; Wang, W.; Duan, X.; Zhong, R.; Shan, Z. Spatial and temporal heterogeneity on runoff and sediment load in the upper Yangtze River (above Yibin): A new perspective from tributaries hydrologic data. J. Hydrol. 2025, 662, 134094. [Google Scholar] [CrossRef] [Scilit]
- Peng, T.; Tian, H.; Singh, V.P.; Chen, M.; Liu, J.; Ma, H.; Wang, J. Quantitative Assessment of Drivers of Sediment Load Reduction in the Yangtze River Basin, China. J. Hydrol. 2020, 580, 124242. [Google Scholar] [CrossRef] [Scilit]
- Wu, Z.; Zhao, D.; Syvitski, J.P.; Saito, Y.; Zhou, J.; Wang, M. Anthropogenic Impacts on the Decreasing Sediment Loads of Nine Major Rivers in China, 1954–2015. Sci. Total Environ. 2020, 739, 139653. [Google Scholar] [CrossRef] [Scilit] [PubMed]
- Jiang, K.; Mo, S.; Zhang, J.; Yu, K.; Li, Z. Variation characteristics of soil erosion and their response to landscape patterns in a typical basin in the Upper Yangtze River. Front. Plant Sci. 2025, 16, 1523891. [Google Scholar] [CrossRef] [Scilit] [PubMed]
- Li, B.; Wang, Y. Impact of the Grain-for-Green Programme and climate change on the soil erosion decline in the Yangtze River, China. J. Geogr. Sci. 2024, 34, 527–542. [Google Scholar] [CrossRef] [Scilit]
- Xue, Z.; Liu, X.; Sawut, M.; Liu, J.; Zhao, X.; Xing, L.; Wang, R.; Luo, X.; Wang, C.; Zhao, H.; et al. The spatial and temporal variability and influence factor analysis of soil erosion in a grass farming area: A case study in central China. Soil Res. 2023, 62, sr23099. [Google Scholar] [CrossRef] [Scilit]
- Ma, Y.; Li, M.; Yao, H.; Chen, P.; Pan, H. Change of NDVI in the Upper Reaches of the Yangtze River and Its Influence on the Water–Sand Process in the Three Gorges Reservoir. Sustainability 2025, 17, 739. [Google Scholar] [CrossRef] [Scilit]
- Teng, M.; Huang, C.; Wang, P.; Zeng, L.; Zhou, Z.; Xiao, W.; Huang, Z.; Liu, C. Impacts of forest restoration on soil erosion in the Three Gorges Reservoir area, China. Sci. Total Environ. 2019, 697, 134164. [Google Scholar] [CrossRef] [Scilit] [PubMed]
- Fu, J.; Liu, J.; Qin, J.; Yang, L.; Zhang, Z.; Deng, Y.; Hu, Y.; Su, B. Monitoring long-term vegetation dynamics over the Yangtze River Basin, China, using multi-temporal remote sensing data. Ecosphere 2024, 15, e4809. [Google Scholar] [CrossRef] [Scilit]
- Yi, L.; Sun, Y.; Ouyang, X.; Yin, S. Identifying the Impacts of Climate Change and Human Activities on Vegetation Cover Changes: A Case Study of the Yangtze River Basin, China. Int. J. Environ. Res. Public Health 2022, 19, 6239. [Google Scholar] [CrossRef] [Scilit]
- Yan, H.; Zhang, X.; Xu, Q. Variation of runoff and sediment inflows to the Three Gorges Reservoir: Impact of upstream cascade reservoirs. J. Hydrol. 2021, 603, 126875. [Google Scholar] [CrossRef] [Scilit]
- Wang, S. Differential Changes in Water and Sediment Transport Under the Influence of Large-Scale Reservoirs Connected End to End in the Upper Yangtze River. Hydrology 2025, 12, 292. [Google Scholar] [CrossRef] [Scilit]
- Li, X.; Ren, J.; Xu, Q.; Yuan, J.; Zhang, W. Impact of cascade reservoirs on the delayed response behaviour of sedimentation in the Three Gorges Reservoir. J. Geogr. Sci. 2023, 33, 576–598. [Google Scholar] [CrossRef] [Scilit]
- Ren, J.; Zhao, M.; Zhang, W.; Xu, Q.; Yuan, J.; Dong, B. Impact of the construction of cascade reservoirs on suspended sediment peak transport variation during flood events in the Three Gorges Reservoir. CATENA 2020, 188, 104409. [Google Scholar] [CrossRef] [Scilit]
- Li, B.; Chen, S.; Zhang, P.; Luo, K.; Zhang, C.; Wang, C.; Wang, Y. Sensitivity and complexity of the Yangtze River’s sediment dynamics. Int. J. Sediment Res. 2026, 41, 422–431. [Google Scholar] [CrossRef] [Scilit]
- Best, J. Anthropogenic stresses on the world’s big rivers. Nat. Geosci. 2019, 12, 7–21, Erratum in Nat. Geosci. 2019, 12, 148. [Google Scholar] [CrossRef] [Scilit]
- Ma, Y.; Chai, Y.; Xu, Y.J.; Li, Z.; Zheng, S. Spatial and Temporal Changes of Sand Mining in the Yangtze River Basin since the Establishment of the Three Gorges Dam. Int. J. Environ. Res. Public Health 2022, 19, 16712. [Google Scholar] [CrossRef] [Scilit] [PubMed]
- Rentier, E.S.; Cammeraat, L.H. The environmental impacts of river sand mining. Sci. Total Environ. 2022, 838, 155877. [Google Scholar] [CrossRef] [Scilit] [PubMed]
- Liang, Y.; Chen, X.; Dong, J.; Wang, J. Impact of Progressive Reservoir Construction on Nonstationary Sediment Load Response to Streamflow in the Upper Yangtze River, China. J. Hydrol. Eng. 2024, 29, 05024003. [Google Scholar] [CrossRef] [Scilit]
- Wang, H.; Ma, Y.; Hong, F.; Yang, H.; Huang, L.; Jiao, X.; Guo, W. Evolution of Water–Sediment Situation and Attribution Analysis in the Upper Yangtze River, China. Water 2023, 15, 574. [Google Scholar] [CrossRef] [Scilit]
- Yang, H.; Huang, W.; Qi, Z.; Cheng, G.; Cai, Y. Attribution Analysis of Water-Sediment Nexus Changes for the Fluctuating Backwater Zone of the Three Gorges Reservoir Under Changing Environmental Conditions. River Res. Appl. 2025, 41, 1255–1269. [Google Scholar] [CrossRef] [Scilit]
- Zhang, X.-F.; Yan, H.-C.; Yue, Y.; Xu, Q.-X. Quantifying natural and anthropogenic impacts on runoff and sediment load: An investigation on the middle and lower reaches of the Jinsha River Basin. J. Hydrol. Reg. Stud. 2019, 25, 100617. [Google Scholar] [CrossRef] [Scilit]

Disclaimer/Publisher’s Note: The statements, opinions and data contained in all publications are solely those of the individual author(s) and contributor(s) and not of MDPI and/or the editor(s). MDPI and/or the editor(s) disclaim responsibility for any injury to people or property resulting from any ideas, methods, instructions or products referred to in the content. |
© 2026 by the authors. Licensee MDPI, Basel, Switzerland. This article is an open access article distributed under the terms and conditions of the Creative Commons Attribution (CC BY) license.