


Abstract
Forest fires significantly disturb the global ecosystem, profoundly impacting carbon cycling, biodiversity, and socio-economic sustainability. Understanding the seasonal patterns of forest fire occurrence is crucial for developing effective prevention and control strategies that support sustainable forest management and disaster risk reduction. However, research on the seasonal dynamics of forest fires in the tropical forests of China’s Hainan Island remains scarce, and the underlying driving mechanisms, particularly in relation to the distinct dry and rainy seasons, are still insufficiently understood. In this study, we analyzed the seasonal patterns and driving factors of forest fires on Hainan Island, a tropical region, from 2000 to 2022, and compared the applicability of emerging machine learning algorithms and traditional Logistic Regression algorithms in constructing tropical forest fire prediction models for the dry and rainy seasons. The results show that tropical forest fires in Hainan Island are primarily concentrated from January to May, peaking in April, with a lagged effect relative to the dry-season months (November to April of the following year). Average temperature and average rainfall were identified as common important predictors of fire occurrence probability in both seasons, with the Normalized Difference Vegetation Index additionally included in only the dry season. The predictive accuracy of the Random Forest model consistently surpassed that of the traditional Logistic Regression model in both seasons. Additionally, our models enable the generation of accurate forest fire probability maps, highlighting risk areas in Hainan Island during both seasons and providing new insights for wildfire prevention strategies and sustainable forest management in tropical regions.
1. Introduction
Tropical forests cover approximately 45% of the global forest area (about 1.8 billion hectares) and are among the most biologically diverse and productive land ecosystems on the planet. They support more than half of the world’s plant and animal species and generate over one-third of global oxygen production [1,2,3]. Wildfires are a destructive hazard and are among the greatest threats to tropical forests, causing significant damage to human life and property while disrupting ecosystem balance and threatening the socio-economic sustainability of forest-dependent communities. This is evidenced by the severe forest fires recently witnessed in the Amazon, the Caribbean, Madagascar, and Southeast Asia [4,5,6,7,8]. Recent studies have further underscored the role of tropical forest fires in the global carbon cycle, highlighting their negative contribution to exacerbating global climate change [9,10]; for instance, the rapid release of carbon during fires can lead to sharp increases in atmospheric carbon dioxide concentrations in some regions, significantly impacting the global carbon budget and intensifying climate warming [11,12,13,14]. With the intensification of global warming and the frequent expansion of human activities, studies predict a further increase in the likelihood of forest fires in tropical regions [15,16]. Therefore, preventing forest fires can help tropical forest ecosystems cope with climate change, maintain ecological equilibrium, and reduce threats to human life and property.
The occurrence and spread of these destructive fires are influenced by a combination of factors, including meteorological conditions, vegetation characteristics, topography, and human activities [17,18]. Climatic influences operate at larger regional scales, whereas vegetation, topography, and human activities function at more localized levels [19]. Research has established a direct link between warming trends and the lengthening of fire seasons [20,21,22]; in particular, increased temperatures accelerate evaporation, causing vegetation and litter to lose more moisture, thereby enhancing their combustibility [23,24]. Regarding vegetation, studies show significant differences in the fuel loads provided by different plant communities [25,26]. Furthermore, vegetation continuity and density affect fuel connectivity, influencing the speed and scale of fire spread [27]. Topography affects fire propagation in a complex manner by influencing wind speed and direction. Mountains and valleys can accelerate airflow, causing flames to spread rapidly in specific directions [28]. Moreover, the terrain slope influences differences in fire movement uphill or downhill, with uphill fires typically spreading faster [29]. The influence of human activities is equally significant; for example, the expansion of flammable tree species plantations and the reduction in forest firebreak density can increase forest fire risk [30,31].
Recent studies have suggested that climatic and vegetation drivers of tropical forest fires may vary between seasons due to changes in temperature and precipitation, significantly affecting fire initiation and development [32,33]. In Guangxi, China, Xu et al. observed that forest fires were mainly concentrated from November to February, and they identified relative humidity as the most important factor affecting forest fire probability, although land surface temperature, wind speed, and human activities also had significant effects [34]. In the western Himalayan region, Charak et al. found that forest fire occurrence showed obvious seasonal variation from February to June, driven by climatic indicators, topographic features, and anthropogenic factors [35]. In northern Vietnam, Trang et al. reported that most forest fires occurred at the end of the dry season (February to April), with mean temperature, elevation, and distance to roads being important influencing factors [36]. Therefore, tropical forest fire susceptibility patterns show pronounced seasonal differences, but conclusions regarding the driving factors behind these seasonal occurrence patterns remain inconsistent. Moreover, most studies still use fire occurrence datasets at the annual scale to elucidate the driving effects on tropical forest fire susceptibility, without separately considering the differences in driving factors between the dry and rainy seasons or exploring the mechanisms of tropical forest fire occurrence in each season. This gap limits our comprehensive understanding of tropical forest fire occurrence patterns and their seasonal differences in driving factors.
Hainan Island, a tropical island in southern China, is not only a vital area for biodiversity conservation but also a significant component of the global tropical forest ecosystem. However, forest fires have always threatened the forest resources and the safety of human life and property on this island [37]. The local government attaches great importance to forest fire prevention and management, and has established an official forest fire danger rating system; however, this system is still managed using a general model and lacks a seasonally dynamic forest fire prediction model. Hainan Island has a relatively high forest coverage rate (62%). Its seasonal climatic characteristics, diverse landforms (mountains, hills, tablelands, and plains), and intensive human activities make it an ideal location for studying the seasonal occurrence patterns and driving factors of tropical forest fires.
Therefore, in this study, we propose the following hypotheses: (1) the number of forest fires on Hainan Island differs significantly between the dry and rainy seasons; and (2) the dominant driving factors and their relative importance differ significantly between the dry and rainy seasons. To test these hypotheses, we employ an integrated approach combining remote sensing monitoring and ground surveys (to mitigate the limitations in data accuracy associated with using remote sensing alone) to analyze the patterns of forest fire occurrence on Hainan Island during the dry and rainy seasons over the past two decades (2000–2022). We utilize both Logistic Regression and Random Forest models to construct separate forest fire prediction models for the rainy and dry seasons. To understand the drivers of tropical forest fires, we employ the Mean Decrease in Gini index from the Random Forest model to calculate driver importance and use Partial Dependence Plots (PDPs) to elucidate the underlying fire mechanisms. These plots illustrate how fire data relate to other features. The results of this study can contribute substantially to the local official forest fire danger rating system and provide government management personnel with new insights for the early warning, monitoring, and management of tropical forest fires.
2. Materials and Methods
2.1. Study Area
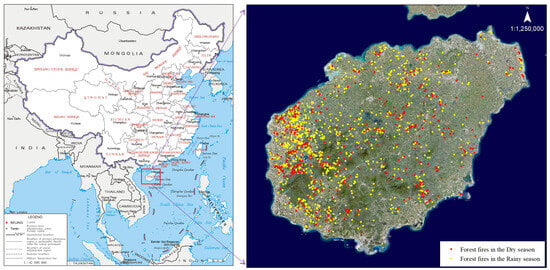
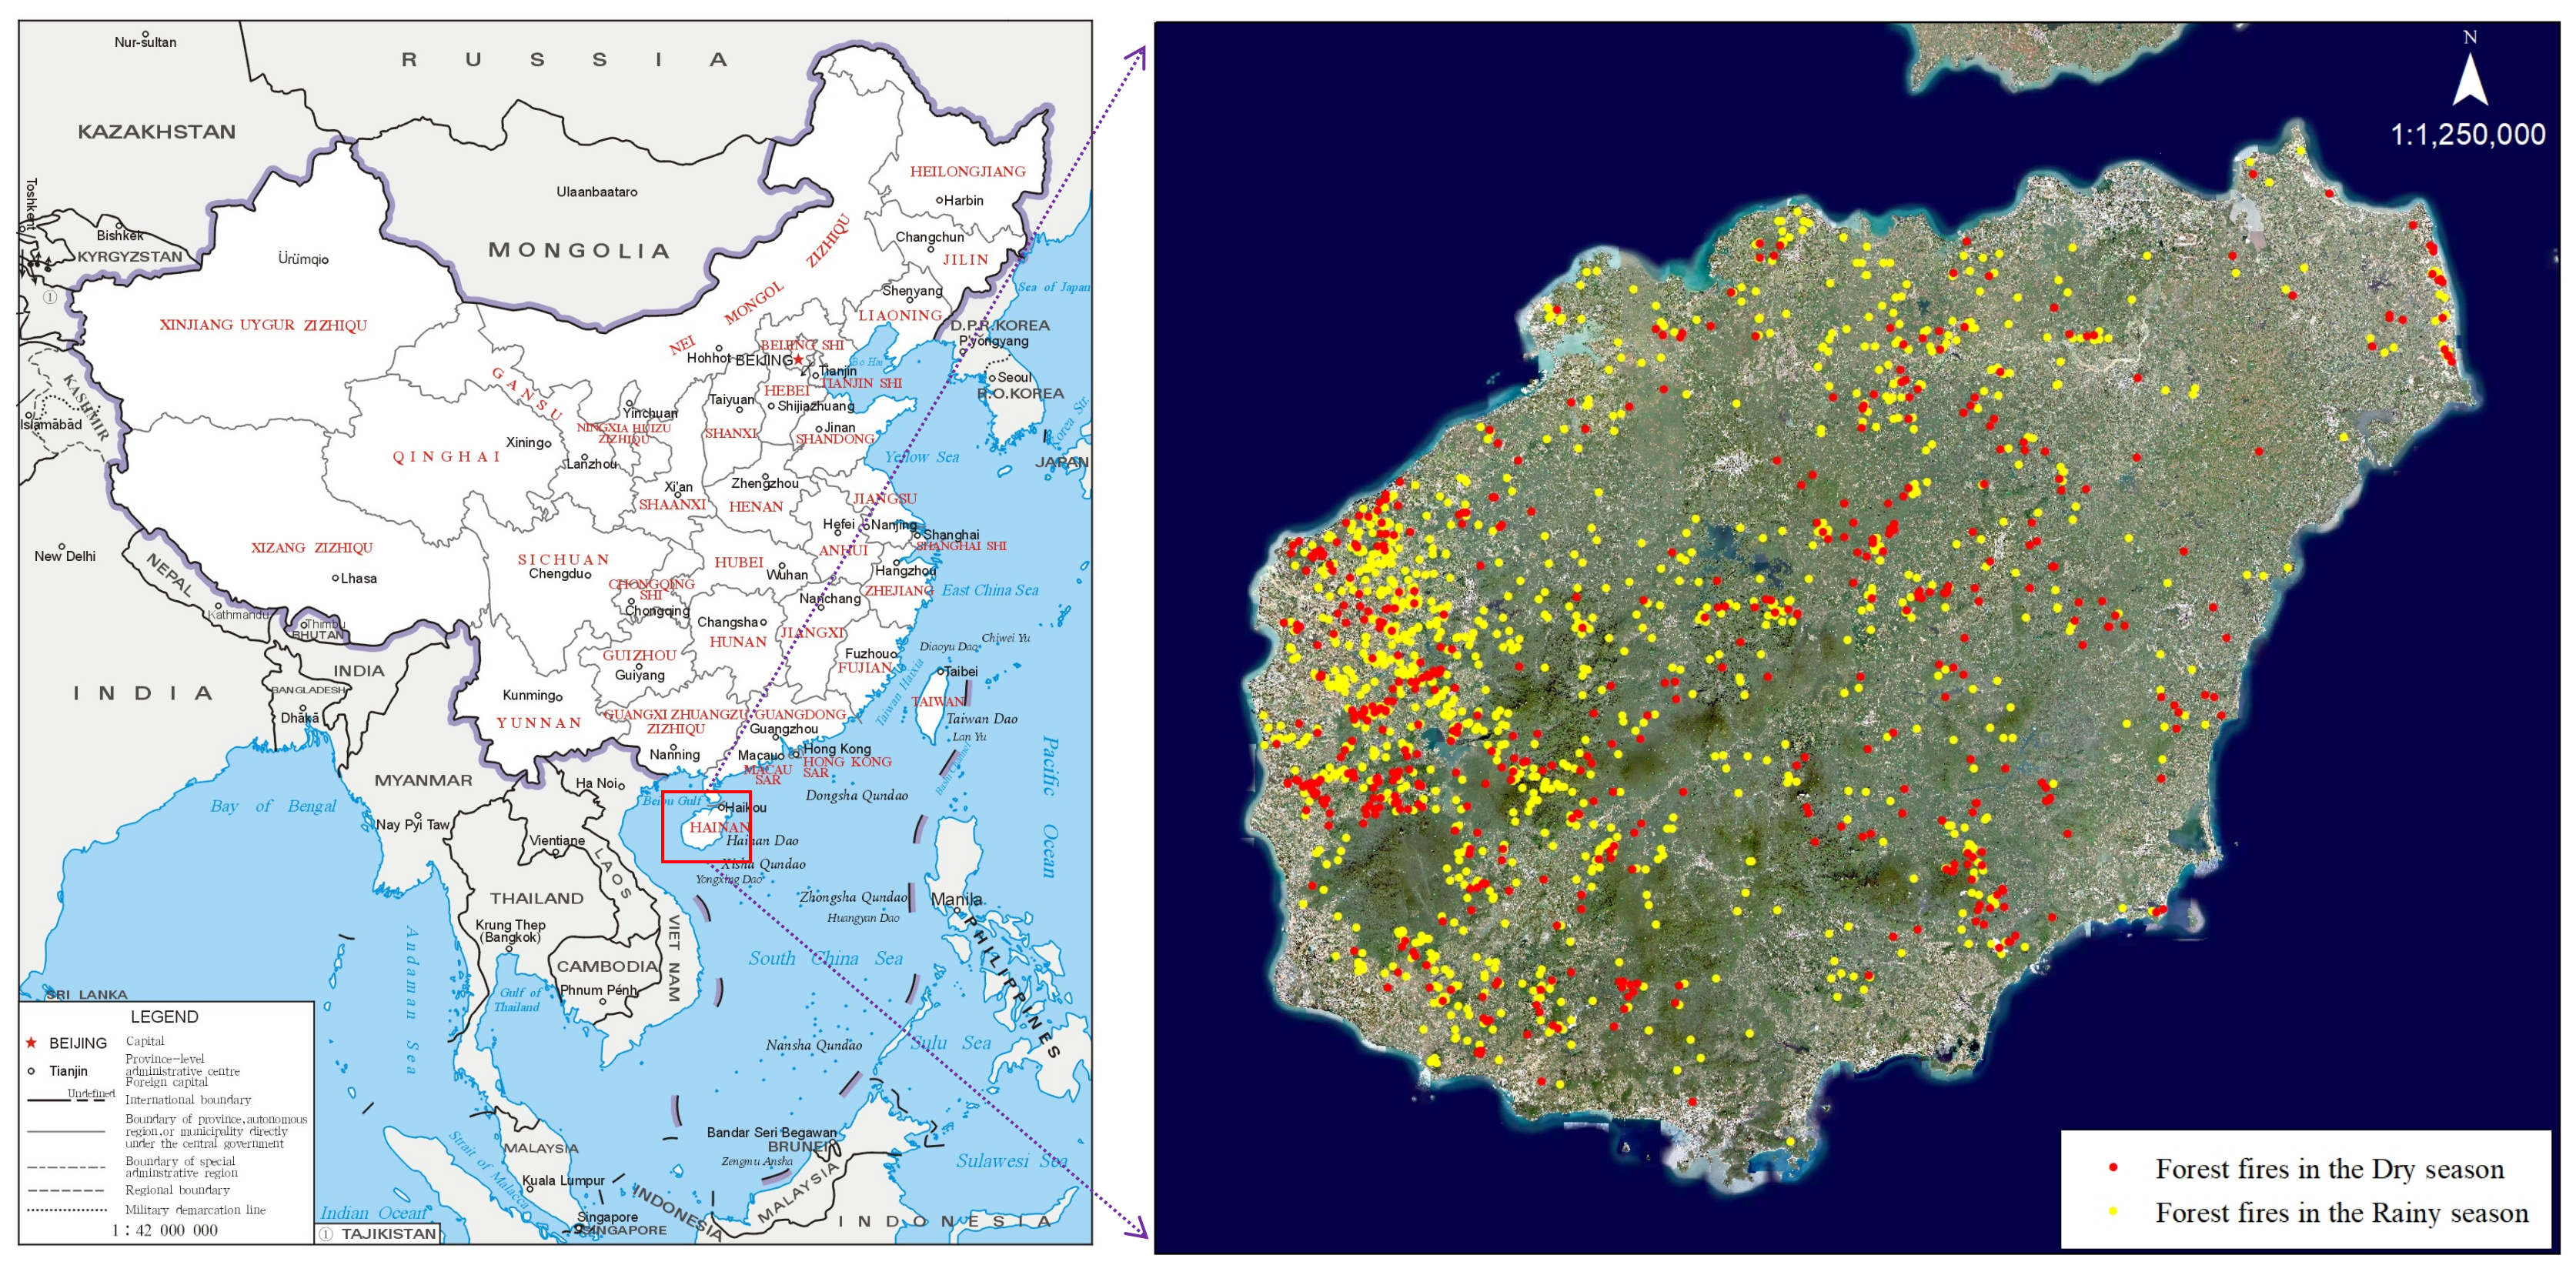
Hainan Island lies in the northwest of the South China Sea (Figure 1), with geographical coordinates of 18.80 to 20.10° N and 108.37° to 111.03° E, covering a total area of approximately 33,900 km2. The island’s topography is characterized by a concentric, layered structure that is higher in the center and lower towards the periphery, encompassing mountains, hills, terraces, and plains. Hainan Island experiences a tropical monsoon marine climate with distinct dry and rainy seasons. The rainy season typically lasts from May to October, receiving about 1500 mm of rainfall, which accounts for 70% to 90% of the annual total. The dry season extends from November to April of the following year, contributing only 10% to 30% of the annual precipitation. The mean annual temperature on Hainan Island ranges from 22.5 °C to 25.6 °C. January is the coldest month, with an average temperature of around 16.5 °C in the central mountainous region, representing the island’s minimum, while July is the hottest month, with an average temperature reaching 29.2 °C in Dongfang City in the west, the highest on the island. Hainan Island boasts extensive forest coverage, diverse forest types (including tropical rainforests, mangrove forests, timber forests, and economic forests), and rich biological resources. The forest area is approximately 21,976 km2, with an estimated forest stock volume of about 161.13 million cubic meters. Local authorities place significant emphasis on forest fire prevention and control, establishing an official forest fire early warning network. Legislation also designates the forest fire prevention period for the region from 1 December to 31 May of the following year, with the high-risk period for forest fires set from 1 March to 31 May annually.
Figure 1.
Location of the study area (Hainan Island) and seasonal distribution of forest fires from 2000 to 2022.
2.2. Forest Fire Data
All statistical data for forest fires occurring on Hainan Island from 2000 to 2022 were provided by the Forestry Department of Hainan Province (FDHP). After each fire incident, FDHP personnel employed handheld GPS units (UniStrong, Beijing, China) to document the fire location, including both the vector boundary and the central coordinates of the burned area.
Additionally, to supplement potentially missed fire records, we downloaded MODIS (Moderate Resolution Imaging Spectroradiometer, NASA, Washington, DC, USA) fire location data (2000–2022) from NASA (https://earthdata.nasa.gov/earth-observation-data/near-real-time/firms/active-fire-data, accessed on 15 September 2025). Data from this source have been established as a suitable and reliable resource for wildfire monitoring. From the MODIS data, we only considered fires classified as vegetation fires (type field = 0). To ensure high reliability, we filtered out fire points with a confidence value below 80%. Furthermore, to avoid incorrectly including active fire sources from non-forest land, we excluded fires occurring on agricultural land, water bodies, industrial areas, etc., based on raster-classified land use types.
We compared the two datasets and prioritized using the FDHP fire point data, compiling a comprehensive forest fire point dataset for Hainan Island spanning the past two decades (2000–2022). This dataset consists of 1536 fire points, of which 744 were derived from FDHP and 792 from MODIS. Fire points were categorized into dry season (November–April of the following year) and rainy season (May–October) datasets based on their month of occurrence (Figure 1). To improve the model’s ability to distinguish between fire points and non-fire points, we randomly generated an equal number of non-fire points in areas beyond 10 km from the center of all fire points [38]. In total, the wildfire dataset contained 3072 sample points. To evaluate model accuracy, the overall data was split into training (70% of fire points) and validation (30% of fire points) samples.
2.3. Forest Fire Drivers
2.3.1. Seasonal Wildfire Drivers
Climatic and vegetation factors are considered seasonal wildfire drivers due to their significant variation between seasons [39,40]. The meteorological data for this study were sourced from weather stations on Hainan Island and the National Earth System Science Data Sharing Infrastructure. This dataset includes monthly observations of average temperature, wind speed, and precipitation, as well as relative humidity. We performed spatial interpolation on the collected meteorological data using ArcGIS (v10.8.1) and extracted corresponding meteorological information for each forest fire location. To investigate the influence of intra-annual variations in seasonal drivers on cross-seasonal wildfires, we subdivided each driver by season and extracted its value separately for each season (Table 1).
Table 1.
Data used in this study.
The Normalized Difference Vegetation Index (NDVI), which accounts for varying vegetation conditions across seasons, is the most commonly used indicator of vegetation cover and growth status, representing fuel load [41,42,43]. We extracted the maximum NDVI value for each season from the raster data to construct four sub-variables. The NDVI data were downloaded from the National Earth System Science Data Center and consist of monthly composites from the MODIS MOD13A2 product. All of these variables were averaged quarterly from 2000 to 2022 to capture long-term seasonal differences in wildfire drivers.
2.3.2. Non-Seasonal Wildfire Drivers
Topographic factors play an important role in influencing wildfire occurrence and spread, especially in mountainous areas [44]. Elevation, slope, and aspect influence the quantity and structure of vegetation fuels, as well as the likelihood of anthropogenic ignition sources, all of which are closely related to wildfire occurrence [45]. In this study, the elevation, slope, and aspect indices for each grid cell were derived from a Digital Elevation Model (DEM) dataset and used directly in the modeling process.
Given the growing impact of human activities on wildfires, it is increasingly necessary to incorporate anthropogenic factors as wildfire drivers [46]; in this study, they are primarily socio-economic, and include distance to roads and distance to settlements. The distance from each grid cell to a road was calculated as the Euclidean distance based on actual road networks obtained from OpenStreetMap (OSM). As an important open-access global spatial database, OSM offers higher positional accuracy compared to other publicly available datasets [47]. Furthermore, considering that forest wildfires are often associated with areas of frequent human activity, settlement rasters were extracted from 2020 land use type data, and the Euclidean distance from each grid cell to the nearest settlement was then calculated.
2.4. Development of Forest Fire Risk Prediction Models and Accuracy Assessment
2.4.1. Traditional Statistical Modeling
We applied a traditional Logistic Regression model to estimate the likelihood of fire occurrence as influenced by multiple drivers. Prior to model development, multicollinearity among the predictor variables (independent variables) was addressed. First, Pearson correlation coefficients were calculated between all pairs of driving factors. For any pair showing a high correlation (|R| > 0.75), one factor was removed to mitigate redundancy.
Subsequently, the Variance Inflation Factor (VIF) was used to further assess the presence of multicollinearity among the remaining independent variables, calculated as follows:
For model construction, only variables with VIF ≤ 10 and Pearson correlation coefficient < 0.75 were selected [48].
We assigned a value of 1 to grid cells where a fire occurred and a value of 0 to cells with no fire. For a given location, the probability of fire is denoted by P, and the probability of no fire is therefore 1 − P. Using the probability of forest fire occurrence as the binary dependent variable, the Logistic Regression model is formulated as follows:
In the equation, denotes the driving factors that affect forest fire points on Hainan Island, denotes the probability of forest fire occurrence, is the constant (intercept), and are the coefficients associated with each driver in the Logistic Regression model. The Logistic Regression model was implemented using the “caTools” package in the RStudio 4.3.1 software.
2.4.2. Machine Learning Modeling
Random Forest (RF) is an ensemble learning technique that builds upon decision trees for classification and regression [49]. The model operates by creating multiple decision trees through the random selection of bootstrap samples, obtaining a prediction from each tree. The split at each node within a tree is determined using a random subset of the predictor variables. The final output is an aggregation of the results from all individual trees. This algorithm addresses the instability associated with using a single classification tree, thereby improving prediction accuracy and delivering superior performance in wildfire susceptibility modeling.
To achieve optimal model performance, we tuned the “ntree” parameter (number of trees in the forest) and the “mtry” parameter (number of variables randomly sampled as candidates at each split). The tuning process involved iterating over “mtry” values starting from 2 with an increment of 2, combined with five different “ntree” values: 100, 200, 300, 400 and 500, and 1000. Ultimately, the combination of “mtry” and “ntree” values that yielded the highest model accuracy was selected for constructing the final Random Forest model. These procedures were implemented using the “randomForest” R package.
2.5. Model Accuracy Assessment
First, we employed 10-fold cross-validation for the evaluation of model performance. Specifically, this step aimed to compare the performance of the Logistic Regression and Random Forest models to identify the optimal model for this study. During the model construction phase using the training samples, we assessed the models using Precision, Accuracy, Recall (Sensitivity), and the F1-Score. Precision refers to the share of predicted wildfires that are actual wildfires. Recall represents the proportion of actual wildfires that are correctly predicted as wildfires. Specificity is the ratio of actual non-wildfires that are correctly predicted as non-wildfires. The F1-Score balances Precision and Recall, providing a measure of the model’s overall effectiveness in predicting wildfires. Finally, Accuracy evaluates the overall correctness of the model’s predictions, providing a comprehensive assessment of its performance.
We further validated the model accuracy by plotting the Receiver Operating Characteristic (ROC) curve using the 30% validation fire sample. The Area Under the Curve (AUC), obtained from this curve, reflects the model’s ability to discriminate. The AUC, which can be conceptualized as the definite integral under the ROC curve, yields a value between 0.5 and 1. Specifically, an AUC of 0.5–0.7 denotes poor performance, 0.7–0.8 acceptable, 0.8–0.9 high accuracy, and >0.9 excellent performance [50]. The plotting and calculation of the ROC curve were implemented using the “pROC” package in the RStudio 4.3.1 software.
2.6. Driver Importance Ranking Method
The Mean Decrease in Gini index and Partial Dependence Plots (PDPs) were used to quantify and interpret the importance of drivers. After obtaining the optimal Random Forest model, feature importance was calculated to visualize the factors that most and least significantly influenced forest fire occurrence. The most important features were determined based on their significance in the model. Subsequently, PDPs were plotted to elucidate the relationship between these features and the model’s predictions. The generation of driver importance rankings and PDPs was implemented using the “randomForest” and “pdp” packages in the RStudio 4.3.1 software.
2.7. Forest Fire Hazard Classification
Forest fire hazard values for Hainan Island were calculated using both the Logistic Regression and the Forest models. The resulting probability values were classified into three hazard levels according to China’s national forest fire risk regionalization system. To maintain simplicity and comparability across seasons and models, equal intervals of the predicted probability range (0–1) were applied.
Zone I represents areas with a forest fire probability ranging from 0.00 to 0.33, classified as a low-susceptibility (low-hazard) zone where fire occurrence is unlikely.
Zone II corresponds to a probability range of 0.34 to 0.66, defined as a moderate-susceptibility (moderate-hazard) zone.
Zone III, with a probability range of 0.67 to 1.00, is categorized as a high-susceptibility (high-hazard) zone where the likelihood of fire occurrence is substantially greater.
3. Results
3.1. Seasonal Variation Characteristics of Forest Fires
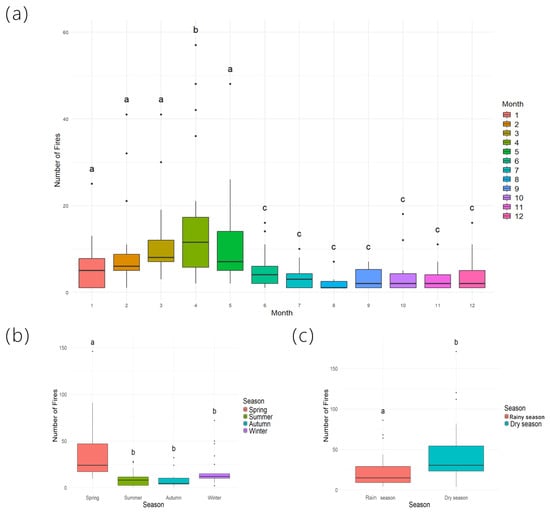
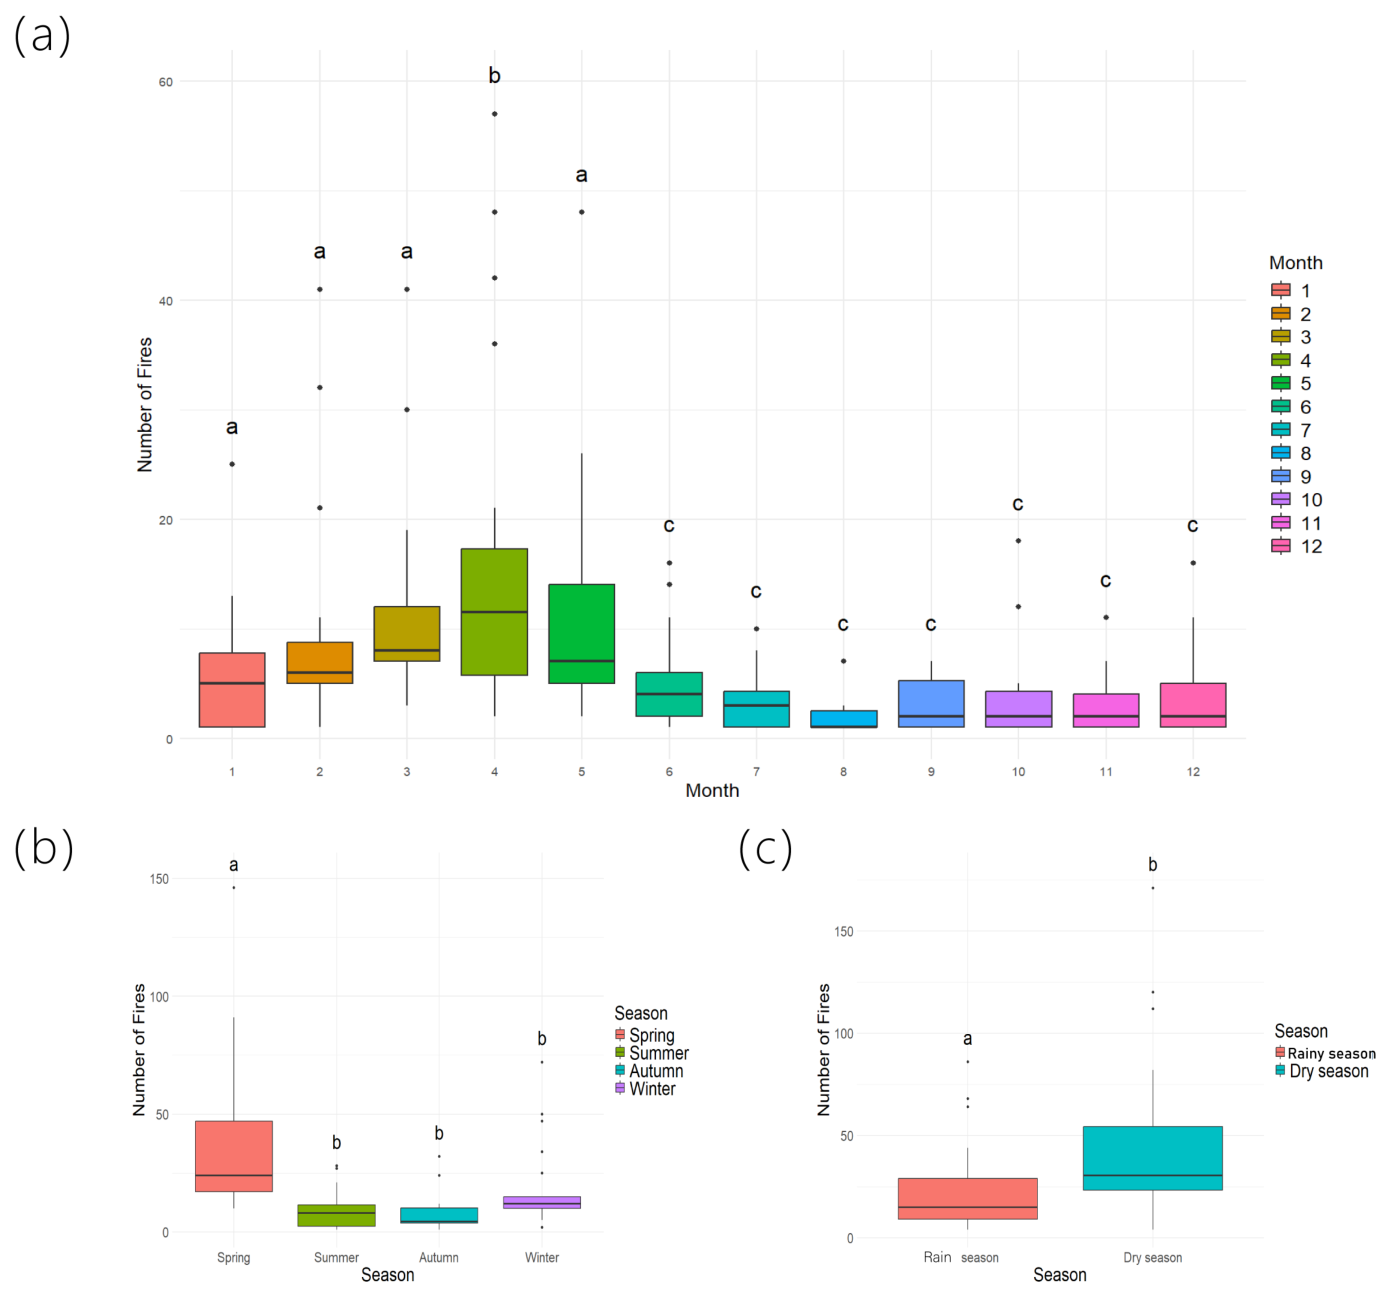
During the period from 2000 to 2022, forest fires on Hainan Island were predominantly concentrated from January to May, with the number of occurrences being significantly higher in these months compared to others. April recorded the highest number of forest fires (Figure 2a). We identified a lagged effect between the main fire occurrence months on Hainan Island and the typical dry-season months (November to April of the following year), with the peak fire period generally delayed by 1 to 2 months. When analyzing the distribution of fire counts across the four seasons (spring, summer, autumn, and winter), we found that spring had the highest number of fires, significantly exceeding the counts in the other three seasons. No significant difference was observed in fire occurrence among the other three seasons (Figure 2b). Furthermore, we categorized the seasonal fire occurrence patterns on Hainan Island into dry- and rainy-season modes. A one-way analysis revealed a significant difference in the number of forest fires between these two periods, with the dry season recording a significantly higher fire count than the rainy season (Figure 2c).
Figure 2.
Temporal distribution of forest fire counts on Hainan Island from 2000 to 2022, illustrated at monthly (a), four-seasonal (b), and two-seasonal (dry vs. rainy) (c) scales. Within the same figure, different lowercase letters indicate significant differences among variables at the 95% confidence level.
3.2. Forest Fire Prediction Models and Accuracy Assessment
An analysis of the interrelationships among the driving factors (Figure S1) indicated that all Pearson correlation coefficients were below 0.75, and all Variance Inflation Factor (VIF) values were less than 10. These results confirm the absence of multicollinearity among the selected factors, qualifying them for the subsequent model fitting procedures.
Accounting for the seasonal variation in forest fire occurrence, we developed separate probability models for the dry season and the rainy season within the study area (Table 2 and Table 3). Table 4 details the training performance metrics for both the Logistic Regression and Random Forest models. Across both the dry and rainy seasons, the Random Forest model demonstrated superior performance, achieving higher scores than the Logistic Regression model in Accuracy, Recall, Precision, and the F1-Score.
Table 2.
Optimal parameters for the Logistic Regression model. Significance levels are indicated as follows: * denotes significance at the 95% confidence level; ** denotes significance at the 99% confidence level; “ns” indicates not significant.
Table 3.
Hyperparameter ranges and best hyperparameters for the Random Forest model.
Table 4.
Calculation results of model accuracy evaluation metrics.
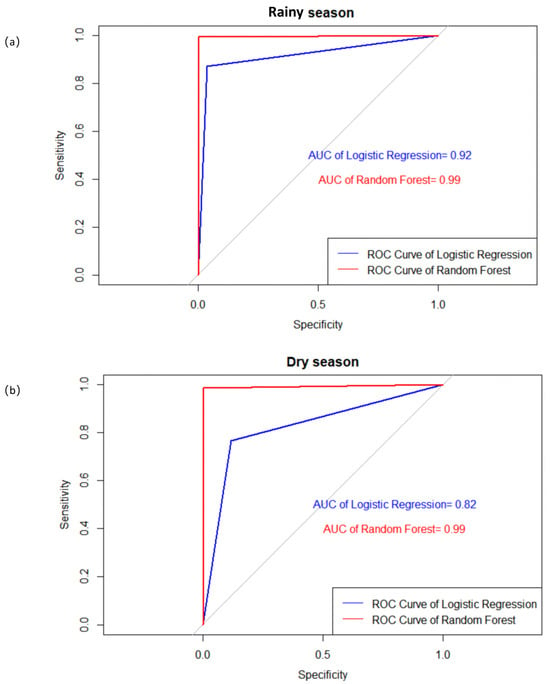
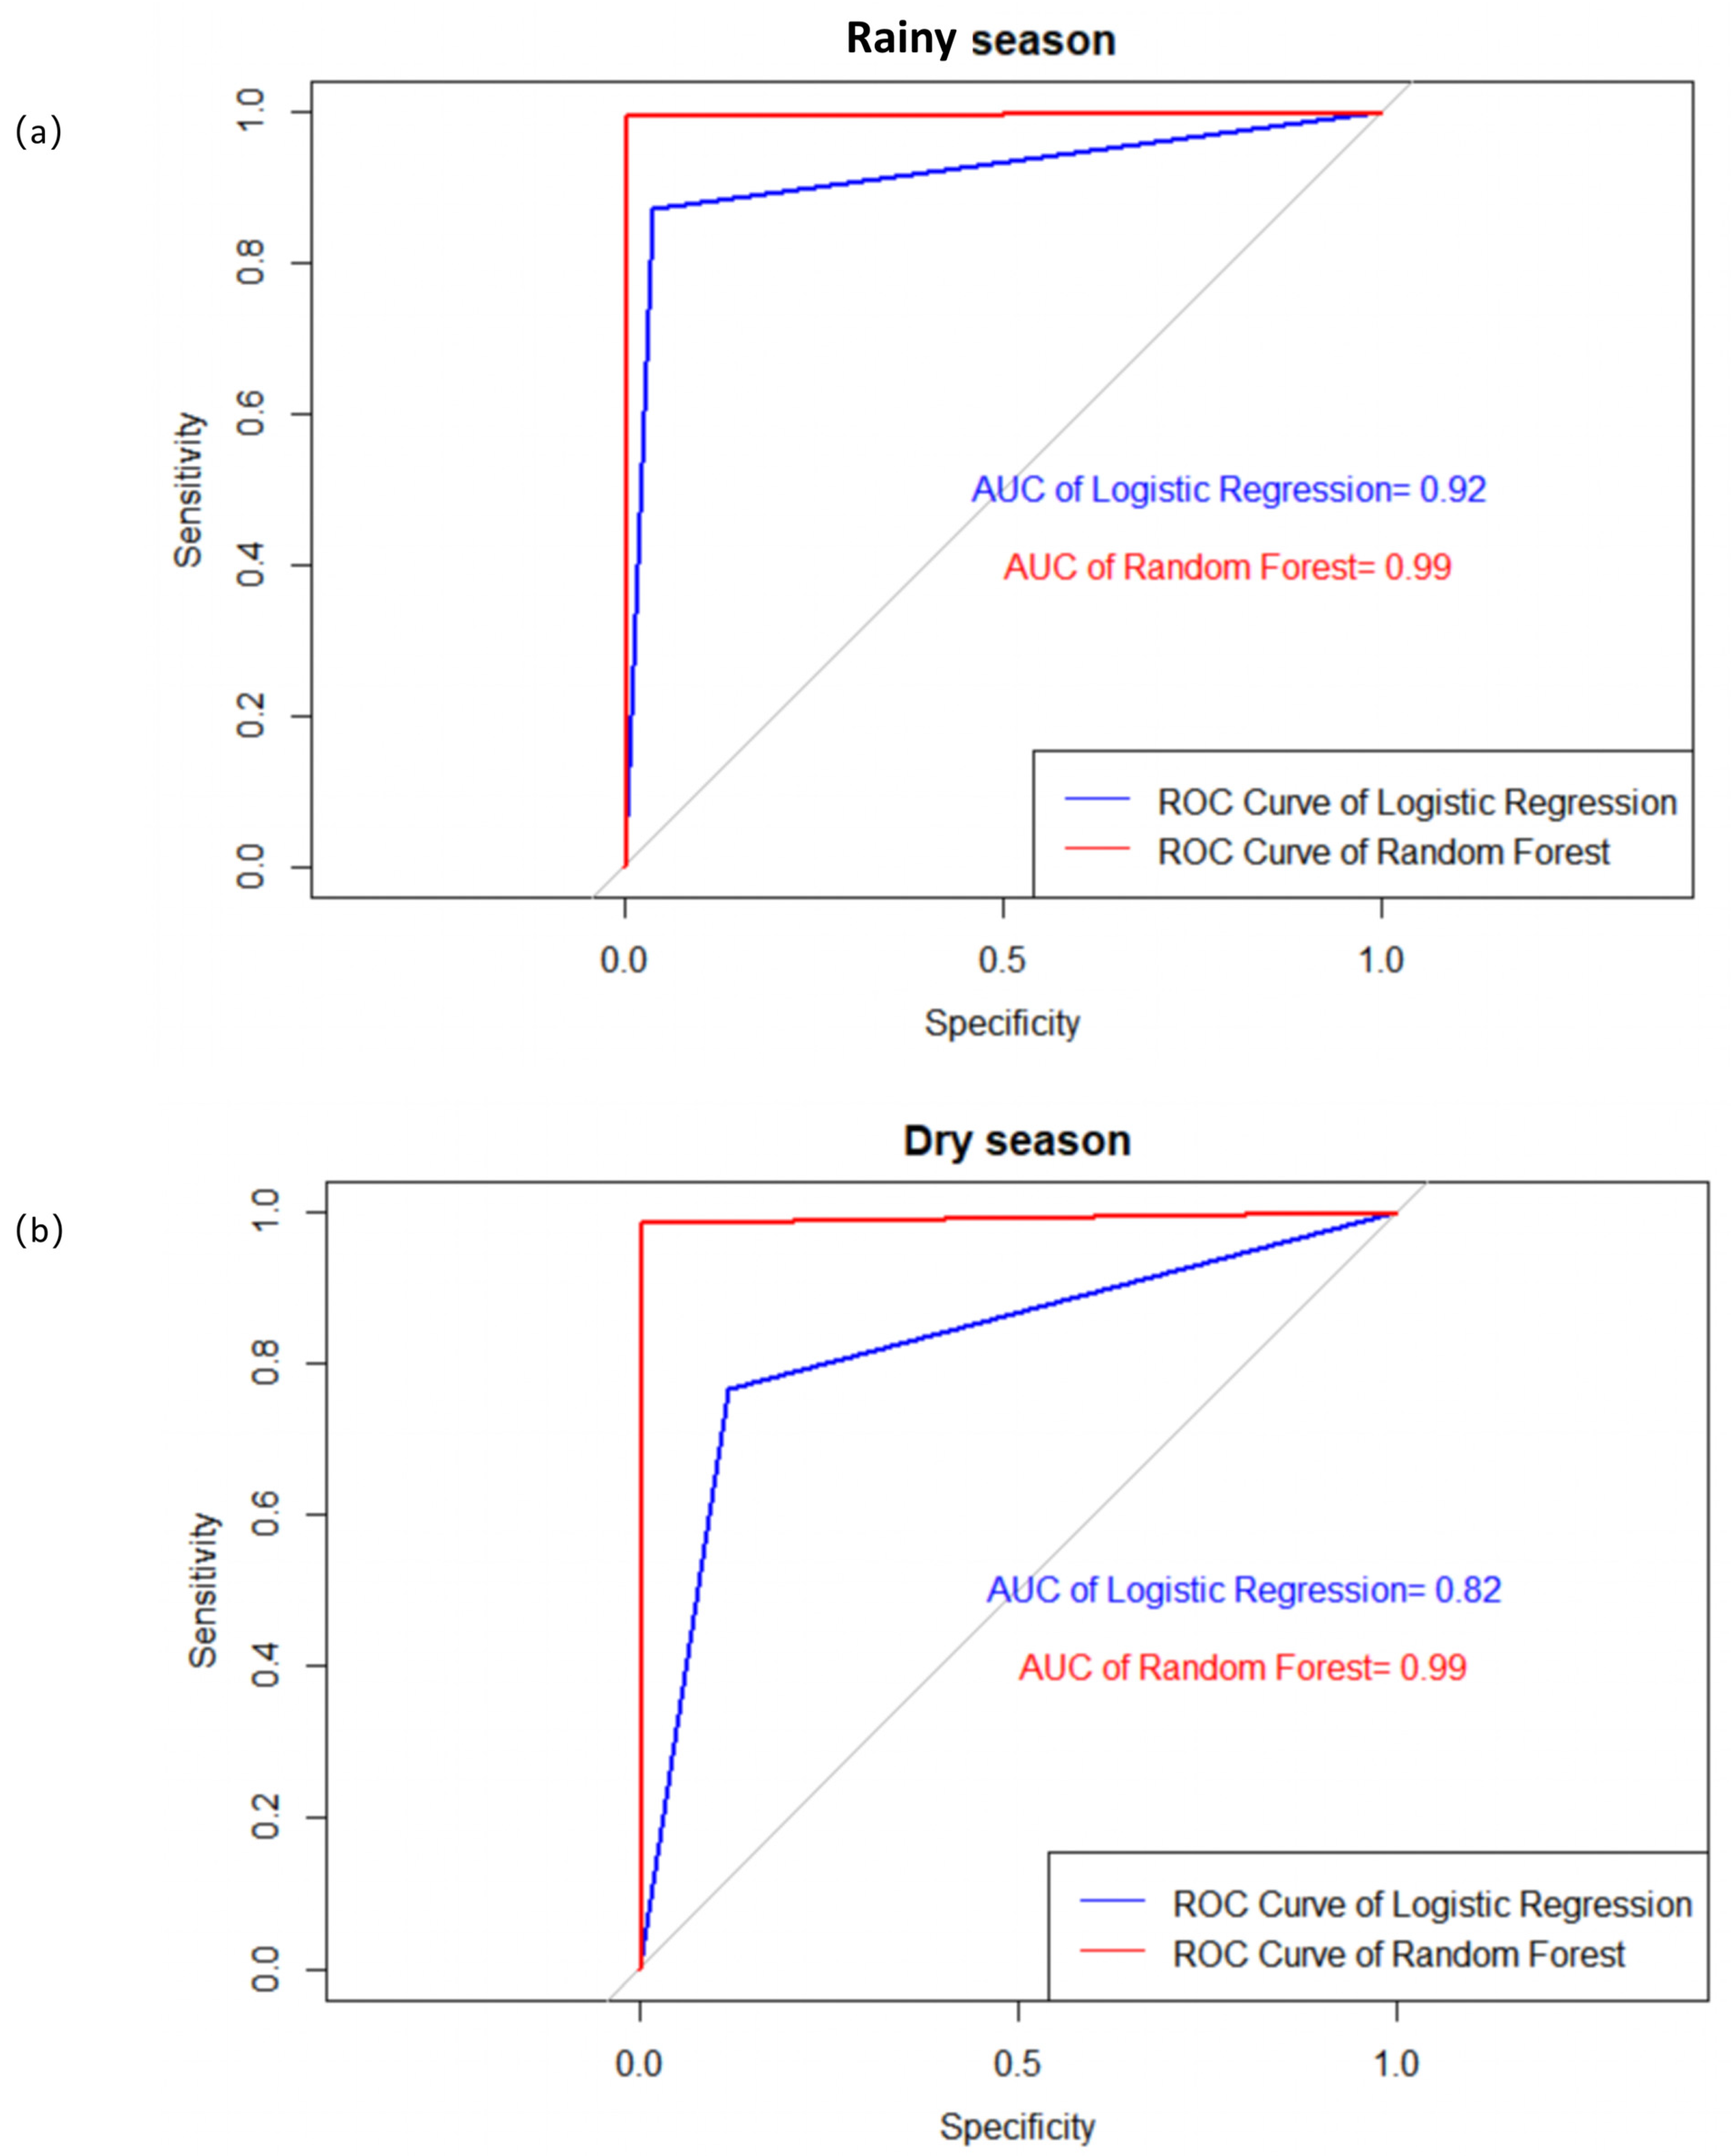
During the rainy season, both models attained Area Under the Curve (AUC) values exceeding 0.9, indicating very high predictive accuracy (Figure 3a). In the dry season, the Logistic Regression model yielded an AUC of 0.82, which was lower than the Random Forest model’s AUC of 0.99 (Figure 3b). Notably, all models produced AUC values greater than 0.8, indicating good overall performance in predicting forest fire occurrence. Among these, the Random Forest model consistently demonstrated the highest predictive capability for both seasons.
Figure 3.
ROC curves of the predictive models on the test set during the (a) rainy and (b) dry seasons. The gray diagonal line represents the random classifier (AUC = 0.5).
3.3. Variable Importance of Drivers by Season
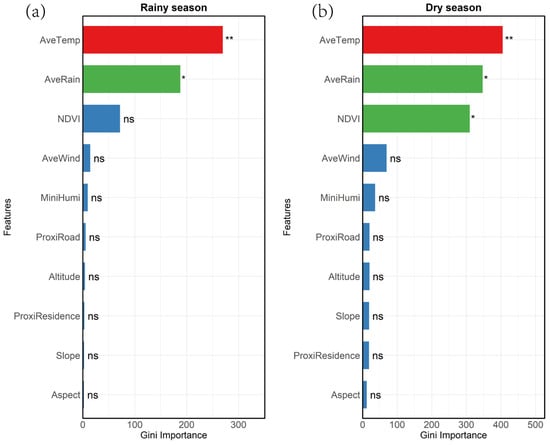
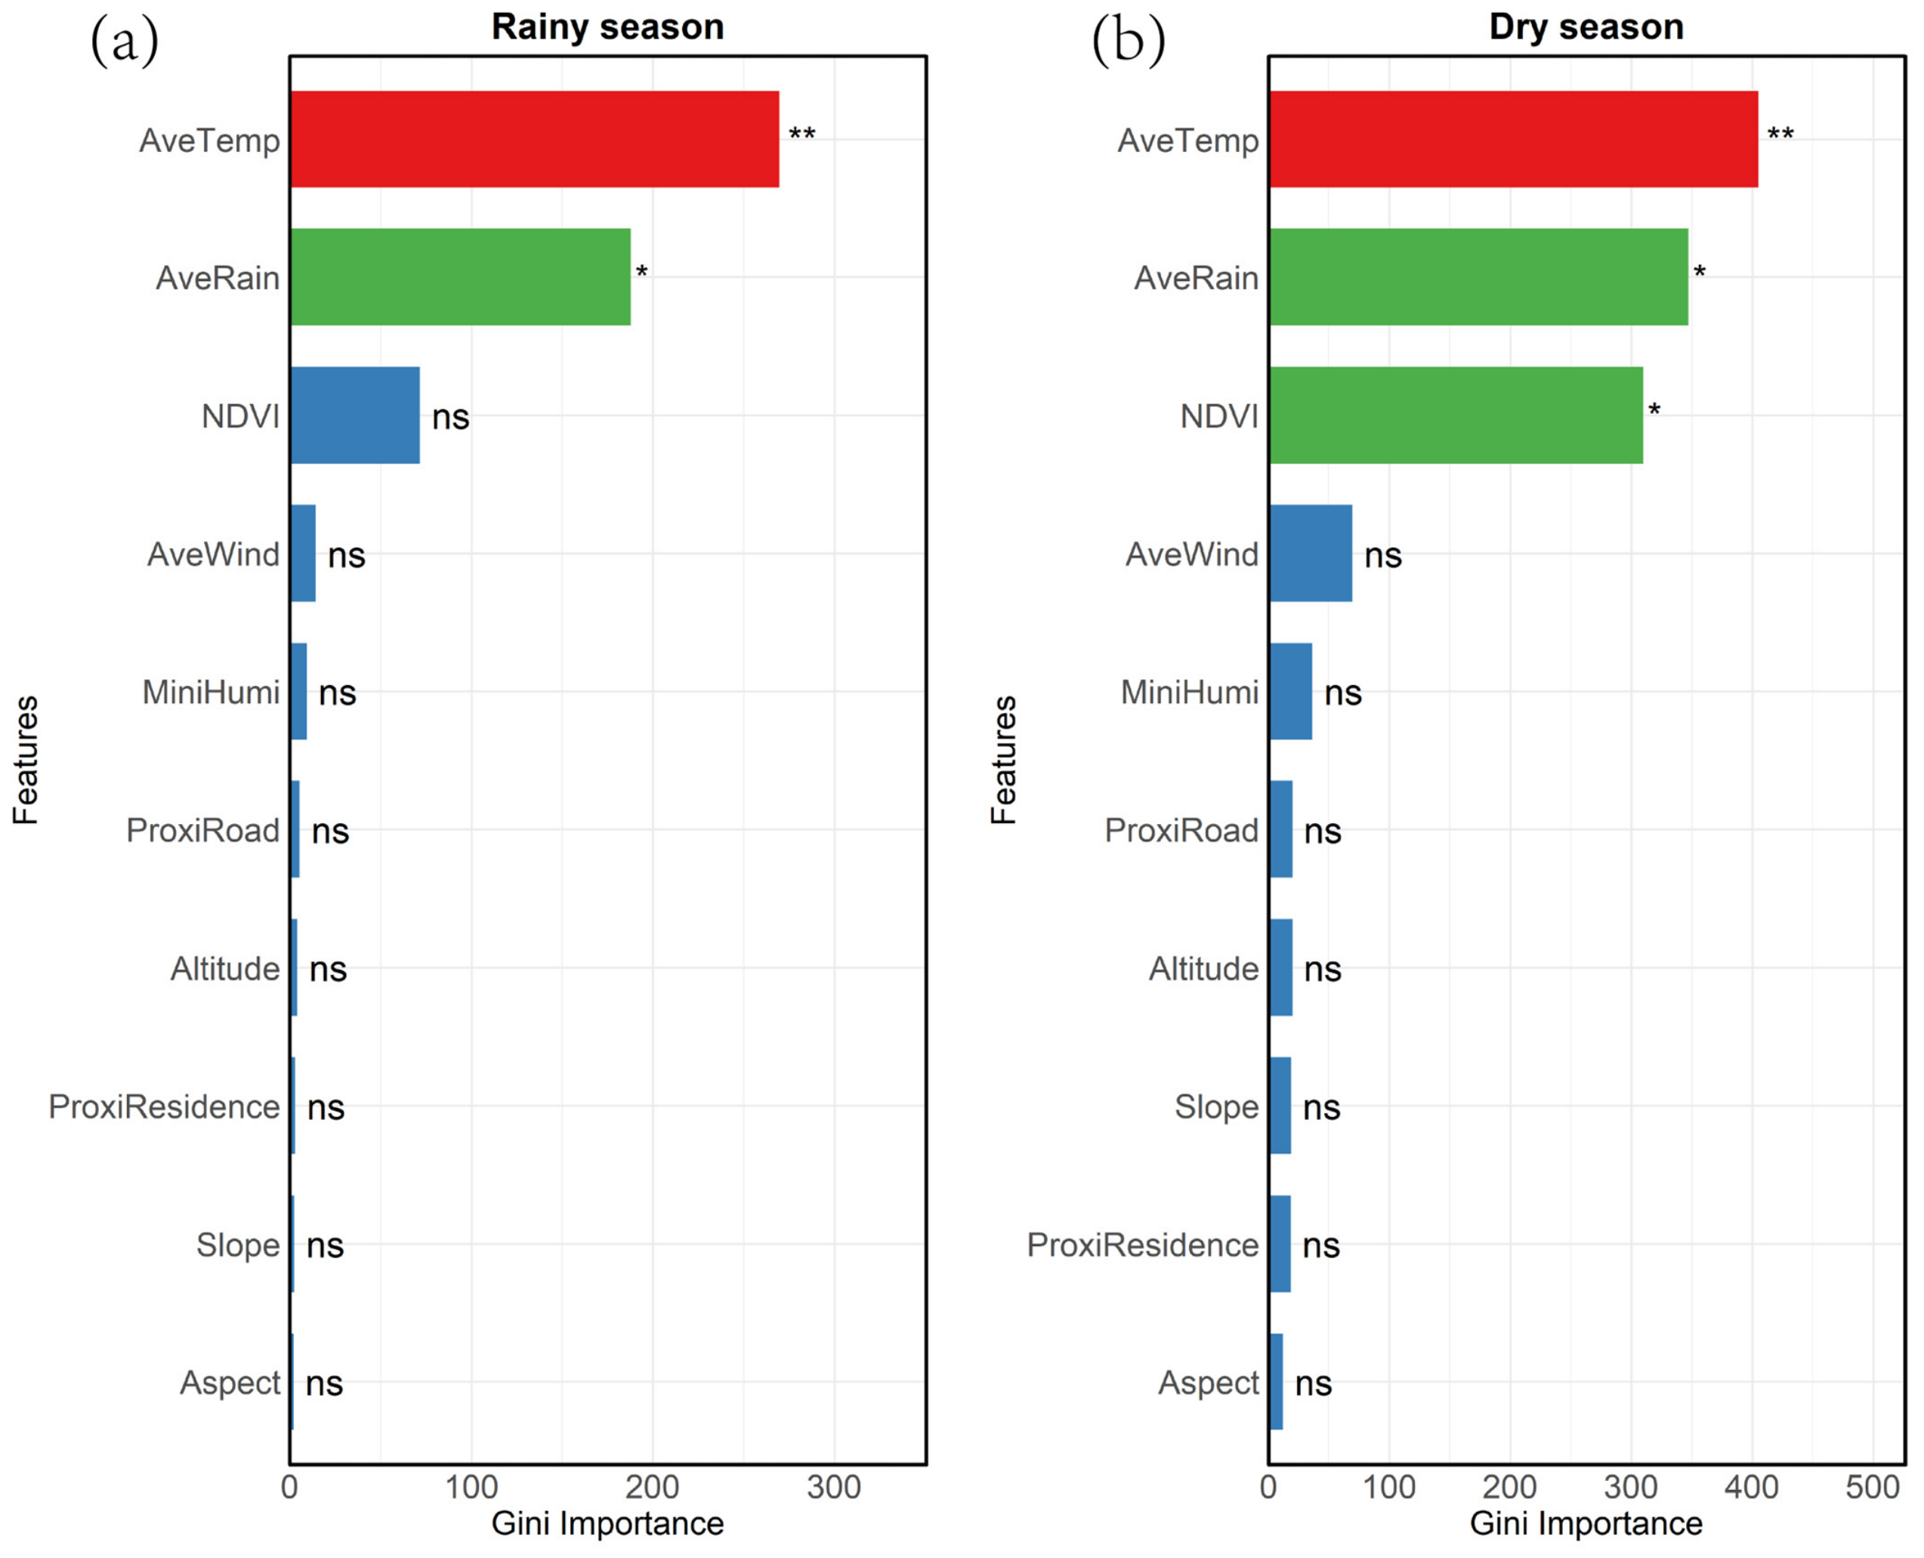
Our analysis indicated that average temperature (AveTemp) and average rainfall (AveRain) were common important drivers of forest fire occurrence in both seasons. Interestingly, the Normalized Difference Vegetation Index (NDVI) exhibited strong importance only during the dry season, while its importance was limited in the rainy season (Figure 4). Specifically, AveTemp and AveRain were the most important factors in the rainy season, while in the dry season, key drivers additionally included NDVI.
Figure 4.
Importance of drivers in different seasons during the (a) rainy and (b) dry seasons. Significance levels are indicated as follows: * denotes significance at the 95% confidence level (corresponding to red); ** denotes significance at the 99% confidence level (corresponding to green); “ns” indicates not significant (corresponding to blue).
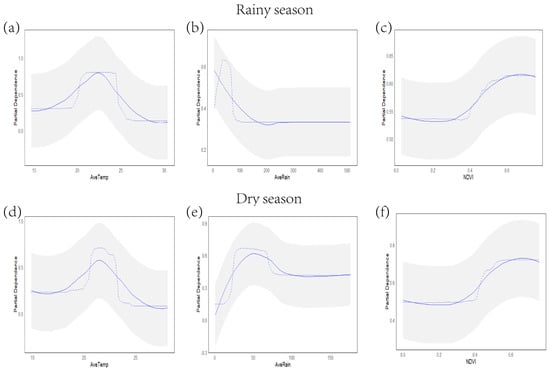
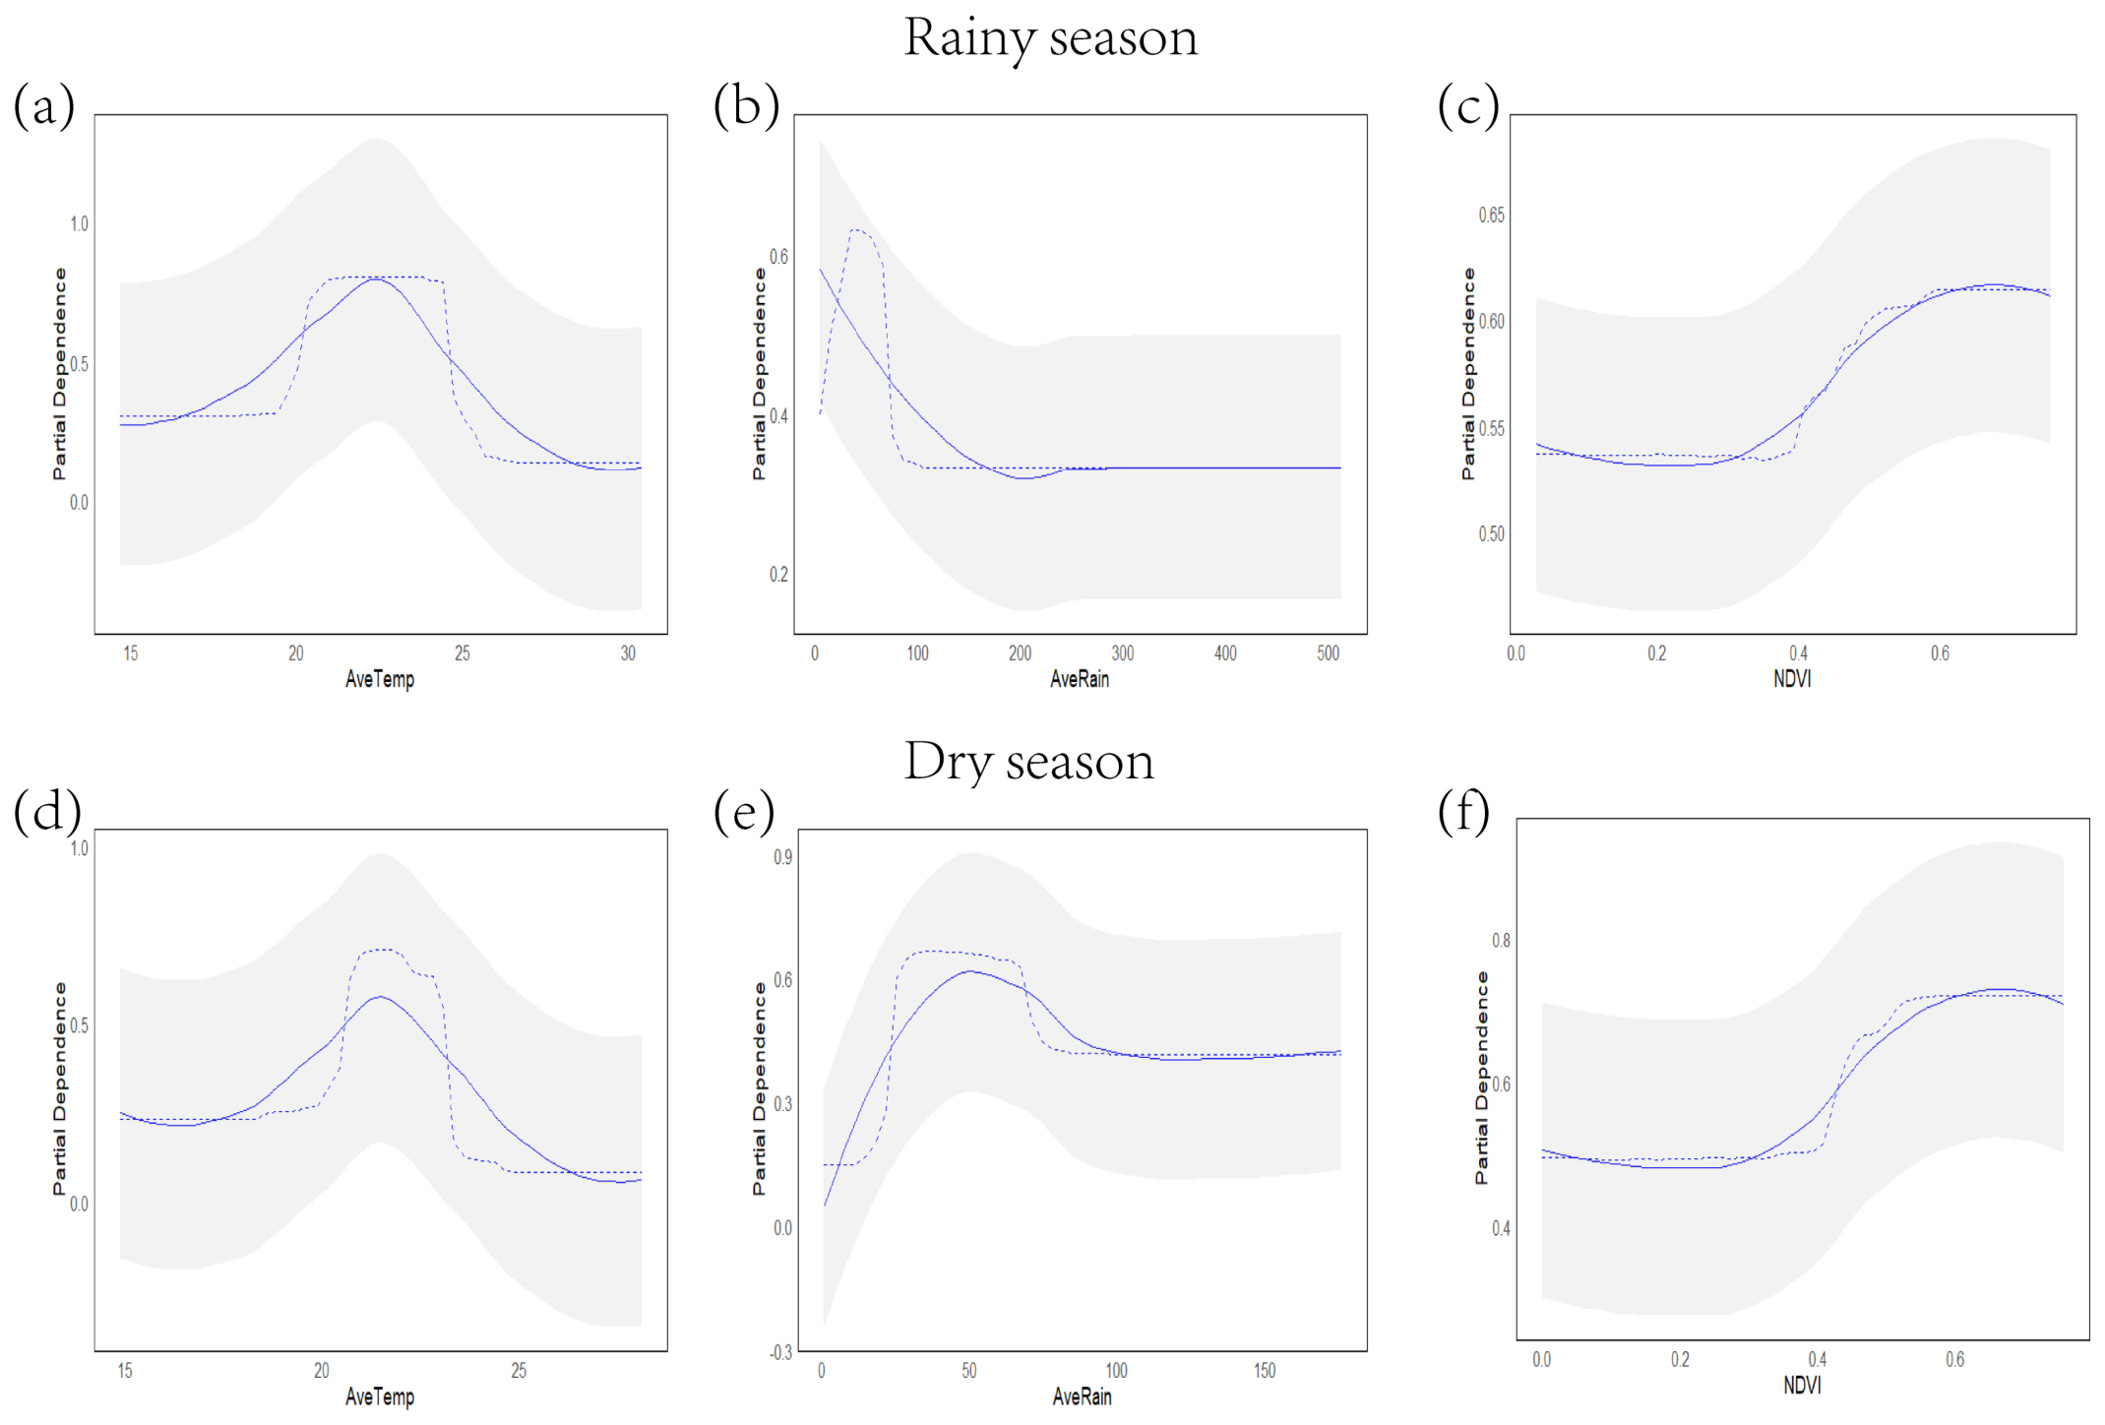
Based on the importance ranking, three factors were identified as top-tier: AveTemp, AveRain, and NDVI (Figure 5). These observations suggest a hierarchical relationship among the factors influencing forest fire occurrence. First, temperature was the most important factor, as indicated by all models. Forest fires predominantly occurred within a threshold range of monthly average temperatures between 20 °C and 25 °C during both seasons (Figure 5a,d). Rainfall was the second-ranked factor (Figure 5b,e). In the rainy season, a turning point, where fire frequency began to decline, occurred when the monthly average rainfall exceeded 200 mm. During the dry season, fire frequency peaked at a monthly average rainfall of approximately 50 mm and subsequently decreased with increasing precipitation. NDVI was the third-ranked factor (Figure 5c,f). In both seasons, forest fire frequency increased with rising NDVI values, reaching a peak at a threshold NDVI value of about 0.65.
Figure 5.
Partial Dependence Plots of the top three factors during the (a–c) rainy and (d–f) dry seasons. The gray shaded area represents the confidence interval. The blue dashed line depicts the data distribution curve, while the blue solid line indicates the smoothed trend line.
3.4. Forest Fire Hazard Map
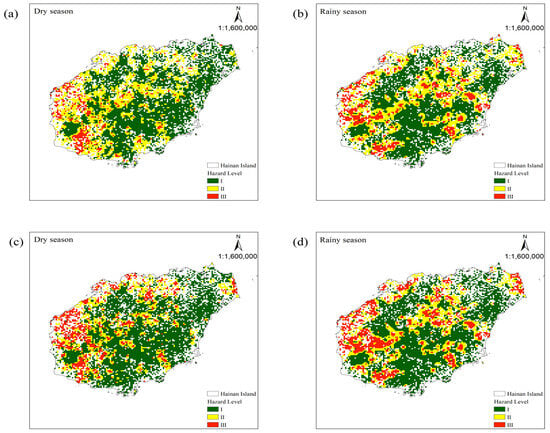
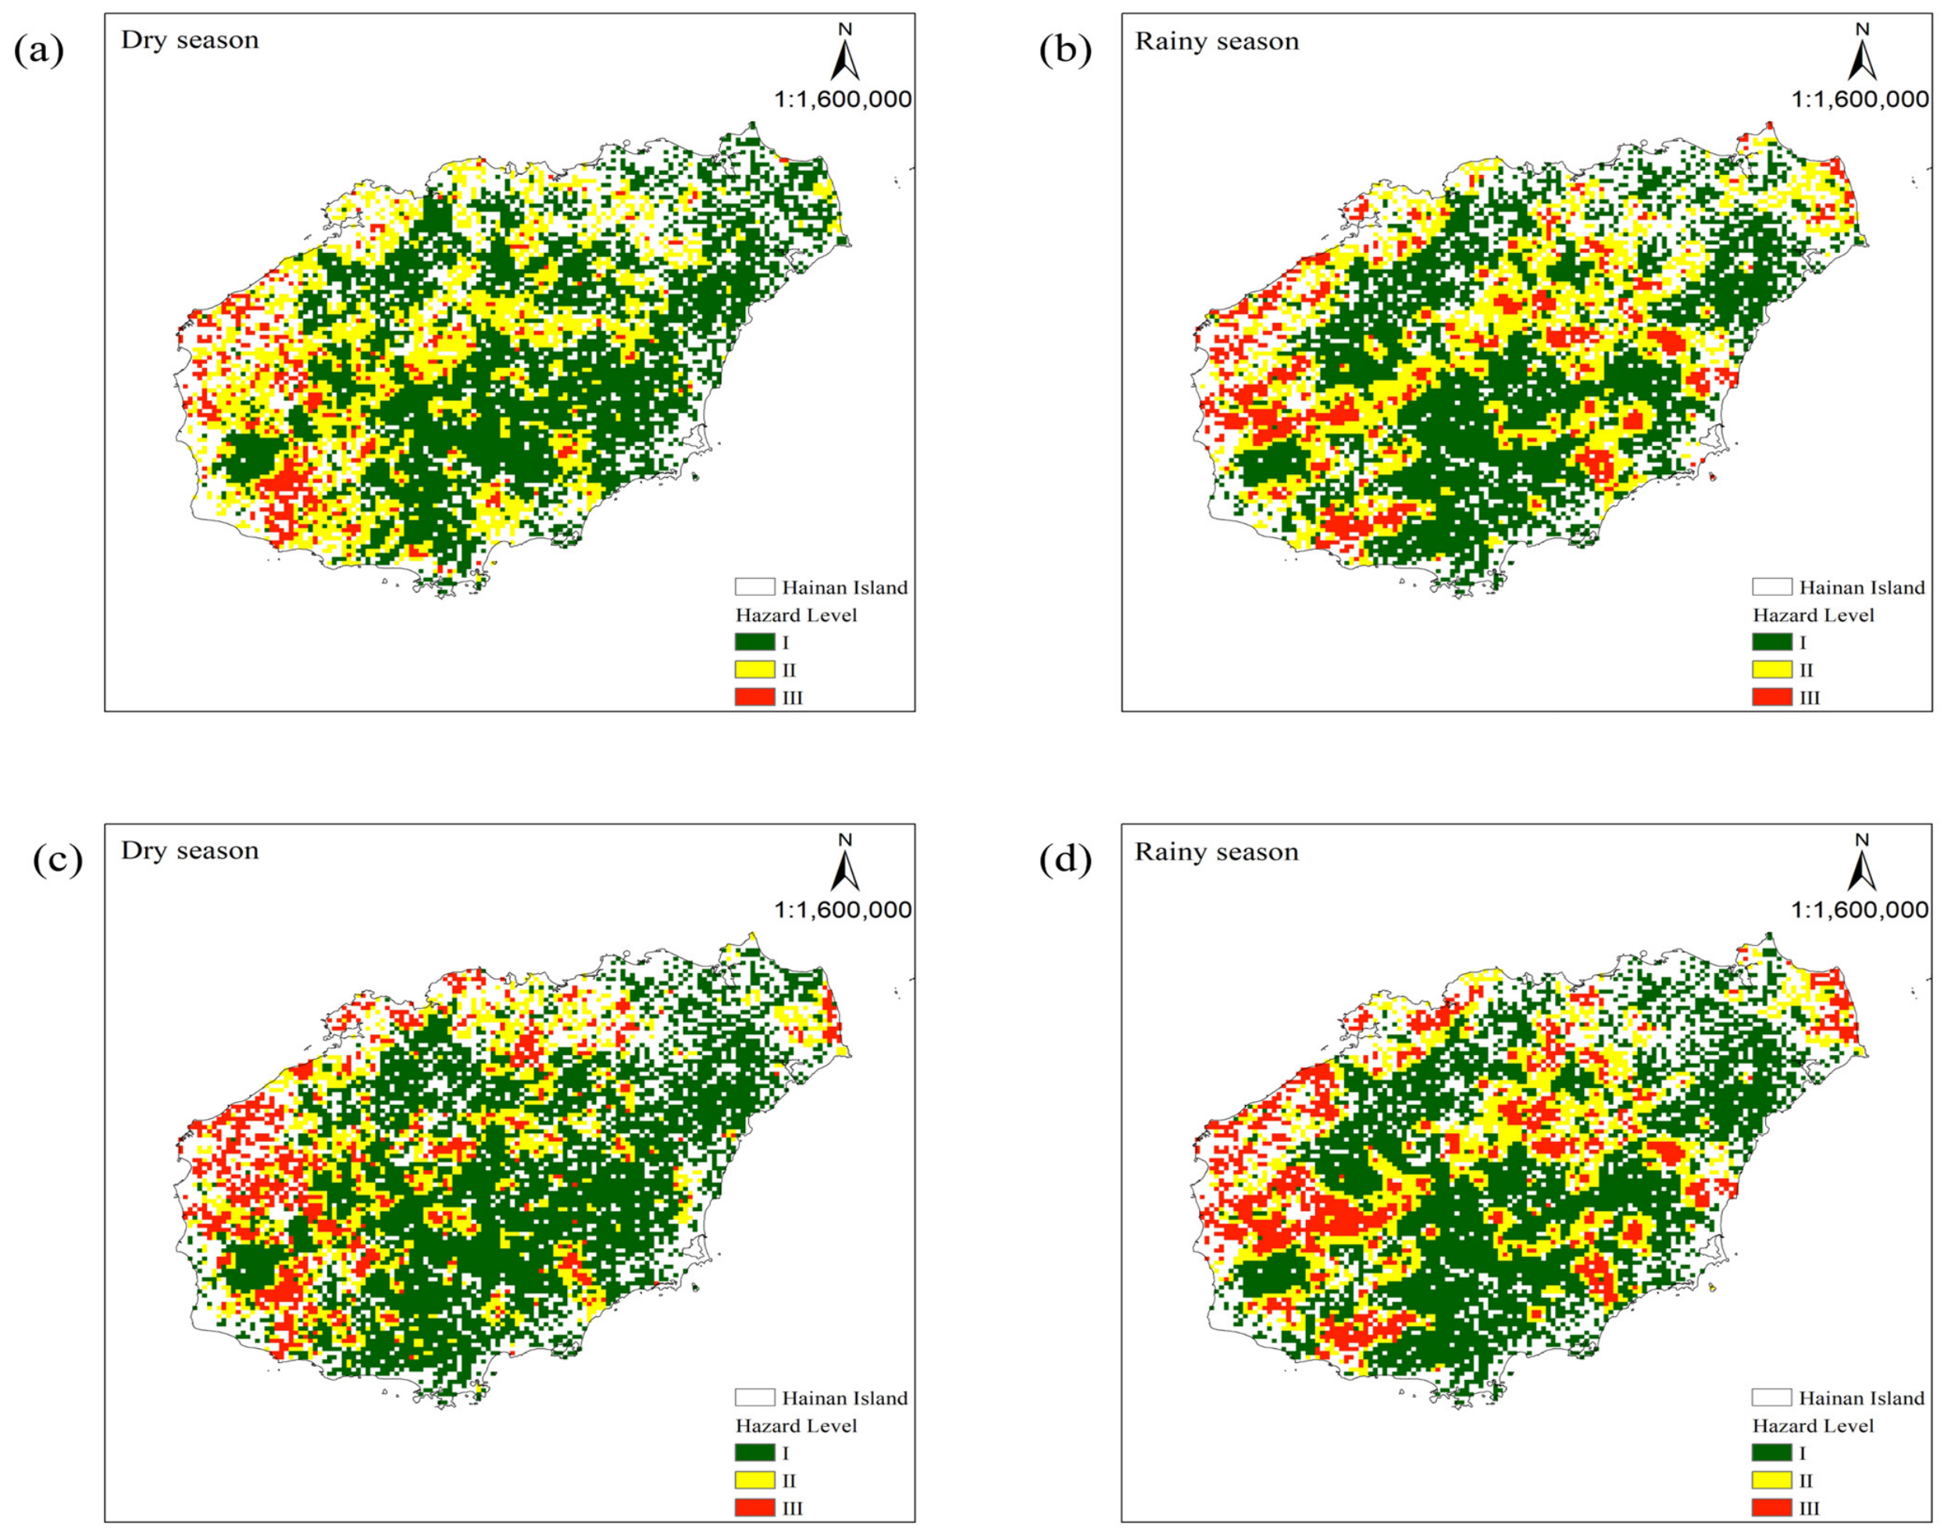
As shown in Figure 6, the forest fire hazard distribution maps for Hainan Island, derived from the Logistic Regression and Random Forest models, exhibit a high degree of similarity. Notably, the predicted spatial distribution of forest fire hazard differs between the rainy and dry seasons. During the dry season, forests in western Hainan Island are particularly susceptible to fire. In contrast, the rainy season’s high-hazard areas are primarily located in the northeastern and western parts of the island.
Figure 6.
Forest fire hazard maps of Hainan Island for the dry and rainy seasons, derived from the Logistic Regression (a,b) and Random Forest (c,d) models.
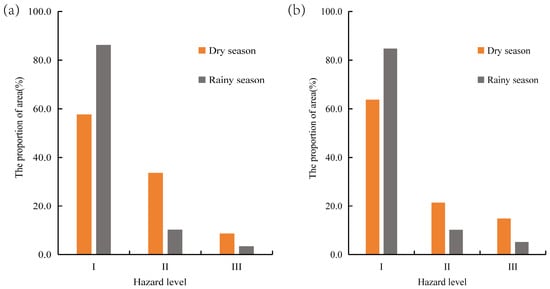
We further calculated the distribution area of each hazard level of forest fires in Hainan Island (Figure 7). Our results show that, regardless of whether the Logistic Regression or Random Forest model is used for prediction, the distribution area of forest fire hazard level II (medium hazard) and III (high hazard) in Hainan Island is larger in the dry season than in the rainy season, while the distribution area of hazard level I (low risk) is larger in the rainy season than in the dry season. The results indicate that the forest fire hazard in Hainan Island varies significantly with the seasons, with the high- and medium-risk areas being larger in the dry season than in the rainy season. In the dry season, the high-risk areas for forest fires include the western part of Hainan Island, while those for the rainy season are mainly distributed in the west and northeast.
Figure 7.
Areal extent of fire hazard classification on Hainan Island during the rainy and dry seasons, based on the Logistic Regression (a) and Random Forest (b) models.
4. Discussion
In this study, we employed an integrated approach combining remote sensing monitoring and ground surveys to collect forest fire data in the study region, thereby exploring the monthly and seasonal dynamics of fire occurrence. Our results showed that tropical forest fires on Hainan Island were predominantly concentrated from January to May, corresponding to the period with relatively low rainfall on the island. This seasonal pattern is consistent with observations from other tropical regions; for instance, forest fires in the Valmiki Tiger Reserve on the southern foothills of the Himalayas were reported to occur mainly from January to May [51]. Similarly, in northern Vietnam, forest fires were observed mainly between February and April [36], while in the Western Ghats of India, fire events were concentrated from January to March [52]. These observations collectively indicate that forest fires in tropical regions exhibit a distinct seasonal distribution, with the fire-prone period concentrated in the dry season.
Identifying key drivers is crucial for effective forest fire management [53,54]. Using feature selection methods, we aimed to identify the most important factors driving fire occurrence probability in each season. We found that monthly AvTemp was the highest-ranked predictor of fire occurrence probability in both seasons, as it promotes the drying of forest fuels and accelerates ignition potential [55]. Furthermore, we identified a high-activity threshold between 20 °C and 25 °C for monthly average temperatures. A study in Indonesia similarly found a low probability of fire occurrence when temperatures fell below 20 °C [56]. However, a key difference is that the upper temperature threshold for high fire activity on Hainan Island is around 25 °C, compared to approximately 30 °C in Indonesia. This disparity is likely due to latitudinal differences; Indonesia is located near the equator, whereas Hainan Island lies between 18°10′ and 20°10′ north latitude. During the dry season when fires are most prevalent, the subsolar point is between the Tropic of Capricorn and the equator, resulting in higher average dry-season temperatures in Indonesia compared to Hainan. AveRain was also identified as an important predictor of fire frequency. During the rainy season, a turning point in fire frequency occurred when monthly rainfall exceeded 200 mm, as abundant precipitation increases vegetation and soil moisture, thereby reducing fire risk. In contrast, during the dry season, fire frequency peaked at a monthly rainfall of about 50 mm—a level insufficient to prevent vegetation from becoming highly flammable. Fire occurrence decreased with further increases in precipitation, indicating that higher rainfall effectively suppresses fires, particularly during dry periods. Therefore, monitoring and predicting precipitation patterns is a critical component of tropical forest fire risk assessment. NDVI was identified as an important predictor only during the dry season, while its importance was limited in the rainy season. This is because fuel is a key component of the “fire triangle” (oxygen, fuel, and heat source). During the dry season, forest fuels are relatively dry, facilitating fire ignition and spread, making fuel conditions more important. In the rainy season, fuels are typically more moist, limiting their influence on fire occurrence [57,58]. This finding suggests that forest managers should prioritize monitoring fuel load, distribution, and moisture content indicators during the dry season.
Wildfire hazard maps are long-term planning tools useful for prioritizing areas for mitigation measures and supporting land-use planning [59,60]. To predict forest fire hazard, we employed both Logistic Regression and Random Forest models. Our results demonstrate that the Random Forest model outperformed the Logistic Regression model in predictive accuracy for both seasons. Globally, comparative studies applying machine learning techniques like Random Forest for fire prediction have been successfully implemented in various tropical regions, including South Asia [61,62], Southeast Asia [7,63], and the Amazon [64], underscoring the adaptability of these methods to diverse tropical environmental factors (climate, topography, vegetation, and human activities). Most importantly, by developing separate models for the distinct dry and rainy season periods on Hainan Island, we enable precise fire hazard predictions tailored to each seasonal regime.
Modeling fire occurrence probability under different seasonal scenarios enhances our understanding of fire drivers and aids in prevention efforts [65]. Our modeling confirms that the forest fire probability on Hainan Island is significantly influenced by seasonal factors, with the dry season generally associated with greater potential burned area and severity than the rainy season. The western region of the island consistently shows higher fire frequency. Key reasons include lower dry-season rainfall, which promotes vegetation dryness and increases flammability [66]. We recommend implementing seasonally targeted monitoring in the high-susceptibility zones identified in this study, with a focus on enforcing strict fire prevention measures in areas prone to high fire incidence during the dry season.
This study employed both machine learning and traditional Logistic Regression approaches to investigate tropical forest fire hazards, differentiating dry- and rainy-season patterns, identifying key seasonal drivers, and generating season-specific fire hazard maps. The results offer actionable insights for local fire prevention and management strategies. However, some limitations should be noted. The use of randomly generated pseudo-absence samples and a random training–validation split without spatial blocking may lead to optimistic model performance due to spatial autocorrelation among fire occurrences. In addition, some potentially relevant predictors, such as lightning activity and fuel moisture, were not included because of limited data availability. Future studies could address these issues by incorporating additional variables (e.g., fuel characteristics, population density, and socio-economic indicators), and by applying spatial cross-validation and more advanced algorithms to further improve model robustness and applicability.
5. Conclusions
By analyzing the seasonal patterns of forest fire occurrence on Hainan Island from 2000 to 2022, this study highlights that the period from January to May represents the main fire-prone season on the island. We further found that the monitoring factors for forest fires differ between the rainy and dry seasons. Monthly average temperature and monthly rainfall were identified as common drivers of fire occurrence probability in both seasons, while NDVI served as an important additional predictor only during the dry season. The Random Forest model consistently outperformed the Logistic Regression model in both seasons, achieving higher accuracy and AUC values, indicating its stronger ability to capture complex nonlinear relationships among fire drivers. The predicted fire hazard maps revealed clear seasonal differences: high- and moderate-hazard areas were more extensive in the dry season than in the rainy season, with the western part of Hainan Island being particularly susceptible. These findings emphasize the need for season-specific fire prevention and management strategies. We recommend that local authorities integrate seasonally dynamic prediction models into the official forest fire danger rating system, strengthen the monitoring of fuel conditions and key climatic variables, and prioritize resource allocation in high-risk areas during the dry season. These findings can enhance the precision of forest fire prevention in tropical regions and contribute to safeguarding the sustainable development of forest-adjacent communities.
Supplementary Materials
The following supporting information can be downloaded at: https://www.mdpi.com/article/10.3390/su18199898/s1. Figure S1. Correlation analysis of driving factors for forest fires (a) and results of multicollinearity diagnosis (b).
Author Contributions
Q.Y.: writing—original draft, conceptualization, formal analysis, methodology; Y.C. (Yiqing Chen): conceptualization, project administration, resources, writing—review and editing; Y.C. (Yongzhong Chen): software, writing—review and editing; X.C.: conceptualization, project administration, resources, writing—review and editing. All authors have read and agreed to the published version of the manuscript.
Funding
This work was supported by Hainan Provincial Natural Science Foundation of China (Grant No. 425RC845).
Institutional Review Board Statement
Not applicable.
Informed Consent Statement
Not applicable.
Data Availability Statement
Restrictions apply to the availability of these data. Data were obtained from the authors’ investigation but are subject to the Forest and Grassland Fire Prevention Regulations of China. The data are available at the China Forest and Grassland Fire Prevention website (https://slcyfh.mem.gov.cn/, accessed on 15 September 2025) with the permission of the relevant county-level emergency management department of Hainan Province after their official release.
Conflicts of Interest
The authors declare no conflicts of interest.
References
- Cleveland, C.C.; Taylor, P.; Chadwick, K.D.; Dahlin, K.; Doughty, C.E.; Malhi, Y.; Smith, W.K.; Sullivan, B.W.; Wieder, W.R.; Townsend, A.R. A comparison of plot-based satellite and Earth system model estimates of tropical forest net primary production. Glob. Biogeochem. Cycles 2015, 29, 626–644. [Google Scholar] [CrossRef] [Scilit]
- Maure, L.A.; Diniz, M.F.; Coelho, M.T.P.; Molin, P.G.; da Silva, F.R.; Hasui, E. Biodiversity and carbon conservation under the ecosystem stability of tropical forests. J. Environ. Manag. 2023, 345, 118929. [Google Scholar] [CrossRef] [Scilit] [PubMed]
- Uribe, M.d.R.; Coe, M.T.; Castanho, A.D.; Macedo, M.N.; Valle, D.; Brando, P.M. Net loss of biomass predicted for tropical biomes in a changing climate. Nat. Clim. Change 2023, 13, 274–281. [Google Scholar] [CrossRef] [Scilit]
- Cammelli, F.; Garrett, R.D.; Barlow, J.; Parry, L. Fire risk perpetuates poverty and fire use among Amazonian smallholders. Glob. Environ. Change-Hum. Policy Dimens. 2020, 63, 102096. [Google Scholar] [CrossRef] [Scilit]
- Xu, X.Y.; Jia, G.S.; Zhang, X.Y.; Riley, W.J.; Xue, Y. Climate regime shift and forest loss amplify fire in Amazonian forests. Glob. Change Biol. 2020, 26, 5874–5885. [Google Scholar] [CrossRef] [Scilit] [PubMed]
- Phelps, L.N.; Andela, N.; Gravey, M.; Davis, D.S.; Kull, C.A.; Douglass, K.; Lehmann, C.E.R. Madagascar’s fire regimes challenge global assumptions about landscape degradation. Glob. Change Biol. 2022, 28, 6944–6960. [Google Scholar] [CrossRef] [Scilit] [PubMed]
- Trang, P.T.; Enright, N.J.; Chu, T.; Andrew, M.E. Drivers of wildfire burn severity in the montane rainforests of northern Vietnam. Int. J. Wildland Fire 2023, 32, 1773–1787. [Google Scholar] [CrossRef] [Scilit]
- Swann, D.E.B.; Bellingham, P.J.; Martin, P.H. Cyclone-Fire Interactions Enhance Fire Extent and Severity in a Tropical Montane Pine Forest. Ecosystems 2024, 27, 559–576. [Google Scholar] [CrossRef] [Scilit]
- Fischer, R. The Long-Term Consequences of Forest Fires on the Carbon Fluxes of a Tropical Forest in Africa. Appl. Sci. 2021, 11, 4696. [Google Scholar] [CrossRef] [Scilit]
- van Wees, D.; van der Werf, G.R.; Randerson, J.T.; Andela, N.; Chen, Y.; Morton, D.C. The role of fire in global forest loss dynamics. Glob. Change Biol. 2021, 27, 2377–2391. [Google Scholar] [CrossRef] [Scilit] [PubMed]
- Li, F.; Lawrence, D.M.; Bond-Lamberty, B. Human impacts on 20th century fire dynamics and implications for global carbon and water trajectories. Glob. Planet. Change 2018, 162, 18–27. [Google Scholar] [CrossRef] [Scilit]
- Jiang, X.; Li, K.F.; Liang, M.C.; Yung, Y.L. Impact of Amazonian Fires on Atmospheric CO2. Geophys. Res. Lett. 2021, 48, 10. [Google Scholar] [CrossRef] [Scilit]
- Mallapaty, S. Australian Bush Fires Belched Out Immense Quantity of Carbon. Nature 2021, 597, 459–460. [Google Scholar] [CrossRef] [Scilit] [PubMed]
- Zheng, B.; Ciais, P.; Chevallier, F.; Yang, H.; Canadell, J.G.; Chen, Y.; van der Velde, I.R.; Aben, I.; Chuvieco, E.; Davis, S.J.; et al. Record-high CO2 emissions from boreal fires in 2021. Science 2023, 379, 912–917. [Google Scholar] [CrossRef] [Scilit] [PubMed]
- Goss, M.; Swain, D.L.; Abatzoglou, J.T.; Sarhadi, A.; Kolden, C.A.; Williams, A.P.; Diffenbaugh, N.S. Climate change is increasing the likelihood of extreme autumn wildfire conditions across California. Environ. Res. Lett. 2020, 15, 094016. [Google Scholar] [CrossRef] [Scilit]
- Jones, M.W.; Kelley, D.I.; Burton, C.A.; Di Giuseppe, F.; Barbosa, M.L.F.; Brambleby, E.; Hartley, A.J.; Lombardi, A.; Mataveli, G.; McNorton, J.R.; et al. State of Wildfires 2023-2024. Earth Syst. Sci. Data 2024, 16, 3601–3685. [Google Scholar] [CrossRef] [Scilit]
- Harrison, S.P.; Prentice, I.C.; Bloomfield, K.J.; Dong, N.; Forkel, M.; Forrest, M.; Ningthoujam, R.K.; Pellegrini, A.; Shen, Y.C.; Baudena, M.; et al. Understanding and modelling wildfire regimes: An ecological perspective. Environ. Res. Lett. 2021, 16, 13. [Google Scholar] [CrossRef] [Scilit]
- Zubieta, R.; Prudencio, F.; Ccanchi, Y.; Saavedra, M.; Sulca, J.; Reupo, J.; Alarco, G. Potential conditions for fire occurrence in vegetation in the Peruvian Andes. Int. J. Wildland Fire 2021, 30, 836–849. [Google Scholar] [CrossRef] [Scilit]
- Ma, W.; Feng, Z.; Cheng, Z.; Chen, S.; Wang, F. Identifying forest fire driving factors and related impacts in China using random forest algorithm. Forests 2020, 11, 507. [Google Scholar] [CrossRef] [Scilit]
- Turco, M.; Jose Rosa-Canovas, J.; Bedia, J.; Jerez, S.; Pedro Montavez, J.; Carmen Llasat, M.; Provenzale, A. Exacerbated fires in Mediterranean Europe due to anthropogenic warming projected with non-stationary climate-fire models. Nat. Commun. 2018, 9, 3821. [Google Scholar] [CrossRef] [Scilit] [PubMed]
- Son, R.; Kim, H.; Wang, S.-Y.; Jeong, J.-H.; Woo, S.-H.; Jeong, J.-Y.; Lee, B.-D.; Kim, S.H.; LaPlante, M.; Kwon, C.-G.; et al. Changes in fire weather climatology under 1.5 °C and 2.0 °C warming. Environ. Res. Lett. 2021, 16, 034058. [Google Scholar] [CrossRef] [Scilit]
- Ribeiro, A.F.S.; Brando, P.M.; Santos, L.; Rattis, L.; Hirschi, M.; Hauser, M.; Seneviratne, S.I.; Zscheischler, J. A compound event-oriented framework to tropical fire risk assessment in a changing climate. Environ. Res. Lett. 2022, 17, 065015. [Google Scholar] [CrossRef] [Scilit]
- Grau Andres, R. Drought and Fuel Structure Controls on Fire Severity: Effects on Post-Fire Vegetation and Soil Carbon Dynamics. 2017. Available online: https://theses.gla.ac.uk/7929/ (accessed on 15 September 2025).
- Kane, J.M.; Kreye, J.K.; Barajas-Ramirez, R.; Varner, J.M. Litter trait driven dampening of flammability following deciduous forest community shifts in eastern North America. For. Ecol. Manag. 2021, 489, 119100. [Google Scholar] [CrossRef] [Scilit]
- Dalziel, B.D.; Perera, A.H. Tree Mortality Following Boreal Forest Fires Reveals Scale-Dependant Interactions Between Community Structure and Fire Intensity. Ecosystems 2009, 12, 973–981. [Google Scholar] [CrossRef] [Scilit]
- Suazo, M.M.; Collins, S.L.; Parmenter, R.R.; Muldavin, E. Montane valley grasslands are highly resistant to summer wildfire. J. Veg. Sci. 2018, 29, 1017–1028. [Google Scholar] [CrossRef] [Scilit]
- McLauchlan, K.K.; Higuera, P.E.; Miesel, J.; Rogers, B.M.; Schweitzer, J.; Shuman, J.K.; Tepley, A.J.; Varner, J.M.; Veblen, T.T.; Adalsteinsson, S.A.; et al. Fire as a fundamental ecological process: Research advances and frontiers. J. Ecol. 2020, 108, 2047–2069. [Google Scholar] [CrossRef] [Scilit]
- Sharples, J.J.; McRae, R.H.D.; Wilkes, S.R. Wind-terrain effects on the propagation of wildfires in rugged terrain: Fire channelling. Int. J. Wildland Fire 2012, 21, 282–296. [Google Scholar] [CrossRef] [Scilit]
- Clarke, P.J.; Knox, K.J.E.; Bradstock, R.A.; Munoz-Robles, C.; Kumar, L. Vegetation, terrain and fire history shape the impact of extreme weather on fire severity and ecosystem response. J. Veg. Sci. 2014, 25, 1033–1044. [Google Scholar] [CrossRef] [Scilit]
- Popovic, Z.; Bojovic, S.; Markovic, M.; Cerdà, A. Tree species flammability based on plant traits: A synthesis. Sci. Total Environ. 2021, 800, 149625. [Google Scholar] [CrossRef] [Scilit] [PubMed]
- Rabin, S.S.; Gérard, F.N.; Arneth, A. The influence of thinning and prescribed burning on future forest fires in fire-prone regions of Europe. Environ. Res. Lett. 2022, 17, 055010. [Google Scholar] [CrossRef] [Scilit]
- Corona-Núñez, R.O.; Campo, J.E. Climate and socioeconomic drivers of biomass burning and carbon emissions from fires in tropical dry forests: A Pantropical analysis. Glob. Change Biol. 2023, 29, 1062–1079. [Google Scholar] [CrossRef] [Scilit] [PubMed]
- Villagra, P.E.; Cesca, E.; Alvarez, L.M.; Delgado, S.; Villalba, R. Spatial and temporal patterns of forest fires in the Central Monte: Relationships with regional climate. Ecol. Process. 2024, 13, 5. [Google Scholar] [CrossRef] [Scilit]
- Xu, K.; Pan, X.; Tansey, K.; Abdulla, A.; Guluzade, R.; Yang, Z.; He, M.; Zhu, C.; Yang, S.; Yang, Y. Wildfire probability assessment and analysis based on multi-source data in Guangxi Province, China. Ecol. Indic. 2025, 179, 114148. [Google Scholar] [CrossRef] [Scilit]
- Charak, A.S.; Kumar, R.; Verma, A.K.; Kumar, B.R.; Kumar, S. Bioclimatic, anthropogenic and topographical drivers of forest fire dynamics in the Western Himalaya. Trees For. People 2026, 25, 101258. [Google Scholar] [CrossRef] [Scilit]
- Trang, P.T.; Andrew, M.E.; Chu, T.; Enright, N.J. Forest fire and its key drivers in the tropical forests of northern Vietnam. Int. J. Wildland Fire 2022, 31, 213–229. [Google Scholar] [CrossRef] [Scilit]
- Chen, X.H.; Yang, Q.Q.; Chen, Z.Z.; Lei, J.R.; Wu, T.T.; Li, Y.L.; Pan, X.Y. The interaction between temperature and rainfall determines the probability of tropical forest fire occurrence in Hainan Island. Front. For. Glob. Change 2025, 8, 1495699. [Google Scholar] [CrossRef] [Scilit]
- Jiang, W.; Qiao, Y.; Zheng, X.; Zhou, J.; Jiang, J.; Meng, Q.; Su, G.; Zhong, S.; Wang, F. Wildfire risk assessment using deep learning in Guangdong Province, China. Int. J. Appl. Earth Obs. Geoinf. 2024, 128, 103750. [Google Scholar] [CrossRef] [Scilit]
- Davis, R.; Yang, Z.; Yost, A.; Belongie, C.; Cohen, W. The normal fire environment—Modeling environmental suitability for large forest wildfires using past, present, and future climate normals. For. Ecol. Manag. 2017, 390, 173–186. [Google Scholar] [CrossRef] [Scilit]
- Zhao, H.; Zhang, Z.; Wang, X.; Zhen, S.; Zhang, H.; Bu, Z.-J.; Zhao, J.; Guo, X.; Wei, K.; Dong, L. Future enhanced threshold effects of wildfire drivers could increase burned areas in northern mid-and high latitudes. Commun. Earth Environ. 2025, 6, 224. [Google Scholar] [CrossRef] [Scilit]
- Li, Z.; Shi, H.; Vogelmann, J.E.; Hawbaker, T.J.; Peterson, B. Assessment of fire fuel load dynamics in shrubland ecosystems in the western United States using MODIS products. Remote Sens. 2020, 12, 1911. [Google Scholar] [CrossRef] [Scilit]
- Ren, Y.; Zhang, F.; Zhao, C.; Cheng, Z. Attribution of climate change and human activities to vegetation NDVI in Jilin Province, China during 1998–2020. Ecol. Indic. 2023, 153, 110415. [Google Scholar] [CrossRef] [Scilit]
- Zhao, Q.; Qu, Y. The retrieval of ground ndvi (normalized difference vegetation index) data consistent with remote-sensing observations. Remote Sens. 2024, 16, 1212. [Google Scholar] [CrossRef] [Scilit]
- Van, L.N.; Lee, G. Investigating the Relationship Between Topographic Variables and Wildfire Burn Severity. Geographies 2025, 5, 47. [Google Scholar] [CrossRef] [Scilit]
- Harris, L.; Taylor, A.H. Topography, fuels, and fire exclusion drive fire severity of the Rim Fire in an old-growth mixed-conifer forest, Yosemite National Park, USA. Ecosystems 2015, 18, 1192–1208. [Google Scholar] [CrossRef] [Scilit]
- Sabancı, S. Climatic, Geomorphological, and Anthropogenic Drivers of Rural Wildfires: A Remote Sensing and GIS-Based Case Study of the June 2024 Diyarbakır-Mardin Events-Türkiye. Int. J. Disaster Risk Reduct. 2025, 105874. [Google Scholar] [CrossRef] [Scilit]
- Caspary, W.; Scheuring, R. Positional accuracy in spatial databases. Comput. Environ. Urban Syst. 1993, 17, 103–110. [Google Scholar] [CrossRef] [Scilit]
- Dormann, C.F.; Elith, J.; Bacher, S.; Buchmann, C.; Carl, G.; Carré, G.; Marquéz, J.R.G.; Gruber, B.; Lafourcade, B.; Leitao, P.J.; et al. Collinearity: A review of methods to deal with it and a simulation study evaluating their performance. Ecography 2013, 36, 27–46. [Google Scholar] [CrossRef] [Scilit]
- Schonlau, M.; Zou, R.Y. The random forest algorithm for statistical learning. Stata J. 2020, 20, 3–29. [Google Scholar] [CrossRef] [Scilit]
- Hosmer, D.W., Jr.; Lemeshow, S.; Sturdivant, R.X. Applied Logistic Regression; John Wiley & Sons: Hoboken, NJ, USA, 2013. [Google Scholar]
- Murthy, K.K.; Sinha, S.K.; Kaul, R.; Vaidyanathan, S. A fine-scale state-space model to understand drivers of forest fires in the Himalayan foothills. For. Ecol. Manag. 2019, 432, 902–911. [Google Scholar] [CrossRef] [Scilit]
- Kodandapani, N.; Parks, S.A. Effects of drought on wildfires in forest landscapes of the Western Ghats, India. Int. J. Wildland Fire 2019, 28, 431–444. [Google Scholar] [CrossRef] [Scilit]
- Gong, D.P.; Jing, M. Spatiotemporal Dynamics of Forest Fire Risk in Southeastern China Under Climate Change: Hydrothermal Drivers and Future Projections. Atmosphere 2025, 16, 1189. [Google Scholar] [CrossRef] [Scilit]
- Li, C.H.; Su, Z.W.; Ni, R.Y.; Wang, G.Y.; Ouyang, Y.Y.; Zeng, A.C.; Guo, F.T. Integrated spatial generalized additive modeling for forest fire prediction: A case study in Fujian Province, China. J. For. Res. 2025, 36, 30. [Google Scholar] [CrossRef] [Scilit]
- Ma, B.; Liu, X.P.; Tong, Z.J.; Zhang, J.Q.; Wang, X. Coupled Effects of High Temperatures and Droughts on Forest Fires in Northeast China. Remote Sens. 2024, 16, 3784. [Google Scholar] [CrossRef] [Scilit]
- Karurung, W.S.; Lee, K.; Lee, W. Assessment of forest fire vulnerability prediction in Indonesia: Seasonal variability analysis using machine learning techniques. Int. J. Appl. Earth Obs. Geoinf. 2025, 138, 104435. [Google Scholar] [CrossRef] [Scilit]
- Gordon, C.E.; Khanal, S.; Nolan, R.H.; Peacock, R.J.; Boer, M.M. A generalised model of rainforest vulnerability to fire in eastern Australia. J. Environ. Manag. 2025, 393, 126799. [Google Scholar] [CrossRef] [Scilit] [PubMed]
- Grupenhoff, A.R.; Young, D.J.N.; Barbato, M.; Latimer, A.M. Evaluating short-term effects of fuel treatments on fuel loading in western US dry conifer forests: A meta-analysis. For. Ecol. Manag. 2025, 590, 122808. [Google Scholar] [CrossRef] [Scilit]
- Lorent, A.; Petrila, M.; Apostol, B.; Capalb, F.; Chivulescu, S.; Samsodan, C.; Marcu, C.; Badea, O. Assessing and Mapping Forest Fire Vulnerability in Romania Using Maximum Entropy and eXtreme Gradient Boosting. Forests 2025, 16, 1156. [Google Scholar] [CrossRef] [Scilit]
- Nejatiyanpour, E.; Ghorbanzadeh, O.; Strobl, J.; Yousefpour, R.; Kakhki, M.D.; Amirnejad, H.; Gholamnia, K.; Sabouni, M.S. Assessing Hyrcanian forest fire vulnerability: Socioeconomic and environmental perspectives. J. For. Res. 2025, 36, 35. [Google Scholar] [CrossRef] [Scilit]
- Sarkar, M.S.; Majhi, B.K.; Pathak, B.; Biswas, T.; Mahapatra, S.; Kumar, D.; Bhatt, I.D.; Kuniyal, J.C.; Nautiyal, S. Ensembling machine learning models to identify forest fire-susceptible zones in Northeast India. Ecol. Inform. 2024, 81, 102598. [Google Scholar] [CrossRef] [Scilit]
- Muhammad, S.; Nizami, S.M.; Jiang, Q.O.; Mehmood, K.; Hussain, M.; Anees, S.A.; Shahzad, F.; Khan, W.R. Machine learning-based forest fire vulnerability assessment in subtropical chir pine forests of Pakistan. Fire Ecol. 2025, 21, 72. [Google Scholar] [CrossRef] [Scilit]
- Tehrany, M.S.; Jones, S.; Shabani, F.; Martínez-Alvarez, F.; Bui, D.T. A novel ensemble modeling approach for the spatial prediction of tropical forest fire susceptibility using LogitBoost machine learning classifier and multi-source geospatial data. Theor. Appl. Climatol. 2019, 137, 637–653. [Google Scholar] [CrossRef] [Scilit]
- Barros, L.D.; de Mendonça, B.A.F.; Sothe, C.; Fernandes, E.I.; Elkin, C. Fire in the Atlantic Rainforest: An analysis of 20 years of fire foci distribution and their social-ecological drivers. Geocarto Int. 2022, 37, 4737–4761. [Google Scholar] [CrossRef] [Scilit]
- Zacharakis, I.; Tsihrintzis, V.A. Integrated wildfire danger models and factors: A review. Sci. Total Environ. 2023, 899, 165704. [Google Scholar] [CrossRef] [Scilit] [PubMed]
- Wang, W.Q.; Zhao, F.J.; Wang, Y.X.; Huang, X.Y.; Ye, J.X. Seasonal differences in the spatial patterns of wildfire drivers and susceptibility in the southwest mountains of China. Sci. Total Environ. 2023, 869, 161782. [Google Scholar] [CrossRef] [Scilit] [PubMed]

Disclaimer/Publisher’s Note: The statements, opinions and data contained in all publications are solely those of the individual author(s) and contributor(s) and not of MDPI and/or the editor(s). MDPI and/or the editor(s) disclaim responsibility for any injury to people or property resulting from any ideas, methods, instructions or products referred to in the content. |
© 2026 by the authors. Licensee MDPI, Basel, Switzerland. This article is an open access article distributed under the terms and conditions of the Creative Commons Attribution (CC BY) license.