


Abstract
Eurasian freight transportation is increasingly shaped by the need to balance transit efficiency, economic performance, and environmental impacts. This study presents a comparative carbon–cost–time assessment of alternative freight corridors between Shanghai and Rotterdam. Three route configurations are evaluated: the rail-based Northern Corridor, the multimodal Middle Corridor, the southern maritime route via the Suez Canal, and an alternative maritime route via the Cape of Good Hope. A common functional unit of 100 TEU is adopted to enable consistent cross-modal comparison. The results reveal a distinct trade-off between transit time and capacity-normalized environmental–economic performance. The Northern Corridor provides the shortest transit time (237 h), whereas the Suez route achieves the lowest CO2 emissions (117,457 kg CO2/100 TEU) and fuel-related cost (USD 24,160/100 TEU). Rerouting via the Cape increases distance, transit time, emissions, and fuel-related cost by approximately 34.6% relative to the Suez route. Even when an assumed USD 700,000 Suez Canal transit fee is included, the Cape route remains approximately 17.0% more expensive. These findings provide a quantitative basis for evaluating carbon–cost–time trade-offs in Eurasian freight corridor selection.
1. Introduction
The rapid expansion of international trade and the increasing geographical fragmentation of production have made freight transportation networks a critical component of global supply chains [1]. Trade between East Asia and Europe depends on a limited number of long-distance transport corridors involving maritime [2], railway, and multimodal connections [3]. The performance of these corridors is no longer evaluated solely in terms of geographical distance or transportation cost. Growing concerns about climate change [4], energy consumption, geopolitical disruptions [5], and supply chain resilience have shifted attention toward transport systems capable of providing economic efficiency, environmental sustainability, and reliable transit times [6]. Consequently, the selection of an international freight corridor has increasingly become a multi-dimensional decision involving trade-offs among transportation distance, delivery time, operating costs, energy consumption, and greenhouse gas emissions [7,8].
The Eurasian transport network provides a particularly relevant setting for investigating these trade-offs [9]. China–Europe freight flows can be broadly transported through three alternative geographical systems: the Northern Corridor, the Middle or Trans-Caspian Corridor, and maritime routes connecting East Asia with Europe via the Indian Ocean and the Mediterranean [10]. The Northern Corridor has traditionally provided an important rail connection between Chinese and European markets through Kazakhstan, Russia, Belarus, and Eastern Europe [11]. Rail freight can offer considerably shorter transit times than conventional deep-sea shipping, making it particularly attractive for relatively high-value and time-sensitive cargo [12]. However, the increasing exposure of international supply chains to geopolitical uncertainty has highlighted the importance of route diversification and has strengthened interest in alternative Eurasian transport connections [13].
Within this context, the Middle Corridor, also known as the Trans-Caspian International Transport Route (TITR), has gained considerable strategic importance. The corridor connects China and Europe through Central Asia, the Caspian Sea, the South Caucasus, and Türkiye, combining railway and maritime transport [14]. The World Bank identifies the Middle Corridor as a multimodal rail–maritime system linking Chinese and European markets through Kazakhstan, Azerbaijan, and Georgia, with onward connections to Europe, including routes through Türkiye. The corridor has attracted particularly strong international attention as a means of improving route diversification and supply-chain resilience against geopolitical disruptions. The World Bank estimates that coordinated infrastructure improvements, logistics reforms, and operational measures could potentially triple freight volumes and halve travel times along the corridor by 2030 [15].
The growing importance of the Middle Corridor is also reflected in European transport policy. A European Commission-supported study, implemented by the European Bank for Reconstruction and Development (EBRD), evaluated sustainable transport connections between the European Union and the five Central Asian republics against environmental, economic, social, fiscal, and political sustainability criteria [16]. Infrastructure bottlenecks nevertheless remain a significant limitation on the operational efficiency of the Trans-Caspian system. Recent investments have therefore focused on railway capacity, container handling facilities, logistics hubs, ports, and intermodal connections. For example, the EBRD has supported improvements in Kazakhstan to increase container-handling capacity and alleviate congestion along the Trans-Caspian Corridor. Such developments indicate that the Middle Corridor is increasingly being considered not merely as an alternative transport route, but as a strategically important component of future Eurasian freight networks [17].
Despite the increasing importance of overland corridors, maritime transport remains the backbone of intercontinental containerized trade. Large container vessels benefit from substantial economies of scale and can transport several thousand, or even tens of thousands, of twenty-foot equivalent units (TEUs) in a single voyage [18]. Consequently, maritime transportation can offer lower transportation costs and emissions per unit of cargo despite substantially longer geographic distances and transit times than railway alternatives [19]. This creates an important methodological distinction between evaluating a corridor based on total vehicle emissions and evaluating its environmental performance on a functional-unit basis. A high-capacity container vessel may consume substantially more fuel and generate greater absolute emissions than a freight train during operation, while its emissions allocated to 100 TEU may nevertheless be considerably lower because of its much larger carrying capacity. Therefore, transport capacity and cargo allocation must be explicitly incorporated when comparing the environmental performance of railway and maritime freight systems [20].
The comparison becomes more complex for multimodal corridors. Whereas the Northern Corridor is predominantly railway-based and the conventional Southern Corridor is predominantly maritime, the Middle Corridor combines railway operations with a Caspian Sea crossing and multiple modal transfer points [21]. Such transfers can introduce additional time, cost, fuel consumption, and operational complexity. Conversely, the corridor may provide substantial strategic benefits by shortening certain transport distances, bypassing geopolitically sensitive regions, and improving access to Central Asian, Caucasian, and Turkish markets. Accordingly, assessing Eurasian freight corridors solely by distance may yield misleading conclusions. A shorter corridor does not necessarily yield the lowest transportation cost or carbon intensity, and the environmentally preferable option may involve longer transit times [22].
This issue is increasingly important in the context of international decarbonization policies. Freight transport contributes to global energy consumption and greenhouse gas emissions, while growing trade volumes may further increase transportation-related environmental pressures unless improvements in vehicle efficiency, fuel carbon intensity, modal allocation, and logistics management offset rising demand [23]. At the same time, supply-chain decisions cannot generally be optimized solely on the basis of emissions. Shippers must simultaneously consider transportation costs, cargo capacity, transit time, reliability, and increasingly, geopolitical exposure. An integrated comparison of these dimensions is therefore necessary to identify the conditions under which different Eurasian corridors become preferable [24].
Against this background, the novelty of the present study lies in the integrated and capacity-normalized comparison of alternative Eurasian freight corridors within a common carbon–cost–time framework. Prior studies have generally relied on a single evaluation criterion, most commonly distance or cost alone, and have rarely addressed cost, carbon emissions, and transit time simultaneously within a normalized and internally consistent framework. Rather than evaluating individual routes or transport modes in isolation, the present study addresses this gap by providing a consistent basis for comparing rail-dominated, multimodal rail–sea, and maritime transport systems while explicitly accounting for differences in transport distance, vehicle capacity, specific fuel consumption, engine power, fuel cost, and operating time.
Accordingly, this study aims to comparatively assess the Northern, Middle, and Southern freight corridors between Shanghai and Rotterdam in terms of transportation distance, transit time, cost, and CO2 emissions. To ensure comparability across transport modes with substantially different carrying capacities, the economic and environmental indicators were normalized to a common functional unit of 100 TEU. In addition, alternative configurations of the Southern maritime route were examined to assess how route selection affects overall performance. By revealing the trade-offs among carbon emissions, transportation cost, and transit time, the proposed framework provides a quantitative basis for identifying the relative advantages and limitations of alternative Eurasian freight corridors and supports more informed corridor selection and low-carbon freight transportation planning across Eurasian trade networks.
Beyond extending the comparison to the Northern, Middle, and Southern Eurasian corridors between Shanghai and Rotterdam, the principal contribution of this study is therefore methodological: it provides a generalizable, capacity-normalized, and allocation-sensitive analytical framework that can be applied to other transport corridors and cost/policy parameters beyond those examined here.
2. Materials and Methods
2.1. Study Framework and Transportation Corridors
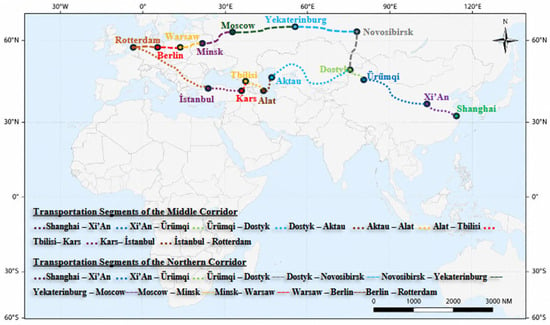
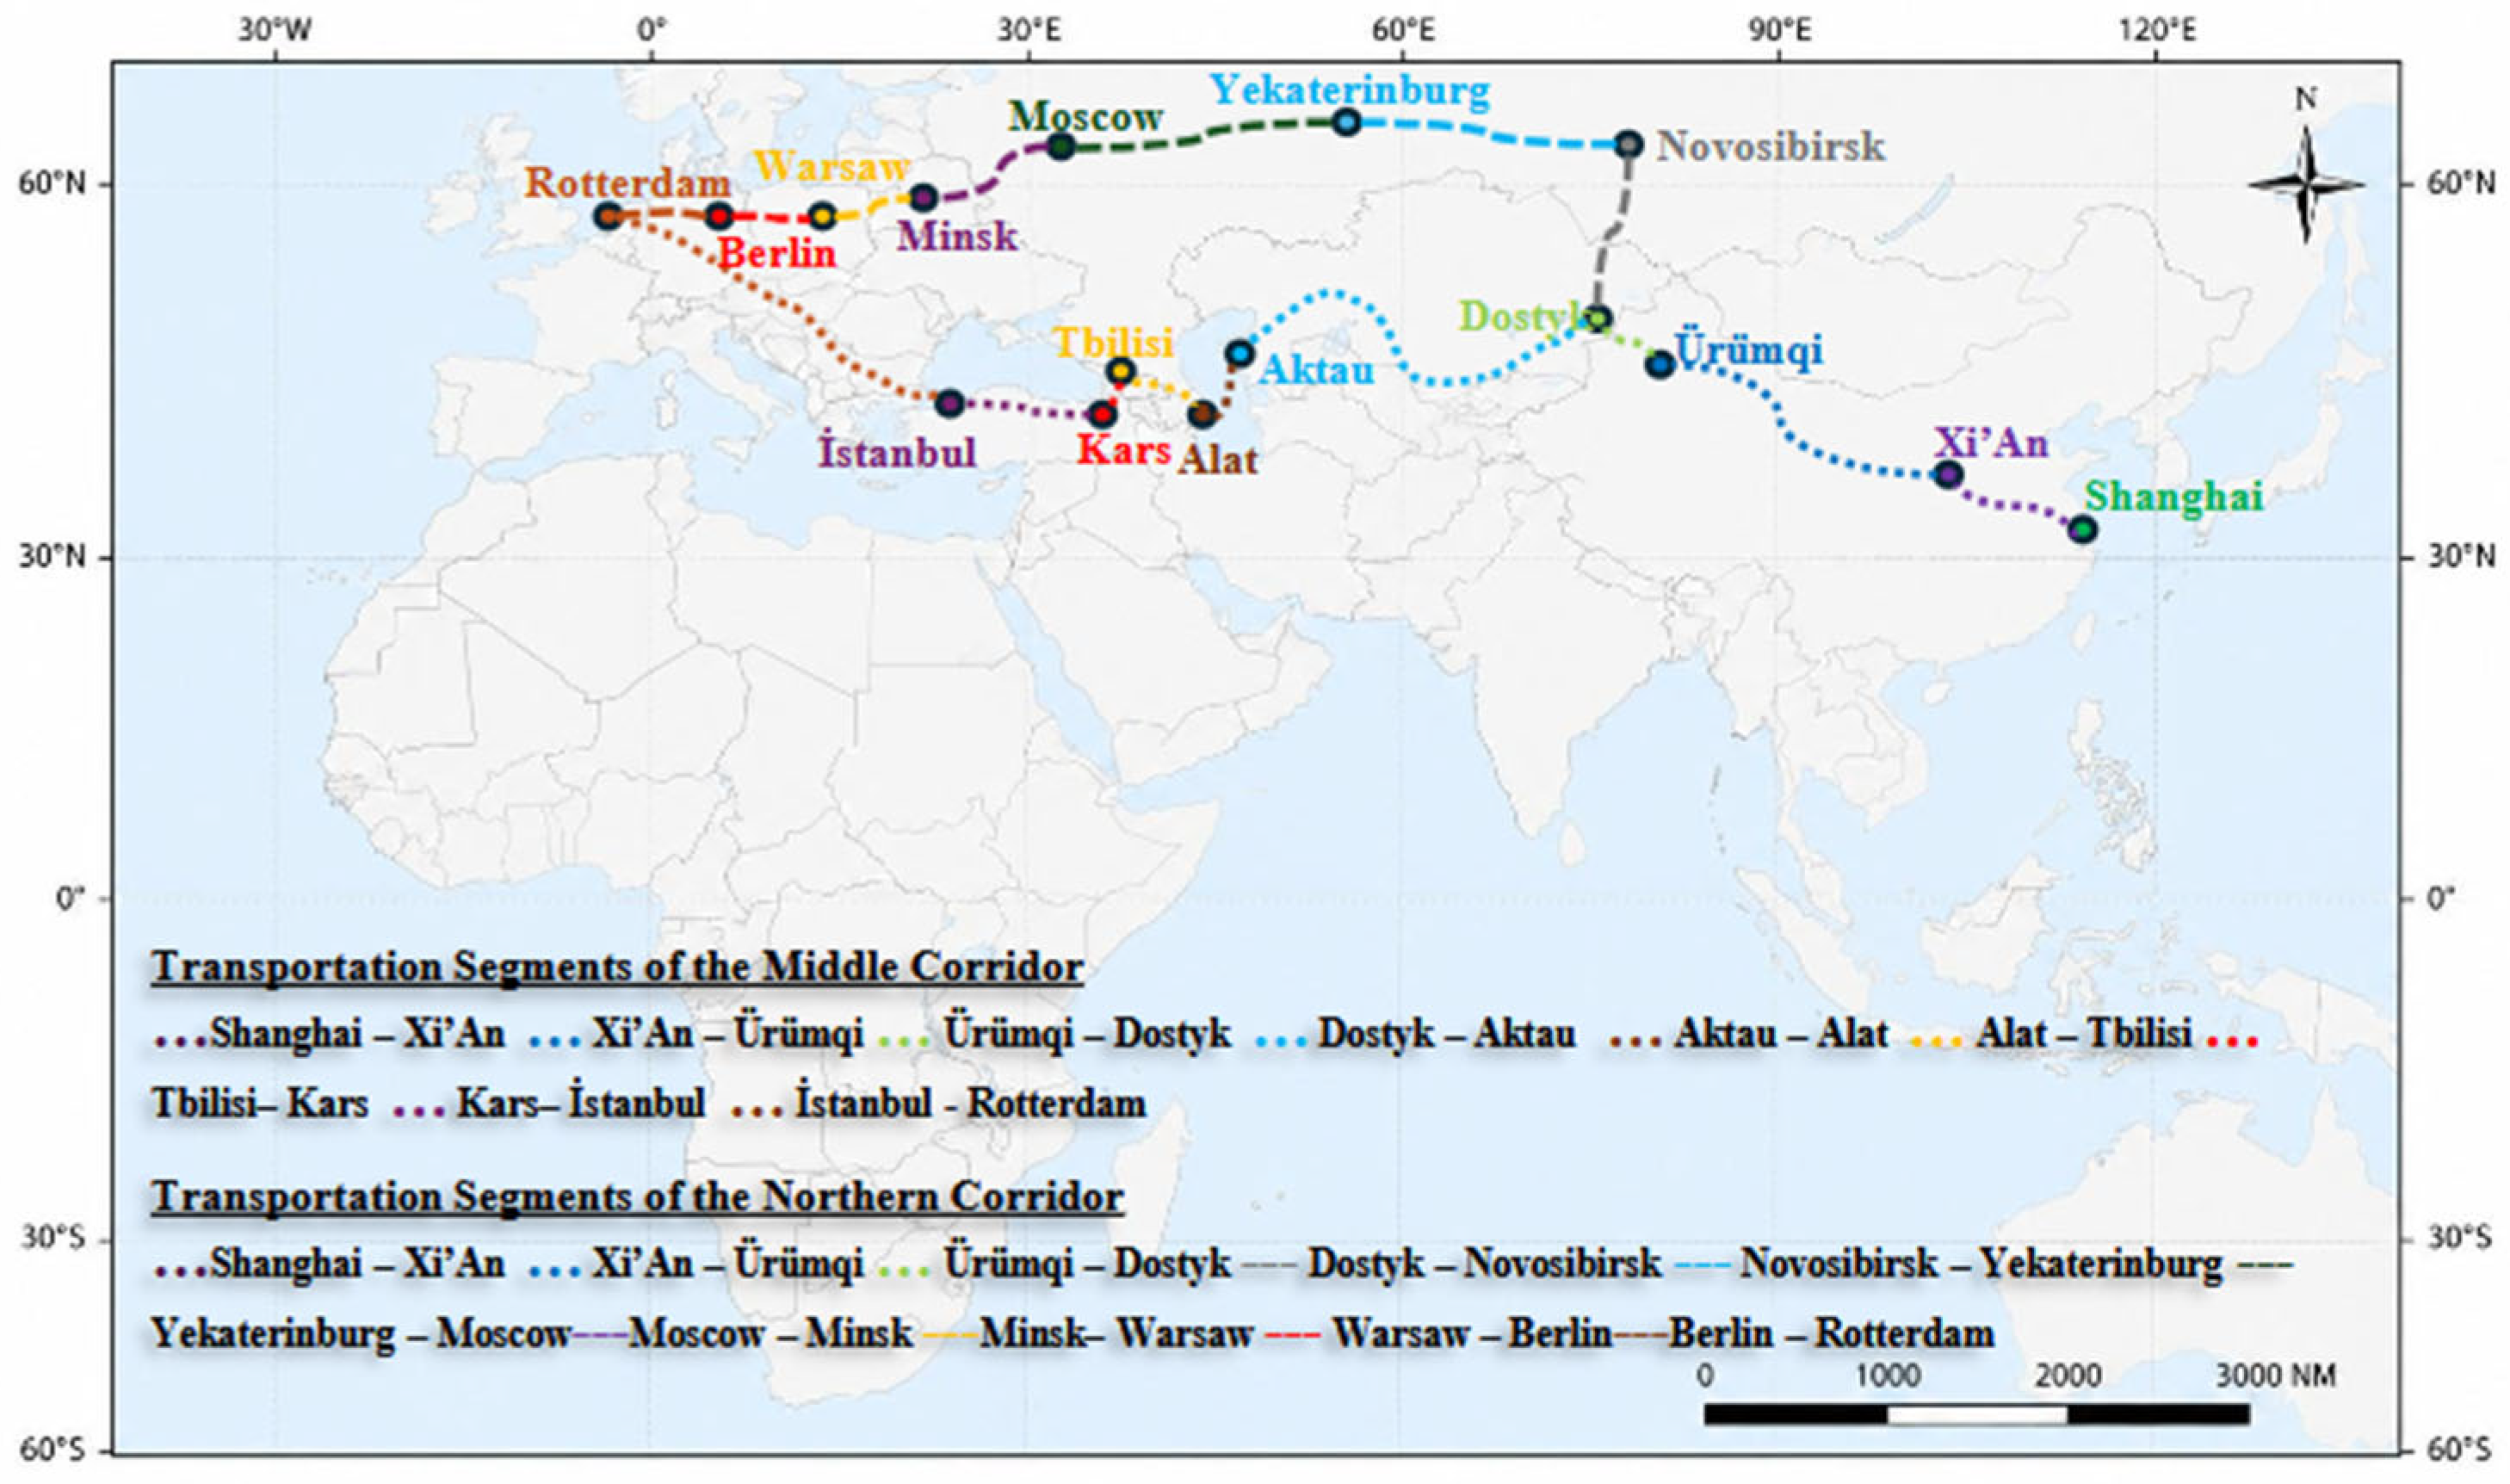
This study develops a comparative framework for evaluating alternative Eurasian freight transportation corridors in terms of distance, transit time, transportation cost, and carbon emissions. Shanghai, China and Rotterdam, the Netherlands were selected as the common origin and destination, respectively, to ensure a consistent geographical basis for the comparison. The analysis considers three principal transportation systems: the Northern Corridor, the Middle Corridor, and the Southern Corridor. Figure 1 illustrates the geographical layout of the Northern and Middle Corridors within the Eurasian freight transportation corridors.
Figure 1.
Geographical configuration of the Northern and Middle Eurasian freight corridors between Shanghai and Rotterdam.
The Northern Corridor was modeled as a predominantly rail-based transportation system connecting China with Northwestern Europe through Central Asia, Russia, Belarus, Poland, and Germany. The route consists of the Shanghai–Xi’an–Urumqi–Alashankou/Dostyk–Novosibirsk–Yekaterinburg–Moscow–Minsk–Warsaw–Berlin–Rotterdam segments.
The Middle Corridor was modeled as a multimodal transportation system that combines rail and maritime transport. The route extends from Shanghai through Xi’an and Urumqi to Dostyk and Aktau, then crosses the Caspian Sea between Aktau and Baku/Alat. Freight is subsequently transported by rail through Tbilisi, Kars, Istanbul, and Kapıkule before reaching Rotterdam. The Aktau–Baku/Alat segment was represented by a river vessel performed in an inland waterway, whereas the remaining segments were modeled as rail transportation.
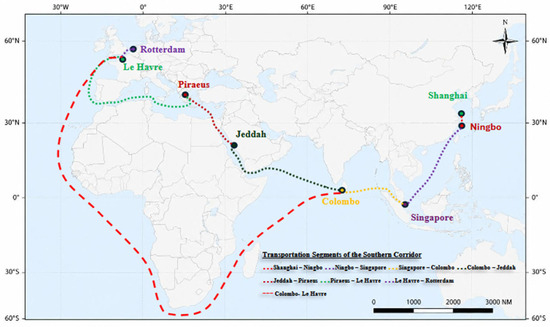
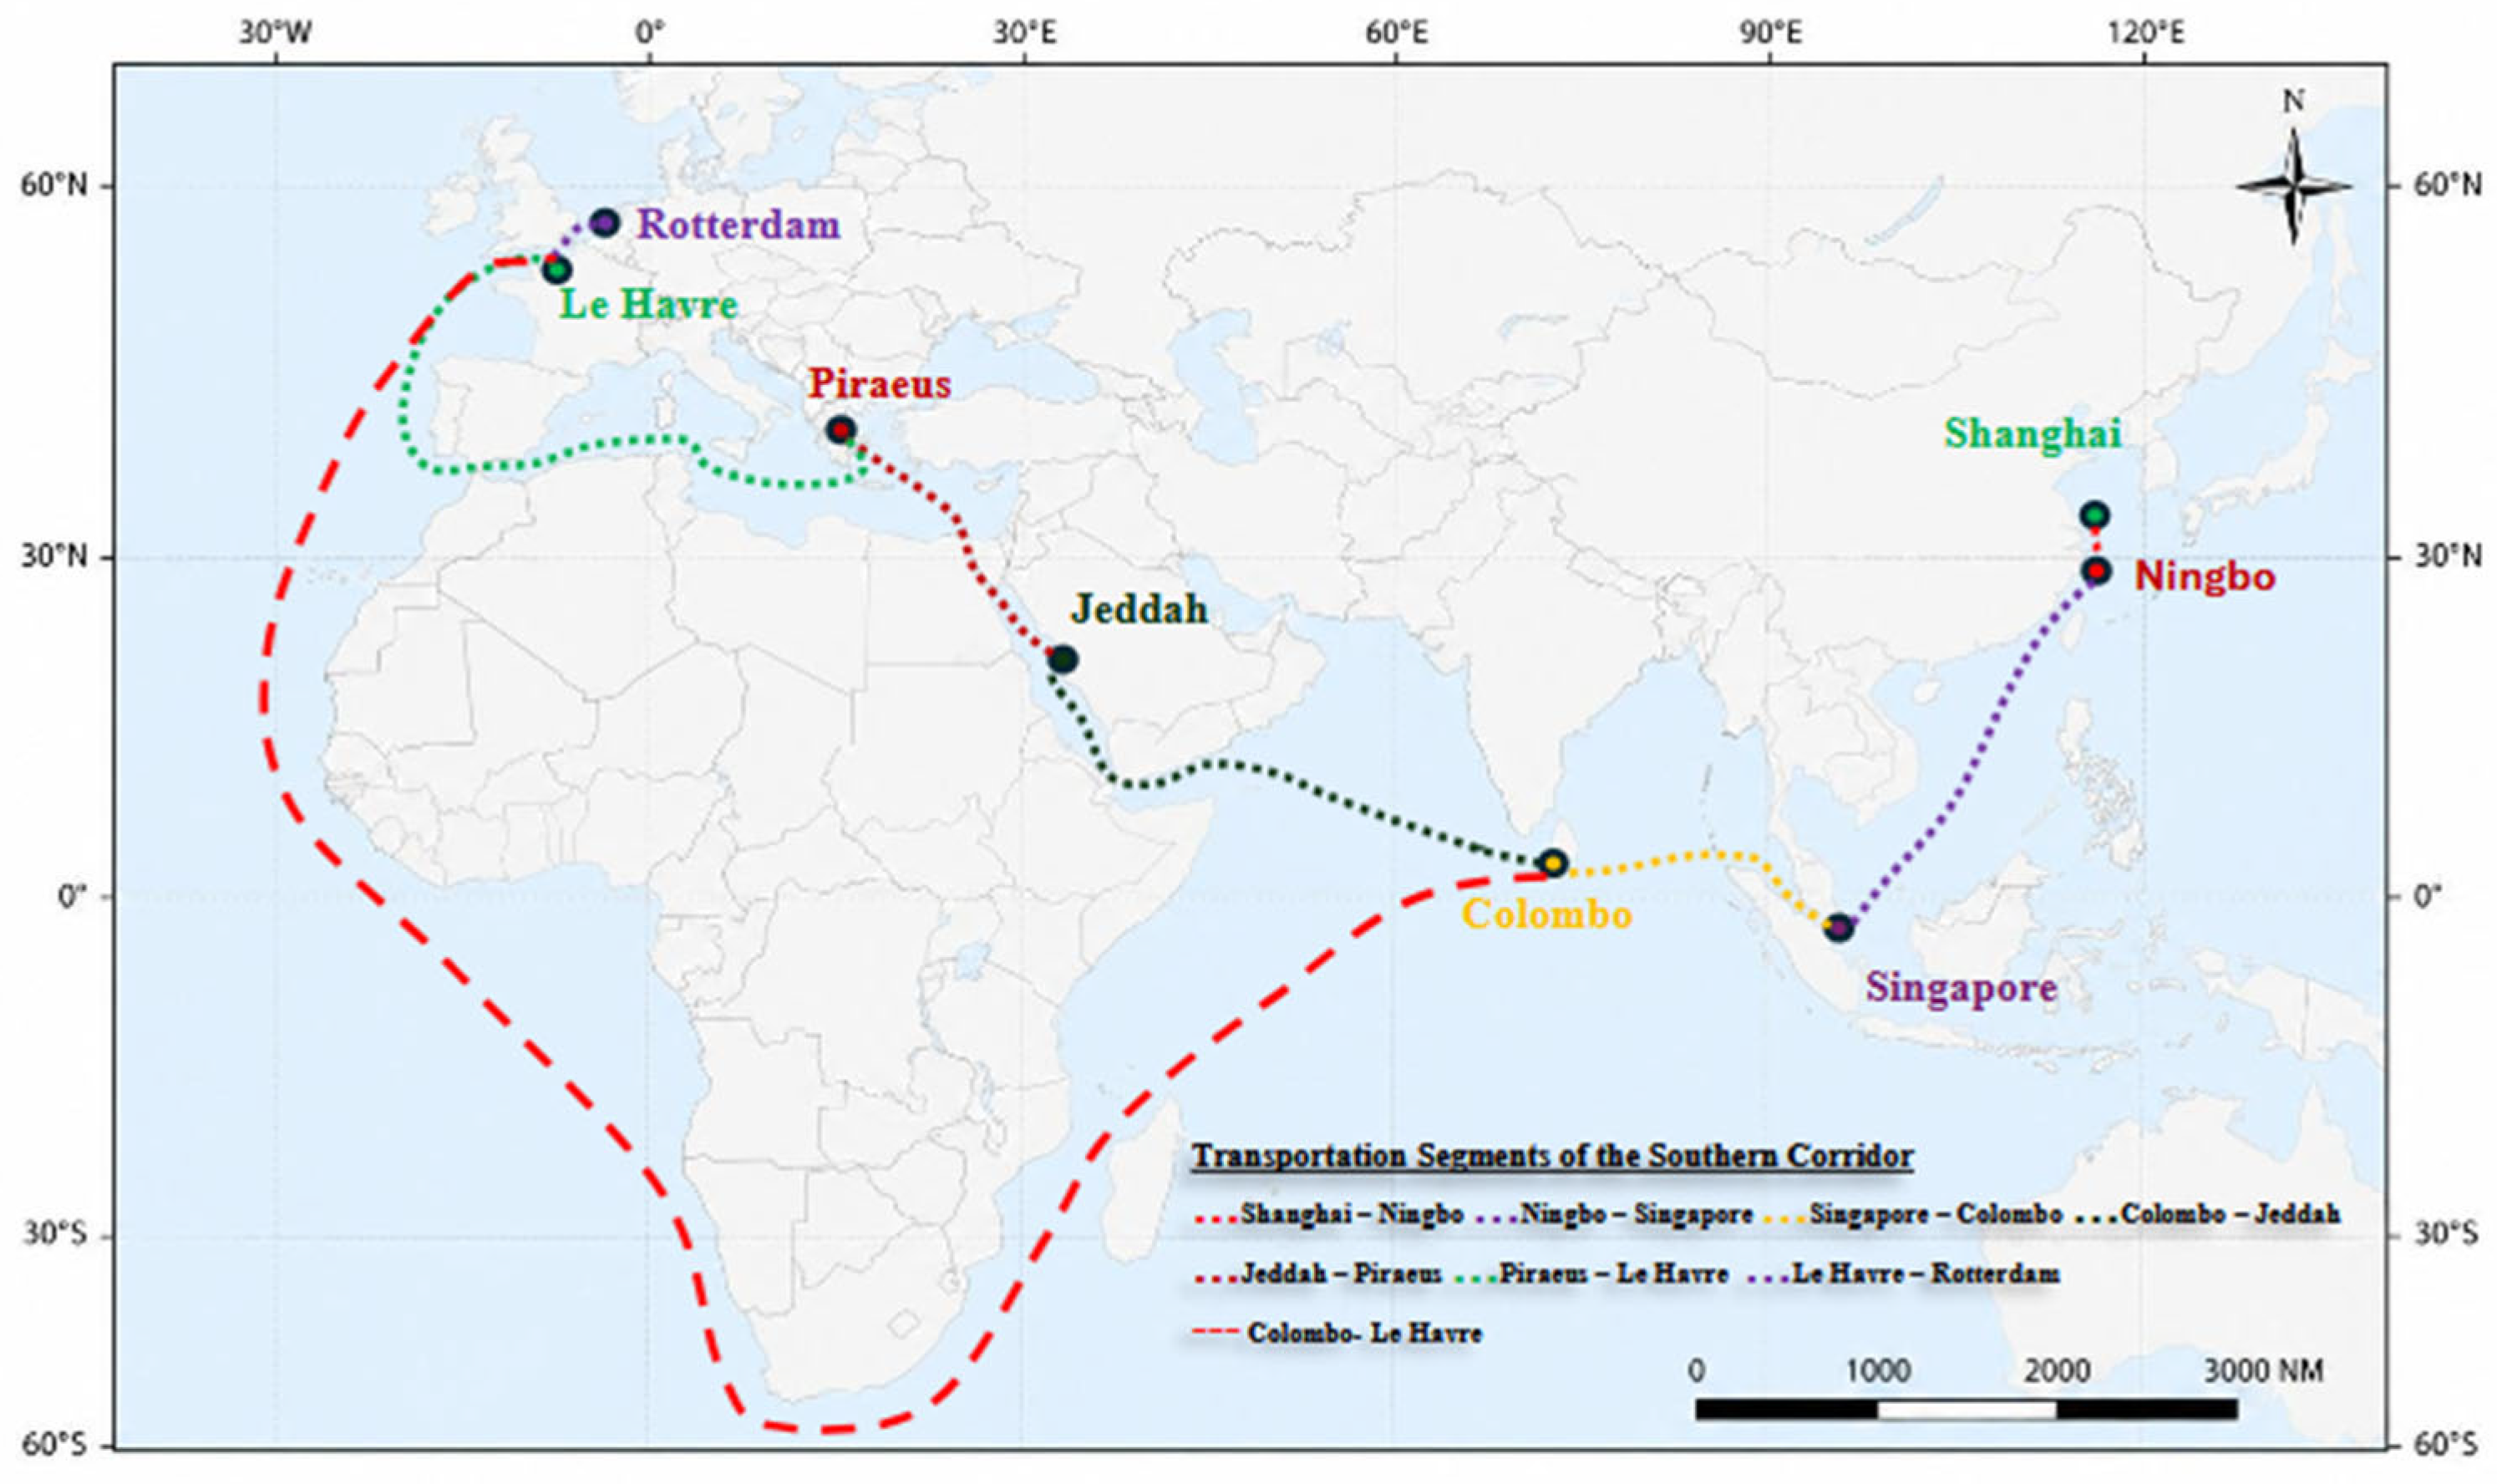
The Southern Corridor illustrated in Figure 2 represents maritime container transportation between East Asia and Northwestern Europe. Unlike the predominantly rail-based Northern Corridor and the multimodal Middle Corridor, this route is characterized by high-capacity container shipping. Two alternative maritime routing configurations were considered under the Southern Corridor: (i) the conventional route through the Suez Canal, and (ii) a longer route bypassing the Suez Canal via the Cape of Good Hope. In particular, the Cape of Good Hope alternative route has gained considerable popularity in recent years, primarily as a means of avoiding the waiting times and associated costs at the Suez Canal, as well as circumventing the political tensions and conflicts along that route. Thus, several shipping companies have redirected their routes toward this alternative and are conducting their freight operations accordingly. However, the Cape of Good Hope route has the potential to increase sailing distance, transit time, fuel-related transportation costs, and CO2 emissions due to its longer distance compared to the conventional route. By assessing these two alternative routes within the Southern Corridor, it becomes possible to evaluate the impact of route deviations on the corridor’s overall performance. The geographical configurations of the Southern Corridor are presented in Figure 2.
Figure 2.
Southern maritime route between Shanghai and Rotterdam through the Suez Canal and via the Cape of Good Hope.
For each corridor, the route was divided into individual transportation segments. Calculations were initially performed at the segment level and subsequently aggregated to obtain corridor-level performance indicators. The overall methodological framework is based on four principal indicators: total transportation distance, transit time, transportation cost, and CO2 emissions.
2.2. Operational and Technical Parameters
The calculations were based on the technical and operational characteristics of the transportation mode assigned to each segment. The principal parameters included transportation distance, vehicle carrying capacity, specific fuel consumption (SFC), engine power, fuel price, and average operating speed.
The carrying capacity was expressed in twenty-foot equivalent units (TEUs). Because rail and maritime transportation systems have substantially different cargo capacities, a direct comparison of total fuel consumption, cost, or emissions would not provide a representative assessment of their relative performance. Therefore, all economic and environmental results were subsequently normalized to a common functional unit of 100 TEU. Table 1 shows the main parameters.
Table 1.
The main parameters used in the analysis.
The calculations were based on mode-specific technical and operational parameters assigned to each transportation segment. The principal input parameters included cargo capacity, engine or traction power, specific fuel consumption (SFC), fuel type, fuel price, and average or service speed. Representative technical characteristics were adopted separately for rail, inland waterway, and deep-sea transportation to account for substantial differences in vehicle capacity and propulsion systems among these modes. The technical and operational input parameters used in the analysis are summarized in Table 2.
Table 2.
Technical and operational input parameters used in the analysis [25,26,27,28].
Although the rail, river vessel, and deep-sea vessel segments employ different fuel types including diesel, MGO, and HFO, respectively, a common CO2 emission factor of 3.16 t CO2/t fuel was applied across all three fuels. This is because CO2 emissions from combustion are primarily determined by the carbon content of the fuel rather than by other compositional differences, and the carbon content of diesel, MGO, and HFO is sufficiently similar according to the IPCC/IMO guidelines that a common factor of 3.16 t CO2/t fuel is widely adopted in the transport emissions literature for distillate and residual petroleum-based fuels. This assumption was applied intentionally and consistently across all modes to ensure comparability of results, rather than resulting from a data limitation.
2.3. Transit-Time Calculation
The transportation time for each segment was determined from the corresponding route distance and assumed average operating speed [29]. For the segment, transit time was calculated as Equation (1):
where is the transit time (h), Di is the segment distance (km), and is the average operating speed (km/h). The total transportation time for corridor j was subsequently calculated by summing the individual segment transit times as in Equation (2):
where n represents the number of transportation segments included in the corresponding corridor. Similarly, the total corridor distance was calculated as Equation (3):
This segment-based approach enables an explicit representation of differences in route configuration and transportation mode within each corridor.
2.4. Fuel Consumption and Transportation Cost Assessment
Fuel consumption was estimated using an activity-based, bottom-up approach in which engine power, specific fuel consumption, and operating time are the principal parameters that determine segment-level fuel demand. Similar power- and activity-based approaches have been widely applied in transportation emission assessments, particularly for estimating fuel consumption and emissions from marine transportation [30]. The hourly fuel consumption for the transportation segment was determined as Equation (4):
where, is the hourly fuel consumption (kg/h). Total fuel consumption over a transportation segment was determined in Equation (5):
The corresponding fuel cost was calculated with Equation (6):
where represents the fuel-based transportation cost (USD). Because vehicle capacities differ considerably between transportation modes, the calculated cost was normalized to 100 TEU as per Equation (7):
The total capacity-normalized cost of corridor j was subsequently determined as Equation (8):
This normalization allows the fuel-related transportation cost of rail, Ro-Ro, and container shipping operations to be compared using an identical freight basis.
2.5. Carbon Emission Assessment
Carbon emissions were estimated using a fuel-based approach, whereby the fuel consumption of each transportation segment was multiplied by the corresponding fuel-specific CO2 emission factor. Accordingly, only combustion-based, tank-to-wake emissions were considered in this study. This approach is consistent with established activity-based emission assessment methods, in which fuel consumption is first estimated from engine operating parameters and subsequently converted into CO2 emissions using fuel-specific conversion factors [31]. Carbon emissions were estimated from fuel consumption using the corresponding fuel-specific CO2 emission factor [29]. The hourly CO2 emission rate for transportation was calculated as per Equation (9):
where represents the CO2 emission rate (kg CO2/h) and is the fuel-specific CO2 emission factor (kg CO2 kg fuel). Total emissions generated during transportation segment were then determined as per Equation (10):
To ensure comparability between transportation modes with different carrying capacities, segment-level emissions were normalized to 100 TEU as per Equation (11). A functional unit of 100 TEU was adopted, as it constitutes a standard and comparable reference load widely employed in container shipping and intermodal freight research, thereby enabling meaningful comparisons across different corridors including different segments and transport modes.
Finally, total capacity-normalized emissions for each corridor were calculated as per Equation (12):
The use of a capacity-normalized indicator is particularly important when comparing rail and maritime transportation. Although large container vessels have considerably higher installed engine power and absolute fuel consumption, their substantially greater carrying capacity can result in lower emissions per unit of transported cargo. Therefore, the use of kg CO2/100 TEU provides a more appropriate basis for cross-modal comparison than absolute vehicle-level emissions.
2.6. Capacity Normalization and Corridor-Level Comparison
The functional unit adopted in this study was defined as the transportation of 100 TEU from Shanghai to Rotterdam. This functional unit was consistently applied to the economic and environmental indicators, whereas distance and transit time remained route-level characteristics and were therefore not capacity-normalized [3]. The performance of each corridor was consequently characterized by using four principal indicators as per Equation (13):
where represents total corridor distance, represents total transit time, represents fuel-based transportation cost per 100 TEU, and represents CO2 emissions per 100 TEU.
Rather than defining a single corridor as universally optimal, the comparison was designed to reveal the trade-offs among geographical distance, transportation time, economic performance, and carbon emissions. This approach enables the relative advantages and disadvantages of rail-dominated, multimodal, and maritime transportation systems to be evaluated within a consistent analytical framework.
3. Results
3.1. Performance of the Northern Corridor
Table 3 illustrates the segment-based performance indicators of the Northern Corridor, spanning from Shanghai to Rotterdam. This corridor traverses a cumulative distance of 11,852 km, connecting East Asia to Western Europe through China, Kazakhstan, Russia, Belarus, Poland, and Germany before reaching the port of Rotterdam. Based on an assumed average operational rail speed of 50 km/h, the estimated total transit time for the entire route is approximately 237.04 h, corresponding to nearly 9.88 days. The corresponding fuel-related transportation cost and CO2 emissions are estimated at USD 304,679/100 TEU and 506,730 kg CO2/100 TEU, respectively. This segment-level breakdown enables a more granular assessment of transportation efficiency along the corridor, facilitating comparison with the performance metrics reported for the other corridors examined in this study.
Table 3.
Segment-level performance of the Northern Corridor.
The segment-level results indicate that the environmental and economic burdens of the Northern Corridor are primarily determined by the length of individual rail sections. Since a common locomotive configuration, specific fuel consumption, operating speed, and carrying capacity were assumed for most rail segments, both fuel-related costs and CO2 emissions increase approximately in proportion to transportation distance. The Xi’an–Urumqi section, extending over 2616 km, therefore represents the largest individual contribution, generating approximately 111,847 kg CO2/100 TEU and a fuel-related cost of USD 67,250/100 TEU. In contrast, the relatively short Urumqi–Alashankou/Dostyk section contributes only 22,104 kg CO2/100 TEU and USD 13,291/100 TEU.
An important characteristic of the Northern Corridor is its relatively short transit time. The estimated total transportation time of 237.04 h, corresponding to approximately 9.9 days of continuous operating time under the assumptions adopted in the model, makes it the fastest of the four route configurations evaluated in this study. However, this time advantage is accompanied by comparatively high capacity-normalized fuel cost and CO2 emissions. This outcome is strongly influenced by the substantially lower carrying capacity of the rail system relative to deep-sea container shipping. As emphasized in the methodological framework, the functional unit of 100 TEU is therefore particularly important for interpreting these results, because vehicle-level fuel consumption alone would not provide an appropriate basis for cross-modal comparison.
3.2. Performance of the Middle Corridor
Table 4 presents the segment-level performance results for the Middle Corridor, which extends from Shanghai to Rotterdam via China, Kazakhstan, Azerbaijan, Georgia, Turkey, and continental Europe, including a Bulgaria/Poland–Germany route through Kapıkule, incorporating a maritime crossing of the Caspian Sea between Aktau and Baku/Alat in addition to rail transport. In contrast to the predominantly rail-based Northern Corridor, this multimodal configuration reflects the Middle Corridor’s distinct routing structure. The total length of this route is 13,992 km, and the corresponding estimated transportation time is approximately 304.17 h (12.67 days), based on the assumed operating speeds for each transport mode. The corresponding capacity-normalized CO2 emissions and fuel-related transportation cost were estimated at 597,530 kg CO2/100 TEU and USD 359,274/100 TEU, respectively.
Table 4.
Segment-level performance of the Middle Corridor.
The results show that the Dostyk–Aktau rail section constitutes the largest individual contributor to both environmental and economic performance along the Middle Corridor. With a distance of 4113 km and a calculated transit time of 82.26 h, this segment accounts for approximately 175,851 kg CO2/100 TEU and USD 105,733/100 TEU. The Shanghai–Xi’an and Xi’an–Urumqi sections also make substantial contributions because of their relatively long rail distances. Together, these results demonstrate that the overall performance of the Middle Corridor is strongly influenced by its long overland rail sections.
The Aktau–Baku/Alat crossing represents the principal modal transition within the corridor. Although its geographical distance is limited to 450 km, the segment requires approximately 33.33 h under the route-specific operating conditions adopted in the analysis. Nevertheless, its larger carrying capacity and different propulsion characteristics result in approximately 18,544 kg CO2/100 TEU and a fuel-related cost of USD 11,150/100 TEU. This illustrates the importance of considering not only the transportation distance, but also the operating speed, carrying capacity, engine power, and specific fuel consumption when assessing multimodal freight corridors.
Compared with the Northern Corridor, the Middle Corridor is approximately 18.1% longer in distance and requires approximately 28.3% more transit time. Its capacity-normalized CO2 emissions and fuel-related transportation cost were also approximately 17.9% and 16.4% higher, respectively. These differences indicate that under the technical and operational assumptions adopted in this study, the multimodal configuration of the Middle Corridor does not provide an immediate carbon, cost, or time advantage over the Northern Corridor. Nevertheless, the Middle Corridor should not be evaluated solely on these operational indicators, as its strategic value also arises from route diversification and reduced dependence on the predominantly Russia-oriented Northern Corridor.
3.3. Performance of the Southern Corridor via the Suez Canal
The segment-level results for the Southern Corridor via the Suez Canal are presented in Table 5. In contrast to the Northern and Middle Corridors, this route relies entirely on deep-sea container transport and covers a total distance of 20,189 km. Under the assumed service speed, the corresponding transit time is approximately 574.09 h, equivalent to 23.92 days. Despite its substantially longer distance and transit time, the route results in considerably lower capacity-normalized environmental and economic indicators, with total CO2 emissions of 117,457 kg CO2/100 TEU and a fuel-related transportation cost of USD 24,160/100 TEU.
Table 5.
Segment-level performance of the Southern Corridor via the Suez Canal.
At the segment level, the Colombo–Jeddah section represents the largest individual contribution to the Suez-based maritime route. This 5181 km section requires approximately 147.33 h and generates 30,142.8 kg CO2/100 TEU, with a corresponding fuel-related cost of approximately USD 6200/100 TEU. The Piraeus–Le Havre and Ningbo–Singapore sections are the next major contributors, reflecting their relatively long sailing distances. Conversely, the short Shanghai–Ningbo and Le Havre–Rotterdam sections make comparatively small contributions to the corridor-level environmental and economic burdens.
The comparatively low capacity-normalized CO2 emissions of the maritime route are primarily associated with the large carrying capacity of the container vessel considered in the analysis. While the vessel has a substantially greater installed engine power than the rail system, this energy demand is distributed over a much larger container capacity. Consequently, normalization to the common functional unit of 100 TEU considerably reduces the environmental and economic burden allocated to a given quantity of transported cargo. This result demonstrates why comparisons based solely on vehicle-level fuel consumption or engine power can lead to misleading conclusions when evaluating transportation modes with substantially different carrying capacities. The use of a common functional unit is therefore essential for the cross-modal comparison performed in this study.
Although the Suez-based Southern Corridor is approximately 70.3% longer than the Northern Corridor, its capacity-normalized CO2 emissions were approximately 76.8% lower. An even more pronounced difference was observed for fuel-related costs, which were approximately 92.1% lower than those of the Northern Corridor. Similar reductions were obtained relative to the Middle Corridor, with the maritime route producing approximately 80.3% lower CO2 emissions and 93.2% lower fuel-related cost. These results reveal a clear operational trade-off: the environmental and economic advantages of high-capacity maritime transportation are achieved at the expense of substantially longer transit time.
The principal disadvantage of the maritime route is transit time. The estimated 574.09 h required by the Suez configuration is approximately 142.2% greater than the 237.04 h estimated for the Northern Corridor and 88.7% greater than the 304.17 h estimated for the Middle Corridor. Accordingly, the results indicate that no single corridor simultaneously minimizes transportation time, fuel-related cost, and CO2 emissions. Instead, route selection involves a distinct trade-off between the speed advantage of rail transportation and the capacity-related environmental and economic efficiency of maritime shipping.
3.4. Performance of the Southern Corridor via the Cape of Good Hope
To examine the sensitivity of maritime transportation performance to major route deviations, the Southern Corridor was additionally evaluated using a routing configuration via the Cape of Good Hope. The segment-level results are presented in Table 6. The Cape configuration increases the total Shanghai–Rotterdam sailing distance to 27,178 km and the corresponding transit time to approximately 772.84 h (32.20 days). Total capacity-normalized CO2 emissions and fuel-related transportation cost increased to 158,121 kg CO2/100 TEU and USD 32,525/100 TEU, respectively.
Table 6.
Segment-level performance of the Southern Corridor via the Cape of Good Hope.
The principal source of this increase is the extended Colombo–Le Havre section via the Cape of Good Hope. At approximately 19,596 km, this segment alone requires 557.23 h of sailing time and accounts for 114,008.6 kg CO2/100 TEU and USD 23,451/100 TEU in fuel-related cost. Thus, the additional environmental and economic burden of the Cape configuration is concentrated primarily in the large geographical deviation required to bypass the Suez Canal.
Compared with the conventional Suez Canal route, rerouting via the Cape of Good Hope increases the total distance by approximately 6989 km, corresponding to an increase of about 34.6%. Under the common vessel and operating assumptions adopted in the model, this increase is directly reflected in the calculated transit time, CO2 emissions, and fuel-related cost, all of which increased by approximately 34.6%. The additional sailing distance therefore resulted in approximately 198.75 h (8.28 days) of additional transit time, 40,664 kg CO2/100 TEU of additional emissions, and USD 8365/100 TEU of additional fuel-related cost.
The nearly proportional increases observed across these indicators are a consequence of the modeling assumptions rather than an indication that these variables are universally proportional under real-world operating conditions. In the present framework, the same vessel characteristics, specific fuel consumption, service speed, and fuel price are applied to both maritime configurations. Consequently, route distance becomes the dominant factor governing the differences between the two maritime alternatives.
3.5. Comparative Carbon–Cost–Time Performance of the Alternative Corridors
Following the segment-level assessment, the results were aggregated at the corridor level to provide a direct comparison of the four alternative Shanghai–Rotterdam freight configurations. Table 7 summarizes the total distance, transit time, capacity-normalized CO2 emissions, and fuel-related transportation cost for the Northern Corridor, Middle Corridor, Southern Corridor via the Suez Canal, and Southern Corridor via the Cape of Good Hope.
Table 7.
Baseline comparison of the carbon–cost–time performance of alternative Shanghai–Rotterdam freight corridors.
The corridor-level results reveal a clear divergence between time performance and capacity-normalized environmental–economic performance. The Northern Corridor provides the shortest transportation distance and transit time, covering 11,852 km in approximately 237 h. The Middle Corridor ranks second in terms of both distance and transit time, whereas the two maritime alternatives require considerably longer transportation distances and sailing times. In particular, the Cape of Good Hope configuration represents the longest alternative, with a total distance of 27,178 km and an estimated transit time of approximately 773 h.
However, the ranking changes substantially when CO2 emissions and fuel-related costs are considered on the common functional basis of 100 TEU. Despite traveling a considerably greater distance, the Suez-based Southern Corridor produces the lowest capacity-normalized CO2 emissions, at 117,457 kg CO2/100 TEU, followed by the Cape of Good Hope route at 158,121 kg CO2/100 TEU. In contrast, the Northern and Middle Corridors generate 506,730 and 597,530 kg CO2/100 TEU, respectively. A similar pattern is observed for fuel-related transportation cost, with the Suez and Cape configurations yielding USD 24,160 and USD 32,525/100 TEU compared with USD 304,679 and USD 359,274/100 TEU for the Northern and Middle Corridors, respectively.
The results therefore demonstrate that geographical distance alone is not sufficient to characterize the environmental or economic performance of competing freight corridors. Although the maritime routes are substantially longer, the high carrying capacity of container vessels spreads propulsion-related fuel consumption and associated CO2 emissions over a much larger cargo volume. Conversely, the rail-dominated corridors offer a pronounced time advantage but exhibit substantially higher impacts when normalized to the same 100-TEU functional unit. The observed ranking should therefore be interpreted within the operational assumptions adopted in the present model, particularly the assumed vehicle capacities, engine loads, SFC values, service speeds, and fuel prices.
To facilitate interpretation of the magnitude of these differences, Table 8 expresses each indicator relative to the minimum value observed for that criterion. Accordingly, the Northern Corridor is used as the reference for distance and transit time, whereas the Suez-based Southern Corridor serves as the reference for CO2 emissions and fuel-related cost.
Table 8.
Percentage differences are calculated relative to the minimum value for each performance criterion.
The relative comparison further highlights the magnitude of the carbon–cost–time trade-off. From a time-oriented perspective, the Northern Corridor represents the most favorable alternative. The Middle Corridor requires approximately 28.3% more transit time than the Northern Corridor, whereas the Suez and Cape maritime configurations require approximately 142.2% and 226.0% more time, respectively. Thus, rail transportation offers a substantial advantage where delivery speed represents the dominant route-selection criterion.
The opposite pattern emerges for capacity-normalized environmental performance. Relative to the Suez-based Southern Corridor, CO2 emissions are approximately 331.4% higher for the Northern Corridor and 408.7% higher for the Middle Corridor. Even the Cape of Good Hope route, despite its considerable additional sailing distance, produces only 34.6% higher CO2 emissions than the Suez alternative under the adopted operating conditions.
The economic findings reveal an even more pronounced disparity. As described in Table 8, fuel-related costs for the Northern and Middle Corridors exceeded the Suez-based maritime reference by approximately 1161% and 1387%, respectively. This substantial gap stems primarily from the combined effect of transport capacity constraints and the fuel-price assumptions applied to each transportation mode. Consequently, the reported cost figures should be understood as fuel-related operational costs rather than comprehensive door-to-door freight rates, since factors such as terminal handling, transshipment, infrastructure access charges, customs procedures, insurance, inventory holding costs, and other logistics-related expenditures fall outside the scope of the present system boundary.
Taken together, the results indicate that none of the investigated corridors simultaneously minimizes all three principal performance dimensions. The Northern Corridor minimizes transit time, whereas the Suez-based Southern Corridor minimizes both capacity-normalized CO2 emissions and fuel-related cost. Under the baseline assumptions, the Middle Corridor does not outperform the Northern Corridor on any of the four operational indicators considered. Nevertheless, it retains considerable strategic value by offering geographical diversification, reducing dependence on a single route, and alleviating the transport load carried by alternative corridors. Similarly, the Cape of Good Hope route is inferior to the Suez configuration in terms of distance, transit time, CO2 emissions, and fuel-related cost under normal operating assumptions; however, this route gains considerable strategic importance under conditions that render Suez Canal transit unfavourable, namely geopolitical instability or armed conflict that restricts passage through the canal, or substantial increases in transit tariffs.
The baseline comparison, however, does not account for route-specific canal charges. Since the Suez configuration incurs a substantial transit fee while the Cape of Good Hope route avoids this cost, an additional scenario analysis was performed to determine whether the inclusion of the Suez Canal charge alters the economic ranking of the two maritime alternatives.
3.6. Effect of the Suez Canal Transit Fee
The baseline analysis presented above considers fuel-related transportation costs and therefore does not incorporate route-specific charges. This distinction is particularly relevant when comparing the two Southern Corridor configurations, since the Suez-based route is subject to a canal transit charge, whereas the Cape of Good Hope route avoids this cost. To examine the potential influence of this additional expenditure on route selection, a supplementary economic scenario was therefore evaluated.
For this scenario, a representative Suez Canal transit charge of USD per vessel passage was assumed. Since the analysis was based on a common functional unit of 100 TEU, the vessel-level canal charge was allocated according to the carrying capacity of the container vessel considered in the study. The normalized canal cost was calculated as Equation (14):
where represents the assumed canal transit charge and represents the vessel carrying capacity. Based on a vessel capacity of 19,224 TEU, the assumed transit fee of US$700,000 depends on the following parameters.
The resulting economic comparison between the Suez Canal and Cape of Good Hope configurations is presented in Table 9.
Table 9.
Comparison of the Southern maritime routes with and without the Suez Canal transit charges.
Table 9 demonstrates that the inclusion of the assumed canal charge reduces, but does not eliminate, the economic advantage of the Suez-based route. Before considering the canal fee, the fuel-related cost of the Cape of Good Hope route is approximately 34.6% higher than that of the Suez route. After allocating the assumed USD 700,000 canal charge to the transported cargo, the total cost of the Suez route increases from USD 24,160 to approximately USD 27,802/100 TEU. Consequently, the cost difference between the two maritime alternatives decreases from approximately USD 8365 to USD 4723/100 TEU. Further sensitivity analysis reveals that this cost differential is highly sensitive to the magnitude of the canal charge: should the assumed charge increase to approximately USD 1.6 million, the cost gap between the two maritime alternatives would be entirely eliminated, rendering both routes economically equivalent in terms of total transportation cost.
Nevertheless, the Cape of Good Hope configuration remains approximately 17.0% more expensive than the Suez-based alternative under the adopted scenario. Moreover, avoidance of the canal charge is accompanied by a substantial operational penalty: the Cape route requires approximately 6989 km of additional sailing distance and 198.75 h (8.28 days) of additional transit time while generating approximately 40,664 kg CO2/100 TEU of additional emissions. Thus, under the assumptions considered, the savings associated with avoiding the Suez Canal transit charge are insufficient to offset the additional fuel consumption associated with the longer Cape routing.
From a route-selection perspective, these findings demonstrate that canal charges should not be evaluated independently of the additional distance and fuel consumption required by alternative routing. Although bypassing the Suez Canal eliminates the canal transit charge, this financial benefit is partly or fully offset by the additional propulsion energy required for the longer voyage. The relative economic attractiveness of the two routes therefore depends on the interaction between canal charges, fuel prices, vessel characteristics, and additional sailing distance rather than on the canal fee alone.
3.7. Overall Discussion and Practical Implications
The comparative results demonstrate that the selection of a Eurasian freight corridor cannot be determined by geographical distance alone. Instead, the relative attractiveness of each route depends strongly on the performance criterion considered. In the present analysis, the rail-dominated Northern Corridor provides the shortest distance and transit time, whereas the maritime Southern Corridor via the Suez Canal provides the lowest capacity-normalized CO2 emissions and fuel-related transportation cost. The Middle Corridor occupies an intermediate position in terms of distance and transit time, but under the adopted technical and operational assumptions, does not outperform the Northern Corridor in terms of either CO2 emissions or fuel-related cost. These findings confirm the existence of a distinct trade-off between transportation speed and capacity-normalized environmental and economic performance.
The substantial environmental advantage of maritime transportation should primarily be interpreted in terms of carrying capacity. The large container vessel considered in this study transports substantially more TEU than the rail configuration, allowing propulsion-related fuel consumption and emissions to be distributed over a much greater cargo capacity. Consequently, although the Southern Corridor involves a considerably longer geographical distance, its normalized CO2 emissions remain below those of the rail-dominated alternatives. This finding also illustrates the importance of selecting an appropriate functional unit in cross-modal transportation assessments. Comparisons based on total vehicle emissions, engine power, or fuel consumption without accounting for cargo capacity could produce substantially different—and potentially misleading—rankings.
At the same time, the superior transit-time performance of rail transportation remains an important operational advantage. The Northern Corridor requires approximately 9.9 days of continuous modeled transportation time compared with approximately 23.9 days for the Suez-based maritime route. Therefore, the environmental and fuel-cost advantages of maritime transportation are accompanied by a substantial time penalty. From a logistics perspective, this suggests that the preferred route may depend on cargo characteristics and shipper priorities. Time-sensitive or high-value cargo may place greater emphasis on transit time, whereas less time-sensitive containerized cargo may benefit more strongly from the lower capacity-normalized cost and emissions associated with maritime transportation.
The results for the Middle Corridor require a broader interpretation. Although it did not achieve the minimum value for any of the four quantitative indicators considered in the present baseline analysis, its relevance extends beyond direct carbon–cost–time optimization. The World Bank identifies the Middle Corridor as an important multimodal connection between Chinese and European markets through Central Asia and the South Caucasus and emphasizes its potential contribution to trade connectivity, route diversification, and supply-chain resilience. The same assessment highlights bottlenecks associated particularly with Caspian crossings, vessel availability, port productivity, and coordination across the corridor.
Despite comparatively weaker performance across the four quantitative indicators, the Middle Corridor may nevertheless be preferable under certain strategic and geopolitical conditions. In particular, it provides an alternative routing option that avoids Russian territory, an increasingly salient consideration following the disruption of established Eurasian rail flows through Russia after 2022. It also diminishes dependence on maritime chokepoints such as the Suez Canal, whose susceptibility to closures, congestion, or security incidents, as evidenced by recent disruptions, can generate considerable uncertainty in global supply chains. Viewed from this perspective, the Middle Corridor operates less as a direct competitor optimized for cost or emissions and more as a resilience-oriented alternative that diversifies risk across the wider Eurasian transport network. Its strategic significance thus resides in reducing dependence on any single route or geopolitical actor, rather than in surpassing existing corridors on the specific technical indicators examined in this study.
This distinction is particularly important when interpreting the comparatively high modeled cost and transit time of the Middle Corridor. The World Bank has suggested that coordinated improvements in infrastructure, operations, and policy could substantially increase freight volumes and reduce travel times along the corridor by 2030. Accordingly, the results obtained in the present study should be viewed as a comparison under the specified baseline technical and operational conditions rather than as a fixed representation of the long-term performance potential of the corridor.
The comparison between the Suez Canal and Cape of Good Hope configurations further demonstrates the sensitivity of maritime environmental performance to route disruptions. In the present model, rerouting via the Cape increases sailing distance, transit time, fuel-related cost, and CO2 emissions by approximately 34.6% relative to the Suez configuration. This general direction is consistent with recent research on disruptions to container shipping networks. Yue et al., examining an Asia–Europe container shipping network, found that disruptions leading to alternative routing, particularly around the Cape of Good Hope, increased sailing requirements and substantially increased well-to-wake carbon emissions [32].
4. Conclusions
This study comparatively assessed the Northern, Middle, and Southern Eurasian freight corridors between Shanghai and Rotterdam in terms of transportation distance, transit time, fuel-related cost, and CO2 emissions using a common functional unit of 100 TEU. The results reveal a clear carbon–cost–time trade-off among the investigated alternatives, demonstrating that corridor performance cannot be represented by a single criterion. The Northern Corridor achieved the shortest distance and transit time, covering 11,852 km in approximately 237 h, while the Middle Corridor required 13,992 km and approximately 304 h. In contrast, the Suez-based Southern Corridor required approximately 574 h over 20,189 km but achieved the lowest capacity-normalized CO2 emissions and fuel-related cost, at approximately 117,457 kg CO2/100 TEU and USD 24,160/100 TEU, respectively. The Northern and Middle Corridors exhibited substantially higher normalized emissions and fuel-related costs despite their shorter distances and transit times. These findings directly address the study objective by demonstrating that the shortest or fastest transportation route does not necessarily provide the lowest environmental impact or fuel-related cost, highlighting the importance of evaluating Eurasian freight corridors within an integrated carbon–cost–time framework.
The comparison of the two maritime alternatives further demonstrates the importance of route configuration. Rerouting via the Cape of Good Hope increased the sailing distance from 20,189 to 27,178 km and extended the modeled transit time from approximately 574 to 773 h. Under identical vessel and operating assumptions, this additional distance resulted in approximately 34.6% higher CO2 emissions and fuel-related cost relative to the Suez-based route. The Cape alternative therefore provides a potential bypass option but entails substantial carbon, cost, and time penalties under the baseline conditions considered.
The additional Suez Canal fee scenario provides further insight into this economic trade-off. When a representative canal charge of USD 700,000 per vessel passage was considered, the normalized total cost of the Suez route increased from approximately USD 24,160 to USD 27,802/100 TEU. Nevertheless, the Cape of Good Hope route remained approximately 17.0% more expensive at USD 32,525/100 TEU. The estimated break-even analysis further indicated that the canal charge would need to reach approximately USD 1.61 million per vessel passage, under otherwise unchanged assumptions, before the modeled total cost of the Suez route became comparable to that of the Cape alternative. Thus, avoiding the canal charge alone does not necessarily compensate for the additional fuel consumption associated with the substantially longer Cape routing.
Overall, the comparative assessment shows that the relative suitability of each Eurasian freight corridor depends on the priority assigned to transit time, fuel-related cost, CO2 emissions, and route availability. Rail-based transportation provides a pronounced transit-time advantage, whereas high-capacity maritime transportation performs considerably better in terms of capacity-normalized fuel-related cost and CO2 emissions under the assumptions adopted in this study. The Middle Corridor remains relevant as a geographically diversified Eurasian connection, while the Cape of Good Hope route provides an alternative maritime configuration when Suez passage is constrained. Corridor selection should therefore be treated as a multi-criteria decision rather than being based on geographical distance or a single performance indicator.
The proposed framework provides a transparent basis for comparing technically different transportation modes using consistent system boundaries and a common freight functional unit. Nevertheless, the results should be interpreted within the scope of the adopted assumptions. The present analysis focused primarily on propulsion-related fuel consumption, associated CO2 emissions, and fuel-related transportation costs; terminal handling, port and rail access charges, transshipment costs, customs delays, insurance, inventory holding costs, congestion, waiting times, and other door-to-door logistics expenditures were not comprehensively represented. Furthermore, constant operating speeds, specific fuel consumption, carrying capacities, and operating conditions were assumed for the respective transport modes. Consequently, the reported transit times represent modeled operating times rather than observed end-to-end delivery times.
Future research could extend the framework by incorporating actual load factors, seasonal variations, terminal and border delays, dynamic fuel prices, port and infrastructure charges, carbon pricing, alternative fuels, and well-to-wake emission factors. In this respect, a broader range of environmental impact indicators could also be considered, extending beyond CO2 to other climate-relevant emissions and short-lived climate forcers, including CH4 and black carbon, to provide a more comprehensive assessment of the environmental footprint of alternative corridors. In addition, future studies could examine the Arctic shipping perspective, particularly the Northern Sea Route, as an alternative maritime route between Shanghai and Rotterdam, given its potential to substantially shorten sailing distance under changing ice conditions. The integration of stochastic disruption scenarios and multi-criteria optimization could further enable the simultaneous assessment of economic performance, environmental impact, transit time, and supply-chain resilience. Such extensions would provide a more comprehensive decision-support framework for planning and decarbonizing future Eurasian freight transportation networks.
Author Contributions
Conceptualization, K.B. and M.S.; methodology, K.B. and M.B.; software, K.B. and M.B.; validation, K.B., M.B. and M.S.; formal analysis, K.B.; investigation, M.S. and K.B.; resources, M.B.; data curation, M.S., K.B. and M.B.; writing—original draft preparation, M.S.; writing—review and editing, M.S., K.B. and M.B.; visualization, M.S., K.B. and M.B.; supervision, M.S.; project administration, M.S., K.B. and M.B. All authors have read and agreed to the published version of the manuscript.
Funding
This research received no external funding.
Institutional Review Board Statement
Not applicable.
Informed Consent Statement
Not applicable.
Data Availability Statement
The original contributions presented in this study are included in the article. Further inquiries can be directed to the corresponding author(s).
Acknowledgments
During the preparation of this manuscript, the authors used ChatGPT (OpenAI, GPT-6) to refine the language, improve academic clarity, and assist with the organization and presentation of the manuscript. The authors reviewed and edited all AI-assisted output and take full responsibility for the content of this publication.
Conflicts of Interest
The authors declare no conflicts of interest.
References
- Cheng, Z.; Li, Y.; Zhao, L.; Zeng, M.; Shi, Z.; Wen, F. Transportation Carbon Emission Structural Lock-in and Subsidy Mechanism Design in the “Belt and Road Initiative”. Transp. Policy 2025, 162, 424–442. [Google Scholar] [CrossRef] [Scilit]
- Traut, M.; Larkin, A.; Anderson, K.; McGlade, C.; Sharmina, M.; Smith, T. CO2 Abatement Goals for International Shipping. Clim. Policy 2018, 18, 1066–1075. [Google Scholar] [CrossRef] [Scilit]
- Yang, L.; Zhang, C.; Wu, X. Multi-Objective Path Optimization of Highway-Railway Multimodal Transport Considering Carbon Emissions. Appl. Sci. 2023, 13, 4731. [Google Scholar] [CrossRef] [Scilit]
- Wu, Y.; Chen, C.; Hu, C. Does the Belt and Road Initiative Increase the Carbon Emission Intensity of Participating Countries? China World Econ. 2021, 29, 1–25. [Google Scholar] [CrossRef] [Scilit]
- Zhang, Y.; Zhang, A.; Wang, K.; Zheng, S.; Yang, H.; Hong, J. Impact of CR Express and Intermodal Freight Transport Competition on China-Europe Route: Emission and Welfare Implications. Transp. Res. Part A Policy Pract. 2023, 171, 103642. [Google Scholar] [CrossRef] [Scilit]
- Wang, C.; Huang, H.; Ma, Z.; Kim, C.; Ge, Y.-E. Empirical Analysis of Sustainable Development of Multimodal Transportation in China-Europe Logistics Corridors. Transp. Policy 2026, 187, 104311. [Google Scholar] [CrossRef] [Scilit]
- Jiang, Y.; Qiao, G.; Lu, J. Impacts of the New International Land–Sea Trade Corridor on the Freight Transport Structure in China, Central Asia, the ASEAN Countries and the EU. Res. Transp. Bus. Manag. 2020, 35, 100419. [Google Scholar] [CrossRef] [Scilit]
- Nemoto, T. Planning Framework for International Freight Transportation Infrastructure: A Case Study on the East-West Economic Corridor in the Greater Mekong Subregion. Asian J. Shipp. Logist. 2009, 25, 253–271. [Google Scholar] [CrossRef] [Scilit]
- Wong, E.Y.C.; Ling, K.K.T.; Tai, A.H.; Yuen, A. Two-Stage Multilateral Trade-Based Prediction Model for Freight Transport Carbon Emission of Belt and Road Countries along Eurasian Landbridges. Int. J. Sustain. Transp. 2024, 18, 633–650. [Google Scholar] [CrossRef] [Scilit]
- Wei, H.; Mao, T.; Lee, S.J. Low-Carbon China-Europe Multi-Corridor Container Freight Network under Shipping Disruption Risks. Transp. Res. Part E Logist. Transp. Rev. 2026, 216, 105136. [Google Scholar] [CrossRef] [Scilit]
- Xie, C.; Wang, R.; Wang, D.; Zou, B.; Fu, X.; Chen, X.; Lu, Q.-C. Incorporating Revenue Loss and Congestion Cost into Rail Freight Subsidy Design: Lessons Learned from the China-Europe Freight Transportation Network. Transp. Policy 2025, 174, 103819. [Google Scholar] [CrossRef] [Scilit]
- Al-Mousa, M.; Sipilä, H.; Högdahl, J.; Fröidh, O.; Kordnejad, B. Assessing Rail Freight Reliability under Mixed-Traffic Conditions: The Role of Capacity Allocation and Traffic Management Policy. Transp. Res. Part A Policy Pract. 2026, 210, 105038. [Google Scholar] [CrossRef] [Scilit]
- Liu, K.; Fu, Q. How Does Geopolitical Risk Affect International Freight? J. Air Transp. Manag. 2024, 118, 102614. [Google Scholar] [CrossRef] [Scilit]
- Rentschler, J.; Reinhardt, A.; Elbert, R.; Hummel, D. The Trans-Caspian Corridor–Geopolitical Implications and Transport Opportunities. J. Transp. Geogr. 2025, 125, 104211. [Google Scholar] [CrossRef] [Scilit]
- World Bank. Middle Trade and Transport Corridor—Policies and Investments to Triple Freight Volumes and Halve Travel Time by 2030; World Bank: Washington, DC, USA, 2026. [Google Scholar]
- European Commission. Study on Sustainable Transport Connections with Central Asia; European Commission: Brussels, Belgium, 2026. [Google Scholar]
- European Bank for Reconstruction and Development (EBRD). EBRD and EU Help Improve Sustainability of Transportation through Transcaspian Corridor; EBRD: London, UK, 2025; Available online: https://www.ebrd.com/home/news-and-events/news/2025/ebrd-and-eu-help-improve-sustainability-of-transportation-throug.html (accessed on 9 June 2026).
- Yu, M.; Yang, H.; Zhou, Y.; Lai, X.; Wang, G. International Multimodal Transportation Optimization Considering Bulk Cargo Containerization. Comput. Oper. Res. 2025, 182, 107095. [Google Scholar] [CrossRef] [Scilit]
- Bayramoğlu, K.; Çelikoğlu, Ş.; Turan, İ. An Examination of the Emissions, Cost, and Time of Intermodal Transportation. Sustainability 2025, 17, 2368. [Google Scholar] [CrossRef] [Scilit]
- Buchanan, C.A.; Charara, M.; Sullivan, J.L.; Lewis, G.M.; Keoleian, G.A. Lightweighting Shipping Containers: Life Cycle Impacts on Multimodal Freight Transportation. Transp. Res. Part D Transp. Environ. 2018, 62, 418–432. [Google Scholar] [CrossRef] [Scilit]
- Nurseiit, N. Attractiveness and Prospects of the Middle Corridor for Cargo Transportation Between Europe and Asia. J. Eurasian Stud. 2026, 17, 167–182. [Google Scholar] [CrossRef] [Scilit]
- Khussanov, A.; Kaldybayeva, B.; Prokhorov, O.; Khussanov, Z.; Kenzhebekov, D.; Yevadilla, M.; Janabayev, D. Agent-Based Simulation Modeling of Multimodal Transport Flows in Transportation System of Kazakhstan. Logistics 2025, 9, 172. [Google Scholar] [CrossRef] [Scilit]
- Triantoro, W.; Mangan, J.; Rietig, K. Towards Maritime Transport Decarbonisation in Developing Countries: A Systematic Literature Review. Mar. Policy 2026, 185, 106989. [Google Scholar] [CrossRef] [Scilit]
- Alquraish, M.; Abuhasel, K. Assessing the Environmental Impact of Freight Transportation in Multinational Supply Chains and Its Sustainable Alternatives. Res. Sq. 2026. [Google Scholar] [CrossRef] [Scilit] [PubMed]
- MAN Energy Solutions. CEAS Engine Calculations; MAN Energy Solutions: Augsburg, Germany, 2025. [Google Scholar]
- Popa, G.; Ghei, M.A. Locomotive Diesel Engine Operation with Optimal Specific Fuel Consumption. Procedia Manuf. 2020, 46, 440–444. [Google Scholar] [CrossRef] [Scilit]
- Caterpillar Motoren GmbH Co. Caterpillar 3512E Marine Main Engine; Caterpillar Motoren GmbH Co.: Kiel, Germany, 2025. [Google Scholar]
- CRRC. Diesel Locomotives Tailored Solutions for High Performance; CRRC: Beijing, China, 2025. [Google Scholar]
- Cheng, C.; Li, Z.; Yan, Y.; Cui, Q.; Zhang, Y.; Liu, L. Maritime Freight Carbon Emission in the U.S. Using AIS Data from 2018 to 2022. Sci. Data 2024, 11, 542. [Google Scholar] [CrossRef] [Scilit] [PubMed]
- Nunes, R.A.O.; Alvim-Ferraz, M.C.M.; Martins, F.G.; Sousa, S.I.V. The Activity-Based Methodology to Assess Ship Emissions—A Review. Environ. Pollut. 2017, 231, 87–103. [Google Scholar] [CrossRef] [Scilit] [PubMed]
- Skoko, I.; Stanivuk, T.; Franic, B.; Bozic, D. Comparative Analysis of CO2 Emissions, Fuel Consumption, and Fuel Costs of Diesel and Hybrid Dredger Ship Engines. J. Mar. Sci. Eng. 2024, 12, 999. [Google Scholar] [CrossRef] [Scilit]
- Yue, Z.; Mustakim, A.; Mangan, J.; Yalcin, E. Carbon Footprint Impacts Arising from Disruptions to Container Shipping Networks. Transp. Res. Part D Transp. Environ. 2024, 134, 104335. [Google Scholar] [CrossRef] [Scilit]

Disclaimer/Publisher’s Note: The statements, opinions and data contained in all publications are solely those of the individual author(s) and contributor(s) and not of MDPI and/or the editor(s). MDPI and/or the editor(s) disclaim responsibility for any injury to people or property resulting from any ideas, methods, instructions or products referred to in the content. |
© 2026 by the authors. Licensee MDPI, Basel, Switzerland. This article is an open access article distributed under the terms and conditions of the Creative Commons Attribution (CC BY) license.