


Abstract
Cross-regional greenhouse gas emission linkages have contributed to the formation of interconnected carbon emission networks among cities. However, whether a city’s position within such networks influences agricultural green total factor productivity (AGTFP) remains insufficiently understood. Using panel data from 40 prefecture-level cities in the Yangtze River Delta, China, from 2010 to 2024, this study measures AGTFP using a super-efficiency SBM model and constructs a carbon emission network based on a modified gravity model and social network analysis. Degree centrality is employed to capture cities’ network positions. Two-way fixed-effects, threshold, and moderation models are applied to examine the relationship between network centrality and AGTFP. The results show that carbon emission network centrality is positively associated with AGTFP, primarily through improvements in technical efficiency rather than technological progress. The relationship exhibits a nonlinear pattern: CENC is positively associated with AGTFP when the urban–rural income gap is below a certain threshold, but the association becomes negative when the gap exceeds this threshold. Moreover, stronger water resource management enhances the positive association between network centrality and AGTFP. These findings underscore the significance of network-based coordination and institutional capacity in driving agricultural green transformation.
1. Introduction
Climate change has become one of the most pressing global sustainability challenges, driven largely by the continuous accumulation of greenhouse gas emissions. A growing body of the literature suggests that carbon emissions are no longer confined within administrative boundaries but are increasingly characterized by strong interregional interdependence through industrial linkages, trade flows, and factor mobility [1]. Consequently, carbon emissions have evolved into complex spatially interconnected networks, where a region’s structural position within the network may have important implications for both environmental and economic outcomes.
Against this global backdrop, China—one of the world’s largest carbon emitters—faces increasing pressure to balance economic development with low-carbon transition and ecological sustainability. As a fundamental sector of the national economy, agriculture plays a vital role in ensuring food security, supporting rural revitalization, and contributing to national carbon mitigation goals. In recent years, China has promoted agricultural green development by improving resource use efficiency, encouraging clean production practices, and strengthening the recycling of agricultural waste, thereby accelerating the transition toward low-carbon agricultural systems [2].
Agricultural green total factor productivity (AGTFP), which incorporates environmental constraints into the traditional productivity framework, provides a comprehensive measure of both efficiency and sustainability in agricultural development. It has therefore become a key indicator for evaluating the progress of agricultural green transformation [3].
However, existing studies have primarily examined the relationship between carbon emissions and agricultural green productivity from the perspectives of emission levels, environmental regulation, or spatial spillovers, while relatively limited attention has been paid to the structural position of cities within intercity carbon emission networks. This distinction is important because a city’s position in a carbon emission network captures its relational connections with other cities rather than merely its own emission level. Such network linkages may be associated with the transmission of knowledge, technology, production factors, and environmental practices across cities, thereby potentially influencing agricultural green productivity.
To address this gap, this study uses panel data from 40 prefecture-level cities in the Yangtze River Delta, China, covering the period 2010–2024. A regional carbon emission network is constructed based on a modified gravity model and social network analysis, and network position is measured using degree centrality. A two-way fixed effects model, panel threshold model, and moderation model are employed to examine the relationship between network centrality and AGTFP, its nonlinear characteristics, and its conditioning factors.
This study contributes to the existing literature in three aspects. First, it extends agricultural green productivity research from a conventional emission-level perspective to a relational network perspective by examining whether a city’s structural position within an intercity carbon emission network is associated with its green productivity performance. Second, it provides further insights into the potential sources of the observed association by decomposing AGTFP into technical efficiency and technological progress. Third, it explores the boundary conditions of the CENC–AGTFP association by examining the nonlinear role of urban–rural income inequality and the moderating role of water resource management.
2. Literature Review
The measurement of agricultural green total factor productivity (AGTFP) has developed into a relatively mature research field, mainly based on two methodological streams: non-parametric Data Envelopment Analysis (DEA) and parametric Stochastic Frontier Analysis (SFA). Within the DEA framework, the Slack-Based Measure (SBM) combined with the Global Malmquist–Luenberger (GML) index is widely adopted to account for undesirable outputs such as agricultural carbon emissions and non-point source pollution. For instance, Shen et al. [4] applied the SBM-GML approach to provincial-level data in China and found that technological progress was the main driver of AGTFP growth. Li, Chen and Min [5] incorporated agricultural non-point source pollution into a directional distance function–Malmquist framework and found that agricultural productivity growth remains constrained by environmental factors. Overall, the measurement of AGTFP has reached a relatively mature stage.
The existing literature on the determinants of AGTFP can be broadly divided into two strands: internal factor-driven studies and external policy-oriented studies. The former highlights the role of land transfer [6] and agricultural machinery subsidies [7] in improving productivity, while the latter emphasizes the positive effects of digital agriculture [8] and ecological compensation policies [9]. However, this literature has predominantly focused on local production factors, policy interventions, and spatial spillovers, with comparatively limited attention to the intercity relational structures generated by carbon emissions and economic linkages.
From a network perspective, recent research has increasingly conceptualized carbon emissions as an intercity relational phenomenon rather than merely a city-specific environmental attribute. Methodologically, studies have commonly combined modified gravity models with social network analysis (SNA) to construct and characterize intercity carbon-emission networks [10,11]. This literature has documented substantial heterogeneity in network connectivity, structural position, and evolutionary patterns across regions, provinces, and urban agglomerations [12,13], with recent studies further extending the framework to multidimensional factor-flow networks [14]. Collectively, these studies suggest that carbon emissions are embedded in interconnected urban systems, implying that cities may differ not only in their emission levels but also in their structural positions within emission networks.
Building on this network perspective, a related strand of research has examined whether network centrality and positional characteristics are associated with environmental and regional outcomes [15,16]. This literature suggests that network position captures more than the scale of local emissions; it reflects a city’s connectivity, embeddedness, and structural influence within a broader intercity system. Yet, whether such positional characteristics are systematically associated with agricultural green productivity remains insufficiently explored.
Taken together, the existing literature reveals an important conceptual disconnect between research on agricultural green productivity and research on carbon-emission networks. AGTFP studies have increasingly incorporated environmental constraints and examined the roles of local production factors, technological progress, policy interventions, and spatial interactions. Carbon-emission network studies, in contrast, have primarily focused on network structure, connectivity, and spatial evolution. What remains insufficiently understood is whether the relational position of a city within an intercity carbon-emission system constitutes a meaningful dimension of its agricultural green productivity.
This study therefore shifts the analytical perspective from carbon-emission levels to network position. Rather than treating carbon emissions solely as a local environmental attribute, we conceptualize a city’s position within the intercity carbon-emission network as a relational characteristic that may be systematically associated with its agricultural green productivity. Furthermore, the study moves beyond the average linear association by examining whether the CENC–AGTFP relationship varies across different levels of urban–rural income inequality and whether water resource management conditions this relationship. Table 1 summarizes how these strands converge on the unresolved question addressed in this study and highlights the corresponding contribution of the present research.
Table 1.
Literature Positioning and Contribution of the Present Study.
3. Theoretical Analysis and Research Hypotheses
The strengthening of intercity economic linkages facilitates the free mobility of production factors such as labor and capital across regions. On the one hand, this increases the opportunity cost of carbon-intensive production modes, accelerates the orderly reallocation of agricultural labor toward non-agricultural sectors, and promotes large-scale land operation and mechanized farming, thereby improving the input–output efficiency of agricultural production [17,18]. On the other hand, low-carbon agricultural technologies originating from core cities within the spatial correlation network tend to diffuse more rapidly to peripheral regions, significantly reducing the adoption costs of green technologies [19]. In addition, intensified competition encourages emerging agricultural operators to adopt environmentally friendly production technologies and fosters green specialization and coordination through value-chain linkages, thereby avoiding low-end homogeneous competition [20,21].
Although these mechanisms have primarily been validated in the context of formal policy coordination, their underlying logic is equally applicable to a city’s position within the carbon emission correlation network. Cities with higher network centrality are more likely to serve as convergence nodes for factor flows, technological spillovers, and market information, thereby passively benefiting from green technology diffusion and improved resource allocation efficiency.
H1.
Cities with higher centrality in the carbon emission correlation network exhibit higher agricultural green total factor productivity (AGTFP).
AGTFP dynamics can be decomposed into two components: technological change (TC) and technical efficiency change (EC). TC reflects outward shifts in the production frontier driven by green innovation and technology diffusion, whereas EC captures improvements in the ability of regions to approach the production frontier through better resource allocation and management practices.
Carbon emission correlation networks may be associated with AGTFP through two complementary channels. First, network centrality facilitates interregional technology spillovers, thereby promoting green technological innovation and driving technological progress. Second, intensified competition and regulatory convergence induced by network interactions encourage agricultural producers to optimize input allocation and operational efficiency.
H2a.
Carbon emission network centrality improves AGTFP primarily through technological change (TC).
H2b.
Carbon emission network centrality improves AGTFP primarily through technical efficiency change (EC).
When the urban–rural income gap is relatively small, rural areas tend to retain sufficient labor and human capital, enabling farming households to adopt green production practices such as low-carbon cultivation, precision fertilization, and straw recycling. Meanwhile, local governments are more capable of allocating fiscal resources to agricultural environmental governance and green technology diffusion, thereby supporting a transition toward intensive and low-carbon agricultural production and improving AGTFP.
However, when the urban–rural income gap exceeds a critical threshold, continuous outmigration of high-quality rural labor leads to human capital hollowing-out [22,23]. Under such conditions, remaining farming households face stronger income pressures and tend to rely on carbon-intensive inputs such as fertilizers, pesticides, and agricultural plastics to maintain output. Rural areas consequently become absorbers of “carbon leakage” within the carbon emission correlation network.
Although carbon-intensive economic activities in urban areas are transmitted through network linkages, low-carbon technologies and environmental regulations fail to effectively diffuse to rural production systems. Instead, industrial relocation may further exacerbate non-point source pollution and environmental pressure in agricultural regions. In addition, fiscal resources may be reallocated toward livelihood subsidies, crowding out investment in environmental governance [24,25]. As a result, the positive effect of network centrality on AGTFP weakens and may even turn negative.
H3.
The relationship between carbon emission network centrality and AGTFP exhibits a threshold effect driven by the urban–rural income gap. Below the threshold, network centrality is positively associated with AGTFP, while above the threshold, this effect diminishes or becomes negative.
Agricultural water use efficiency and regional agricultural development exhibit strong spatial coupling, and their coordination level directly influences the resilience and technological absorption capacity of agricultural systems [26]. Accordingly, the effectiveness of carbon emission network linkages in transmitting technological and regulatory spillovers depends on regional water resource management capacity.
In regions with efficient water resource management, advanced water-saving technologies such as drip irrigation and integrated water–fertilizer systems are widely adopted, and farmers exhibit stronger adaptability to external environmental constraints. As a result, low-carbon technologies transmitted through the network can be rapidly embedded into local production systems.
In contrast, in regions with poor water resource conditions or inefficient management, agricultural systems operate under resource stress, limiting technological absorption capacity. Under such conditions, the positive spillover effects of network centrality are offset by carbon-intensive survival-driven production behavior.
Therefore, water resource management acts as an enabling condition for the relationship between carbon emission network centrality and AGTFP.
H4.
Water resource management positively moderates the relationship between carbon emission network centrality and AGTFP, such that the effect becomes stronger as water resource management improves.
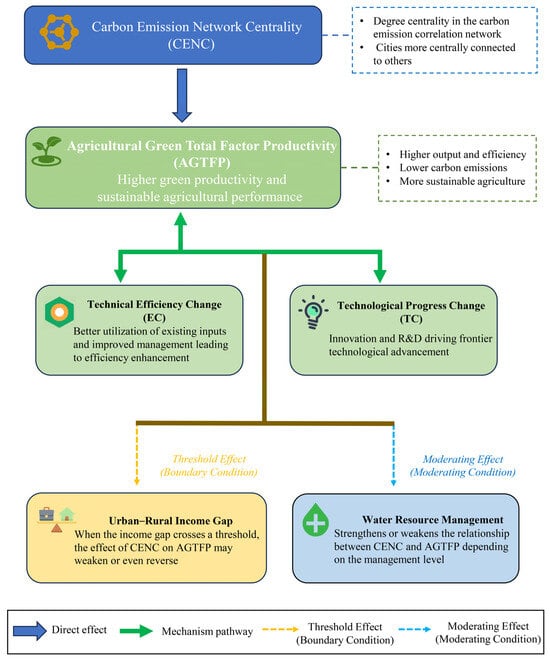
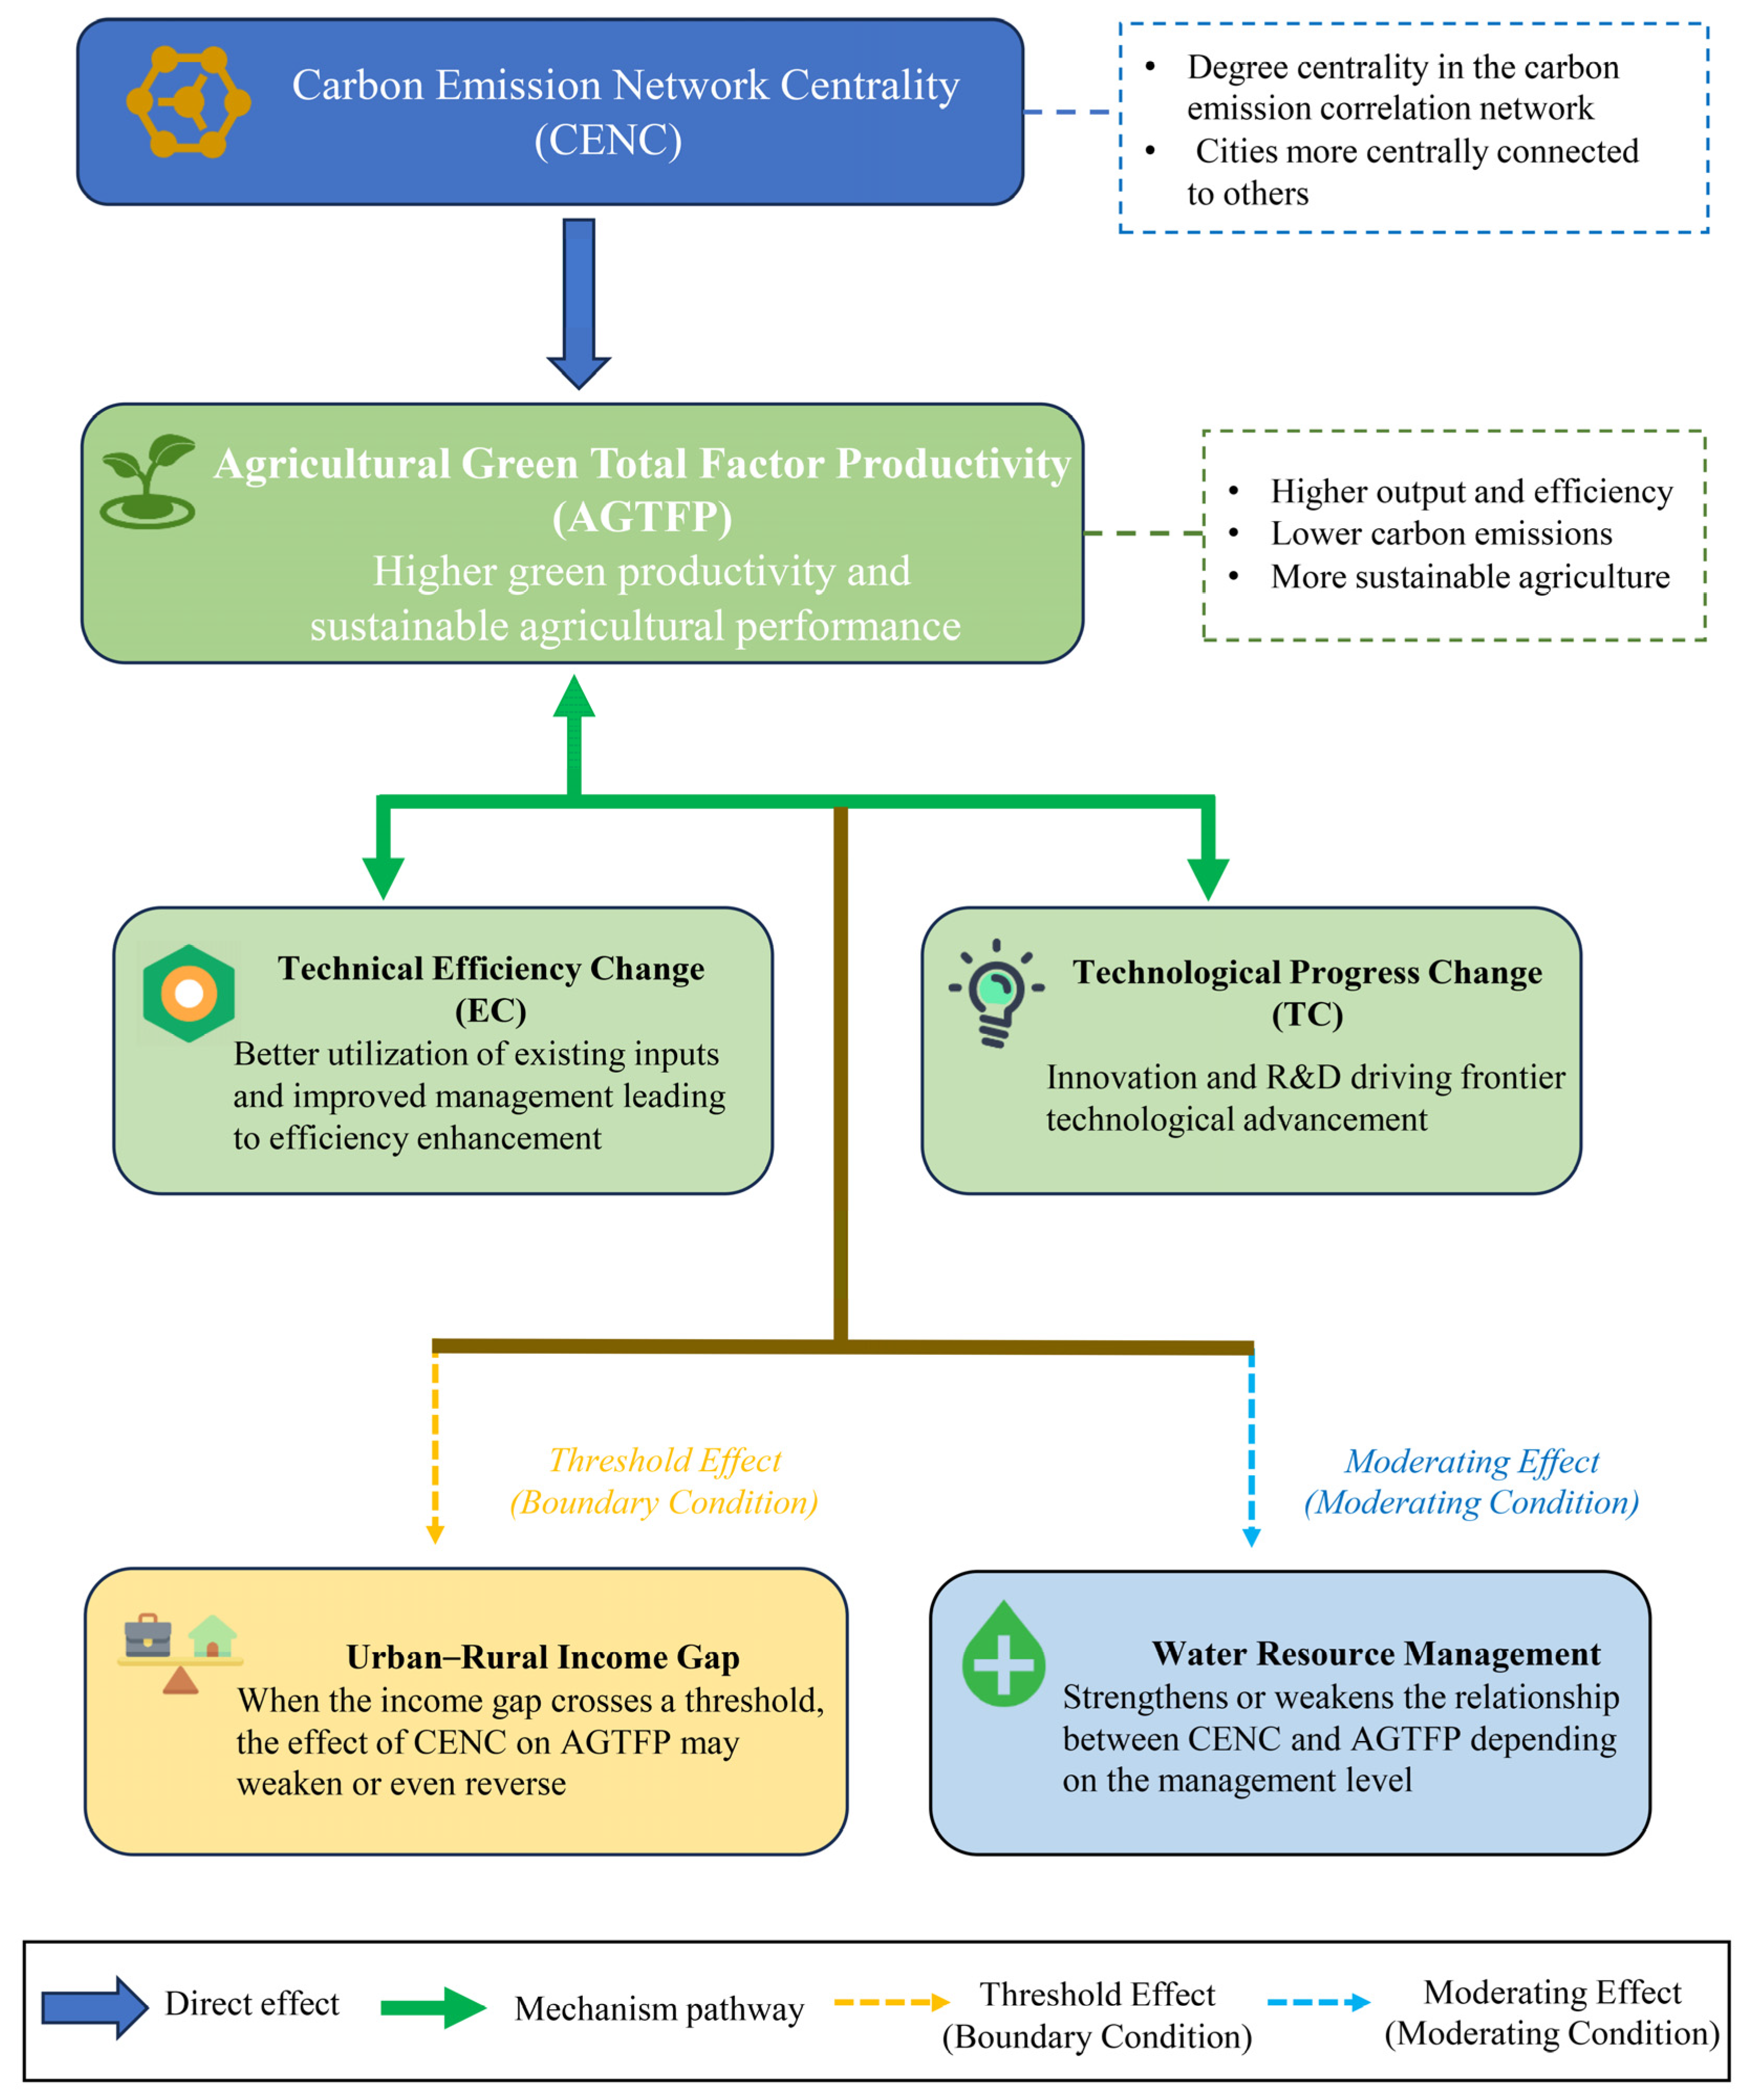
Figure 1 presents the conceptual framework illustrating the relationships among CENC, AGTFP, underlying mechanisms, and threshold and moderating conditions.
Figure 1.
Theoretical framework.
4. Model, Variables, and Data
4.1. Model Construction
4.1.1. Super-SBM Model
Data envelopment analysis (DEA) is a non-parametric method for evaluating the relative efficiency of decision-making units (DMUs) by constructing a production frontier based on input and output data. DEA does not require a pre-specified production function and can accommodate multiple inputs and outputs without assigning subjective weights, making it widely used in efficiency evaluation.
Traditional DEA models are often radial and oriented, requiring inputs or outputs to change proportionally. To address the limitation of radial models in capturing non-proportional input and output slacks, Tone [27] proposed the slack-based measure (SBM) model, which explicitly incorporates input excesses and output shortfalls into the efficiency evaluation. However, the conventional SBM model assigns an efficiency score of one to all efficient DMUs, making it difficult to further distinguish and rank efficient DMUs. To overcome this limitation, Tone [28] developed the super-efficiency SBM model by excluding the evaluated DMU from the reference set, allowing efficient DMUs to obtain efficiency scores greater than unity. Tone [29] further extended the super-efficiency SBM framework to incorporate undesirable outputs.
In this study, we employ a super-efficiency SBM model incorporating undesirable outputs to evaluate the green efficiency of agricultural production in 41 prefecture-level cities in the Yangtze River Delta. We adopt the super-efficiency SBM model rather than SBM-DDF mainly because it can further distinguish among efficient DMUs and allows efficiency scores to exceed unity. This is crucial for our study, since AGTFP is the dependent variable used to examine the effect of carbon emission network centrality (CENC). If SBM or SBM-DDF were used, many cities would be censored at an efficiency score of 1, which would substantially reduce variation in AGTFP and potentially bias the estimated CENC effect. The super-efficiency SBM also avoids the need to pre-specify a direction vector and handles undesirable outputs in a non-radial way, making it better suited to agricultural production and our subsequent heterogeneity analysis. Each city is treated as a decision-making unit (DMU). Agricultural production is characterized by three types of variables: input, desirable output, and undesirable output. Let denote the number of inputs, the number of desirable outputs, and the number of undesirable outputs. For DMU , the input, desirable-output, and undesirable-output vectors are denoted by , , and , respectively.
The super-efficiency SBM model with undesirable outputs is specified as follows:
subject to
where denotes the number of DMUs; is the intensity variable associated with DMU ; and , , and represent the slacks associated with inputs, desirable outputs, and undesirable outputs, respectively. The evaluated DMU is excluded from the reference set (), which enables the model to distinguish among efficient DMUs. The efficiency score is denoted by , with a higher value indicating better relative green efficiency. The normalization constraint in Equation (5) imposes variable returns to scale (VRS).
4.1.2. Global Malmquist–Luenberger (GML) Index
Building on the super-efficiency SBM model with undesirable outputs, this study employs the Global Malmquist–Luenberger (GML) index proposed by Oh [30] to measure the dynamic changes in agricultural green total factor productivity (AGTFP) between period and .
The GML index is constructed based on a global production technology set, which is defined by the input–output combinations of all decision-making units (DMUs, i.e., cities) across all time periods. This global reference technology ensures full comparability of efficiency across different time periods and avoids the potential infeasibility problems associated with the traditional Malmquist–Luenberger index.
The GML index is defined as follows:
where denotes the efficiency score calculated based on the super-efficiency SBM model with undesirable outputs under the global production technology set.
The value of indicates an improvement in AGTFP from period to , whereas indicates a decline, and implies no change in productivity.
4.1.3. Baseline Regression Model
To examine the relationship between regional carbon emission network centrality (CENC) and agricultural green total factor productivity (lnAGTFP), this study specifies the following two-way fixed effects panel model:
where denotes the city and denotes the year. represents agricultural green total factor productivity in city at time , and denotes the carbon emission network centrality of city in year . is a vector of control variables. and capture city-fixed effects and time-fixed effects, respectively, controlling for time-invariant city heterogeneity and common temporal shocks. is the idiosyncratic error term, with standard errors clustered at the city level to account for potential serial correlation and heteroskedasticity.
4.1.4. Threshold Regression Model
To further examine whether the relationship between carbon emission network centrality (CENC) and agricultural green total factor productivity (lnAGTFP) exhibits nonlinear heterogeneity across different conditions, this study employs the panel threshold regression model proposed by Hansen [31]. This approach allows the threshold value to be endogenously determined from the data and enables the effects of the core explanatory variable to vary across different regimes.
The single-threshold model is specified as follows:
where the Theil index is used to measure the urban–rural income gap and serves as the threshold variable. denotes the threshold value to be estimated, and is an indicator function that equals one when the condition is satisfied and equals zero otherwise. is a vector of control variables. and capture unobserved city-specific and time-specific fixed effects, respectively, controlling for time-invariant heterogeneity across cities and common temporal shocks. is the idiosyncratic error term.
The significance of the threshold effect is tested using a bootstrap procedure that constructs the F-statistic to examine the null hypothesis of no threshold effect (i.e., ). Rejection of the null hypothesis indicates the presence of a statistically significant threshold effect. In this case, both the threshold value and its corresponding confidence interval can be consistently estimated.
4.1.5. Moderating Effect Model
To examine whether water resource management intensity (Conservancy) moderates the effect of carbon emission network centrality (CENC) on agricultural green total factor productivity (lnAGTFP), this study introduces the interaction term between CENC and Conservancy into the baseline model. The moderating effect model is specified as follows:
where times denotes the interaction term between carbon emission network centrality and water resource management intensity. The coefficient captures the moderating effect of water resource management. A significantly positive indicates that stronger water resource management enhances the positive effect of CENC on AGTFP. represents the vector of control variables, while and denote city fixed effects and year fixed effects, respectively. is the error term.
4.2. Variables Selection
4.2.1. Core Explanatory Variable: Carbon Emission Network Centrality (CENC)
Following Liu et al. [32]., this study measures regional carbon emission network centrality using a combination of a modified gravity model and social network analysis (SNA).
(1) Gravity matrix
This study constructs a structural interdependence network of intercity carbon emissions rather than a physical flow network of emissions.
Let denote the carbon emission–economic gravity between city and city in year , which is defined as follows:
where denotes total carbon emissions of city in year (10,000 tons of CO2 equivalent); represents the end-of-year permanent resident population (10,000 persons); is real GDP (billion RMB); and refers to per capita GDP (10,000 RMB per person). is the geographical distance between cities and , calculated based on the great-circle distance using latitude and longitude coordinates.
(2) Binary Network Construction
To construct a binary (unweighted) and temporally comparable network, this study adopts a global thresholding approach. Specifically, the global median of all gravity values across all city pairs and all time periods is first calculated as :
The global median is selected as the baseline threshold for three main reasons. First, it provides a distribution-based and relatively neutral benchmark for distinguishing stronger from weaker intercity linkages. This is particularly appropriate given the substantial heterogeneity and right-skewed distribution of the gravity values. Compared with the mean, the median is less sensitive to a small number of extremely strong intercity linkages and therefore provides a more robust representation of the typical level of linkage intensity. Second, degree centrality is based on the number of direct connections. An excessively low threshold may generate an overly dense network in which most cities are connected, reducing the ability of degree centrality to distinguish differences in network position; conversely, an excessively high threshold may produce an overly sparse network and weaken the stability of the measured network structure. The median therefore provides a balanced baseline for identifying relatively strong intercity structural linkages. Third, a global rather than year-specific threshold is adopted to ensure that the same benchmark is applied to all city pairs throughout the study period. This avoids changes in network connectivity that may arise solely from changes in year-specific threshold values and improves the temporal comparability of city-level network centrality.
Based on this uniform threshold, the continuous gravity matrix is transformed into a binary adjacency matrix as follows:
where indicates the gravity-based structural interdependence between city and city in year t exceeds the sample-wide median level, while otherwise. This global thresholding strategy ensures temporal comparability of the network structure across years and avoids potential bias arising from year-specific or sample-specific thresholds. Binary networks are employed to mitigate the influence of extreme values and heterogeneity in link intensities, as well as potential measurement noise, thereby providing a more stable representation of intercity structural linkages and enhancing temporal comparability.
(3) Overall Network Density
The overall level of intercity carbon emission correlation in year is measured by network density , which is defined as follows:
where denotes the number of cities in the Yangtze River Delta urban agglomeration, and is a binary indicator that equals 1 if a significant carbon emission linkage exists between city and city , and is 0 otherwise. A higher value of indicates a more closely connected and denser regional carbon emission correlation network, reflecting stronger overall intercity dependence in carbon emission linkages.
(4) City-Level Carbon Emission Network Centrality
The network centrality of city in year is measured by degree centrality , which is defined as follows:
where is a binary indicator that equals 1 if a carbon emission linkage exists between city and city , and is 0 otherwise. denotes the number of cities in the sample. This indicator captures the proportion of cities directly connected to city within the carbon emission correlation network.
The value of ranges from 0 to 1, with higher values indicating that the city occupies a more central position in the network, characterized by a greater number of direct connections to other cities and stronger embeddedness within the intercity carbon emission structure.
Degree centrality captures the breadth of a city’s network connections and exposure within the system, rather than hierarchical dominance or structural superiority.
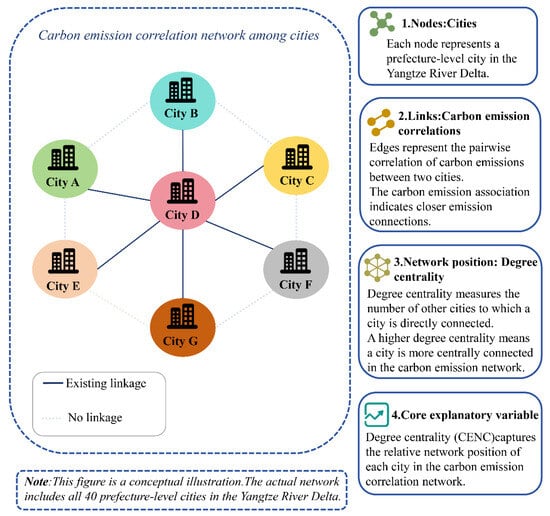
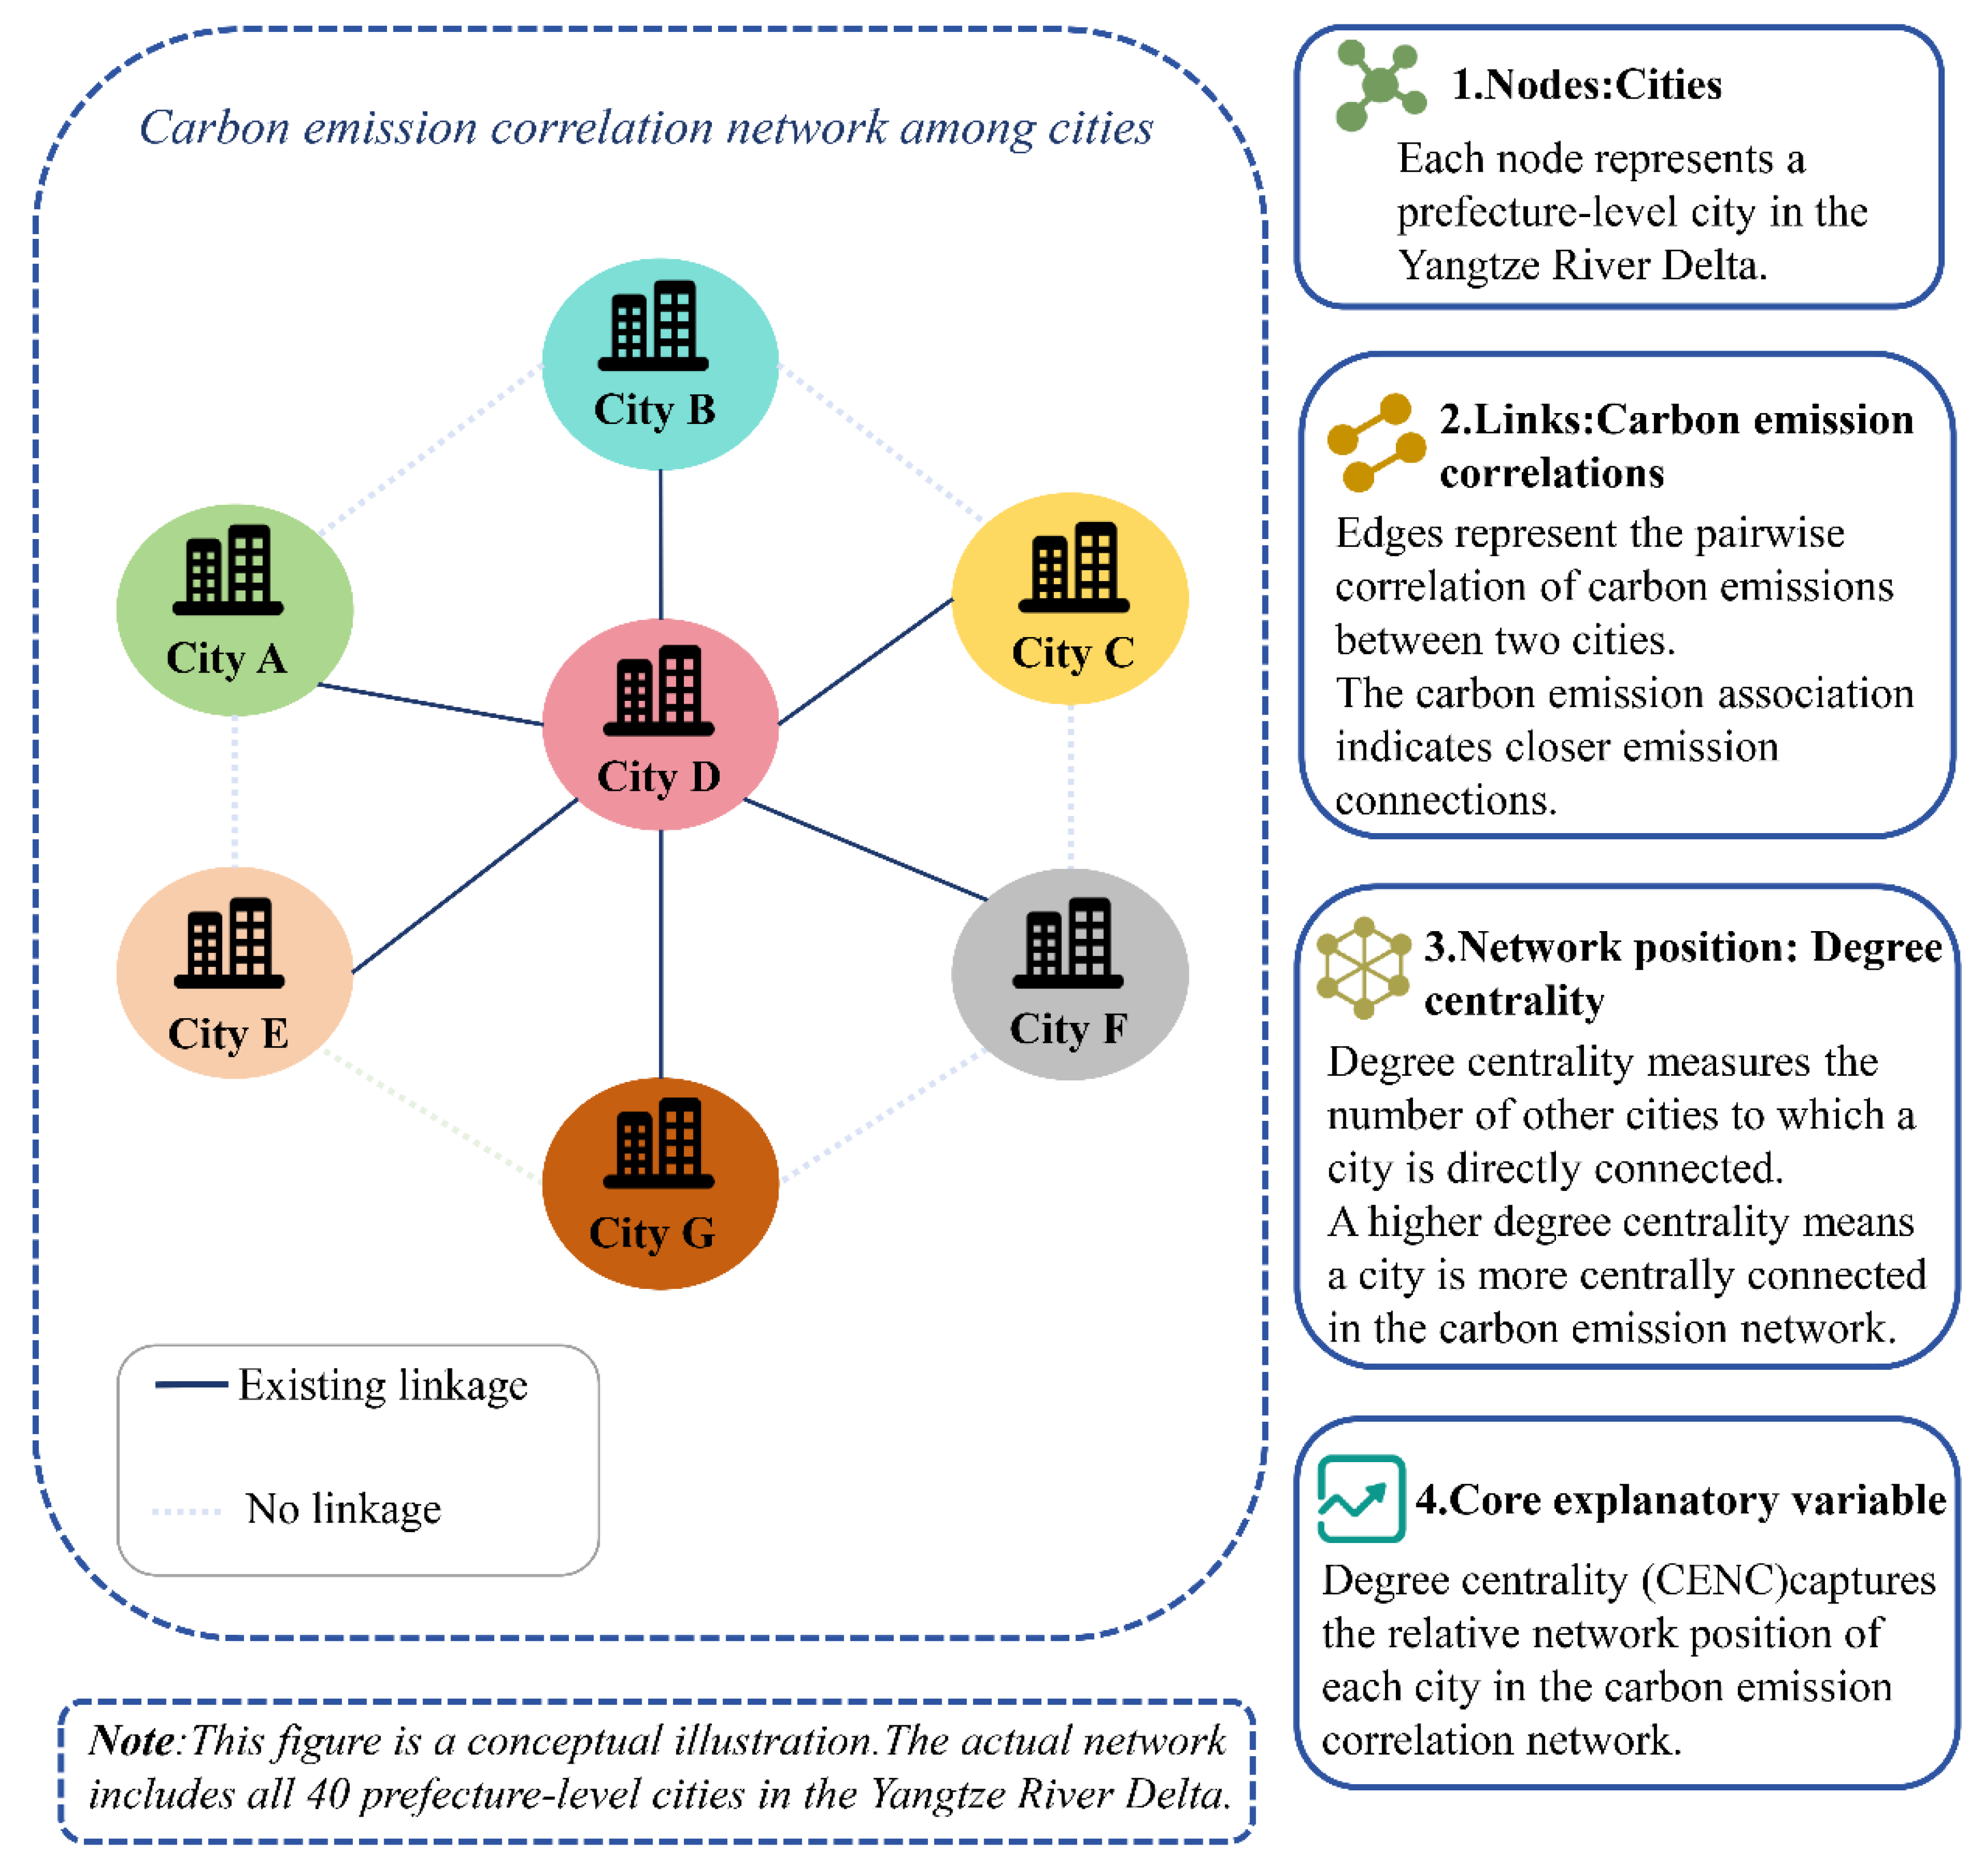
Figure 2 provides a conceptual illustration of the carbon emission linkage network and degree centrality.
Figure 2.
Conceptual illustration of the carbon emission linkage network and degree centrality.
4.2.2. Dependent Variable: Agricultural Green Total Factor Productivity (AGTFP)
Agricultural green total factor productivity (AGTFP) is measured using a super-efficiency SBM model with undesirable outputs, combined with the Global Malmquist–Luenberger (GML) index. This approach simultaneously accounts for desirable output (agricultural output value) and undesirable outputs (agricultural carbon emissions), and overcomes limitations of the traditional Malmquist index, including infeasibility under non-radial slack conditions and inconsistency in handling undesirable outputs across periods.
Following existing studies [4,5,33], nine input indicators are included: labor, land, machinery, chemical fertilizer, agricultural plastic film, diesel, pesticides, energy consumption, and irrigation. First, from the perspective of production frontier theory, TFP measurement requires a sufficiently comprehensive input set to adequately characterize the production process. Land and labor represent primary production factors; machinery captures capital input and mechanization; chemical fertilizer, plastic film, and pesticides represent intermediate material inputs; diesel captures direct fossil-fuel use, while electricity consumption captures electricity use in agricultural production; and irrigation represents water resource input. Together, these nine indicators cover key agricultural inputs such as labor, land, capital, materials, energy, and water. Second, these variables are closely related to the “green” dimension of AGTFP. Chemical fertilizer, pesticides, plastic film, diesel, energy consumption, and irrigation are major sources of agricultural carbon emissions and resource consumption. Including them in the input side allows the TFP measurement to reflect both economic output and environmental costs. Third, these indicators have been widely used in existing agricultural green TFP studies, and they are consistently defined and available in the relevant statistical yearbooks or databases, ensuring comparability, reproducibility, and reliability. Therefore, this input set is theoretically justified, supported by the literature, and empirically feasible. Agricultural output value (deflated to 2010 constant prices: 10,000 CNY) is used as the desirable output because AGTFP aims to capture the overall economic performance of agriculture. Agricultural carbon emissions (tons of CO2 equivalent) are used as the undesirable output because green TFP needs to incorporate resource and environmental constraints. This treatment follows existing studies [4,5,33] and is consistent with the efficiency logic that desirable output should be maximized while undesirable output should be minimized.
Variable definitions are reported in Table 2.
Table 2.
Agricultural Green TFP Input–Output System.
Agricultural carbon emissions are calculated based on seven major sources, including agricultural tillage, irrigation, chemical fertilizer, pesticide, plastic film, diesel, and electricity consumption. Following the existing literature, total agricultural carbon emissions are estimated as follows:
where denotes total agricultural carbon emissions; represents emissions from source ; is the activity level of each emission source (e.g., fertilizer application, pesticide use, etc.); and is the corresponding emission coefficient. All emission coefficients are reported in Table 3.
Table 3.
Emission coefficients.
4.2.3. Threshold Variable: Urban–Rural Income Gap (Theil Index)
This study adopts the urban–rural income gap as the threshold variable to examine the nonlinear effects of carbon emission network centrality (CENC) on agricultural green total factor productivity (AGTFP). The urban–rural income disparity is measured using the Theil index, which captures income inequality between urban and rural residents in a decomposition-consistent framework. The Theil index is calculated as follows:
where denotes urban and rural areas, respectively. represents per capita disposable income of urban or rural residents in region at time , while denotes the aggregate income of region . is the population of urban or rural residents, and is the total population of region . A higher value of the index indicates a greater degree of urban–rural income disparity.
4.2.4. Moderating Variable: Water Resource Management Intensity (Conservancy)
This study follows Tian and Zeng [7] and measures water resource management intensity using the ratio of effective irrigated area to total sown crop area. The effective irrigated area is a widely used indicator of the development level of agricultural water conservancy infrastructure and regional water resource regulation capacity. This indicator reflects the infrastructural and managerial capacity of agricultural water systems rather than direct water consumption. A higher value of this ratio indicates stronger irrigation assurance capacity and more advanced agricultural water management systems within a region.
4.2.5. Control Variables
To mitigate potential omitted variable bias, this study includes a set of control variables that may affect agricultural green total factor productivity (AGTFP).
Industrial structure (ind) is measured by the ratio of value added of the tertiary industry to that of the secondary industry, capturing the degree of economic structural upgrading [39]. Agricultural machinery density (machine) is calculated as the total agricultural machinery power (10,000 kW) per unit of total sown area (thousand hectares), reflecting the level of agricultural mechanization [40]. Urbanization level (urban) is measured by the proportion of urban population in total permanent residents, indicating the degree of population agglomeration and urban development [41]. Labor input (labor) is proxied by the share of primary industry employment in total employment across all three sectors, reflecting agricultural labor endowment conditions [42]. Economic development level (lnpgdp) is measured as the natural logarithm of per capita GDP to capture regional income and development differences.
4.3. Data Sources
This study covers 40 prefecture-level cities in the Yangtze River Delta region over the period 2010–2024.
Carbon emission data are obtained from the Emissions Database for Global Atmospheric Research (EDGAR), which provides gridded global greenhouse gas emission datasets. These data are spatially aggregated to the city level using ArcMap 10.8.1-based zonal statistics to derive total economy-wide carbon emissions for each city.
Data on agricultural inputs and outputs, as well as other control variables, are sourced from the EPS Data Platform, the China City Statistical Yearbook, and statistical yearbooks of the three provinces in the Yangtze River Delta, including the Jiangsu Rural Statistical Yearbook. For a small number of missing or inconsistent observations due to differences in statistical calibration across sources, data are supplemented through official statistical bulletins and inquiries with local statistical bureaus. Remaining missing values are interpolated using a linear interpolation method.
Descriptive statistics of all variables are reported in Table 4.
Table 4.
Descriptive Statistics of Variables.
5. Analysis of Empirical Findings
5.1. Baseline Regression Results
Table 5 reports the estimation results of the relationship between carbon emission network centrality (CENC) and agricultural green total factor productivity (AGTFP). Column (1) includes only city and year fixed effects, and the coefficient of CENC is 0.2792, which is statistically significant at the 1% level. In Column (2), additional control variables are included, and the coefficient slightly decreases to 0.2665 while remaining highly significant, indicating that the baseline result is robust to the inclusion of covariates.
Table 5.
Benchmark results.
Column (3) includes only city fixed effects without controlling for time effects, yielding a coefficient of 0.2341, significant at the 5% level, suggesting that the results are not driven by time trends alone. In contrast, Column (4), which includes only year fixed effects, produces an insignificant coefficient of 0.0019. Similarly, Column (5), which excludes both city and year fixed effects, also yields an insignificant estimate (0.0322), indicating that failure to control for unobserved city-level heterogeneity leads to substantial estimation bias.
Overall, these results highlight the importance of accounting for time-invariant city characteristics in model specification. Therefore, Column (2), which incorporates both city and year fixed effects along with control variables, is selected as the preferred specification.
The estimated coefficient implies that a one-unit increase in CENC is associated with an approximately 26.65% increase in AGTFP, given the semi-elastic interpretation of the logarithmic dependent variable. This finding supports Hypothesis H1, indicating that higher carbon emission network centrality is significantly positively associated with agricultural green transformation.
To examine the potential mechanisms underlying the relationship between CENC and AGTFP, this study decomposes the Global Malmquist–Luenberger (GML) index into technical efficiency change (EC) and technological change (TC), which are subsequently used as dependent variables in separate regressions.
The results reported in Table 6 indicate that CENC is significantly positively associated with EC, with a coefficient of 0.1269 that is statistically significant at the 1% level. In contrast, its association with TC is statistically insignificant.
Table 6.
Mechanism Decomposition Regression Results.
This pattern is consistent with the characteristics of agricultural development in the Yangtze River Delta. As one of the most advanced agricultural regions in China, cities such as Shanghai, southern Jiangsu, and northern Zhejiang have already reached a relatively high level of green agricultural technology, leaving limited scope for short-term frontier-shifting innovation through spatial network linkages.
By contrast, substantial heterogeneity persists across cities in terms of technology adoption capacity, managerial efficiency, and resource allocation. Intercity network linkages facilitate the diffusion of existing green technologies through labor mobility, information exchange, and industrial collaboration. As a result, less-developed regions gradually catch up to the existing production frontier, primarily through improvements in efficiency rather than innovation-driven technological progress.
Accordingly, Hypothesis H2a is not supported, while H2b is empirically confirmed.
5.2. Threshold Regression Analysis
Table 7 reports the results of the threshold effect tests. The findings show that the single-threshold model yields an F-statistic of 50.13 with a p-value below 0.001, which is statistically significant at the 1% level, indicating the existence of a robust single threshold effect.
Table 7.
Threshold Effect Test Results.
For the double-threshold specification, the F-statistic is 15.90 with a p-value of 0.050, which lies at the conventional 5% significance boundary. Although this result suggests weak evidence of a second threshold effect, it does not provide sufficiently strong statistical support at stricter significance levels.
In contrast, the triple-threshold model produces an F-statistic of 10.91 with a p-value of 0.434, indicating no statistically significant evidence of a third threshold effect.
Overall, the results suggest that the relationship between carbon emission network centrality (CENC) and agricultural green total factor productivity (AGTFP) is best characterized by a single threshold specification. Accordingly, the single-threshold model is adopted in subsequent analyses.
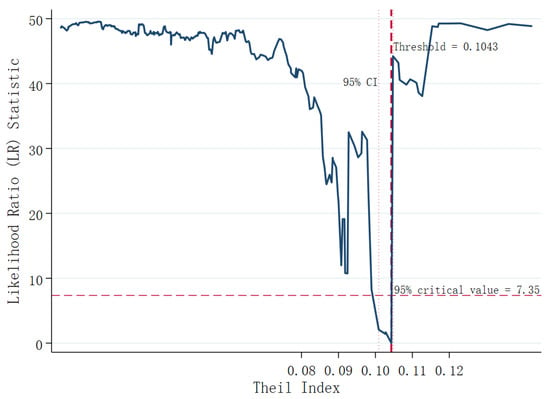
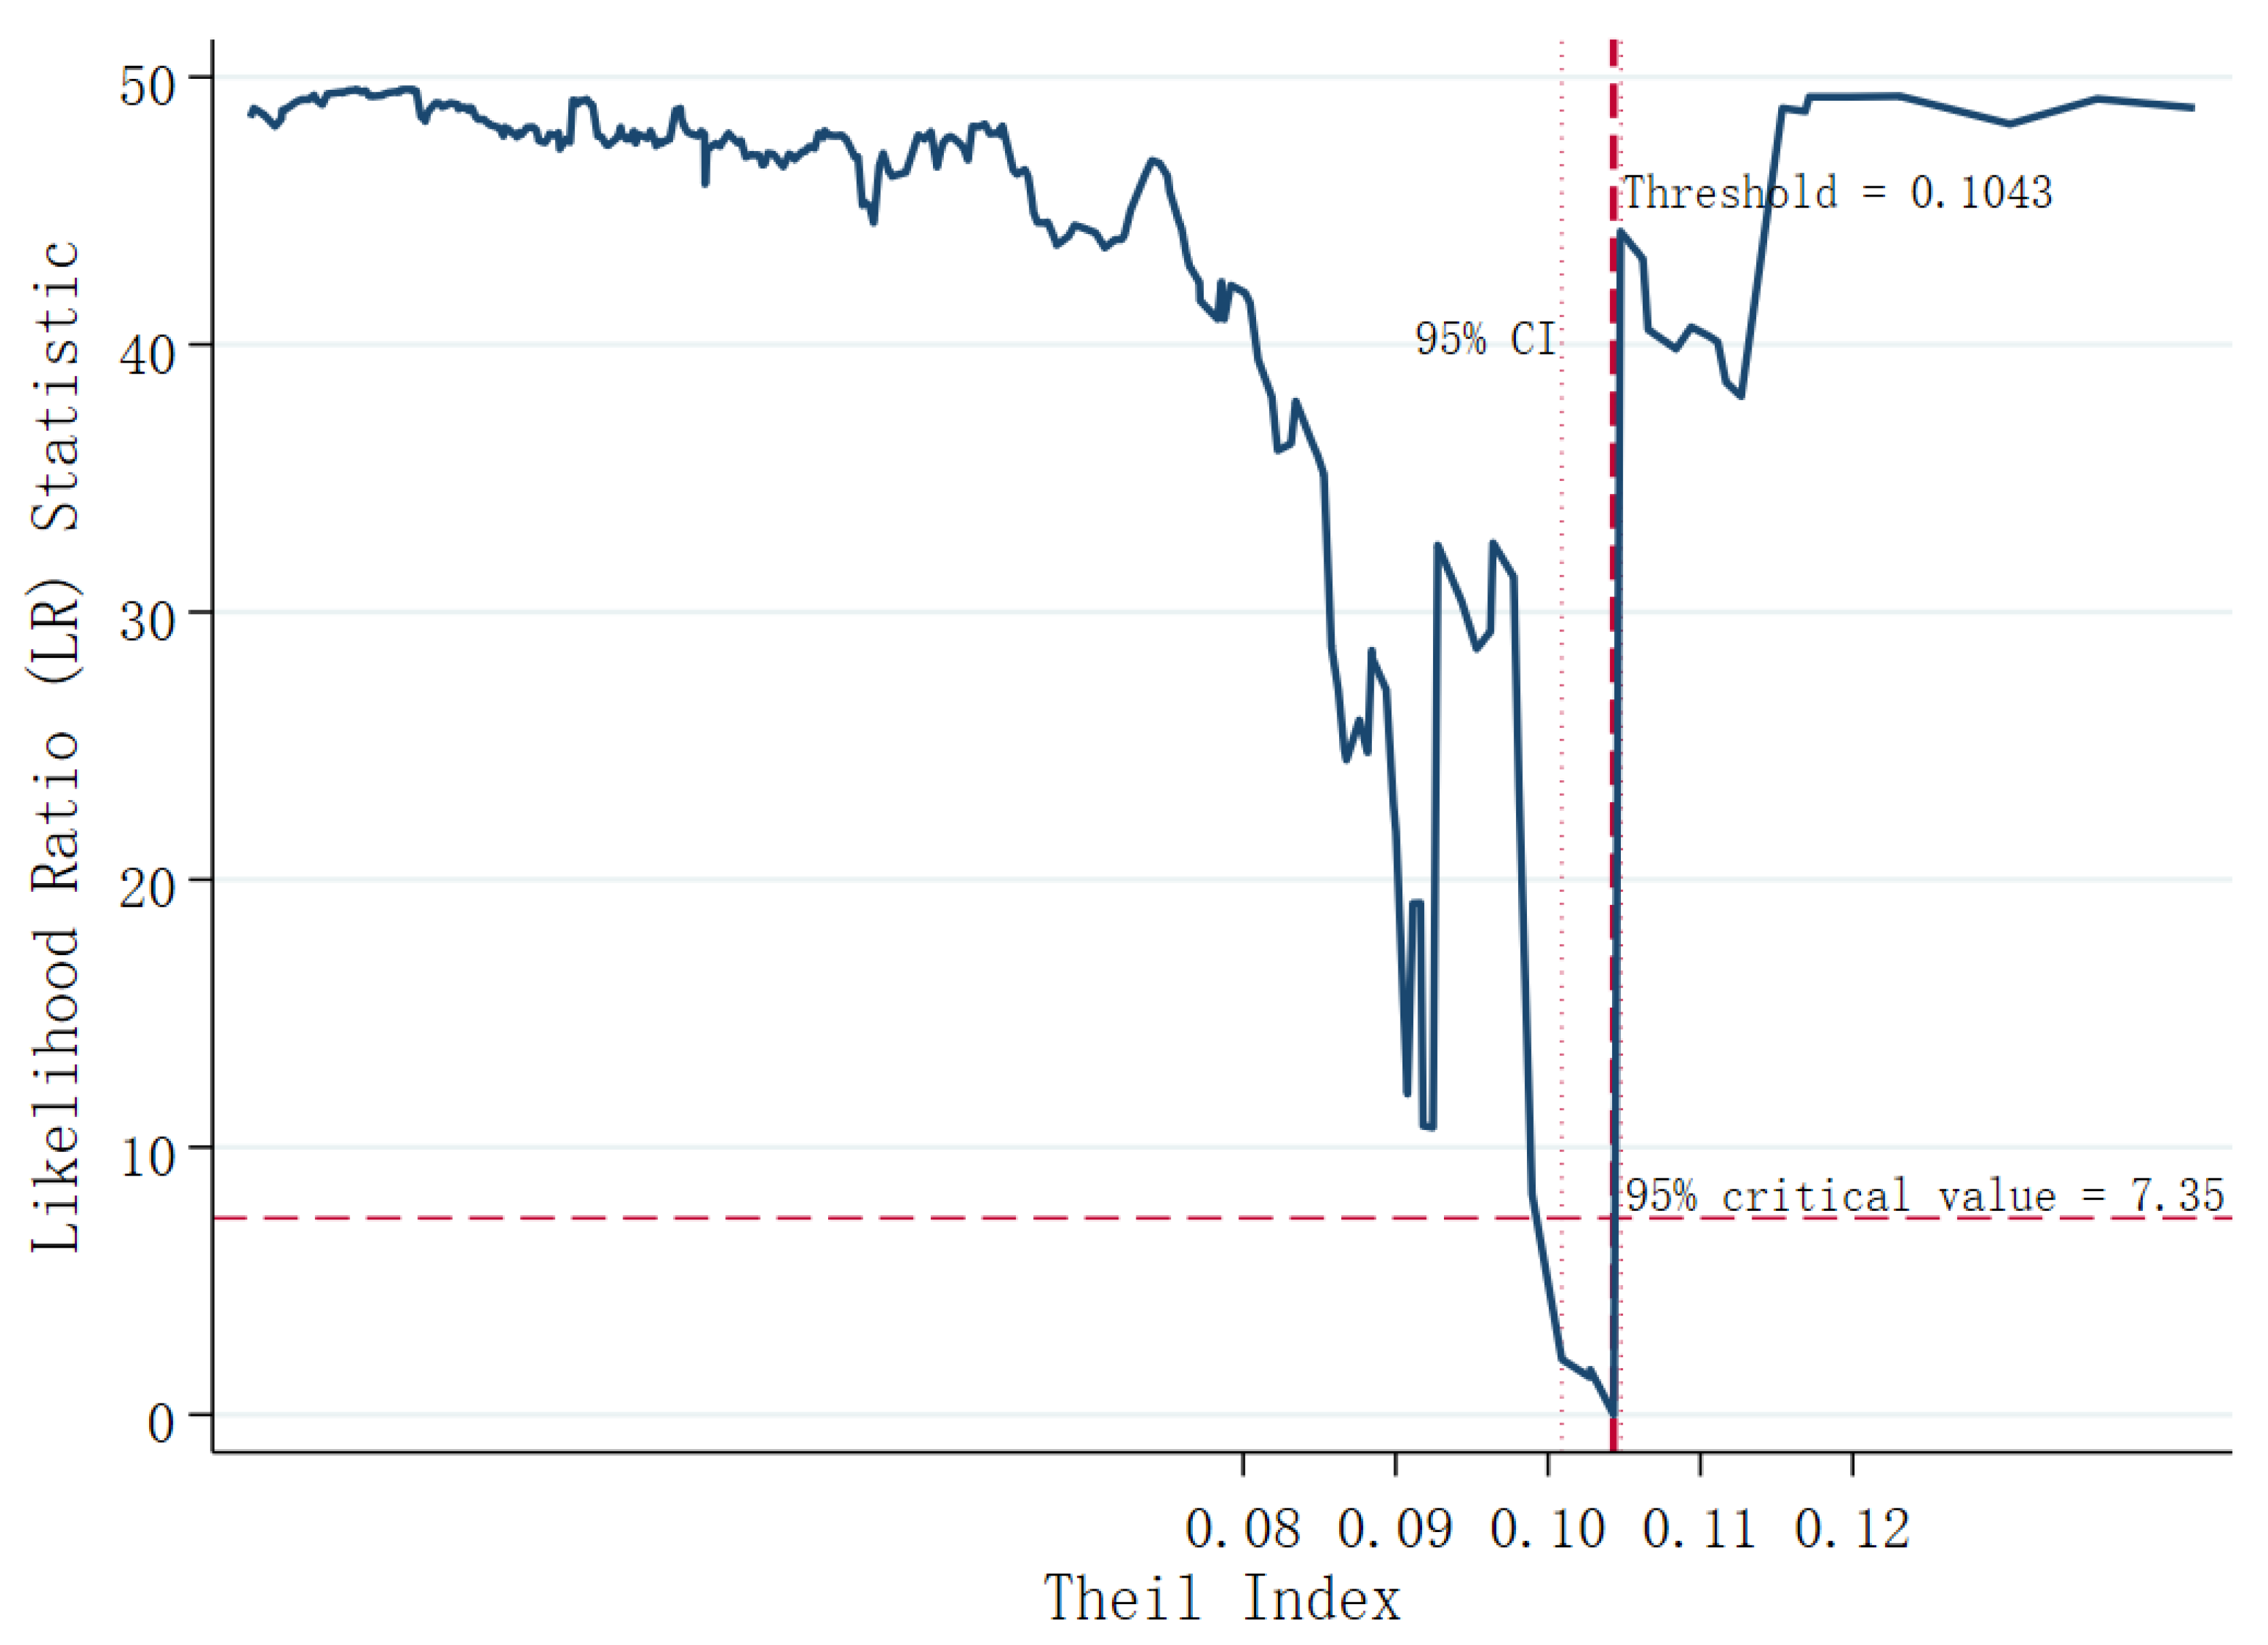
Table 8 reports the results of the threshold regression analysis. The estimated threshold value of the Theil index is 0.1043, with a 95% confidence interval of [0.1009, 0.1048]. Figure 3 presents the likelihood-ratio (LR) profile of the threshold estimation and visually illustrates the location of the estimated threshold and its confidence interval.
Table 8.
Threshold Regression Results.
Figure 3.
Likelihood-ratio statistics and the estimated threshold of the Theil index.
When the urban–rural income gap is below the threshold value, the coefficient of CENC is 0.188 and statistically significant at the 5% level, suggesting that higher network centrality is positively associated with AGTFP in regions with relatively balanced income distribution.
Above the threshold, the estimated association becomes negative, although the coefficient is statistically significant only at the 10% level.
These results suggest that the urban–rural income gap plays a critical nonlinear role in moderating the relationship between CENC and AGTFP. Specifically, when inequality exceeds the threshold of 0.1043, the beneficial spillover effects of carbon emission network linkages are significantly weakened and may even turn negative. This finding highlights the existence of a risk threshold in regional development, providing quantitative evidence for designing more targeted and differentiated regional coordination and emission reduction policies.
5.3. Moderating Effect Analysis
To examine whether water resource management intensity moderates the relationship between carbon emission network centrality (CENC) and agricultural green total factor productivity (AGTFP), this study introduces the interaction term between CENC and water resource management intensity (CENC × Conservancy) into the baseline regression model. The estimation results are reported in Table 9. The coefficient of the interaction term is 0.347 and statistically significant, indicating that water resource management intensity positively moderates the relationship between CENC and AGTFP. Because both CENC and water resource management are mean-centered, the coefficient of water resource management represents its conditional association with AGTFP at the mean level of CENC and should not be interpreted independently as its general association with AGTFP. More importantly, the positive interaction coefficient indicates that the marginal association between CENC and AGTFP increases as the level of water resource management rises.
Table 9.
Moderating Effect Regression Results.
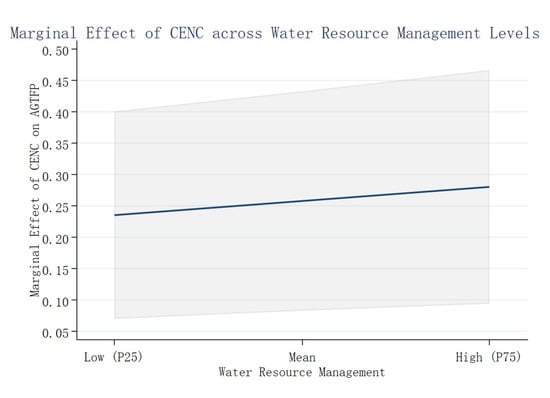
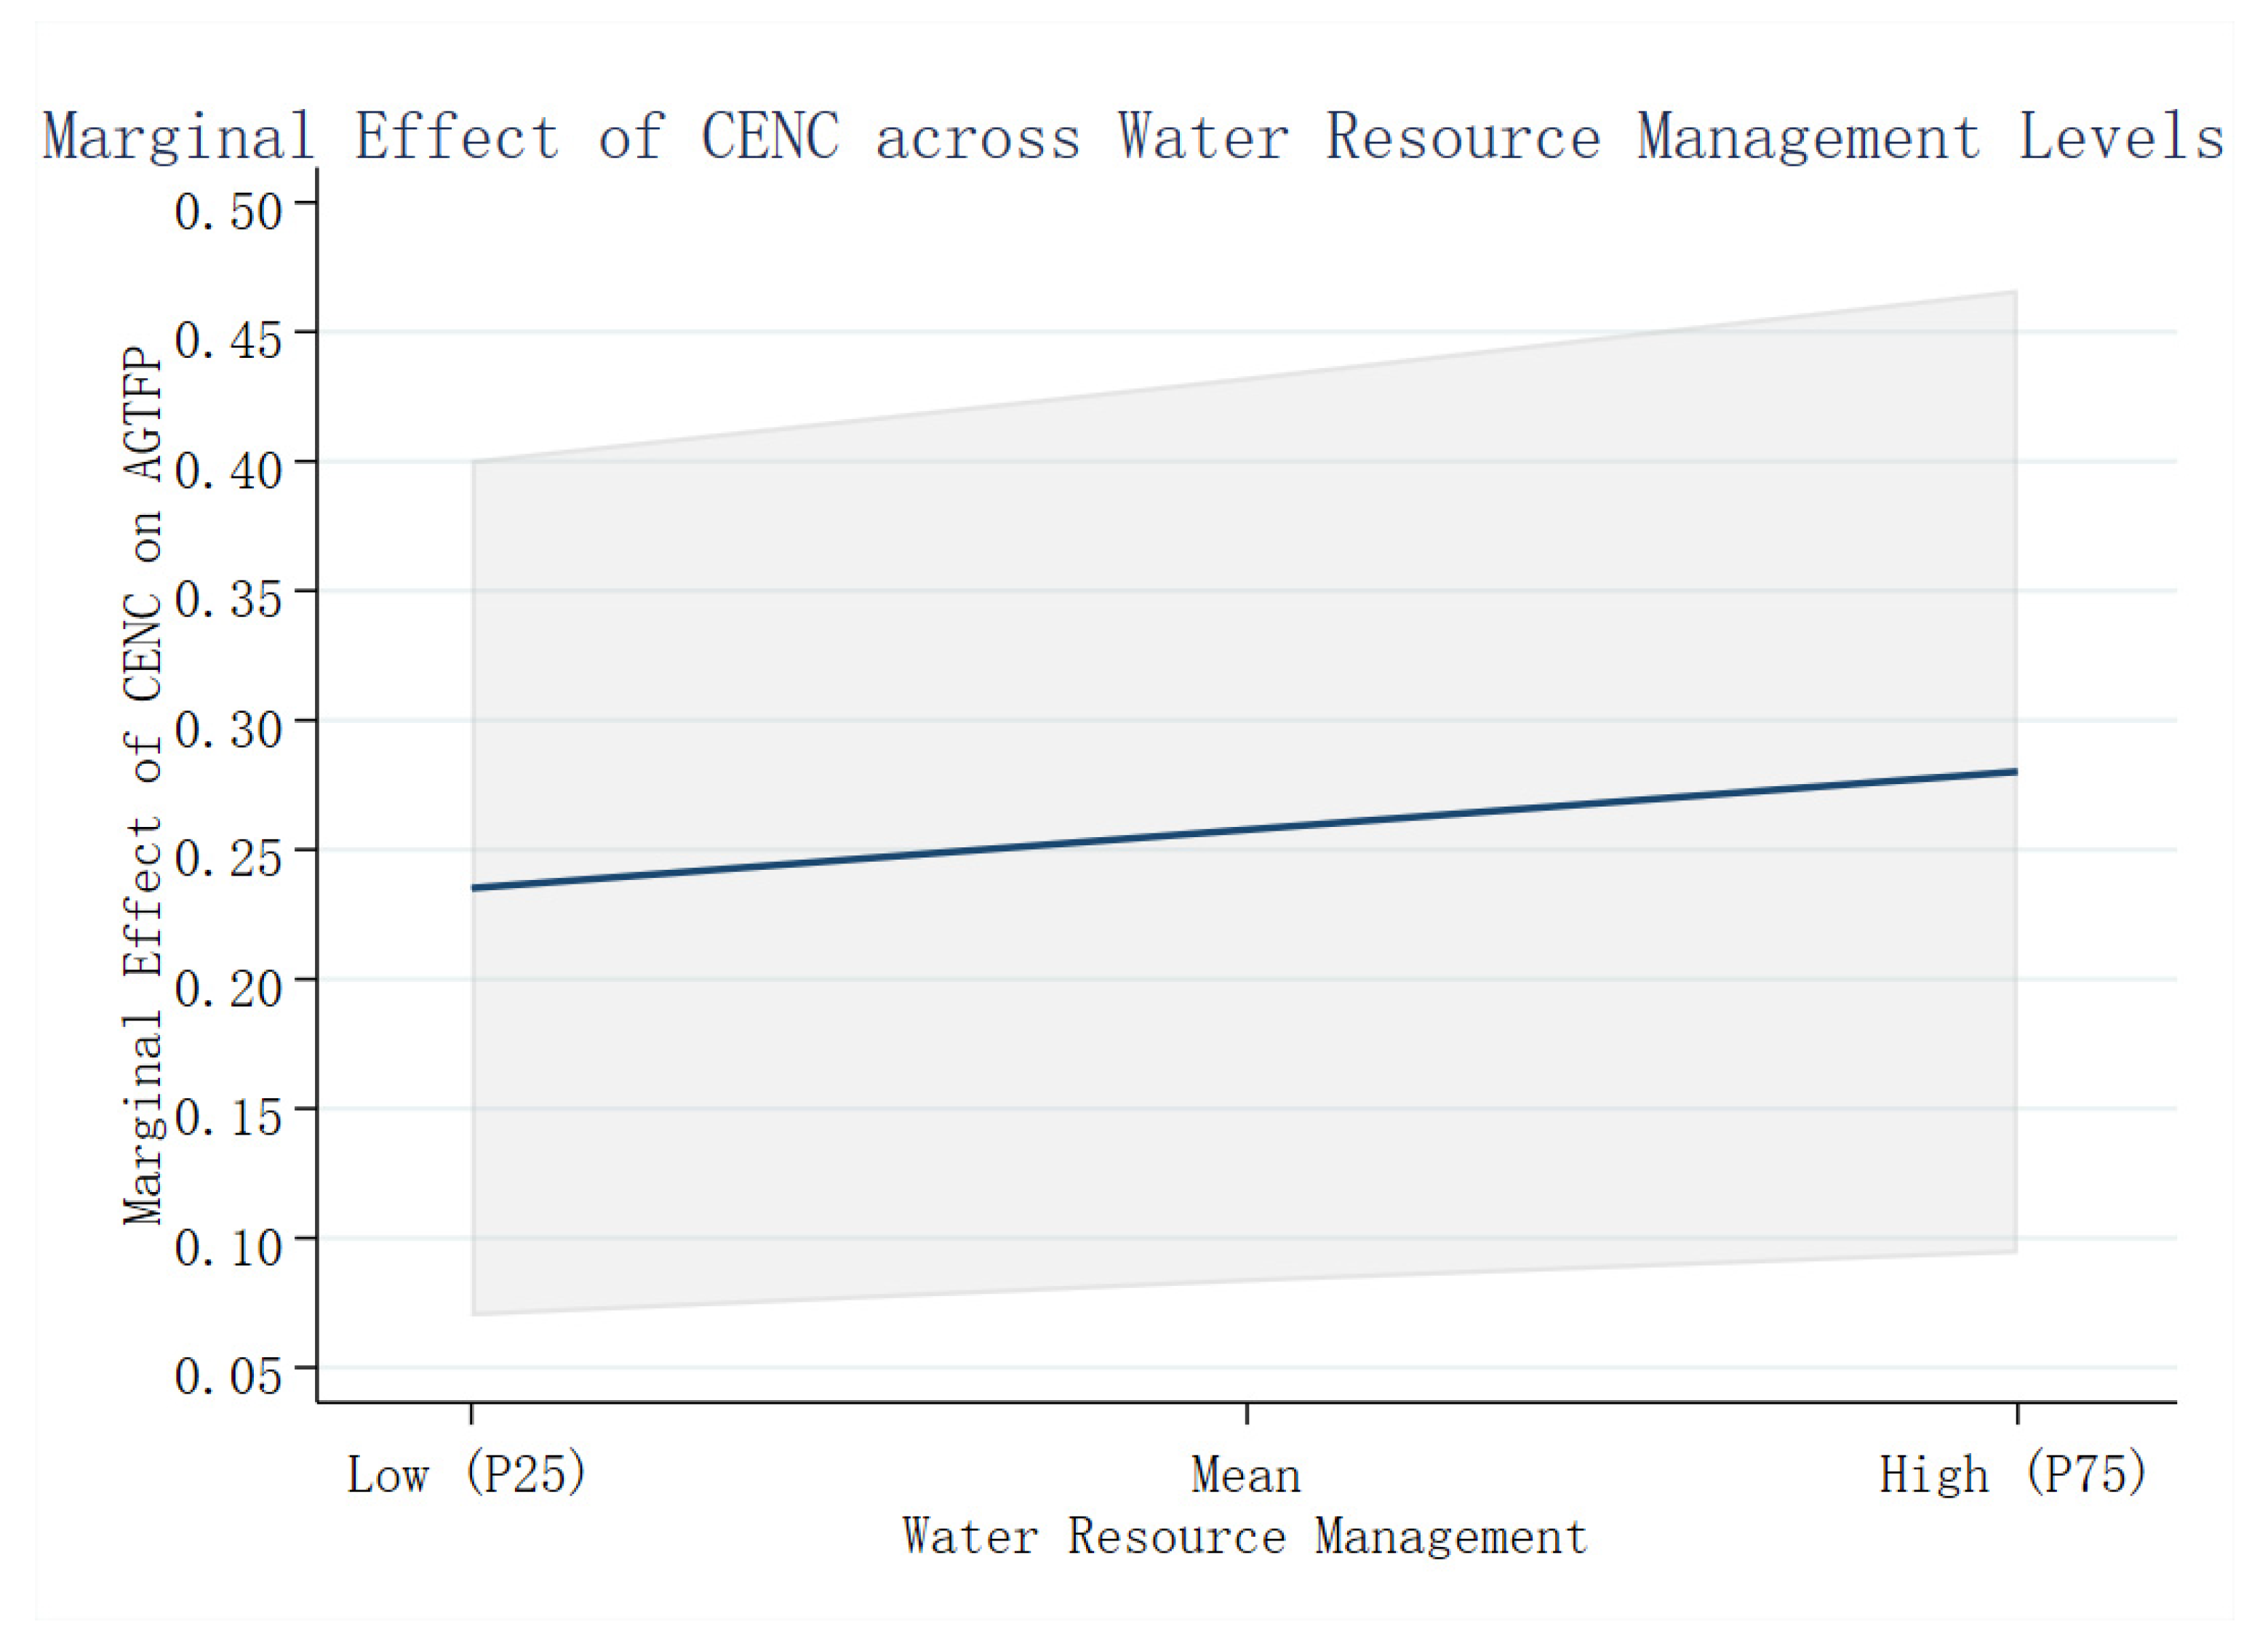
To further clarify how the association between CENC and AGTFP varies across different levels of water resource management, we calculate the marginal effects of CENC at the 25th percentile, mean, and 75th percentile of water resource management. The marginal effects are 0.2352, 0.2577, and 0.2802, respectively. All three marginal effects are statistically significant at the 5% level. These results indicate that the positive association between CENC and AGTFP becomes stronger as the level of water resource management increases.
As shown in Figure 4, the marginal effect of CENC remains positive and statistically significant across the representative levels of water resource management, while its magnitude increases from 0.2352 at the 25th percentile to 0.2802 at the 75th percentile. The shaded area represents the 95% confidence interval of the marginal effect. These findings provide further support for Hypothesis H4, suggesting that effective water resource management serves as an important enabling condition for translating intercity carbon-related linkages into agricultural green development benefits.
Figure 4.
Marginal Effect of CENC across Water Resource Management Levels.
5.4. Heterogeneity Analysis
To further examine whether the effect of carbon emission network centrality (CENC) on agricultural green total factor productivity (AGTFP) varies with the level of agricultural development, this study conducts a heterogeneity analysis based on agricultural labor productivity. Agricultural labor productivity is measured as agricultural output divided by the number of employees in the primary industry. The sample is divided into high- and low-agricultural-labor-productivity groups according to the sample median. The estimation results are reported in Table 10.
Table 10.
Regional Heterogeneity Analysis.
The subgroup regression results show that the coefficient of CENC is 0.1533 in the low-agricultural-labor-productivity group, but it is not statistically significant. In contrast, the coefficient of CENC is 0.3656 in the high-agricultural-labor-productivity group and is statistically significant at the 5% level. These results suggest that CENC has a more evident positive association with AGTFP in regions with higher agricultural labor productivity. However, differences in statistical significance across the two subgroups alone do not establish that the coefficients are statistically different from each other. Therefore, we further conduct a formal coefficient-difference test using an interaction term in the full sample.
To formally assess whether the difference between the two subgroup coefficients is statistically significant, we further introduce an interaction term between CENC and an indicator for high agricultural labor productivity in the full sample. The difference in the CENC coefficients is therefore statistically significant at the 10% level. The positive interaction coefficient suggests that the estimated effect of CENC is stronger in regions with higher agricultural labor productivity.
This heterogeneity may reflect differences in the capacity of agricultural systems to translate improvements in environmental conditions and external network linkages into productivity gains. Regions with higher agricultural labor productivity may have a stronger agricultural production base, greater capacity for technology adoption, and more efficient allocation of agricultural resources, which may facilitate the conversion of environmental and network-related advantages into improvements in AGTFP. However, these potential explanations are not directly tested in the present study and should therefore be regarded as plausible interpretations rather than established causal mechanisms.
Overall, the results suggest that the productivity-enhancing effect of CENC is heterogeneous across regions with different levels of agricultural labor productivity. Compared with the original province-based classification, this approach focuses on an economically meaningful dimension of agricultural development and provides a formal statistical test of whether the estimated CENC effects differ across groups.
5.5. Robustness Tests
To verify the reliability of the baseline results, this study conducts a series of robustness checks from multiple perspectives.
5.5.1. Alternative Measurements of the Key Variables
The measurement of the core explanatory variable is first modified by reconstructing the carbon emission network based on non-agricultural carbon emissions. The resulting indicator, denoted as NCENC (Non-agricultural Carbon Emission Network Centrality), is then used in place of CENC in the regression model. The coefficient of NCENC remains positive and statistically significant, indicating that the baseline finding is robust to an alternative definition of carbon emissions used to construct the network.
We further employ a residual-based approach to examine whether the relationship between network centrality and AGTFP is sensitive to differences in city-level economic and emission scales. Specifically, the original degree centrality measure is regressed on per capita GDP, population size, and total carbon emissions, and the resulting residual is used as an alternative measure of network centrality purged of these observable scale-related factors. The coefficient of the residual-based centrality measure remains statistically significant, providing further evidence that the positive association between carbon emission network position and AGTFP is not fully explained by differences in economic scale, population size, or emission scale. The robustness results for this subsection are reported in Panel A of Table 11.
Table 11.
Robustness tests (alternative measurements of the key variables).
5.5.2. Alternative Model Specifications and Temporal Ordering
To examine whether the results are sensitive to the timing of the explanatory variable, CENC is lagged by one period and reintroduced into the baseline two-way fixed-effects model. The coefficient of lagged CENC remains positive and statistically significant. This specification provides a temporal-ordering check and reduces concerns that the baseline association is driven by contemporaneous reverse causality, although it does not by itself establish causal identification.
As a further specification check, the dependent variable is replaced by the original GML index rather than its logarithmic transformation. The estimated coefficient of CENC remains positive and statistically significant, indicating that the main finding is robust to the functional form used for the AGTFP measure.
Finally, to examine whether the main findings are sensitive to the unusual conditions associated with the COVID-19 pandemic, observations from 2020–2022 are excluded from the sample and the baseline model is re-estimated. The coefficient of CENC remains positive and statistically significant, suggesting that the main finding is not attributable to the inclusion of these pandemic-period observations. The robustness results for this subsection are reported in Panel B of Table 12.
Table 12.
Robustness tests (Alternative Model Specifications and Temporal Ordering).
5.5.3. Alternative Network Constructions
To examine whether the main findings are sensitive to the construction of the carbon emission network, three additional robustness checks are conducted.
First, alternative network thresholds are adopted to assess whether the results depend on the choice of the baseline global median threshold. Specifically, the global mean and the 75th percentile of the gravity values across all cities and years are used as alternative thresholds. The estimated coefficients of CENC remain positive and statistically significant, with coefficients of 0.1841 and 0.1499, respectively. These results suggest that the positive association between CENC and AGTFP is not driven by the specific choice of the global median threshold.
Second, to address the potential information loss associated with converting the continuous gravity matrix into a binary network, a continuous weighted carbon emission network is constructed. Given the highly right-skewed distribution and substantial heterogeneity in the magnitude of the original gravity values, directly using the raw gravity values may allow a small number of extremely strong intercity linkages to disproportionately influence weighted network centrality. Therefore, the original gravity values are normalized by the annual mean gravity value. Specifically, the weight of the linkage between cities and in year is defined as , where denotes the original gravity value and represents the mean gravity value across all city pairs in year . This normalization preserves the relative strength of intercity linkages within each year while improving the comparability of network weights across years.
Based on the resulting continuous weighted network, weighted network centrality is calculated for each city. The estimated coefficient of weighted network centrality is 0.0658 and remains positive and statistically significant at the 10% level. This result provides additional evidence that the positive association between carbon emission network centrality and AGTFP is not solely attributable to the binary representation of intercity carbon emission linkages. The robustness results for this subsection are reported in Panel C of Table 13.
Table 13.
Robustness tests (Alternative Network Constructions).
5.5.4. Alternative AGTFP Measurement
To further examine whether the main findings are sensitive to the methodology used to measure agricultural green total factor productivity, an alternative AGTFP measure is constructed using a slack-based directional distance function (SBM-DDF) with a max–min directional vector and a vector of the original data [43]. Specifically, the directional vector is constructed based on the observed ranges of the relevant input, desirable-output, and undesirable-output variables. The resulting efficiency scores are subsequently used to construct an alternative GML index.
The baseline two-way fixed-effects model is then re-estimated using the alternative AGTFP measure. The coefficient of CENC remains positive and statistically significant, and its sign is consistent with the baseline estimate. This result indicates that the positive association between carbon emission network centrality and AGTFP is robust to an alternative productivity measurement framework and directional-vector specification. The robustness results for this subsection are reported in Panel D of Table 14.
Table 14.
Robustness tests (Alternative AGTFP Measurement).
6. Discussion and Policy Implications
6.1. Discussion
This study investigates the relationship between carbon emission network centrality (CENC) and agricultural green total factor productivity (AGTFP) using panel data from 40 cities in the Yangtze River Delta from 2010 to 2024. By integrating a super-efficiency SBM model, social network analysis, and panel regression models, this study reveals the mechanisms through which intercity carbon linkages influence agricultural green transformation.
The results demonstrate that there is a significant positive association between CENC and AGTFP, and this relationship remains robust under various alternative specifications. Further decomposition of the GML index indicates that the improvement in AGTFP is primarily driven by technical efficiency change (EC) rather than technological progress (TC). This suggests that carbon emission networks mainly facilitate the diffusion and application of existing green technologies, improve resource allocation efficiency, and help agricultural sectors in peripheral cities approach the production frontier. However, breakthroughs in technological progress require long-term innovation accumulation and are less likely to be achieved through short-term network spillovers.
Moreover, the threshold analysis reveals that the relationship between CENC and AGTFP is conditional on the urban–rural income gap. When the income gap remains below the threshold level, carbon emission network linkages generate positive spillover effects by improving the capacity of rural areas to absorb green technologies and optimize production practices. Once the gap exceeds the threshold, however, the positive association weakens and turns negative, suggesting that excessive urban–rural inequality may constrain the transmission and realization of network-based green development benefits.
The moderating analysis further shows that water resource management strengthens the positive effect of CENC on AGTFP. Regions with better agricultural water management systems possess stronger capabilities to absorb and implement low-carbon technologies, indicating that infrastructure and resource management conditions are important complementary factors for transforming network connectivity into green productivity gains.
The heterogeneity analysis further shows that the positive association between CENC and AGTFP is more pronounced in regions with higher agricultural labor productivity. The formal coefficient-difference test confirms a statistically significant difference between the two groups at the 10% level. This finding suggests that agricultural development capacity may condition the extent to which cities benefit from their positions within carbon emission networks. However, the underlying mechanisms are not directly tested and therefore warrant further investigation.
6.2. Policy Implications
The findings of this study provide several policy implications for promoting agricultural green transformation through regional coordination and network governance.
First, regional governments should strengthen cross-city coordination in carbon emission management and make greater use of intercity network linkages. The positive association between CENC and AGTFP suggests that carbon emission governance should not be considered solely from the perspective of individual cities. Greater coordination in environmental information sharing, green technology exchange, and resource allocation may help cities better utilize their positions within regional carbon emission networks. In particular, cities occupying more central positions could be encouraged to participate in regional cooperation and knowledge-sharing platforms, while less-connected cities could be supported in improving their access to green technologies and environmental management practices.
Second, policies should pay greater attention to urban–rural income disparities when promoting green agricultural transformation. The threshold analysis indicates that the CENC–AGTFP association varies across different levels of urban–rural income inequality, with a weaker and potentially negative association observed above the estimated threshold. This finding highlights the importance of improving the inclusiveness of regional green development. Policies aimed at narrowing urban–rural disparities, improving rural human capital and agricultural infrastructure, and expanding rural access to green technologies may help create more favorable conditions for translating regional network linkages into agricultural green productivity gains. However, these measures should be understood as policy directions rather than mechanisms directly verified by the present study.
Third, water resource management should be incorporated into strategies for coordinating carbon reduction and agricultural green development. The moderation analysis shows that stronger water resource management is associated with a stronger positive CENC–AGTFP relationship. Accordingly, policymakers should strengthen water-saving irrigation, agricultural water-use efficiency, and water resource management capacity, while promoting coordination between water conservation, carbon reduction, and agricultural modernization. Such integrated governance may create more favorable conditions for the positive association between carbon emission network centrality and AGTFP.
Finally, differentiated policies should be adopted according to regional development conditions. The heterogeneous relationship between CENC and AGTFP across regions with different agricultural labor productivity levels indicates that the capacity to translate network-related advantages into agricultural green productivity may vary with local agricultural development conditions. Therefore, regional coordination policies should be complemented by locally appropriate measures that strengthen agricultural productivity, technological adoption, and resource allocation capacity. Rather than applying a uniform policy across cities, policymakers should consider differences in agricultural development foundations and institutional conditions when designing network-based green transformation strategies.
7. Limitations and Future Research
Despite the above findings, several limitations should be acknowledged.
First, a potential mechanical overlap exists between agricultural inputs and agricultural carbon emissions in the construction of AGTFP. Some agricultural inputs, such as fertilizer, pesticide, and energy use, are also important sources of agricultural carbon emissions. Consequently, incorporating agricultural carbon emissions as an undesirable output alongside these input variables may introduce a certain degree of mechanical linkage into the efficiency measurement. We acknowledge that alternative undesirable-output measures could help assess the sensitivity of the estimated AGTFP to this potential overlap. However, constructing an alternative undesirable-output indicator that is both theoretically comparable to agricultural carbon emissions and continuously and consistently measured across all 40 prefecture-level cities throughout the sample period remains challenging. We therefore retain agricultural carbon emissions as the undesirable output because they directly capture the environmental dimension of agricultural green total factor productivity examined in this study. Nevertheless, this potential mechanical overlap represents a limitation of the current measurement framework, and future research could further address this concern by employing alternative environmental-output measures that are consistently available at the city level.
Second, the mechanisms underlying the threshold relationship are not directly verified. Although the threshold regression reveals a nonlinear relationship across different regimes, the estimated threshold pattern alone does not allow us to disentangle the relative contributions of potential channels, such as rural human capital, agricultural infrastructure, and technology absorption. Therefore, we refrain from attributing the observed threshold pattern to any specific mechanism without more direct evidence. Future research could build on this study by examining these potential channels in greater detail and investigating how they contribute to the nonlinear relationship identified here.
Third, potential endogeneity remains a limitation of the empirical analysis. Although the two-way fixed-effects model controls for time-invariant city characteristics and common time shocks, potential endogeneity concerns cannot be completely ruled out. In particular, time-varying omitted factors may simultaneously affect carbon emission network centrality and agricultural green total factor productivity, while reverse causality may also arise if changes in agricultural green productivity subsequently affect a city’s position in the carbon emission network. The lagged-CENC specification provides a temporal-ordering robustness check, but it does not fully resolve these endogeneity concerns. Future research could employ more rigorous identification strategies, such as instrumental-variable approaches or quasi-experimental designs, when suitable instruments or exogenous policy shocks become available.
Fourth, the empirical analysis is limited to cities in the Yangtze River Delta, which constrains the external validity of the findings. The YRD is a highly interconnected urban agglomeration with distinctive economic, industrial, agricultural, and environmental characteristics. These regional features may shape both intercity carbon emission networks and agricultural green productivity, meaning that the estimated CENC–AGTFP association may not necessarily be transferable to other regions. Therefore, the findings should be interpreted primarily within the context of the YRD rather than as universally applicable to other Chinese urban agglomerations. Future research could extend the analysis to other regions and conduct cross-regional comparisons, such as with the Pearl River Delta, to examine whether the observed relationship is robust across different regional contexts.
Taken together, these limitations point to several promising directions for future research, including improving city-level environmental-output measurements, directly testing the mechanisms underlying nonlinear relationships, strengthening causal identification, and conducting cross-regional validation.
Author Contributions
Conceptualization, W.X. and J.M.; Methodology, W.X.; Software, W.X.; Validation, J.M. and C.C.; Formal Analysis, W.X.; Investigation, W.X.; Data Curation, W.X.; Writing—Original Draft Preparation, W.X.; Writing—Review and Editing, J.M. and C.C.; Supervision, J.M. All authors have read and agreed to the published version of the manuscript.
Funding
This research was supported by the Fundamental Research Funds for the Central Universities (Grant No. B20250207103) and the Social Science Fund of Jiangsu Province (Grant No. 26GLB026).
Institutional Review Board Statement
Not applicable.
Informed Consent Statement
Not applicable.
Data Availability Statement
The data used in this study were obtained from publicly available sources, including the China City Statistical Yearbook and relevant provincial statistical yearbooks. The processed data and empirical results supporting the findings of this study are available from the corresponding author upon reasonable request.
Conflicts of Interest
The authors declare no conflict of interest.
References
- Zhang, R.; Shen, H.; Luo, L.; Zhao, Y. International unilateral climate policies and carbon leakage: Evidence from airline routes. Energy Econ. 2026, 157, 109279. [Google Scholar] [CrossRef] [Scilit]
- Ning, J. The Direction, Route and Key Tasks of a Chinese Path to Modernization. J. Manag. World 2023, 39, 1–19. [Google Scholar] [CrossRef]
- Xiang, S.; Chen, Z.; Zheng, R. Spatio-temporal Evolution and Driving Mechanism of Agricultural Green Total Factor Productivity in China. Environ. Sci. 2026, 1–21. [Google Scholar] [CrossRef]
- Shen, Y.; Zhou, P. Measurement of Agriculture Green Total Factor Productivity and Convergence Analysis Based on the Dual Perspective of Carbon Sinks and Carbon Emissions. World Surv. Res. 2022, 4, 58–68. [Google Scholar] [CrossRef]
- Li, G.; Chen, N.; Min, R. Growth and Sources of Agricultural Total Factor Productivity in China under Environmental Regulations. China Popul. Resour. Environ. 2011, 21, 153–160. [Google Scholar] [CrossRef]
- Wu, Y.; Liu, Q.; Guo, S.; Zhao, J. Farmland Transfer, Cropping Structure, and Agricultural Green Total Factor Productivity. Res. Agric. Mod. 2026, 47, 265–276. [Google Scholar] [CrossRef]
- Tian, A.; Zeng, L. Research on the Impact of Agricultural Machinery Purchase Subsidies on Green Total Factor Productivity in Agriculture. West Forum 2024, 34, 94–109. [Google Scholar] [CrossRef]
- Wen, X.; Huang, L.; Yang, H. Empirical test of the impact of digital agriculture development on agricultural green total factor productivity: Evidence from western China. Stat. Decis. 2026, 42, 61–65. [Google Scholar] [CrossRef]
- Sun, X. The impact of horizontal ecological protection compensation on agricultural green total factor productivity. Chin. J. Agric. Resour. Reg. Plan. 2026, 1–11. Available online: https://link.cnki.net/urlid/11.3513.S.20260428.1347.013 (accessed on 20 September 2026).
- Wang, Z.; Xie, W.; Zhang, C. Towards COP26 targets: Characteristics and influencing factors of spatial correlation network structure on U.S. carbon emission. Resour. Policy 2023, 81, 103285. [Google Scholar] [CrossRef] [Scilit]
- Qing, X.; Guiliang, T.; Zheng, W. Examining embodied carbon emission flow relationships among different industrial sectors in China. Sustain. Prod. Consum. 2022, 29, 100–114. [Google Scholar] [CrossRef] [Scilit]
- Liu, C.; Sheng, S.; Zhao, Z. Impact of Digital Economy on Regional Collaborative Emission Reduction: Evidence from 30 Provinces in China. Soft Sci. 2025, 39, 127–135. [Google Scholar] [CrossRef]
- Sun, X.; Li, M.; Hou, S.; Zhang, C. Research on the Spatial Network Characteristics, Synergistic Emission Reduction Effects and Mechanisms of Carbon Emission in Beijing–Tianjin–Hebei Urban Agglomeration. Sustainability 2023, 15, 8176. [Google Scholar] [CrossRef] [Scilit]
- Lv, T.; Zhao, Q.; Fu, S.; Jin, G.; Zhang, X.; Hu, H.; Xu, G. Deciphering flows: Spatial correlation characteristics and factors influencing carbon emission intensity in the Yangtze River Delta. J. Clean. Prod. 2024, 483, 144290. [Google Scholar] [CrossRef] [Scilit]
- Zhang, Y. Study on Chinese Provincial Collaborative Carbon Reduction Based on Spatial Correlation Network Structure. J. Stat. Inf. 2017, 32, 63–69. [Google Scholar] [CrossRef]
- Yu, J.; Zhang, Y.; Li, Q. Structural characteristics and evolutionary mechanism of spatial correlation network of carbon emissions in the Yangtze River Delta. J. Nat. Resour. 2024, 39, 372–391. [Google Scholar] [CrossRef] [Scilit]
- Ke, D.; Xu, B.; Liu, Y. The impact of regional integration on green development efficiency. Stat. Decis. 2023, 39, 114–119. [Google Scholar] [CrossRef]
- Yang, R.; Xia, M. How Regional Integration Policies Affect Energy Efficiency: Evidence from a Quasi-Natural Experiment of the Yangtze River Economic Belt Development Strategy. Resour. Environ. Yangtze Basin 2025, 34, 2406–2418. [Google Scholar]
- Chen, Y.; Zhang, S.; Zhang, W. Research on the Impact of the Yangtze River Economic Belt Development Strategy on Agricultural Carbon Emissions in the Yangtze River Basin. Chongqing Soc. Sci. 2025, 6, 104–117. [Google Scholar] [CrossRef]
- Li, G.; Gao, D.; Lyu, S. Regional Integration and Green Development of Urban Agglomerations: Quasi-natural Experiment Based on Yangtze River Delta Expansion. Econ. Surv. 2022, 39, 22–31. [Google Scholar] [CrossRef]
- Li, L.; Chen, W. Does Market Integration Promote Green Development of Urban Agglomeration in Yangtze River Economic Belt? Study Pract. 2022, 7, 65–74. [Google Scholar] [CrossRef]
- Gao, Y. Urban bias, urban-rural income gap, and China’s agricultural growth. China Rural Surv. 2010, 5, 2–13. [Google Scholar] [CrossRef]
- Fan, D.; Zhu, Y. Dual Economy, the Flow of Agricultural Labor and Grain Production. J. Yunnan Univ. Financ. Econ. 2012, 28, 50–56. [Google Scholar] [CrossRef]
- Tang, F. Research on the Reform of China’s Public Expenditure Policy Under the Goal of Maximizing Residents’ Happiness. Financ. Account. Mon. 2019, 12, 147–153. [Google Scholar] [CrossRef]
- Zhang, S. A Study on the Fiscal Policy of Income Gap between Urban and Rural Residents in Shanxi Province. Econ. Probl. 2017, 10, 45–50+73. [Google Scholar] [CrossRef]
- Yang, G.; Yang, Y.; Gong, G.; Chen, X. The coupling and coordination characteristics of agricultural green water resources and agricultural economic development in China. Environ. Dev. Sustain. 2024, 26, 2131–2151. [Google Scholar] [CrossRef] [Scilit]
- Tone, K. A slacks-based measure of efficiency in data envelopment analysis. Eur. J. Oper. Res. 2001, 130, 498–509. [Google Scholar] [CrossRef] [Scilit]
- Tone, K. A slacks-based measure of super-efficiency in data envelopment analysis. Eur. J. Oper. Res. 2002, 143, 32–41. [Google Scholar] [CrossRef] [Scilit]
- Tone, K.; Tsutsui, M. Applying an efficiency measure of desirable and undesirable outputs in DEA to U.S. electric utilities. J. Cent. Cathedra Bus. Econ. Res. J. 2011, 4, 236–249. [Google Scholar] [CrossRef] [Scilit]
- Oh, D. A global Malmquist-Luenberger productivity index. J. Product. Anal. 2010, 34, 183–197. [Google Scholar] [CrossRef] [Scilit]
- Hansen, B.E. Threshold effects in non-dynamic panels: Estimation, testing, and inference. J. Econom. 1999, 93, 345–368. [Google Scholar] [CrossRef] [Scilit]
- Liu, J.; Zhang, J.; Wang, S.; Yang, Y.-F.; Ren, Z. Structural characteristics and influencing factors of the spatial correlation network of carbon emissions in China: A study based on the stochastic actor-oriented model. Environ. Dev. Sustain. 2025, 1–25. [Google Scholar] [CrossRef] [Scilit]
- Wu, C.Q.; Song, Z.Y. Study on the measurement and affecting factors of agricultural green total factor productivity in the Yangtze River Economic Belt. Sci. Technol. Prog. Policy 2018, 35, 35–41. [Google Scholar]
- West, T.O.; Marland, G. A synthesis of carbon sequestration, carbon emissions, and net carbon flux in agriculture: Comparing tillage practices in the United States. Agric. Ecosyst. Environ. 2002, 91, 217–232. [Google Scholar] [CrossRef] [Scilit]
- Cheng, K.; Pan, G.; Smith, P.; Luo, T.; Li, L.; Zheng, J.; Zhang, X.; Han, X.; Yan, M. Carbon footprint of China’s crop production—An estimation using agro-statistics data over 1993–2007. Agric. Ecosyst. Environ. 2011, 142, 231–237. [Google Scholar] [CrossRef] [Scilit]
- Wu, F.L.; Li, L.; Zhang, H.L.; Chen, F. Effects of conservation tillage on net carbon flux from farmland ecosystems. Chin. J. Ecol. 2007, 26, 2035–2039. Available online: https://www.scopus.com/pages/publications/38849093932 (accessed on 20 September 2026).
- Li, B.; Zhang, J.; Li, H. Research on Spatial-temporal Characteristics and Affecting Factors Decomposition of Agricultural Carbon Emission in China. China Popul. Resour. Environ. 2011, 21, 80–86. [Google Scholar] [CrossRef]
- Ministry of Ecology and Environment, General Office. Notice on Greenhouse Gas Emission Reporting for Enterprises in the Power Generation Industry (2023–2025). Huanban Qihou Han [2023] No. 43. 2023. Available online: https://www.mee.gov.cn/xxgk2018/xxgk/xxgk06/202302/t20230207_1015569.html (accessed on 20 September 2026).
- Su, T.; Li, C. A study on the impact of the digital economy on the green total factor productivity of China’s livestock industry. Chin. J. Agric. Resour. Reg. Plan. 2026, 1–20. Available online: https://link.cnki.net/urlid/11.3513.S.20260311.1454.014 (accessed on 20 September 2026).
- Liu, Q.; Xiao, H. The impact of farmland management scale and fiscal policy for supporting agriculture on agricultural carbon emission. Resour. Sci. 2020, 42, 1063–1073. [Google Scholar] [CrossRef] [Scilit]
- Ye, J.; Yuan, Q.; Lin, K. Study on the impact of mechanization on agricultural green total factor productivity: Dual path effect based on technology. J. Chin. Agric. Mech. 2025, 46, 280–290. [Google Scholar] [CrossRef]
- Liu, X.; Huang, F. Impact of agricultural mechanization development on green total factor productivity in agriculture. J. Chin. Agric. Mech. 2026, 1–10. Available online: https://link.cnki.net/urlid/32.1837.S.20260130.1518.004 (accessed on 20 September 2026).
- Fukuyama, H.; Weber, W.L. A directional slacks-based measure of technical inefficiency. Socio-Econ. Plan. Sci. 2009, 43, 274–287. [Google Scholar] [CrossRef] [Scilit]

Disclaimer/Publisher’s Note: The statements, opinions and data contained in all publications are solely those of the individual author(s) and contributor(s) and not of MDPI and/or the editor(s). MDPI and/or the editor(s) disclaim responsibility for any injury to people or property resulting from any ideas, methods, instructions or products referred to in the content. |
© 2026 by the authors. Licensee MDPI, Basel, Switzerland. This article is an open access article distributed under the terms and conditions of the Creative Commons Attribution (CC BY) license.