


Abstract
The regeneration of brownfield sites in Belgrade represents an important component of sustainable urban development. Over the past two decades, Belgrade has experienced extensive redevelopment of brownfield sites, although these transformations have largely taken place without a coherent strategic framework for integrating the provision of public amenities with the needs and priorities of local communities. This study evaluates the regeneration potential of 23 brownfield sites representing different activation statuses using a multi-criteria assessment framework based on the Analytic Hierarchy Process (AHP). As a case study, the proposed framework has practical applicability and can support decision-makers in the planning and activation of future brownfield sites by incorporating lessons learned from previous redevelopment processes. The ultimate contribution of this study therefore lies in bridging methodological assessment and practical decision-making, thereby supporting more sustainable, evidence-based, and context-sensitive brownfield regeneration. Thirteen criteria were grouped into three thematic categories: environmental safety; infrastructure development and spatial capacity; and quality of life and social well-being. The analysis integrated data from strategic planning documents, spatial datasets, satellite imagery, and field verification, while Geographic Information Systems (GIS) were used to process, spatially integrate, and visualize the results. The proposed framework integrates environmental, spatial, infrastructural, and social considerations to provide a systematic basis for assessing and prioritizing brownfield regeneration. The results indicate that brownfield activation in Belgrade has frequently occurred without sufficient alignment with a clearly defined urban development strategy. Brownfield sites have most commonly been converted into residential areas and shopping centers, while insufficient consideration has been given to the provision of green spaces, tourism-related uses, and potential environmental pressures. Sites located in the municipalities of Savski Venac and Rakovica demonstrate the greatest potential for the integration of green infrastructure. Based on the assessment results, three brownfield typologies were identified: sites suitable for ecological restoration and green corridor development; sites suitable for mixed-use regeneration incorporating public facilities; and sites requiring priority remediation before redevelopment. The findings provide practical guidance for environmental protection, urban safety, and multifunctional regeneration of post-industrial areas, while demonstrating the potential applicability of the proposed methodology to other urban areas facing similar brownfield regeneration challenges.
1. Introduction
The economy of Belgrade has undergone substantial structural changes over the past four decades, resulting in the transformation of numerous industrial complexes, railway corridors, and former military facilities into brownfield sites. This transformation has been driven by multiple factors, including technological obsolescence, market decline, economic restructuring associated with the transition and privatization processes, and decisions made by national and local authorities. Brownfield areas constitute a substantial component of the urban landscape of Belgrade (Figure 1a).
Figure 1.
(a) Geographical location of the study area. (b) Administrative area of Belgrade and urban settlement of Belgrade [1].
Given the extensive spatial distribution of brownfield sites across the city, the entire brownfield area of Belgrade was not included in the analysis. Instead, a representative sample of sites was selected to provide a methodological basis for assessing their regeneration potential.
Environmental pollution associated with brownfield sites represents one of the major challenges in assessing their potential for revitalization. Brownfields are defined as land or facilities where previous activities have resulted in actual or perceived contamination and which are currently not in active use but have potential for redevelopment [2]. According to Filipović and Samardžić [3], an analysis of selected areas within the Zvezdara municipality of Belgrade identified several common environmental and spatial problems in the vicinity of brownfield sites, including the formation of illegal dumpsites and unauthorized sites for the disposal of secondary raw materials, spatial encroachment associated with unsanitary housing, unpleasant odors, deterioration and collapse of facades and fences, and degradation of the site’s landscape and environmental characteristics.
To assess the level of site contamination, four levels of investigation may be distinguished: (1) site identification without field investigation, based on available historical data; (2) preliminary investigation to assess the potential presence of contamination; (3) detailed investigation, conducted when contamination has been established to determine remediation and site-cleanup requirements; and (4) post-remediation monitoring to determine whether the remediation objectives have been achieved [4].
Due to the absence of a unified national brownfield registry, the total area of brownfield sites in Serbia cannot be reliably determined [5]. A substantial number of brownfield sites in Belgrade have been repurposed in recent decades, primarily for residential, commercial, and mixed-use development. Informal settlements have generally not been subject to systematic redevelopment, except in cases where the land was sold to private investors and subsequently redeveloped for new uses. In addition, the Serbian Armed Forces transferred ownership or use rights to several former military complexes as compensation, primarily through arrangements involving the provision of residential units. Examples include the former “Aleksa Dundić” barracks, which has been transformed into the Zemunske Kapije residential complex, and the former “Vojvoda Stepa Stepanović” barracks, which has been redeveloped as the Stepa Stepanović residential complex [1].
Former railway areas have also undergone significant transformation. The former railway area in the central part of Belgrade was incorporated into the Belgrade Waterfront development, while sections of the former railway infrastructure in the Dorćol area are being transformed into a linear park. In the Košutnjak area, a section of the former railway corridor is being converted into Patrijarh Pavle Boulevard. Further transformation of former industrial complexes is anticipated in the coming years, particularly following amendments to the Law on Planning and Construction and the abolition of the land conversion fee. Several large former industrial sites, including BIP, the Port of Belgrade, IMT, IMR, 21. Maj, and Duga, are expected to undergo transformation into residential, commercial, or mixed-use areas [1].
Previous redevelopment processes have frequently involved the transformation of brownfield areas into high-rise residential structures, commercial facilities, and shopping centers, while informal settlements have generally remained outside systematic redevelopment processes. At the same time, insufficient consideration has been given to the needs of local communities for green spaces, public facilities, and adequate transport and utility infrastructure. Addressing these challenges requires a systematic methodological approach that can support the assessment and planning of future brownfield regeneration. Sanitary and utility-related problems associated with brownfield sites are often linked to unmanaged and inadequately maintained areas, where existing environmental conditions may require remediation prior to redevelopment [1].
1.1. Literature Review and Research Gap
Brownfield regeneration addresses environmental contamination [4] as well as broader economic, environmental, and socio-spatial impacts on urban areas [6]. In the post-industrial urban context, the decline of manufacturing activities and the expansion of the service sector [7] have redirected development interest towards technology parks and the redevelopment of previously industrial sites [8]. At the same time, former industrial sites provide opportunities for local economic restructuring through adaptive reuse, including the development of cultural and industrial heritage [9], tourism [10], and commercial transformations such as Belgrade’s Beton Hala [1].
To assess these complex spatial dynamics, multi-criteria decision analysis (MCDA) has been integrated with GIS to evaluate spatial suitability [11], incorporate remote sensing data [12], and support decision-making in brownfield regeneration [13]. Specific evaluation indicators, including infrastructure investment, the proportion of green space, and industrial contamination, have been proposed by Burinskienė et al. [14]. However, determining appropriate criterion weights becomes increasingly challenging as the heterogeneity of indicators increases [15], highlighting the need for group decision-making approaches [16] and statistical approaches to quantify uncertainty in expert judgments [17].
Using a combination of keywords (“GIS-AHP”, “multi-criteria decision analysis”, and “brownfield redevelopment”), a systematic literature search was conducted in the Web of Science (WoS) and Scopus databases to identify the methodological approaches used for brownfield redevelopment. Previous studies have made significant methodological contributions by establishing theoretical and expert-based criteria for brownfield redevelopment [18], as well as by employing spatial simulations to model land-use allocation using advanced computational approaches [19]. Hybrid AHP-based models integrated within GIS methodology have also been applied to evaluate specific brownfield redevelopment options, including the planning of green infrastructure to mitigate the urban heat island effect [20] and the assessment of rural brownfield sites for the development of solar energy applications [21].
However, existing models tend to focus on individual redevelopment options or specific sectors, highlighting the need for integrated geospatial approaches capable of simultaneously addressing the complex environmental, safety, infrastructural, and social conditions that characterize specific urban contexts. In response to this gap, this study adopts a comprehensive spatial perspective by assessing the area surrounding brownfield sites and evaluating its capacity and needs in relation to appropriate brownfield redevelopment.
1.2. Research Objectives, Questions, and Contribution
A comparative analysis of the current conditions observed at previously activated brownfield sites provides a basis for drawing conclusions and formulating recommendations for the planning and activation of sites that have yet to be redeveloped. The selected sites are evaluated using 13 criteria grouped into three dimensions: environmental safety; infrastructure and spatial capacity; and social infrastructure and quality of life. These criteria are integrated through the AHP within a QGIS environment, enabling the spatially explicit assessment of brownfield redevelopment potential.
The analysis is supported by relevant scientific literature and planning documentation, providing both an empirical and methodological foundation for the assessment. The proposed approach offers a framework for guiding future brownfield activation while reducing the risk of perpetuating shortcomings identified in previously redeveloped sites, including insufficient green infrastructure and public facilities, increased anthropogenic pressure, and adverse environmental impacts. By linking the assessment of spatial capacity and local needs with lessons derived from existing redevelopment outcomes, the study provides a transferable decision-support framework for more sustainable, context-sensitive, and evidence-based brownfield regeneration.
Based on the identified research gap, this study addresses the following key research questions:
- Q1: How can heterogeneous geospatial datasets be systematically integrated into an AHP-based model within a GIS methodology to assess the redevelopment suitability of urban brownfield sites?
- Q2: What are the existing site conditions and redevelopment suitability of activated, partially activated, and inactive brownfield sites when assessed across three dimensions: Environmental Safety, Spatial and Infrastructural Capacity, and Geo-Spatial Standards?
- Q3: How can spatial deficiencies identified at previously activated brownfield sites inform planning measures for the sustainable redevelopment of remaining inactive sites?
Research Objective:
The primary objective of this study is to develop a multi-criteria AHP model applicable within a GIS environment, incorporating defined quantitative indicators to support the sustainable planning of urban brownfield land uses and provide decision support tailored to specific spatial contexts.
Methodological Approach:
The study employs a GIS-AHP multi-criteria analysis implemented in QGIS, based on 13 spatially explicit criteria grouped into three thematic dimensions. The model is applied to 23 brownfield sites in Belgrade, representing different activation statuses: activated, partially activated, and inactive. The methodological framework includes consistency analysis of the pairwise comparison matrices and raster-based overlay of the thematic layers to generate a spatial suitability map for brownfield redevelopment.
Expected Novelty and Contribution:
The study develops an integrated multi-criteria spatial model that evaluates brownfield redevelopment suitability by simultaneously considering environmental safety, infrastructural capacity, and the needs of local communities across individual sites and their surrounding areas. The resulting framework provides a spatially explicit basis for informing future planning and decision-making processes related to brownfield activation and redevelopment, with the aim of supporting more sustainable and context-sensitive urban development.
The paper is organized as follows. First, the study area is introduced, followed by a description of the research methodology, cartographic framework, underlying databases, and criteria employed in the AHP analysis. The subsequent sections present and discuss the results, followed by the main conclusions and implications of the study.
2. Research Area
The Administrative Area (AA) of Belgrade comprises 17 municipalities and occupies a total area of 3224 km2, with a strategic geographical position at the intersection of Central Europe, the Balkans, and the Danube region (Figure 1b). Within the AA, the Urban Settlement (US) of Belgrade represents a smaller territorial unit covering 388.87 km2 and encompassing the main urban core, where the majority of brownfield sites are concentrated. According to the 2022 population census, the AA of Belgrade had a population of 1,681,405, while the US of Belgrade had 1,197,714 inhabitants, accounting for 71.2% of the total population of the AA [1].
The representative sample comprised brownfield sites selected primarily according to their spatial extent, with emphasis placed on the largest polygonal sites. The selection process was further based on the stage and extent of redevelopment, as well as the impact of each site on its surrounding area. Particular consideration was given to activated military and railway brownfields due to their substantial spatial extent and their potential influence on the surrounding urban environment.
A further important criterion for inclusion was the existence of approved planning documentation that did not incorporate a comprehensive assessment of the surrounding area, particularly with regard to deficiencies in green spaces, public facilities, and other elements relevant to the quality of the urban environment. Smaller brownfield sites were excluded where redevelopment had resulted primarily in residential construction and where, in individual cases, such transformation did not present significant environmental concerns.
The final stage of the selection process involved classifying the sites according to their degree of activation, resulting in three categories: activated, partially activated, and inactive brownfield sites. This classification enabled a comparative assessment of sites at different stages of redevelopment. Partially activated sites are of particular relevance, as their further redevelopment is expected to result in complete redevelopment, despite the absence of a comprehensive assessment of redevelopment suitability and local population needs. Their current status enables the early identification of potential deficiencies and provides a basis for informing planning decisions regarding their subsequent transformation.
The brownfield sites analyzed in this study were classified into three groups according to their activation status: activated sites (A1–A7), partially activated sites (P1–P3), and unactivated sites (U1–U13). The activated sites (A1–A7) comprise two former military complexes: the Aleksa Dundić barracks in Zemun, which has been transformed into the Zemunske Kapije residential complex, and the Vojvoda Stepa Stepanović barracks, which has been redeveloped as the Stepa Stepanović residential complex. This group also includes the former industrial zone along Višnjička Street; the former Precizna Mehanika factory, currently used as a shopping center; the industrial zone along Ustanička Street, which has been transformed into residential complexes; the former FMP industrial site, currently occupied by a residential complex; and the former Rekord factory in Rakovica, which has been converted into a shopping center.
The partially activated sites (P1–P3) include the former railway corridor extending from the Pančevo Bridge to Topčider Park, encompassing the decommissioned Dunav, Belgrade Main, and Topčider railway stations, as well as individual industrial facilities. This area has undergone extensive redevelopment, including the transformation of parts of the former railway area through the Belgrade Waterfront project and the development of a linear park [22]. The group also includes the former Zmaj industrial zone, where parts of the area have been transformed into residential buildings and shopping centers, and the industrial zone in New Belgrade and Zemun, where former industrial areas have been partially converted to residential use.
The unactivated sites (U1–U13) comprise a range of former industrial and production areas, including the industrial complex in New Belgrade encompassing Blocks 64 and 65; the former Industrija Mašina i Traktora (IMT) complex; and the former FOB (Belgrade Foundry Factory). The IMT site is currently designated for redevelopment under the Detailed Regulation Plan for the Area between Jurija Gagarina Street and Zemunska Street (IMT), New Belgrade Municipality—Phase I (2022). Other unactivated sites include the industrial zone along the Sava River in New Belgrade; the former Beko industrial complex; industrial areas in the Stari Grad zone, including Ada Huja and the Dorćol Marina; sugar refineries in the Rospi Ćuprija area; the former Kluz factory; the industrial zone along Peka Dapčevića Street, including Napred, Industrija Obuće Beograd, Prokupac, and Preduzeće za Puteve; the former Dvadesetprvi Maj Beograd (DMB) complex, including the turbojet engine and transmission factory and the Small Engine Factory, for which the Detailed Regulation Plan for part of the AD 21 industrial complex in Maj, Rakovica Municipality, provides for land-use transformation and spatial redevelopment; and the industrial zone in Železnik.
3. Materials and Methods
To assess the suitability of brownfield sites for regeneration within the Urban Settlement of Belgrade (hereafter, US Belgrade), a multi-criteria assessment based on AHP was applied. The research methodology was structured into four interconnected phases implemented within a Geographic Information Systems (GIS) environment:
- Spatial data collection and processing, including the creation of raster and vector layers for the 13 assessment criteria.
- Standardization and reclassification of different data types using a four-point scale (1–4) to ensure data comparability for subsequent analysis.
- Construction of AHP matrices, including the determination of criterion weights and verification of the mathematical consistency of the model.
- Visualization and interpretation of the results, including the identification of problems associated with the redevelopment of activated brownfield sites and the prioritization of unactivated brownfield sites for sustainable regeneration in accordance with spatial needs.
To ensure data comparability, methodological consistency, and the applicability of the assessment model, the 13 criteria included in the AHP analysis and grouped into three thematic categories were evaluated based on the current conditions at the investigated sites. The study encompasses three types of brownfield sites according to their activation status: activated, partially activated, and unactivated brownfield sites. Applying a common temporal reference point enables a consistent assessment of existing conditions and facilitates an objective comparison across the investigated sites. The results subsequently enable a comparative assessment of the spatial and functional characteristics of previously redeveloped brownfield sites and those awaiting transformation. Based on these findings, the Discussion section proposes measures aimed at preventing the recurrence of shortcomings identified in previously activated brownfields, particularly those related to excessive population density and deficiencies in transport infrastructure and public facilities.
The domestic literature reviewed does not provide methodological approaches capable of adequately assessing the appropriateness of brownfield redevelopment. Existing studies have primarily focused on the impacts of brownfield redevelopment and the potential for their transformation, rather than on developing an integrated framework for evaluating the suitability of different redevelopment options. Furthermore, within the international literature reviewed for this study, no applications of the AHP method were identified that integrate the specific spatial, environmental, infrastructural, and social dimensions required to assess the suitability of brownfield redevelopment in the context of Belgrade.
The specific spatial characteristics and organizational structure of brownfield sites within the urban area of Belgrade therefore call for a tailored methodological approach to their assessment and future activation. In this context, the proposed GIS-AHP framework seeks to provide a systematic basis for evaluating redevelopment suitability while accounting for the environmental safety, infrastructural capacity, and social needs of the surrounding urban area.
3.1. Dataset
QGIS version 3.40.9 [23] was used for the processing and analysis of geospatial data. For each of the 23 investigated brownfield sites, a 500 m buffer zone was established around the site boundaries. The brownfield sites were digitized as vector polygons based on cadastral plot boundaries, and the resulting buffered areas were used to define the spatial extent of the analysis. The investigated polygons vary in area because some represent individual brownfield facilities, whereas others encompass larger industrial zones. Table 1 provides a summary of the 13 criteria used in the analysis.
Table 1.
Summary of the 13 criteria used in the GIS-AHP analysis.
First Group of Criteria
Data on landslide susceptibility were obtained from the website of the Urban Planning Institute of Belgrade under “02—Geological Data” [24] and cross-referenced with Map 08—“Urban Development Constraints”, at a scale of 1:50,000, from the Master Urban Plan of Belgrade (2016). The available data were used to identify and verify areas of stable terrain, conditionally stable terrain (areas with potential landslide occurrence), remediated or fossil landslides, and active landslides within the study area. The resulting spatial data were integrated into the GIS environment and reclassified according to a four-point suitability scale (1–4) for subsequent AHP analysis.
In accordance with the Law on Air Protection (“Official Gazette of the RS”, No. 51/2025), the Environmental Protection Agency (SEPA) publishes an annual report on the state of air quality in the Republic of Serbia. In this study, the air quality criterion was based on the air quality index reported for 2024 in the Annual Report on Air Quality in the Republic of Serbia for 2024 [26]. The classification follows the European Environment Agency (EEA) air quality index, which distinguishes three categories of relatively clean air (“good”, “acceptable”, and “moderate”) and three categories of polluted air (“polluted”, “very polluted”, and “extremely polluted”).
For each of the 23 investigated polygons, the air quality assessment was based on PM2.5 data obtained from the nearest SEPA monitoring station. The available real-time PM2.5 measurements published on the SEPA website were considered in accordance with the classification presented in the annual report [26]. To ensure the representativeness of the selected data and reduce the potential influence of short-term fluctuations or extreme values, the measurements were cross-checked with other data available from the SEPA monitoring network. The nearest monitoring station to each investigated polygon was identified in QGIS using the Distance to Nearest Hub tool.
The air quality data were interpreted in relation to the applicable national regulatory framework, including the Regulation on Limit Values of Emissions of Pollutants from Stationary Sources (“Official Gazette of the RS”, Nos. 5/16 and 10/24) and the Regulation on Monitoring Conditions and Air Quality Requirements (“Official Gazette of the RS”, Nos. 11/2010, 75/2010, and 63/2013).
The main watercourses were digitized from the topographic map of the Military Geographical Institute [27]. To assess the distance of the investigated brownfield sites from the main watercourses—the Danube, the Sava, and the Topčider River—the Multi-ring Buffer tool in QGIS was used to generate concentric distance zones at predefined intervals. The resulting spatial layer was reclassified into four classes to ensure comparability within the AHP matrix.
Second Group of Criteria
Land-use data from the Copernicus Urban Atlas were used as one of the data sources for the AHP analysis [32]. The dataset consists of high-resolution vector layers with a minimum mapping unit of 0.25 ha for urban areas in Europe, including Belgrade. The data used in this study cover the 2020–2022 period and are available in vector format through the Copernicus Urban Atlas platform. The spatial accuracy and current relevance of the vector layers were verified using Google Satellite imagery and cross-referenced with the planned land use defined in the Draft Master Urban Plan of Belgrade until 2041 (2022) [25].
As official census data do not provide population counts at the settlement level in Belgrade, open-access spatial data from the global WorldPop database [31] were used to estimate population density and anthropogenic pressure. Population data for Belgrade were obtained based on the 2022 population census and represented as a raster dataset with a spatial resolution of 100 m × 100 m. The mean anthropogenic pressure index was subsequently calculated for each of the 23 investigated polygons using the Zonal Statistics tool in QGIS. To account for differences in polygon area, the calculated values were normalized by dividing each value by the corresponding polygon area and subsequently reclassified into four classes. A similar approach was adopted by Wang et al. [33], who developed a planning model to balance ecosystem services and brownfield greening, incorporating WorldPop data as a population data source.
Road network data used to assess the distance from major thoroughfares and the internal road connectivity of the investigated sites were obtained from Geofabrik’s OpenStreetMap database [29]. Major thoroughfares were extracted from the road network, and their distances from the investigated brownfield sites were calculated in QGIS using the Multi-ring Buffer tool to generate concentric distance zones according to predefined parameters. The resulting spatial layer was reclassified into four classes.
Local roads and unclassified paths were also extracted from the same vector database to assess internal connectivity. Road intersections within the investigated polygons were identified using the Line Intersections tool in QGIS and subsequently verified using Google Satellite imagery. The number of intersections within each investigated polygon was normalized by dividing it by the corresponding polygon area, and the resulting values were reclassified into four classes to ensure comparability among the investigated sites.
Third Group of Criteria
To assess the degree of greenness and the proximity to green spaces, multiple spatial data sources were integrated, including the Copernicus Urban Atlas [30], OpenStreetMap (OSM) data obtained from Geofabrik [29], planning documentation from the Urban Planning Institute of Belgrade, specifically the Draft General Urban Plan until 2041 (2022) [25], and Google Satellite imagery for visual verification. The degree of greenness was expressed as the amount of green space (m2) per capita within each investigated polygon, while proximity to green spaces was assessed using the Multi-ring Buffer function. Both indicators were subsequently classified into four classes. Sentinel-2 imagery provides spatial data at a resolution of up to 10 m and is widely used in scientific research for vegetation mapping [34,35]. However, Sentinel-2 data may be subject to uncertainties associated with atmospheric conditions during image acquisition and may have limitations in detecting small-scale, fragmented areas of vegetation due to their spatial resolution [36]. To minimize these uncertainties, the identified green spaces were cross-verified using Google Satellite imagery. Small, isolated, and highly fragmented green areas were excluded from the analysis because they were considered unlikely to constitute spaces of meaningful public significance.
Relevant literature, Points of Interest (POI) data from the Geofabrik OpenStreetMap geodata portal [29], and Google Satellite imagery were used to identify public and tourist facilities within the study area. Distances to public facilities were calculated in QGIS using the Multi-ring Buffer tool. The number of public and tourist facilities within each investigated polygon was determined using the Count Points in Polygon tool, while facility diversity was assessed based on the number of distinct facility types present within each polygon. All four criteria were subsequently reclassified into four classes.
3.2. Criteria Used in the AHP Analysis
The study incorporated 13 criteria, grouped into three thematic categories and ranked individually according to their relative importance within the AHP framework (Figure 2). The 13 criteria were systematically defined based on the relevant scientific literature and substantiated by empirical research and applicable normative standards. The scientific rationale underlying each criterion, together with the reclassification classes and supporting literature sources, is detailed in Section 3.2.1, Section 3.2.2 and Section 3.2.3.
Figure 2.
Hierarchical structure of AHP criteria for brownfield suitability assessment.
The first group of criteria comprises environmental safety parameters, which received the highest weight in the AHP matrix, accounting for 40% of the overall model weight. This prioritization is justified by the need to ensure human and environmental safety as a fundamental prerequisite for further urban development and brownfield regeneration. The second group, comprising infrastructure development and spatial capacity criteria, accounts for 30% of the overall model weight and reflects the conditions required for the functional integration and redevelopment of brownfield sites within the existing urban system, while minimizing additional infrastructure requirements and avoiding unnecessary pressure on spatial capacity and urban functionality. The third group, addressing quality of life and social well-being, also accounts for 30% of the overall model weight. Its inclusion reflects the importance of meeting residents’ social, cultural, healthcare, educational, and other community needs, which are essential for ensuring the long-term sustainability, attractiveness, and usability of regenerated sites.
3.2.1. First Group of AHP Criteria—Environmental Safety
The first group comprises three key spatial indicators: landslide susceptibility, air quality, and distance from major rivers. Landslide susceptibility represents the most critical criterion, as construction activities and other spatial interventions require a thorough assessment of terrain stability. Air quality serves as an indicator of environmental conditions, public health, and population well-being, while distance from major rivers is relevant for assessing potential flood risk and the potential need for hydrogeotechnical interventions, as well as for recognizing the contribution of water bodies to the quality of urban landscapes. Within the AHP model, this group was assigned a weight of 40%, reflecting the importance of environmental safety in determining the suitability of brownfield sites for regeneration. This weighting ensures that sites presenting significant environmental or safety constraints are appropriately reflected in the overall suitability assessment and prevents such sites from achieving high suitability scores solely on the basis of other favorable characteristics. Where safety-related constraints are identified, appropriate mitigation or remediation measures should therefore be considered before determining the most suitable form of land-use transformation. The evaluation of the criteria comprising the first AHP group is presented in Table 2.
Table 2.
Evaluation of the first group of AHP criteria.
Landslide Hazard
Landslides are a common natural hazard that can damage infrastructure, cause economic losses, and result in fatalities. Their occurrence and severity are influenced by a range of environmental and anthropogenic factors, including climate change, deforestation, and urbanization. Incorporating landslide hazard into land-use planning and disaster risk management provides a basis for assessing and mitigating landslide-related risks associated with construction and land-use transformation [11,37]. Effective mitigation of landslide hazards requires consideration of multiple factors, including terrain slope, population distribution, proximity to roads, precipitation, land use, green-space coverage, and other relevant spatial parameters [38].
Within the AHP framework, landslide hazard was incorporated as a criterion to ensure that terrain stability and associated safety constraints were considered in assessing the suitability of brownfield sites for regeneration. Based on the available spatial data, the criterion was evaluated using a four-point suitability scale (1–4), reflecting the feasibility of brownfield regeneration from a terrain-stability perspective.
A score of 1 (very unfavorable) was assigned to areas affected by active landslides or temporarily stabilized landslides, where ongoing or potentially recurring processes may pose a high risk to people and structures. Such sites are considered unsuitable for conventional urban redevelopment without prior stabilization measures and may require remediation and, where appropriate, afforestation measures. A score of 2 (unfavorable) was assigned to areas with potential landslide hazard, where terrain stability may be compromised by construction activities or other anthropogenic interventions. Development in such areas may require detailed geotechnical investigations, stabilization measures, and additional financial investment.
A score of 3 (favorable) was assigned to stabilized, remediated, and fossil landslides that have undergone engineering interventions and are subject to appropriate technical control or monitoring. Although these areas have been affected by landslide processes in the past, the implementation of appropriate preventive and engineering measures can provide sufficient stability for controlled redevelopment. A score of 4 (very favorable) was assigned to stable terrain without identified landslide processes, representing the most favorable conditions for brownfield regeneration and generally requiring no additional geotechnical stabilization measures.
Air Quality
Urban air pollution from traffic, industrial activities, heating, and other anthropogenic sources can adversely affect population health [39]. The health burden is particularly pronounced in densely populated urban areas, where individuals with cardiovascular, respiratory, and other chronic conditions may be especially vulnerable [40,41]. In 2021, the World Health Organization (WHO) revised its air quality guidelines and established a guideline level of 5 μg/m3 for the annual mean concentration of PM2.5 [42].
Although the WHO 2021 guideline establishes 5 μg/m3 as the recommended annual mean PM2.5 concentration, the 25 μg/m3 threshold was retained in this study because it corresponds to the classification and reporting framework applied in the national air-quality dataset used for the assessment. The criterion was derived from the proportion of the year during which the specified concentration threshold was exceeded, based on data reported in the Air Quality Report for 2024 [26]. The resulting values were reclassified into four classes according to the percentage of the year characterized by PM2.5 concentrations above the specified threshold, thereby ensuring comparability within the AHP model.
A score of 4 (very favorable) was assigned to areas where the exceedance occurred during less than 24% of the year, corresponding to the lowest level of pollution according to the classification applied by the SEPA in accordance with the EEA framework. A score of 3 (favorable) was assigned to areas with exceedance frequencies of 24–27%, representing values around the urban average and corresponding to acceptable air quality. A score of 2 (unfavorable) was assigned to areas with exceedance frequencies of 28–31%, indicating that the PM2.5 threshold was exceeded for approximately one-third of the year. A score of 1 (very unfavorable) was assigned to areas where exceedance occurred during more than 31% of the year, indicating a high level of air pollution and a potentially increased risk to public health.
Distance from Watercourses
Flood vulnerability is influenced by the stability, age, and maintenance of urban infrastructure; however, assessments based solely on infrastructure characteristics may not fully account for precipitation intensity, surface runoff, or flash-flood events [43]. Effective flood-risk management should therefore combine structural and non-structural measures, including spatial planning, water-related land-use management, and community participation [44,45]. Kumar et al. [46] demonstrated the application of a spatially based vulnerability assessment at the district level in Bangalore, India, highlighting the value of spatial planning approaches for reducing uncertainty and supporting decision-making in flood-risk management. The potential effects of climate change should also be considered in the assessment of future flood vulnerability [47]. Given the multidimensional nature of flood vulnerability, the selection of relevant indicators is essential for developing an effective AHP-based assessment framework [48].
In this study, distance from the Danube, Sava, and Topčider rivers was used as an indicator incorporating both flood-related constraints and the potential benefits associated with proximity to water bodies. A score of 1 (very unfavorable) was assigned to areas located within 100 m of a river, due to their direct exposure to alluvial terrain, elevated groundwater levels, and potential flood risk. Redevelopment of brownfield sites in these areas may therefore require costly hydraulic engineering measures, potentially constraining the feasibility of their transformation. A score of 2 (unfavorable) was assigned to areas located more than 1000 m from the main watercourses, where the beneficial microclimatic effects associated with proximity to water bodies are reduced. A score of 3 (favorable) was assigned to the 500–1000 m zone, which represents a relatively safer distance while retaining favorable microclimatic regulatory functions. The highest score, 4 (very favorable), was assigned to areas located 100–500 m from the main watercourses, representing a balance between reduced exposure to hydrological hazards and the beneficial microclimatic effects of proximity to water.
3.2.2. Second Group of AHP Criteria—Infrastructure Development and Spatial Capacity
The assessment of land use, infrastructure, and spatial functionality provides a basis for evaluating the long-term sustainability and integration of brownfield sites within the urban system. The land-use and anthropopressure criteria characterize the intensity of existing human activity and the potential for spatial transformation, while also indicating the extent to which redevelopment may contribute to land-use conflicts or additional pressure on existing urban areas. The logistical and accessibility characteristics of individual sites were assessed through their proximity to major thoroughfares and the capacity of the internal road network. Within the AHP framework, these criteria support the identification of brownfield sites with greater potential for integration into the existing transport and spatial infrastructure, while limiting the need for substantial additional infrastructure and reducing potential spatial conflicts.
The evaluation of the criteria comprising the second AHP group is presented in Table 3. Each criterion was reclassified using a standardized four-point suitability scale: 1—very unfavorable, 2—unfavorable, 3—favorable, and 4—very favorable. The threshold values for each score were established based on relevant scientific literature and adapted to the urban and morphological characteristics of Belgrade.
Table 3.
Evaluation of the second group of AHP criteria.
Land Use
Contemporary scientific literature emphasizes the importance of aligning proposed brownfield regeneration with existing surrounding land uses in order to minimize spatial conflicts and promote balanced urban development [49]. Planning decisions are site-specific and should account for both social and economic considerations [50]. Mosadeghi et al. [51] applied the AHP method to land-use classification, while Beames et al. [52] examined land-use options for brownfield redevelopment in Belgium, with particular attention to the benefits of regeneration for local communities and the provision of social amenities. The consideration of spatial and environmental constraints is also essential for supporting informed land-use decision-making and ensuring environmental protection [53].
Land use within a 500 m buffer around each investigated brownfield site was identified and evaluated (Table 3) to characterize the urban features and spatial functions surrounding the site. This assessment was used to determine the existing spatial capacity and the extent to which additional functions could be accommodated without generating significant conflicts or placing excessive pressure on the surrounding urban system.
A score of 4 (very favorable) was assigned to sites surrounded by land uses that provide favorable conditions for regeneration, particularly where brownfield redevelopment represents the reuse of previously developed land without generating significant additional spatial conflicts or pressure on natural resources. A score of 3 (favorable) was assigned to areas characterized by moderate built-up density and sufficient open space, indicating potential for integrating new functions without substantially increasing pressure on the surrounding urban structure. A score of 2 (unfavorable) was assigned to areas characterized by high infrastructure density and existing environmental pressures, including noise and air pollution, where conversion of brownfield sites to residential or commercial uses could place additional pressure on urban functionality. A score of 1 (very unfavorable) was assigned to areas where existing land-use conditions impose substantial constraints on further development. Where forests, green spaces, or water bodies predominate within the 500 m buffer, additional consideration is required to ensure that regeneration activities do not adversely affect existing natural and ecological functions.
Anthropopressure
Liu et al. [54] assessed the suitability of brownfield sites for redevelopment in Shenzhen, China, using planning data and urban population dynamics to support spatial decision-making. Urbanization and population growth increase demand for land and resources and may intensify environmental pressures, particularly where utility infrastructure is insufficient [55]. In Belgrade, population data for the 2001–2022 period indicate only a modest increase in the population of the US Belgrade, while demographic projections do not indicate substantial population growth in the future. This suggests that the scale and spatial distribution of new residential development should be aligned more closely with projected demographic needs [25]. According to the population projections presented in the Draft Master Urban Plan (2022) [25], considerable spatial differences among municipalities are expected, with population decline projected by 2041 in 9 of the 12 municipalities considered in the projection, while population growth is expected in Zvezdara, Palilula, and Surčin. These demographic trends highlight the importance of more balanced spatial development and the alignment of future residential provision with projected population dynamics.
Anthropopressure was assessed using a four-point suitability scale based on population density and its implications for the provision and functioning of urban services. Because the 23 investigated polygons differ in spatial extent, population estimates were normalized by dividing the estimated population of each polygon by its corresponding area in km2. A score of 1 (very unfavorable) was assigned to areas with population densities exceeding 8000 inhabitants/km2, indicating a high level of anthropogenic pressure and increased demand on the existing urban system. A score of 2 (unfavorable) was assigned to areas with population densities of 6100–8000 inhabitants/km2, where higher population concentrations may place additional pressure on environmental quality, infrastructure, and public services. A score of 3 (favorable) was assigned to areas with population densities of 4500–6100 inhabitants/km2, representing conditions with lower levels of population-related pressure. A score of 4 (very favorable) was assigned to areas with population densities below 4500 inhabitants/km2, representing the most favorable conditions within the adopted classification.
Capacity of Internal Roads
The capacity of the local road network was assessed using intersection density within the 500 m buffer zone surrounding each investigated brownfield site. The 500 m buffer represents the immediate spatial context of the site and was used to assess the connectivity and structural characteristics of the surrounding street network. A higher density of road intersections was interpreted as indicating greater network connectivity and a greater potential for distributing traffic across alternative routes. The assessment was based on existing road-network conditions and the corresponding functionality scores.
The classification also accounts for the morphological differences between peripheral areas of Belgrade, which generally have lower population densities and fewer urban functions, and the more densely developed urban core, where higher levels of street-network connectivity are expected. To ensure comparability among the investigated sites, which differ in spatial extent, the number of road intersections was normalized by dividing it by the area of the corresponding 500 m buffer zone. The resulting indicator was expressed as the number of intersections per km2.
A score of 1 (very unfavorable) was assigned to areas with fewer than 100 intersections/km2, indicating a low level of street-network connectivity. A score of 2 (unfavorable) was assigned to areas with 100–150 intersections/km2. A score of 3 (favorable) was assigned to areas with 150–200 intersections/km2, while a score of 4 (very favorable) was assigned to areas with more than 200 intersections/km2, representing the highest level of intersection density within the adopted classification.
Distance from the Transport Network
This criterion assesses the distance of each investigated brownfield site from higher-order transport corridors, including boulevards, arterial roads, and highways. A 1500 m buffer was established to represent the immediate accessibility range to the higher-order road network and to evaluate the potential for connecting the investigated sites to existing transport infrastructure.
The assessment also considers a recurring challenge in the Urban Settlement of Belgrade, where the development of new residential and commercial complexes may increase demand on existing transport infrastructure and intensify traffic on local streets. A score of 1 (very unfavorable) was assigned to sites located more than 1500 m from a higher-order transport corridor, indicating limited direct accessibility to the primary road network. A score of 2 (unfavorable) was assigned to distances of 1000–1500 m, reflecting relatively limited accessibility and a greater potential reliance on local streets for connection to the higher-order network. A score of 3 (favorable) was assigned to distances of 500–1000 m, representing favorable accessibility to the main transport network. A score of 4 (very favorable) was assigned to sites located within 500 m of a higher-order transport corridor, indicating the greatest potential for direct connection to the existing transport network and reduced reliance on local streets.
3.2.3. Third Group of AHP Criteria—Quality of Life and Social Standard
The third group of criteria addresses quality of life and social well-being, with particular emphasis on the availability and accessibility of public services within the 500 m surroundings of the analyzed brownfield sites. The selected indicators include green infrastructure, represented by the degree of greenness and accessibility to green spaces, as well as social infrastructure, represented by the proximity, density, and functional diversity of public facilities and tourism-related amenities. The integration of these indicators reflects a human-centered planning approach focused on community needs and enables the assessment of the capacity of the surrounding urban environment to accommodate and integrate future spatial changes.
Rather than evaluating these indicators in isolation, the analysis considers their combined contribution to the functional capacity and quality of the surrounding urban environment. The existing conditions within the 500 m buffer zones were therefore assessed both to determine the capacity of the surrounding area to accommodate future redevelopment of unactivated brownfield sites and to evaluate the consequences of previous transformation in activated sites, where substantial spatial changes and increases in anthropogenic pressure have occurred.
The evaluation method for the criteria comprising the third AHP group is presented in Table 4. Each parameter was reclassified according to a standardized four-point suitability scale: score 1—very unfavorable, score 2—unfavorable, score 3—favorable, and score 4—very favorable. The threshold values were established based on relevant scientific literature and adapted to the specific urban planning and spatial characteristics of Belgrade.
Table 4.
Evaluation of the third group of AHP criteria.
Degree of Greenness
Green-space provision, expressed as green-space area per inhabitant (m2/inhabitant), is an important indicator of urban environmental quality and liveability. A higher proportion of green space can contribute to mitigating the urban heat island effect and supporting the continuity of urban green infrastructure. A score of 1 represents a pronounced deficit of green space and corresponds to values below 9 m2/inhabitant, based on the minimum threshold referenced in the World Health Organization-related literature [56,57]. A score of 2 (9–16 m2/inhabitant) represents a transitional level that provides a basic amount of green space, consistent with values of approximately 12–16 m2/inhabitant referenced in United Nations guidelines [58,59]. A score of 3 (16–30 m2/inhabitant) represents favorable green-space provision, taking into account the higher values recommended in international and European planning guidance, including approximately 26–30 m2/inhabitant [60,61]. The maximum score of 4 (>30 m2/inhabitant) represents a very favorable level of green-space provision and corresponds to the target value considered in the Master Urban Plan of Belgrade [25,28].
Distance from Green Areas
Proximity to green areas, including parks, recreational green spaces, urban forests, and protected natural areas, is an important indicator of access to outdoor recreation and contact with nature in urban environments. The criterion is expressed as the Euclidean distance (m) from the analyzed brownfield site to the nearest green area. A score of 1 (>1000 m) represents very poor accessibility and indicates a substantial deficit in access to green space, exceeding the approximately 900–1000 m distance associated with a 15-min walking threshold referenced in European guidance. In the context of brownfield regeneration, this category identifies areas where additional residential development should be accompanied by investment in parks and other forms of green infrastructure.
A score of 2 (500–1000 m) indicates unfavorable accessibility. Although this distance exceeds more stringent local and international recommendations, it remains within the upper range of the approximately 15-min walking distance referenced by the European Environment Agency (EEA). A score of 3 (300–500 m) represents favorable accessibility and is consistent with planning approaches that emphasize access to green spaces within approximately 500 m, including guidance from Berlin and the Dutch Green City Guidelines project [62]. A score of 4 (<300 m) represents very favorable accessibility and was established in accordance with the planning framework of Belgrade, including the Master Urban Plan and the Draft Master Urban Plan until 2041, which identify approximately 300 m as a suitable maximum walking distance for local-level daily recreation [25]. A comparable 300 m accessibility threshold is also reflected in recommendations by Natural England [63,64].
Type, Proximity, and Number of Public Facilities
Proximity to public facilities can reduce dependence on private transport and support a more compact urban structure by contributing to shorter travel distances, reduced commuting times, and potentially lower traffic-related emissions. Greater proximity to public facilities also facilitates the integration of brownfield sites into the existing urban fabric. To assess the attractiveness and functional capacity of an area, the distribution and diversity of public facilities should be considered collectively rather than evaluating individual facilities or distances in isolation [65]. The number and functional diversity of public facilities provide an indication of whether the existing social infrastructure has sufficient capacity to accommodate new land-use functions associated with brownfield regeneration without placing excessive pressure on existing services.
The functional diversity of public facilities was assessed within a 500 m radius of each analyzed brownfield site. The assessment considered specific facility types across three main sectors: healthcare (primary healthcare centers and hospitals), education (primary and secondary schools), and public administration (post offices and courts), resulting in a total of six distinct functional types.
A score of 1 (0–1 facility type) was assigned to locations with no or very limited provision of public facilities. A score of 2 (2 facility types) represented a low level of functional diversity, characterized by a limited range of public services. Such locations may benefit from the introduction of public facilities providing functions that are currently absent from the surrounding area. A score of 3 (3 facility types) indicated moderate functional diversity, with the primary needs of the population for healthcare and education being substantially covered. A score of 4 (4 or more facility types) represented a highly diverse and multifunctional area, reflecting a more balanced provision of public services and a broader range of facilities available to the local population [52].
Proximity to public facilities is an important indicator of accessibility and the capacity of a brownfield site to integrate into the existing urban service network. A distance greater than 1500 m (score 1) represents very poor accessibility and indicates that the introduction of public functions would require substantial investment in additional facilities or improved accessibility. Distances of 1000–1500 m (score 2) and 500–1000 m (score 3) represent progressively more favorable levels of accessibility for educational and cultural facilities [66]. A distance of less than 500 m (score 4) represents very favorable accessibility and corresponds to a convenient walking distance.
The number of public facilities was used to assess the capacity of the social infrastructure within the 500 m buffer zone surrounding each brownfield site. The objective was to identify the existing level of public-service provision and determine whether additional public functions may be required as part of future brownfield regeneration. This criterion also addresses the potential consequences of residential and commercial redevelopment without corresponding investment in public infrastructure. To ensure comparability among the analyzed sites, the number of identified public facilities within each 500 m buffer zone was normalized by the area of the respective buffer zone. The resulting values are expressed as the number of public facilities per km2.
A score of 1 (<5 facilities/km2) represents very low provision of public facilities and indicates limited access to services within the immediate surroundings of the brownfield site. A score of 2 (5–20 facilities/km2) indicates low service capacity and a relatively limited presence of public institutions [67]. In such areas, brownfield regeneration could consider the introduction or expansion of public-service functions that are currently underrepresented. A score of 3 (20–40 facilities/km2) represents favorable provision, indicating a relatively developed network of public facilities within the analyzed area. A score of 4 (>40 facilities/km2) represents very favorable provision and indicates a high concentration of public facilities in the surrounding urban environment. Higher facility density and accessibility may contribute to reducing pressure on existing services, shortening travel distances, and improving access to essential public functions [65,66]. Brownfield sites located in areas characterized by high anthropogenic pressure should therefore be assessed with particular attention to the capacity and accessibility of existing public facilities.
Tourist Amenities
The presence of tourist amenities, including historical, cultural, sports and recreational, and religious facilities within a 500 m radius of the brownfield sites, represents an important indicator of the site’s potential for integration into the existing tourism and cultural network. The presence and diversity of such amenities may contribute to the attractiveness of the area, support local economic activity, and enhance the quality of the urban environment. Incorporating this criterion recognizes the potential for brownfield sites to be transformed into functional urban assets that complement existing tourism resources and spatial capacities. Tourist amenities considered in the analysis include cultural facilities (theaters and cinemas), historical monuments and public fountains, religious buildings, shopping centers, and sports and recreational facilities (sports fields, sports halls, and sports centers).
The criterion quantitatively evaluates the number of tourist amenities within a 500 m buffer zone around each brownfield site. This distance was adopted as an approximately 10-min walking range and therefore represents the immediate area within which tourist and cultural amenities can contribute to the site’s attractiveness and functional integration. A score of 1 (0–1 tourist amenities) was assigned to areas with absent or very limited tourist content, while a score of 2 (2–3 amenities) represents low provision. A score of 3 (4–5 amenities) indicates favorable tourist and cultural provision, whereas a score of 4 (>6 amenities) represents a high concentration of tourist amenities and a highly developed cultural, recreational, or religious environment.
During brownfield regeneration, particular attention should be given to the preservation and integration of elements contributing to the cultural identity and historical character of the city. The reuse of brownfield sites can contribute to the valorization of cultural and historical heritage by incorporating existing heritage assets into new tourism functions and supporting sustainable economic, social, and cultural development [68]. Gholitabar et al. [69] emphasize the importance of architectural heritage as a tourism resource, while its adaptive reuse can contribute to tourism-related economic activity and circular-economy principles [70].
3.3. Analytical Hierarchy Process (AHP)
The principal method applied in this study is multi-criteria decision analysis, specifically the Analytic Hierarchy Process (AHP), which was used to develop suitability maps for brownfield land-use repurposing. Developed by Thomas Saaty, the AHP establishes a hierarchical structure of criteria and enables the relative importance of individual criteria to be quantified through pairwise comparisons [71]. The relative importance of criteria is assessed using a fundamental scale from 1 to 9, where 1 denotes equal importance, 3 moderate importance, 5 strong importance, 7 very strong importance, and 9 extreme importance; intermediate values represent compromise judgments between adjacent levels [72,73]. Reciprocal values are assigned when the criterion in the column is considered more important than the criterion in the row. Based on these pairwise comparisons, normalized weighting coefficients are calculated to express the relative contribution of each criterion to the overall suitability assessment. This approach enables priority factors to be assigned greater weights while retaining lower-weighted criteria as contributing components of the decision-making framework [64].
The AHP framework decomposes a complex spatial decision problem into a hierarchy of criteria and sub-criteria that can be systematically evaluated and compared through mathematically derived weighting coefficients reflecting their relative importance [13]. The use of weighting coefficients enables a structured and transparent assessment of site suitability by integrating expert judgment with quantitative analysis. The integration of AHP with Geographic Information Systems (GIS) and remote sensing techniques has been widely applied in spatial suitability assessment and brownfield regeneration studies [11,12].
For the implementation of the AHP analysis and the determination of the criterion weights, an interdisciplinary expert panel comprising six academics and researchers from the University of Belgrade was established, including experts from the Faculty of Geography and the Faculty of Security Studies. The panel included specialists in geosciences, environmental protection, urban safety, and spatial risk management. All panel members held doctoral degrees and represented the following academic positions: one full professor, two associate professors, two assistant professors, and one research associate who was also a doctoral student.
The selection of panel members was based on their specific scientific expertise in the evaluation of geospatial data, urban environmental safety, risks to the population and the environment, and the application of GIS-based methods. Pairwise comparison judgments were collected individually from each expert using Saaty’s fundamental 1–9 scale [72,73]. The individual expert judgments were subsequently aggregated into a single pairwise comparison matrix using the geometric mean method. This approach enables the integration of individual assessments while preserving the reciprocal property of the pairwise comparison matrix and reducing the influence of extreme individual judgments on the resulting criterion weights [16,74].
A two-level weighting framework was applied to develop the GIS model for assessing the redevelopment suitability of brownfield sites. At the first level, weights were assigned to the three thematic groups to reflect their relative importance: 40% for environmental safety, 30% for infrastructure and spatial capacity, and 30% for social infrastructure and quality of life. These group-level weights were established with reference to strategic objectives of spatial planning and local urban regeneration policies [20]. At the second level, the AHP was applied to determine the relative weights of the individual sub-criteria within each thematic group (λmax, CI, and CR).
A study conducted in the Vilnius city region of Lithuania identified infrastructure investment, greenness measured as green-space area per inhabitant, real estate costs, vacant-site area per inhabitant, and industrial pollution as among the most important criteria for brownfield redevelopment [14]. The criteria applied by Burinskienė et al. [14] informed the selection of indicators for the present analysis, which were subsequently adapted to the specific spatial, environmental, and infrastructural conditions of Belgrade.
The assignment of weighting coefficients to different types of indicators using the AHP method becomes increasingly complex as the number and heterogeneity of criteria increase [15]. In the present study, 13 criteria were selected and organized into three thematic groups, with the criteria within each group evaluated separately. The first group comprises environmental safety criteria, the second focuses on infrastructure development and spatial capacity, and the third addresses quality of life and social well-being. The AHP pairwise comparison matrices for the three groups are presented in Table 5, Table 6 and Table 7. Following the methodological framework proposed by Marinelli et al. (2021) [17], the weighting coefficients were supplemented with 95% confidence intervals, expressed in percentage points (±pp), to quantify uncertainty and variability in expert judgments (Table 5, Table 6 and Table 7).
Table 5.
AHP model matrix for Group I.
Table 6.
AHP model matrix for Group II.
Table 7.
AHP model matrix for Group III.
The consistency of the pairwise comparison matrix and the weighting coefficients was confirmed mathematically by calculating the Consistency Index (CI) and the Consistency Ratio (CR). The CI is calculated using Equation (1):
where λmax is the maximum eigenvalue of the pairwise comparison matrix, and n is the number of criteria.
CI = (λmax − n)/(n − 1)
The Consistency Ratio (CR) is determined using Equation (2):
where CI is the Consistency Index obtained from Equation (1), and RI is the Random Index, whose value depends on the number of criteria (n) in the comparison matrix.
CR = CI/RI
An acceptable level of consistency is achieved if the CR value is equal to or less than 0.1 [75]. In all matrices, the consistency index remained below the 0.1 threshold, confirming high consistency and logical stability, which provides a reliable basis for application in GIS analyses [64,76].
The consistency measures for the three thematic groups were as follows: for Group I (GI), n = 3, λmax= 3, CI = 0.000, and CR = 0.000 (0%); for Group II (GII), n = 4, λmax= 4.015, CI = 0.005, and CR = 0.006 (0.6%); and for Group III (GIII), n = 6, λmax = 6.341, CI = 0.068, and CR = 0.055 (5.5%) [17].
Due to varying units of measurement and time periods across the 13 investigated criteria, the data were standardized and reclassified into 4 classes (1—very unfavorable, 2—unfavorable, 3—favorable, 4—very favorable). All vector layers were converted into raster formats for use in the Raster Calculator within QGIS, where individual group layers were calculated before being overlaid to generate the final suitability index (FSI) map. The formulas for each group model are given in Equations (3)–(6).
where
GI = (c_LS ⋅ LS) + (c_AQ ⋅ AQ) + (c_DW ⋅ DW)
GII = (c_LU ⋅ LU) + (c_AP ⋅ AP) + (c_IRC ⋅ IRC) + (c_DMR ⋅ DMR)
GIII = (c_GS ⋅ GS) + (c_DGS ⋅ DGS) + (c_TPF ⋅ TPF) + (c_DPF ⋅ DPF) + (c_NPF ⋅ NPF) + (c_TA ⋅ TA)
FSI = 0.4 ⋅ GI + 0.3 ⋅ GII + 0.3 ⋅ GIII
- GI = Group I suitability score (Environmental Safety);
- GII = Group II suitability score (Infrastructure and Spatial Capacity);
- GIII = Group III suitability score (Social Infrastructure and Living Standards);
- FSI = Final Suitability Index;
- LS = Landslide Susceptibility; AQ = Air Quality Index; DW = Distance to Watercourses;
- LU = Land Use; AP = Anthropogenic Pressure (Population Density); IRC = Internal Road Capacity; DMR = Distance to Major Roads;
- GS = Green Space per capita; DGS = Distance to Green Spaces; TPF = Type of Public Facilities; DPF = Distance to Public Facilities; NPF = Number of Public Facilities; TA = Tourist Attractions.
The Sava and Danube rivers are included within the 500 m buffer zones and are retained in the cartographic representation; however, water surfaces were excluded from the mathematical analysis. In the raster layers, river areas were assigned a value of 0 as an exclusion value and therefore did not contribute to the calculation of the individual criteria. This approach preserves the spatial visibility of the rivers in the maps while preventing water surfaces from influencing the suitability assessment, as the criteria applied in this study are intended to evaluate land-based conditions relevant to brownfield regeneration.
Sensitivity Analysis
To assess the robustness of the model and determine whether the resulting site priorities remain stable under alternative plausible weighting schemes, a sensitivity analysis was conducted by testing a set of alternative weighting scenarios [77]. In addition to the baseline AHP scenario (S0: Group I = 40%, Group II = 30%, and Group III = 30%), four alternative scenarios were defined:
- S1—Equal weighting: Group I = 33.33%, Group II = 33.33%, and Group III = 33.33%;
- S2—Dominant environmental weighting: Group I = 50%, Group II = 25%, and Group III = 25%;
- S3—Dominant infrastructure weighting: Group I = 30%, Group II = 40%, and Group III = 30%;
- S4—Dominant social weighting: Group I = 30%, Group II = 30%, and Group III = 40%.
For each scenario, a GIS-based analysis was performed using the Raster Calculator, while the mean suitability values for the 23 analyzed sites were extracted using the Zonal Statistics function. The resulting sensitivity analysis (Figure 3) indicates a high degree of stability in the baseline AHP model (S0), particularly under the moderate changes in group weights represented by scenarios S1 and S2. The results for S0, S1, and S2 show a high degree of overlap across the 23 analyzed sites, with the highest-ranked sites (P3, U1, U2, and U3) maintaining consistently high suitability values and leading positions across these scenarios.
Figure 3.
Sensitivity analysis of the brownfield redevelopment suitability index under the baseline scenario (S0) and alternative criterion-weighting scenarios (S1–S4).
In contrast, scenarios S3 and S4 produce more pronounced changes in the mean suitability values of specific sites, particularly A1, A5, and A6. These shifts reflect the sensitivity of individual sites to increased weighting of infrastructure-related or social criteria, respectively, and demonstrate the capacity of the model to capture site-specific strengths associated with these dimensions.
Overall, the sensitivity analysis demonstrates that the baseline weighting scheme provides a relatively stable basis for assessing brownfield redevelopment suitability, while alternative weighting scenarios reveal how changes in thematic priorities can alter the relative performance of individual sites. This confirms the usefulness of the model as a flexible decision-support framework for exploring alternative planning priorities in brownfield redevelopment.
4. Results
The results of the spatial modeling conducted using GIS and AHP are presented in this chapter. A total of 23 brownfield sites were analyzed, with a 500 m buffer zone established around the boundaries of each site. Based on their activation status, the sites were classified into three groups: activated (A1–A7), partially activated (P1–P3), and unactivated (U1–U13) (Figure 4). The 500 m buffer zone was used to characterize the local spatial context and assess conditions related to environmental safety, infrastructure and service provision, and quality of life in the immediate surroundings of each brownfield site. The spatial distribution of the investigated polygons is presented in Figure 4, while their codes, names, and activation statuses are provided in Table 8. The results include an individual assessment of the 13 criteria, grouped according to thematic similarity into three categories (GI, GII, and GIII), followed by cartographic, tabular, and graphical presentation of the final AHP results obtained through the weighted overlay of the three criterion groups.
Figure 4.
Spatial distribution and activation status of the evaluated brownfield sites in Belgrade.
Table 8.
Inventory and activation status of the selected brownfield sites, unactivated.
4.1. Spatial Evaluation and Mapping of Individual Criteria
4.1.1. Group I
The northwestern part of the Belgrade Master Plan area, encompassing Zemun and New Belgrade and including polygons A1, P1, P2, and U1–U3, is characterized by predominantly lowland and stable terrain without active landslide processes. Consequently, this area received the highest score (4) in terms of terrain suitability with respect to landslide susceptibility. In contrast, areas along the right banks of the Sava and Danube rivers, including Zvezdara, Karaburma, Višnjica, Vinča, and Mirijevo (polygons U4–U9 and A3–A5), are characterized by active, potentially active, or fossil landslide processes and therefore received lower terrain-stability scores. Potentially unstable terrain is also present in parts of Rakovica (U11–U13) and Železnik (U10), where score 2 predominates, indicating unfavorable conditions for redevelopment from the perspective of landslide susceptibility.
Brownfield regeneration in areas affected by landslide processes remains feasible but may require additional geotechnical investigations, stabilization measures, and associated financial investment. The analysis of activated brownfield sites further indicates that terrain stability may not have been sufficiently considered in previous redevelopment processes, as sites A2, A3, A4, and A5 are located directly within areas characterized by active or potentially active landslide processes (Figure 5a).
Figure 5.
Spatial suitability assessment of environmental safety indicators—physical hazards: (a) Landslide hazard suitability scores; (b) Air quality monitoring station coverage (%); (c) Distance to rivers (m).
According to the annual air-quality index, the lowest air-quality scores were generally observed in areas located closer to primary thoroughfares and characterized by higher anthropogenic pressure or a lower proportion of green space, particularly in New Belgrade and Rakovica. The highest air-quality score (4) was recorded only for polygons A2 and U7. The spatial distribution of the results also indicates comparatively better air-quality conditions along the major river corridors, which may be associated with greater openness of the surrounding urban space and potentially more favorable ventilation conditions. Brownfield sites characterized by satisfactory air-quality conditions may be considered for residential or commercial uses, whereas sites with lower air-quality scores should incorporate measures to strengthen green infrastructure, including the establishment of vegetated buffers and green belts (Figure 5b).
A narrow zone extending less than 100 m from the banks of the Sava, Danube, and Topčider rivers in Rakovica was assigned the lowest suitability score (1), reflecting its location within an alluvial area with increased flood susceptibility. The highest suitability score (4) was assigned to distances between 100 and 500 m, representing a balance between greater separation from potentially flood-prone areas. Polygons U2–U7, U11–U13, and P3 are located directly along major river corridors, including the Belgrade Waterfront and Ada Huja areas. Their redevelopment therefore requires particular consideration of flood risk and appropriate hydrotechnical and flood-protection measures (Figure 5c).
4.1.2. Group II
Land use within the 500 m buffer surrounding each brownfield site provides an important indication of the spatial structure of the immediate urban context, including the distribution of built-up areas, green spaces, and water bodies. This spatial context was used to assess which functions may be most appropriate for future regeneration and whether additional development should prioritize residential and commercial uses or the strengthening of green infrastructure. All brownfield sites received a score of 4 as previously developed areas with existing structures and/or land that is currently underutilized or without an active function; however, the surrounding buffer zones were evaluated according to their prevailing land-use characteristics. The resulting scores ranged from 1 to 4, enabling site-specific assessment of the relationship between existing land use and the potential for accommodating additional functions.
For the activated sites A1, A3, A4, and A6, the surrounding land use was not sufficiently considered during previous redevelopment processes. Their current 500 m buffer zones are predominantly classified as unfavorable (score 2) or favorable (score 3), indicating a relatively high proportion of built-up areas and a comparatively limited availability of green and open spaces, in combination with elevated anthropogenic pressure (Figure 6a). These findings suggest that future regeneration of brownfield sites within similarly developed urban contexts should give greater consideration to the existing land-use structure and the need to strengthen green infrastructure and other public functions.
Figure 6.
Land use structure and anthropogenic pressure within the 500 m buffer zone: (a) Land use classification; (b) Anthropogenic pressure (inhabitants/km2).
Population density, expressed as inhabitants/km2, indicates that population-related spatial capacity was not sufficiently considered during the redevelopment of some activated brownfield sites, particularly where new residential development substantially increased the intensity of land use. Polygons A3 and A4, both of which have been repurposed for residential uses, currently exhibit population densities exceeding 8000 inhabitants/km2 and therefore fall within the highest anthropopressure category (score 1) (Figure 6b). Polygon A5 also demonstrates unfavorable conditions according to the adopted population-density classification.
The partially activated polygons P1–P3 currently exhibit population densities within the most favorable category. However, these sites encompass extensive areas where redevelopment remains incomplete, and the current population does not yet reflect the full development potential or planned intensity of land use. In addition, residential use was not the predominant function of these areas prior to redevelopment. Consequently, continued implementation of planned residential development, particularly within the Belgrade Waterfront area, is expected to substantially increase the number of residents and, consequently, population-related anthropogenic pressure. These findings indicate that population density and the associated spatial capacity should be explicitly considered when planning the regeneration of unactivated brownfield sites. Where existing population-related pressure is already high, alternative land uses should be considered, particularly those that can strengthen green infrastructure, public amenities, and other functions that contribute to the quality of life of the existing local population (Figure 6b).
The highest suitability scores for internal road-network connectivity were recorded for the already activated sites A3–A5, where intersection density exceeds 200 intersections/km2. In contrast, site A1 exhibits an unfavorable level of internal network connectivity, with 100–150 intersections/km2. Polygons U1 and U9 demonstrate very favorable conditions in terms of the density of internal road intersections. Particular attention is required when introducing additional spatial functions and associated traffic demand in polygons U10–U13, where intersection density is below 100 intersections/km2 and therefore classified as very unfavorable. Higher intersection density indicates greater street-network connectivity and provides a greater number of alternative routes for local traffic circulation. The results also indicate a spatial differentiation between the central and peripheral parts of Belgrade, with higher levels of internal street-network connectivity generally observed in the more densely developed urban areas (Figure 7a).
Figure 7.
Transport network accessibility and capacity indicators: (a) Internal road network capacity (intersections/m2); (b) Distance to major roads (m).
Proximity to primary thoroughfares represents an additional factor influencing the accessibility of brownfield sites to the higher-order transport network. Sites located at shorter distances from primary thoroughfares have greater potential for direct connection to the main transport network and reduced reliance on local streets. Polygons P1–P3 and U1–U3 demonstrate highly favorable accessibility to the primary transport network, with the largest portions of their respective areas located within 500 m of a primary thoroughfare and therefore assigned the highest suitability score (4). In contrast, polygons A2, A5, U7, U9, and U11 exhibit very unfavorable accessibility, with the largest portions of their areas located more than 1500 m from a primary thoroughfare (Figure 7b).
4.1.3. Group III
Activated brownfield sites A3, A5, A6, and A7 exhibit very unfavorable green-space provision, with less than 9 m2 of green space per inhabitant, indicating that the provision of green areas during previous redevelopment was insufficient in relation to the existing population. An unfavorable score (2) was also recorded for A1, where green-space provision ranges from 9 to 16 m2 per inhabitant. Low scores (1 and 2) were additionally recorded for unactivated sites U4, U5, U8, U12, and U13, as well as partially activated site P1. These findings indicate that future regeneration of these sites should incorporate measures to strengthen green infrastructure and prioritize land uses that provide a substantial proportion of green and open space. Green infrastructure contributes to the quality of the urban environment and residents’ quality of life while also providing habitats and ecological functions within urban ecosystems (Figure 8a).
Figure 8.
Green infrastructure indicators—coverage and accessibility: (a) green space provision per capita (m2/inhabitant); (b) proximity to green areas (m).
Figure 8b presents the spatial distribution of accessibility to green areas, including parks and forests. The most favorable accessibility occurs at distances of up to 300 m (score 4), while distances of up to 500 m are classified as favorable (score 3), corresponding approximately to convenient pedestrian access. Particularly favorable conditions are observed in areas surrounding Ada Ciganlija, along the Sava River, and within polygons A3 and A4. Following the redevelopment of A1 and A5, accessibility to functional green areas became highly unfavorable, with distances exceeding 500 m. Low accessibility is also observed at sites U6, U9, and U10. The comparative analysis of Figure 8a,b reveals an important distinction between the quantity of green space available per inhabitant and its spatial accessibility. In particular, activated sites A3, A5, A6, and A7 exhibit insufficient green-space provision relative to their population, despite the presence of existing green areas within potentially acceptable walking distances. This indicates that proximity to green spaces alone does not necessarily compensate for insufficient green-space provision within densely populated areas.
Brownfield sites located in the central parts of Belgrade and in New Belgrade generally demonstrate good accessibility to public facilities, with many facilities located within a pedestrian distance of 500 m, whereas sites in peripheral areas are frequently located more than 1500 m from such facilities (Figure 9a). The comparative analysis of Figure 9a–c indicates that, following the redevelopment of brownfield sites A3, A5, and A6, the provision and diversity of public facilities, including healthcare, social, and educational functions, remain limited in relation to the intensity of residential and commercial development. These polygons contain either no public-service functions or only one type of public service, with up to five facilities/km2, corresponding to a very unfavorable classification.
Figure 9.
Social infrastructure and tourism amenity indicators: (a) Proximity to social infrastructure (m); (b) Functional diversity of public facilities; (c) Public facility density (facilities/m2); (d) Number of tourist facilities.
Polygons P3 and U6 demonstrate highly favorable conditions with respect to the distance, diversity, and number of public facilities. However, their central locations and the concentration of facilities within these areas mean that their services extend beyond the boundaries of the analyzed 500 m buffer zones and serve populations from surrounding neighborhoods. Consequently, further brownfield redevelopment in these areas without corresponding investment in social infrastructure could increase reliance on existing facilities and the surrounding urban network. Public-facility provision is comparatively limited in peripheral areas, particularly A4, P1, P2, and U10–U13. Future regeneration of these sites should therefore consider opportunities to strengthen educational, healthcare, and social infrastructure alongside other proposed land uses.
Tourism-related amenities, including theaters, cinemas, museums, shopping centers, and sports facilities, are concentrated predominantly in the central urban area, while their availability is considerably lower in peripheral parts of Belgrade. The activated brownfield sites A1–A6 exhibit limited access to tourism-related amenities within the analyzed walking-distance range, with no more than three facilities identified in their respective areas. Similarly, the partially activated sites P1 and P2 received unfavorable scores of 1 and 2, respectively. These findings indicate that tourism-related functions and amenities have been insufficiently integrated into the redevelopment of several brownfield sites. For the regeneration of remaining unactivated sites, the existing distribution of tourism-related amenities should therefore be considered when determining appropriate future uses, with opportunities for tourism, cultural, recreational, and related functions assessed as part of the broader regeneration strategy (Figure 9d).
4.2. AHP Spatial Synthesis
The first AHP model (Figure 10a) indicates that brownfield sites in New Belgrade and along the right bank of the Sava River exhibit the highest suitability for repurposing from an environmental safety perspective, reflecting more favorable conditions with respect to terrain stability and air quality and, consequently, a lower need for stabilization and pollution-mitigation measures. In contrast, sites located in the eastern, southern, and southwestern parts of the study area exhibit lower suitability, primarily due to the prevalence of landslide-prone terrain. The second AHP model (Figure 10b) highlights areas where infrastructure capacity and existing spatial conditions may constrain further development under elevated anthropogenic pressure, with scores of 1 and 2 predominating across several investigated polygons.
Figure 10.
AHP multi-criteria suitability models and the composite Final Suitability Index: (a) Group I—Environmental Safety; (b) Group II—Infrastructure and Spatial Capacity; (c) Group III—Social Infrastructure and Living Standards; (d) Final Suitability Index (FSI).
The results of the third AHP model (Figure 10c) reflect the distribution of social infrastructure and living-standard conditions. Peripheral areas generally exhibit lower suitability, primarily due to the limited availability of public facilities, tourism-related amenities, and green spaces, whereas sites located closer to the city center generally demonstrate more favorable conditions. However, the concentration of green spaces and social amenities in central areas may also indicate a broader service function extending beyond the analyzed 500 m buffer zones. Consequently, additional brownfield redevelopment without corresponding investment in social and green infrastructure may increase pressure on existing facilities and surrounding neighborhoods.
The final suitability map (Figure 10d) was generated by overlaying the three thematic AHP models according to Equation (6), using weighting shares of 40% for Group I, 30% for Group II, and 30% for Group III. Low suitability scores of 1 and 2 predominate across the analyzed area, whereas higher suitability scores of 3 and 4 are concentrated primarily in polygons P3 and U6. Although P3 has undergone partial redevelopment, the population data used in the analysis correspond to the 2022 census and therefore do not fully reflect the subsequent residential development within the polygon. The area was not predominantly residential prior to redevelopment, whereas the ongoing construction of large-scale residential development is expected to substantially increase population density. This may place additional pressure on existing spatial and infrastructural capacity, particularly with regard to flood vulnerability, green-space provision, transport infrastructure, and social amenities. The results therefore indicate the need for coordinated infrastructure provision and careful consideration of population capacity when further redevelopment is planned in this area.
The analysis of the activated brownfield polygons indicates that the criteria considered in this study were not sufficiently reflected in previous redevelopment outcomes, as the current conditions of A1–A7 are predominantly characterized by low suitability scores. Sites located in the eastern and southern parts of the study area are particularly affected by landslide susceptibility, which represents a critical environmental safety constraint for further spatial development. The partially activated sites P1 and P2 are also predominantly characterized by suitability scores of 1 and 2, indicating significant environmental, infrastructural, and socio-spatial constraints. For the unactivated brownfield sites, the characteristics of the surrounding 500 m buffer zones should be examined in greater detail to determine the most appropriate future land uses. Based on the identified spatial conditions, regeneration strategies should prioritize ecological and social functions, including green infrastructure and public amenities, where these can contribute to improving residents’ quality of life and the urban environment. The distribution of the total analyzed area according to suitability score is presented in Table 9 and Figure 11. The results of the multi-criteria AHP analysis are synthesized in Table 10.
Table 9.
Proportion of total area by suitability score classes (%).
Figure 11.
Proportion of total area by suitability score class (%).
Table 10.
Synthesis of the main findings.
5. Discussion
Existing studies of brownfield sites in Belgrade provide valuable insights into their characteristics, impacts, and transformation potential; however, they provide limited methodological guidance for systematically assessing their redevelopment suitability and informing decisions on their future activation. The approach proposed in this study does not seek to challenge or replace existing planning documents or scientific findings. Rather, it complements them by providing an integrated spatial assessment framework that addresses environmental safety, infrastructural capacity, and social needs, thereby providing an additional evidence base for brownfield planning and redevelopment.
The implications for the scientific community lie in extending the methodological basis for brownfield assessment through the integration of GIS-based spatial analysis and AHP-based multi-criteria evaluation. At the practical level, the proposed framework offers potential for knowledge transfer to planning practitioners and decision-makers and can support the incorporation of spatially explicit, multi-criteria assessment into the preparation and revision of planning documents. Its application may therefore contribute to more transparent, evidence-based, and context-sensitive decisions regarding the future activation and redevelopment of brownfield sites.
Brownfield sites represent a potential source of environmental risk due to residual pollutants that may remain in soils, buildings, warehouses, and storage facilities previously used for industrial activities or the storage of hazardous materials [4]. According to Stojkov [6], the presence of such sites can generate significant economic, ecological, environmental, and social impacts, including the devaluation of land in the surrounding urban area, loss of potential economic benefits associated with strategically located urban land, deterioration of social conditions, potential public health risks, environmental degradation, adverse effects on the psychological well-being of nearby residents, and a negative impact on urban identity.
Urbanization is a global process, and cities undergoing structural and socio-economic transformation, such as Belgrade, increasingly require effective mechanisms for redefining and adapting spatial functions. However, the analysis of brownfield activation within the territory covered by the Master Urban Plan of Belgrade indicates several shortcomings in the current redevelopment approach. In the absence of a clearly defined and integrated framework for brownfield regeneration, these sites have predominantly been converted into residential complexes and commercial facilities, with comparatively limited consideration of green infrastructure, tourism-related functions, and other public uses. The analysis also indicates that brownfield regeneration areas remain subject to multiple environmental pressures, highlighting the need to integrate urban safety, public health, and environmental protection into redevelopment planning. In particular, greater consideration should be given to the provision and integration of green infrastructure in future brownfield regeneration processes in order to better respond to the needs of the local population and support sustainable urban development.
Economic growth and urban development should be grounded in scientific and professional principles that prioritize the quality of life of local communities while mitigating anthropogenic pressure. At the same time, the strategic potential of brownfield regeneration should be recognized and incorporated into future development strategies. Numerous former industrial areas offer opportunities for tourism as a means of supporting spatial restructuring and local economic development [10], while industrial heritage within urban areas can provide a valuable basis for the development of tourism. Such heritage may comprise individual buildings, complexes of structures, or interconnected sites that can form extended cultural and industrial heritage routes [9]. Accordingly, brownfield regeneration strategies may include the adaptive reuse of former industrial sites for hospitality, cultural, and tourism-related functions. An example in Belgrade is Beton Hala, where part of a former industrial brownfield area was transformed into a commercial and hospitality destination [1].
The structural transformation of Belgrade from an industrial city toward a service-oriented urban economy has created new opportunities for spatial and economic development. The decline of manufacturing activities has been accompanied by the expansion of the service sector [7], while investor interest has increasingly focused on technology parks, technology transfer centers, and the redevelopment of former industrial complexes [8]. This transformation highlights the potential for brownfield regeneration to support new economic functions while contributing to the broader restructuring of the urban environment.
Numerous spatial parameters and criteria are difficult to quantify objectively, while aspects such as urban identity, visual character, and landscape vistas inherently involve a degree of subjectivity and therefore require interpretative assessment. Major urban interventions can substantially influence the historical identity and visual structure of the city. For example, the Belgrade Waterfront development has transformed the Sava riverfront and altered the spatial relationship between the river and the historic city center, including views toward the Kalemegdan Fortress from the Sava River. However, the interpretation of such changes remains context-dependent, as increased urban density may alternatively be regarded as a contemporary model of urban development that does not necessarily compromise the broader visual structure of the city. In New Belgrade, the transformation of former brownfield areas through high-rise development has significantly modified the existing urban landscape; nevertheless, these interventions can also be interpreted as consistent with the area’s long-term development trajectory and established urban character. By contrast, the transformation of a former railway corridor into the Linear Park represents an example of brownfield regeneration that introduced a continuous green infrastructure corridor into the urban fabric and substantially altered the former land-use function of the site.
A further, less visible infrastructural challenge concerns the connection of newly developed areas to the existing municipal wastewater system. Where new wastewater trunk collectors are not constructed, existing network capacity is not expanded, or the sewer infrastructure is not adequately upgraded, increased wastewater and stormwater loads may result in network surcharging, particularly during intense rainfall events. This vulnerability is further exacerbated in areas where stormwater and sanitary wastewater are conveyed through combined sewer systems and where existing utility infrastructure operates close to or beyond its design capacity.
An important phase of brownfield redevelopment involves the demolition and removal of existing structures. From the perspective of impacts on local communities, demolition activities may temporarily reduce environmental quality and quality of life through increased noise, dust generation, and associated disturbance. Additional public health and environmental risks may arise when demolition involves structures containing hazardous materials. The demolition of the former Hotel Jugoslavija illustrates the importance of adequately addressing such risks, particularly those associated with asbestos-containing materials, and highlights the need to incorporate public health and community considerations into the planning and implementation of brownfield regeneration.
Effective environmental protection and sustainable brownfield regeneration within the territory covered by the Master Urban Plan of Belgrade require a comprehensive planning framework that considers a broader range of spatial and community needs. Such a framework should incorporate the provision and connectivity of green infrastructure, tourism-related functions, sports and recreational facilities, and cultural and educational uses alongside residential and commercial development. An excessive concentration of high-density residential and commercial functions, without adequate consideration of supporting infrastructure and public amenities, may increase pressure on existing utility networks, transport infrastructure, environmental resources, and the overall functionality of the urban system. Therefore, brownfield regeneration should be guided by an integrated decision-making approach that balances development potential with environmental protection, urban safety, infrastructure capacity, and the needs of local communities.
Research Limitations
The principal limitation of the study concerns the spatial coverage and temporal completeness of the air-quality monitoring network operated by the Serbian Environmental Protection Agency, which comprised 36 monitoring stations in 2024. The limited spatial distribution of monitoring stations, together with gaps and irregularities in some data series, constrains the spatial and temporal resolution of air-quality assessment. Accordingly, the present study assessed air quality using available PM2.5 data from the nearest monitoring stations with sufficiently accessible time series. Although this approach enabled the inclusion of air quality as a criterion within the AHP framework, a denser monitoring network and more complete time-series data would enable a more spatially detailed assessment. Future studies could further improve the analysis by incorporating seasonal variability, more frequent observations, and additional air-quality parameters.
The study incorporated data from official urban planning documentation, European spatial databases, and relevant scientific literature; nevertheless, several methodological limitations should be acknowledged. Spatial distances to watercourses, primary thoroughfares, and green areas were calculated as straight-line Euclidean distances and therefore did not account for terrain elevation, slope, or topographic barriers. This simplification was adopted to maintain a consistent and manageable analytical framework, particularly for criteria with relatively lower weights in the brownfield suitability assessment. Nevertheless, incorporating topographic characteristics could provide a more detailed representation of spatial accessibility and environmental constraints in future studies. The specific morphological characteristics of Belgrade, including the extensive alluvial plains along the major rivers, were considered when interpreting the results.
A fixed 500 m buffer around the boundaries of the brownfield sites was used to standardize the spatial extent of the analysis. However, the application of a uniform buffer represents a simplification of actual pedestrian accessibility and the spatial reach of public facilities and green infrastructure. It does not account for site-specific topographic characteristics, street-network morphology, or variations in population movement associated with differences in site size and land use. Consequently, the fixed-buffer approach provides a consistent basis for comparative analysis but may not fully capture the functional accessibility and spatial influence of individual brownfield sites.
The Urban Atlas datasets used in the analysis have a temporal lag relative to the current state of the urban environment and were therefore manually verified using Google Satellite imagery. This verification was feasible given the manageable number of investigated sites (n = 23) and helped reduce potential temporal discrepancies between the spatial dataset and the observed land-use conditions. However, future studies would benefit from the availability of more frequently updated spatial datasets that better capture ongoing urban transformations. Although the minimum mapping unit of 0.25 ha is appropriate for regional-scale urban land-use analysis, small and spatially fragmented areas with heterogeneous land uses may remain undetected. This limitation was partially addressed through visual verification using satellite imagery. Future research could additionally incorporate indices such as the Normalized Difference Built-up Index (NDBI) to improve the identification and spatial characterization of built-up areas.
Due to data constraints, the assessment of traffic-related conditions was limited to proximity to primary thoroughfares and did not incorporate direct measurements of traffic noise, vehicular emissions, or actual traffic volumes at major roads and intersections. Similarly, the assessment of tourism-related functions was constrained by the limited availability of data on annual visitor numbers, which could otherwise contribute to a more refined evaluation of the relative tourism potential of the investigated sites. A further limitation of the study concerns the temporal inconsistency of some spatial datasets due to the unavailability of fully updated data for 2026.
Expert subjectivity represents an inherent component of the AHP methodology. In the present study, this limitation was addressed through the involvement of a multidisciplinary team of experts in environmental protection and urban safety with extensive knowledge of the study area. The pairwise comparisons and criterion evaluations were informed by relevant scientific literature, available spatial and planning data, and empirical field surveys [78,79]. The consistency of the expert judgments was further evaluated using the consistency ratio, thereby providing an additional measure of the reliability of the AHP weighting process.
6. Conclusions
This study demonstrates the applicability of an integrated AHP–GIS framework for the systematic assessment and prioritization of brownfield sites in Belgrade in support of sustainable regeneration. The main findings and contributions are as follows:
- The multi-criteria assessment, incorporating 13 weighted criteria across environmental, infrastructural, and geo-spatial dimensions, demonstrates substantial heterogeneity in the regeneration potential of brownfield sites in Belgrade. Sites located in the municipalities of Savski Venac and Rakovica exhibited the greatest potential for integration into green infrastructure.
- The consistency ratio (CR) for all pairwise comparison matrices remained below the threshold of 0.10, indicating an acceptable level of consistency in the AHP weighting process. Environmental risk criteria, including landslide susceptibility, air quality, and distance to watercourses, received the highest combined group weight, highlighting the importance of environmental considerations in brownfield regeneration planning.
- The GIS-based spatial analysis enabled the identification of three brownfield typologies: (a) sites suitable for ecological restoration and green corridor development; (b) sites suitable for mixed-use urban regeneration incorporating public facilities; and (c) sites requiring priority remediation before redevelopment.
- The proposed methodology provides a transferable framework for assessing brownfield regeneration potential in other post-industrial urban areas, particularly in Southeast Europe, provided that the criteria, weights, and geospatial datasets are appropriately adapted to local conditions.
From a practical perspective, the findings provide evidence-based support for urban planning and decision-making concerning the future transformation of brownfield sites, particularly through the integration of brownfield regeneration with green infrastructure strategies. Future research should incorporate longitudinal monitoring of regenerated sites using Sentinel-2 time-series data, stakeholder preference elicitation through participatory AHP approaches, and life-cycle cost–benefit analysis to strengthen the economic dimension of the assessment framework.
The contribution of this study lies in establishing a methodological framework for applying an integrated GIS-AHP approach to brownfield redevelopment planning and for incorporating lessons from previous redevelopment outcomes into future planning processes. The framework provides a basis for identifying spatial deficiencies associated with previously activated brownfield sites and for considering the needs of local communities when planning the transformation of remaining inactive sites.
The main limitations of the study relate to the challenges of translating a methodological framework into established planning and decision-making practice. The implementation of an alternative approach may be constrained by existing institutional procedures, planning practices, and established patterns of brownfield redevelopment. This challenge is particularly relevant in the context of Belgrade, where a substantial proportion of brownfield sites have already been transformed predominantly into residential and commercial uses. Integrating multi-criteria spatial assessment into future planning processes would therefore require not only methodological capacity but also its incorporation into established planning and decision-support procedures.
Future research should focus on applying and validating the proposed methodology at specific brownfield sites and examining its performance under real-world planning conditions. Further research could also investigate the integration of more detailed accessibility measures, site-specific spatial characteristics, and additional environmental and socio-economic indicators, thereby refining the model and strengthening its applicability to future brownfield redevelopment planning.
Author Contributions
Conceptualization, I.S. (Ivan Samardžić), I.S. (Irena Simić), D.J.P., D.K., M.T. and I.R.; methodology, I.S. (Ivan Samardžić), I.S. (Irena Simić), D.J.P., D.K., M.T. and I.R.; software, I.S. (Ivan Samardžić) and I.S. (Irena Simić); validation, I.S. (Ivan Samardžić), I.S. (Irena Simić), D.J.P., D.K., M.T. and I.R.; formal analysis, I.S. (Ivan Samardžić), I.S. (Irena Simić) and I.R.; investigation, I.S. (Ivan Samardžić), I.S. (Irena Simić), D.J.P., D.K., M.T. and I.R.; resources, I.S. (Ivan Samardžić), I.S. (Irena Simić), D.K. and M.T.; data curation, I.S. (Ivan Samardžić), I.S. (Irena Simić) and D.J.P.; writing—original draft preparation, I.S. (Ivan Samardžić), I.S. (Irena Simić), D.J.P., D.K., M.T. and I.R.; writing—review and editing, I.S. (Ivan Samardžić), I.S. (Irena Simić), D.J.P., D.K., M.T. and I.R.; visualization, I.S. (Irena Simić); supervision, I.S. (Ivan Samardžić), D.J.P. and I.R.; project administration, I.S. (Ivan Samardžić), I.S. (Irena Simić), D.J.P. and I.R. All authors have read and agreed to the published version of the manuscript.
Funding
The study was supported by Ministry of Science, Technological Development and Innovation of the Republic of Serbia (Contract number 451-03-33/2026-03/200091).
Data Availability Statement
The original contributions presented in this study are included in the article. Further inquiries can be directed to the corresponding author(s).
Conflicts of Interest
The authors declare no conflict of interest.
References
- Samardžić, I. Municipal Hygiene of Public Spaces of the Urban Settlement Belgrade (Monograph); University of Belgrade, Faculty of Geography: Belgrade, Serbia, 2024. [Google Scholar]
- Blagajac, I. The conflict between nature preservation and tourism in nature monument “Suma Kosutnjak”. In Bulletin of the Serbian Geographical Society; Serbian Geographical Society: Belgrade, Serbia, 2023; Volume 103, pp. 447–474. [Google Scholar] [CrossRef] [Scilit]
- Filipović, D.; Samardžić, I. Technogenic Sources of Pollution—Ecological Problems of Brownfield Sites in the Territory of Municipality Zvezdara (Belgrade). Ecologica 2016, 23, 804–808. [Google Scholar]
- Filipović, D.; Šećerov, V. The Significance of Ecological Instruments in the Analysis and Planning of Brownfield Sites. In Proceedings of the 4th Serbian Congress of Geographers with International Participation; University of Belgrade, Faculty of Geography: Belgrade, Serbia, 2015; pp. 407–412. [Google Scholar]
- Perić, A. The Role of Urban Planning in the Process of Brownfield Site Regeneration. Ph.D. Thesis, University of Belgrade, Belgrade, Serbia, 2013. [Google Scholar]
- Stojkov, B. Towards the Recycling of Building Land in Serbia. Bull. Serbian Geogr. Soc. 2007, 87, 175–185. [Google Scholar] [CrossRef] [Scilit]
- Rogerson, J.R. Quality of Life and City Competitiveness. Urban Stud. 1999, 36, 969–985. [Google Scholar] [CrossRef] [Scilit]
- Hajduk, S. The Concept of a Smart City in Urban Management. Bus. Manag. Educ. 2016, 14, 34–49. [Google Scholar] [CrossRef] [Scilit]
- Trettin, L.; Neumann, U.; Zakrzewski, G. Essen and the Ruhr Area—The European Capital of Cultural 2010: Development of Tourism and the Role of SMEs; ERSA Conference Papers ersa10p357; European Regional Science Association: Milan, Italy, 2011. [Google Scholar]
- Edwards, J.; Llurdes, J. Mines and quarries: Industrial heritage tourism. Ann. Tour. Res. 1996, 23, 341–363. [Google Scholar]
- Widiastuti, M.; Widodo, S.; Tumpu, M.; Hatta, M.; Alimuddin, I. Landslide Hazard Index Assessment Using GIS and AHP in Tapalang, Mamuju, West Sulawesi Province, Indonesia. Eng. Technol. Appl. Sci. Res. 2025, 15, 24857–24863. [Google Scholar] [CrossRef] [Scilit]
- Liu, X.; Shao, S.; Shao, S. Landslide susceptibility zonation using the analytical hierarchy process (AHP) in the Great Xi’an Region, China. Sci. Rep. 2024, 14, 2941. [Google Scholar] [CrossRef] [Scilit] [PubMed]
- Tavakoli, M.; Motlagh, Z.K.; Dąbrowska, D.; Youssef, Y.M.; Đurin, B.; Saqr, A.M. Harnessing AHP and Fuzzy Scenarios for Resilient Flood Management in Arid Environments: Challenges and Pathways Toward Sustainability. Water 2025, 17, 1276. [Google Scholar] [CrossRef] [Scilit]
- Burinskienė, M.; Bielinskas, V.; Podviezko, A.; Gurskienė, V.; Maliene, V. Evaluating the Significance of Criteria Contributing to Decision-Making on Brownfield Land Redevelopment Strategies in Urban Areas. Sustainability 2017, 9, 759. [Google Scholar] [CrossRef] [Scilit]
- Kurek, K.A.; Heijman, W.; van Ophem, J.; Gędek, S.; Strojny, J. Measuring local competitiveness: Comparing and integrating two methods PCA and AHP. Qual. Quant. 2022, 56, 1371–1389. [Google Scholar] [CrossRef] [Scilit]
- Salo, A.; Hämäläinen, R. Multicriteria Decision Analysis in Group Decision Processes; Springer: Dordrecht, The Netherland, 2010; pp. 269–283. [Google Scholar] [CrossRef] [Scilit]
- Marinelli, S.; Butturi, M.A.; Rimini, B.; Gamberini, R.; Sellitto, M.A. Estimating the Circularity Performance of an Emerging Industrial Symbiosis Network: The Case of Recycled Plastic Fibers in Reinforced Concrete. Sustainability 2021, 13, 10257. [Google Scholar] [CrossRef] [Scilit]
- Wei, X.; Maruthaveeran, S.; Shahidan, M.F.; Sha, T. Assessment of potential dominant factors for brownfield landscape regeneration: A case study in Xi’an, China. PLoS ONE 2025, 20, e0312668. [Google Scholar] [CrossRef] [Scilit] [PubMed]
- Zibaei, H.; Saadi Mesgari, M.; El-Sayed, M.; El-Kenawy; Khodadadi, N. A spatial agent-based modeling to allocate land use for brownfield sites on an urban scale. Landsc. Urban Plan. 2026, 269, 105595. [Google Scholar] [CrossRef] [Scilit]
- Feng, S.; Shen, J.; Sheng, S.; Hu, Z.; Wang, Y. Spatial Prioritizing Brownfields Catering for Green Infrastructure by Integrating Urban Demands and Site Attributes in a Metropolitan Area. Land 2023, 12, 802. [Google Scholar] [CrossRef] [Scilit]
- Malinić, V.; Durlević, U.; Brašanac-Bosanac, L.; Novković, I.; Joksimović, M.; Golić, R.; Krstić, F. A Hybrid Fuzzy AHP–MULTIMOORA Approach for Solar Energy Development on Rural Brownfield Sites in Serbia. Sustainability 2025, 17, 7988. [Google Scholar] [CrossRef] [Scilit]
- Official Gazette of the City of Belgrade. Detailed Regulation Plan for the Linear Park—Belgrade, City Municipalities Stari Grad and Palilula; City of Belgrade: Belgrade, Serbia, 2021. [Google Scholar]
- QGIS Development Team. QGIS Geographic Information System V3.40.9 with GRASS [Software], Open Source Geospatial Foundation: Beaverton, OR, USA, 2025. Available online: http://qgis.osgeo.org (accessed on 20 April 2026).
- Urban Planning Institute of Belgrade: 02—Geological Data. Available online: https://mape.urbel.com/urbelmape/maps/125939/02-geolo-ki-podaci-beograd# (accessed on 25 April 2026).
- Urban Planning Institute of Belgrade. Draft Master Urban Plan of Belgrade Until 2041; Secretariat for Urban Planning and Construction Affairs: Belgrade, Serbia, 2022; Available online: https://www.urbel.com/srp/javni-uvidi/2977/detaljnije/w/0/rani-javni-uvid-u-generalni-urbanisticki-plan-beograda-2041/ (accessed on 15 June 2026).
- Environmental Protection Agency. Annual Report on the State of Air Quality in the Republic of Serbia for 2024; Ministry of Environmental Protection of the Republic of Serbia: Belgrade, Serbia, 2025. Available online: https://sepa.gov.rs/wp-content/uploads/2026/01/Vazduh2024.pdf (accessed on 10 June 2026).
- Military Geographical Institute. Map of JNA, Scale 1:25,000. 1971. Available online: https://www.topografskakarta.com/ (accessed on 7 May 2026).
- Official Gazette of the City of Belgrade. Master Urban Plan of Belgrade 2021 (Official Gazette of the City of Belgrade, No. 11/16); City of Belgrade: Belgrade, Serbia, 2016. [Google Scholar]
- Geofabrik. Download OpenStreetMap Data for This Region: Serbia (Serbia-Latest-Free.shp.zip). 2026. Available online: https://download.geofabrik.de/europe/serbia.html (accessed on 2 June 2026).
- Copernicus Land Monitoring Service: Urban Atlas. Available online: https://land.copernicus.eu/en/products/urban-atlas (accessed on 15 June 2026).
- Bondarenko, M.; Priyatikanto, R.; Tejedor-Garavito, N.; Zhang, W.; McKeen, T.; Cunningham, A.; Woods, T.; Hilton, J.; Cihan, D.; Nosatiuk, B.; et al. Constrained Estimates of 2015-2030 Total Number of People per Grid Square at a Resolution of 3 Arc (Approximately 100m at the Equator) R2025A Version v1. Global Demographic Data Project—Funded by The Bill and Melinda Gates Foundation (INV-045237); WorldPop—School of Geography and Environmental Science, University of Southampton: Portswood, UK, 2025. [Google Scholar] [CrossRef]
- Xu, S.; Ehlers, M. Automatic detection of urban vacant land: An open-source approach for sustainable cities. Comput. Environ. Urban Syst. 2022, 91, 101729. [Google Scholar] [CrossRef] [Scilit]
- Wang, H.; Zhou, W.; Peng, S.; Zheng, X.; Fu, Q. Optimizing urban brownfields regreening solutions through a multi-objective planning model to balance ecosystem services supply, demands and costs. Landsc. Ecol. 2026, 41, 42. [Google Scholar] [CrossRef] [Scilit]
- Drusch, M.; Del Bello, U.; Carlier, S.; Colin, O.; Fernandez, V.; Gascon, F.; Hoersch, B.; Isola, C.; Laberinti, P.; Martimort, P.; et al. Sentinel-2: ESA’s optical high-resolution mission for GMES operational services. Remote Sens. Environ. 2012, 120, 25–36. [Google Scholar] [CrossRef] [Scilit]
- Frick, A.; Tervooren, S. A Framework for the Long-term Monitoring of Urban Green Volume Based on Multi-temporal and Multi-sensoral Remote Sensing Data. J. Geovis. Spat. Anal. 2019, 3, 6. [Google Scholar] [CrossRef] [Scilit]
- Ludwig, C.; Hecht, R.; Lautenbach, S.; Schorcht, M.; Zipf, A. Assessing the Completeness of Urban Green Spaces in OpenStreetMap. In Proceedings of the Academic Track at the State of the Map 2019, Heidelberg, Germany, 21–23 September 2019. [Google Scholar] [CrossRef]
- Latief, R.; Budu; Tumpu, M.; Hatta, M.P.; Aprianti, E. Quality of Life Analysis with WHOQOL-BREF in Disaster Preparedness for Flood-Prone Areas in Makassar City, Indonesia. Eng. Technol. Appl. Sci. Res. 2025, 15, 22178–22186. [Google Scholar] [CrossRef] [Scilit]
- Leonardi, G.; Palamara, R.; Manti, F.; Tufano, A. GIS-Multicriteria Analysis Using AHP to Evaluate the Landslide Risk in Road Lifelines. Appl. Sci. 2022, 12, 4707. [Google Scholar] [CrossRef] [Scilit]
- Aval, F.A.; Ataee, S.; Nemati, B.; Silva, B.T.; Lopes, D.; Martins, V.; Miranda, A.I.; Diapouli, E.; Relvas, H. Data-Driven Spatial Mapping of Air Pollution Exposure and Mortality Burden in Lisbon Metropolitan Area. Atmosphere 2026, 17, 408. [Google Scholar] [CrossRef] [Scilit]
- Schraufnagel, D.E.; Balmes, J.R.; Cowl, C.T.; De Matteis, S.; Jung, S.H.; Mortimer, K.; Perez-Padilla, R.; Rice, M.B.; Riojas-Rodriguez, H.; Sood, A.; et al. Air Pollution and Noncommunicable Diseases: A Review by the Forum of International Respiratory Societies’ Environmental Committee, Part 2: Air Pollution and Organ Systems. Chest 2019, 155, 417–426. [Google Scholar] [CrossRef] [Scilit] [PubMed]
- Fuller, R.; Landrigan, P.J.; Balakrishnan, K.; Bathan, G.; Bose-O’Reilly, S.; Brauer, M.; Caravanos, J.; Chiles, T.; Cohen, A.; Corra, L.; et al. Pollution and health: A progress update. Lancet Planet. Health 2022, 6, e535–e547. [Google Scholar] [CrossRef] [Scilit] [PubMed]
- World Health Organization. Global Air Quality Guidelines: Particulate Matter (PM2.5 and PM10), Ozone, Nitrogen Dioxide, Sulfur Dioxide and Carbon Monoxide; World Health Organization: Geneva, Switzerland, 2021. [Google Scholar]
- Durga Rao, K.H.V.; Alladi, S.; Singh, A. An Integrated Approach in Developing Flood Vulnerability Index of India using Spatial Multi-Criteria Evaluation Technique. Curr. Sci. 2019, 117, 80–86. [Google Scholar] [CrossRef] [Scilit]
- Maiti, S.; Jha, S.K.; Garai, S.; Nag, A.; Chakravarty, R.; Kadian, K.S.; Chandel, B.S.; Datta, K.K.; Upadhyay, R.C. Upadhyay, Assessment of social vulnerability to climate change in the eastern coast of India. Clim. Change 2015, 131, 287–306. [Google Scholar] [CrossRef] [Scilit]
- Rehman, S.; Sahana, M.; Kumar, P.; Ahmed, R.; Sajjad, H. Assessing hazards induced vulnerability in coastal districts of India using site-specific indicators: An integrated approach. GeoJournal 2020, 86, 2245–2266. [Google Scholar] [CrossRef] [Scilit]
- Kumar, P.; Geneletti, D.; Nagendra, H. Spatial assessment of climate change vulnerability at city scale: A study in Bangalore, India. Land Use Policy 2016, 58, 514–532. [Google Scholar] [CrossRef] [Scilit]
- Kumari, N.; Dhiman, R.; Krishnankutty, M.; Kalbar, P. Localising vulnerability assessment to urban floods: A comparative analysis of top-down and bottom-up geospatial approaches in Patna City, India. Int. J. Disaster Risk Reduct. 2024, 100, 104230. [Google Scholar] [CrossRef] [Scilit]
- Demšar, U.; Harris, P.; Brunsdon, C.; Fotheringham, A.S.; McLoone, S. Principal Component Analysis on Spatial Data: An Overview. Ann. Assoc. Am. Geogr. 2013, 103, 106–128. [Google Scholar] [CrossRef] [Scilit]
- Hammond, E.; Coulon, F.; Hallett, S.; Thomas, R.; Hardy, D.; Kingdon, A.; Beriro, D. A critical review of decision support systems for brownfield redevelopment. Sci. Total Environ. 2021, 785, 147132. [Google Scholar] [CrossRef] [Scilit] [PubMed]
- Huysegoms, L.; Cappuyns, V. Critical review of decision support tools for sustainability assessment of site remediation options. J. Environ. Manag. 2017, 196, 278–296. [Google Scholar] [CrossRef] [Scilit] [PubMed]
- Mosadeghi, R.; Warnken, J.; Tomlinson, R.; Mirfenderesk, H. Comparison of Fuzzy AHP and AHP in a spatial multi-criteria decision making model for urban land-use planning. Comput. Environ. Urban Syst. 2015, 49, 54–65. [Google Scholar] [CrossRef] [Scilit]
- Beames, A.; Broekx, S.; Schneidewind, U.; Landuyt, D.; Meulen, M.; Heijungs, R.; Seuntjens, P. Amenity proximity analysis for sustainable brownfield redevelopment planning. Landsc. Urban Plan. 2018, 171, 68–79. [Google Scholar] [CrossRef] [Scilit]
- Herbst, H.; Herbst, V. The development of an evaluation method using a geographic information system to determine the importance of wasteland sites as urban wildlife areas. Landsc. Landsc. Urban Plan. 2006, 77, 178–195. [Google Scholar] [CrossRef] [Scilit]
- Liu, Y.; Zhu, A.-X.; Wang, J.; Li, W.; Hu, G.; Hu, Y. Land-use decision support in brownfield redevelopment for urban renewal based on crowdsourced data and a presence-and-background learning (PBL) method. Land Use Policy 2019, 88, 104188. [Google Scholar] [CrossRef] [Scilit]
- Gani, A.; Hussain, A.; Pathak, S.; Ahmed, S.; Omar, P.J. Impact of pollutants on groundwater quality and health risk assessment of quaternary aquifers in Northern India. J. Hazard Toxic. Radioact. Waste 2025, 29, 04024039. [Google Scholar] [CrossRef] [Scilit]
- Russo, A.; Cirella, G.T. Modern compact cities: How much greenery do we need? Int. J. Environ. Res. Public Health 2018, 15, 2180. [Google Scholar] [CrossRef] [Scilit] [PubMed]
- Paul, S.; Bardhan, S. Overview: Framework for quantitative assessment of Urban-Blue-and-Green-spaces in a high-density megacity. Int. Rev. Spat. Plan. Sustain. Dev. 2022, 10, 280–301. [Google Scholar] [CrossRef] [Scilit] [PubMed]
- Hassan, Y.N.; Ali, Z.F.; Usztoke, L.; Jombach, S. A Comparative Assessment of UGS Changes and Accessibility Using Per Capita. Metrics: A Case Study of Budapest and Vienna. J. Digit. Landsc. Archit. 2024, 723–734. [Google Scholar]
- Buchavyi, Y.; Lovynska, V.; Samarska, A. GIS assessment of the green space percentage in a big industrial city (Dnipro, Ukraine). Ekologia 2023, 42, 89–100. [Google Scholar] [CrossRef] [Scilit]
- Yukhnovskyi, V.; Zibtseva, O. Green space trends in small towns of Kyiv region according to EOS Land Viewer–a case study. J. For. Sci. 2020, 66, 252–263. [Google Scholar] [CrossRef] [Scilit]
- Maghrabi, A.; Alyamani, A.; Addas, A. Exploring pattern of green spaces (Gss) and their impact on climatic change mitigation and adaptation strategies: Evidence from a saudi arabian city. Forests 2021, 12, 629. [Google Scholar] [CrossRef] [Scilit]
- de Roo, M. The Green City Guidelines: Techniques for a healthy liveable city; Zwaan Printmedia: Wormerveer, The Netherlands, 2011. [Google Scholar]
- Handley, J.; Pauleit, S.; Slinn, P.; Barber, A.; Baker, M.; Jones, C.; Lindley, S. Providing Accessible Natural Greenspace in Towns and Cities: A Practical Guide to Assessing the Resource and Implementing Local Standards for Provision; English Nature: Peterborough, UK, 2003; Available online: https://publications.naturalengland.org.uk/publication/65021 (accessed on 24 May 2026).
- Samardžić, I.; Blagajac, I.; Durlević, U.; Filipović, D.; Novković, I.; Dragićević, S. GIS-based Spatial Prediction of Torrential Flood Susceptibility Using Sentinel-2 Data: A Case Study of the Čemernica River Basin, Serbia. Earth Syst. Environ. 2026, 10, 11171–11191. [Google Scholar] [CrossRef] [Scilit]
- Rahman, M.; Meher, N.M. A GIS Based Integrated Approach to Measure the Spatial Equity of Community Facilities of Bangladesh. AIMS Geosci. 2015, 1, 21–40. [Google Scholar] [CrossRef] [Scilit]
- Taleai, M.; Sliuzas, R.; Flacke, J. An integrated framework to evaluate the equity of urban public facilities using spatial multi-criteria analysis. Cities 2014, 40, 56–69. [Google Scholar] [CrossRef] [Scilit]
- Wang, Z.; Chen, X.; Huang, N.; Yang, Y.; Wang, L.; Wang, Y. Spatial Identification and Redevelopment Evaluation of Brownfields in the Perspective of Urban Complex Ecosystems: A Case of Wuhu City, China. Int. J. Environ. Res. Public Health 2022, 19, 478. [Google Scholar] [CrossRef] [Scilit] [PubMed]
- Vardopoulos, I. Critical sustainable development factors in the adaptive reuse of urban industrial buildings. A fuzzy DEMATEL approach. Sustain. Cities Soc. 2019, 50, 101684. [Google Scholar] [CrossRef] [Scilit]
- Gholitabar, S.; Alipour, H.; Costa, C. An Empirical Investigation of Architectural Heritage Management Implications for Tourism: The Case of Portugal. Sustainability 2018, 10, 93–125. [Google Scholar] [CrossRef] [Scilit]
- Korhonen, J.; Honkasalo, A.; Seppälä, J. Circular Economy: The Concept and its Limitations. Ecol. Econ. 2018, 143, 37–46. [Google Scholar] [CrossRef] [Scilit]
- Ahmed, A.; Ranasinghe-Arachchilage, C.; Alrajhi, A.; Hewa, G. Comparison of multicriteria decision-making techniques for groundwater recharge potential zonation: Case study of the Willochra Basin, South Australia. Water 2021, 13, 525. [Google Scholar] [CrossRef] [Scilit]
- Saaty, T.L. The Analytic Hierarchy Process; McGraw-Hill: New York, NY, USA, 1980. [Google Scholar]
- Saaty, T.L. How to make a decision: The analytic hierarchy process. Eur. J. Oper. Res. 1990, 48, 9–26. [Google Scholar] [CrossRef] [Scilit]
- Jha, R.K.; Gundimeda, H. An integrated assessment of vulnerability to floods using composite index—A district level analysis for Bihar, India. Int. J. Disaster Risk Reduct. 2019, 35, 101074. [Google Scholar] [CrossRef] [Scilit]
- Chabuk, A.; Al-Ansari, N.; Hussain, H.M.; Knutsson, S.; Pusch, R.; Laue, J. Combining GIS Applications and Method of Multi-Criteria Decision-Making (AHP) for Landfill Siting in Al-Hashimiyah Qadhaa, Babylon, Iraq. Sustainability 2017, 9, 1932. [Google Scholar] [CrossRef] [Scilit]
- Xie, W.-T.; Ho, S.-T.; Lin, H.-C. Designing Cross-Domain Sustainability Instruction in Higher Education: A Mixed-Methods Study Using AHP and Transformative Pedagogy. Sustainability 2025, 17, 6380. [Google Scholar] [CrossRef] [Scilit]
- Chen, Y.; Yu, J.; Khan, S. Spatial sensitivity analysis of multi-criteria weights in GIS-based land suitability evaluation. Environ. Model. Softw. 2010, 25, 1582–1591. [Google Scholar] [CrossRef] [Scilit]
- Ishizaka, A.; Labib, A. Analytic Hierarchy Process and Expert Choice: Benefits and limitations. OR Insight 2009, 22, 201–220. [Google Scholar] [CrossRef] [Scilit]
- Canevari-Luzardo, L.; Bastide, J.; Choutet, I.; Liverman, D. Using partial participatory GIS in vulnerability and disaster risk reduction in Grenada. Clim. Dev. 2017, 9, 95–109. [Google Scholar] [CrossRef] [Scilit]
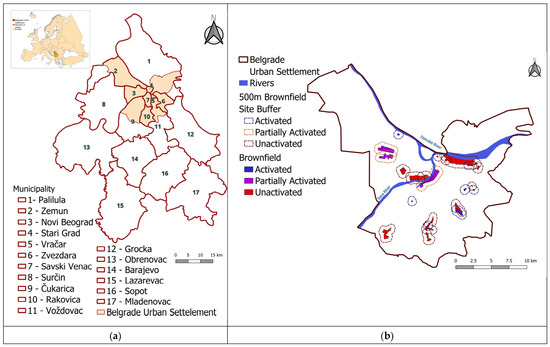
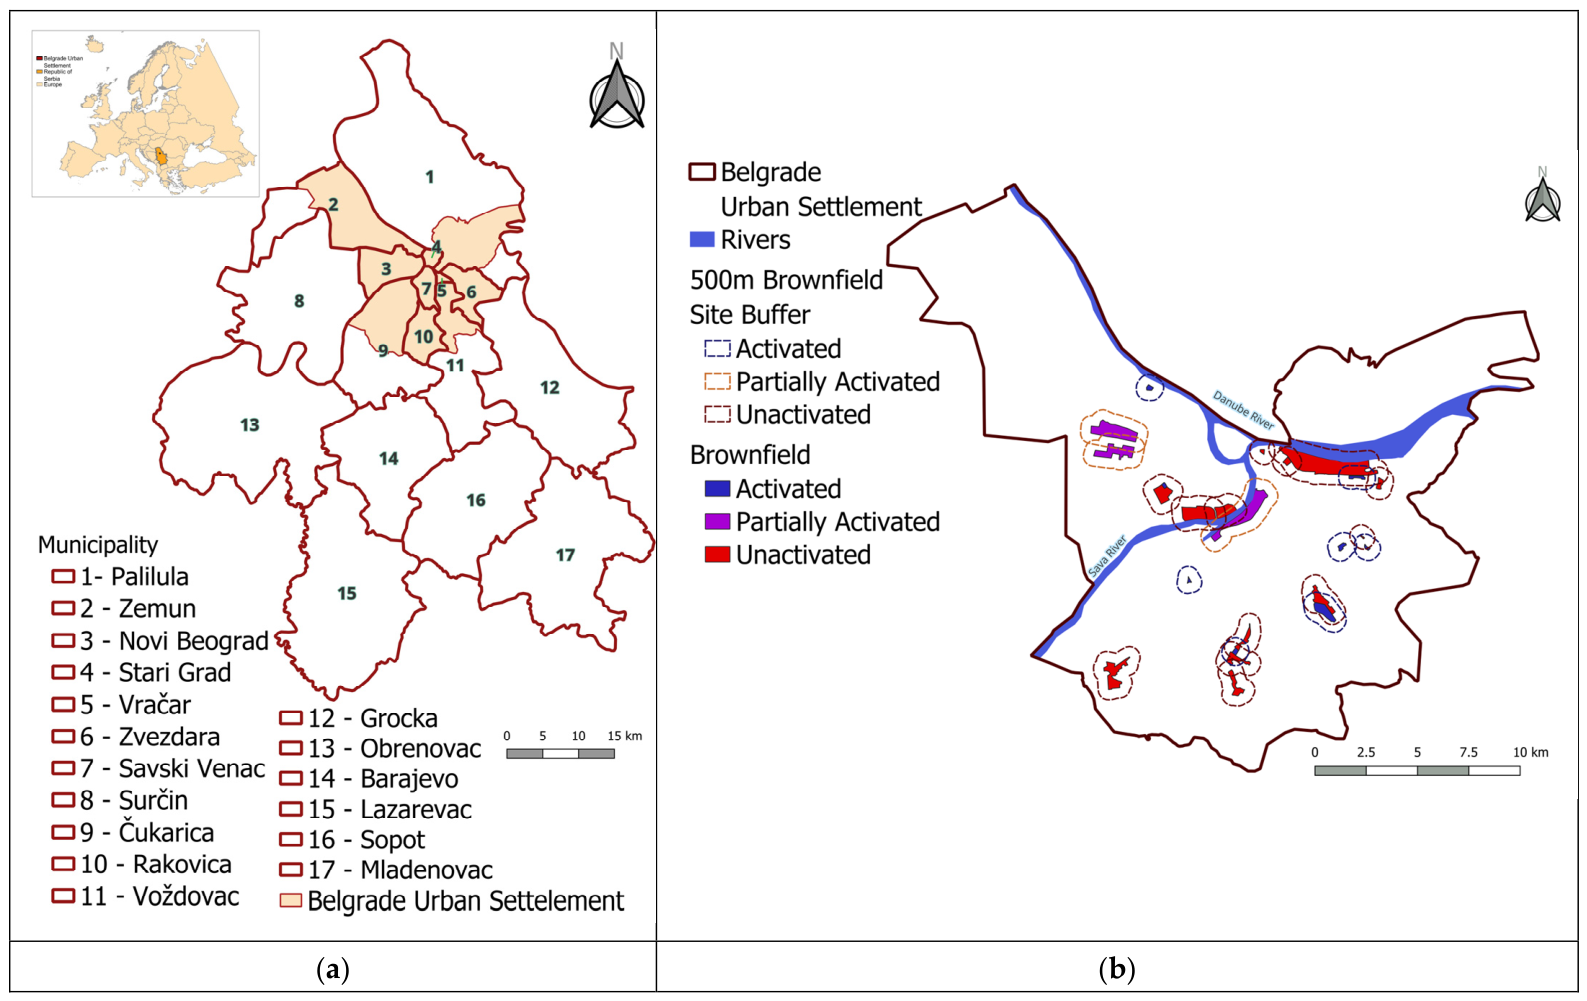
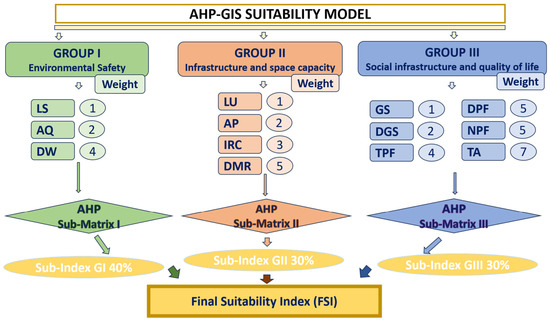
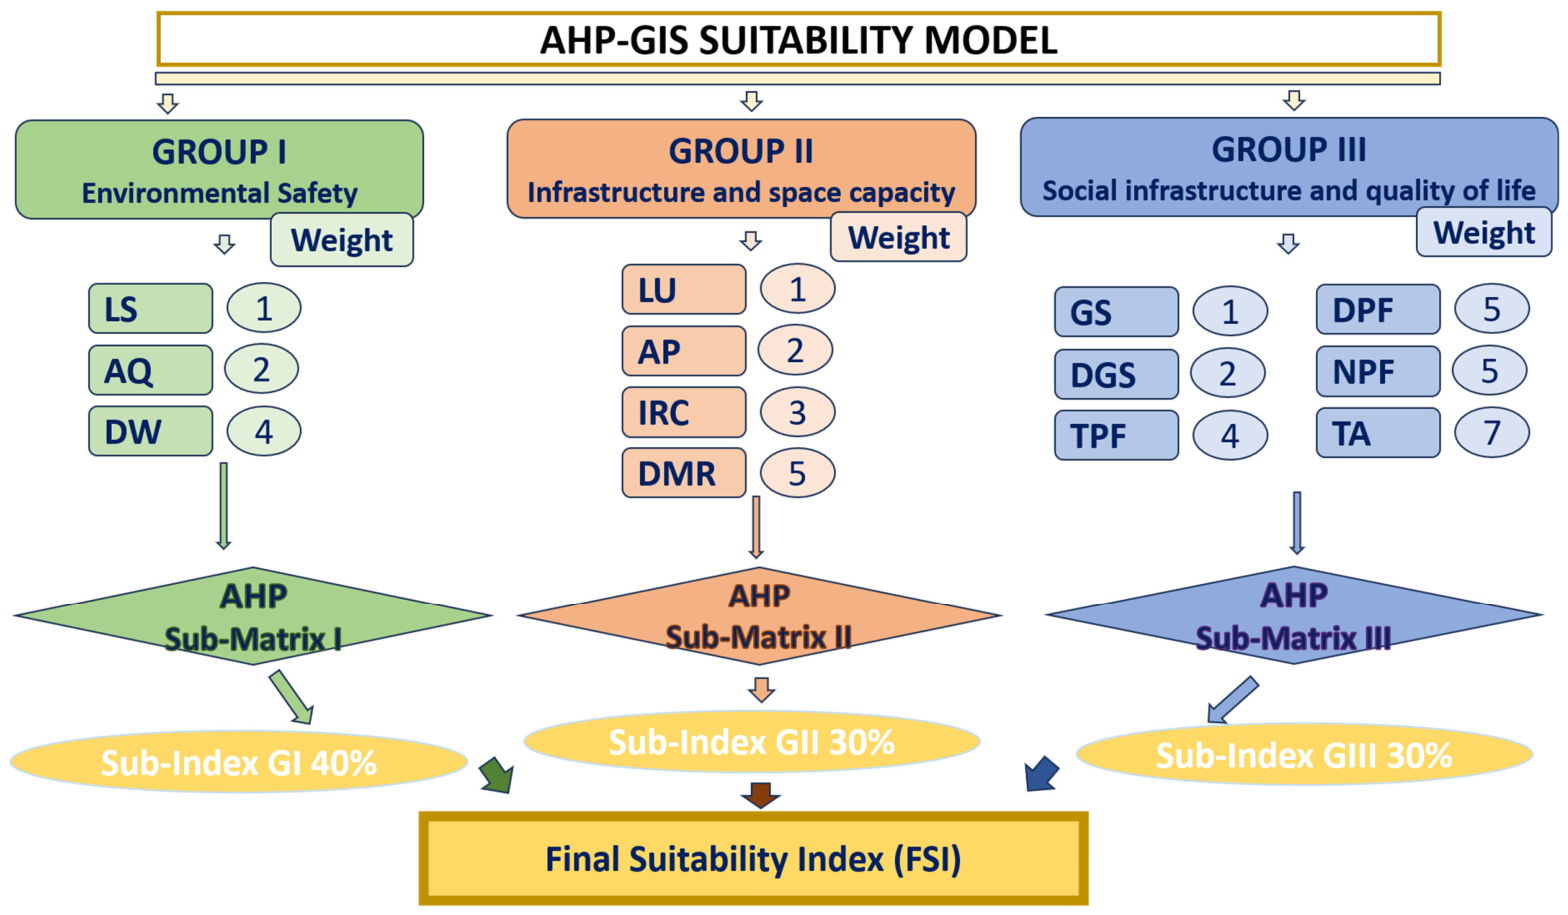
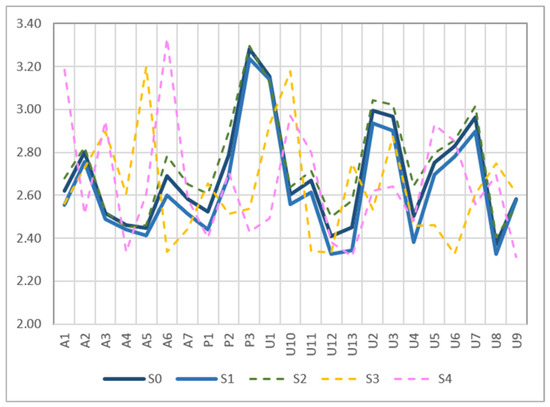
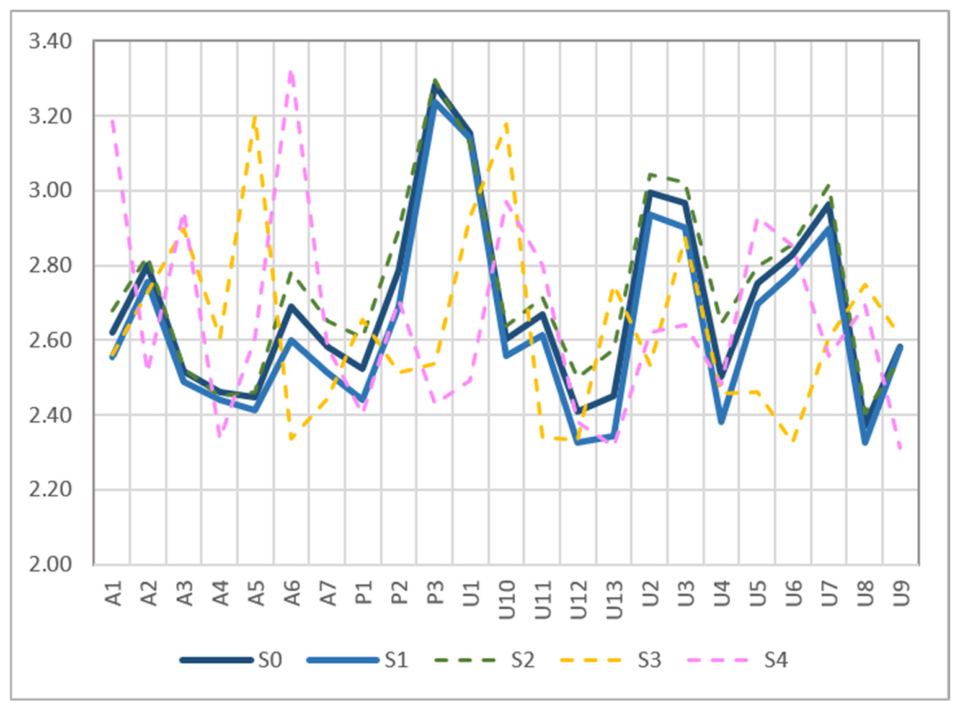
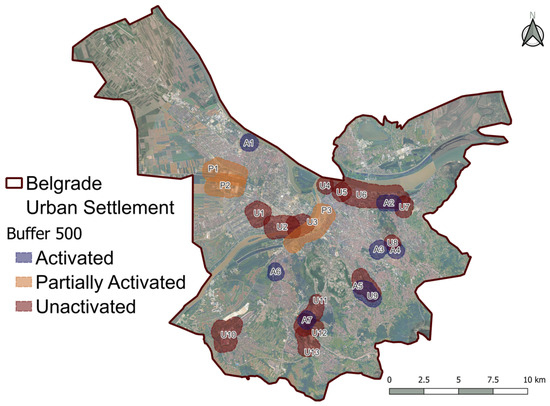
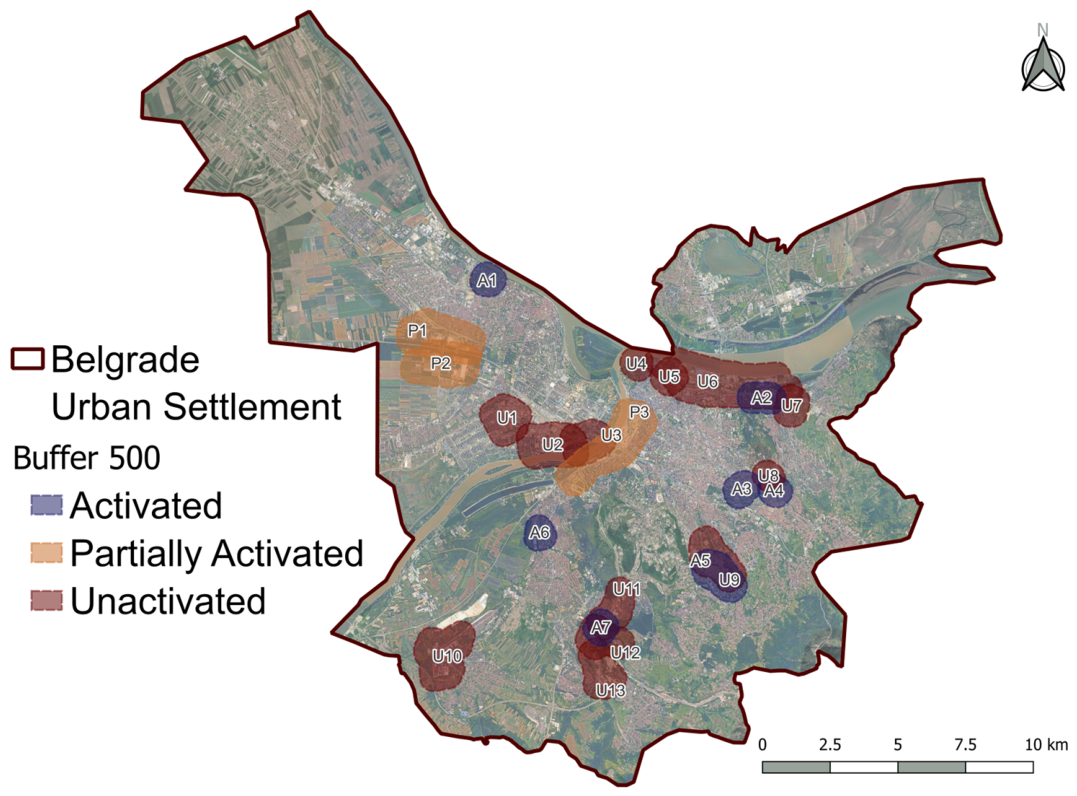
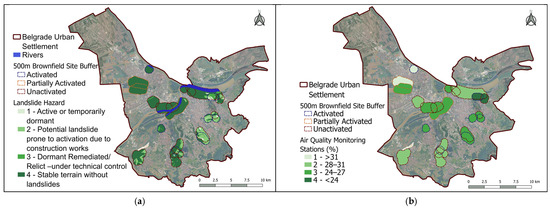
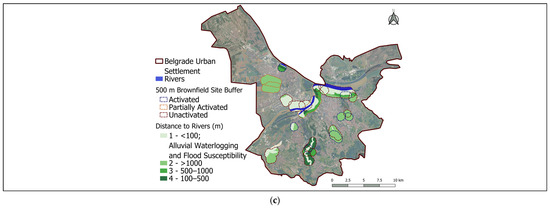
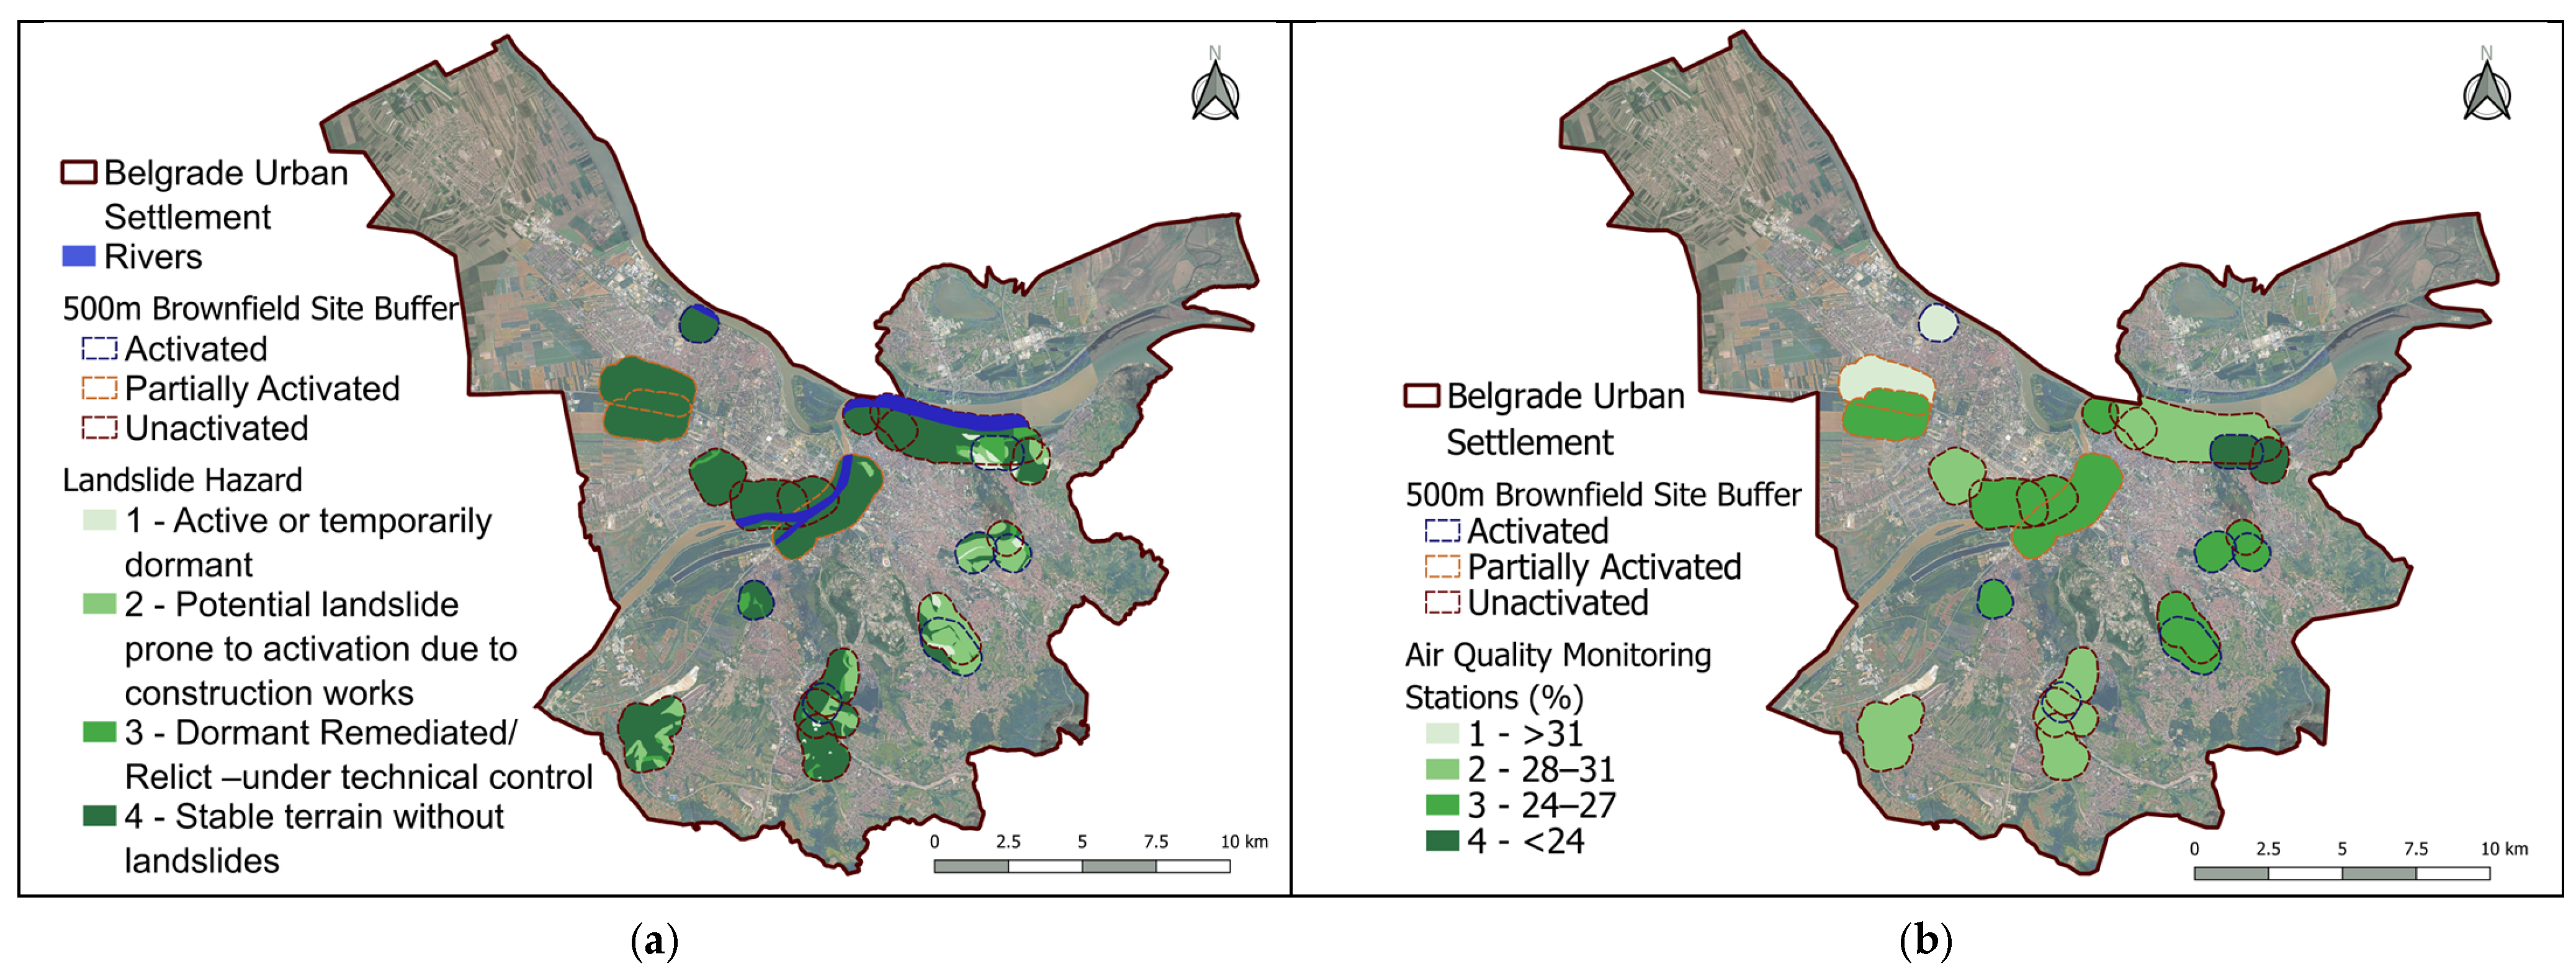
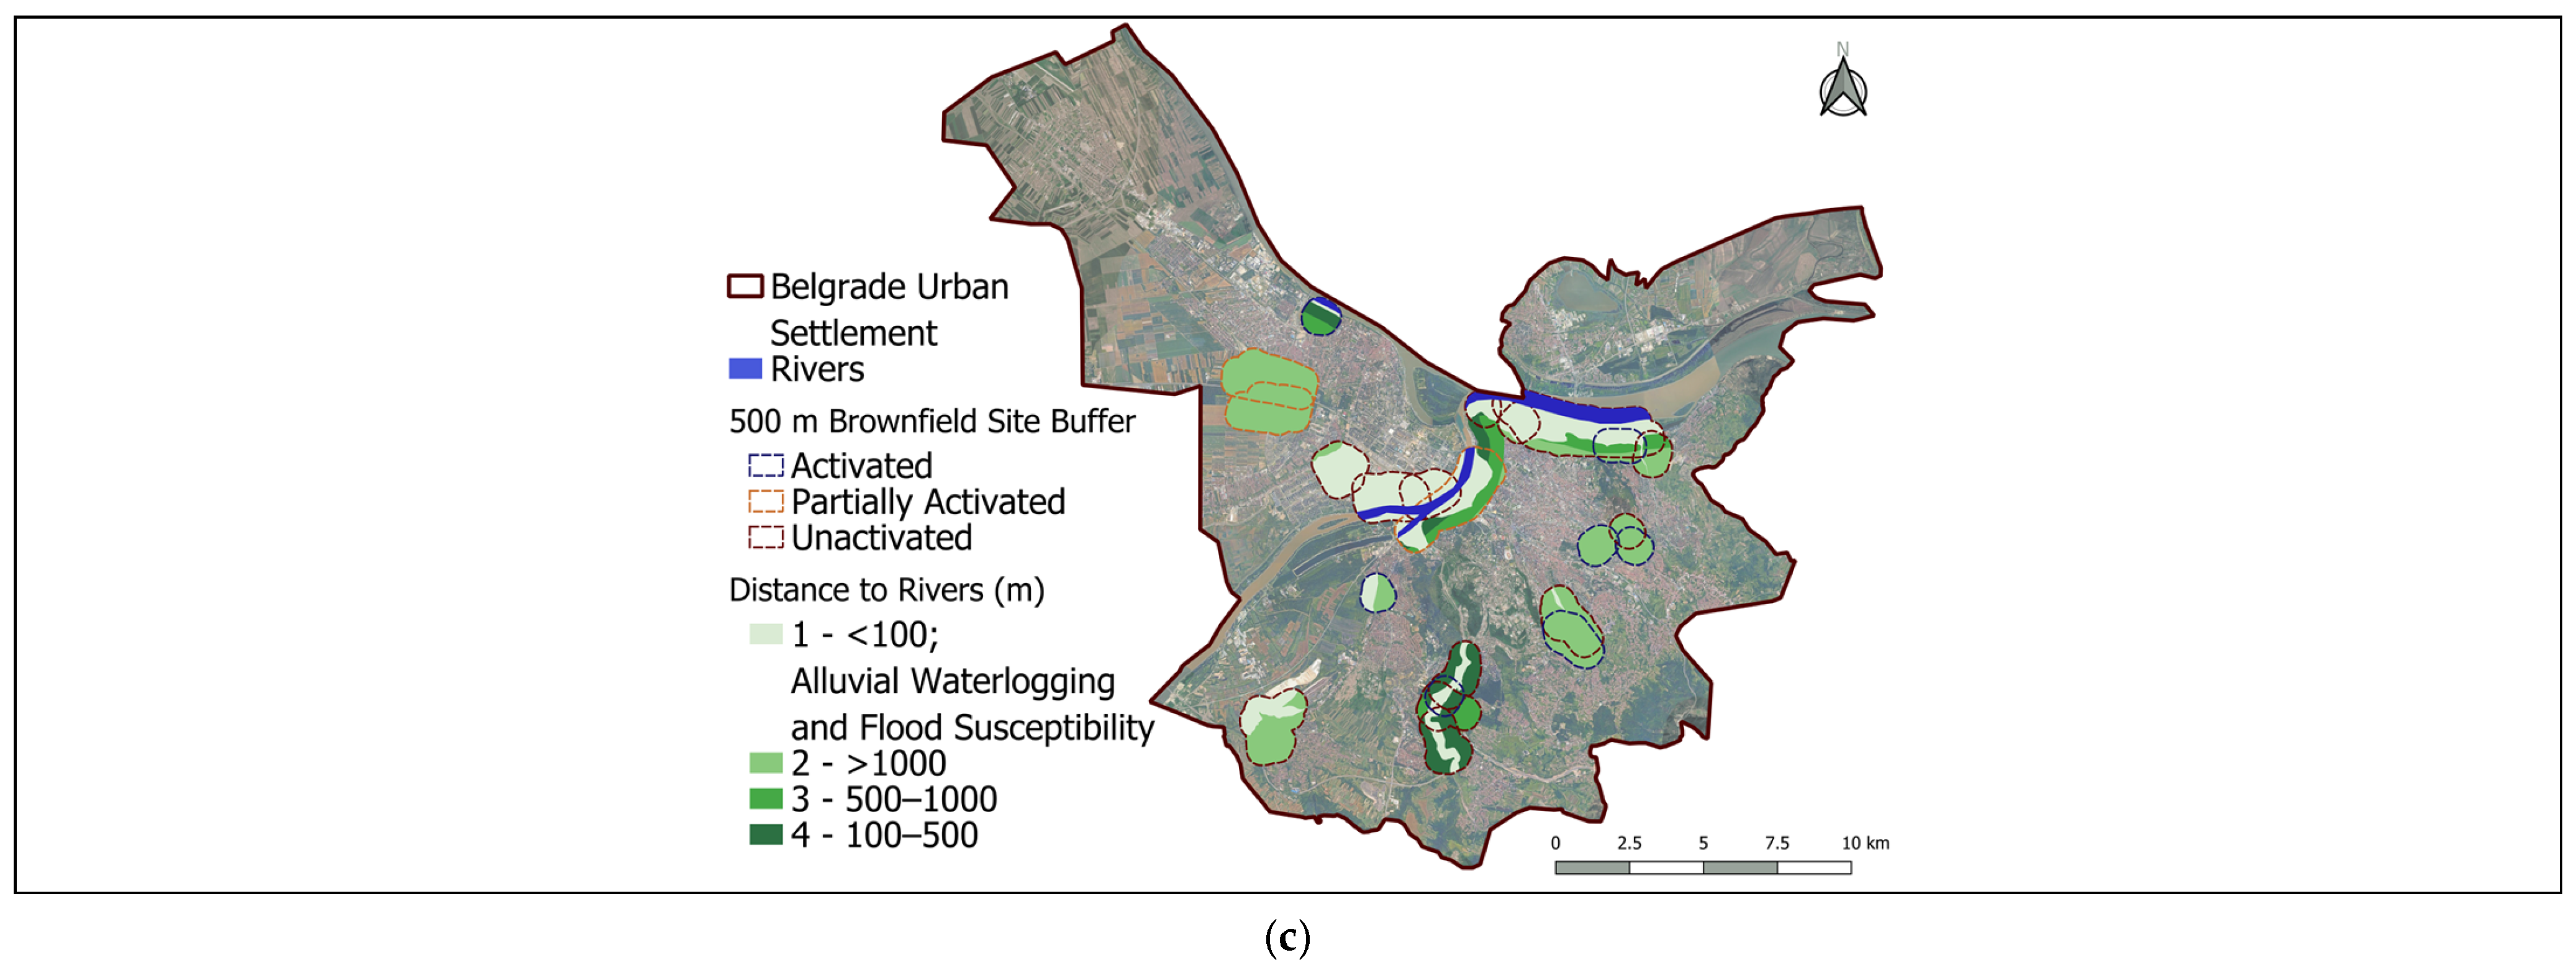
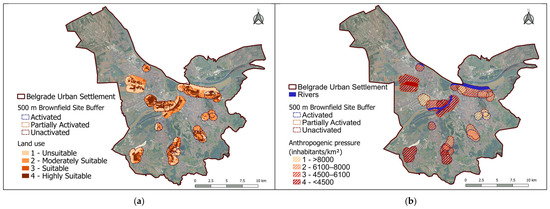
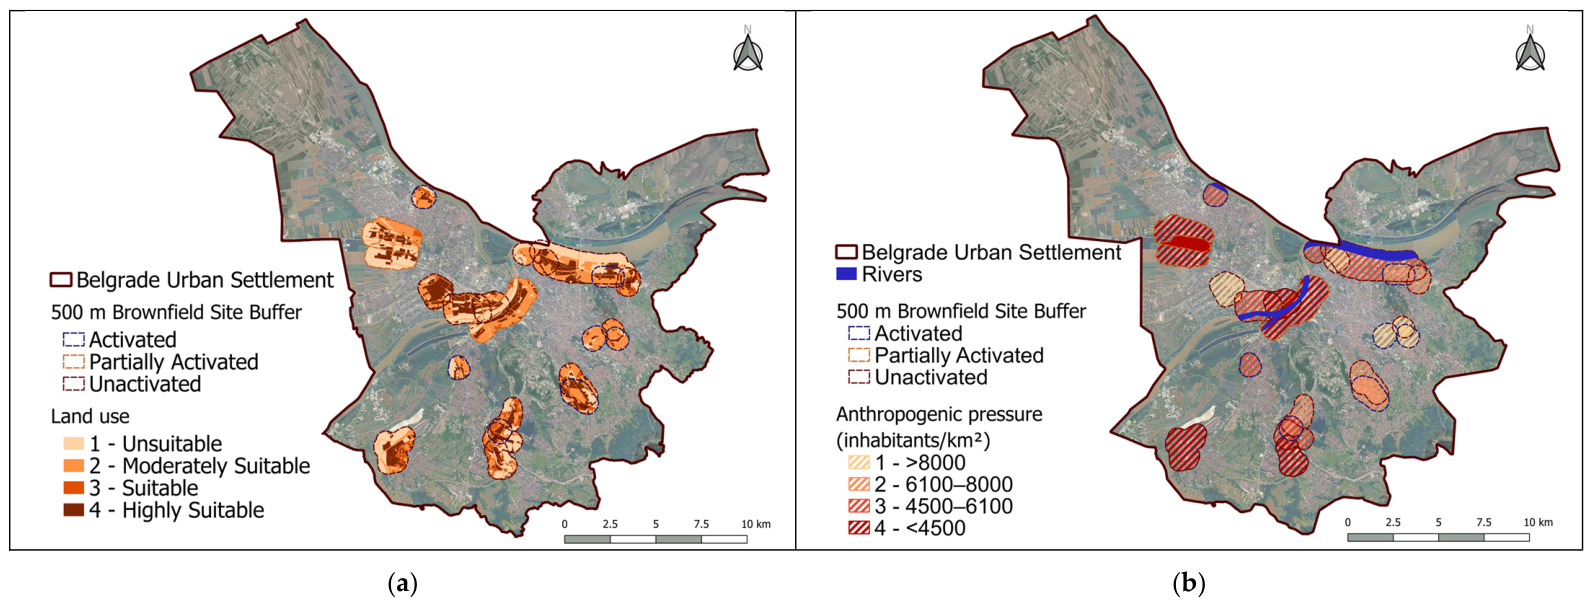
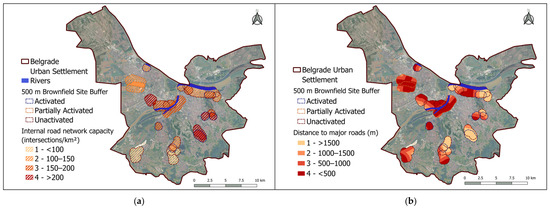
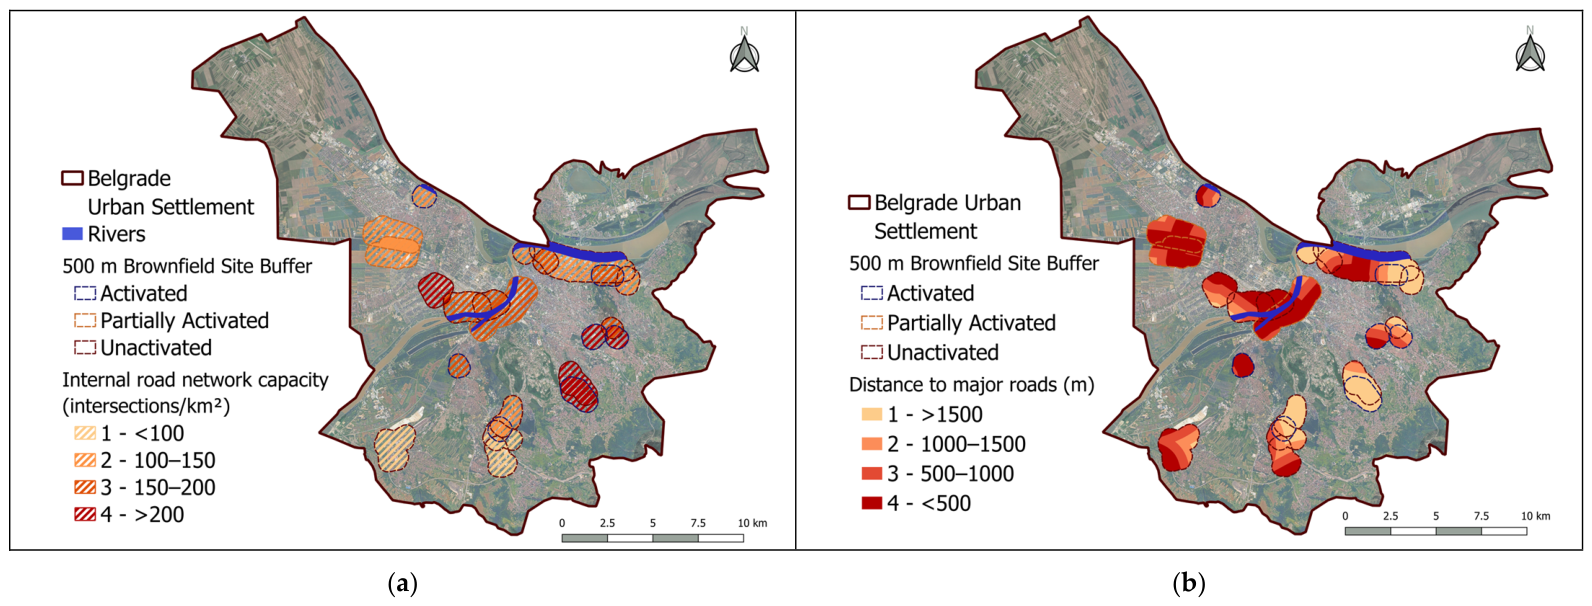
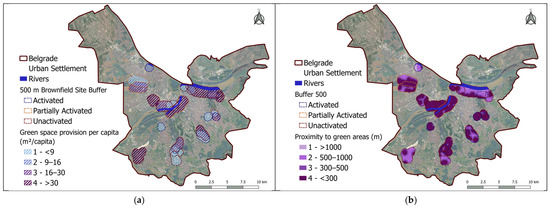
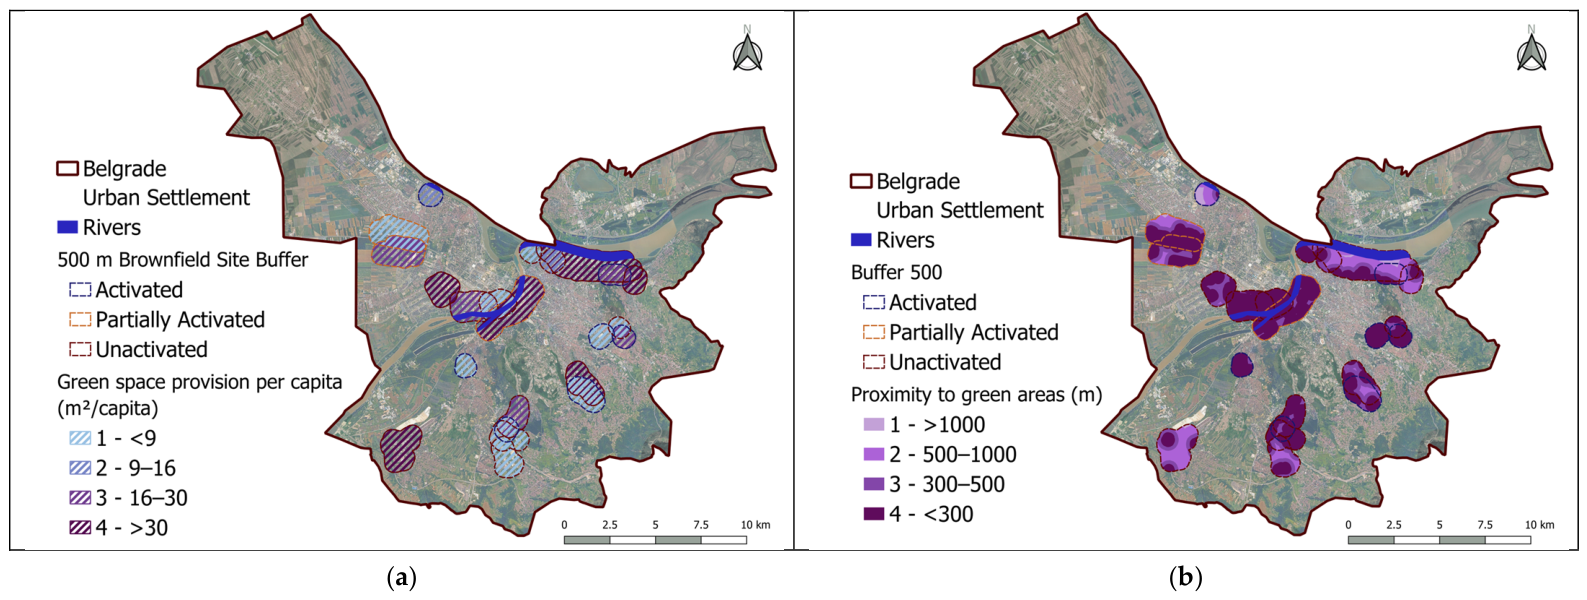
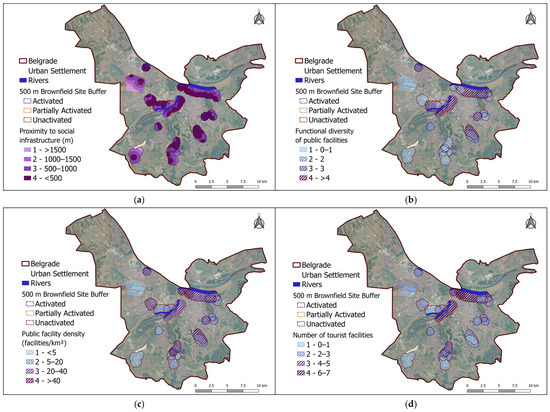
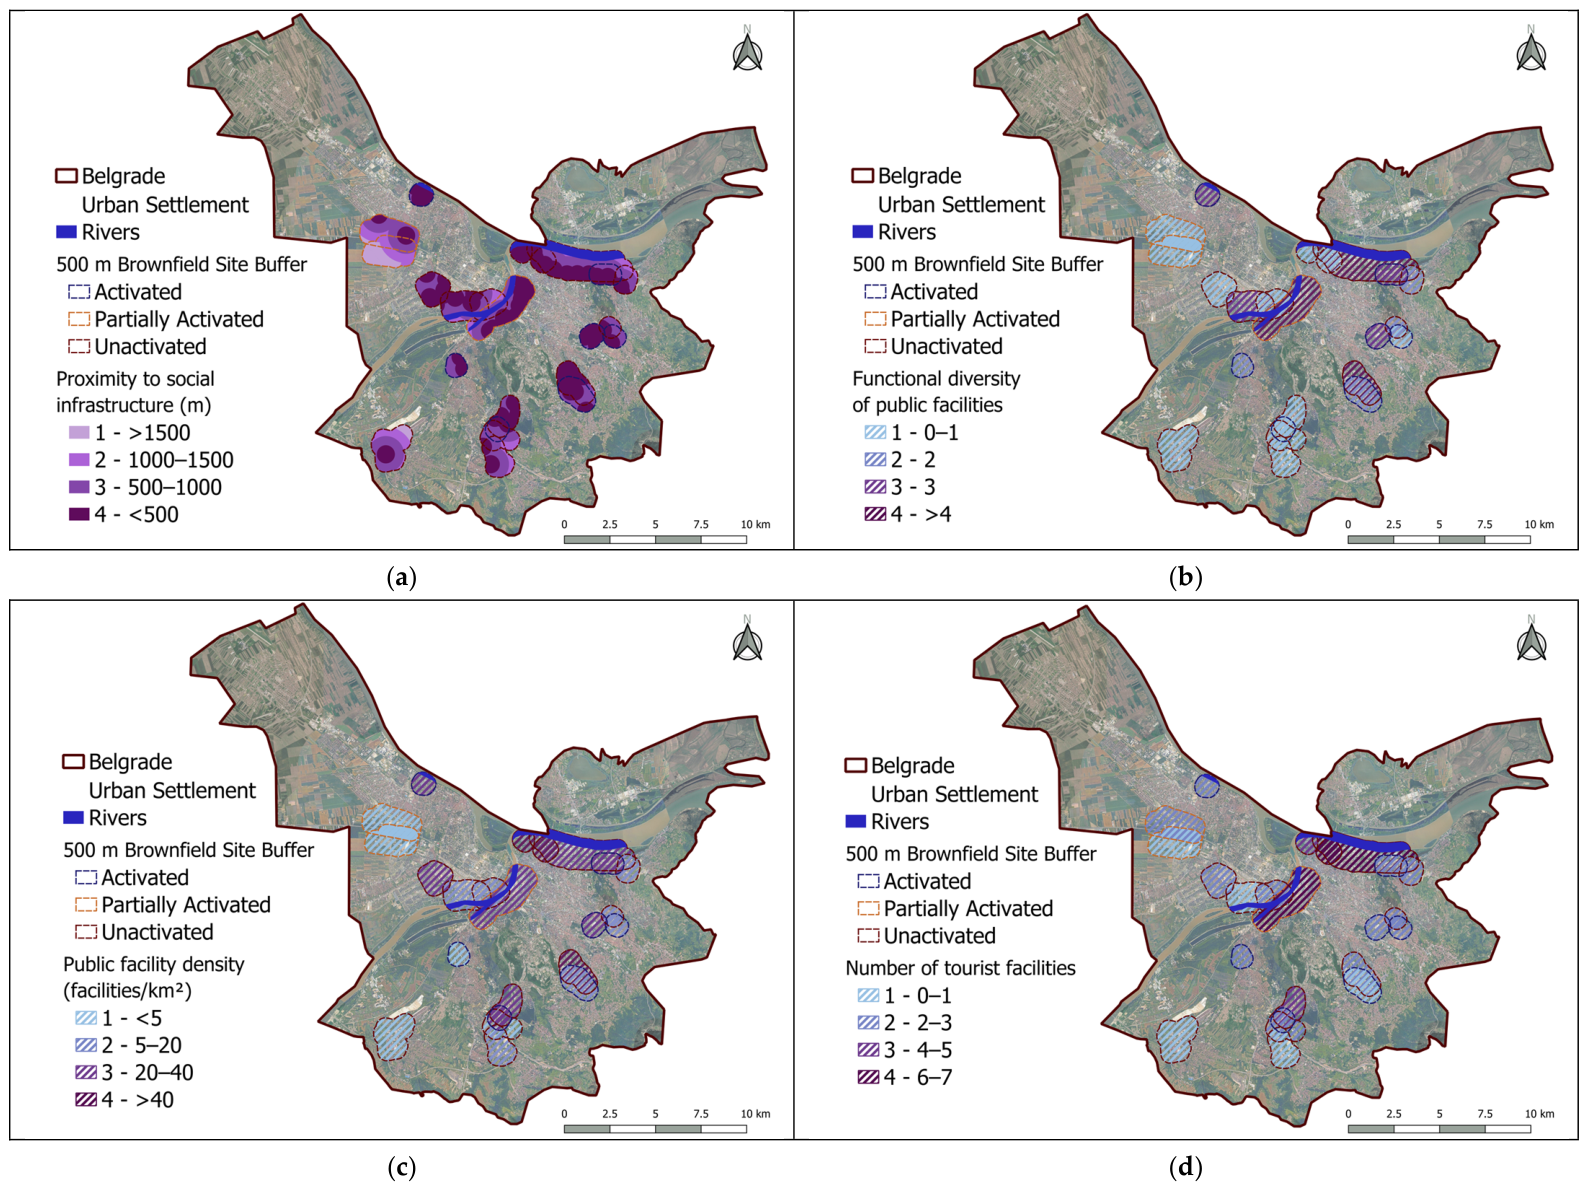
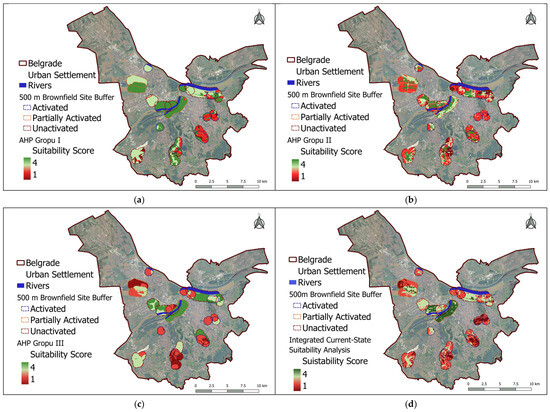
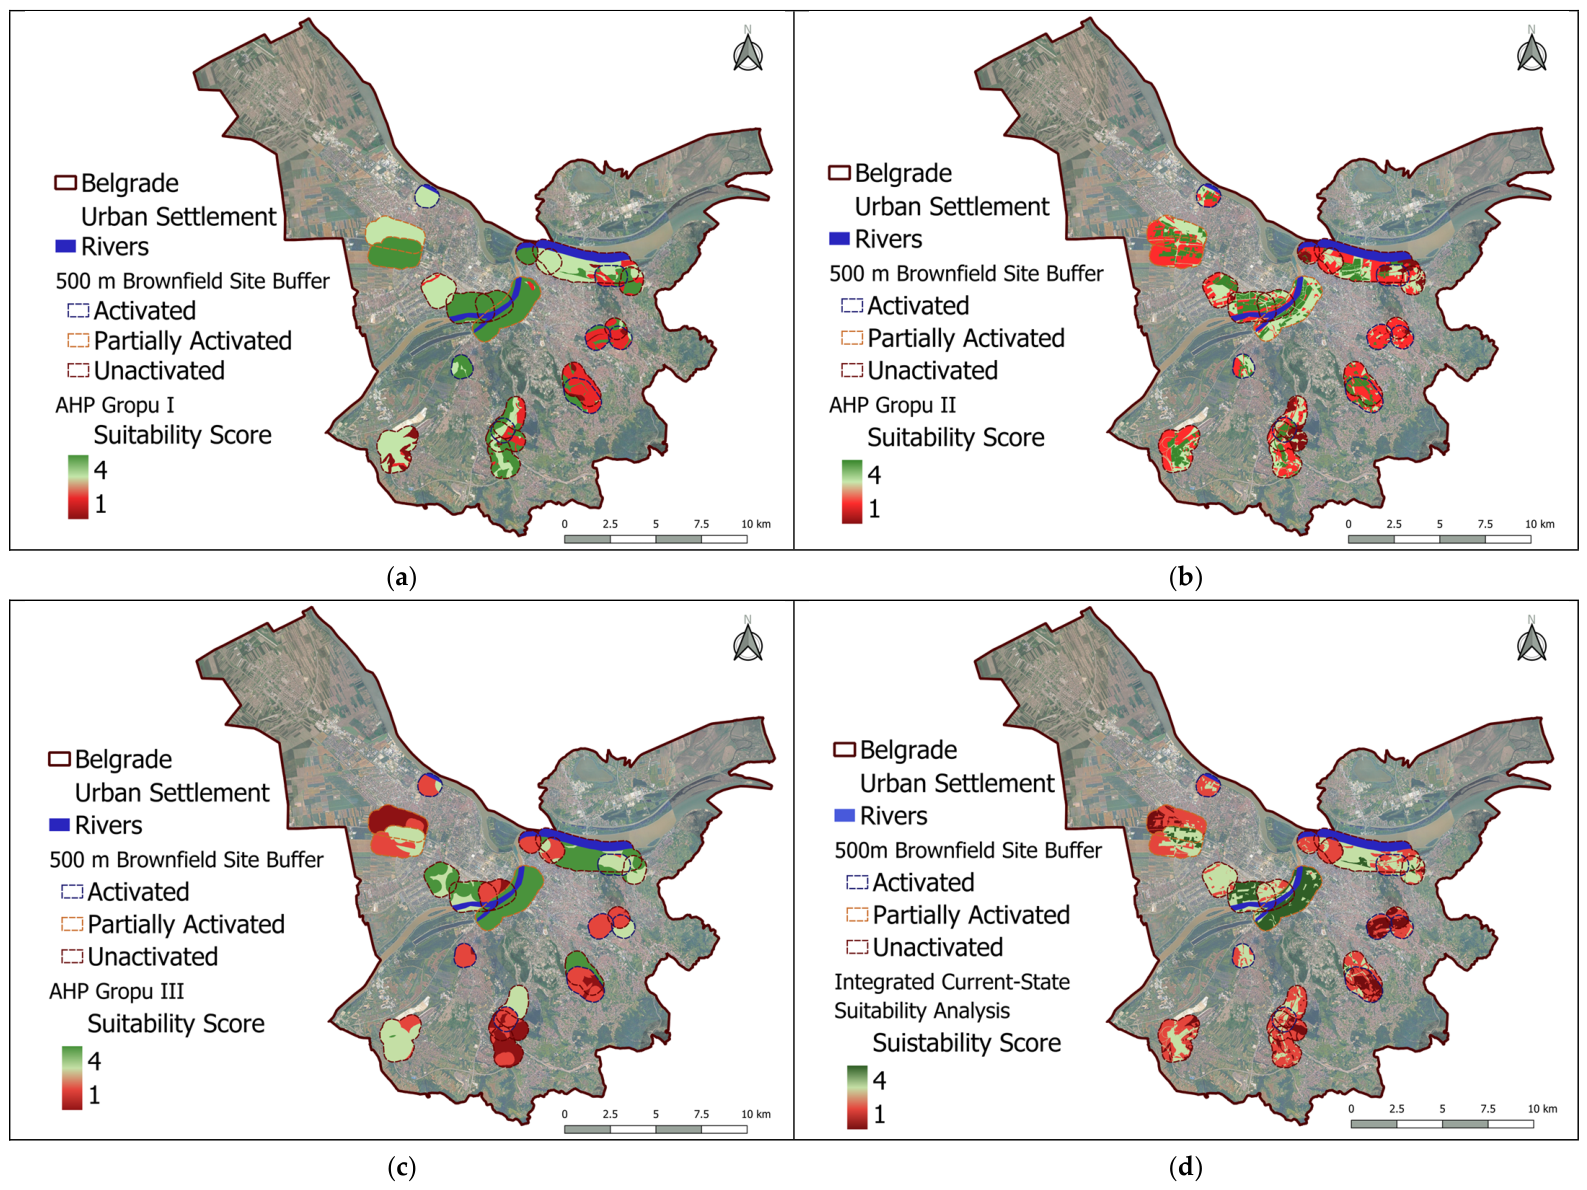
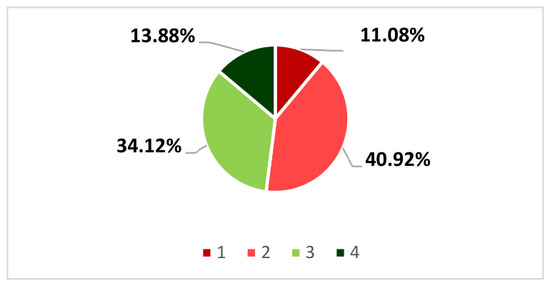
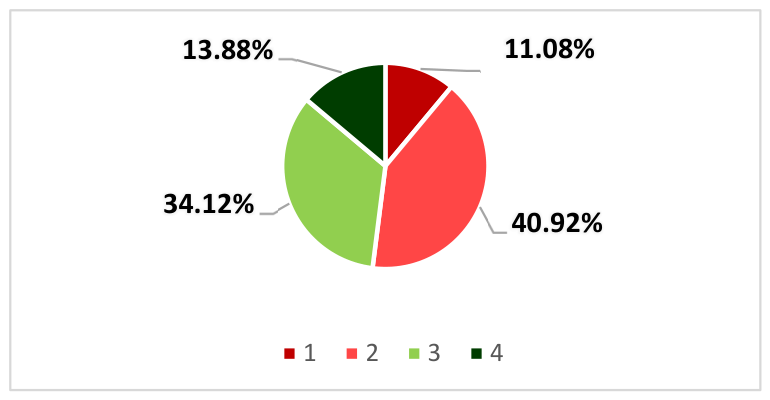

Disclaimer/Publisher’s Note: The statements, opinions and data contained in all publications are solely those of the individual author(s) and contributor(s) and not of MDPI and/or the editor(s). MDPI and/or the editor(s) disclaim responsibility for any injury to people or property resulting from any ideas, methods, instructions or products referred to in the content. |
© 2026 by the authors. Licensee MDPI, Basel, Switzerland. This article is an open access article distributed under the terms and conditions of the Creative Commons Attribution (CC BY) license.