


Abstract
Agricultural new-quality productive forces constitute an important driver of the transformation and upgrading of agricultural production systems, while their regional evolution influences the overall quality and spatial pattern of agricultural modernization. Based on panel data for 31 provincial-level regions in China from 2001 to 2023, this study constructs an evaluation index system grounded in the three-element theory of productive forces and employs the entropy weight method, the Dagum Gini coefficient and its decomposition, kernel density estimation, and traditional and spatial Markov chains to examine the development levels, regional disparities, distributional evolution, and spatial transition dynamics of agricultural new-quality productive forces. The findings reveal a continuous rise in agricultural new-quality productive forces in China, while the seven major regions have maintained a relatively stable development gradient, alongside distinct differences in the growth rates and regional advantage structures of the three constituent elements. Overall disparities exhibit a phased pattern of convergence followed by renewed divergence, with inter-regional disparities consistently constituting the primary source of overall inequality. The inter-provincial distribution has also shifted steadily toward higher levels while becoming increasingly dispersed, accompanied by a simultaneous extension of the upper tail and intensification of localized stratification. The dynamic evolution is characterized by strong state persistence and gradual upward mobility, with transitions occurring predominantly between adjacent levels; meanwhile, the association between neighborhood conditions and state transitions exhibits clear heterogeneity across development levels and sensitivity to alternative specifications. Theoretically, this study deepens the understanding of the unevenness, path dependence, and spatial conditionality underlying the regional evolution of agricultural new-quality productive forces. Practically, it provides empirical evidence for identifying region-specific constraints on upgrading and optimizing pathways for regional coordination.
1. Introduction
Sustained agricultural modernization depends on upgrading the quality of agricultural productive forces. At present, the marginal returns to land, labor, and conventional capital inputs are diminishing; meanwhile, resource and environmental constraints, market volatility, and climate risks are imposing increasingly stringent requirements on stable production and supply, quality and efficiency, and green transformation. Against this backdrop, the drivers of agricultural growth are shifting from factor-based expansion to innovation-driven development and systemic synergy [1]. Unlike general industrial production, agriculture encompasses both natural and economic reproduction processes, and the effectiveness of technological applications is highly contingent on resource endowments, farmers’ capabilities, organizational structures, and supporting industrial conditions [2]. Accordingly, agricultural new-quality productive forces embody not only a qualitative leap in agricultural productivity but also the capacity to efficiently allocate and transform new-quality factors under heterogeneous agricultural conditions.
China’s vast territory encompasses significant regional disparities in agricultural resource endowments, production functions, and the foundations of agricultural modernization. The Plan for Accelerating the Building of an Agricultural Powerhouse (2024–2035) explicitly proposes advancing the construction of an agricultural powerhouse through the development of agricultural new-quality productive forces, while the 2026 No. 1 Central Document further emphasizes the need to “develop agricultural new-quality productive forces in a manner tailored to local conditions.” These policy directions signal a shift in agricultural productivity upgrading from dissemination of general-purpose technologies toward systematic cultivation tailored to regional conditions. Existing studies further show that the development of agricultural new-quality productive forces is jointly shaped by socioeconomic foundations, factor endowments, market conditions, and the natural environment, with significant interactions among these factors [3]. Accordingly, the regional evolution of agricultural new-quality productive forces exhibits pronounced conditional dependence, and the uneven patterns underlying their overall improvement require further investigation.
Existing studies, through theoretical conceptualization and comprehensive measurement, have broadly established that the overall improvement of China’s agricultural new-quality productive forces has been accompanied by persistent regional differentiation [4]. However, existing analyses remain fragmented across different dimensions of regional evolution. Regional averages cannot reveal whether overall disparities originate primarily from within-region differences, between-region differences, or the overlap of provincial distributions; fluctuations in disparity levels alone cannot capture changes in convergence, stratification, or local polarization in the inter-provincial distribution; and static spatial patterns cannot identify whether the persistence of, or transitions between, different development levels are conditioned by neighboring environments. Against this background, this study takes the uneven evolution underlying overall improvement as its central analytical thread and addresses three progressively linked questions. First, to what extent has the long-term growth of China’s agricultural new-quality productive forces been shared across regions, and how have the sources of overall disparities evolved? Second, as the overall level rises, what patterns of convergence, stratification, or polarization emerge in the interprovincial distribution? Third, what is the continuity and direction of development of each province, and how do transition probabilities vary across different neighborhood environments? To address these questions, this study uses panel data for 31 Chinese provinces from 2001 to 2023 and, drawing on the theory of the three elements of productive forces, constructs an evaluation system encompassing new-quality agricultural laborers, new-quality agricultural means of production, and new-quality agricultural objects of labor. The entropy method, the Dagum Gini coefficient and its decomposition, kernel density estimation, and traditional and spatial Markov chains are then combined to systematically examine the long-term uneven evolution of China’s agricultural new-quality productive forces under overall improvement from three perspectives: regional disparities and their sources, distributional restructuring, and level persistence and spatial transitions.
This study makes three main contributions. First, building on the existing three-element framework of productive forces, this study further uses functional changes in the three categories of production factors as a unified criterion for identifying and classifying new-quality attributes. In doing so, it incorporates emerging characteristics such as digitalization, green transformation, technological innovation, and organizational upgrading while preserving the theoretical coherence and long-term comparability of the evaluation framework. Second, empirically, the study extends the observation period back to 2001 and adopts a seven-region classification to trace structural shifts among intra-regional disparities, inter-regional gradients, and interprovincial distributional overlap, thereby deepening the identification of uneven regional evolution amid overall improvement. Third, from a dynamic perspective, this study combines traditional and spatial Markov analyses to examine transition differences under the interaction of initial development level and neighborhood environment after identifying state persistence and level mobility. By further adopting a relative-state classification, the analysis distinguishes common temporal evolution from spatial conditional associations, thereby deepening the identification of path persistence and spatial heterogeneity in the evolution of agricultural new-quality productive forces.
2. Literature Review
2.1. Theoretical Connotations and Measurement of Agricultural New-Quality Productive Forces
Agricultural new-quality productive forces represent the sector-specific manifestation of new-quality productive forces in agriculture. Existing studies have mainly conceptualized their connotation from three perspectives. First, drawing on such fundamental characteristics as high technology, high efficiency, and high quality, scholars emphasize the systematic reshaping of agricultural production modes and development quality through scientific and technological innovation [5]. Second, focusing on practical manifestations including digitalization, intelligent upgrading, green transformation, and industrial integration, studies identify how new technologies, new models, and new forms of business expand the boundaries of agricultural production [6]. Third, given agriculture’s biological nature and regional heterogeneity, scholars stress that the application of new technologies and new factors needs to match farmers’ capabilities, local production conditions, and actual production needs to effectively translate into productive capacity [7]. Overall, although existing studies differ in the specific attributes they emphasize, they consistently regard technological progress and the reconfiguration of production factors as the core drivers behind the emergence of agricultural new-quality productive forces.
Building on these conceptualizations, existing measurement studies have generally followed two approaches. The first is a development-characteristics-based approach, which selects indicators based on observable dimensions such as scientific and technological innovation, digital intelligence, green and low-carbon development, and integrated development [8]. While this approach effectively captures emerging technologies, new business forms, and new development models arising from agricultural transformation, it is susceptible to overlap across dimensions and to an excessive extension of policy-oriented indicators. The second adopts the three-element framework of productive forces, taking laborers, means of production, and objects of labor as the basic analytical structure and reassigning dispersed new-quality characteristics to the fundamental elements of the agricultural production process [9,10]. By constraining indicator classification within the basic structure of productive forces, this approach strengthens theoretical consistency and intertemporal comparability; however, the correspondence between the three elements and specific indicators still requires further clarification.
Regarding comprehensive evaluation, objective weighting methods such as the entropy method and entropy-weighted TOPSIS have been widely applied [11], as they mitigate the influence of subjective weighting while enhancing comparability across provinces and years. However, objective weighting addresses only the technical issue of assigning indicator weights and cannot substitute for the theoretically grounded framework in defining indicator boundaries. Differences across studies in conceptual definitions, indicator composition, weighting schemes, and sample periods may also affect assessments of interprovincial rankings and regional disparities. Therefore, robust measurement requires balancing adequate representation of new-quality attributes, theoretical consistency in indicator classification, and consistency in long-term comparisons.
2.2. Regional Disparities and Dynamic Evolution of Agricultural New-Quality Productive Forces
Existing studies generally agree that China’s agricultural new-quality productive forces have continued to improve, although assessments of regional rankings and the degree of regional catch-up remain somewhat inconsistent. Cao et al. [12] found that the eastern region generally maintains a leading position. Under a four-region classification, Huang et al. [13] identified a gradient of “Eastern China > Central China > Northeast China > Western China.” When the country is further divided into seven regions, North China, East China, and Central China generally exhibit relatively high levels, whereas Southwest China and South China lag behind [14]. Although the specific rankings vary with regional classification schemes and research specifications, existing studies consistently reveal a pronounced regional gradient in agricultural new-quality productive forces. Regional rankings alone, however, are insufficient to uncover the structure of these disparities and how they evolve.
Existing studies have yet to reach a consensus on the evolution of regional disparities. One strand of research finds that overall disparities are narrowing and exhibit a certain degree of regional convergence [15], whereas another strand of research reports widening regional disparities, with inter-regional gaps remaining an important source of overall inequality [16]. These divergent findings suggest that the growth of agricultural new-quality productive forces does not follow a single convergence path. Rather, rising overall levels may coexist with catch-up in some regions, persistent regional gradients, and renewed differentiation among high-level regions. Short sample periods, coarse regional classifications, and comparisons based solely on regional averages make it difficult to disentangle these distinct evolutionary processes.
As research has advanced, regional analysis has gradually expanded from mean-based rankings to the structure of disparities, distributional patterns, and spatial configurations. Jin and Qi [17] employed the Dagum Gini coefficient and kernel density estimation to examine the structural sources of overall disparities and their dynamic distribution. Gao et al. [18] likewise found that provincial development states exhibit strong persistence while generally evolving toward higher levels. Similar patterns of spatial disparity and agglomeration have also been documented in studies of high-quality agricultural development [19]. Accordingly, regional unevenness is no longer confined to static differences in development levels across regions; the dynamic evolution of disparity structures, distributional restructuring, and spatial agglomeration has become an important extension of this research field.
Building on this line of research, research in related fields has further shifted its focus from distributional evolution to hierarchical progression. Traditional Markov chains identify state persistence and transition directions, whereas spatial Markov chains extend the analysis by examining how neighborhood environments affect conditional transition probabilities. Agricultural green total factor productivity, high-quality agricultural and rural development, and fishery industry chain modernization all exhibit strong state persistence in their level transitions [20], with transitions occurring mainly between adjacent levels and cross-level movements remaining relatively limited [21,22]. Spatial Markov analyses further show that, for the same initial level, transition probabilities vary with the neighborhood environment, which may either reinforce the existing state or alter the likelihood of upgrading or downgrading [23]. Accordingly, the understanding of regional dynamic evolution has extended from state persistence to conditional transitions under spatial dependence, revealing pronounced path dependence and spatial embeddedness in the evolution of development level.
2.3. Literature Review and Research Gaps
In summary, existing studies have established a basic research trajectory from theoretical interpretation and comprehensive measurement to regional disparities and spatial relationships, laying an important foundation for understanding the regional pattern of China’s agricultural new-quality productive forces. Nevertheless, three aspects warrant further investigation. First, the measurement framework remains insufficiently unified. Although existing indicator systems extensively incorporate new-quality attributes such as digitalization, green transformation, technological innovation, and industrial upgrading, the criteria for indicator selection and classification vary across studies. The theoretical correspondence between these indicators and the three elements of productive forces also requires further clarification, while the specific characteristics of agricultural production are not consistently reflected. Second, the long-term evolutionary process remains underexplored. Most existing studies focus on the past decade or so and frequently adopt relatively coarse regional classifications, such as Eastern, Central, and Western China. Such approaches are susceptible to short-term fluctuations and make it difficult to assess the persistence of regional catch-up, divergence, and local polarization. Third, the link between level transitions and neighborhood conditions remains insufficiently examined. Existing studies have identified state stability and level mobility in agricultural new-quality productive forces, but systematic evidence is still lacking on how transition probabilities vary across neighborhood environments for provinces starting from the same initial state, and on whether such spatial conditional relationships remain distinct from the common long-term upward trend. Therefore, under a unified measurement framework, it is necessary to draw on long-term provincial data and a more refined regional classification to systematically examine the sources of disparities, distributional evolution, and level transitions, thereby providing a more comprehensive understanding of the long-term uneven evolution underlying the overall improvement of agricultural new-quality productive forces.
3. Materials and Methods
3.1. Data Source
This study adopts panel data from 31 provincial-level administrative regions of China (excluding Hong Kong, Macao, and Taiwan) spanning 2001 to 2023. The data are primarily sourced from the China Statistical Yearbook, China Rural Statistical Yearbook, China Science and Technology Statistical Yearbook, and provincial statistical yearbooks. Missing observations are handled according to their location and continuity within the series. Isolated missing values within a time series are imputed using linear interpolation, while missing values at the endpoints are estimated through trend extrapolation. For the few province–indicator series that were entirely missing throughout the study period, missing values were imputed using inverse-distance weighting based on the five nearest neighbors identified by long-term cross-provincial similarity. This imputation scheme was selected after leave-one-province-out cross-validation and comparison with alternative methods. After data processing, the 39 indicators for 31 provinces over 2001–2023 form a complete panel comprising 713 province–year observations (Tables S1 and S13).
3.2. Construction and Description of the Indicator System
Based on the theory of the three elements of productive forces, this study constructs an evaluation system for agricultural new-quality productive forces along three dimensions: new-quality agricultural laborers, new-quality agricultural means of production, and new-quality agricultural objects of labor. These dimensions respectively capture the agents capable of applying advanced production methods, the conditions that enable their realization, and the transformation of resources into value. Based on their functional roles in the agricultural production process, indicators that directly reflect production agents’ knowledge, skills, and managerial capabilities are classified under laborers; equipment and facilities, technological capital, risk protection, and digital information conditions that support production activities are classified under means of labor; and indicators capturing the allocation and utilization of agricultural resources and products, input transformation, value realization, and sustainable development are classified under objects of labor. The three dimensions are interconnected through the production logic whereby “laborers act upon objects of labor by means of production.” Accordingly, the evaluation system comprises 10 secondary indicators and 39 tertiary indicators, as detailed in Table 1.
Table 1.
Evaluation indicator system for agricultural new-quality productive forces.
The dimension of new-quality agricultural laborers focuses on production agents’ capacity to engage with advanced modes of production. Knowledge and skills determine laborers’ ability to identify, absorb, and apply new technologies and knowledge; income levels reflect the realization of labor value and the capacity for sustained investment; and participation in modern business entities captures the extent to which laborers shift from dispersed, experience-based production toward specialized division of labor and organized management in modern agriculture. Technology adoption is also constrained by economic incentives, including expected returns and adoption costs [24]. Accordingly, this dimension comprehensively reflects improvements in agricultural laborers’ human capital, value realization, and participation in modern agricultural operations.
The dimension of new-quality agricultural means of production focuses on the supporting conditions required to translate advanced modes of production into actual productive capacity. Modern equipment and agricultural infrastructure provide the basic material foundation, while technology, capital, risk protection, and information networks further expand the functional capacity of the means of labor. Specifically, agricultural credit and insurance reflect the availability of production capital and risk-sharing capacity, respectively; technology transactions indicate the accessibility of technological achievements for application in actual production; and digital infrastructure, such as the Internet and fiber-optic networks, provides the conditions for information access, production decision-making, and market connectivity. These transform the means of production from stand-alone production tools into an integrated support system that connects technology, capital, information, and agricultural production processes [25,26]. This transformation, in turn, enhances both the accessibility and effective utilization of advanced modes of production.
The dimension of new-quality agricultural objects of labor focuses on the productive performance and value-creation potential generated through the development and utilization of agricultural resources and products. Indicators such as agricultural labor productivity, total factor productivity, capital output ratio, and land productivity capture the efficiency with which resources and related inputs are transformed into effective outputs. Agricultural product trade competitiveness and agro-processing-related indicators reflect the extent of product value realization and industrial chain extension, while green production indicators capture the environmental constraints associated with resource utilization [27]. Indicators such as land transfer, cooperatives, and family farms further reflect the organizational configuration of land use and agricultural production and management. Accordingly, this dimension captures the extent to which agricultural objects of labor are transformed from basic production resources and outputs into carriers of multidimensional value through the combined processes of resource allocation, productive efficiency, value creation, and sustainable utilization.
3.3. Research Methods
To systematically characterize the uneven development of agricultural new-quality productive forces and their evolutionary dynamics, this study conducts analysis from four dimensions: development level measurement, disparity structure decomposition, distributional dynamics, and level transitions. Accordingly, the entropy method, the Dagum Gini coefficient and its decomposition, kernel density estimation, and traditional and spatial Markov chains are jointly employed. The specific methods are described as follows.
3.3.1. The Entropy Method
To ensure transparency, repeatability, dynamic comparability, and objectivity in the evaluation process, the entropy method is employed to assess the development level of agricultural new quality productive forces. This method’s advantage lies in its ability to mitigate the influence of subjective biases, allowing for an objective and precise reflection of the significance of each evaluation indicator. The specific calculation steps are as follows:
The initial step involves data standardization. The standardization formula for positive indicators is presented in Equation (1):
The standardization formula for negative indicators is formulated as:
where is the original value of indicator j for province i in year t, and is its standardized value. xj,min and xj,max denote the minimum and maximum of indicator j across all province-year observations.
The second step requires calculating the entropy for each indicator, as shown in Equation (3).
In Equation (3), is the share of observation (i,t) in indicator j; N = 31 and T = 23 denote the number of provinces and years, respectively.
The third step is to determine the weight wj of each indicator. Its formula is
In Equation (4), ej is its information entropy, and J = 39 is the total number of indicators.
The fourth step is the calculation of the comprehensive score for each province. It is formulated as:
The independent index, after re-normalizing fixed entropy weights within the first-level dimension, can be expressed as:
Here, g represents new-quality agricultural laborers, new-quality agricultural labor materials, and new-quality agricultural labor objects.
3.3.2. Dagum Gini Coefficient Decomposition
In this study, Dagum’s Gini coefficient decomposition method is employed to examine the spatial differentiation of agricultural new quality productive forces in different regions of China. Compared with the traditional Gini coefficient, the Dagum Gini coefficient can effectively decompose total differences into intra-regional differences, inter-regional differences, contribution rates of differences, and their sources:
In Equation (7), Gt represents the total difference; K is the number of regions; j and h represent any region; i and r represent any province; is the agricultural new quality productive forces of a province in region j; represents the agricultural new quality productive forces of a province in region h; n represents the number of provinces; and represents the average level of agricultural new quality productive forces.
In Equation (8), represents the Gini coefficient of region j.
In Equation (9), represents the intra-regional difference, , .
Here, represents the inter-regional Gini coefficient.
where represents the contribution of inter-regional differences, also known as inter-regional net worth differences, and is Dagum’s relative economic influence coefficient between regions j and h.
In Equation (12), represents the intensity of transvariation.
In Equation (13), Gt represents the total difference.
3.3.3. Kernel Density Estimation
Kernel density estimation is a non-parametric estimation method that can convert random variables into continuous density curves for measurement. Its results exhibit a certain degree of stability, and using kernel density estimation can reflect the position distribution, shape distribution, peak shape, and distribution extensibility of random variables, where is the estimated density at x in year t; nt is the annual sample size; h is the bandwidth; and K(⋅) is the Gaussian kernel function.
The annual candidate bandwidth uses the robust Silverman rule:
where h is the common bandwidth defined as the median of the annual candidate bandwidths over 2001–2023, thereby improving intertemporal comparability (Table S4). Pointwise 95% confidence bands for representative years are obtained from 1000 bootstrap replications.
h = median(h2001, h2002, …, h2023)
3.3.4. Traditional and Spatial Markov Chains
An N × N Markov transition probability matrix is built to describe the transition probability of agricultural new quality productive forces. The specific formula is
where denotes the state of province i in year t; nab is the number of observed transitions from state a to state b, and na is the total number of transitions originating from state a. The four states are defined using the fixed full-sample quartiles Q1, Q2 and Q3 calculated from all 713 province–year observations.
where is the spatial-lag index of province i, wij is the row-standardized first-order contiguity weight, and is the index of neighboring province j. is classified into four neighborhood states using the same fixed Q1, Q2, and Q3 thresholds.
where is the probability of transition from state a to state b, conditional on neighborhood state c; and denotes the neighborhood state of province i.
Spatial conditional differences are assessed using Pearson’s χ2 statistic with 5000 province-trajectory permutations, while neighborhood-gradient confidence intervals and two-sided p-values are obtained from 5000 province-cluster bootstrap replications.
4. Results
4.1. Measurement of Development Levels and Regional Gradient Characteristics
4.1.1. National and Regional Evolution
From 2001 to 2023, the overall development level of China’s agricultural new-quality productive forces increased steadily, although the growth rate exhibited stage-specific fluctuations (Figure 1 and Table S2). The national composite index increased from 0.0363 in 2001 to 0.1946 in 2023, representing a cumulative increase of 436.41% and a compound annual growth rate of 7.93%. In terms of annual growth, the rate peaked at 12.89% in 2008 and reached another high of 12.54% in 2010. Fluctuations intensified after 2018, declining to 4.69% in 2019 before rebounding to 12.65% in 2020, the second-highest rate over the sample period. Although the composite index continued to increase from 2021 to 2023, its annual growth rate was generally moderate. These stage-specific changes broadly coincided in timing with the continued advancement of policies supporting agricultural modernization. In 2010, the central government further increased fiscal support for agricultural machinery purchase subsidies. This was followed by the Rural Revitalization Strategic Plan (2018–2022), which provided a systematic framework for agricultural and rural modernization, and the Digital Agriculture and Rural Development Plan (2019–2025), which further promoted the digitalization of agricultural production and operations and the intelligent transformation of management and service provision.
Figure 1.
Annual trend in China’s agricultural new-quality productive forces index and its growth rate, 2001–2023.
Following China’s seven-region geographical classification, the 31 provinces were grouped into North China, Northeast China, East China, Central China, South China, Southwest China, and Northwest China. The results show that the development levels of all seven regions increased over the study period (Table 2; Figure 2), with mean values ranked as East China > North China > Northeast China > Central China > South China > Northwest China > Southwest China, ranging from 0.0766 to 0.1209. Further consideration of compound annual growth rates and changes in regional rankings reveals four distinct development trajectories. First, East China followed a leading-and-strengthening trajectory. It surpassed North China in 2005 and, with a CAGR of 8.67%, achieved the highest long-term mean, continuously strengthening its lead. Second, North China and Northeast China exhibited a high-level and steady-growth trajectory. Their long-term means ranked second and third, respectively, but their CAGRs were only 7.09% and 7.19%, lower than those of most middle- and lower-ranked regions. Northeast China fell to fourth place by the end of the study period, indicating that both regions maintained steady improvement primarily on the basis of relatively high initial levels rather than rapid expansion. Third, Central China, South China, and Southwest China displayed a middle- and low-level catch-up trajectory, with Central China being the most representative. Although their long-term mean levels were relatively low, their CAGRs reached 8.27%, 7.83%, and 7.89%, respectively. Central China improved its ranking, whereas the positions of South China and Southwest China remained broadly stable, indicating sustained improvement within the existing regional hierarchy. Fourth, Northwest China followed a fluctuating-growth trajectory. Despite a relatively low long-term mean of 0.0801, it recorded a CAGR of 8.01%, indicating relatively strong growth momentum. However, its annual development level fluctuated markedly. It briefly rose to third place in 2018, subsequently declined, and then resumed growth, reflecting pronounced stage-specific variation. Overall, the seven regions exhibited a differentiated pattern characterized by a strengthening advantage in the leading region, steady advancement in high-level regions, gradual improvement in middle- and lower-level regions, and pronounced stage-specific fluctuations in certain regions.
Table 2.
Measurement results of the agricultural new-quality productive forces index across Chinese provinces, 2001–2023.
Figure 2.
Annual trends in the agricultural new-quality productive forces index across China’s seven geographic regions, 2001–2023.
4.1.2. Dimensional Structure and Regional Characteristics
Overall, the three dimensions were ranked during the study period as new-quality agricultural laborers > objects of labor > means of labor, while their CAGRs were 8.97%, 7.57%, and 8.12%, respectively (Table 3). The laborer dimension combined a relatively high existing level with rapid growth, thereby remaining the leading component of agricultural new-quality productive forces at the current stage. By contrast, the means of labor exhibited a more pronounced catch-up trend. Taken together, these patterns reveal a dimensional evolution characterized by the continued leadership of laborers, accelerated improvement in the means of labor, and steady progress in the objects of labor.
Table 3.
Development levels and growth rates of the three dimensions of agricultural new-quality productive forces, 2001–2023.
Regionally, East China’s advantage is concentrated in the new-quality agricultural means of labor and objects of labor, both of which rank first among the seven regions in terms of long-term mean values, whereas its laborers dimension ranks only fifth. This structure is consistent with East China’s relatively strong regional foundation in the commercialization of agricultural scientific and technological achievements, technology transactions, and agricultural product processing and distribution. Central China, by contrast, exhibits a more pronounced pattern of growth-driven catch-up. Although the long-term means of its laborers and objects of labor dimensions both rank sixth, the CAGRs of laborers and means of labor reach 10.77% and 9.30%, respectively, the highest among the seven regions. This growth profile is broadly consistent with Central China’s strong grain-production function and the continued improvement of agricultural equipment and production conditions. In Northwest China, the mean value of the laborers dimension is 0.2450, ranking first among the seven regions, whereas the mean of the labor dimension ranks last, indicating a clear mismatch across dimensions. In comparison, North China ranks third, second, and third across the three dimensions, respectively, reflecting a relatively balanced structure of factor support.
4.2. Regional Disparity Structure and Evolution
4.2.1. Evolution of Intra-Regional Disparities
Using the aforementioned seven-region geographical grouping, the Dagum decomposition further identifies the sources and structural evolution of overall disparities. From 2001 to 2023, intra-regional disparities in agricultural new-quality productive forces exhibited substantial heterogeneity across the seven regions. Based on the mean Gini coefficients over the sample period, intra-regional inequality ranked as follows: North China (0.1663) > East China (0.1453) > South China (0.1251) > Southwest China (0.0989) > Northwest China (0.0891) > Central China (0.0495) > Northeast China (0.0423), indicating that persistent internal imbalances were concentrated mainly in North China, East China, and South China (Table 4). Further consideration of both disparity levels and their temporal trajectories reveals five distinct evolutionary patterns (Figure 3). First, North China and East China followed a high-level convergence-then-divergence pattern. Their disparities were initially high, declining to 0.126 in 2016 and 0.114 in 2017, respectively, before widening again to 0.199 and 0.181 by 2023. The combination of relatively high long-term means and renewed expansion in the later period indicates that intraregional disparities in both regions were highly persistent. Second, South China and Northeast China exhibited a low-level stability-then-expansion pattern, with relatively limited internal disparities during the earlier period. In South China, the Gini coefficient remained around 0.09–0.12 for an extended period, but differences among provinces in agricultural production structures and the extent of value-chain extension contributed to a widening of inter-provincial disparities to 0.204 in the later period. In Northeast China, the coefficient declined from 0.032 in 2001 to 0.008 in 2014 and then gradually increased to 0.083 by 2023. Despite the marked increase, the absolute level of disparity remained relatively limited. Third, Central China followed a stage-specific expansion-then-convergence pattern. Its Gini coefficient reached a temporary peak of 0.102 in 2016 and subsequently declined to 0.063 by 2023, resulting in an overall inverted-V trajectory. Fourth, Northwest China displayed a highly volatile pattern. Its Gini coefficient surged to 0.186 in 2008 and thereafter adjusted through relatively large fluctuations, ending at 0.094. Fifth, Southwest China exhibited a convergence-dominated pattern with stage-specific fluctuations. Its intra-regional disparity rose to a temporary peak of 0.131 in 2008, then narrowed continuously to 0.0593 in 2017, before increasing again to 0.0971 in 2021 and subsequently declining to 0.0755 in 2023. This produced a stage-specific pattern of “fluctuating convergence–renewed expansion–reconvergence.” Over the longer term, the end-period disparity remained below its initial level, indicating an overall narrowing of internal differences. Overall, intra-regional disparities across the seven regions evolved through a combination of renewed divergence from high levels, expansion from low levels, stage-specific convergence, pronounced volatility, and multi-stage alternating adjustments.
Table 4.
Gini coefficients of regional differences in agricultural new-quality productive forces across China’s seven geographic regions, 2001–2023.
Figure 3.
Trends in the Gini coefficients of regional differences in agricultural new-quality productive forces across China’s seven geographic regions, 2001–2023.
4.2.2. Sources and Structural Shifts in Overall Regional Disparities
Regarding the overall disparities and their composition, the uneven development of agricultural new-quality productive forces in China exhibits a clear structure characterized by the dominance of inter-regional disparities, followed by transvariation density, with intra-regional disparities remaining relatively stable (Table 5 and Table S3). From 2001 to 2023, the overall Gini coefficient averaged 0.1634 and ended the period 19.24% above its initial level. Its evolution followed a non-linear expansion pattern: disparities widened slightly from 2001 to 2008, then narrowed cumulatively by approximately 26.94% through 2018, before rebounding rapidly by about 47.87% from 2018 to 2023. This produced a stage-specific trajectory of fluctuating expansion in the early period, convergence in the middle period, and renewed widening in the later period (Figure 4). Further decomposition shows that the period-average values of inter-regional disparities, transvariation density, and intra-regional disparities were 0.1011, 0.0421 and 0.0202, respectively, with corresponding average contribution rates of 61.74%, 25.90%, and 12.36%. Inter-regional disparities were approximately 2.4 times the transvariation density and five times the intra-regional component, serving as the predominant source of overall inequality over the long term (Figure 5). The relative weights of the three components also underwent marked stage-specific adjustments. In 2008, the contribution of inter-regional disparities fell to 54.58%, while that of transvariation density rose to 32.22%, substantially narrowing the gap between the two; however, the corresponding shares quickly returned to 67.46% and 20.64% in 2009, indicating a short-lived structural deviation. A more sustained restructuring occurred from 2011 to 2021, when the contribution of inter-regional disparities declined to 53.11%, and that of transvariation density increased to 34.07%, narrowing the gap from 47.59 to 19.04 percentage points. This indicates a weakening of the relative dominance of inter-regional disparities and a simultaneous rise in the relative contribution of cross-regional provincial overlap. After 2021, the contribution of inter-regional disparities rebounded to 63.01%, while that of transvariation density fell to 24.47%, indicating a renewed strengthening of the regional development gradient. The contribution of intra-regional disparities remained within 11–13% throughout the study period, exhibiting the most stable component.
Table 5.
Dagum Gini decomposition of regional differences in agricultural new-quality productive forces, 2001–2023.
Figure 4.
Overall regional differences in agricultural new-quality productive forces and their Dagum Gini decomposition, 2001–2023.
Figure 5.
Overall contribution rate of Gini coefficient decomposition from 2001 to 2023.
4.3. Distributional Evolution and Regional Differentiation
To reduce the influence of random fluctuations in a finite cross-sectional sample on peak identification, the study assesses distributional patterns in conjunction with 95% bootstrap confidence bands for representative years (Figure S1). Consistent with the upward trend of the composite index described above, the main body of the national kernel density curve shifted continuously toward higher values from 2001 to 2023, with the pace of this rightward movement accelerating after 2017 (Figure 6). In terms of distributional shape, the height of the main peak declined in a stepwise manner, with several short-term rebounds, while the distribution became progressively wider. This indicates that the concentration of provinces at relatively low levels in the early period gradually gave way to a wider dispersion across a broader development range. After 2019, the extent of this widening became more pronounced, which is consistent with the renewed increase in the overall Dagum Gini coefficient in the later period. In terms of tail extension, the upper tail continued to lengthen, indicating that high-level provinces steadily pushed the upper bound of the overall distribution upward. In terms of peak configuration, the early stage was dominated by a single main peak, with only weak fluctuations on the high-value side. In 2008, the distinction between the main peak and the local side peak became more distinct. From 2010 to 2014, local peaks on the high-value side appeared persistently, and after 2019, the peak structure became more complex, characterized by the coexistence of multiple local peaks at the high-value end and a pronounced long-tail extension.
Figure 6.
Kernel density distributions of agricultural new-quality productive forces in China and its seven geographic regions, 2001–2023. Note: The color gradient is used to distinguish the density curves across different years.
At the regional level, East China exhibited a fluctuating trajectory in main-peak height characterized by an initial decline, a temporary rebound, and a subsequent rapid decrease. After 2017, the distribution widened markedly, accompanied by a more pronounced upper tail and increasingly multilayered peak structures, indicating the coexistence of provinces across multiple development intervals. High-level provinces played a particularly important role in extending the upper end of the regional distribution, consistent with the renewed widening of East China’s intra-regional Gini coefficient in the later period. North China experienced a relatively stable overall shift, but a persistent upper tail and bimodal distribution emerged after 2012, while the distribution width expanded substantially after 2019. This sustained differentiation may be partly attributable to Beijing’s increase from 0.2213 in 2018 to 0.3722 in 2023, whereas the other provinces remained concentrated within relatively lower ranges. Middle- and lower-level regions were characterized more prominently by inter-peak stratification and persistence at the lower end. South China gradually shifted from a concentrated unimodal distribution in the early period to a set of increasingly separated peaks, with expansion toward the high-value side accelerating markedly after 2018. Guangdong’s faster upward movement relative to Guangxi and Hainan was an important source of the widening distance between peaks. Northwest China exhibited more pronounced stage-specific fluctuations, with peak height showing repeated V-shaped rebounds. In 2008, the distribution temporarily widened, and a high-value side peak emerged, corresponding to Ningxia’s temporary upward shift in that year; the distribution then rapidly reconcentrated in the following year. After 2017, a low-value side peak persisted, producing a distributional pattern in which an overall upward shift coexisted with the continued retention of a low-value cluster. Northeast China displayed a stronger pattern of non-monotonic adjustment. Its main-peak height fluctuated in a pronounced sawtooth pattern, while the internal distribution underwent a sequence of high concentration, substantial dispersion, temporary reconcentration around the main peak, and subsequently sustained widening with multiple coexisting peaks. Peak height and distribution width therefore exhibited marked alternating adjustments.
4.4. Level Transitions and Spatial Neighborhood Conditionality
4.4.1. State Persistence and Conditional Transitions
Using fixed quartile thresholds derived from all 713 province–year observations in the full sample, agricultural new-quality productive forces were classified into four levels: low, lower-middle, upper-middle, and high, which are denoted by I, II, III, and IV, respectively. A transition from a lower to a higher level was defined as an upward transition, whereas movement in the opposite direction was defined as a downward transition. The three thresholds were 0.0468, 0.0784, and 0.1280. On this basis, a traditional Markov transition matrix was constructed, yielding 682 transition observations. The results show that the diagonal transition probabilities for all four states are substantially higher than the off-diagonal probabilities, indicating strong persistence in provincial development levels across adjacent years, with the high-level state exhibiting the greatest persistence (Table 6 and Table S5). Off-diagonal transitions occur predominantly between adjacent states, and upward transitions are markedly more frequent than downward transitions. The probabilities of moving upward by one level from the low, lower-middle, and upper-middle states are 14.04%, 18.44%, and 16.67%, respectively, whereas the probabilities of moving downward by one level from the upper-middle and high states are below 1.5%. The probabilities of upward or downward transitions across more than one level are also only about 0.56%. These results indicate that provincial agricultural new-quality productive forces generally followed a gradual upward trajectory during the sample period, while leapfrogging across levels within a short period remained rare. This persistence in development states is consistent with the localized stratification identified by the kernel density analysis: although the overall distribution shifted upward, mobility at both the upper and lower ends of the distribution remained limited.
Table 6.
Traditional Markov chain transition matrix.
After incorporating spatial neighborhood states, the permutation-based p-value for the overall test of spatial independence is 0.0006, indicating a significant conditional association between the development state in the subsequent period and the neighborhood state. Specifically (Table 7 and Table S6), under a low-level neighborhood, the probability that a Level I province remains in the same state is 89.74%, higher than the corresponding 85.39% in the traditional Markov matrix, suggesting that a low-level neighborhood tends to reinforce low-level lock-in. When the neighborhood state rises to Level II, the probability of an upward transition for Level I provinces increases from 10.26% to 45.45%, also exceeding the 14.6% upward-transition probability in the traditional matrix. For Level II provinces, the probability of moving to Level III is 14.84% under a Level II neighborhood and rises to 56.00% under a Level III neighborhood. For Level III provinces, the probability of transitioning to Level IV increases successively from 6.45% to 17.76% and 22.86% as the neighborhood state rises from Levels II and III to Level IV. These results indicate a relatively clear positive gradient between neighborhood development levels and the subsequent states of low- and middle-level provinces. By contrast, the probabilities that Level IV provinces remain in the high-level state are 97.30% and 99.12% under Level III and Level IV neighborhoods, respectively, indicating a much weaker neighborhood gradient. Overall, under the fixed full-sample thresholds, the evolution of agricultural new-quality productive forces displays a distinct “initial rank × neighborhood state” conditionality: low- and middle-level provinces are more strongly associated with their surrounding development environment, whereas high-level provinces are characterized primarily by high state persistence. This pattern is also broadly consistent with the recent policy context of strengthening agricultural technology services, factor allocation, and regional coordination.
Table 7.
Spatial Markov chain transition matrix.
4.4.2. Statistical Reliability of Spatial Conditional Associations
To assess the statistical reliability of the conditional transition differences identified by the spatial Markov analysis, this study employs a province-level complete-trajectory permutation test and a province-clustered bootstrap procedure. The overall test of spatial independence is statistically significant (χ2 = 230.518, df = 14, p = 0.0006), indicating a significant conditional association between neighborhood states and rankings in the subsequent period after controlling for initial states. By initial state, the neighborhood gradients for Levels I–III are all significantly positive, with those for Levels I and II significant at the 1% level and that for Level III significant at the 5% level, whereas the gradient for Level IV is not statistically significant. Thus, under the fixed full-sample threshold specification, the spatial conditional association is concentrated mainly among provinces in the low-to-upper-middle states, while high-level provinces are characterized more strongly by persistence in their own development states (Table 8 and Table S7).
Table 8.
Statistical tests of spatial conditional dependence in state transitions.
5. Robustness Checks
5.1. Robustness of Index Measurement
To assess the sensitivity of the measurement of agricultural new-quality productive forces to the weighting structure, normalization method, and temporal coverage of the Taobao Village coverage indicator, this study recalculates the composite index using an equal-weighting scheme, directional percentile-rank normalization, and complete exclusion of the Taobao Village coverage indicator from the full sample, respectively (Table 9, Tables S8 and S9). The overall Spearman correlation coefficients between the equal-weighted and percentile-rank-normalized indices and the baseline index are 0.9612 and 0.9418, respectively, while the corresponding correlations for the national annual trends are 0.9990 and 0.9931; all are significant at the 1% level, indicating that the pooled rank structure across province–year observations and long-term evolutionary trend are generally stable. However, the mean annual inter-provincial Spearman correlation coefficients are 0.7854 and 0.7261, respectively, suggesting that provincial relative rankings in individual years exhibit some sensitivity to the weighting and normalization methods. To address the early-period missing values of Taobao Village coverage, the indicator is completely excluded from the 2001–2023 sample, and the composite index is recalculated using the remaining 38 indicators. The alternative index has an overall Spearman correlation coefficient of 0.9995 with the baseline index and a national annual trend correlation of 1.0000; both are significant at the 1% level. The mean annual inter-provincial Spearman correlation coefficient reaches 0.9944, with the minimum annual value still as high as 0.9625 (Table S15). These results indicate that, after excluding this indicator, both the long-term evolution of agricultural new-quality productive forces and the relative inter-provincial structure remain highly stable.
Table 9.
Robustness tests of index measurement under alternative specifications.
5.2. Robustness to Alternative Regional Classifications
To assess the sensitivity of the Dagum decomposition results to regional classification, this study replaces the benchmark seven-region scheme with the four major economic regions of Eastern, Central, Western, and Northeastern China. Under the alternative classification, the average contribution of inter-regional disparities is 71.02%, and this component remains the largest contributor in all 23 years. This indicates that the conclusion that inter-regional disparities consistently dominate overall inequality is robust to the alternative regional classification (Table S10).
5.3. Robustness of Transition and Neighborhood Results
To systematically assess the sensitivity of the Markov results to key specifications, this study conducts alternative tests along four dimensions: temporal benchmark, state classification, spatial neighborhood specification, and index weighting (Table 10, Table S11, Table S12, Table S14 and Table S16). The results show that state persistence is highly stable across alternative specifications. Under year-specific quartiles, alternative state boundaries, and the equal-weighting specification, the mean diagonal transition probability remains within the range of 0.8345–0.8510. Under equal weighting, 84.60% of transitions remain in the same state, 15.40% occur between adjacent states, and no transitions across two or more levels are observed, indicating that state persistence and gradual mobility do not depend on a particular temporal benchmark, state classification, or weighting structure. By contrast, spatial conditional associations exhibit more pronounced specification sensitivity. Under year-specific quartiles, the neighborhood gradients for Levels I–III are no longer statistically significant, while only Level IV remains significant at the 1% level; nevertheless, the overall spatial independence test remains significant at the 5% level (p = 0.0102). Under alternative state boundaries, only Levels I and II remain significant at the 1% level, whereas under the second-order contiguity matrix, the neighborhood gradients for Levels I–III are all significant at the 1% level. Under the equal-weighting specification, the neighborhood gradients for Levels I–III remain significantly positive and that for Level IV remains insignificant, while the overall spatial independence test is no longer statistically significant (p = 0.7508). Overall, state persistence and transitions between adjacent levels constitute relatively robust dynamic features, whereas the overall statistical strength of spatial conditional associations and the development levels at which they operate are more sensitive to the temporal benchmark, state boundaries, spatial neighborhood specification, and weighting structure.
Table 10.
Robustness tests of Markov transition results.
6. Discussion
6.1. Structural Transformation of Regional Disparities
The stable regional gradients and the dominance of inter-regional disparities identified in this study are consistent with existing research regarding the persistent regional gaps in China’s agricultural productivity [28,29]. North and Northeast China, characterized by contiguous fields and grain production, offer a low barrier-to-entry for large-scale operations involving heavy machinery, precision seeding, and agricultural socialized services. East China further extends its regional advantages into facility agriculture, agro-processing and distribution, and market realization, enabling technological inputs to be applied across a longer segment of the value chain. In contrast, in Southwest China, the hilly terrain, fragmented farmland, and the concentration of specialty crops impose greater requirements for the adaptation of small-scale and specialized equipment as well as supporting processing systems. Meanwhile, Northwest China must reconcile the expansion of mechanization and digital applications with constraints on water resources. Ultimately, the technology-specific boundaries, jointly shaped by production settings, resource constraints, and positions within the agricultural value chain, cause similar types of new-quality factors to exhibit different conversion efficiencies across regions and thereby sustain the long-term regional gradient.
6.2. Cumulative Constraints in Distributional Restructuring
The kernel density and traditional Markov results jointly indicate that the upgrading of agricultural new-quality productive forces is strongly cumulative and gradual, consistent with the state persistence and adjacent-level transition patterns identified in previous studies of agricultural green development [30]. Specifically, intelligent agricultural machinery requires the combined support of suitable land plots, digital control systems, and operation and maintenance capabilities; biological breeding and green agricultural inputs depend on standardized production and effective technology extension systems; and value-added agricultural processing relies on coordination among stable raw-material supply, grading and processing, cold-chain transportation, and market channels. Provinces with relatively robust foundations across these multiple segments are better positioned to simultaneously advance the upgrading of these three elements into a comprehensive competitive advantage and sustain a high-level status, whereas provinces with gaps in supporting segments primarily achieve transitions to adjacent levels by addressing these deficiencies one by one.
6.3. Stage-Specific Differences in Neighborhood Conditional Associations
Existing studies have shown that rural human capital and agricultural green total factor productivity can generate spatial spillovers through cross-regional channels such as knowledge diffusion and technology diffusion [31,32]. The study further shows that the spatial conditional associations of agricultural new-quality productive forces reflect the combined effects of common growth and localized spatial transmission. Under the fixed-threshold specification, the expansion of agricultural science and technology provision, improvements in farmland and digital infrastructure, and policy support for agriculture exhibit strong cross-regional synchronization, causing local and neighboring development levels to rise simultaneously and closely coupling level transitions with temporal evolution. After the common trend is removed through annual-quartile classification, the positive neighborhood gradients for Levels I–III are no longer significant, indicating that the previously observed spatial associations among low- and middle-level provinces contain a substantial common-growth component. At the same time, the neighborhood gradient for Level IV becomes statistically significant, suggesting that the maintenance and adjustment of high-level provinces in relative rankings depend more on regionally selective agricultural technology diffusion, coordination in agricultural producer services, and linkages within agricultural production and marketing networks. The resulting spatial pattern therefore exhibits stronger heterogeneity across development levels.
6.4. Research Limitations and Future Directions
This study identifies the long-term distributional and level evolution of agricultural new-quality productive forces based on provincial-level composite indices. However, the provincial scale cannot fully capture micro-level interactions among heterogeneous agricultural operators; therefore, the discussions of production–system compatibility, cumulative effects of existing foundations, and shifts in neighborhood relationships remain mechanism-based inferences. Moreover, a geographic contiguity matrix cannot fully represent the actual spatial relationships formed through industrial linkages, technology flows, and functional coordination, while the limited number of observations for certain neighborhood combinations may also affect the stability of conditional transition probabilities.
Future research could move beyond identifying provincial-level patterns toward multiscale analyses of underlying mechanisms. City-, county-, and operator-level data could enable a more direct examination of the formation process of agricultural new-quality productive forces, while functional proximity networks based on production linkages and factor flows could better capture inter-regional relationships. Combining such data with dynamic spatial models and causal identification strategies would allow the mechanisms proposed above to be tested directly and improve the comparability and consistency of findings across multiple spatial scales.
7. Conclusions and Recommendations
7.1. Research Conclusions
The main findings of this study are as follows: (1) China’s agricultural new-quality productive forces have continued to improve, while the regional development gradient has remained relatively stable. All seven regions exhibit an upward trend, with leading regions such as East China maintaining their advantages. Although middle- and lower-level regions are catching up, changes in the overall regional hierarchy remain limited. The three constituent elements of productive forces also differ in their rates of improvement, indicating structural differentiation within the overall growth. (2) The spatial inequality of agricultural new-quality productive forces is characterized by strong persistence alongside distinct stage-specific restructuring. Inter-regional disparity remains the primary source of overall inequality; fluctuations in the relative contributions of this disparity and transvariation density drive the overall gap to contract or expand across different periods. Meanwhile, the intra-regional provincial distributions continue to shift toward higher values while gradually widening, with more pronounced upper-tail extension and localized stratification. Consequently, changes in overall disparities mainly reflect structural adjustments occurring within an established regional development gradient. (3) The upgrading of agricultural new-quality productive forces exhibits distinct path persistence and spatial conditionality. Provincial state transitions are dominated by persistence in the original state and movements between adjacent levels, while short-term leapfrogging across multiple levels remains rare. Spatial conditional associations, however, show pronounced heterogeneity across development levels and sensitivity to alternative specifications: under the fixed-threshold specification, they are concentrated mainly among Levels I–III, whereas after controlling for the common time trend, they manifest primarily at Level IV. Under alternative state boundaries, the significant associations narrow to Levels I–II, whereas after expanding the spatial neighborhood and adopting an equal-weighting scheme, Levels I–III remain significant while Level IV remains insignificant. Across different specifications, the results consistently indicate that transition probabilities are jointly shaped by the local initial level and the type of spatial neighborhood. This pattern is consistent with China’s current strategic emphasis on strengthening regional coordination in agriculture and rural development and promoting cross-regional factor linkages, further underscoring the importance of shifting from isolated local upgrading toward the cultivation of regional synergy.
7.2. Policy Recommendations
Based on the findings, this study proposes the following policy recommendations:
- (1)
- Strengthen the diffusion of advantages and coordinated upgrading within high-performing regions. Regional policy should shift from reinforcing the isolated advantages of core provinces toward improving intra-regional coordination in technology diffusion, achievement commercialization, and agricultural production services, so that the innovative capacity of leading areas can be more effectively translated into productive gains in surrounding provinces. Cross-provincial mechanisms for technology commercialization and industrial collaboration can be established by leveraging research platforms, agricultural production service systems, and market networks. In East China, for example, Shanghai and Zhejiang can leverage their strengths in research and markets to jointly develop agricultural technology commercialization and production service platforms with relatively lagging provinces in the region, thereby better aligning technology supply with agricultural production scenarios.
- (2)
- Promote gradual upgrading in lagging regions through appropriate technologies and stronger local absorptive capacity. Development priorities in lower-level regions should shift toward improving the alignment of mature technologies with local production conditions, while simultaneously strengthening production organization, technical services, and market linkages. In hilly and mountainous areas such as Guangxi and Guizhou, for example, policy efforts should prioritize the promotion of appropriately scaled small agricultural machinery and agricultural socialized services. Fiscal support for agriculture and technology extension can be allocated in stages following a sequence of “demonstration and application-scaled diffusion-efficiency enhancement,” with sustained adoption and actual efficiency gains serving as criteria for subsequent support. This approach can reduce the erosion of policy effectiveness caused by one-off investments and redundant construction.
- (3)
- Improve the benefit-sharing and coordination mechanisms for cross-regional agricultural cooperation. For the benefits and costs arising from the cross-provincial flow of new-quality agricultural factors, stable mechanisms for benefit distribution, cost sharing, and performance evaluation should be established to enhance the sustainability of regional cooperation. For closely connected interprovincial agricultural functional zones, cross-regional cooperation agreements, benefit-sharing arrangements, and coordinated performance assessments can be used to incorporate the application of technological achievements, value added along agricultural value chains, and spillovers from public services into joint benefit-sharing frameworks. In regions where high-level areas exert strong resource-attraction effects, greater coordination is needed in the cross-regional allocation of talent, capital, and innovation resources to mitigate the crowding-out effects of continued resource concentration in core areas on the development space of neighboring regions, thereby fostering a cooperative relationship that balances the agglomeration of regional advantages with broader regional sharing.
- (4)
- Establish a dynamic monitoring and policy adjustment mechanism aligned with level evolution. The development level, transition direction, and changes in regional disparities of agricultural new-quality productive forces should be incorporated into routine monitoring, with policy priorities adjusted promptly according to each region’s stage of development.
Supplementary Materials
The following supporting information can be downloaded at: https://www.mdpi.com/article/10.3390/su181910235/s1, Figure S1: Kernel Density Estimates with 95% Bootstrap Confidence Bands for China and Regions in Representative Years; Tables S1–S16: Table S1: Entropy-Weight, Data-Quality, and Imputation Diagnostics; Table S2: Comprehensive Index of Agricultural New-Quality Productive Forces in 31 Provinces from 2001 to 2023 Using the Entropy Method; Table S3: Complete Dagum Gini Coefficient, Decomposition, and Regional Gini Results, 2001–2023; Table S4: Common Bandwidths and Annual Sample Sizes for Kernel Density Estimation; Table S5: Transition Counts and Province-Cluster-Bootstrap Confidence Intervals for the Traditional Markov Chain; Table S6: Conditional Transition Counts and Province-Cluster-Bootstrap Confidence Intervals for the Spatial Markov Chain; Table S7: Statistical Inference for Spatial Markov Transitions and W1 Diagnostics; Table S8: Detailed Robustness Results under Equal Weighting; Table S9: Detailed Robustness Results under Alternative Normalization; Table S10: Complete Dagum Decomposition under the Four-Region Classification; Table S11: Complete Robustness Results under the Alternative State Categorization; Table S12: Complete Robustness Results under the Extended Second-Order Spatial Weight Matrix; Table S13: Robustness Test of Alternative KNN Imputation Treatment; Table S14: Robustness Results under Year-Specific Quartile State Categorization; Table S15: Robustness Test Excluding the Taobao Village Coverage Indicator; Table S16: Robustness of Markov Transition Results under Equal Weighting; Supplementary tables containing data-quality and imputation diagnostics, complete empirical results, and robustness checks; Code S1: Core code used for index construction, empirical analyses, statistical tests, and robustness checks.
Author Contributions
Conceptualization, R.W.; methodology, Q.G.; software, Q.G.; validation, Y.X.; formal analysis, Q.G.; investigation, R.W.; resources, R.W.; data curation, Q.G.; writing—original draft preparation, Q.G.; writing—review and editing, R.W., C.C. and Y.X.; visualization, Q.G.; supervision, R.W. and C.C.; project administration, C.C. All authors have read and agreed to the published version of the manuscript.
Funding
This research received no external funding.
Institutional Review Board Statement
Not applicable.
Informed Consent Statement
Not applicable.
Data Availability Statement
The dataset supporting the findings of this study is available from the corresponding author upon reasonable request. The underlying data were compiled from publicly available statistical yearbooks and official statistical sources, as described in Section 3.1.
Conflicts of Interest
The authors declare no conflicts of interest.
Abbreviations
The following abbreviations are used in this manuscript:
| TOPSIS | Technique for Order Preference by Similarity to an Ideal Solution |
| CAGR | Compound Annual Growth Rate |
References
- Zhang, H.; Yang, F.; Yang, M. Assessing the Impact of Digitalization and Technological and Financial Innovation on Grain Production in China. Agriculture 2026, 16, 401. [Google Scholar] [CrossRef] [Scilit]
- Valdes, R.; Gómez, D.; Barrantes, L. Enhancing Agricultural Value Chains through Technology Adoption: A Case Study in the Horticultural Sector of a Developing Country. Agric. Food Secur. 2023, 12, 45. [Google Scholar] [CrossRef] [Scilit]
- Zhang, G.; Deng, Y.; Shi, A. Study on the Measurement, Regional Disparities, and Driving Factors of the Level of New Quality Productive Forces in Agriculture. J. Northeast. Univ. Soc. Sci. 2026, 28, 1–12. (In Chinese) [Google Scholar] [CrossRef]
- Li, J.; Wu, L. Measurement and Dynamic Evolution of China’s Agricultural New Quality Productive Forces: A Study Based on the Pressure-State-Response (PSR) Model. Front. Sustain. Food Syst. 2026, 10, 1899973. [Google Scholar] [CrossRef] [Scilit]
- Cao, B.; Li, H.; Zhao, C.; Li, J. The Path of Smart Agricultural Technology Innovation Leading Development of Agricultural New Quality Productivity. Smart Agric. 2024, 6, 116–127. (In Chinese) [Google Scholar] [CrossRef]
- Yin, Y.; Wang, F. Theoretical Connotation, Significance, and Practical Path of Agricultural New Quality Productive Forces. Acad. Exch. 2025, 5, 119–133. (In Chinese) [Google Scholar]
- Huang, J. New Quality Productive Forces in Agriculture: Connotation and Denotation, Potential and Challenges, and Development Ideas. China Rural Surv. 2024, 5, 19–34. (In Chinese) [Google Scholar] [CrossRef]
- Guo, H.; Han, W. Can Agricultural New Quality Productivity Promote the Increase of Agricultural Green Total Factor Productivity. J. Southwest Univ. Soc. Sci. Ed. 2024, 50, 182–196. (In Chinese) [Google Scholar] [CrossRef]
- Li, C.; Zhang, K.; Wang, P. The Impact of Rural Demographic Structure on Agricultural New-Quality Productivity in China: Evidence from a Panel Dataset of 30 Provinces. Sustainability 2025, 17, 9697. [Google Scholar] [CrossRef] [Scilit]
- Liu, W.; Zheng, H. Research on the Impact of Agricultural New Quality Productive Forces on Grain Production Resilience: Evidence from China. Front. Sustain. Food Syst. 2026, 10, 1775421. [Google Scholar] [CrossRef] [Scilit]
- Li, C.; Zhang, S. Measurement of the Level of New Quality Productive Forces in Agriculture and Rural Areas of China and Analysis of Influencing Factors. Inq. Into Econ. Issues 2024, 12, 122–135. (In Chinese) [Google Scholar]
- Cao, X.; Lei, J.; Shi, D.; Yu, W.; Tao, T.; Zhang, X.; Wang, A. New Quality Productivity of Agriculture and Rural Areas at the Provincial Scale in China: Indicator Construction and Spatiotemporal Evolution. ISPRS Int. J. Geo-Inf. 2025, 14, 104. [Google Scholar] [CrossRef] [Scilit]
- Huang, H.; Xu, M.; Gan, X. Evaluation and Obstacle Analysis of New Quality Productive Forces in Agriculture Based on Entropy Weight-TOPSIS Method. Chin. J. Eco-Agric. 2026, 34, 1375–1389. (In Chinese) [Google Scholar] [CrossRef]
- Xiong, C.; He, X. Constructing New Quality of Agricultural Productivity Evaluation Indicators, Level Measurement and Regional Differences in China. Sci. Technol. Manag. Res. 2025, 45, 53–62. (In Chinese) [Google Scholar]
- Ge, M.; Tan, X. Agricultural New Quality Productivity of China: Level Measurement, Spatiotemporal Differentiation and Spatial Convergence Analysis. J. Southwest Univ. Nat. Sci. Ed. 2025, 47, 113–127. (In Chinese) [Google Scholar] [CrossRef]
- Qin, L.; Liu, S.; Wang, W.; Miao, F.; Xie, F. Regional Differences, Dynamic Evolution, and Obstacle Factors in the Development of Agricultural New Quality Productive Forces in China. J. Resour. Ecol. 2025, 16, 1499–1514. [Google Scholar] [CrossRef] [Scilit]
- Jin, S.; Qi, X. China’s Agricultural New Quality Productivity: Comprehensive Measurement and Dynamic Evolution. J. Macro-Qual. Res. 2025, 13, 73–89. (In Chinese) [Google Scholar] [CrossRef]
- Gao, J.; Zhu, J.; Li, Y.; Gong, Y.; Shen, M. Spatio-Temporal Pattern of China’s New Quality Agricultural Productive Forces and Their Impact on Agriculture. Acta Geogr. Sin. 2025, 80, 1386–1404. (In Chinese) [Google Scholar] [CrossRef]
- Li, X.; Xu, S. The Measurement of the Level of Agricultural High-Quality Development and the Study of the Spatial Distribution Characteristics: On the Basis of the New Development Concept. J. Jiangxi Univ. Financ. Econ. 2020, 6, 78–94. (In Chinese) [Google Scholar] [CrossRef]
- He, J.; Han, M. Analysis of Spatial and Temporal Characteristics and Evolution of Green Total Factor Productivity in Agriculture in the Lower Yellow River Basin. Front. Sustain. Food Syst. 2024, 8, 1474813. [Google Scholar] [CrossRef] [Scilit]
- Ding, Q.; Yang, Z.; Huang, Z. Spatio-Temporal Differentiation and Influencing Factors of High-Quality Development of Agriculture and Rural Areas in China. Front. Sustain. Food Syst. 2025, 8, 1471197. [Google Scholar] [CrossRef] [Scilit]
- Wang, L.; Zhang, P.; Li, M. Regional Differences and Dynamic Evolution of the Modernization Level of China’s Fishery Industry Chain. Front. Sustain. Food Syst. 2025, 9, 1710311. [Google Scholar] [CrossRef] [Scilit]
- Han, W.; Guo, H.; Wang, D. Spatial and Temporal Evolution of the Development of New Quality Productivity of Agricultural and Obstacles to Further Development. Chin. J. Eco-Agric. 2025, 33, 820–833. (In Chinese) [Google Scholar] [CrossRef]
- Blasch, J.; van der Kroon, B.; van Beukering, P.; Munster, R.; Fabiani, S.; Nino, P.; Vanino, S. Farmer Preferences for Adopting Precision Farming Technologies: A Case Study from Italy. Eur. Rev. Agric. Econ. 2022, 49, 33–81. [Google Scholar] [CrossRef] [Scilit]
- Birner, R.; Daum, T.; Pray, C. Who Drives the Digital Revolution in Agriculture? A Review of Supply-Side Trends, Players and Challenges. Appl. Econ. Perspect. Policy 2021, 43, 1260–1285. [Google Scholar] [CrossRef] [Scilit]
- Fabregas, R.; Kremer, M.; Schilbach, F. Realizing the Potential of Digital Development: The Case of Agricultural Advice. Science 2019, 366, eaay3038. [Google Scholar] [CrossRef] [Scilit] [PubMed]
- Pretty, J.; Benton, T.G.; Bharucha, Z.P.; Dicks, L.V.; Flora, C.B.; Godfray, H.C.J.; Goulson, D.; Hartley, S.; Lampkin, N.; Morris, C.; et al. Global Assessment of Agricultural System Redesign for Sustainable Intensification. Nat. Sustain. 2018, 1, 441–446. [Google Scholar] [CrossRef] [Scilit]
- Wang, S.L.; Huang, J.; Wang, X.; Tuan, F. Are China’s Regional Agricultural Productivities Converging: How and Why? Food Policy 2019, 86, 101727. [Google Scholar] [CrossRef] [Scilit]
- Gong, B. Agricultural Productivity Convergence in China. China Econ. Rev. 2020, 60, 101423. [Google Scholar] [CrossRef] [Scilit]
- Zhou, F.; Wen, C. Research on the Level of Agricultural Green Development, Regional Disparities, and Dynamic Distribution Evolution in China from the Perspective of Sustainable Development. Agriculture 2023, 13, 1441. [Google Scholar] [CrossRef] [Scilit]
- Li, X.; Jin, Y. A Study of Spatial Spillover Effects of Rural Human Capital on Agroecological Wellbeing Performance: Based on Empirical Data Analysis at the Provincial in China. Front. Sustain. Food Syst. 2025, 9, 1570357. [Google Scholar] [CrossRef] [Scilit]
- Li, H.; Zhang, L.; Zhang, J.; Li, W. Impact of Technological Innovation on Agricultural Green Total Factor Productivity in China: Considering the Threshold Effect of Environmental Regulation. J. Environ. Plan. Manag. 2025, 68, 1057–1081. [Google Scholar] [CrossRef] [Scilit]
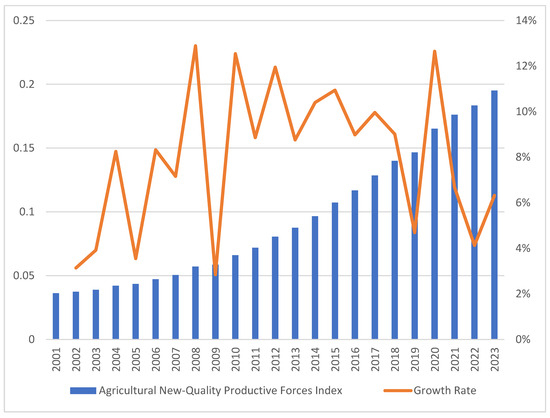
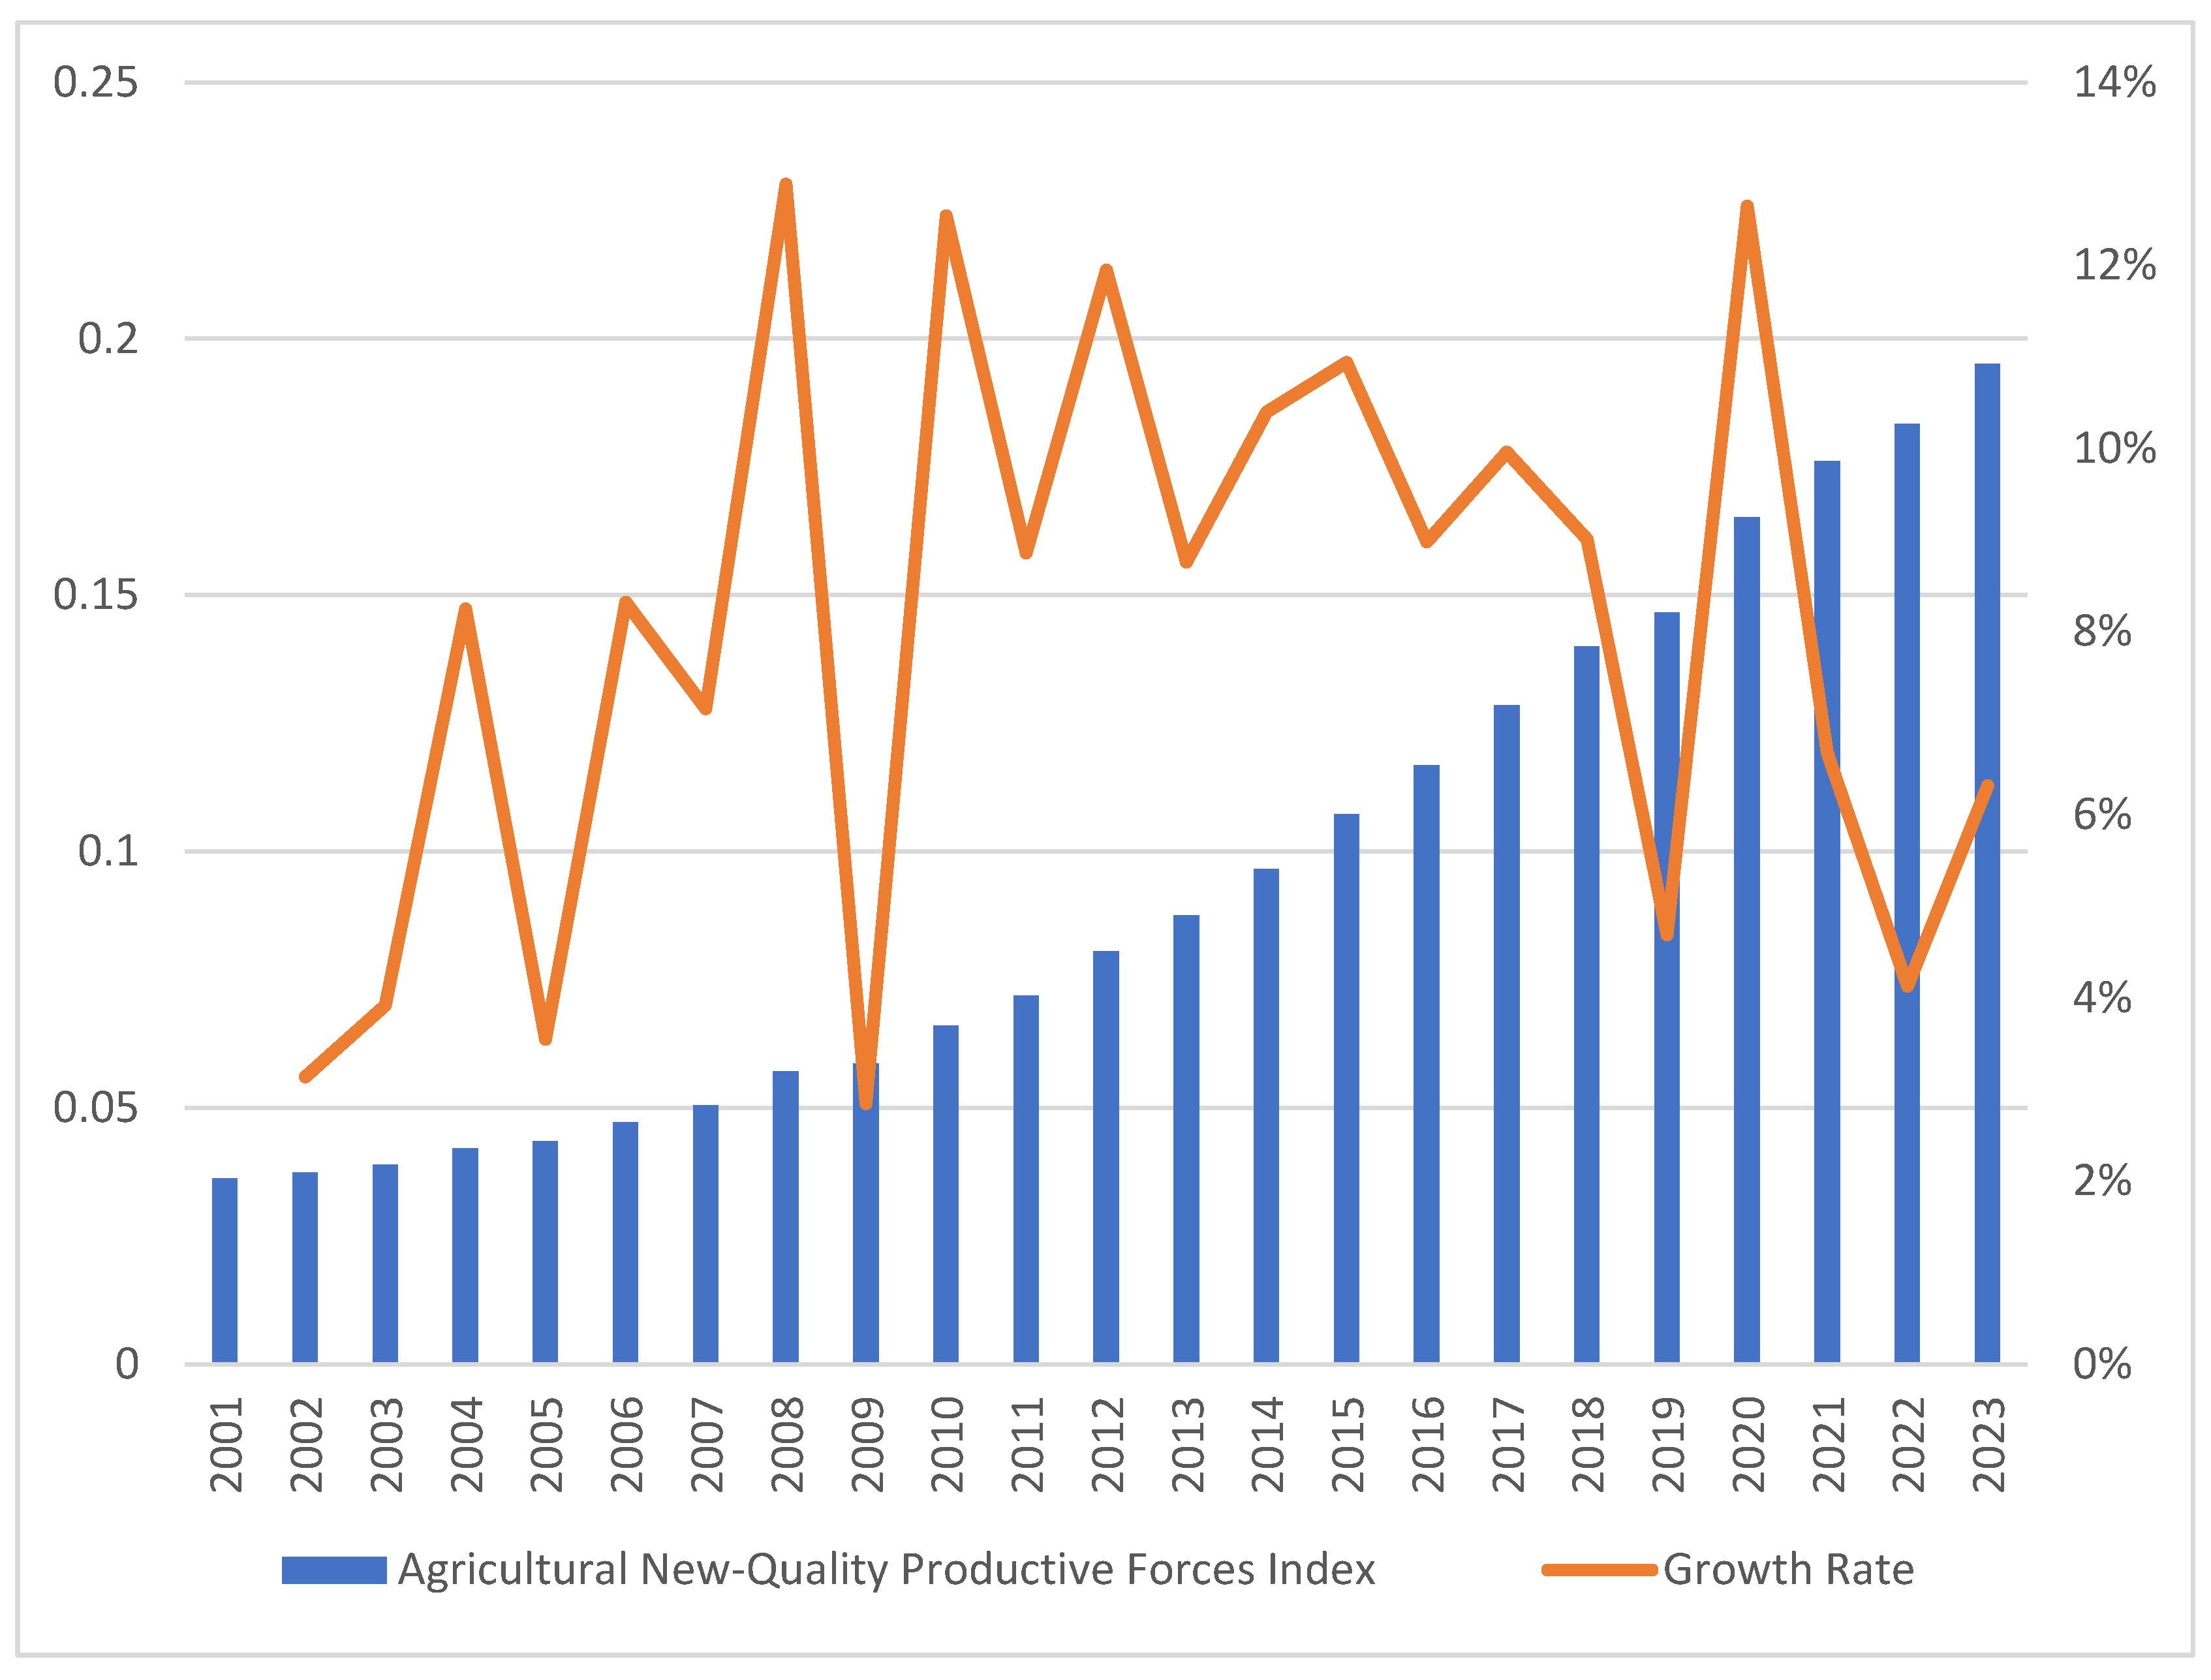
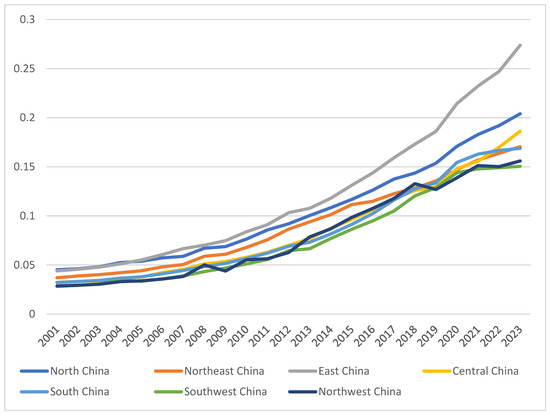
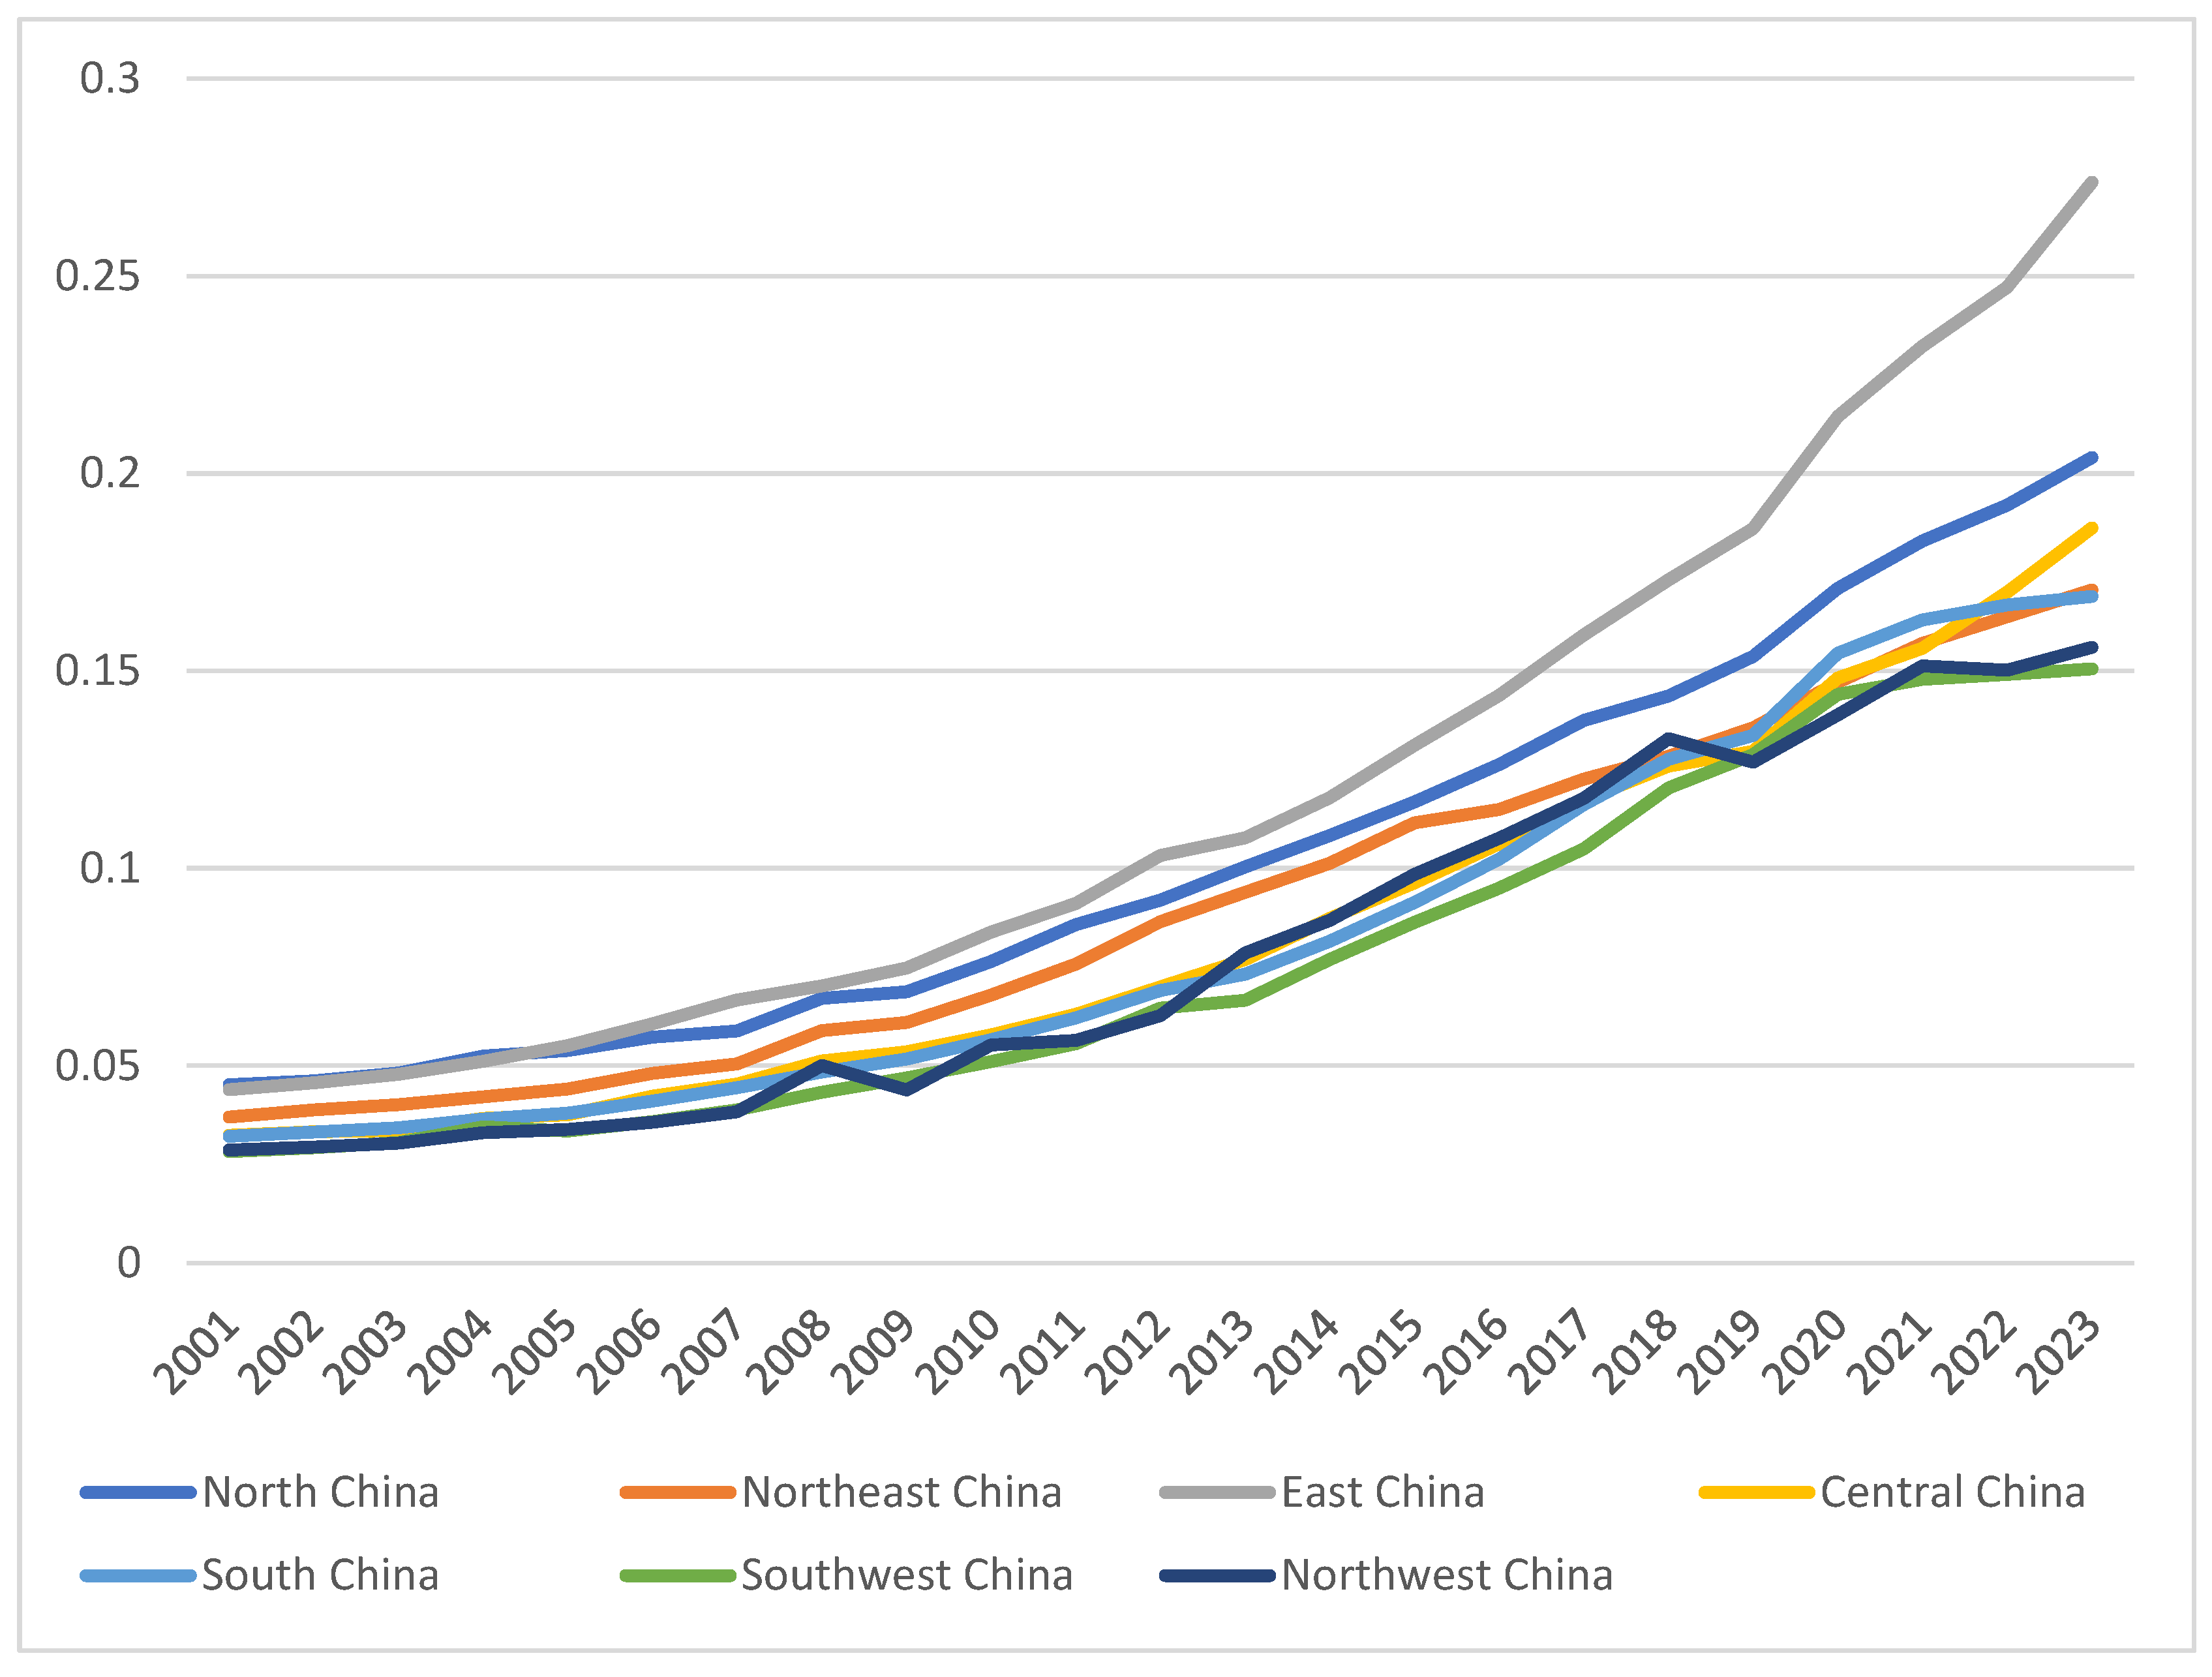
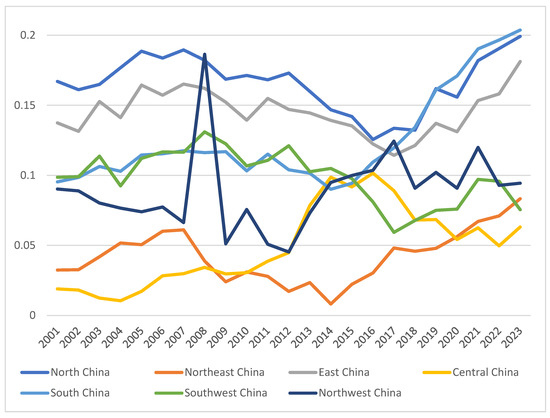
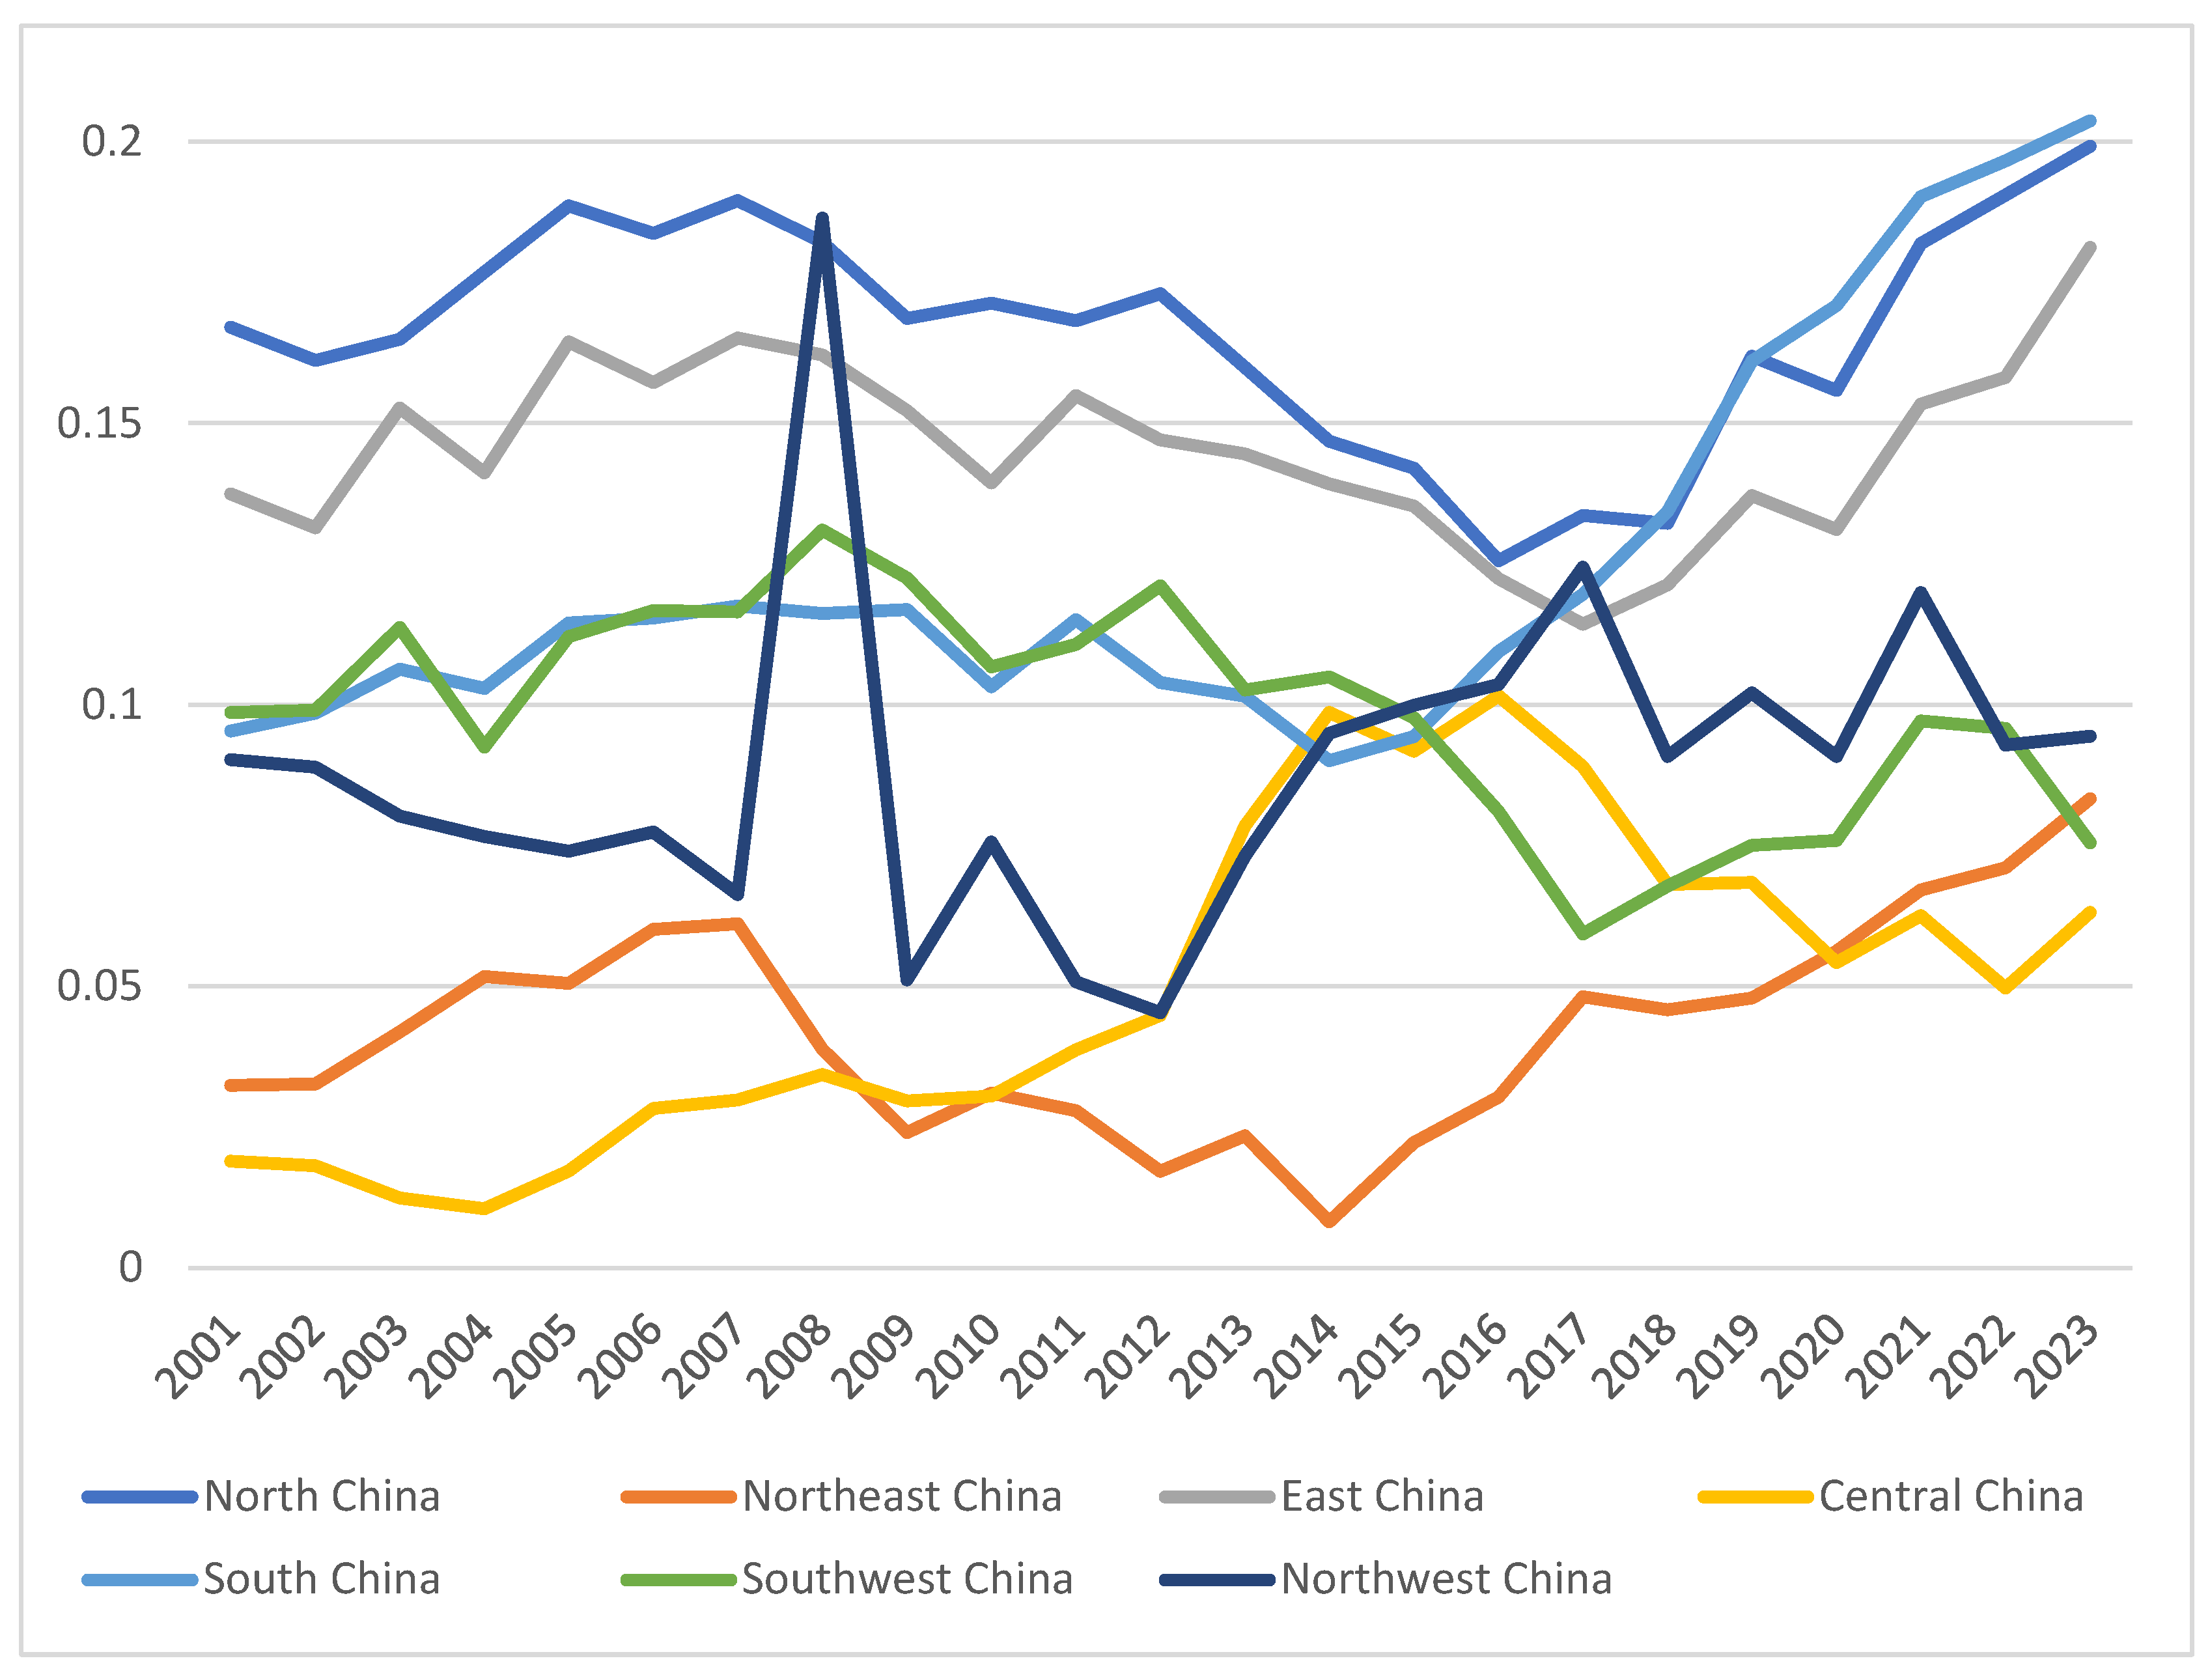
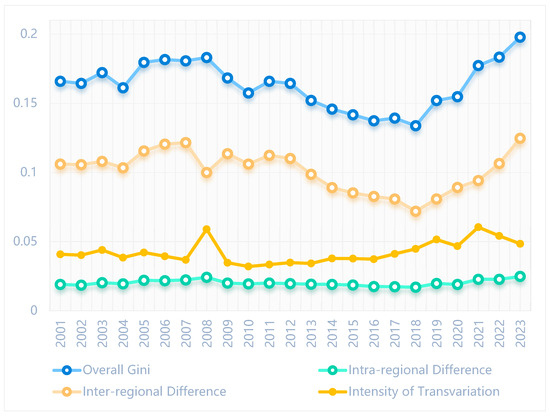
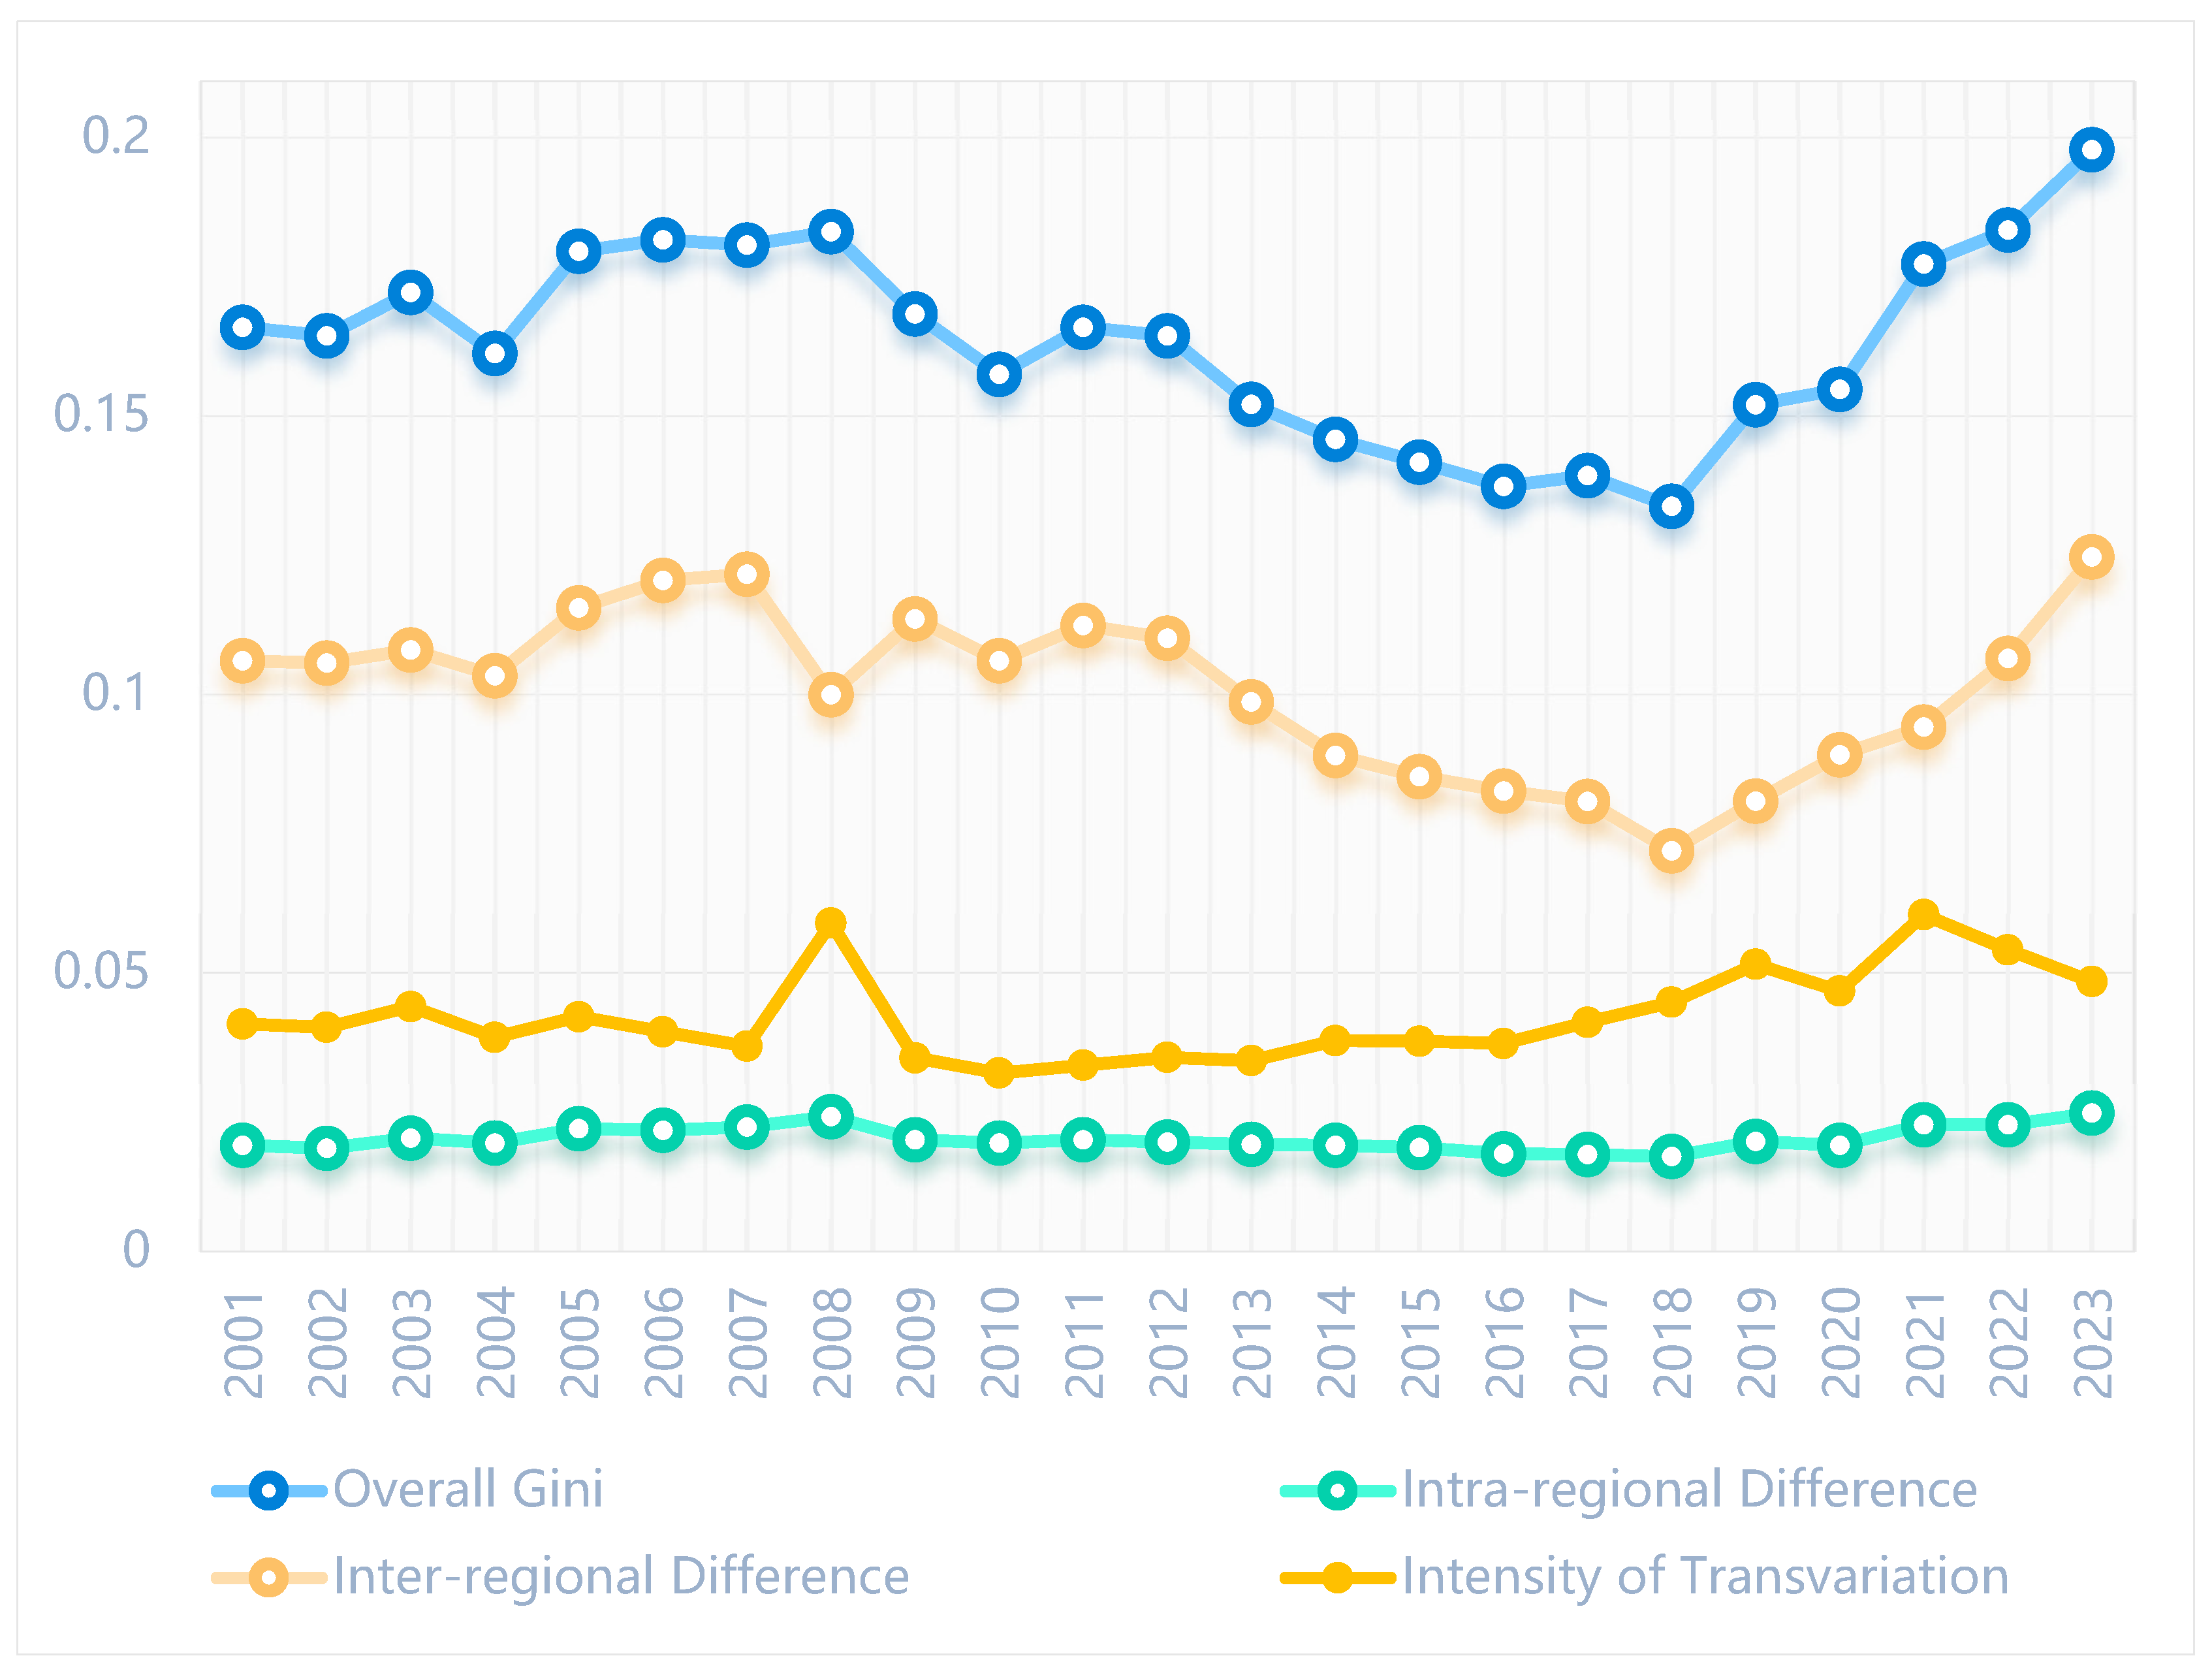
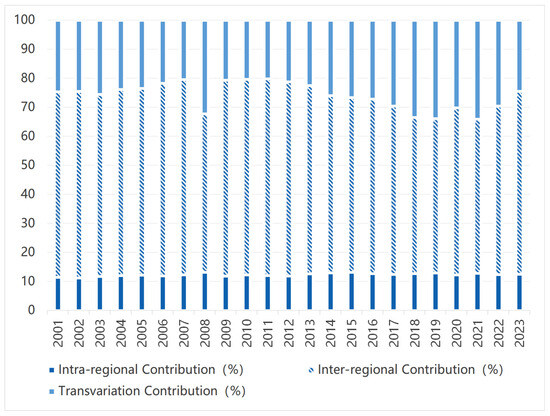
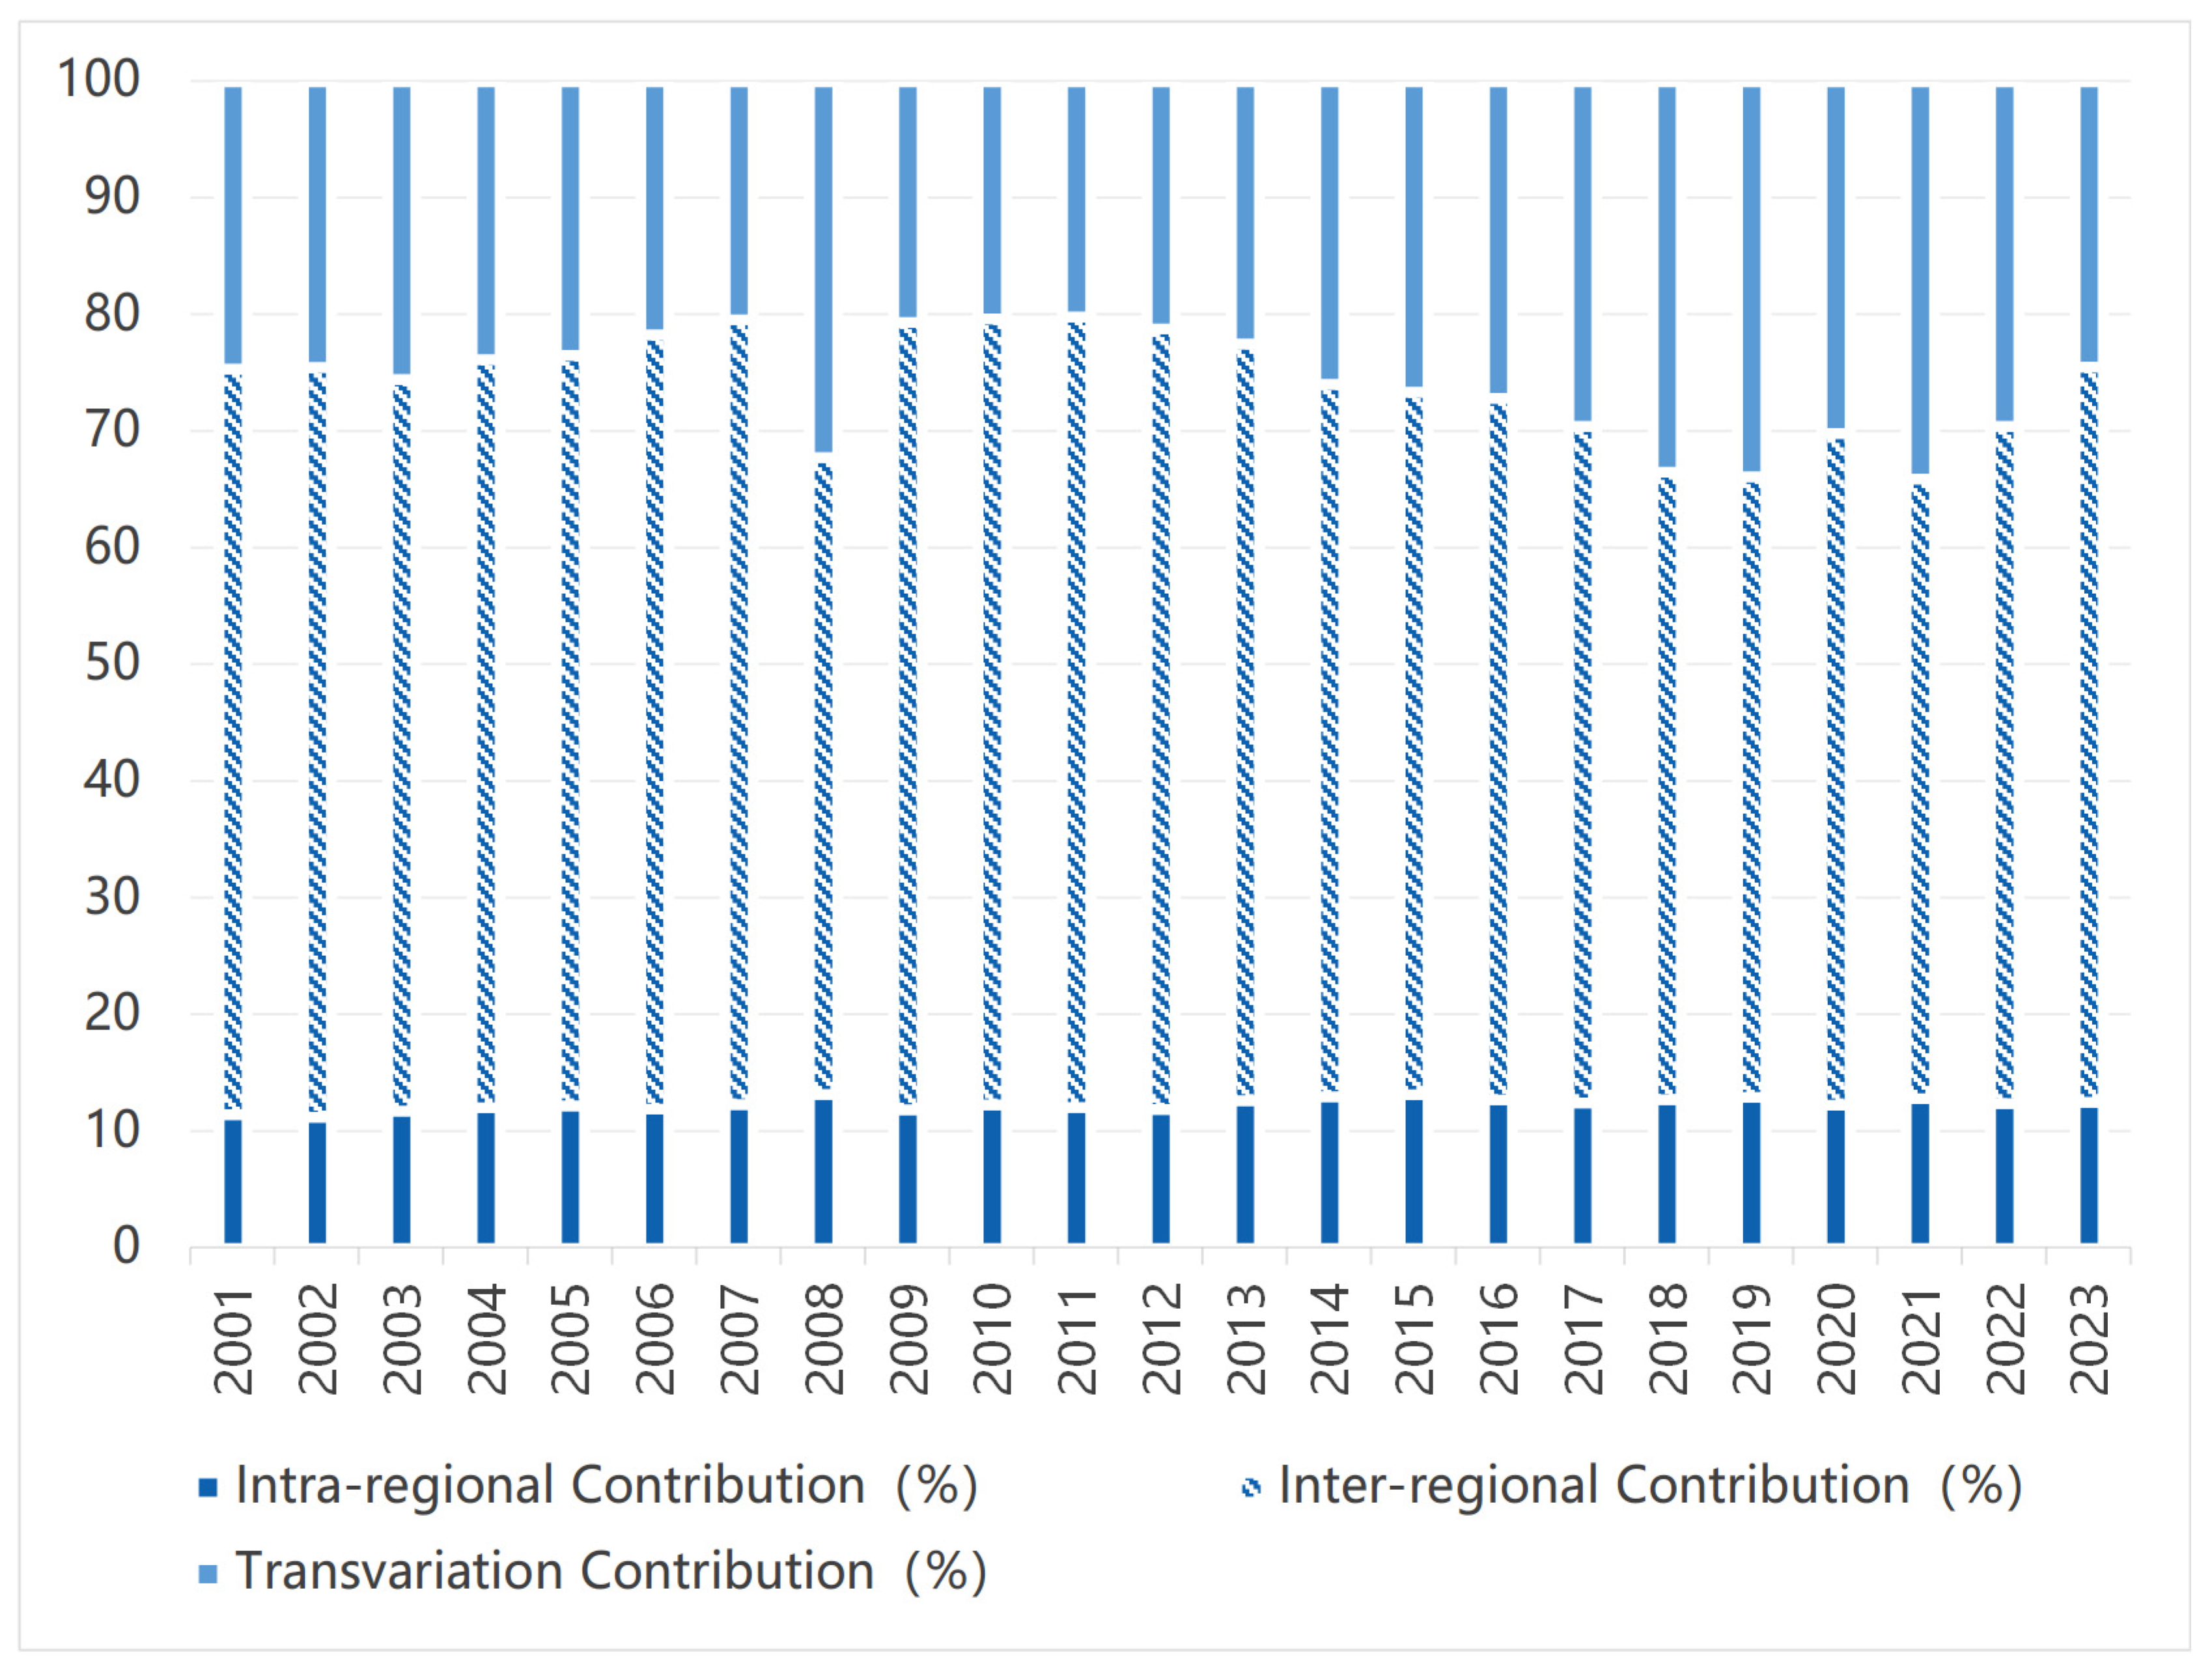
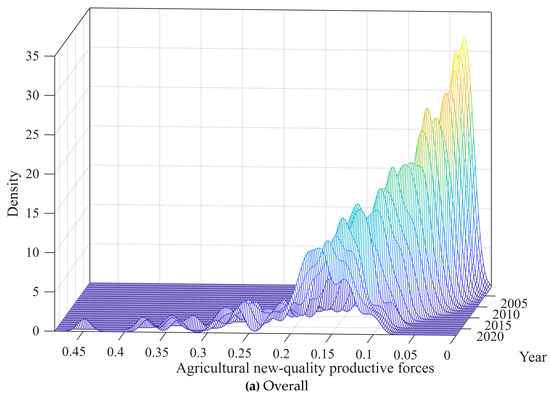
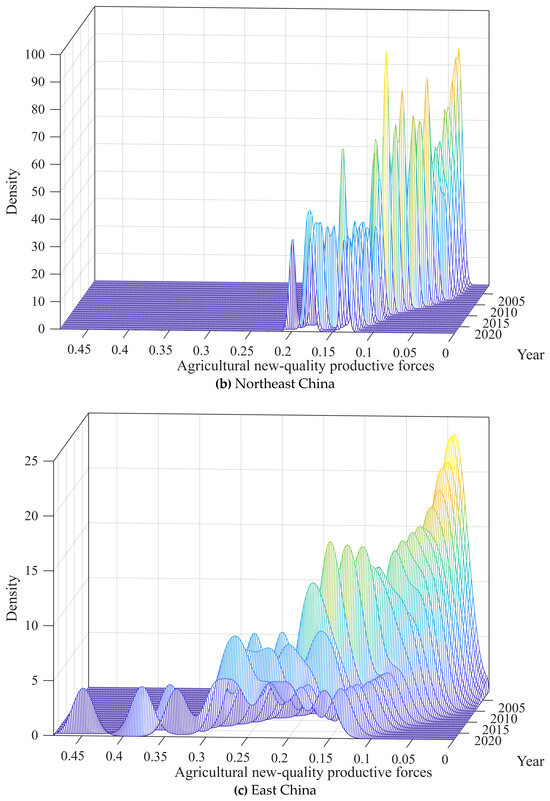
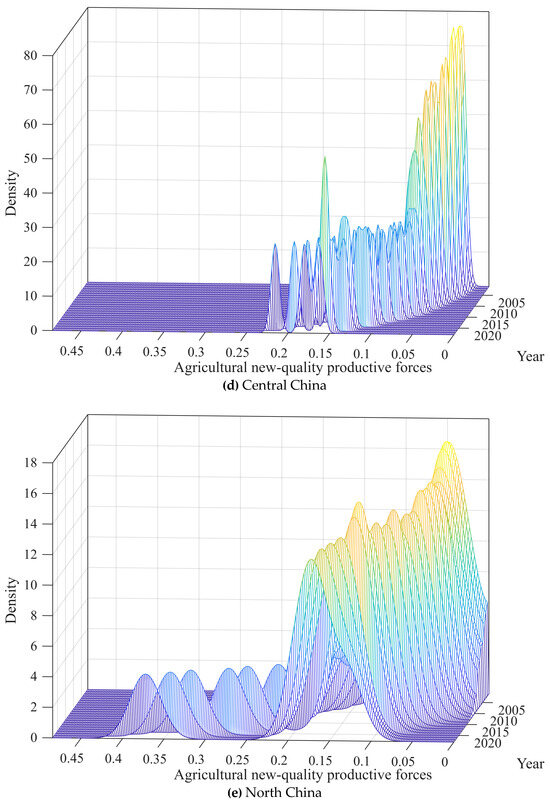
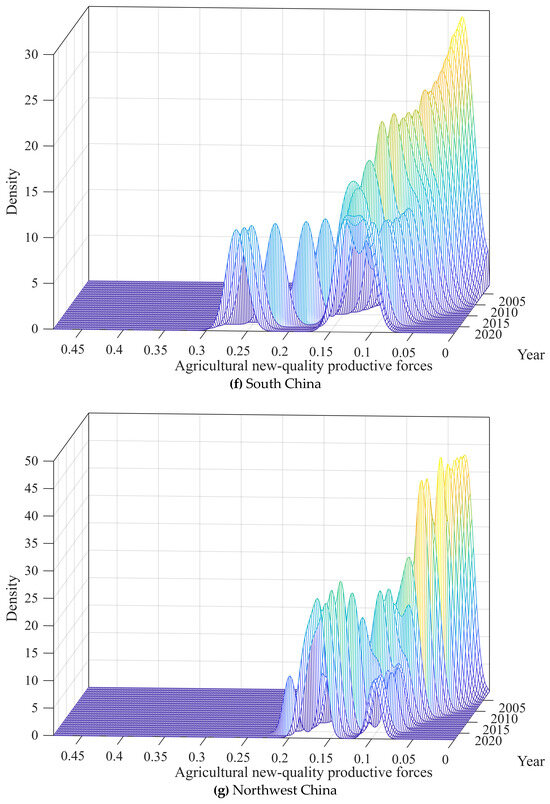
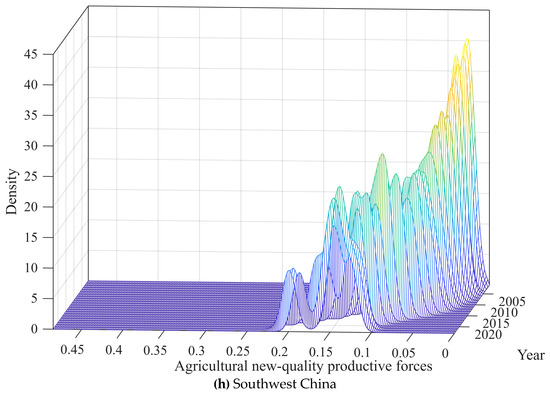
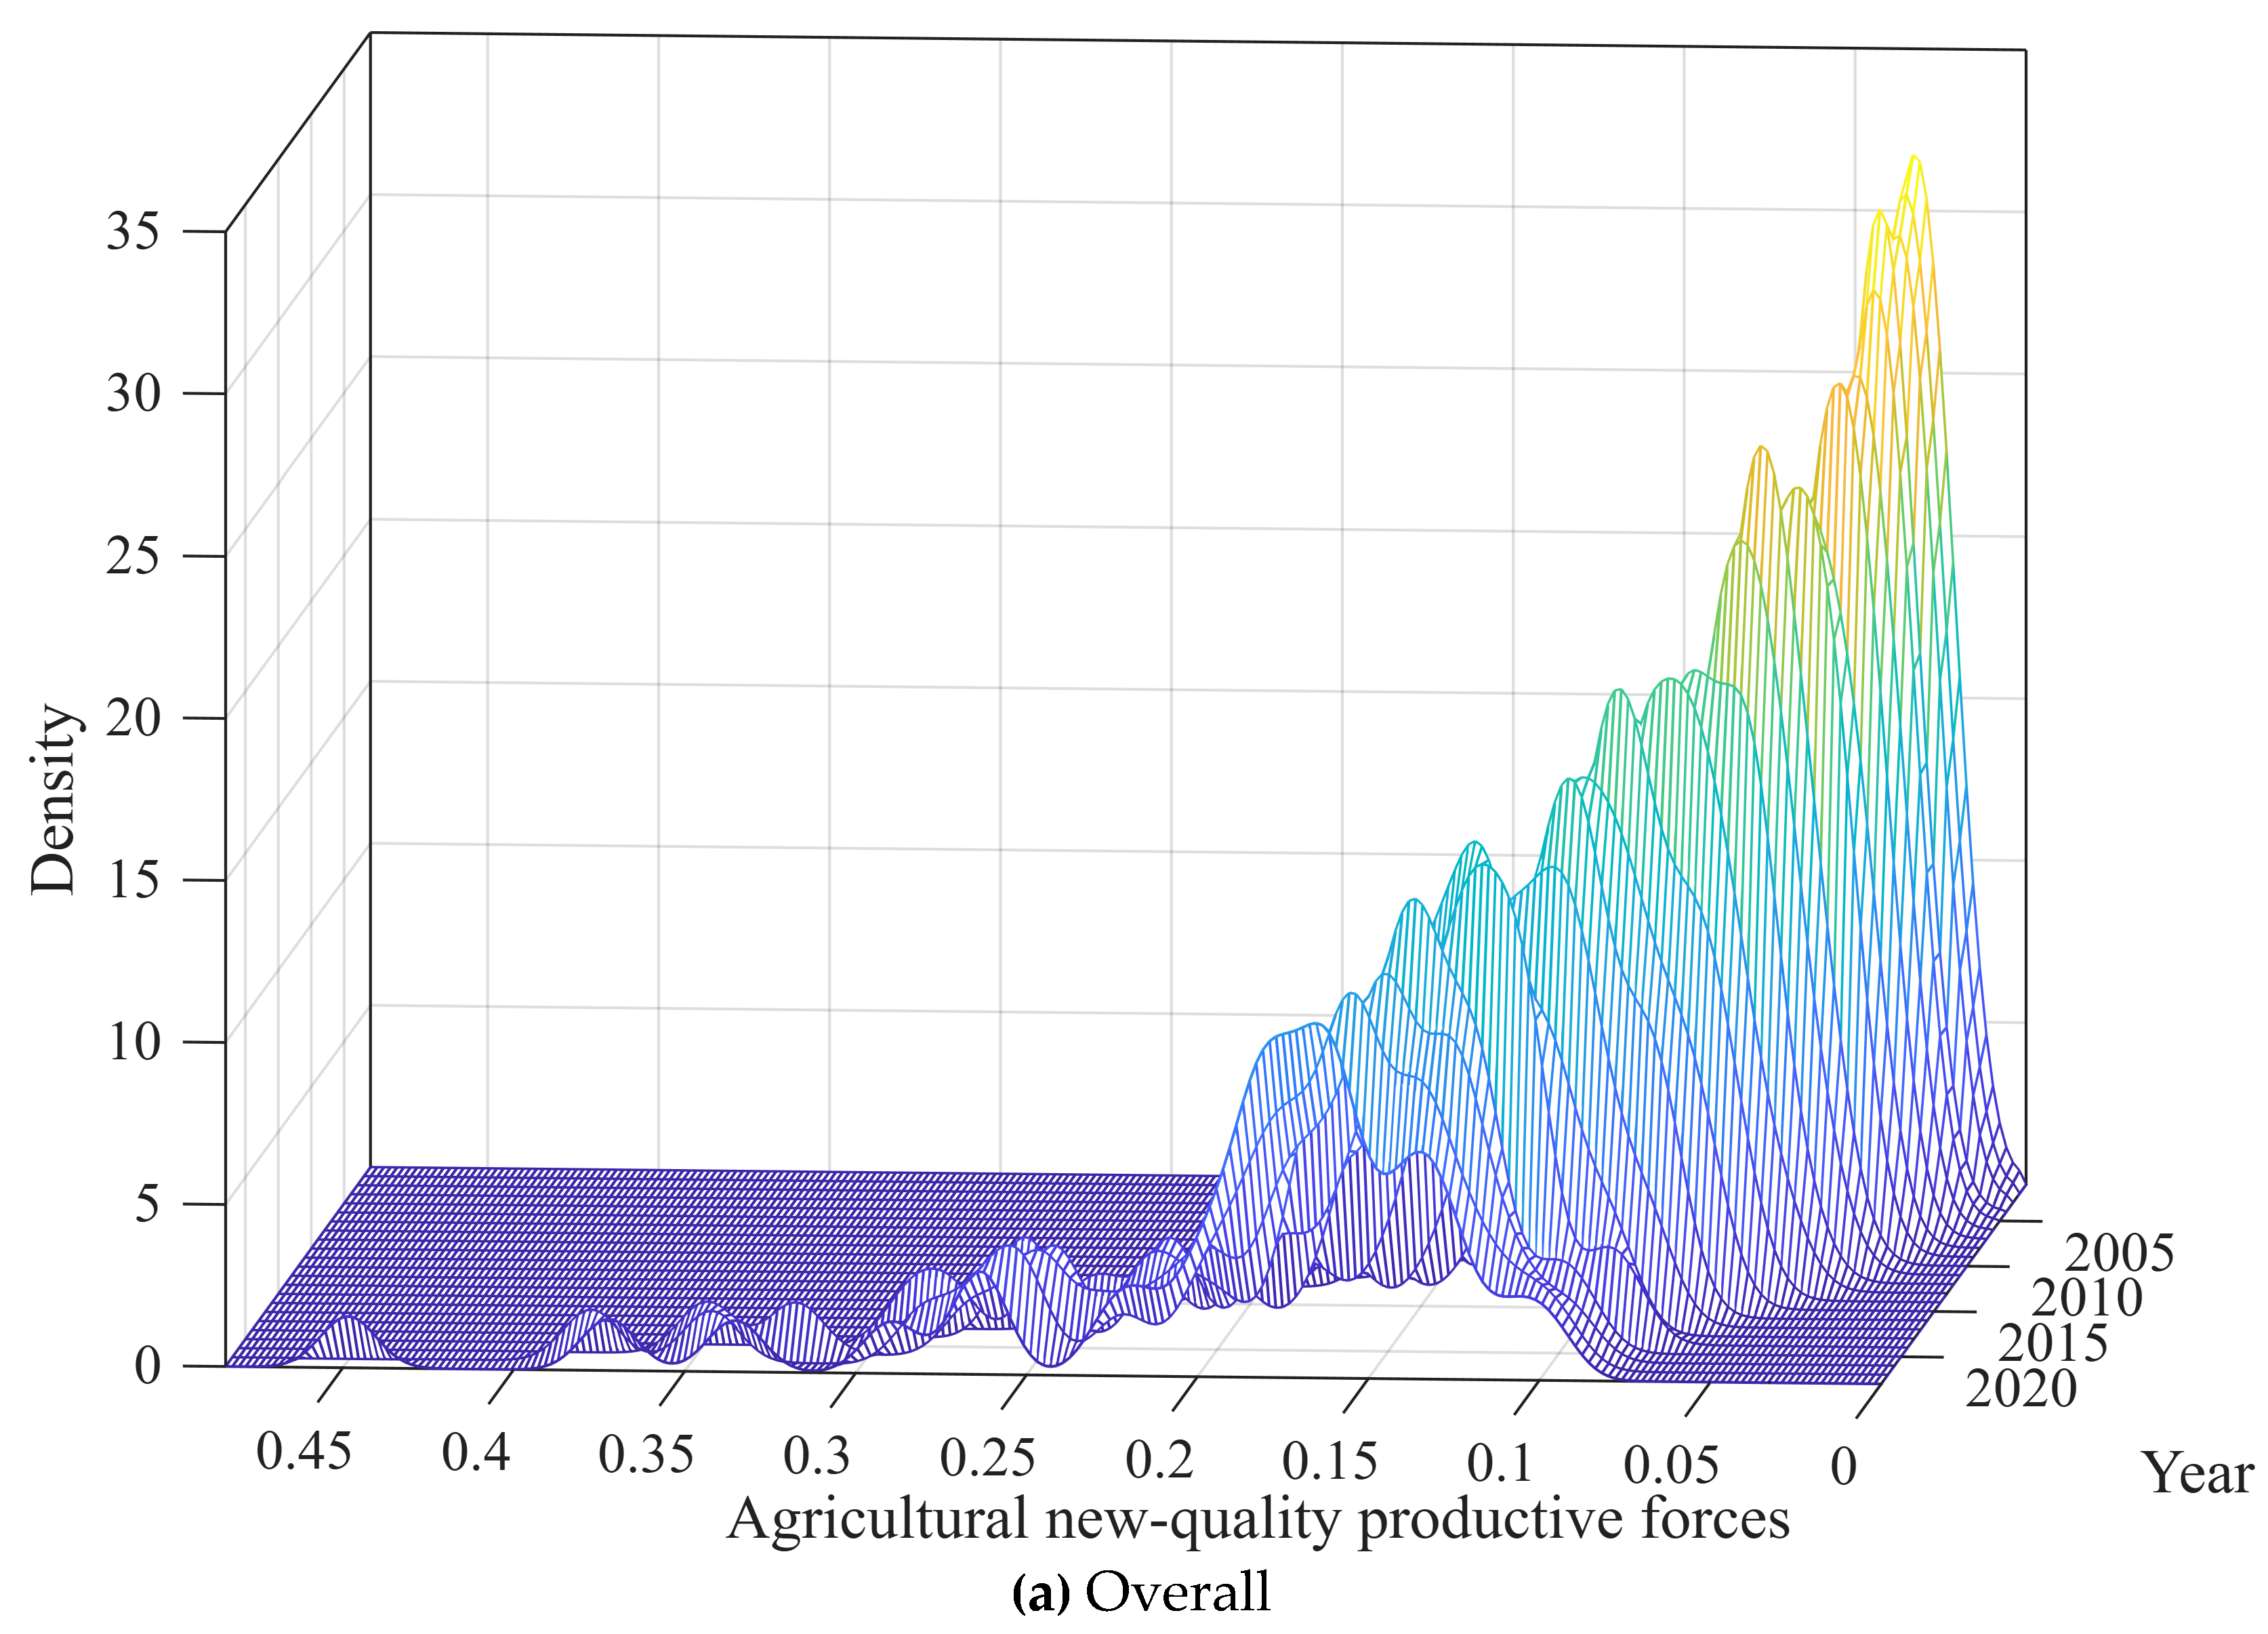
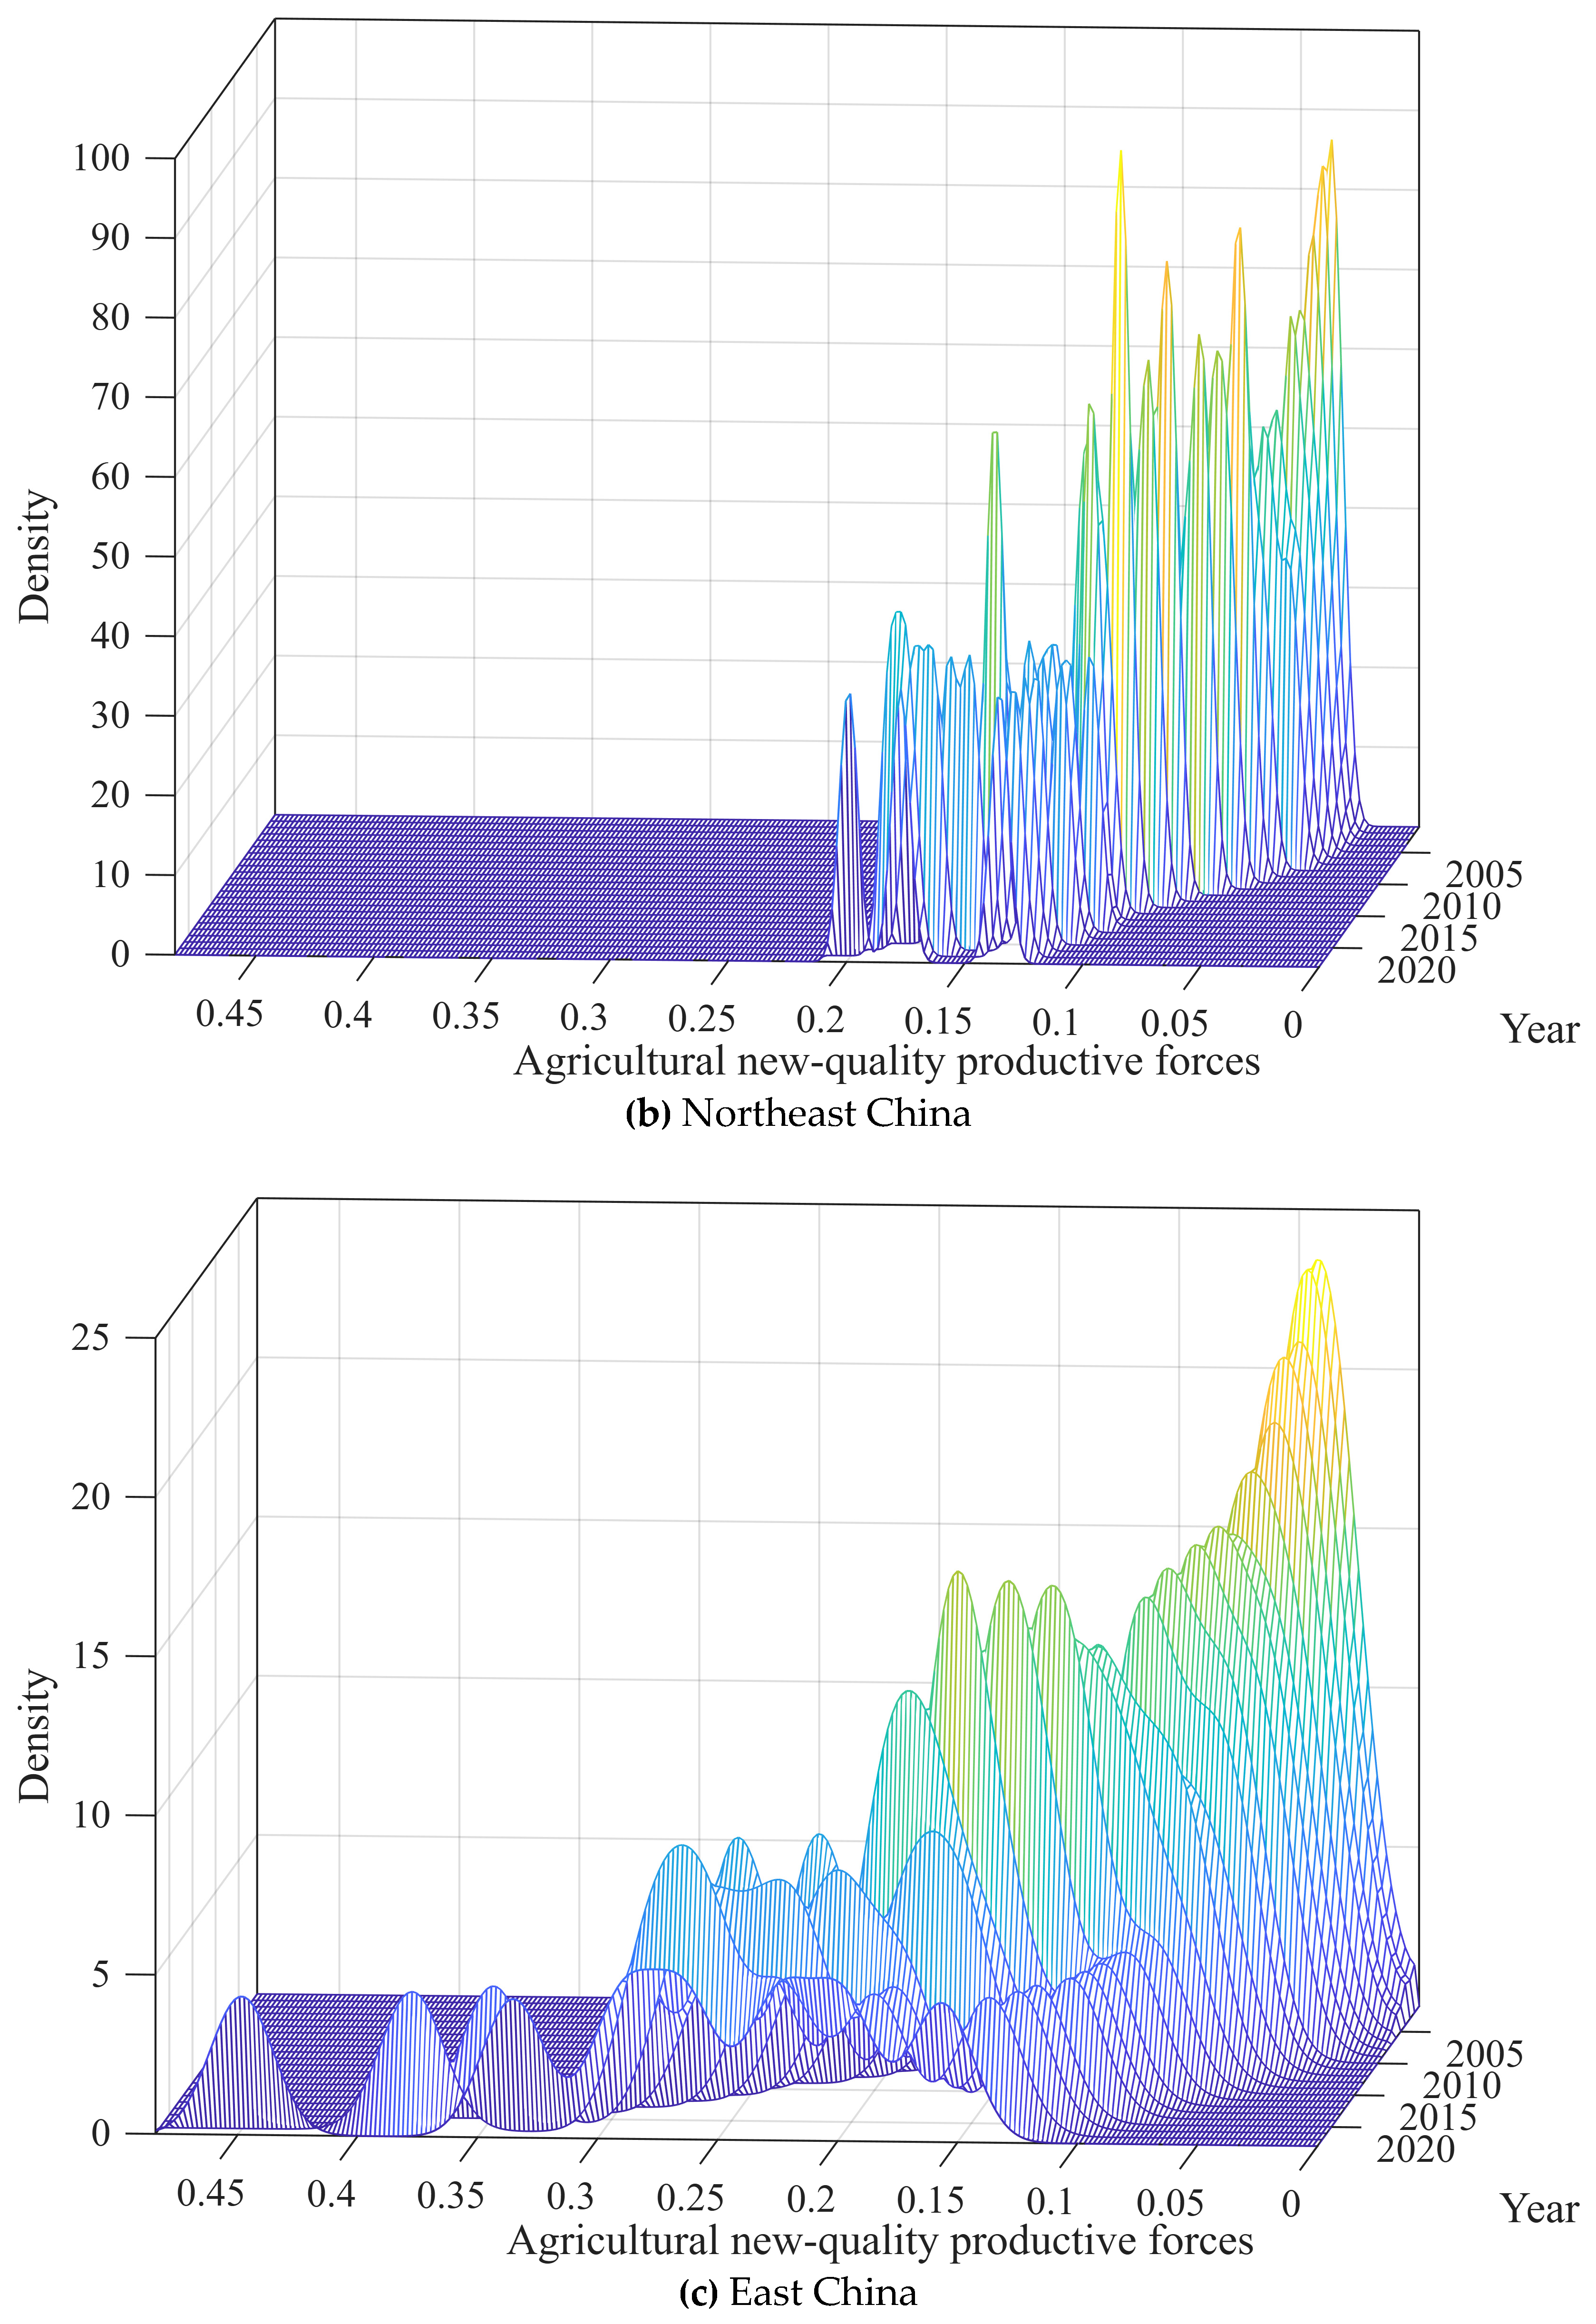
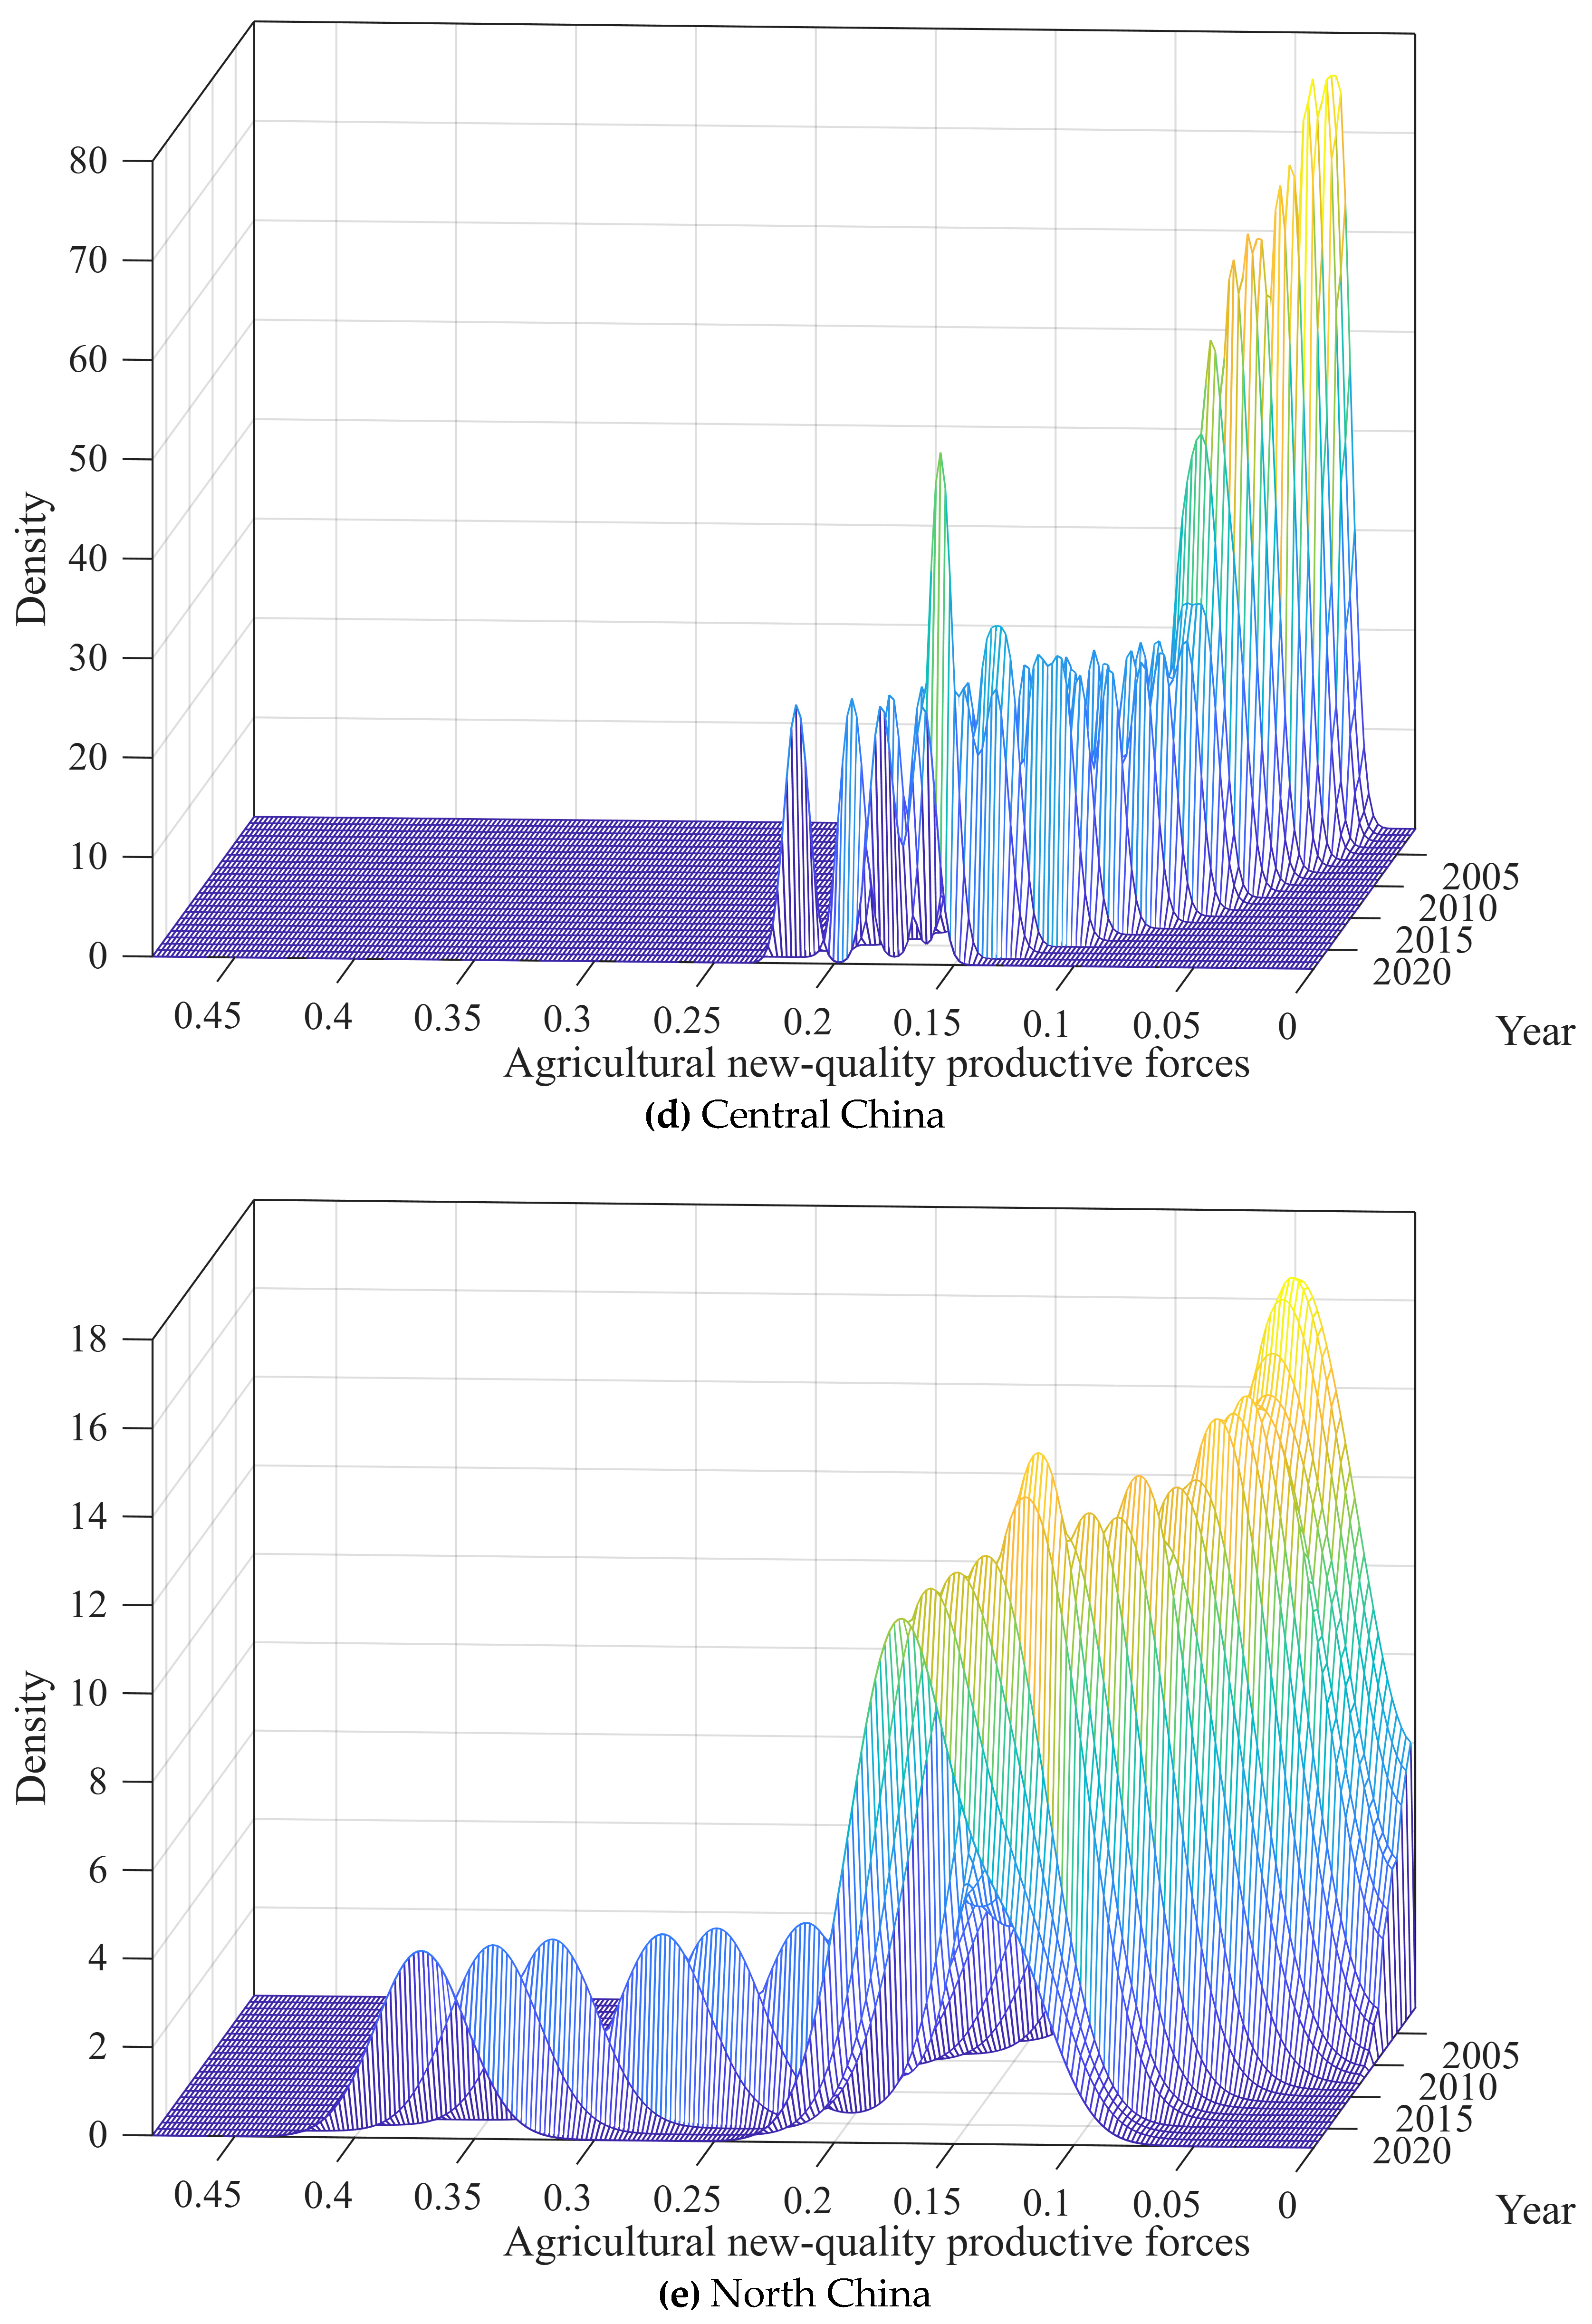
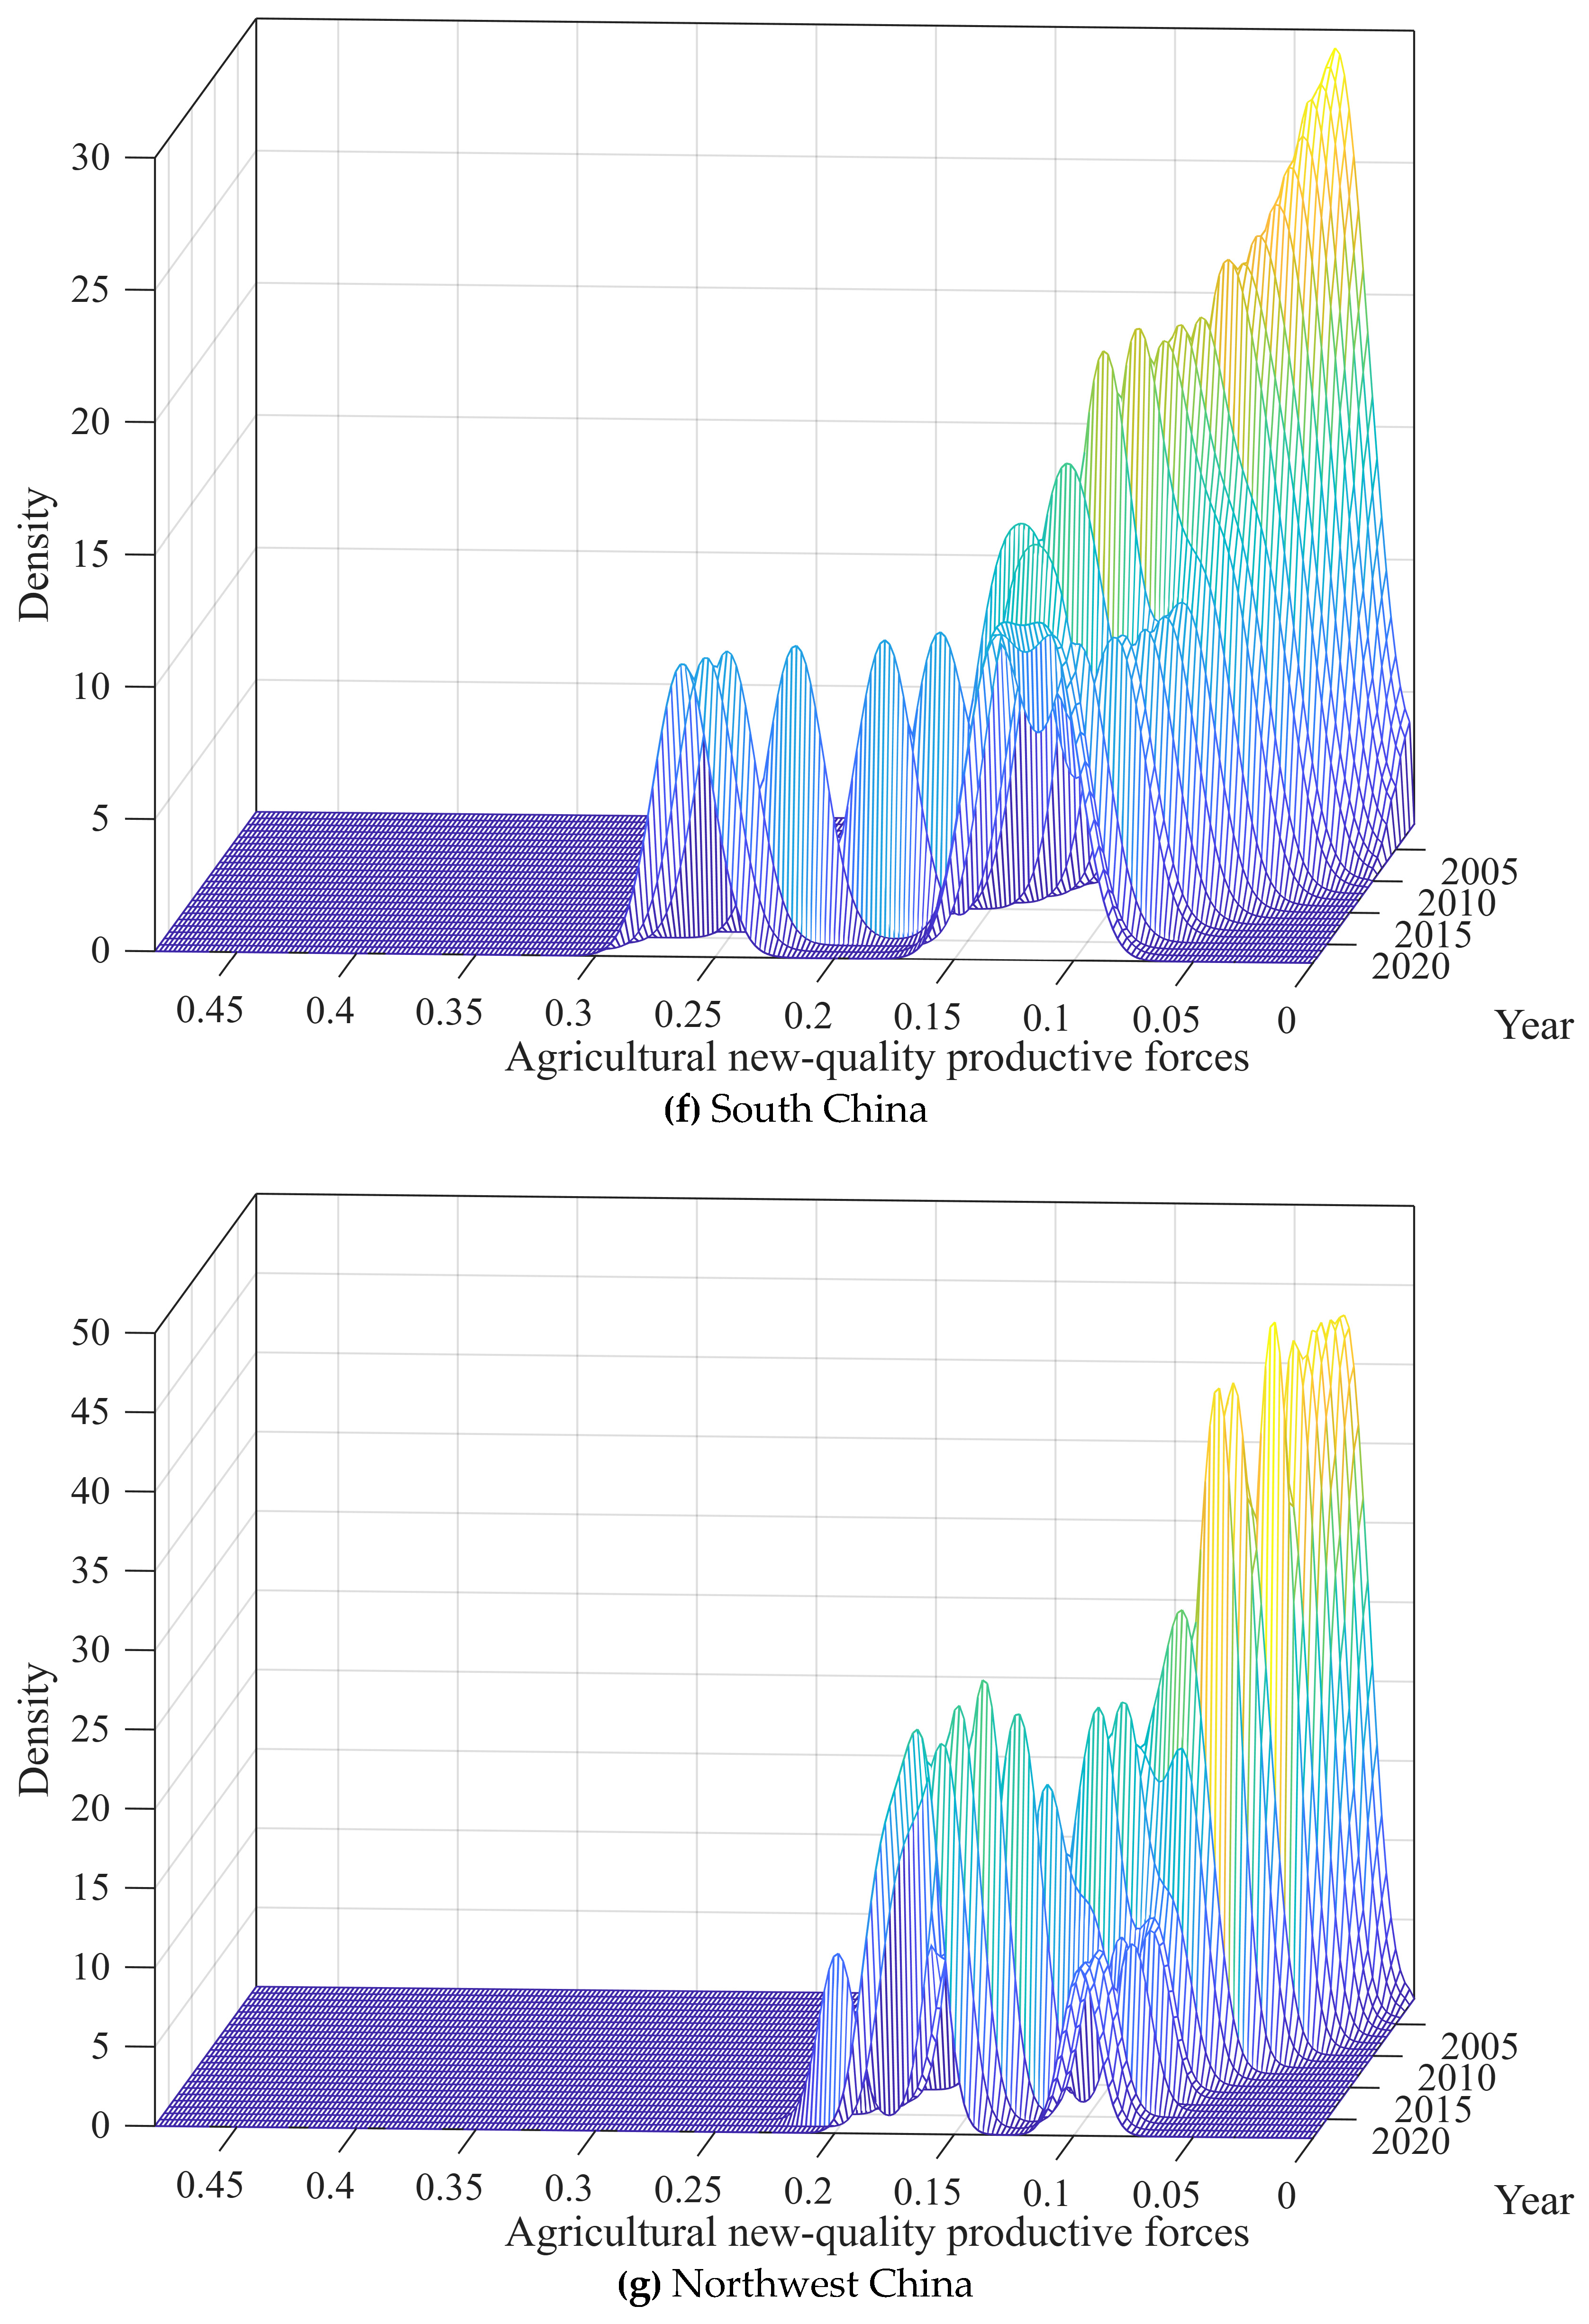
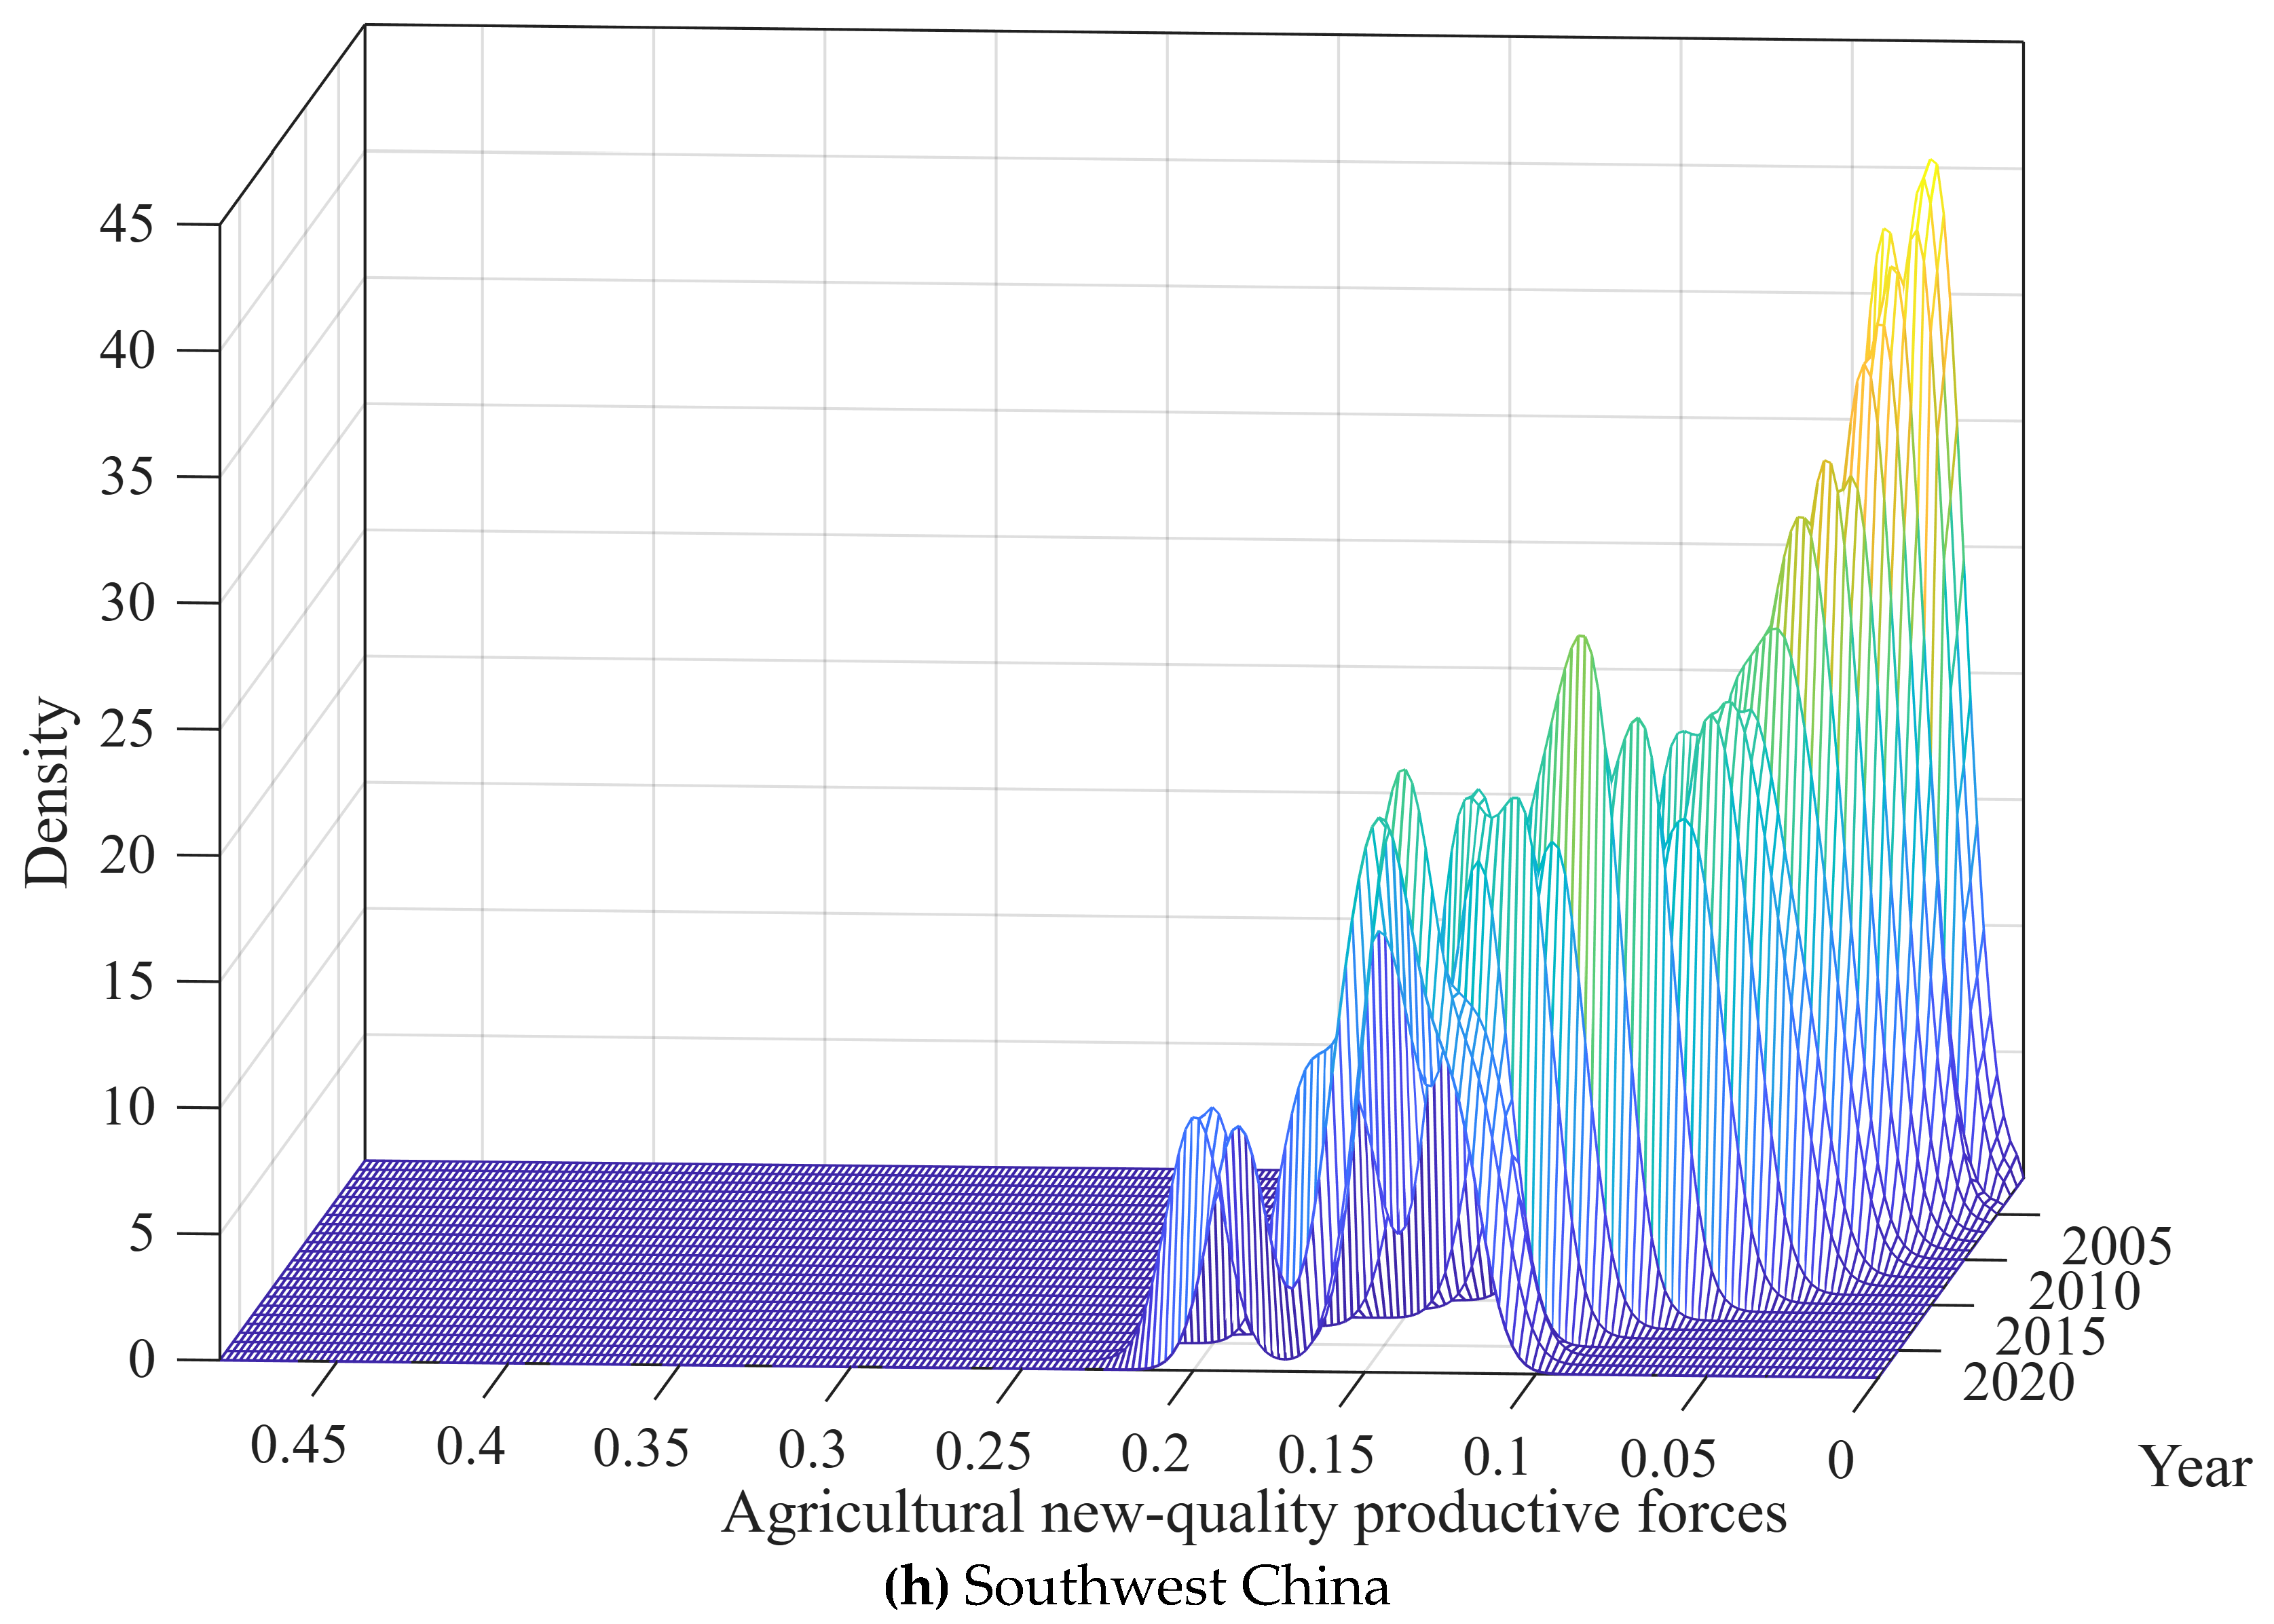

Disclaimer/Publisher’s Note: The statements, opinions and data contained in all publications are solely those of the individual author(s) and contributor(s) and not of MDPI and/or the editor(s). MDPI and/or the editor(s) disclaim responsibility for any injury to people or property resulting from any ideas, methods, instructions or products referred to in the content. |
© 2026 by the authors. Licensee MDPI, Basel, Switzerland. This article is an open access article distributed under the terms and conditions of the Creative Commons Attribution (CC BY) license.