


Abstract
This study applies a Triple Bottom Line (TBL) framework to assess ecological, social, and economic dimensions of the fisheries in Hurghada, Egypt, using spatial habitat mapping and official statistics. Time-series ecological analysis of stock-status data confirms monotonic deterioration across all exploitation categories, with the developing stock proportion declining at −1.04 percentage points per year (CSS) and −1.39 (NSS). Quantitative survey analysis documents that 80% of Hurghada fishing households derive less than 25% of income from fishing, with mean operational costs of USD 454 per trip. Socio-economic analysis shows that Hurghada’s 343-vessel fleet supports approximately 1720 registered fishers, of whom 69% report deteriorating stock conditions. Economic analysis shows that the direct-use value of the fisheries is estimated at USD 26.51 million with multiplier effects; the net present value of fisheries benefits over 2025–2050 ranges from USD 375 million to USD 679 million. These findings indicate that co-management interventions, including effort reduction, stronger enforcement against illegal fishing, expanded habitat protection, and integration of fisher knowledge into governance offer the most credible literature-supported pathway toward long-term fisheries sustainability.
1. Introduction
Global fisheries and aquaculture reached unprecedented production levels in 2022, with total output of 223.2 million tonnes, supporting approximately 61.8 million people in primary production [1]. Despite these production milestones, sustainability deficits persist; only 62.3% of monitored stocks were fished within biologically sustainable levels in 2021 [1]. Within this global context, Egypt occupies a distinctive position as the undisputed leader in African aquaculture. In 2022, Egypt produced 1.55 million tonnes of farmed fish, accounting for 67% of Africa’s total aquaculture output and ranking seventh globally [1,2]. Total national fish production reached 1.99 million tonnes in 2022, with a total value of approximately USD 4.75 billion. National production by volume comprised three components: aquaculture (77.6% of total volume; USD 3.65 billion), marine-capture fisheries from the Red Sea, Mediterranean, and associated waters (4.9%; 97,600 tonnes; USD 343 million), and inland/freshwater/rice-field fisheries (17.5%, of which were inland lake fisheries 13.3%, freshwater fisheries 3.9%, and rice-field fisheries 0.3%) [2,3].
Marine-capture fisheries support the livelihoods of approximately 600 million people globally and supply more than 20% of dietary protein for roughly three billion people worldwide [1]. Yet the ecological foundations underpinning these contributions are under severe strain. Overexploitation is driven by excess fishing capacity, weak governance, inadequate enforcement, and the compounding pressures of climate change and habitat degradation [4].
The Red Sea is among the world’s most ecologically distinctive marine ecosystems, characterised by exceptional biodiversity, high endemism, and comparatively resilient coral reef systems [5,6]. Egypt’s Red Sea coastline supports a complex mosaic of artisanal, industrial, and subsistence fisheries vital to coastal livelihoods in areas with limited alternative economic opportunities [7,8]. Hurghada, one of the principal coastal cities of the Egyptian Red Sea Governorate and the dominant hub of regional fishing activity, has seen its fisheries progressively undermined by overexploitation, declining mean trophic levels, habitat degradation, and persistent illegal, unreported, and unregulated (IUU) fishing amid insufficient enforcement capacity [9,10,11].
The Triple Bottom Line (TBL) concept, originally proposed by Elkington [12] as a corporate sustainability framework encompassing environmental, social, and financial pillars, has been adapted for fisheries assessment through tools such as the Fishery Performance Indicators [13]. Nevertheless, translating TBL principles into actionable governance remains challenging in data-limited, artisanal fisheries contexts in the developing world [14].
TBL assessments of small-scale tropical fisheries have gained considerable traction in the Indo-Pacific, Caribbean, and Mediterranean [11,15]. In the Egyptian Red Sea, however, quantitative TBL assessments remain scarce. Existing studies have addressed either the ecological dimension through catch reconstructions, stock assessments, and biological surveys [8,10] or the socio-economic dimension through fisher perception surveys and livelihood analyses [9], but rarely within a unifying framework that integrates all three pillars.
A further dimension of this analytical gap concerns the Northern Red Sea Islands Protected Area (NRSIPA), one of the largest and most ecologically significant protected areas in the Egyptian Red Sea. The NRSIPA encompasses extensive seagrass nursery habitats and mixed seagrass–coral systems that perform critical source–sink functions for regional fish recruitment. Research on analogous tropical reef systems has demonstrated that the proximity and integrity of inshore nursery habitats can exert a greater influence on reef fish biomass than protection from fishing alone [16]. The economic value embedded in the NRSIPA’s fisheries productivity remains unquantified in the Egyptian context [17], representing a critical gap for evidence-based conservation financing and blue economy planning.
The present study responds to this gap by conducting an integrated, three-dimensional TBL assessment of Hurghada’s fisheries (Figure 1). Specifically, the study aims to: (1) characterise the ecological status of Red Sea fisheries; (2) document the socio-economic structure and livelihood conditions of Hurghada’s fishing community; (3) estimate the direct-use value and long-term economic worth of the fisheries; and (4) synthesise findings across all three TBL dimensions to inform evidence-based, co-management policy recommendations. Quantitatively integrating trade-offs and relative weights across the three dimensions into a single composite index is explicitly outside this scope and is identified as a direction for subsequent work (Section 3.4 and Section 4.5).
Figure 1.
Study area map showing the three spatial scales analysed: Hurghada local fishing grounds (local scale), the Northern Red Sea Islands Protected Area (regional scale), and Egypt’s Red Sea EEZ boundary (EEZ scale).
The study operates across three explicitly distinguished spatial scales. First, the local scale refers to Hurghada’s three fishing landing sites (El Arida, El Dahar, and Houd 10) and the fishing grounds immediately accessible to the 343-vessel artisanal fleet operating from these sites (approximately within 50 km of the coast). Primary survey data and production statistics pertain to this local scale. Second, the regional scale encompasses the Northern Red Sea Islands Protected Area (NRSIPA), which extends northward from Hurghada. Ecological assessments and the economic valuation apply to this regional scale. Third, the EEZ scale covers Egypt’s entire Red Sea Exclusive Economic Zone (FAO Area 51), for which the Sea Around Us reconstructed catch series provides long-term ecological trend data.
2. Materials and Methods
2.1. Research Design
This study employed a convergent parallel mixed-methods design, integrating quantitative and qualitative data streams across ecological, social, and economic dimensions [18]. Throughout this paper, the social dimension refers to fisher- and household-level demographic, behavioural, and perceptual conditions (Section 3.2); the economic dimension refers to fishery-level monetary valuation of direct-use and non-market benefits (Section 3.3); and the compound term socio-economic is used, consistent with established usage in the small-scale fisheries literature [9,19], specifically where social and economic conditions are analytically inseparable at the household level (e.g., income diversification, cost exposure, and vulnerability). Four principal data streams were employed. These comprised: (1) systematic literature review and secondary data analysis; (2) key informant consultations; (3) a structured fisher survey; and (4) benefit-transfer economic valuation.
2.2. Literature Review and Secondary Data Analysis
A systematic review was conducted using Web of Science, Scopus, and Google Scholar. Search terms included “Red Sea fisheries”, “Egypt fisheries”, “coral reef economic valuation”, “benefit transfer marine fisheries”, and “Red Sea Northern Islands Protected Area”, applied in combination. The review covered publications from 1950 to 2025, focusing on peer-reviewed studies after 2000 to align with the full catch reconstruction period (1950–2019) and the most recent stock assessment and valuation literature (late 2025). The reviewed literature corpus is summarised in Appendix A (Table A1).
Official production and fleet statistics were obtained from three institutional sources: the Central Agency for Public Mobilisation and Statistics (CAPMAS), the Lakes and Fish Resources Protection and Development Agency (LFRPDA), and the National Institute of Oceanography and Fisheries (NIOF). Data included vessel counts by gear type, total annual fish production for Hurghada (2020–2024), landing-site employment figures, and biological parameter estimates, (e.g., maximum sustainable production and stock size).
The stock-status data for Egypt’s Red Sea Exclusive Economic Zone (EEZ, FAO Area 51) were obtained from the Sea Around Us database (Data Version 50.1) [20], specifically drawing upon the catch reconstruction for Egypt by Tesfamichael and Mehanna [8]. This database provides reconstructed catch time-series (1950–2019) disaggregated by taxon, gear type, and fishing sector (industrial, artisanal, subsistence, recreational) for Egypt’s Red Sea Exclusive Economic Zone (FAO Area 51). While this disaggregation enables analysis of compositional trends, a full systematic analysis of all dimensions was beyond this study’s scope and is identified as a direction for future work. Key taxon- and gear-level trends cited in the text are taken directly from the published reconstruction literature [7,8], not from independent re-analysis of raw data. The dataset used for the present analysis (Data Version 50.1) was accessed and processed only at the level of the five aggregate CSS/NSS stock-status categories; the taxon-, gear-, and sector-disaggregated extract required for CPUE-proxy, gear-specific, and species-level trend analysis was not obtained for the present study. Obtaining and processing that disaggregated extract is accordingly identified in Section 4.5 as a priority for future research.
The Sea Around Us data ended in 2019 because the reconstruction methodology requires a several-year lag for validating reported landings, correcting unreported catches, and reconciling national reporting systems—an inherent limitation of the global approach, not a data gap specific to Egypt. For 2020–2024, this study therefore relies on official LFRPDA and CAPMAS annual statistics, which represent reported landings only and exclude estimates of IUU catches.
2.3. Key Informant Consultations
Structured consultations were conducted with 12 officials and technical staff from three institutional counterparts: the LFRPDA Red Sea Governorate office, the Hurghada branch of NIOF, and the Hurghada Fishermen’s Cooperative. Meetings were conducted in Arabic by the lead author and covered current management practices, regulatory challenges, fleet structure and recent trends, IUU fishing dynamics, and data availability.
2.4. Fisher Survey
A structured questionnaire was administered through face-to-face interviews with 30 active fishers at the Hurghada Fishermen’s Cooperative in October 2025. Participants were recruited using a purposive snowball sampling approach. The sample was deliberately structured to include both vessel owners and crew members, ensuring representation across roles, gear types, and economic strata. While a sample of 30 is acknowledged as modest relative to the registered fleet of approximately 1720 fishers, it is consistent with sample sizes reported in comparable small-scale fisheries perception studies in the region [9] and was constrained by access and time limitations during fieldwork. Findings from the survey are therefore interpreted as indicative rather than statistically representative of the full fishing community.
The instrument comprised four thematic sections: (i) a Demographic and Asset Profile covering role, experience, vessel specifications, and household socio-economics; (ii) a Fishing Effort and Economic Costs section covering trip frequency, fishing patterns, and fuel and operational cost breakdowns; (iii) a Catch and Market Data section covering catch volumes, species composition, and sales channels; and (iv) a Perceptual and Attitudinal section covering perceived environmental change, primary livelihood challenges, and management recommendations.
2.5. Economic Valuation: Benefit-Transfer Method
The economic value of Hurghada’s fisheries was estimated using the benefit-transfer method [21,22,23,24,25]. The method was applied in three stages. First, a review of published per-hectare economic values for coral reef fisheries in the Red Sea and Indo-Pacific identified comparable reference studies. Second, a conservative baseline value of USD 400 per hectare per year (in 2003 USD) was selected from Cesar and van Beukering’s Red Sea-specific valuation [26]. Third, this value was adjusted for inflation at 2.5% per annum to 2025 (yielding an inflation adjustment factor of 1.72 over 22 years), producing an adjusted value of approximately USD 688 per hectare per year. This figure was applied to the estimated productive reef and associated fishing grounds area of 75,000 hectares, as delineated by Hanafy and Sarhan [27].
Net Present Value (NPV) calculations for NRSIPA fisheries were conducted over a 25-year projection horizon (2025–2050) using three social discount rates; 0%, 2.5%, and 5%, reflecting, respectively, a strong sustainability perspective, a moderate social discounting perspective, and a more conservative fiscal planning perspective [26,28]. To contextualise NPV findings within the broader literature, a supplementary benefit-transfer scenario analysis was conducted using per-hectare values from four additional reference studies spanning the Red Sea, the Philippines, Southeast Asia, and Indonesia.
2.6. Statistical Analysis and Quantitative Methods
2.6.1. Time-Series Analysis of Stock-Status Data
Time-series analysis was applied to the Sea Around Us stock-status database (Data Version 50.1, 1950–2019), distinguishing the catch-share stock status (CSS) and number-of-stocks status (NSS). Linear regression (OLS) was fitted to the annual percentage of unsustainable stocks (collapsed + over-exploited) across the full 70-year time series; the coefficient of determination (R2) and p-value for the slope are reported. The Mann–Kendall (MK) non-parametric trend test was selected as the primary inferential method. Kendall’s τ was reported as an effect-size measure of monotonic trend strength. Augmented Dickey–Fuller (ADF) tests were conducted to test for unit roots. Three-year running averages were retained for graphical presentation while raw annual values were used for regression. Cross-validation against LFRPDA official production data (2020–2024) and primary fisher perception survey data was conducted to validate the directionality of trends.
2.6.2. Survey Data Statistical Analysis
Survey data were analysed using descriptive statistics. An independent-samples t-test was applied to compare fishing between high and low fishing seasons. A simple OLS regression was fitted to examine whether years of experience predicted trip duration in the high season. Pearson’s product-moment correlation coefficient assessed associations between spatial fishing variables. Challenge and solution items were analysed as binary multiple-response variables, with results expressed as the percentage of the 30 respondents citing each option. Cross-tabulation was conducted for income dependence on fishing × perception of stock condition. All analyses were conducted in Python 3.12.
3. Results
3.1. Ecological Dimension: Status of Red Sea Fisheries
3.1.1. Red Sea Fisheries: Structure, Exploitation Trends, and Stock Status
Egypt’s Red Sea fisheries contributed approximately 46,000 tonnes in 2022, representing about 2.3% of national fish production by volume but accounting for nearly half of Egypt’s total marine catch (47.1% of the 97,600 tonnes from all marine waters combined), with a total value of approximately USD 82 million [2]. The fisheries supplies high-value species, including groupers, snappers, emperors, and shrimp, that are not readily substitutable by aquaculture and that command premium domestic and regional market prices [29,30].
Red Sea fisheries exhibit a complex multi-sectoral structure encompassing industrial trawl and purse-seine fleets, artisanal hook-and-line and net fisheries, and smaller-scale subsistence and recreational activities [7,31]. Time-series analysis of the Sea Around Us stock-status data (CSS and NSS frameworks, n = 70 annual observations 1950–2019) (Table 1) confirms a statistically unambiguous and monotonic deterioration of stock health across the full 70-year record.
Table 1.
Descriptive statistics and Mann–Kendall trend test results for each stock-status category, Egypt’s Red Sea, 1950–2019.
Under the CSS framework, the developing stock proportion declined from a mean of 83.3% in the pre-exploitation period (1950–1966) to 28.2% during 2010–2019, a trajectory characterised by a Mann–Kendall τ of −0.709 (z = −8.68, p < 0.001) and a linear slope of −1.04 percentage points per year (R2 = 0.731). Over-exploited stocks increased monotonically (τ = +0.410, z = +5.02, p < 0.001; β = +0.37%/yr), with collapsed stocks also increasing significantly (τ = +0.573, z = +7.02, p < 0.001). Under the NSS framework, trends were directionally consistent but of greater magnitude: the developing proportion declined at −1.39 percentage points per year (R2 = 0.938, τ = −0.863), and over-exploited stocks increased at +0.68 percentage points per year (R2 = 0.853, τ = +0.734)—the best-fit linear trend of any series (Figure 2).
Figure 2.
Time series of each stock-status category (%), Egypt’s Red Sea, EEZ 1950–2019.
CSS (solid lines) and NSS (dashed lines) are overlaid for direct comparison. Each panel represents one exploitation category. Stock-status plots assess the status of various taxa by catch tonnage. Stock-status categories are defined using the following criteria (all referring to the maximum, or ‘peak’ catch in each series): Developing (catches ≤ 50% of peak and year is pre-peak, or year of peak is final year of the time series); Exploited (catches ≥ 50% of peak catches); Over-exploited (catches between 50% and 10% of peak and year is post-peak); Collapsed (catches < 10% of peak and year is post-peak); and Rebuilding (catches between 10% and 50% of peak and year is after post-peak minimum). Note that (n), the number of ‘stocks,’ is defined as a time series of a given species, genus, or family (higher and pooled groups have been excluded) for which the first and last reported landings are at least 10 years apart, for which there are at least 5 years of consecutive catches, and for which the cumulative catch in the area under consideration is at least 1000 tonnes.
Period-specific summaries (Table 2) show that NSS-combined unhealthy stocks (collapsed + over-exploited) increased from near-zero in the pre-exploitation era to approximately 46.5% in 2000–2009 and 50.0% in 2010–2019. The recent period (2010–2019) exhibits the highest rebuilding proportions in both datasets (CSS: 5.1%; NSS: 14.4%), signalling early partial recovery in some stocks, though overexploitation remains the dominant condition. Augmented Dickey–Fuller tests found non-stationarity in nine of ten series, confirming that these fisheries have undergone a directional regime shift rather than fluctuating around a sustainable equilibrium. The sole stationary series was NSS-exploited (ADF-p = 0.021). This pervasive non-stationarity reinforces the appropriateness of non-parametric trend testing as the primary inferential method and indicates that projection models assuming mean-reverting stock dynamics will systematically mischaracterise the trajectory of change.
Table 2.
Mean stock status (%) by exploitation category and historical sub-period, Egypt’s Red Sea.
To identify the timing of the regime shift more precisely than the fixed historical sub-periods in Table 2, a Pettitt test for a single most-probable change-point was applied to the combined over-exploited-plus-collapsed series for each framework. For CSS, the most probable change-point falls at 1966 (K = 884, p < 0.001), coinciding almost exactly with the boundary already used to define the pre-exploitation period in Table 2. For NSS, the most probable change-point falls at 1986 (K = 1213, p < 0.001), placing the most abrupt shift within the already-defined development period (1967–1999) but closer to its end than its start. This corroborates the existing period boundaries with an independent, objective statistical test rather than a subjectively chosen historical periodisation and narrows the NSS shift to the mid-1980s specifically.
A systematic divergence between the CSS and NSS frameworks is evident throughout the record (Figure 3). NSS consistently yields higher estimates of overexploitation and collapse than CSS, attributable to a selection bias inherent in the NSS approach: formally assessed stocks are disproportionately commercially important, heavily targeted species. Reporting both frameworks in parallel, rather than relying on a single metric, is essential for robust interpretation [32].
Figure 3.
Combined proportions of over-exploited and collapsed stocks (%), Egypt’s Red Sea, 1950–2019. CSS (solid red) and NSS (dashed orange). Horizontal dotted line marks the 50% threshold.
The Fishing-in-Balance (FiB) index, also shown in Figure 4, provides complementary ecological information: it measures whether changes in the mean trophic level of catches are consistent with the spatial expansion of fishing grounds or not. A stable or increasing FiB index alongside a declining Marine Trophic Index (MTI) indicates that the fisheries has maintained or expanded its catch volume primarily by fishing geographically further offshore and targeting lower-trophic-level species—exactly the pattern observed in Egypt’s Red Sea, where offshore trawl expansion has partially compensated for the depletion of inshore reef fish stocks [7,8]. A declining FiB index, in contrast, would suggest that catches are falling faster than can be explained by shifts in target species, indicating possible ecosystem-level failure. Stock assessments conducted by Mehanna and Samy-Kamal [10] for 55 commercial species document a clear historical progression, with catches peaking around 2010 before declining and with limited signs of stabilisation [11].
Figure 4.
Regional Marine Trophic Index (RMTI; top), Marine Trophic Index (MTI; bottom left), and Fishing-in-Balance Index (FiB; bottom right) trends in the Red Sea, Egypt. In the RMTI panel, dark blue represents the initial inshore region, light blue the subsequent fishing region, and orange the outermost/offshore region. Source: Sea Around Us (Data Version 50.1) based on Food and Agriculture Organisation of the United Nations (FAO) FishStat database.
Excessive fishing effort, fleet overcapacity, weak enforcement, and IUU fishing, which were identified by Farouk-Abdelfattah et al. [9] as the primary drivers of overexploitation, are compounded by habitat degradation, coastal tourism pressures, and intensifying climate-driven stressors, including thermal bleaching events [33,34]. NIOF biological assessments estimate the maximum sustainable production for the Red Sea region at approximately 40,000 tonnes per year [35], against an actual catch of approximately 46,000 tonnes in 2022 [2], indicating an overfishing margin of approximately 15% [1].
3.1.2. Northern Red Sea Islands Protected Area (NRSIPA)
Ecological assessments confirm that the NRSIPA contains a high concentration of fish nursery habitats—particularly extensive seagrass meadows and mixed seagrass–coral systems surrounding islands including Ghanem, Mukawarat, North Qeisim, Tawila, and Goubal [27,33]. These habitats perform a critical source function: spatial analyses show that nursery habitat density is highest in the northern protected zone, generating juvenile fish that disperse to adult populations in adjacent fishing grounds. This source–sink dynamic, consistent with findings from analogous Indo-Pacific reef systems [16], reinforces the NRSIPA’s regional importance beyond its immediate boundaries.
Temporal trend analysis, integrating reconstructed catch data and spatial habitat condition indicators, suggests that fishing pressure within and around the NRSIPA has intensified since the 1970s; however, the protected area has demonstrably moderated some of the most severe ecological impacts observed elsewhere in the Egyptian Red Sea [27]. A critical management challenge identified by both scientific assessment and fisher testimony is the spatial mismatch between the formal protection boundary and the full extent of ecologically critical nursery habitats: several of the most productive nursery areas extend outside strictly protected boundaries, exposing them to unregulated fishing pressure and habitat disturbance.
3.2. Social Dimension: Socio-Economic Profile of Hurghada’s Fishing Community
3.2.1. Fleet Structure and Production
Hurghada constitutes the principal fishing hub of the Red Sea Governorate, with 343 vessels operating from three primary landing sites (Figure 5): El Arida (89 boats, 445 registered fishers), El Dahar (85 boats, 425 fishers), and Houd 10 (169 boats, 850 fishers) [35]. Collectively, these sites account for approximately 32.9% of the governorate’s total registered fishing fleet and 32.4% of its fishing workforce, affirming Hurghada’s role as the dominant centre of Red Sea marine-capture fisheries. The fleet comprises 214 outboard feluccas using line fishing (predominantly handlines and longlines), 107 outboard feluccas using gillnets, and 22 fixed motor launches employing the traditional Shashula fishing method; a configuration reflecting the predominance of small-scale, artisanal fishing consistent with the ecological characteristics and bathymetry of the northern Red Sea shelf [36,37].
Figure 5.
Fishing landing sites in Hurghada, Red Sea Governorate, Egypt.
Coloured polygons in Figure 5 denote the spatial boundaries of the three primary landing-site catchment areas: El Arida (northern polygon), El Dahar (central polygon), and Houd 10 (southern polygon), as delineated by LFRPDA [35]. The polygons represent administrative catchment zones associated with each landing site and do not represent exclusive fishing grounds, as vessels from all sites operate across overlapping areas of the northern Red Sea shelf.
Fish production in Hurghada has exhibited a broadly increasing trajectory over the most recent five-year reporting period, rising from 7979 tonnes in 2020 to a peak of 8800 tonnes in 2023, before a marginal decline to 8750 tonnes in 2024 [2,35]. Production in 2022, the baseline year for this study’s economic valuation, totalled 8227 tonnes. Notably, the fishers’ survey data reveal a concerning trend in household economic vulnerability: 80% of surveyed households report deriving only 0–25% of income from fishing, suggesting progressive income diversification. The implications of this trend for fisheries governance are examined in Section 4.2.
3.2.2. Fisher Demographics and Economic Conditions
The survey captured 30 respondents, the large majority of whom were boat owners (27 of 30; 90%). Mean years of fishing experience was 43.0 years (SD = 14.9; range 15–70 years), indicating a highly experienced workforce with considerable institutional knowledge of local fishing grounds. Mean household size was 5.9 family members (SD = 0.71; range 3–7). Most respondents (80%) reported that fishing contributes only 0–25% of total family income, suggesting that the majority of Hurghada fishing households depend on multiple income streams.
3.2.3. Seasonal Effort Analysis
Fishers operate vessels averaging 7.5 metres in length with 41 horsepower engines and crew complements of four to five individuals, involving approximately five-day trips during which fishers actively fish for around five hours per day, yielding an average catch of approximately 50 kg per boat per day. The majority of catch is sold to wholesale intermediaries, a market structure that constrains fishers’ bargaining power and limits their capture of value-chain margins. Fishing effort differed significantly between high and low seasons (Figure 6). In the high season, respondents averaged 3.8 trips per month (SD = 1.32; range 1–6), with a mean trip duration of 6.1 days (SD = 1.60) and an average of 5.1 fishing hours per day. In the low season, mean trips fell to 2.9 per month (SD = 1.49) and mean trip duration decreased to 4.9 days (SD = 1.32), with 4.3 fishing hours per day. An independent-samples t-test confirmed that the seasonal reduction in trip duration was statistically significant (t = 2.36, p = 0.024), while the difference in trip frequency was marginally significant (t = 1.95, p = 0.059). Estimated total annual fishing days ranged from 30 to 324, with a mean of 216 days per year (SD = 74.8).
Figure 6.
Fishing trips per month in the high and low fishing seasons.
The orange line indicates the median; whiskers indicate the full range. The seasonal difference is marginally significant (p = 0.059).
3.2.4. Spatial Fishing Behaviour
The majority of respondents (67%) reported Basin 10 as their primary landing area, followed by Marsa El Dahar (13%), and Red Sea Islands (7%). Fishing grounds were spread across 13 named sites, including Tawwal, Jubal, Jisium, Al-Fanadir, and Al-Arq among the most frequented (four respondents each). Mean fishing depth was 18.5 m (SD = 8.75; range 5–30 m), and mean distance to fishing ground was 6.1 km from the beach (SD = 10.7; range 1–50 km), indicating that most fishing occurs in relatively shallow nearshore waters. A statistically significant negative correlation was found between distance to fishing ground and depth (r = −0.49, p = 0.048), indicating that more distant sites tend to be shallower—consistent with the spatial configuration of the Red Sea shelf and reef systems surrounding Hurghada. A simple OLS regression was fitted to test whether years of fishing experience predicted the number of days per trip in the high season (Figure 7). The model was not statistically significant (F(1,15) = 0.72, p = 0.74; R2 = 0.007), suggesting that trip duration is not strongly determined by individual experience level alone, and likely reflects vessel capacity, target species, and landing arrangements rather than fisher expertise.
Figure 7.
Scatter plot of fishing experience (years) against high-season trip duration (days). The relationship is not statistically significant (R2 = 0.046, p = 0.41).
3.2.5. Fishing Economic Cost Structure
Boat capital costs varied widely across respondents. Mean total boat acquisition cost (purchase plus renewal) was USD 1556 (SD = USD 1260; median = USD 1325), with individual values ranging from effectively zero (inherited or state-subsidised vessels) to USD 4102. The wide standard deviation and right-skewed distribution reflect heterogeneity in vessel age, size, and mode of acquisition across the fleet. Variable trip-level costs were reported for fuel, ice, bait, food, and other items. Mean fuel cost per trip was USD 75 (SD = USD 42), the largest single variable cost item. Mean ice cost was USD 43 (SD = USD 20), bait USD 71 (SD = USD 46), food USD 123 (SD = USD 46), and other miscellaneous costs USD 129 (SD = USD 114). Mean total variable cost per trip, across respondents providing complete cost breakdowns, was USD 454 (SD = USD 126; range USD 320–841) (Figure 8). Collectively, these figures reflect a sector characterised by low profit margins and high exposure to energy price volatility, consistent with observations from other artisanal Red Sea fisheries [9,37].
Figure 8.
Mean variable costs per fishing trip by cost category (USD ± SD).
3.2.6. Perceived Operational Challenges
As Table 3 explains, high fuel prices were identified as the primary challenge by 56.7% of respondents, followed by regulatory restrictions (50.0%), weather/climate effects (46.7%), declining fish stocks (43.3%), high equipment costs (36.7%), competition from large fleets and illegal fishing (both 30.0%), limited market access (26.7%), and low fish prices (20.0%).
Table 3.
Reported operational challenges.
3.2.7. Perceptions of Environmental Change
Perceptions were predominantly negative across all four indicators assessed: fish size, fish quantity, coral reef condition, and seagrass status (Figure 9). For fish quantity, 69% of respondents providing observations reported deterioration, with 31% perceiving no change and none reporting improvement. For coral reef condition, 71% reported deterioration, and 29% reported no change. Seagrass status showed a similar pattern, with 67% noting deterioration and 27% no change; 6% reported improvement. Fish size perceptions were more mixed, with 38% reporting deterioration, 38% no change, and 24% improvement of some kind. This community testimony corroborates the scientific stock assessments reviewed in Section 3.1 and is consistent with findings from the broader Egyptian Red Sea artisanal fisheries literature [9].
Figure 9.
Stacked bar chart of perceived environmental change by indicator.
Fishers articulated concrete and internally coherent management recommendations. The most widely suggested intervention was financial support through incentives, subsidies or interest-free loans especially during fishing ban periods, stricter/more equitable laws, habitat protection/restoration and better enforcement against illegal fishing.
3.3. Economic Dimension: Valuation of Hurghada’s Fisheries
3.3.1. Direct-Use Value
The direct-use value of Egypt’s fisheries reached approximately USD 3.63 billion in 2022, dominated by aquaculture production [2]. Within this national total, the Red Sea region contributed approximately USD 82 million, with the Hurghada fishing area alone generating an estimated USD 14.73 million from its 2022 production of 8227 tonnes.
3.3.2. Indirect Use Value and Economic Multiplier Effects
Beyond the dockside catch value, fisheries generate substantial indirect economic contributions through multiplier effects on upstream and downstream sectors. Drawing on the global synthesis of marine sector multipliers by Jacobsen et al. [38], who estimated multiplier effects of 1.5 to 3.0 across diverse marine industries, this study applied a conservative multiplier of 1.8 to the Red Sea fisheries context, consistent with the moderate economic diversification of the Hurghada economy and its mix of artisanal and semi-industrial fishing. Application of this multiplier suggests that each dollar of direct fisheries value generates approximately USD 0.80 in additional economic activity through vessel maintenance, fuel supply, net and equipment manufacturing, fish processing, and retail, elevating the estimated annual total economic impact of Hurghada’s fisheries to approximately USD 26.51 million.
In terms of employment, Hurghada’s fisheries directly supports 1720 registered fishers on 343 vessels. Applying global benchmarks of 0.5 to 1.0 jobs per tonne of production [38] to the 2022 production volume of 8227 tonnes implies direct and indirect employment for between 4100 and 8200 individuals. With each fisher supporting an average of six dependants, fishing-related income sustains the livelihoods of approximately 10,320 individuals in the Hurghada community, despite fisheries constituting a maximum of 25% of total household income.
3.3.3. Net Present Value of NRSIPA Fisheries (2025–2050)
NPV calculations for direct fisheries benefits from coral reefs in the NRSIPA over the 2025–2050 horizon yielded estimates ranging from USD 375 million at a 5% discount rate to USD 679 million at a 0% discount rate, with an intermediate estimate of USD 495 million at a 2.5% discount rate (Table 4). The wide range reflects policy-relevant variation in the valuation of future ecosystem benefits across different intergenerational equity frameworks [28]. Annual equivalent values range from USD 14.4 million at a 5% discount rate to USD 26.1 million at a 0% discount rate. Per-hectare annual values derived from these calculations range from USD 193 at a 5% discount rate to USD 348 at a 0% discount rate, providing a site-specific reference point for conservation investment cost-effectiveness analysis.
Table 4.
NPV of NRSIPA fisheries benefits across discount rates (2025–2050).
To contextualise these findings within the broader literature, a supplementary benefit-transfer scenario analysis was conducted using per-hectare values from four comparable reference studies. Under a conservative scenario based on the Red Sea regional average [7], the annual fisheries value is estimated at USD 22.28 million, yielding 25-year NPVs of USD 556.9 million, USD 390.8 million, and USD 280.9 million at discount rates of 0%, 2.5%, and 5%, respectively. A moderate scenario based on the median of four comparable studies [39,40] yields an annual value of USD 31.95 million and NPVs of USD 798.8 million, USD 560.5 million, and USD 403.1 million. A high scenario based on a well-managed marine-protected area in Wakatobi National Park, Indonesia [41], yields an annual value of USD 129.90 million and NPVs of USD 3.25 billion, USD 2.28 billion, and USD 1.64 billion at the respective discount rates (Table 5).
Table 5.
Benefit-transfer scenarios for NRSIPA annual fisheries value and NPV (million USD) over a 25-year horizon.
These figures represent a conservative lower bound, as they incorporate only direct fisheries benefits. The NRSIPA’s total ecosystem value, including tourism, coastal protection, carbon sequestration, and biodiversity provisioning, is estimated to be 2 to 10 times higher than the fisheries component alone [41,42], implying a broader ecosystem value potentially ranging between USD 1.04 billion and USD 4.17 billion, and providing a robust economic justification for conservation investments that remain below these NPV thresholds.
3.4. TBL Integration: Sustainability Scorecard
Table 6 synthesises the integrated sustainability status across all three TBL dimensions, mapping each key performance indicator against its observed value, reference threshold, and evidence-based classification. The matrix confirms that the Ecological pillar is predominantly critical (composite score 0.20) and the Social pillar is critical-to-mixed (0.38), while the Economic pillar is comparatively positive (0.67), though not uniformly so, since the bioeconomic depletion scenario remains classified as at risk. This divergence is not paradoxical: the positive economic signal is the net present value of benefits that continued conservation investment can still secure, not a claim that the fishery is currently thriving. The magnitude of that NPV is itself a function of the resource’s present degraded-but-recoverable state and would fall toward zero under continued unmanaged decline (see the depletion scenario below).
Table 6.
Operationalised TBL indicator framework for Hurghada’s fisheries.
The three TBL pillars interact directionally. Ecologically, declining stock conditions reduce catch per unit effort (Ecological→Social), directly compressing household income. Economically, the high net present value of NRSIPA fisheries (USD 375–679 million over 25 years) establishes a clear investment case for conservation measures that could rebuild stocks and improve long-run CPUE (Economic→Ecological). Socially, the community’s demonstrated willingness to support IUU enforcement and seasonal closures—conditional on financial compensation—provides a governance pathway through which the Ecological–Social–Economic system could shift from a trade-off dynamic to a mutually reinforcing one (Social→Ecological→Economic) [43]. A formal composite-index integration was beyond the scope of this study and is identified as a priority for future research. Table 6 is accordingly best read as a structured indicator inventory rather than a weighted or trade-off-optimised composite index, and the ecological–economic linkage described above is a narrative synthesis of interaction pathways rather than a coupled bioeconomic model, since the ecological and economic data underlying it derive from different spatial scales and time horizons (Section 4.5).
To move beyond a purely qualitative indicator inventory, the 11 status classifications in Table 6 were converted to an illustrative composite TBL score using a disclosed ordinal rubric (Critical = 0.00, At risk = 0.33, Mixed = 0.50, Adequate/Positive = 0.67, Strong case = 1.00), averaged first within each pillar and then equally across the three pillars. This yields pillar scores of 0.17 (Ecological), 0.38 (Social), and 0.67 (Economic), and an overall composite score of 0.40 on a 0–1 scale where 0 represents uniformly critical status and 1 represents uniformly sustainable status. A coarser four-band rubric (0.00/0.25/0.50/0.75) produces materially similar results (0.13, 0.38, 0.58; overall 0.36), indicating that the ranking of pillars—and the overall critical-leaning classification—is not an artefact of the specific rubric chosen. This composite is explicitly a first-order, equally weighted transformation of already-reported categorical judgements, not a stakeholder-elicited multi-criteria index with defensible relative weights; it operationalises Table 6 quantitatively while stopping well short of claiming a validated trade-off-weighted index, consistent with the scope limitation already stated above. The resulting illustrative composite scores are presented in Table 7.
Table 7.
Illustrative composite TBL index derived from Table 6 status classifications.
The NRSIPA NPV estimates reported in Table 4 assume that fisheries productivity is maintained at current levels; this baseline is contingent on sustained management action. Drawing on Mamdouh-Lotfy et al. [11], who estimate that current fishing effort exceeds the bioeconomic optimum by approximately 40%, the status quo trajectory implies a progressive erosion of productive potential. Under a linear depletion assumption, a 40% reduction in stock productivity by 2050 would proportionally erode the NPV of NRSIPA fisheries benefits reported in Table 4; Table 8 quantifies this foregone value directly from the Table 4 baseline across a range of depletion scenarios and discount rates. Conversely, implementing the recommended 40% effort reduction by 2030 could restore productivity toward maximum sustainable yield levels, potentially increasing annual fisheries value by 20–30% within a decade [44]. The NPV figures in Table 4 should therefore be read as a conservative floor, not a guaranteed outcome under the status quo.
Table 8.
NPV of NRSIPA fisheries benefits under linear productivity depletion scenarios (2025–2050), anchored to the published Table 4 baseline.
Table 8 quantifies the foregone value of continued stock depletion directly from the Table 4 NPV baseline using the relative depletion fraction, so its results do not depend on the per-hectare annual value used elsewhere in this section.
Depletion was assumed to increase linearly from 0% in 2025 to the stated percentage in 2050. Foregone value = baseline of Table 4 NPV minus depleted-scenario NPV, computed by discounting the same relative productivity path used for the baseline so results are anchored directly to the Table 4 NPV baseline. At 40% depletion, the foregone value ranges from USD 59.0 million (5% discount rate) to USD 135.8 million (0% discount rate).
4. Discussion
4.1. Ecological Sustainability and the Imperative for Adaptive Governance
The discussion below distinguishes three tiers of claim: findings directly supported by the ecological, survey, and valuation data generated in this study; interpretations drawn from comparison with the published Red Sea and regional fisheries literature; and broader management recommendations informed by international experience where local calibration is not yet available. The ecological findings of this study provide unambiguous evidence that Hurghada’s fisheries are operating at or beyond ecologically sustainable thresholds. The convergent indicators of overexploitation reported in Section 3.1.1 collectively constitute a pattern consistent with advanced stages of fishery degradation documented across diverse tropical reef fisheries globally [10,11,45].
The time-series analysis presented in Section 3.1.1 substantially strengthens these conclusions by quantifying the rate and statistical robustness of the deterioration trajectory. The Mann–Kendall trend results confirm that the observed directional change is not attributable to random inter-annual variability (all p < 0.001) and that the system has undergone a structural regime shift in exploitation status—a finding underscored by the pervasive non-stationarity of all series. The acceleration of stock deterioration during 2000–2009 is consistent with global patterns in data-limited tropical seas [46,47] and coincides with documented fleet capacity investments and increasing export demand for Egyptian Red Sea species. The partial recovery signal in the rebuilding category during 2010–2019 may reflect early effects of management interventions introduced in this period, though overexploitation remains the dominant stock condition.
However, it is critical to recognise that the overshoot reported in Section 3.1.1 represents only the current flow deficit relative to MSY. Because the stock has been subject to prolonged growth overfishing and recruitment impairment, simply reducing catch to the MSY level would stabilise the stock at a depleted state but would not facilitate biomass rebuilding to more productive target reference points. Bioeconomic modelling of Egyptian Red Sea fisheries by Mamdouh-Lotfy et al. [11] demonstrates that a more substantial reduction in fishing effort, on the order of 40%, is necessary to reverse the trajectory of decline and restore stocks to levels capable of supporting long-term sustainable yields.
The NRSIPA emerges from this assessment as an ecologically critical asset whose effective management is indispensable for the long-term productivity of the broader regional fishery. Its function as a source area for juvenile fish recruitment, maintained by the integrity of extensive seagrass nursery habitats, provides an ecological subsidy to surrounding fishing grounds whose monetary value dwarfs conventional estimates of direct catch value. This finding resonates strongly with Nagelkerken et al.’s demonstration that proximity to intact nursery habitats can generate reef fish biomass enhancements of up to 249% [16], substantially exceeding the biomass benefits of protection from fishing alone. The spatial mismatch between current protection boundaries and the full extent of ecologically critical nursery habitats represents the most immediately actionable governance gap identified by this assessment: realigning protection to encompass these habitats should be a priority.
Broader Red Sea governance reforms are equally essential. The persistence of IUU fishing, identified by surveyed fishers (Section 3.2.6) as a critical problem affecting the viability of compliant operators, underlines the central role of enforcement capacity in translating formal regulations into ecological outcomes [9]. Recent Egyptian government measures, including temporary bans on Red Sea fish trade during breeding seasons and suspensions of recreational fishing, represent meaningful steps toward addressing overexploitation [48]; however, sustained enforcement investment and the development of monitoring, control, and surveillance (MCS) systems remain essential prerequisites for durable stock recovery. Furthermore, the effectiveness of strictly protected MPAs relative to partially managed zones has been confirmed in a comprehensive review by Costello et al. [44], who found economic fisheries benefits adjacent to MPAs in 25 countries, with fully protected no-take reserves consistently outperforming more complex partial-use arrangements. This international pattern was not tested directly against NRSIPA-specific data in the present study, but it provides a reasoned, literature-based case for extending strict protection to the NRSIPA’s nursery habitat periphery.
4.2. Socio-Economic Vulnerability, Co-Management, and the Governance of Small-Scale Fisheries
The socio-economic profile of Hurghada’s fishing community documented in this study reveals a sector under compounding and potentially mutually reinforcing pressures. High and increasing operational costs, driven primarily by fuel price volatility, combined with declining catch per unit effort and constrained market access, erode the economic viability of small-scale fishing households [9]. The quantitative survey analysis reveals several findings of governance significance. The concentration of respondents at low levels of fishing income dependence (Section 3.2.2)—against a simple majority that might be expected for registered cooperative members—may reflect adaptive income diversification or, alternatively, progressive push-out from fishing under conditions of economic unviability (“distress diversification” [19]). The statistically significant seasonal contraction in trip duration (Section 3.2.3) demonstrates that the fleet does adaptively reduce effort under adverse conditions, providing a behavioural foundation for fisheries management interventions that create positive incentives for voluntary effort reduction. The non-significant relationship between experience and operational effort (Section 3.2.4) suggests that structural constraints—fuel costs, regulatory environment, market access—are the dominant drivers of fishing behaviour, not individual expertise. This finding challenges assumptions embedded in some traditional fisheries management models that treat experience as a proxy for productivity and underlines the primacy of economic incentive design in co-management frameworks.
Smallhorn-West et al. [49], in a global synthesis linking small-scale fisheries co-management to SDG achievement, further emphasise that socio-economic vulnerability in artisanal fisheries is not merely a welfare concern but a governance obstacle: communities under acute economic stress are structurally less able to engage in long-term co-management arrangements that require short-term income sacrifice for long-term ecological and economic gains.
The community’s articulation of concrete, internally coherent management recommendations, particularly the strong support for IUU enforcement, which benefits compliant fishers directly by removing competitive distortions, provides an important foundation for co-management design. Co-management approaches that formally integrate fisher knowledge, establish shared monitoring responsibilities, and link compliance to tangible economic benefits (such as priority access to financial support or premium market programmes) have demonstrated effectiveness in analogous small-scale tropical fisheries [9,43]. The fisher community’s willingness to support seasonal closures, contingent on financial compensation during closure periods, indicates a pragmatic recognition of the long-term trade-off between short-term income foregone and medium-term stock recovery, provided economic welfare is not sacrificed in the process. This conditionality is consistent with the theoretical framework underpinning Ostrom’s [43] principles for governing commons: communities will support self-imposed restrictions on access only when they perceive the rules as legitimate, the monitoring as credible, and the distribution of costs and benefits as broadly equitable. The demand by surveyed fishers for stricter IUU enforcement, directed at third-party violators rather than themselves, reflects a mature understanding of common-pool resource dynamics that policymakers should leverage explicitly in co-management design, ensuring that enforcement gains are visible and directly attributable to the fishing community’s own advocacy.
The wholesale market structure identified by this survey, in which the majority of fishers sell to intermediaries with limited bargaining power, constitutes a structural barrier to value capture that compounds the income pressures created by high operational costs and declining catches. Market-oriented interventions, including the development of transparent fish auction systems, direct market linkages, and collective marketing through cooperative structures, could enhance fisher welfare without requiring increases in fishing effort, and should be pursued alongside ecological management measures.
4.3. Economic Valuation and the Investment Case for Conservation
The economic valuation results establish a compelling and multifaceted financial case for strengthened conservation investment in the NRSIPA and adjacent waters. The NPV of direct fisheries benefits reported in Section 3.3.3 implies that conservation investments well below this threshold represent rational economic choices under any reasonable discounting framework. The multiplier analysis further demonstrates that the broader economic contribution of Hurghada’s fisheries to the regional economy substantially exceeds the simple market value of landed catch [38], a finding that is particularly relevant for policy arguments addressing the full employment and welfare implications of fisheries decline. Contextualising the NRSIPA’s NPV range against these benchmarks suggests that it compares favourably with well-studied MPA systems in the Pacific and Caribbean, even under the conservative assumptions employed here. Furthermore, the recent EBRD [39] Natural Capital Valuation for the Red Sea Landscape explicitly places Hurghada’s reef systems among the highest-priority sites for natural capital accounting in the region, lending institutional credibility to the economic estimates presented in this study and supporting their use as the basis for conservation financing proposals.
The benefit-transfer scenarios, while inherently subject to methodological limitations, including potential contextual non-equivalence, site-specific productivity differences, and uncertainty in area estimates, provide a range of economically credible estimates. These limitations are addressed comprehensively in Section 4.5. The finding that the total ecosystem value of the NRSIPA substantially exceeds the fisheries component alone provides an especially robust argument for integrating the NRSIPA into Egypt’s emerging natural capital accounting frameworks. A critical methodological consideration that warrants explicit acknowledgement is the inherent conservative bias introduced by restricting valuation to direct fisheries provisioning services. Applying a more comprehensive TEV framework would likely raise the NRSIPA’s economic value estimate by an order of magnitude beyond the fisheries-only figures presented here. Future work in the Egyptian Red Sea context should prioritise willingness-to-pay studies for non-use values and empirical assessments of coastal protection benefits, which in storm-exposed reef systems can represent the largest single component of total economic value [26,42].
The study also highlights the critical policy relevance of discount rate choice in natural capital valuation. The more-than-threefold difference in NPV estimates between the 0% and 5% discount rate scenarios (Table 4) illustrates how intergenerational equity assumptions can substantially affect the apparent financial case for conservation, and reinforces the argument for presenting NPV estimates across a range of discount rates rather than selecting a single “business-as-usual” rate that may systematically undervalue long-horizon ecosystem services [28].
The bioeconomic framing introduced in Section 3.3 provides an important qualification: these NPV estimates are contingent on maintaining productivity at current levels. Under a continued-depletion scenario, the discounted present value of foregone productivity represents an additional economic argument for precautionary management, over and above the direct conservation value.
4.4. Policy Implications and Management Recommendations
The convergence of ecological deterioration, socio-economic vulnerability, and substantial economic value creates an urgent and well-evidenced case for comprehensive, integrated management action. Priority near-term interventions, several of which are already partially underway through Egyptian government decrees, include: (1) a substantial reduction in fishing effort through transparent vessel decommissioning programmes with appropriate compensation; (2) strengthened MCS capacity and prosecution of IUU fishing, addressing the 30% of fishers who identify it as a systemic competitive threat; (3) emergency protection of critical nursery habitats presently outside formal NRSIPA boundaries; and (4) the establishment of co-management frameworks at the Hurghada level that institutionalise fisher participation in monitoring, compliance, and adaptive management. Sequencing matters as much as content: the socio-economic evidence indicates that effort reduction imposed before compensation and enforcement are in place would fall hardest on operators who are already marginal. While the present study’s own data do not permit direct estimation of an optimal effort-reduction magnitude for Hurghada, this magnitude of fleet rationalisation is consistent with evidence from comparable developing-country decommissioning programmes in the Mediterranean and the Indo-Pacific, which have demonstrated that effort reductions of 30–50% can generate statistically significant stock recovery within five to ten years when accompanied by credible enforcement [45]. The call for rights-based management incorporating limited-entry licencing and individual fishing quotas is informed by the following literature. A global meta-analysis by Costello et al. [44] found that rights-based management reduced the probability of stock collapse by more than 50% relative to open-access regimes. Cross-country panel evidence corroborates that secure property rights are associated with a lower collapse probability, though the strength of this relationship varies with species value, resource regeneration capacity, and the enforceability of rights, and is not uniform across contexts [50]. Outcomes specifically in small-scale, developing-country fisheries have been more mixed than a straightforward extrapolation of the Costello et al. finding would suggest [51], a qualification taken up directly below.
Over the medium term, the sector would benefit from a transition toward rights-based management incorporating limited-entry licencing and individual fishing quotas, aligned with ecosystem-based reference points [11,45]. This recommendation is qualified rather than unconditional: in some small-scale fisheries, fully tradable individual quotas have produced job losses, consolidation of access among wealthier operators, and weakened bargaining power for crew and smaller vessel owners [51]. Factoring these distributional risks in, a transition designed as tradable, open-market ITQs would not straightforwardly benefit the Hurghada fleet as currently structured (343 vessels, predominantly small feluccas). A limited-entry or territorial-use-rights (TURF) design that allocates access to existing Hurghada-based vessel owners and crew, rather than issuing freely tradable permits, would be expected to preserve the effort-control benefits described above while mitigating these equity risks; this qualification should be treated as a design requirement, not an implementation detail. Financial mechanisms linking coastal tourism revenue to conservation outcomes, a payment-for-ecosystem-services (PES) model, could provide a sustainable funding stream for both MCS capacity and fisher economic diversification programmes, leveraging the high-value tourism economy already established in Hurghada [52]. The development of electronic logbook systems and near-real-time catch reporting, allied with capacity building in the NIOF and LFRPDA, is a prerequisite for the evidence-based adaptive management that sustainable Red Sea fisheries ultimately require [39].
4.5. Study Limitations and Directions for Future Research
Some limitations warrant acknowledgment. First, the survey sample of 30 fishers is not statistically representative; it draws exclusively from cooperative-affiliated, registered fishers, so findings are indicative rather than generalisable. Future work should employ stratified random sampling across landing sites, gear types, and vessel classes. Additionally, purposive interviews with women involved in fish processing and marketing would strengthen the socio-economic analysis and better capture gender-related fisheries vulnerabilities [53]. Second, the ecological assessment relies heavily on reconstructed catch time-series from the Sea Around Us project, which carries estimation uncertainty over the 70-year record; the estimated overfishing margin should be treated as an order-of-magnitude indicator. Priority future work includes independent stock assessments using acoustic surveys, length-frequency analysis, and standardised CPUE time-series at landing sites. Third, the benefit-transfer economic valuation inherits uncertainty from reference sites in different geographic and ecological contexts. Conducting primary contingent valuation or choice experiments among fishers and dive operators, and integrating climate change scenarios (e.g., RCP-based bleaching projections) into NPV analyses, would substantially improve realism and policy relevance [54]. Fourth, the study relies on the aggregate CSS/NSS stock-status series rather than the taxon-, gear-, and sector-disaggregated extract that the Sea Around Us database also makes available; obtaining and analysing the Sea Around Us EEZ-level disaggregated data (by taxon, gear, and sector) is accordingly the single highest-priority next step to distinguish the relative contributions of industrial trawling versus artisanal line fishing, to construct a CPUE proxy, and to test for species-level exploitation trajectories to the observed overexploitation trajectory.
Fifth, notwithstanding the explicit three-scale framework introduced in Section 1, some inferential statements in this Discussion draw on EEZ-scale ecological trend data to help characterise conditions at the Hurghada local scale. This residual scale-mixing should be read as an assumption of broad regional consistency rather than a locally validated finding, pending landing-site-specific stock data. Sixth, regarding this study’s relationship to prior Red Sea fisheries research: its principal contribution lies in combining EEZ-scale ecological trend data, Hurghada-specific survey evidence, and site-specific NPV valuation within a single analytical frame, a combination not previously available for this system. This is not merely a qualitative claim: the present study’s finding that 50.0% of NSS-assessed stocks were over-exploited or collapsed over 2010–2019 is directly corroborated by Mehanna and Samy-Kamal [10], whose independent species-level assessment of 55 commercial Red Sea species found 50 of 55 (90.9%) to be over-exploited under Gulland’s [55] exploitation-ratio criterion, and who recommended a fishing-mortality reduction of 20–70% to reach the optimum exploitation level—a range that brackets, and so independently corroborates, the 40% effort-reduction figure drawn from Mamdouh-Lotfy et al. [11] and used throughout Section 3.4 and Section 4.4. At the social level, Farouk-Abdelfattah et al. [9] found that nearly all surveyed Egyptian Red Sea artisan fishers reported declining catches, with 61% attributing the decline directly to overfishing, and that median artisanal income was only 54% of the mean rural Egyptian income—figures that this study’s 69% deterioration-perception rate and USD 454 mean trip cost against a background of income diversification are directionally consistent with, while being drawn from an independent Hurghada-specific sample rather than duplicating it. Systematic, point-by-point benchmarking beyond these two corroborating comparisons was not undertaken here and remains a priority for subsequent work.
5. Conclusions
This study has deployed a Triple Bottom Line assessment framework to provide an integrated ecological, social, and economic evaluation of Hurghada’s fisheries, one of the most economically significant and ecologically stressed fishery systems in the Egyptian Red Sea. The findings across all three analytical dimensions converge on a consistent and urgent diagnosis: this fishery system is under compounding pressures that, without coordinated and evidence-based management intervention, are likely to accelerate its ecological and economic deterioration.
On the Ecological dimension, time-series analysis (Mann–Kendall trend tests, all p < 0.001) confirms that the long-term deterioration of stock status is statistically robust and monotonic across both the CSS and NSS frameworks, with developing stocks declining at −1.04 to −1.39 percentage points per year and over-exploited stocks increasing at +0.37 to +0.68 percentage points per year over 1950–2019. The NRSIPA, while demonstrably preserving critical nursery functions and maintaining higher relative biodiversity, is ecologically constrained by fishing pressure outside its boundaries and by a spatial mismatch between current protection zones and the full extent of productive nursery habitats.
On the Social dimension, quantitative survey analysis documents that 80% of Hurghada fishing households derive less than 25% of income from fishing, with mean total variable costs per trip of USD 454 dominated by food (USD 123) and fuel (USD 75). Statistically significant seasonal effort reduction (t = 2.36, p = 0.024) indicates adaptive capacity, while widespread negative environmental perceptions (fish quantity deteriorated: 69%; coral reef deteriorated: 71%) corroborate the scientific stock-status findings. On the Economic dimension, the direct economic value of Hurghada’s fisheries (USD 26.51 million/year with multiplier effects) and the 25-year NPV of NRSIPA fisheries (USD 375–679 million) represent a substantial natural asset whose preservation is both ecologically imperative and economically rational—provided that current stock depletion trajectories are reversed.
The NRSIPA emerges from this analysis as the ecological cornerstone of a sustainable future for Red Sea fisheries in the Hurghada region. Realising this potential requires, above all, the development of a governance environment characterised by co-management, adequate enforcement, rights-based access, and integrated spatial planning that aligns conservation objectives with fisheries dynamics. The evidence assembled in this study provides a robust, multi-dimensional foundation for policymakers, marine managers, international development partners, and local stakeholders to build the institutional and financial architecture necessary for the long-term sustainability of Hurghada’s marine resources.
Author Contributions
Conceptualization, M.S., R.T. and Y.H.; methodology, M.S. and R.T.; software, M.S.; validation, R.T., Y.H. and F.A.; formal analysis, M.S. and R.T.; data curation, M.S. and Y.H.; writing—original draft preparation, M.S. and R.T.; writing—review and editing, M.S., R.T., Y.H. and F.A.; visualisation, M.S. All authors have read and agreed to the published version of the manuscript.
Funding
This work was supported by the Deanship of Scientific Research, Vice Presidency for Graduate Studies and Scientific Research, King Faisal University, Saudi Arabia [Grant No. KFU262331].
Informed Consent Statement
Informed consent was obtained from all subjects involved in the study.
Data Availability Statement
The raw data supporting the conclusions of this article will be made available by the authors on request.
Acknowledgments
The authors express gratitude to the fishers of Hurghada who participated in the survey, the staff of the Hurghada Fishermen’s Cooperative, and officials from the LFRPDA and NIOF for their cooperation and data sharing. The Green Hurghada Project team at UNIDO and EEAA are acknowledged for institutional support throughout the study.
Conflicts of Interest
The authors declare no conflicts of interest.
Appendix A
Table A1.
Reviewed literature corpus.
References
- Food and Agriculture Organization of the United Nations (FAO). The State of World Fisheries and Aquaculture—Blue Transformation in Action; FAO: Rome, Italy, 2024; pp. R1–R232. [Google Scholar]
- Central Agency for Public Mobilization and Statistics (CAPMAS). Fish Production Statistics, 2022; CAPMAS: Cairo, Egypt, 2024. [Google Scholar]
- Mehanna, S.F. Egyptian Marine Fisheries and Its Sustainability. In Sustainable Fish Production and Processing; Elsevier: Amsterdam, The Netherlands, 2022; pp. 111–140. [Google Scholar]
- OECD; FAO. Fish and Other Aquatic Products: OECD-FAO Agricultural Outlook 2025–2034. Available online: https://www.oecd.org/en/publications/oecd-fao-agricultural-outlook-2025-2034_601276cd-en/full-report/fish-and-other-aquatic-products_ed13346f.html (accessed on 8 April 2026).
- Kotb, M.; Abdulaziz, M.; Al-Agwan, Z.; Alshaikh, K.; Al-Yami, H.; Banajah, A.; Devantier, L.; Eisinger, M.; Eltayeb, M.; Hassan, M. Status of Coral Reefs in the Red Sea and Gulf of Aden in 2004. In Status of Coral Reefs of the World, 2004; Australian Institute of Marine Science: Townsville, Australia, 2004; Volume 1, pp. 137–154. [Google Scholar]
- Tawfik, R. The Application of D (A) PSI (W) R (M) Framework to Coral Reef Conservation. Sustainability 2023, 15, 9133. [Google Scholar] [CrossRef] [Scilit]
- Khalfallah, M.; White, R.; Cashion, T.; Derrick, B.; Noël, S.-L.; Page, E.; Relano, V. Red Sea and Gulf of Aden Countries: Updated Catch Reconstructions to 2018; Fisheries Centre Research Reports; University of British Columbia, Fisheries Centre: Vancouver, BC, Canada, 2020; Volume 28, pp. 346–364. [Google Scholar]
- Tesfamichael, D.; Mehanna, S.F. Reconstructing Red Sea Fisheries of Egypt: Heavy Investment and Fisheries. In Catch Reconstruction for the Red Sea Large Marine Ecosystem by Countries (1950–2010); Fisheries Centre Research Reports; University of British Columbia: Vancouver, BC, Canada, 2012; Volume 20, pp. 23–50. [Google Scholar]
- Farouk-Abdelfattah, R.; Schuchert, P.; Farnsworth, K.D. Pressures on Egyptian Red Sea Fisheries from the Artisan Fishers’ Perspective. Ocean Coast. Manag. 2024, 258, 107406. [Google Scholar] [CrossRef] [Scilit]
- Mehanna, S.F.; Samy-Kamal, M. Population Dynamics Parameters and Exploitation Status of 55 Commercial Species in Egyptian Red Sea Fisheries: A Key to Sustainable Fisheries. Fishes 2024, 9, 255. [Google Scholar] [CrossRef] [Scilit]
- Mamdouh-Lotfy, M.; Samy-Kamal, M.; Nam, J.; Sim, S. Bioeconomic Analysis of Egyptian Mediterranean and Red Sea Fisheries: Implications for Sustainable Management. Reg. Stud. Mar. Sci. 2025, 89, 104277. [Google Scholar] [CrossRef] [Scilit]
- Elkington, J. Towards the Sustainable Corporation: Win-Win-Win Business Strategies for Sustainable Development. Calif. Manag. Rev. 1994, 36, 90–100. [Google Scholar] [CrossRef] [Scilit]
- Anderson, J.L.; Anderson, C.M.; Chu, J.; Meredith, J.; Asche, F.; Sylvia, G.; Smith, M.D.; Anggraeni, D.; Arthur, R.; Guttormsen, A. The Fishery Performance Indicators: A Management Tool for Triple Bottom Line Outcomes. PLoS ONE 2015, 10, e0122809. [Google Scholar] [CrossRef] [Scilit]
- Asche, F.; Garlock, T.M.; Anderson, J.L.; Bush, S.R.; Smith, M.D.; Anderson, C.M.; Chu, J.; Garrett, K.A.; Lem, A.; Lorenzen, K. Three Pillars of Sustainability in Fisheries. Proc. Natl. Acad. Sci. USA 2018, 115, 11221–11225. [Google Scholar] [CrossRef] [Scilit]
- Marco, J.; Valderrama, D.; Rueda, M. Triple Bottom Line Assessment for the Historically Underperforming Colombian Queen Conch Fishery. Mar. Policy 2021, 125, 104257. [Google Scholar] [CrossRef] [Scilit]
- Nagelkerken, I.; Grol, M.G.; Mumby, P.J. Effects of Marine Reserves versus Nursery Habitat Availability on Structure of Reef Fish Communities. PLoS ONE 2012, 7, e36906. [Google Scholar] [CrossRef] [Scilit]
- Sarhan, M.; Tawfik, R. The Economic Valuation of Mangrove Forest Ecosystem Services: Implications for Protected Area Conservation. Georg. Wright Forum 2018, 35, 341–349. [Google Scholar]
- Creswell, J.W.; Clark, V.L.P. Designing and Conducting Mixed Methods Research; Sage Publications: Thousand Oaks, CA, USA, 2017. [Google Scholar]
- Béné, C.; Arthur, R.; Norbury, H.; Allison, E.H.; Beveridge, M.; Bush, S.; Campling, L.; Leschen, W.; Little, D.; Squires, D. Contribution of Fisheries and Aquaculture to Food Security and Poverty Reduction: Assessing the Current Evidence. World Dev. 2016, 79, 177–196. [Google Scholar] [CrossRef] [Scilit]
- Pauly, D.; Zeller, D.; Palomares, M.L.D. Sea Around Us: Concepts, Design and Data 2020. Available online: https://www.seaaroundus.org (accessed on 5 May 2025).
- Harper, S.; Adshade, M.; Lam, V.W.; Pauly, D.; Sumaila, U.R. Valuing Invisible Catches: Estimating the Global Contribution by Women to Small-Scale Marine Capture Fisheries Production. PLoS ONE 2020, 15, e0228912. [Google Scholar] [CrossRef] [Scilit]
- Pandeya, B.; Buytaert, W.; Zulkafli, Z.; Karpouzoglou, T.; Mao, F.; Hannah, D.M. A Comparative Analysis of Ecosystem Services Valuation Approaches for Application at the Local Scale and in Data Scarce Regions. Ecosyst. Serv. 2016, 22, 250–259. [Google Scholar] [CrossRef] [Scilit]
- Navrud, S.; Ready, R. Lessons Learned for Environmental Value Transfer. In Environmental Value Transfer: Issues and Methods; Springer: Berlin/Heidelberg, Germany, 2007; pp. 283–290. [Google Scholar]
- Boutwell, J.L.; Westra, J.V. Benefit Transfer: A Review of Methodologies and Challenges. Resources 2013, 2, 517–527. [Google Scholar] [CrossRef] [Scilit]
- Johnston, R.J.; Rolfe, J.; Rosenberger, R.S.; Brouwer, R. Benefit Transfer of Environmental and Resource Values; The Economics of Non-Market Goods and Resources; Springer: Berlin/Heidelberg, Germany, 2015; Volume 14. [Google Scholar]
- Cesar, H.S.J.; van Beukering, P.J.H. Economic Valuation of the Egyptian Red Sea Coral Reef; Policy Research Working Paper Series; The World Bank: Washington, DC, USA, 2004. [Google Scholar]
- Hanafy, M.; Sarhan, M. Ecological Assessment, Conservation Plans and Policy Recommendations for Hurghada’s Natural Capital; UNIDO: Vienna, Austria; Egyptian Environmental Affairs Agency (EEAA): Cairo, Egypt, 2025. [Google Scholar]
- Brink, P.; Berghöfer, A.; Schröter-Schlaack, C.; Sukhdev, P.; Vakrou, A.; White, S.; Wittmer, H. TEEB—The Economics of Ecosystems and Biodiversity for National and International Policy Makers 2009; TEEB: Geneva, Switzerland, 2009. [Google Scholar]
- Fattouh, S.A.; Ahmad, M.K. Fish Catch and Its Economics in the Southern Part of the Egyptian Red Sea Fisheries. Alex. Sci. Exch. J. 2016, 37, 121–137. [Google Scholar] [CrossRef] [Scilit]
- El-Mahdy, S.M.; Osman, Y.A.; Maiyza, S.I.; Mohammad, A.S.; Hassanien, E.M. Fish Production and Evaluation of the Fishery Status for Shalateen Fishing Area, Red Sea, Egypt. Egypt. J. Aquat. Biol. Fish. 2023, 27, 439. [Google Scholar] [CrossRef] [Scilit]
- Sanders, M.J.; Kedidi, S.M. Summary Review of Red Sea Commercial Fisheries Catches and Stock Assessments Including Maps of Actual and Potential Fishing Grounds; FAO: Rome, Italy, 1981. [Google Scholar]
- Froese, R.; Stern-Pirlot, A.; Winker, H.; Gascuel, D. Size Matters: How Single-Species Management Can Contribute to Ecosystem-Based Fisheries Management. Fish. Res. 2008, 92, 231–241. [Google Scholar] [CrossRef] [Scilit]
- Kotb, M.M.A.; Hanafy, M.H.; Rirche, H.; Matsumuras, S. Status of Coral Reefs in the Red Sea and Gulf of Aden in 2007. In Status of Coral Reefs of the World: 2008; Wilkinson, C., Ed.; Global Coral Reef Monitoring Network: Townsville, Australia, 2008; pp. 69–78. [Google Scholar]
- Global Coral Reef Monitoring Network (GCRMN). Status of Coral Reefs of the World: 2025; Global Coral Reef Monitoring Network (GCRMN): Townsville, Australia; International Coral Reef Initiative (ICRI): Riyadh, Saudi Arabia, 2025. [Google Scholar]
- Lakes and Fish Resources Protection and Development Agency (LFRPDA). Catch Landing Sites, Numbers of Fishing Boats and Fishermen by Sector in the Red Sea Governorate; LFRPDA: Cairo, Egypt, 2025.
- Lakes and Fish Resources Protection and Development Agency (LFRPDA). Statement on the Number of Boats and Fish Production; LFRPDA: Cairo, Egypt, 2024.
- Sharaan, M.; Negm, A.; Iskander, M.; El-Tarabily, M. Analysis of Egyptian Red Sea Fishing Ports. Int. J. Eng. Technol. 2017, 9, 117. [Google Scholar] [CrossRef] [Scilit]
- Jacobsen, K.I.; Lester, S.E.; Halpern, B.S. A Global Synthesis of the Economic Multiplier Effects of Marine Sectors. Mar. Policy 2014, 44, 273–278. [Google Scholar] [CrossRef] [Scilit]
- European Bank for Reconstruction and Development (EBRD). Natural Capital Valuation Assessment Red Sea Landscape: Final Report; EBRD: London, UK, 2023. [Google Scholar]
- Cesar, H.; Chong, C.K. Economic Valuation and Socioeconomics of Coral Reefs: Methodological Issues and Three Case Studies. In Economic Valuation and Policy Priorities for Sustainable Management of Coral Reefs; WorldFish Center: Penang, Malaysia, 2004; pp. 14–40. [Google Scholar]
- The Ocean Foundation. Economic Valuation of Reef Ecosystems in the MAR Region; The Ocean Foundation: Washington, DC, USA, 2021. [Google Scholar]
- Conservation International. Economic Values of Coral Reefs, Mangroves, and Seagrasses; Center for Applied Biodiversity Science, Conservation International: Arlington, VA, USA, 2008. [Google Scholar]
- Ostrom, E. Governing the Commons: The Evolution of Institutions for Collective Action; Cambridge University Press: Cambridge, UK, 1990. [Google Scholar]
- Costello, C.; Ovando, D.; Clavelle, T.; Strauss, C.K.; Hilborn, R.; Melnychuk, M.C.; Branch, T.A.; Gaines, S.D.; Szuwalski, C.S.; Cabral, R.B. Global Fishery Prospects under Contrasting Management Regimes. Proc. Natl. Acad. Sci. USA 2016, 113, 5125–5129. [Google Scholar] [CrossRef] [Scilit]
- McClanahan, T.R.; Graham, N.A.; MacNeil, M.A.; Muthiga, N.A.; Cinner, J.E.; Bruggemann, J.H.; Wilson, S.K. Critical Thresholds and Tangible Targets for Ecosystem-Based Management of Coral Reef Fisheries. Proc. Natl. Acad. Sci. USA 2011, 108, 17230–17233. [Google Scholar] [CrossRef] [Scilit]
- Anticamara, J.A.; Watson, R.; Gelchu, A.; Pauly, D. Global Fishing Effort (1950–2010): Trends, Gaps, and Implications. Fish. Res. 2011, 107, 131–136. [Google Scholar] [CrossRef] [Scilit]
- Pauly, D.; Christensen, V.; Guénette, S.; Pitcher, T.J.; Sumaila, U.R.; Walters, C.J.; Watson, R.; Zeller, D. Towards Sustainability in World Fisheries. Nature 2002, 418, 689–695. [Google Scholar] [CrossRef] [Scilit]
- Hurghada Environmental Protection and Conservation Association (HEPCA). Site Management Plans and Annual Reports; HEPCA: Hurghada, Egypt, 2022. [Google Scholar]
- Smallhorn-West, P.; Cohen, P.J.; Phillips, M.; Jupiter, S.D.; Govan, H.; Pressey, R.L. Linking Small-scale Fisheries Co-management to UN Sustainable Development Goals. Conserv. Biol. 2022, 36, e13977. [Google Scholar] [CrossRef] [Scilit]
- Isaksen, E.T.; Richter, A. Tragedy, Property Rights, and the Commons: Investigating the Causal Relationship from Institutions to Ecosystem Collapse. J. Assoc. Environ. Resour. Econ. 2019, 6, 741–781. [Google Scholar] [CrossRef] [Scilit]
- Hara, M.M. Efficacy of Rights-Based Management of Small Pelagic Fish within an Ecosystems Approach to Fisheries in South Africa. Afr. J. Mar. Sci. 2013, 35, 315–322. [Google Scholar] [CrossRef] [Scilit]
- Tawfik, R.; Sarhan, M. Ecotourism and Protected Areas Sustainable Financing: A Case Study of Wadi El Gemal Visitor Center. J. Tour. Sustain. Well-Being 2021, 9, 156–172. [Google Scholar]
- Kleiber, D.; Harris, L.M.; Vincent, A.C. Gender and Small-scale Fisheries: A Case for Counting Women and Beyond. Fish Fish. 2015, 16, 547–562. [Google Scholar] [CrossRef] [Scilit]
- Hoegh-Guldberg, O.; Mumby, P.J.; Hooten, A.J.; Steneck, R.S.; Greenfield, P.; Gomez, E.; Harvell, C.D.; Sale, P.F.; Edwards, A.J.; Caldeira, K. Coral Reefs under Rapid Climate Change and Ocean Acidification. Science 2007, 318, 1737–1742. [Google Scholar] [CrossRef] [Scilit]
- Gulland, J.A. The Fish Resources of the Ocean; Fishing News [for the Food and Agriculture Organization]: West Byfleet, UK, 1971; ISBN 978-0-85238-055-0. [Google Scholar]
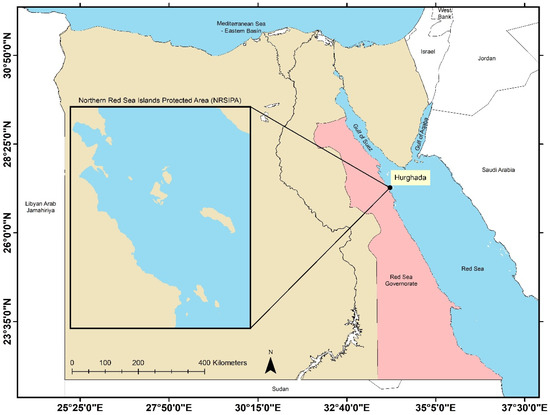
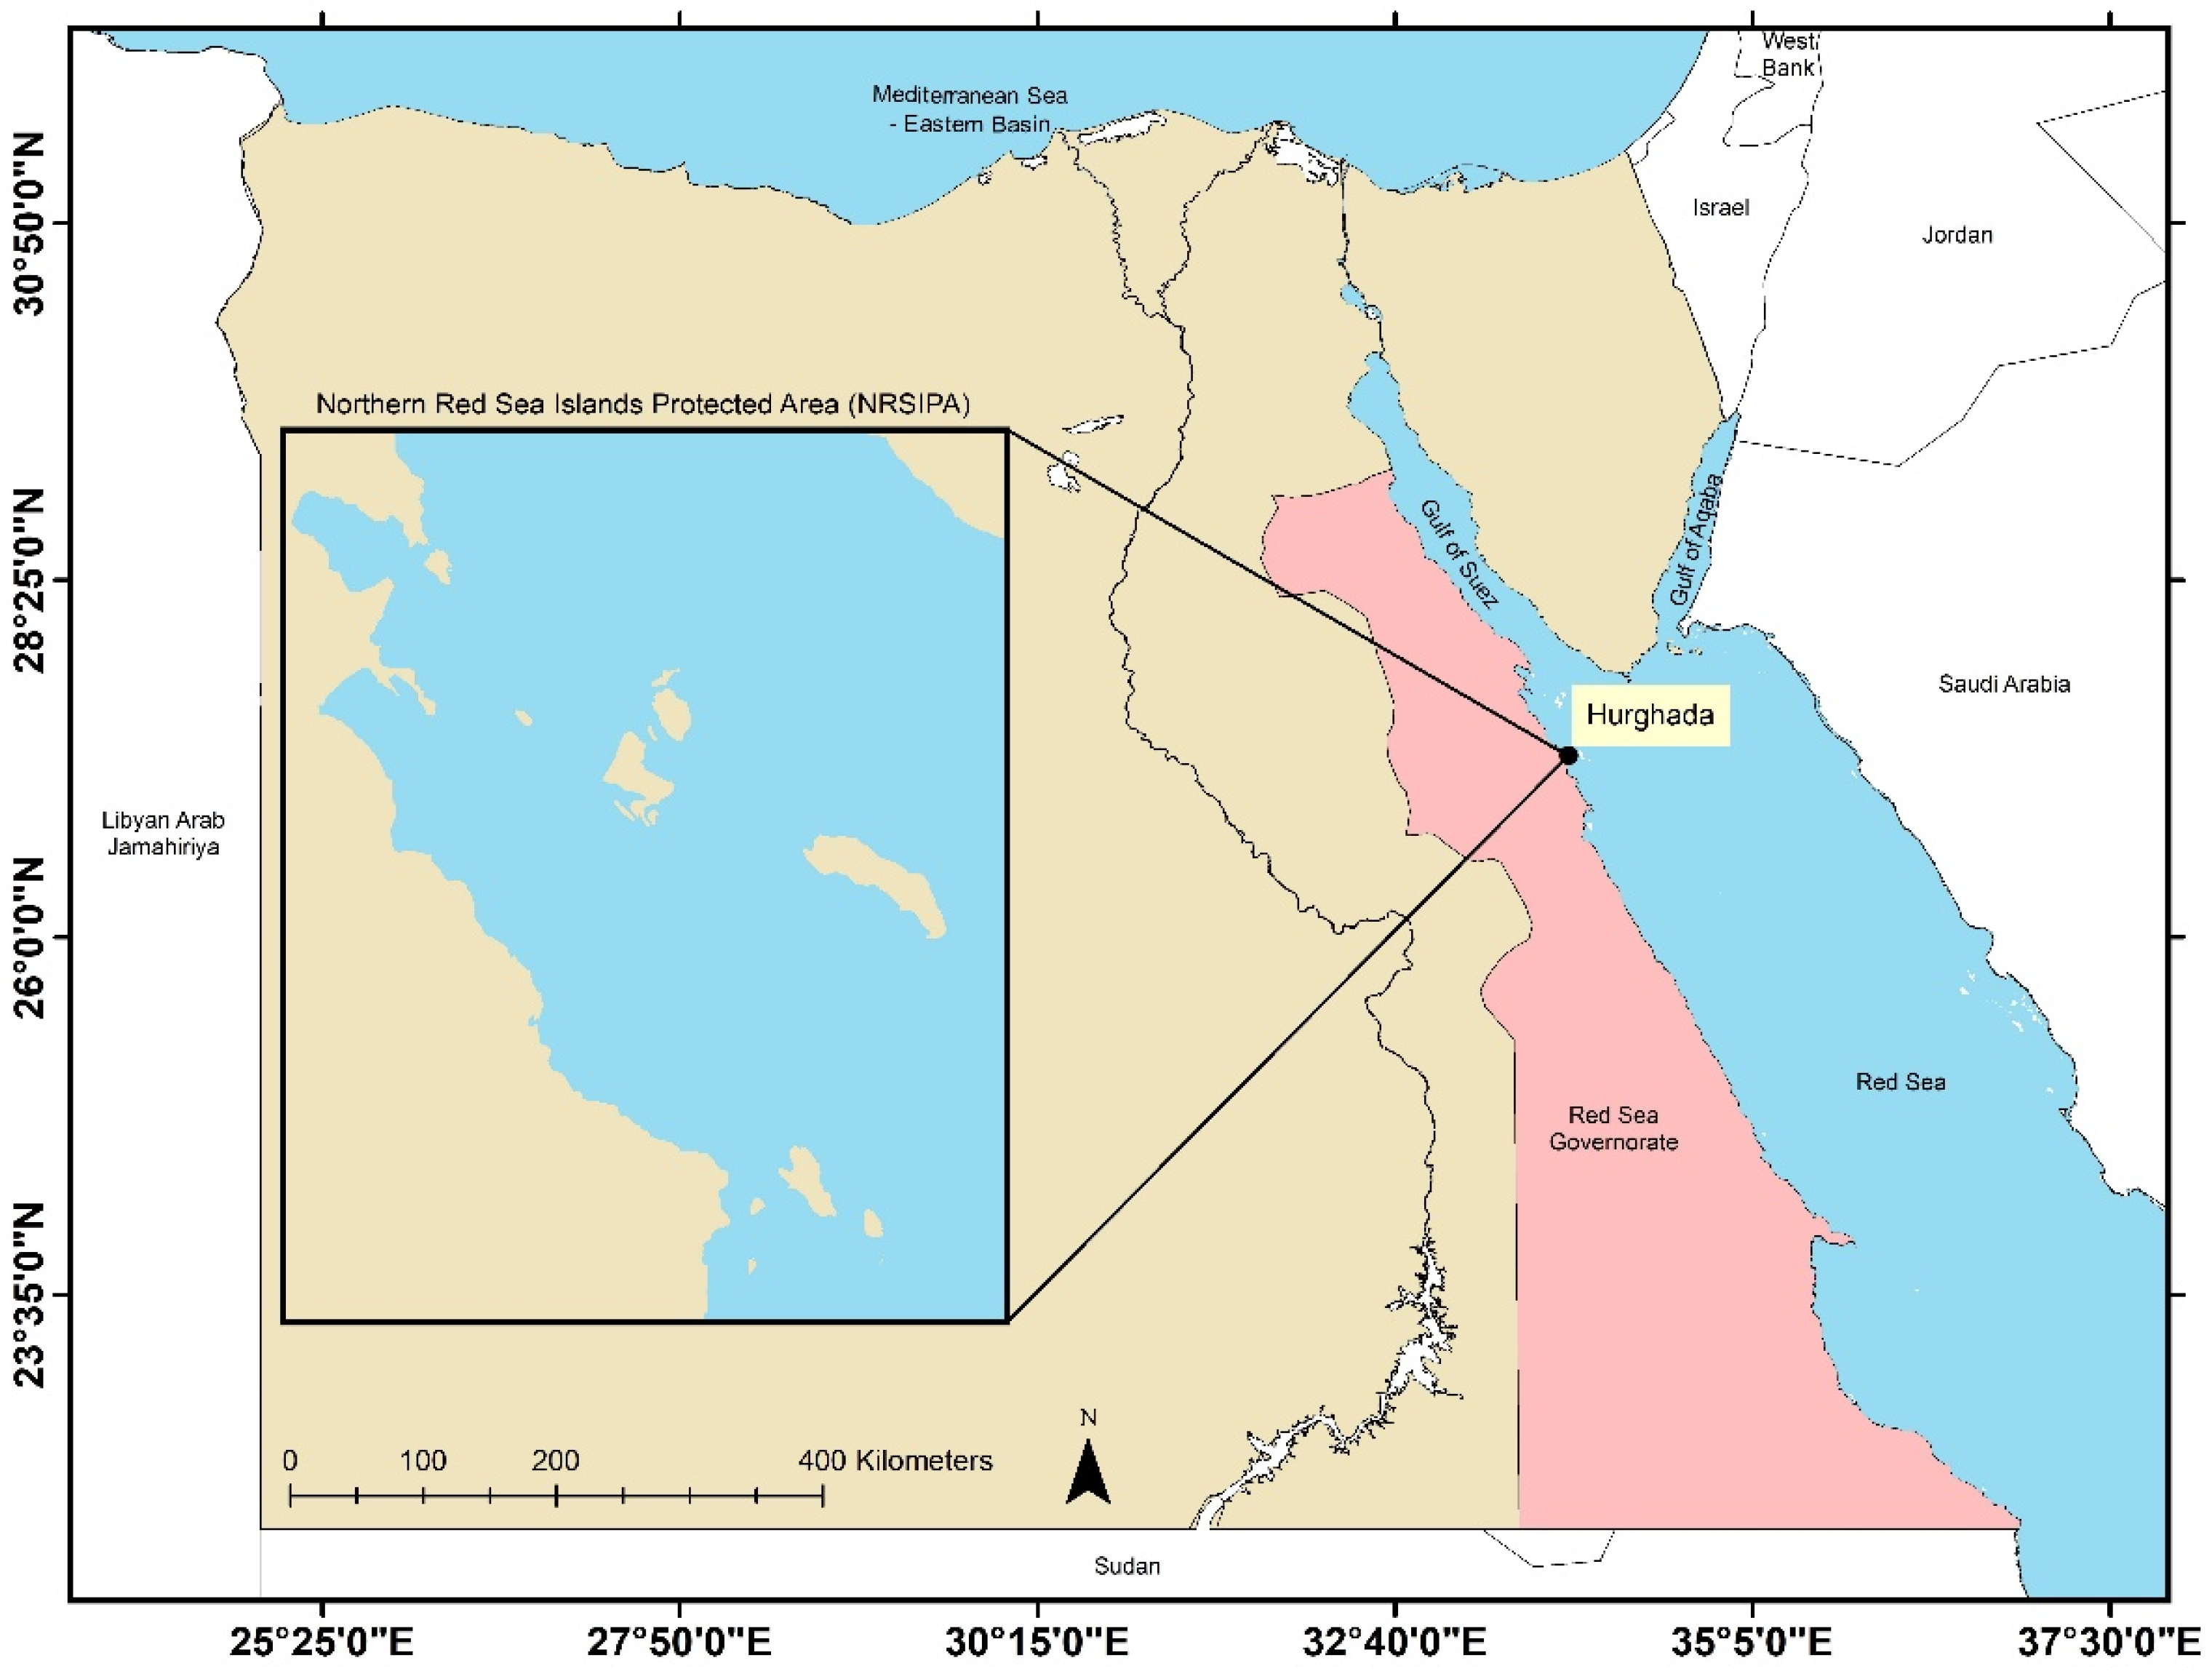
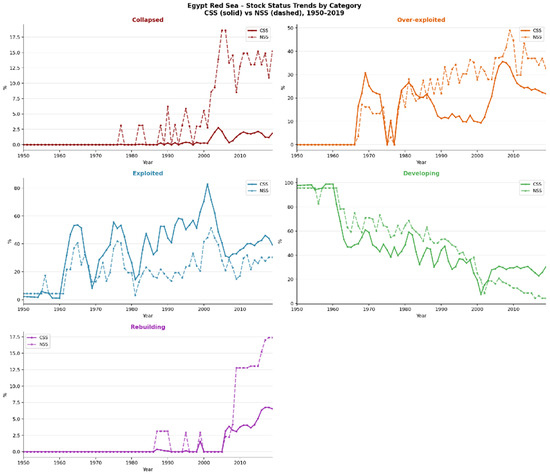
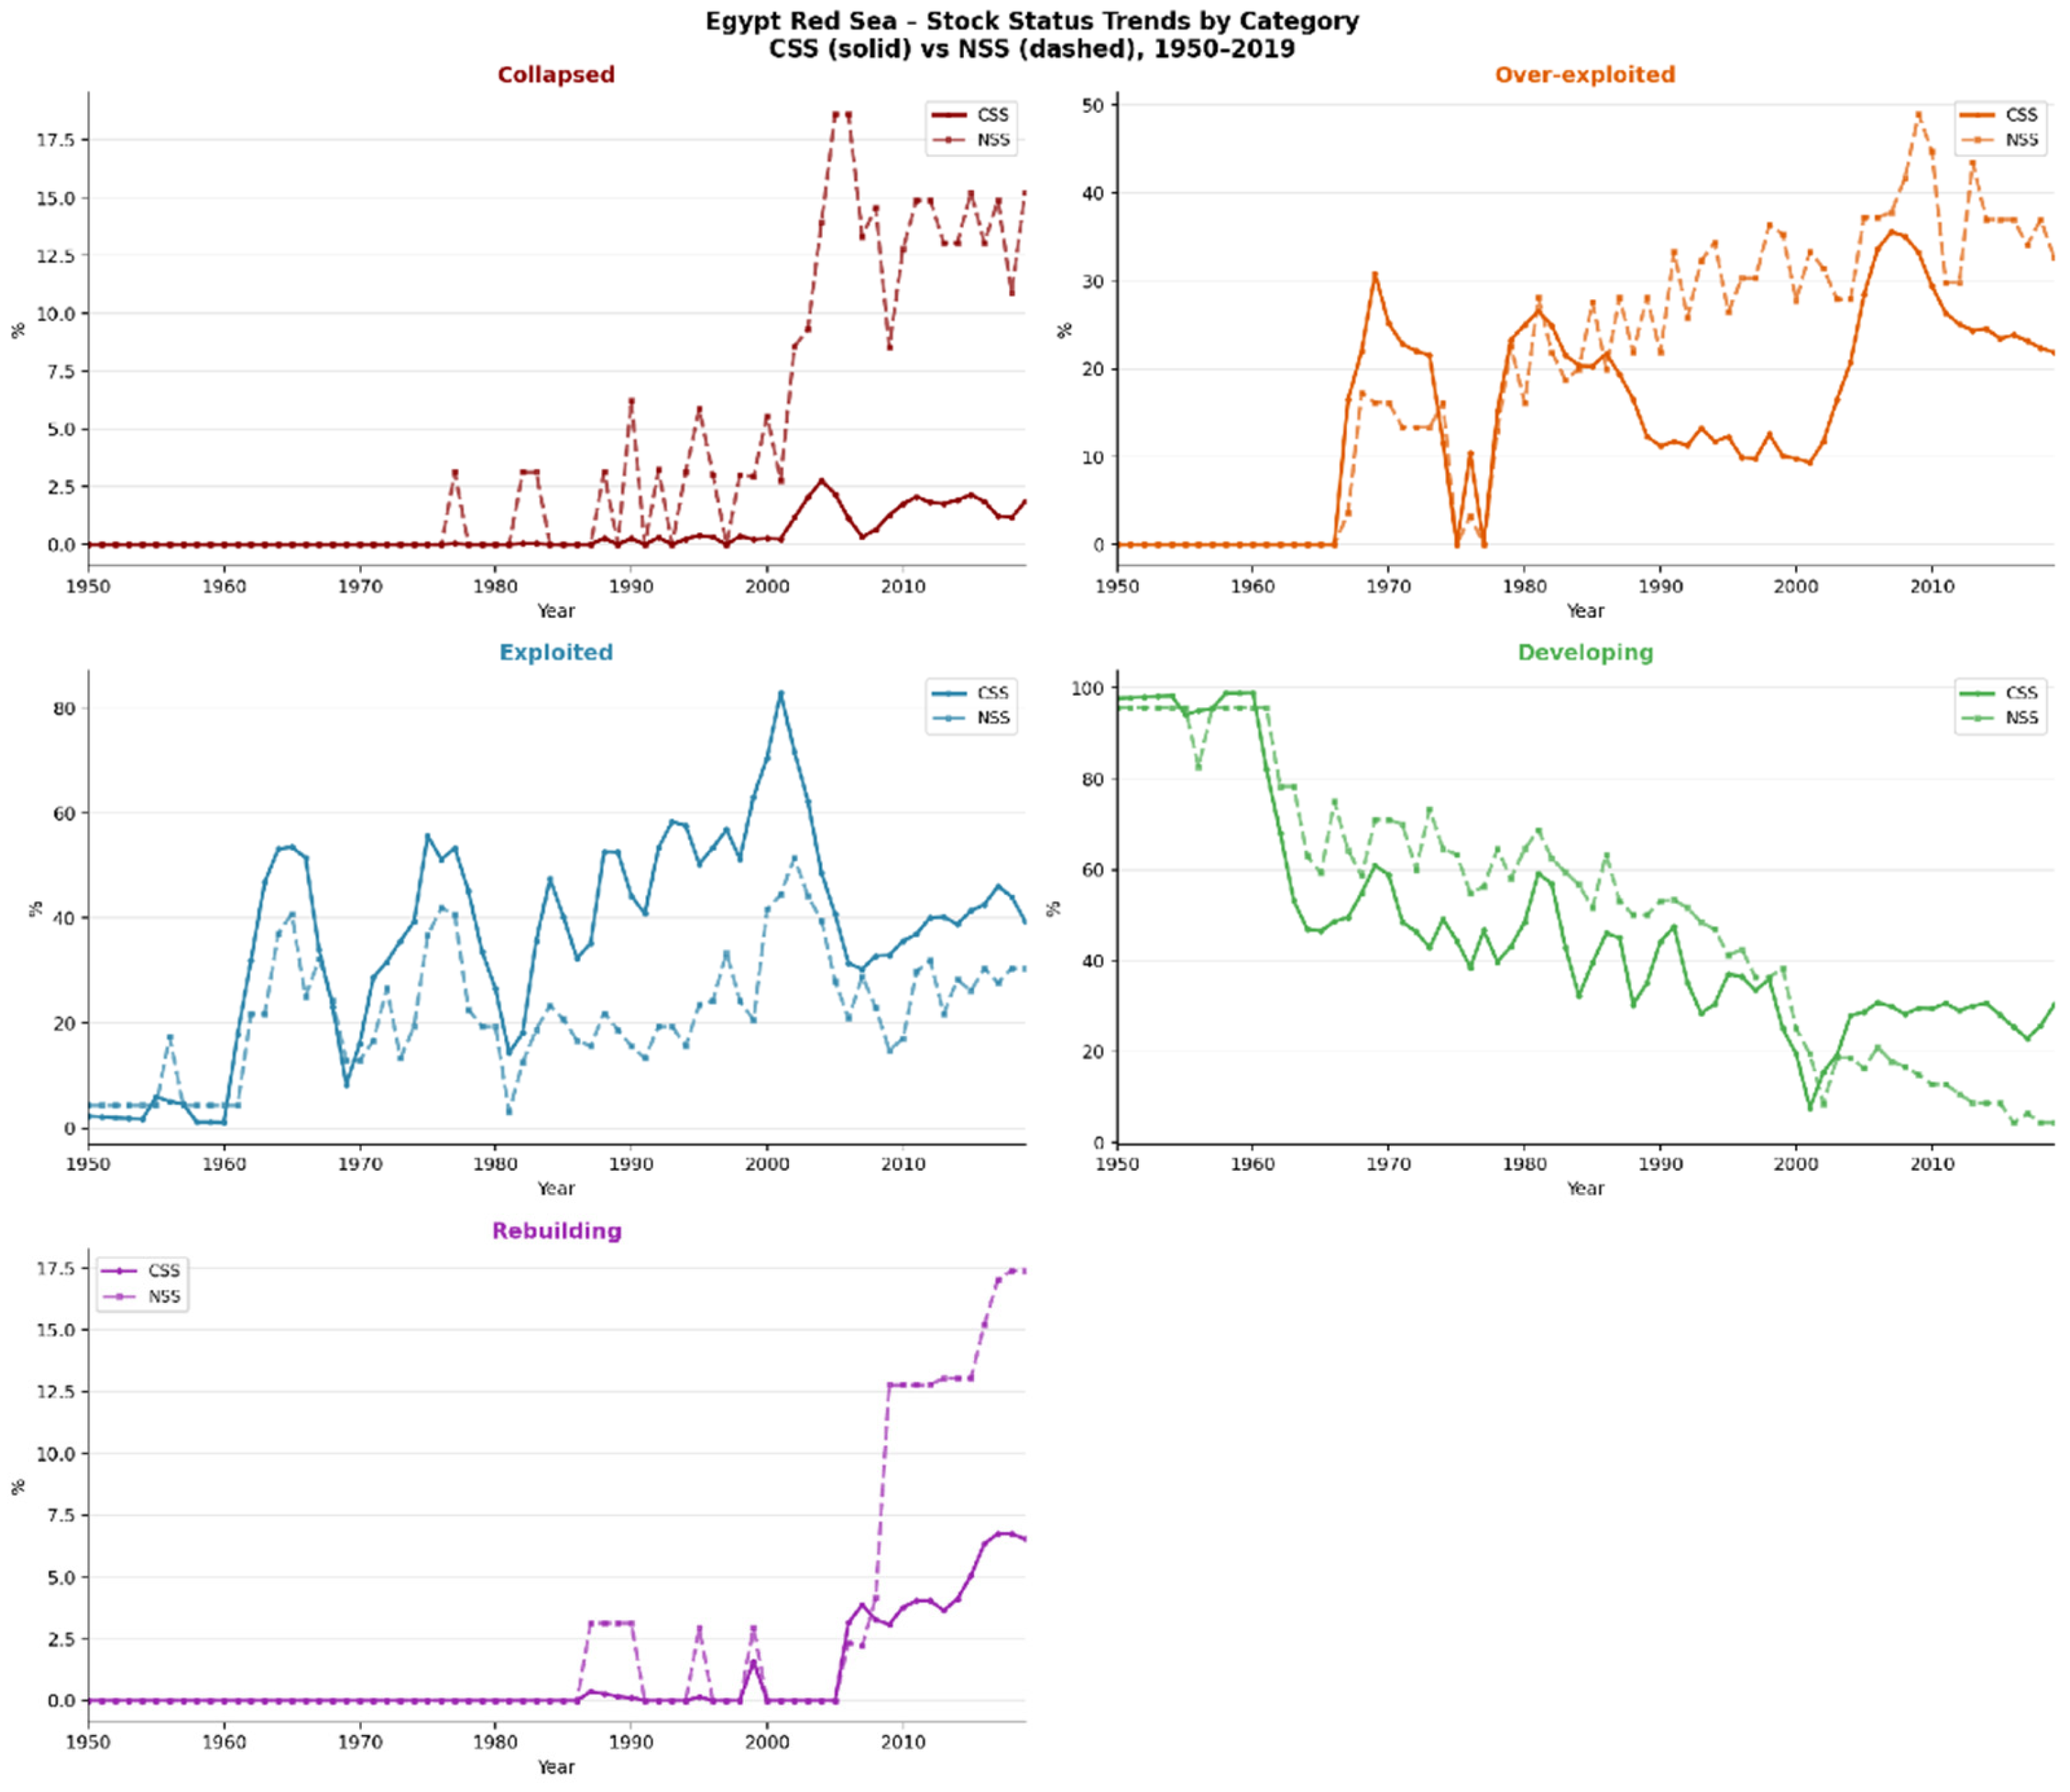
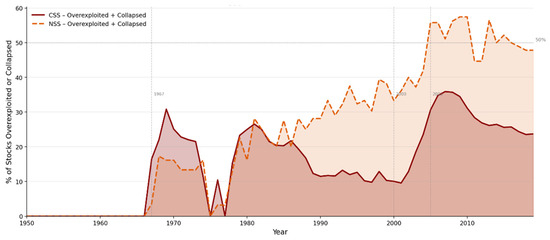
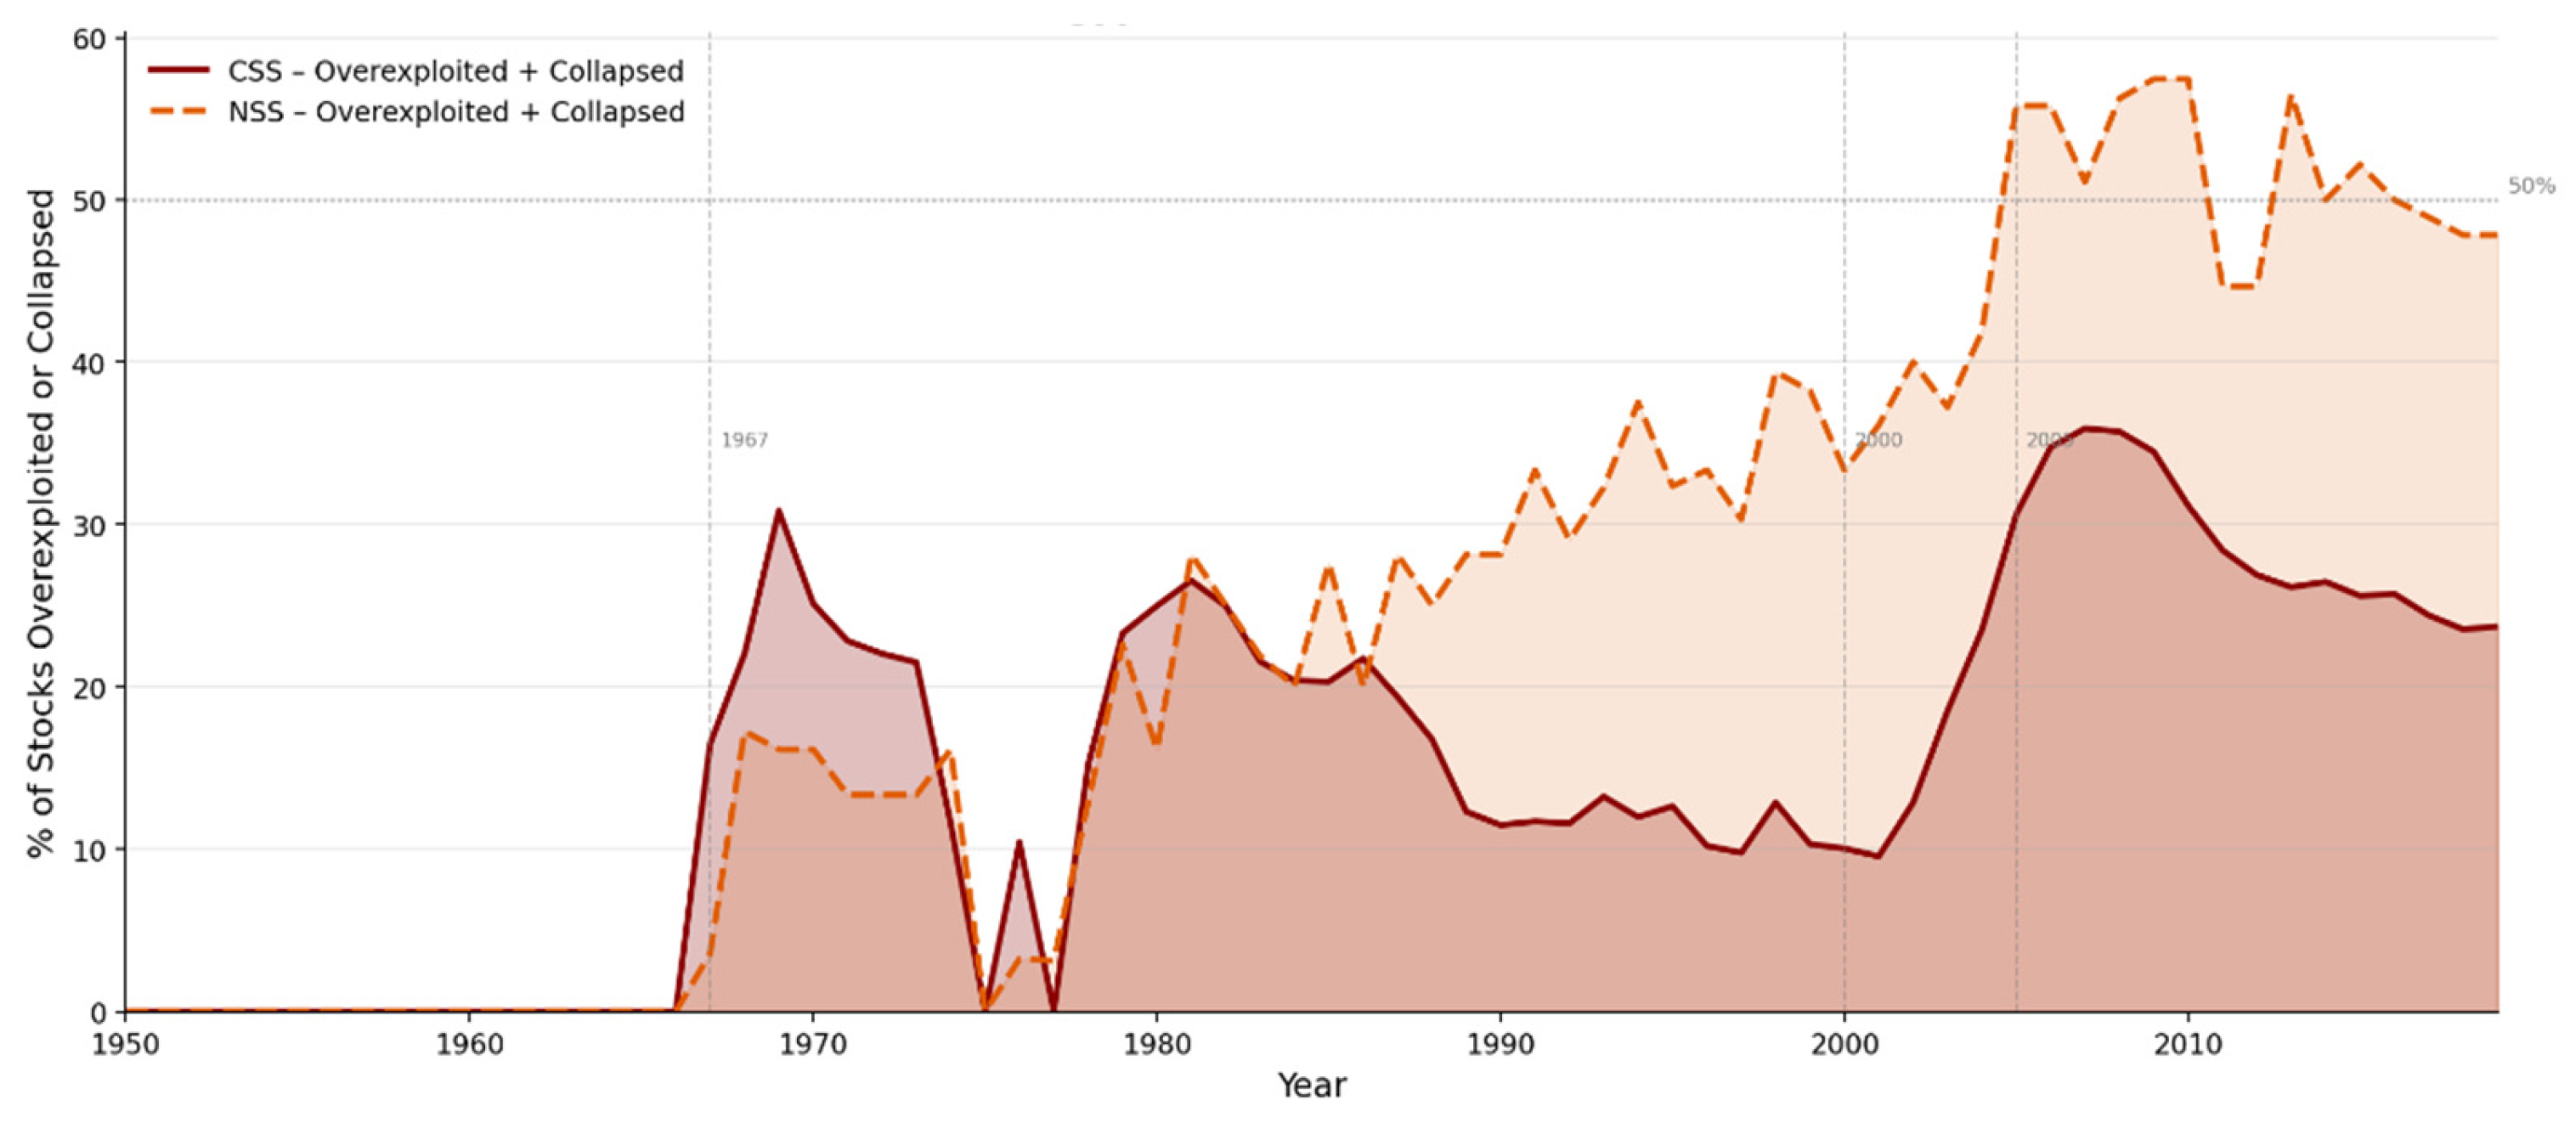
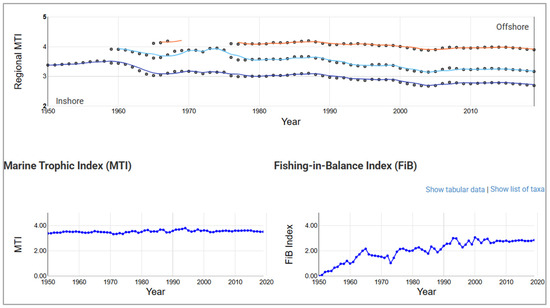
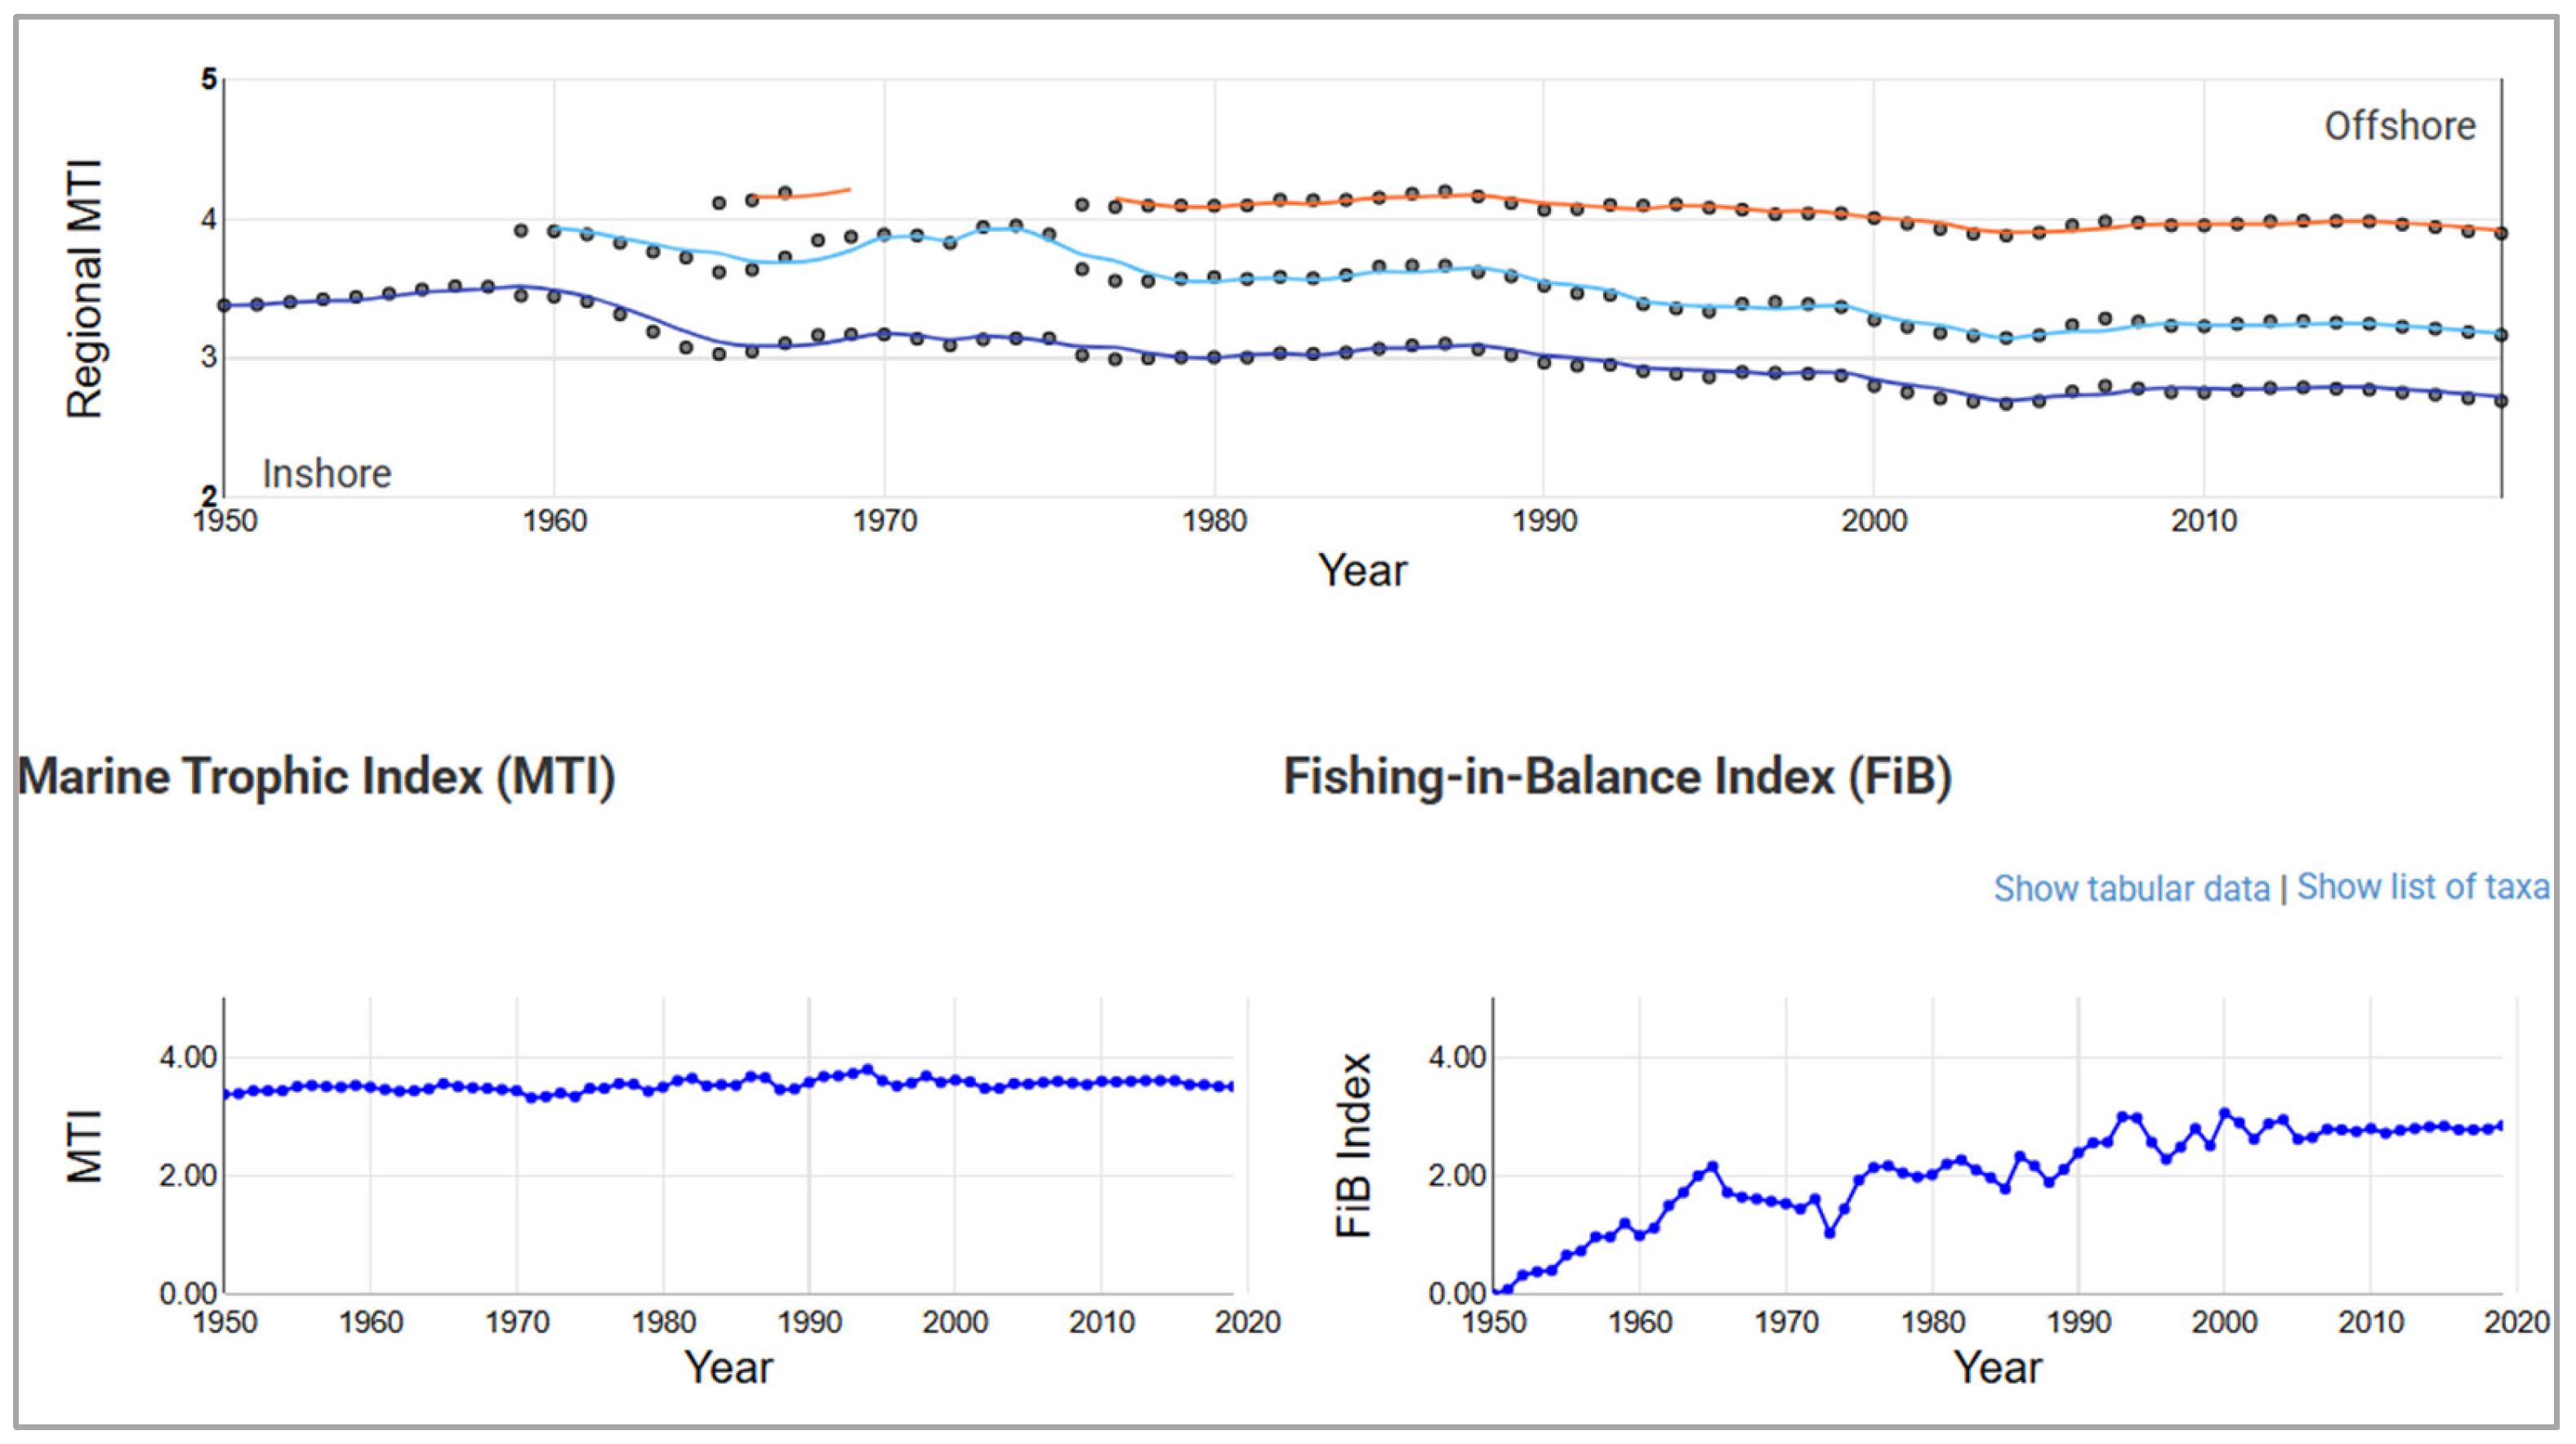
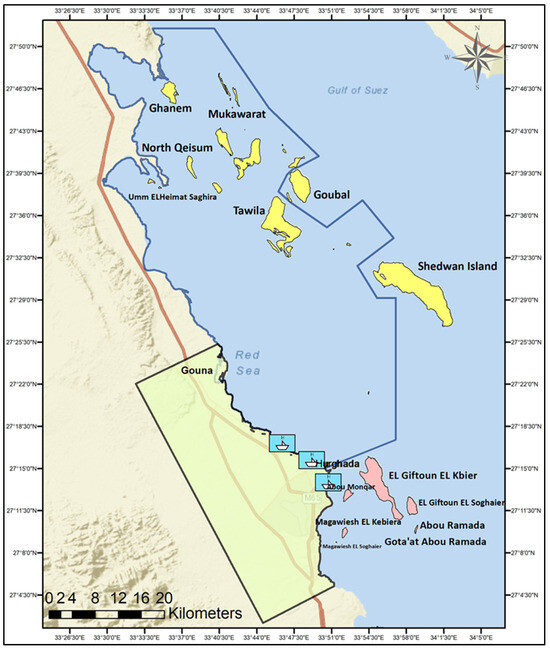
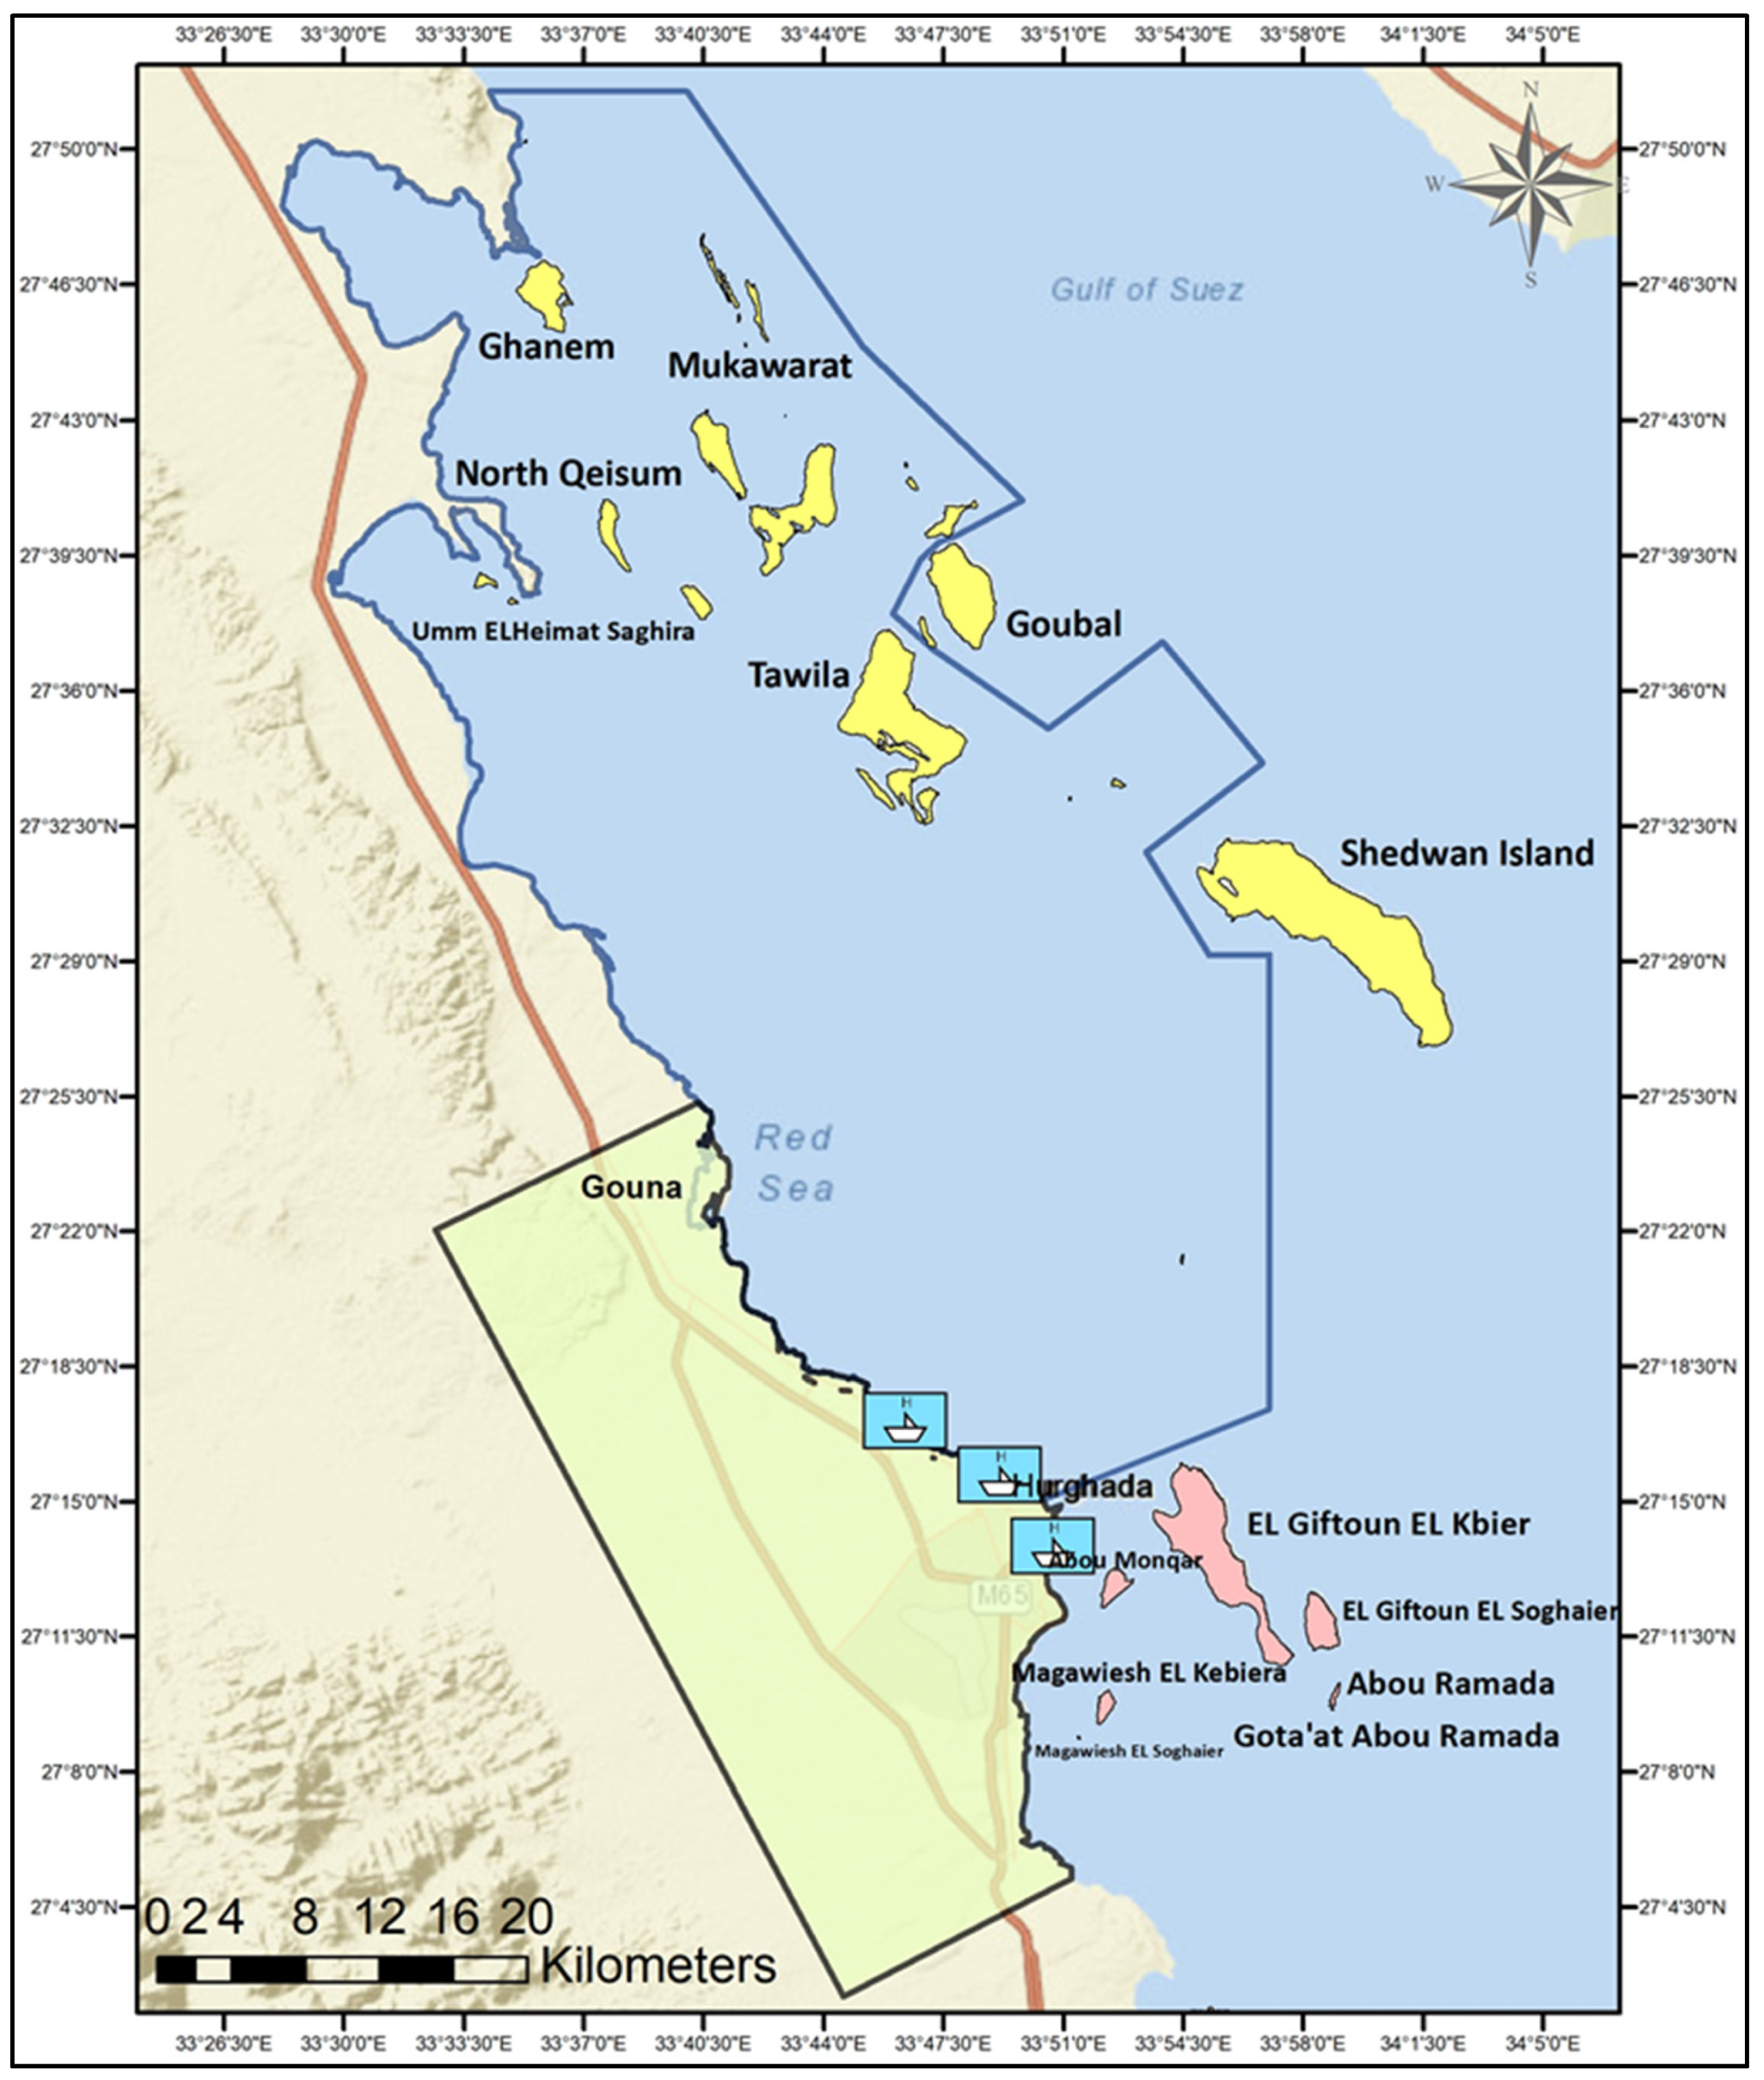
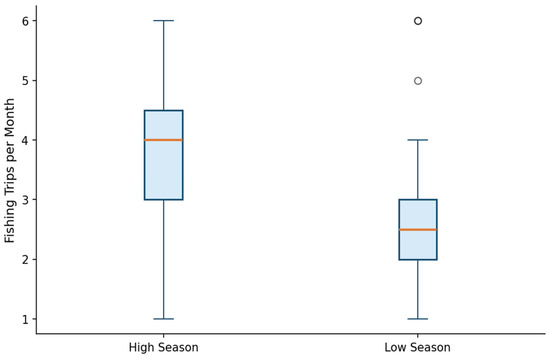
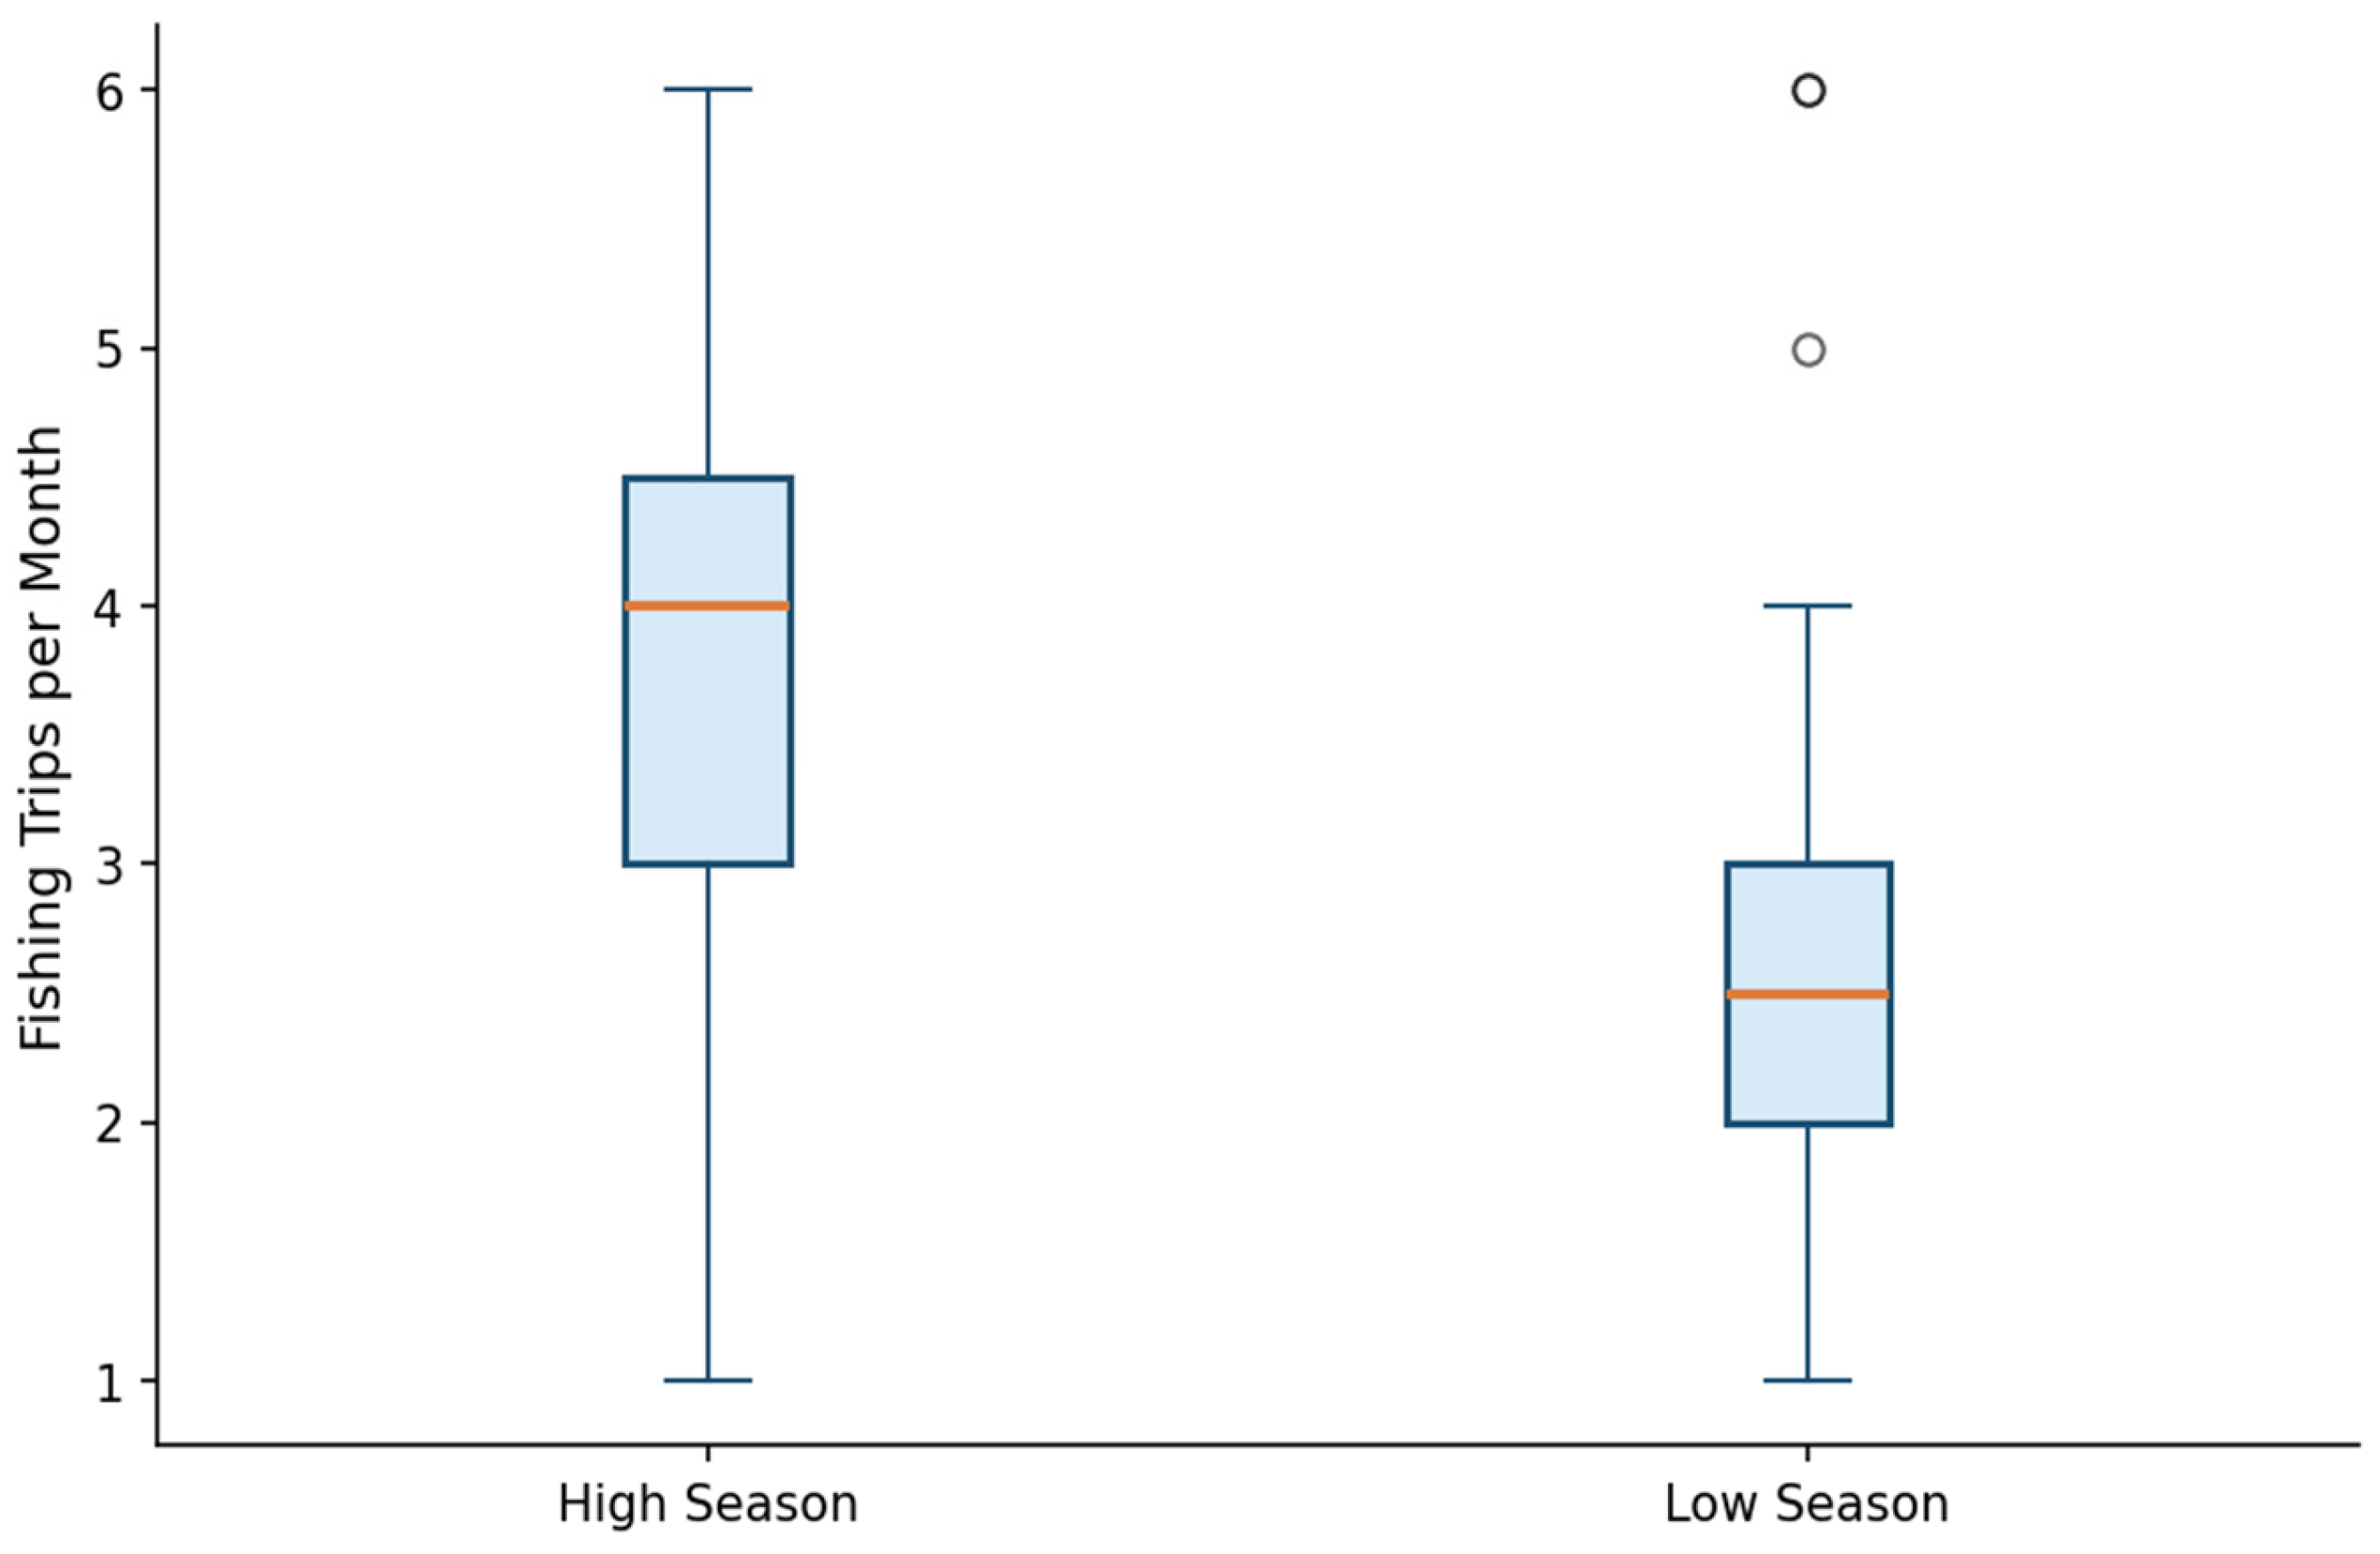
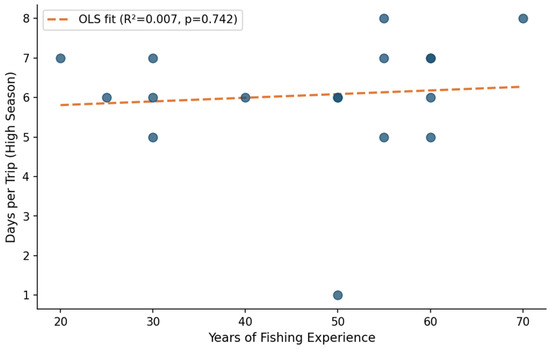
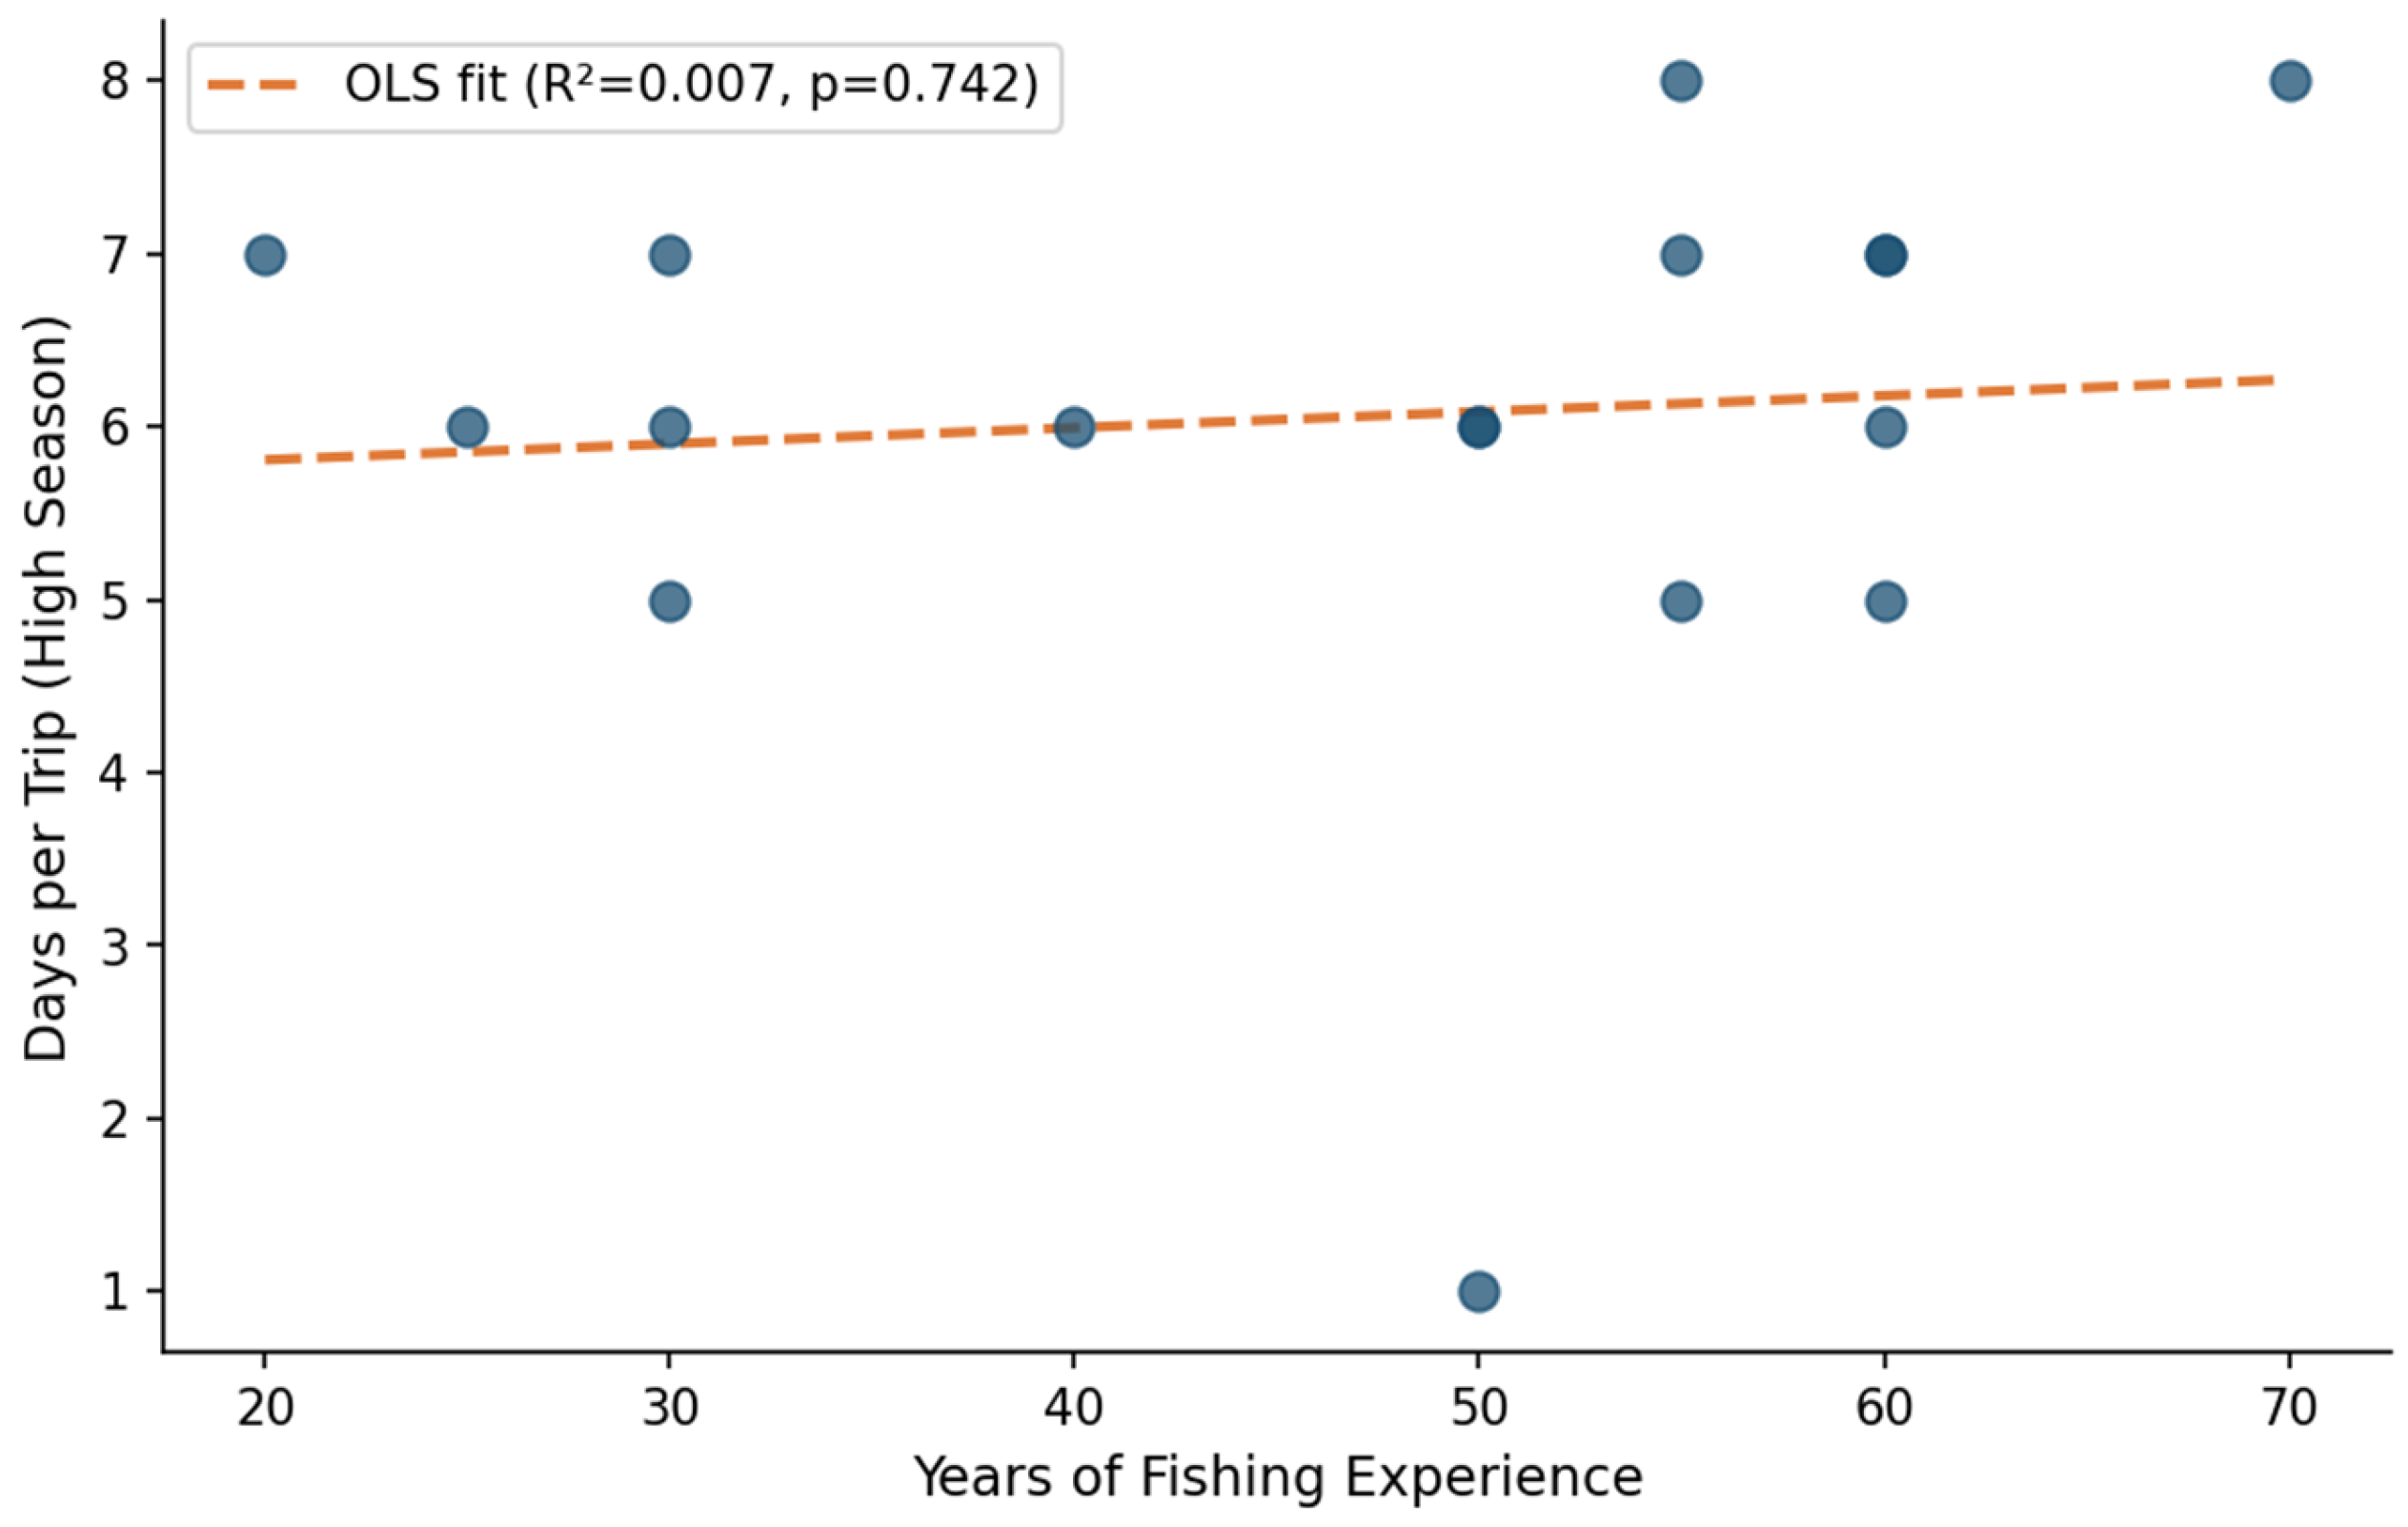
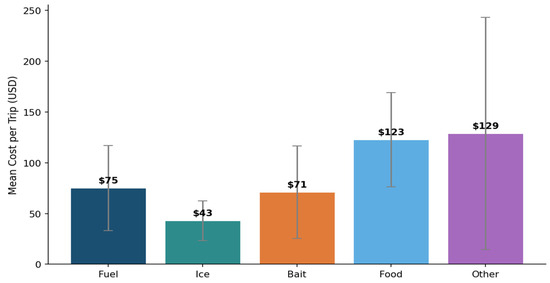
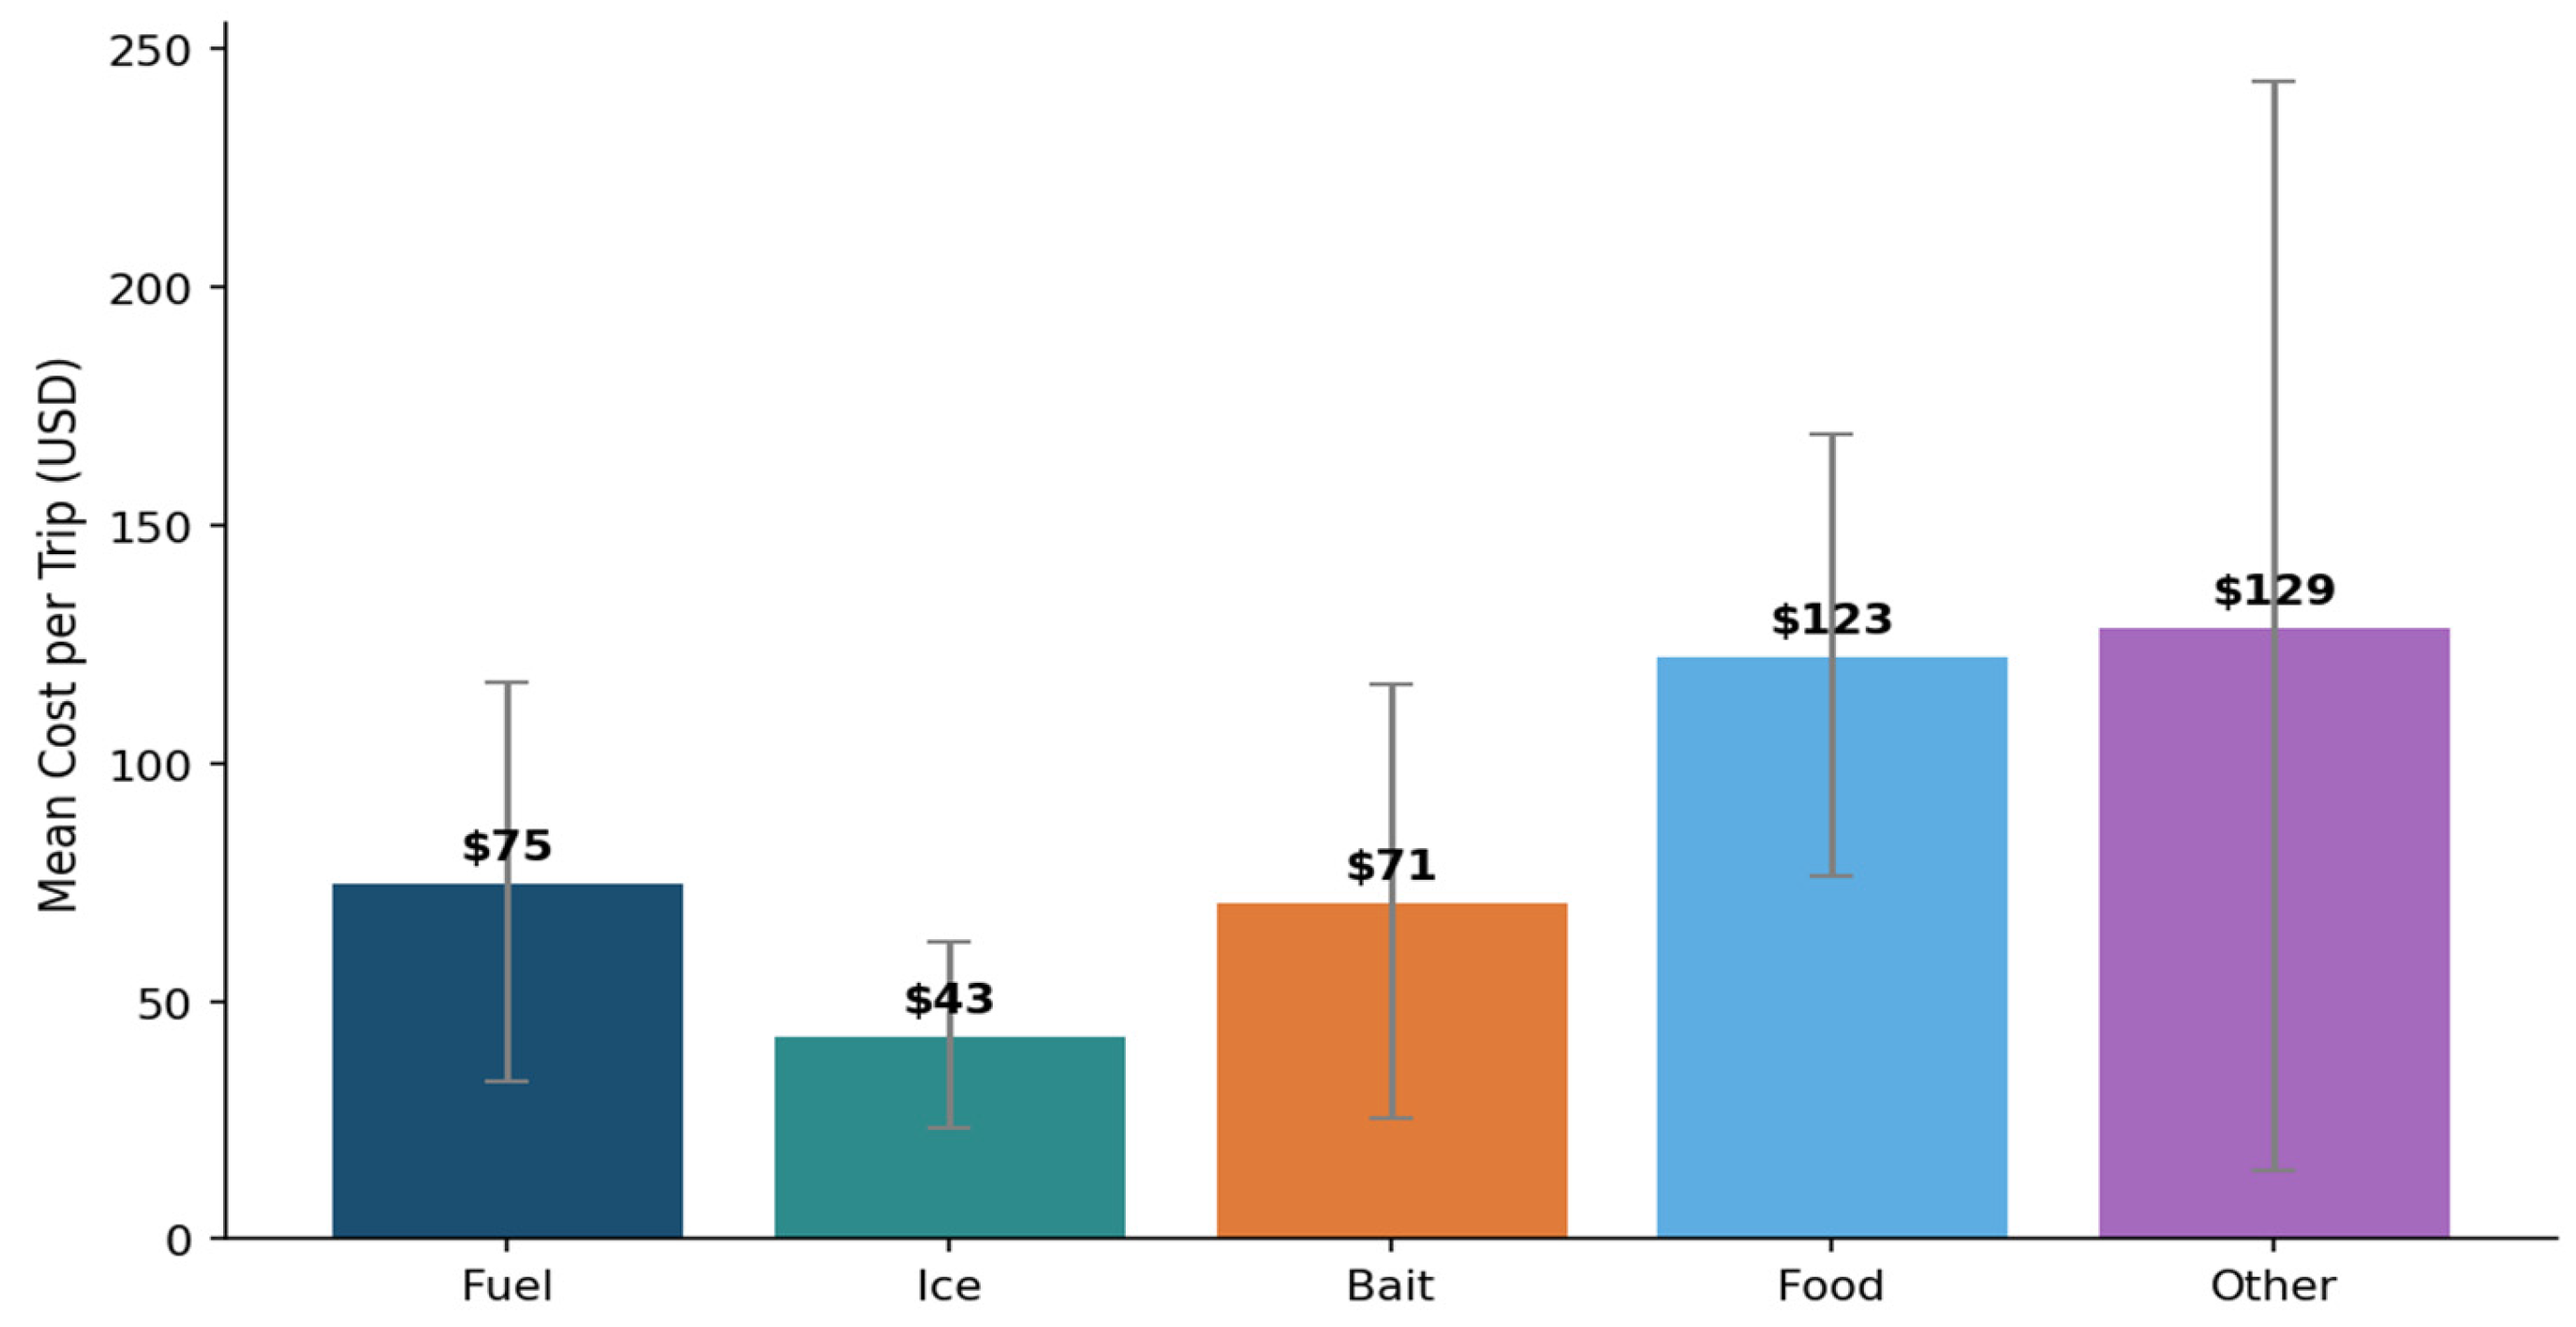
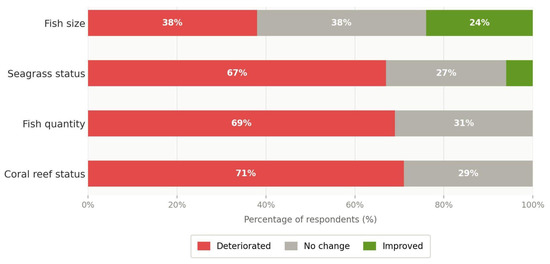
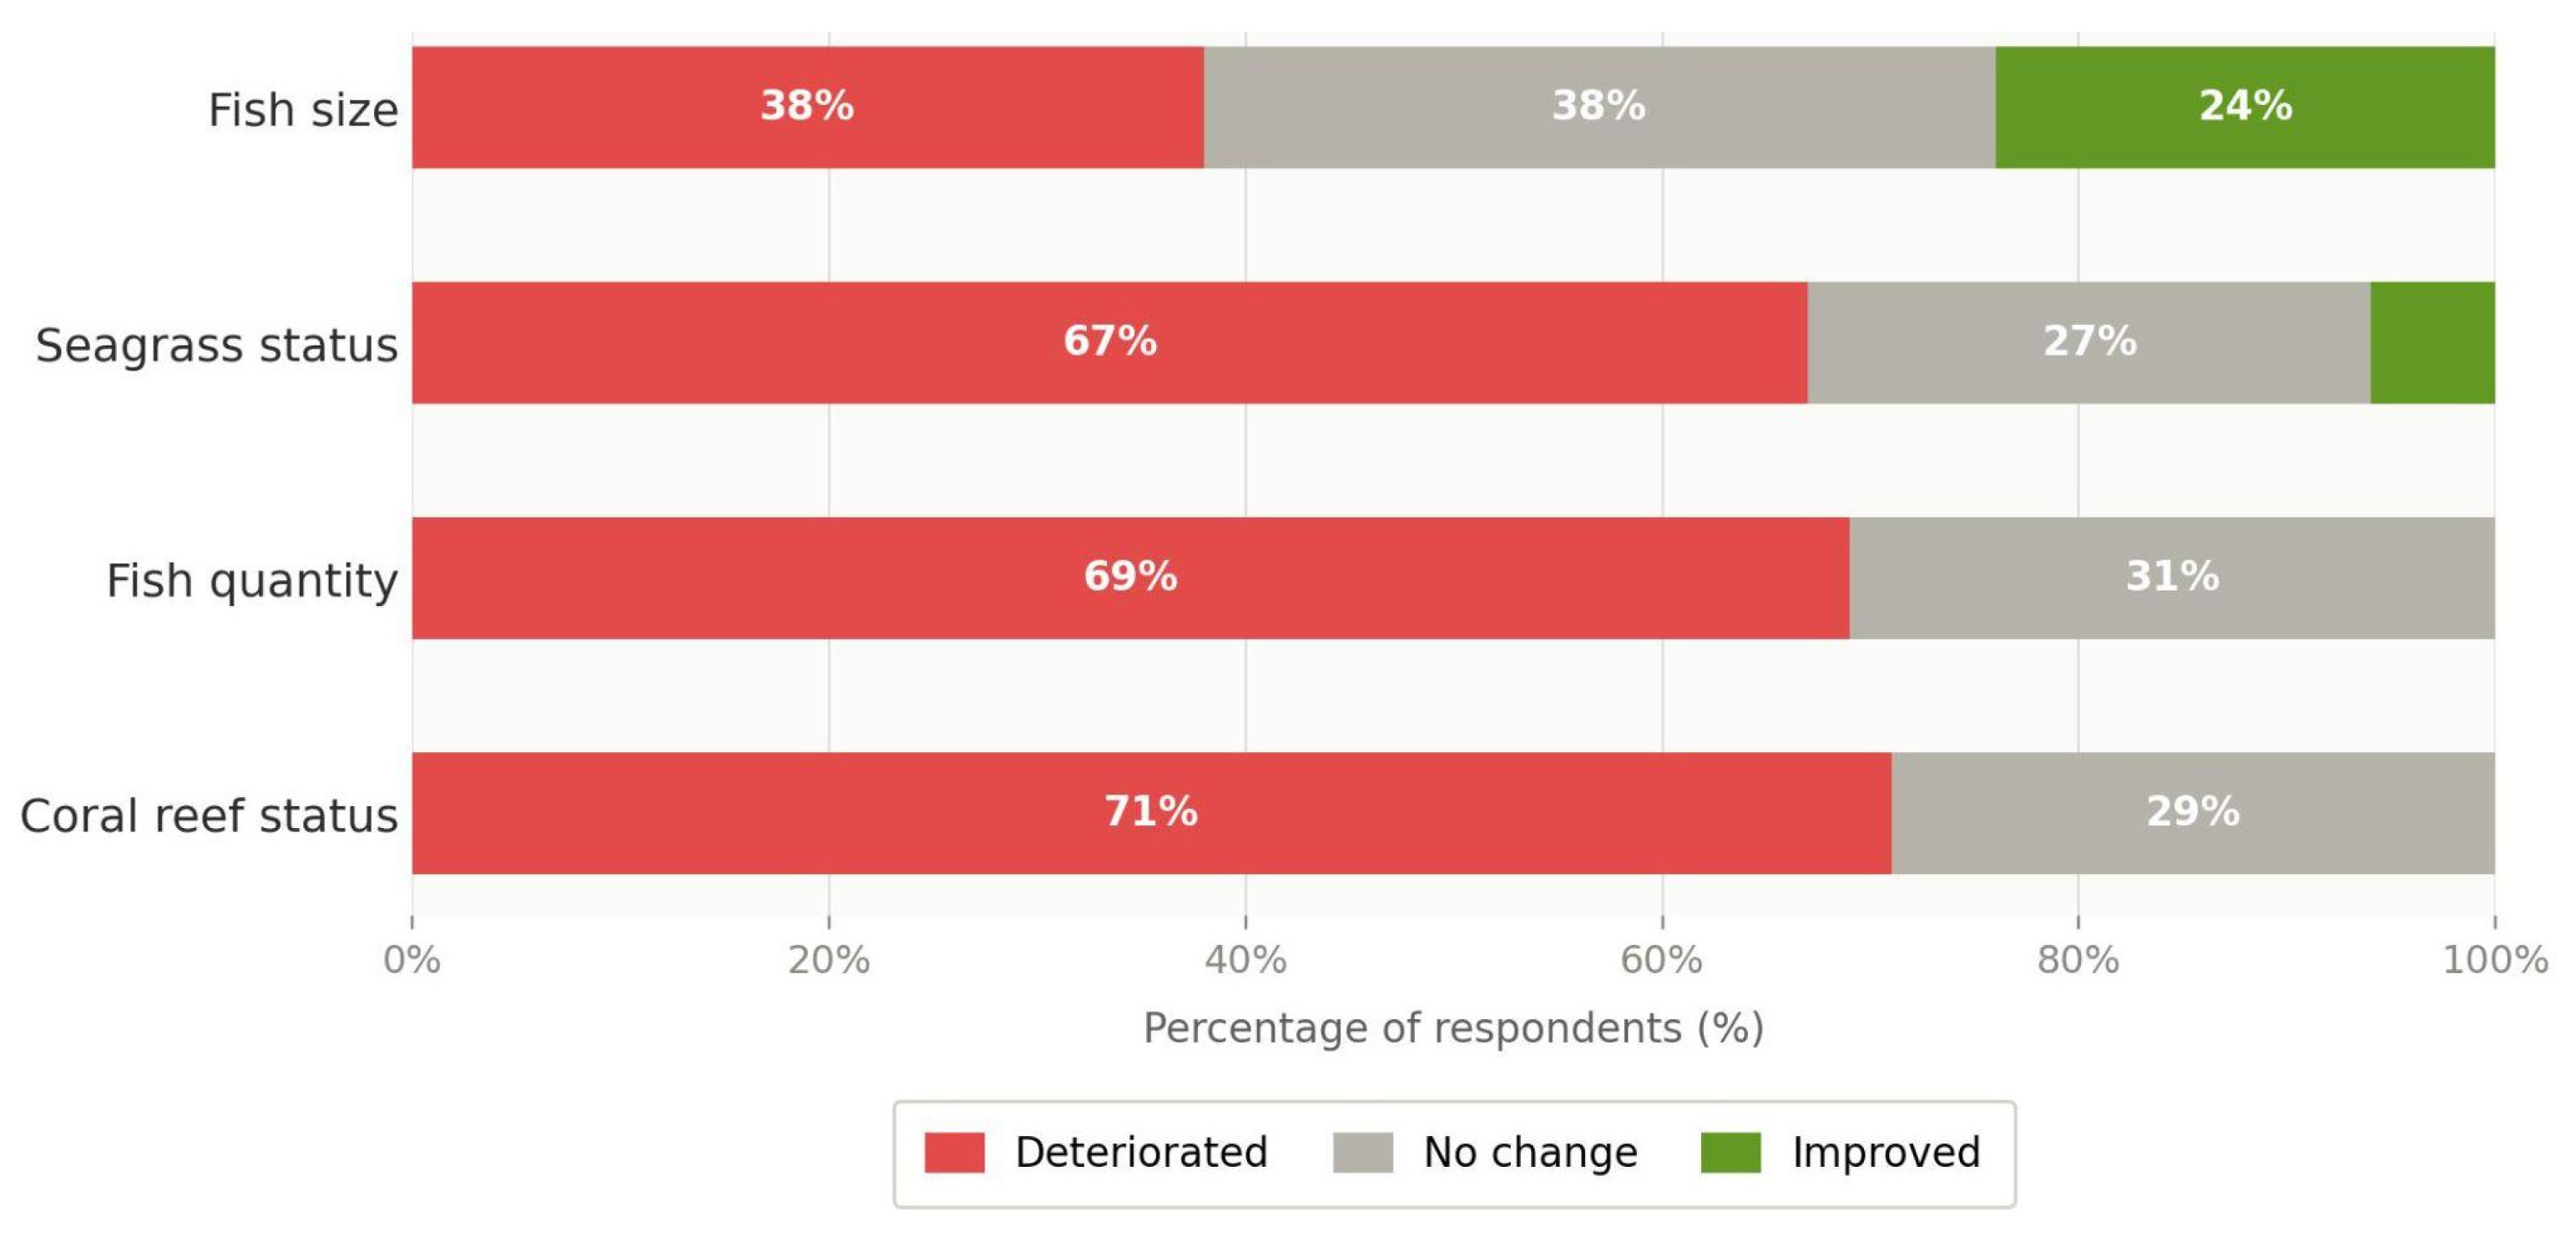

Disclaimer/Publisher’s Note: The statements, opinions and data contained in all publications are solely those of the individual author(s) and contributor(s) and not of MDPI and/or the editor(s). MDPI and/or the editor(s) disclaim responsibility for any injury to people or property resulting from any ideas, methods, instructions or products referred to in the content. |
© 2026 by the authors. Licensee MDPI, Basel, Switzerland. This article is an open access article distributed under the terms and conditions of the Creative Commons Attribution (CC BY) license.