


Abstract
Supplier delivery instability can disrupt production continuity and increase inventory and coordination pressure. This study proposes a dual-track framework for supplier delivery reliability risk analysis under private, temporally sparse, small-sample enterprise data. A replaceable structured track produces on-time delivery estimates and risk grades for the next observed period. A locally deployed, LoRA-adapted large language model uses retrieved evidence to generate risk explanations and management recommendations. Numeric anchoring, multi-level verification, and provenance auditing connect the two tracks, and the language model does not alter the structured results. Under temporally frozen evaluation, persistence achieves the lowest MAE (0.252), and no learned predictor outperforms this baseline. Factorial experiments show that domain adaptation improves explanation coverage, numeric anchoring brings conditional anchor fidelity to 96.2%, and retrieval reduces the training-value restatement rate from 24.4% to 7.3%. However, 19.5% of outputs in the default configuration still degenerate. A blind evaluation by three domain experts indicates that the overall usefulness of the current explanations remains limited and that they require human review. By linking quantitative estimates with traceable explanations, the framework supports delivery risk analysis under human supervision. Its potential contribution to supply-chain resilience and resource efficiency requires further validation through prospective operational studies.
1. Introduction
The transition to electric mobility represents an important pathway for reducing road-transport carbon emissions and supporting the decarbonization of the transport sector [1]. This transition depends on industrial supply chains capable of reliably providing batteries, electric-drive systems, electronic control units, and other specialized components. As electric vehicle (EV) production expands, the performance of these suppliers increasingly affects production continuity, quality assurance, and the ability of manufacturers to respond to changing market and operational conditions. Delivery instability can disrupt assembly schedules, increase inventory and coordination requirements, and complicate production planning, while quality deviations may propagate into later manufacturing or vehicle-operation stages and increase the difficulty of traceability and corrective action. These conditions have motivated growing research on predicting supplier performance, delivery disruption, and operational risks from heterogeneous industrial records [2,3,4].
Supplier risk management is also closely connected with the broader objectives of supply-chain sustainability and resilience. Sustainability and resilience have become important considerations in supply-chain risk management because disruption responses influence operational continuity, resource allocation, and long-term supply-chain performance [5,6]. Disruption recovery may require additional safety stocks or changes in transportation arrangements, creating trade-offs among continuity, resource use, and carbon-emission costs [7,8]. Earlier identification of delivery risk may therefore support more informed allocation of operational resources and reduce reliance on reactive responses. In the EV industry, digital capabilities and enhanced supply-chain visibility have likewise been associated with stronger resilience outcomes [9]. Decision support for supplier delivery risk is therefore potentially relevant to sustainable and resilient EV supply-chain management, although such effects need to be measured in operational settings.
Realizing this potential requires decision-support systems that can operate under the data conditions encountered in industrial practice. Supplier-risk assessment relies on commercially sensitive records such as order and receipt histories, incoming-inspection results, and supplier-specific performance statistics. Information sharing across supply-chain tiers is shaped by organizational, technological, legal, relational, and security considerations [10], while data privacy and security concerns directly affect organizations’ willingness to participate in digitally connected supply-chain systems [11]. These conditions favor analytical architectures that can be deployed within the enterprise boundary and provide auditable results without depending on external transmission of confidential operational data.
Predicting supplier delivery risk nevertheless remains difficult under real industrial data conditions. Enterprise datasets are often heterogeneous, supplier histories may be short, and performance can alternate between persistent operating states and abrupt changes caused by capacity adjustments, logistics disturbances, or order restructuring. These characteristics make the appropriate predictive model dependent on the available data regime rather than on a single universally preferred architecture. A practical supplier-risk system should therefore expose numerical prediction through a stable and replaceable interface, allowing the structured component to be selected or updated independently while preserving the downstream decision-support process.
Reliable numerical outputs alone, however, do not provide all the information required for supplier management. Procurement and quality personnel must understand how an assessment relates to recent supplier performance, historical cases, applicable management rules, and supporting evidence before deciding how to respond. Conventional regression, classification, and time-series forecasting methods provide reproducible numerical outputs for supplier assessment [3,4], while explainable artificial intelligence can reveal influential features or local decision factors [12]. These approaches offer important analytical transparency, but management-facing supplier-risk decisions often require a broader synthesis of numerical results, historical context, procedural knowledge, evidential qualifications, and recommended actions [13].
Large language models (LLMs) offer a complementary capability for this purpose because they can interpret domain text, synthesize heterogeneous evidence, and communicate analytical results in natural language. Their use in supply-chain knowledge assistance, relation extraction, risk identification, and decision support is expanding rapidly [14,15]. The central challenge is not whether LLMs can generate fluent explanations, but how numerical authority and evidence provenance should be governed when generative models are introduced into operational decision-support systems. Numerical forecasting remains better suited to explicitly evaluated structured models in numerically sensitive tasks [16,17], whereas generated explanations can introduce values or statements that do not correspond to authoritative operational records [18]. Domain adaptation improves task alignment, and retrieval provides external evidence, but the resulting explanation must still distinguish current case information from knowledge retained in model parameters or retrieved from historical sources. This distinction is particularly important in the presence of context–memory conflict, where a model may reproduce previously learned values even when current evidence differs [19].
These observations motivate a different system architecture from an end-to-end generative predictor. The key requirement is to separate numerical authority from language-based interpretation while maintaining a controlled information flow between them. The numerical component should remain independently evaluable and replaceable; the language component should explain rather than regenerate authoritative outputs; retrieved evidence should remain traceable to its source and availability time; and the complete pipeline should obey the same temporal-causality boundary. Such a design makes it possible to combine the reproducibility of structured prediction with the contextual reasoning and communication capabilities of language models without transferring numerical control to the generative component.
Accordingly, this paper proposes a dual-track LLM framework for supplier delivery-reliability risk analysis in EV supply chains. The structured track produces the on-time delivery estimate for the next observed period and maps it to a delivery-reliability risk grade using study-defined thresholds. In this paper, supplier risk therefore refers specifically to delivery-reliability risk. Quality performance serves as a reference indicator for explanation and consistency checks and is not predicted as a separate risk; overall supplier risk, disruption probability, and sustainability risk are outside the scope of the model. The semantic track uses a locally deployed, LoRA-adapted Qwen2.5-3B-Instruct model to transform the structured outputs and relevant evidence into a structured risk explanation and management recommendations. The two tracks are deliberately assigned different responsibilities: the structured track determines the reported numerical assessment, whereas the semantic track interprets that assessment in its operational context. Local adaptation and inference keep supplier and quality records confidential within the enterprise computing environment.
Three complementary mechanisms connect the two tracks. First, hybrid dense–sparse retrieval supplies temporally admissible supplier histories, management rules, statistical references, compliance knowledge, and governed quality evidence. Second, numeric anchoring explicitly identifies the structured outputs as authoritative values in the generation prompt, preserving cross-track numerical consistency. Third, a three-level verifier checks business-rule compliance, consistency with historical statistics available at the prediction origin, and consistency between the generated conclusion and the structured outputs. A provenance audit further records whether numerical claims originate from current inputs or from adaptation corpora. Structured prediction, retrieval evidence, and verification statistics all follow a unified temporal-causality constraint, and the adaptation corpora are screened for target information. The resulting architecture therefore supports traceable explanation. It also makes explicit where numerical claims originate and which information was available when each decision was produced.
The main contributions of this study are as follows:
- A dual-track architecture is developed that separates numerical authority from generative explanation while retaining a replaceable structured-prediction interface. This design allows the predictive component to adapt to changing data regimes without redesigning the semantic, retrieval, or verification pipeline, providing a flexible basis for supplier delivery-risk decision support under private and small-sample industrial conditions.
- Hybrid retrieval, numeric anchoring, and three-level verification are integrated into a traceable explanation mechanism with explicit control of cross-track consistency and numerical provenance. A full-factorial evaluation, together with a blind evaluation by domain experts, examines the respective contributions of domain adaptation, retrieval, and anchoring to explanation structure, evidence use, consistency with the structured outputs, and perceived business value.
- A temporal-causal and provenance-aware evaluation strategy is established across the decision pipeline. Prediction inputs, retrievable evidence, and verification statistics are aligned to the same prediction origin, and the adaptation corpora are screened for target information. Numerical claims are differentiated according to whether they originate from current inputs or from adaptation corpora, and restated historical values are checked for validity at the prediction origin. This design extends temporal-validity checks beyond the structured predictor to retrieval and verification.
The remainder of this paper is organized as follows. Section 2 reviews supplier risk prediction, explainable artificial intelligence for supply-chain decision support, and large language models for industrial applications, and positions the present study relative to the remaining gaps. Section 3 presents the proposed dual-track framework. Section 4 reports the industrial case study and experimental evaluation. Section 5 discusses the replaceable structured interface, the managerial and sustainability implications, the implications for evaluation under small-sample industrial data, and the limitations and future research directions. Section 6 concludes the paper.
2. Related Work
2.1. Supplier Risk Prediction in Supply Chain Management
Supplier-risk prediction has been widely investigated as an important component of proactive supply-chain management [20]. With the increasing availability of operational data, researchers have developed statistical models, machine-learning approaches, and deep-learning methods to estimate supplier performance, delivery reliability, quality risk, and disruption probability. These approaches transform heterogeneous supplier information into quantitative indicators, providing valuable support for supplier evaluation and risk monitoring.
Traditional statistical models provide interpretable relationships between historical observations and future performance, while machine-learning methods can capture nonlinear interactions among multiple operational factors. Artificial intelligence has been systematically reviewed as an enabler of proactive supply-chain risk management, covering risk identification, assessment, mitigation, and monitoring across a wide range of methodological families [21,22]. In automotive supply chains, supplier delivery and quality prediction have been explored using operational records, historical performance indicators, and machine-learning-based forecasting methods [3,4,23]. Multi-criteria decision-making has also been combined with machine learning. For example, a hybrid AHP–TOPSIS and XGBoost model has been used to combine supplier performance ranking with next-month risk prediction in the EV industry [24]. For sustainable supplier selection, fuzzy multi-criteria methods have been used to weight evaluation criteria for EV battery suppliers based on expert linguistic judgments [25] and to assess candidate suppliers against sustainability and circularity criteria in closed-loop supply chain network design for electronic devices [26].
However, practical supplier-risk assessment differs from conventional benchmark prediction problems. Enterprise supply-chain datasets are typically private, limited in scale, and characterized by heterogeneous operational conditions. Under such circumstances, the appropriate predictive model depends strongly on data availability and temporal characteristics rather than model complexity alone. Therefore, practical decision-support systems require flexible prediction architectures that can accommodate different data regimes.
Furthermore, numerical risk estimation represents only one component of supplier management. Managers often require additional contextual information, including historical behavior, supporting evidence, and recommended actions, before making operational decisions. Existing prediction-oriented studies mainly focus on improving estimation accuracy, and decision-support systems for supplier evaluation typically aggregate multi-criteria scores rather than produce a reviewable rationale [27]. The integration between numerical assessment and traceable managerial interpretation therefore remains insufficiently explored. This motivates the development of frameworks that separate structured prediction from subsequent explanation and decision-support processes.
2.2. Explainable AI for Supply Chain Decision Support
Explainable artificial intelligence (XAI) has emerged as an important research direction for improving transparency and trust in data-driven decision systems. In supply-chain applications, XAI techniques help identify influential variables, reveal decision factors, and improve users’ understanding of model outputs. Feature attribution methods, surrogate models, and local explanation approaches have been widely adopted to interpret machine-learning predictions in complex industrial scenarios [28,29].
For supplier-risk management, explainability is particularly important because operational decisions may involve supplier evaluation, production coordination, inventory adjustment, and quality intervention. A risk score without supporting rationale provides limited assistance for decision makers who need to understand the causes of risk and determine appropriate responses.
Nevertheless, existing XAI methods mainly focus on explaining the internal behavior of predictive models, such as identifying important input variables or estimating feature contributions. Management-oriented decision support requires a broader form of explanation that can integrate numerical outputs, historical cases, domain knowledge, and external evidence, and that satisfies the requirements of evidential support, meaningfulness to the intended user, accuracy, and explicit acknowledgment of knowledge limits [30]. In addition, explanations involving quantitative information must remain consistent with authoritative operational records.
Recent research has therefore moved toward evidence-enhanced and knowledge-supported explanations, including hybrid approaches that couple learned models with explicit symbolic or knowledge-based reasoning so that explanations can be traced to represented knowledge rather than to model internals alone [28]. However, maintaining consistency between structured numerical assessments and generated explanations remains challenging, especially when language models are introduced into operational workflows. This highlights the need for decision-support architectures that explicitly define the relationship between numerical prediction, evidence retrieval, and language-based interpretation.
2.3. Large Language Models for Industrial Decision Support
Large language models (LLMs) have recently demonstrated strong capabilities in natural-language understanding, knowledge synthesis, and interactive decision assistance. In supply chain applications, LLMs have been explored for knowledge management, information extraction, risk identification, and operational support because they can process complex textual information and generate human-readable responses [14,15]. In supply chain risk applications, language models have been applied to disruption analysis in the EV battery supply chain, where they induce event schemas from heterogeneous disruption reports to support disruption prediction [2].
Retrieval-augmented generation (RAG) provides an effective mechanism for connecting LLMs with external knowledge sources by incorporating relevant information during generation rather than relying solely on model parameters [31]. Meanwhile, parameter-efficient fine-tuning methods such as Low-Rank Adaptation (LoRA) enable domain-specific adaptation of large models with reduced computational requirements [32]. These techniques provide practical pathways for deploying language models in specialized industrial environments.
Industrial decision support, however, requires more than fluent language generation. Recent studies have highlighted challenges related to hallucination and unsupported generation in large language models [33]. One line of work addresses this by training the model to retrieve, critique, and revise its own output [34]. In industrial deployment, however, the judgment of whether an explanation is adequately supported should not rest with the same component that produced it.
Automated frameworks for evaluating retrieval-augmented systems assess dimensions such as answer faithfulness, context relevance, and answer relevance [35,36]. These frameworks are designed mainly for open-domain question answering, in which the retrieved passages are treated as the authoritative source for generated answers.
2.4. Comparison with Recent LLM-Based Studies and Positioning of This Study
Section 2.1, Section 2.2 and Section 2.3 show how supplier risk assessment has evolved from numerical prediction, through efforts to explain model outputs, to the use of large language models for interpreting textual information and communicating analytical results. As LLMs enter supply chain decision support, an important question is how generative outputs relate to independently evaluated numerical results and to the evidence available at decision time. Because this issue lies at the core of the present study, Table 1 compares representative LLM-based studies in supply chain and procurement applications published between 2024 and 2026 with the present study.
Table 1.
Comparison of representative LLM-based studies in supply chain management with the present study.
Table 1 shows that recent LLM-based studies have advanced supplier discovery, supply chain risk measurement, network visibility, retrieval-supported mapping, and autonomous coordination. However, these studies assign different roles to language models and structured numerical analysis. In several applications, LLMs directly extract or generate risk information, while others use LLMs primarily for knowledge discovery, mapping, or autonomous decision support. In addition, existing evaluation frameworks for retrieval-augmented systems treat retrieved passages as the authoritative source, whereas in supplier risk analysis, the authoritative numerical values come from a structured predictor and each piece of evidence must be available at the prediction origin. Less attention has been given to architectures in which an independently evaluated structured predictor retains numerical authority while an LLM interprets frozen numerical outputs using traceable external evidence. The present study addresses this gap through a dual-track design that separates structured delivery risk estimation from semantic interpretation and connects the two through retrieval, numeric anchoring, verification, and provenance auditing.
3. Proposed Dual-Track Framework
3.1. Problem Formulation and System Boundaries
This paper formulates supplier delivery-reliability risk assessment as a coordinated decision-support problem comprising structured numerical prediction, delivery-reliability risk classification, and traceable semantic interpretation. For supplier i at the s-th observation period, the monthly profile is defined as
where , , , , , and denote the quality pass rate, on-time delivery rate, average lead time, delay rate, batch count, and arrival volume, respectively. These variables are obtained by aggregating routine enterprise records of orders, receipts, and incoming inspections on a monthly basis. Given a historical window of length L, the ordered history available for supplier i at prediction origin t is represented as
which contains the most recent L observed monthly profiles available up to the prediction origin. Because an enterprise does not necessarily conduct procurement transactions with every supplier in every month, the subscript t + 1 denotes the supplier’s next observed period rather than necessarily the next calendar month.
Let denote the set of external evidence available at prediction origin t. The complete framework can then be expressed as
where is the estimated on-time delivery rate for the next observed period, is the quality reference derived from recent observations, and is the delivery-reliability risk category. The term denotes the management-oriented semantic interpretation, while and denote its verification record and provenance audit record, respectively.
Within this framework, the Structured Track is the sole source of numerical outputs and risk categories. The Semantic Track generates corresponding interpretations and management recommendations based on the structured outputs and retrieved evidence. Retrieval supplements the historical, statistical, rule-based, and case-based information required for interpretation, but does not participate in determining the risk category. Verification and provenance auditing record consistency and source information associated with the semantic interpretation. The quality reference characterizes recent quality status and supports interpretation and consistency checking, while downstream vehicle-fault records are used for system-level retrospective analysis and evidence supplementation.
3.2. Overall Dual-Track Architecture
To integrate numerical assessment of supplier delivery risk with management-oriented interpretation, this study develops a dual-track decision-support framework consisting of a Structured Track and a Semantic Track. The Structured Track performs numerical assessment, while the Semantic Track interprets the structured outputs and generates management recommendations based on supplier profiles and external evidence. The two tracks are coordinated through evidence retrieval, numerical anchoring, and post-generation verification and auditing, while maintaining a clear functional boundary between numerical assessment and language-based interpretation. As shown in Figure 1, the overall architecture consists of four functional layers: the Data Layer, the dual-track core, the Retrieval, Anchoring, and Verification Layer, and the Offline Fault-Feedback Augmentation Layer.
Figure 1.
Overall framework of the dual-track method for supplier delivery-reliability risk assessment.
The Data Layer organizes supplier operational data and the domain information required for interpretation. Order, receipt, and incoming-inspection records are aggregated into the supplier monthly profiles and historical sequences defined in Section 3.1 and are used to construct the Structured Feature Matrix. Supplier historical cases, domain management rules, statistical references, compliance documents, and downstream quality records are maintained as independent evidence. They are made available to the Semantic Track only when the corresponding temporal and provenance constraints are satisfied. Thus, structured prediction inputs and external evidence remain separated at the data organization stage.
The dual-track core performs numerical assessment and semantic interpretation. The Structured Track produces the on-time delivery rate estimate, quality reference, and delivery-reliability risk category through the unified interface defined in Section 3.3 and serves as the authoritative source of these numerical outputs. The domain-adapted Semantic Track takes the supplier profile, structured outputs, and retrieved evidence as inputs and generates a four-part explanation comprising risk assessment, supplier traceability, cause analysis, and management recommendations. The structured outputs are passed to the Semantic Track as explicit numerical anchors so that the generated content remains centered on the predefined numerical results.
The Retrieval, Anchoring, and Verification Layer connects the two tracks and constrains semantic generation. The Evidence Retrieval module retrieves external evidence that is admissible at the current prediction origin. The Hybrid Index, which combines dense and sparse retrieval with rank fusion, provides the ranked evidence used for generation. Numerical anchoring specifies the structured outputs associated with the current interpretation. After generation, Verification & Auditing further examines business-rule consistency, as-of statistical consistency, cross-track logical consistency, and numerical provenance. These mechanisms are described in detail in Section 3.5 and Section 3.6.
The Offline Fault-Feedback Augmentation Layer uses downstream fault and quality feedback from the vehicle service stage to continuously expand system knowledge. In-service Quality Feedback can support Retrospective Feature Analysis, SFT Sample Augmentation, and Knowledge-based Enrichment, thereby enabling subsequent updates of the Structured Track, Semantic Track, and Evidence Layers. This layer is separated from the online inference process and operates as an offline augmentation mechanism within the framework.
3.3. Structured Prediction Track
The Structured Track is defined by a fixed input–output interface rather than being tied to a specific predictive architecture. Let denote the mapping that extracts a structured representation from the admissible history. This mapping may include feature selection, temporal arrangement, and preprocessing. Any predictor f satisfying
can occupy this interface. This formulation can accommodate persistence rules, statistical models, machine-learning regressors, and neural-network predictors without changing the downstream semantic interpretation, evidence retrieval, or verification mechanisms. The specific implementation of the interface is determined under a unified temporally admissible evaluation protocol. Candidate models are compared at the same prediction origins and under the same training-information boundary, with prediction error used as the primary model-selection criterion.
The delivery-reliability risk category is obtained by deterministically mapping the estimated on-time delivery rate:
where . These thresholds are study-defined settings used to construct operational delivery-reliability categories rather than categories prescribed by an industry standard. Therefore, represents the delivery-reliability risk category rather than the probability of complete supply interruption. Neither retrieved evidence nor the Semantic Track alters this deterministic mapping. The specific threshold values and the corresponding sensitivity analysis are presented in Section 4.
Quality performance is handled through a separate reference channel. No additional quality prediction model is trained. Instead, a quality reference indicator is constructed from recently observed quality pass rates:
where qmin denotes the lower bound of the quality reference indicator. In the empirical setting of this study, qmin = 0.70, so the quality reference is restricted to the interval [0.70,1.00]. This indicator is constructed from recent historical observations to characterize the supplier’s recent quality status and to provide a reference for semantic interpretation and consistency checking.
Regardless of which predictor is used to implement the structured interface, the Structured Track consistently outputs the estimated on-time delivery rate, the quality reference indicator, and the delivery-reliability risk category obtained through the deterministic mapping. These outputs then form the numerical anchors for the Semantic Track and remain unchanged throughout the interpretation, retrieval, and verification processes. In this way, the responsibilities of numerical assessment and language-based interpretation remain clearly separated.
3.4. Domain Adaptation of the Semantic Track
General-purpose instruction-tuned large language models have strong language understanding and generation capabilities, but they do not inherently possess the specialized terminology, analytical logic, or standardized output structure required for automotive supplier delivery management. When directly applied to supplier-risk interpretation, their outputs may not satisfy managerial review requirements for domain specificity, structural completeness, and consistency of expression. This issue is particularly relevant in proprietary, small-sample settings, where limited domain-adaptation data cannot ensure that generated content always remains consistent with the current business state and structured outputs. Therefore, the Semantic Track is not used to numerically predict future supplier performance. Instead, it serves as an interpretation module for the authoritative outputs determined by the Structured Track, including the estimated on-time delivery rate for the next observed period, the corresponding delivery-reliability risk category, and the quality reference indicator. Under this division of responsibilities, domain adaptation is intended to improve the model’s alignment with automotive supply-chain context, management logic, and explanation format without transferring numerical decision-making authority to the LLM.
Domain adaptation consists of two stages: continual pre-training (CPT) and supervised fine-tuning (SFT). CPT primarily familiarizes the model with automotive supply-chain terminology, the organization of enterprise records, and the context of supplier delivery and quality management. SFT further constrains task behavior by teaching the model the predefined explanation structure, analytical logic, and conventions for management-oriented expression. Information that requires continuous updating or source traceability, such as supplier historical states, statistical references, domain management rules, and case evidence, is not encoded as fixed facts during domain adaptation. Instead, such information is retained in the external evidence base and provided as needed at the current prediction origin during inference. Domain adaptation and time-specific evidence access therefore serve different functions. The former improves the model’s adaptation to domain language, task structure, and management-oriented expression, whereas the latter provides the external facts and evidence required for the current interpretation.
The adaptation corpus is constructed independently of the final evaluation. Target-information screening is applied consistently to both the CPT and SFT corpora, and samples containing target information from the evaluation period are excluded before training. Because some SFT instructions are also converted into knowledge fragments for CPT, the same screening procedure is applied to both adaptation stages to prevent target information from entering the model parameters through different training channels. After corpus screening, the Semantic Track undergoes CPT and SFT starting from the base model, and its parameters remain fixed during the subsequent formal semantic evaluation.
The Semantic Track uses Qwen2.5-3B-Instruct as the base model [44] and performs domain adaptation through Low-Rank Adaptation (LoRA) [32]. Because supplier, procurement, and quality data are commercially sensitive, both model adaptation and inference are conducted in a locally controlled environment. To reduce the number of trainable parameters and the computational cost of local training, the main parameters of the base model remain frozen, and only the LoRA adapter parameters are updated. For a pretrained weight matrix W0, the adapted weight is expressed as
where A and B are trainable low-rank matrices, ρ denotes the low-rank dimension, and is the scaling factor. This formulation introduces only low-rank parameter updates, thereby reducing the number of trainable parameters and the computational cost of domain adaptation. It is therefore more suitable for the locally controlled operating conditions considered in this paper.
After adaptation, the Semantic Track generates a standardized four-part management-oriented explanation comprising risk assessment, supplier traceability, cause analysis, and management recommendations. The generated content is based on the authoritative outputs from the Structured Track and the external evidence available at the current prediction origin. The estimated on-time delivery rate, quality reference indicator, and delivery-reliability risk category are all determined by the Structured Track. The Semantic Track does not recalculate, replace, or modify these outputs. Its role is to organize the existing numerical assessment together with relevant historical states, management rules, and case information into a natural-language explanation for managerial use. Associations among suppliers, components, and downstream fault information are treated only as candidate traceability clues when supported by the available evidence. They are not used to make direct causal or responsibility attributions. Thus, domain adaptation does not construct a new supplier predictor; rather, it improves the Semantic Track’s ability to organize domain information and perform standardized interpretation tasks.
3.5. Evidence Retrieval and Numeric Anchoring
Domain adaptation improves the Semantic Track’s alignment with automotive supply-chain terminology, task structure, and management-oriented expression, but it cannot ensure that generated facts always remain consistent with the supplier state at the current prediction origin. This is particularly important for time-varying supplier states, statistical indicators, and historical performance. Parametric knowledge acquired during adaptation cannot replace the latest external information available at inference time, nor can it determine the numerical authority of the current structured outputs. Therefore, two functionally complementary mechanisms are introduced during semantic generation: evidence retrieval and numerical anchoring. Evidence retrieval provides external facts and management-related information available at the current prediction origin, whereas numerical anchoring specifies the structured outputs that the Semantic Track must follow. The former addresses the evidential basis of the interpretation, while the latter defines the authority of the numerical results.
The evidence base contains five categories of information: supplier historical cases, domain management rules, supplier time-series statistics, compliance documents, and downstream fault cases. Each evidence fragment retains metadata describing its source, evidence category, associated supplier, applicable scenario, and temporal attributes. The temporal attributes are used to determine whether a fragment is admissible at a given prediction origin. Following the same temporal-causality constraints as the Structured Track, only information already available at the current prediction origin can enter the semantic interpretation process. Domain management rules and compliance documents are treated as static knowledge within the study period, and their admissibility therefore does not vary with the specific prediction origin. Downstream fault cases are included as supplementary traceability evidence to support the identification of potential quality-related associations.
To exploit both semantic similarity and keyword matching, this study adopts a hybrid retrieval method combining dense semantic retrieval with BM25-based sparse retrieval [45]. The two retrieval channels independently rank the candidate evidence fragments, and their ranked lists are merged using reciprocal rank fusion (RRF) [46]. For an evidence fragment d, the fusion score is defined as
where denotes the set of retrieval channels, rankc(d) is the rank of evidence fragment in channel , and is the smoothing constant. After rank fusion, only highly ranked evidence fragments that satisfy the temporal admissibility requirement at the current prediction origin are retained. These fragments provide external support for historical comparison, rule-based interpretation, and management recommendation generation.
Evidence retrieval is enabled by default at every semantic interpretation origin. In addition, a rule-gated retrieval scheme is introduced as an alternative to examine the possibility of reducing unnecessary retrieval calls. Retrieval is triggered when the structured output deviates from the supplier’s recent historical fluctuation range, when the risk category requires high-risk handling, or when the quality reference indicator falls below a predefined lower bound. Otherwise, the retrieval module is not invoked. This gated design is used only to evaluate the feasibility of reducing retrieval overhead under specific conditions and does not replace the default always-on retrieval strategy.
Numerical anchoring serves a different function from evidence retrieval. For the semantic interpretation of supplier i at prediction origin t, the outputs of the Structured Track are organized as an ordered numerical anchor:
where denotes the estimated on-time delivery rate for the next observed period, denotes the quality reference indicator, and denotes the delivery-reliability risk category mapped from the estimated on-time delivery rate. These structured outputs form the numerical anchor and are provided to the Semantic Track as an independent input. Because retrieved evidence may contain numerical values associated with the same supplier at different historical periods, the numerical anchor identifies the structured results corresponding to the current interpretation. Semantic generation is therefore centered on the current on-time delivery estimate, quality reference indicator, and risk category.
Accordingly, this study distinguishes numerical consistency from numerical authority in semantic generation. Numerical consistency indicates whether the generated content agrees with the relevant numerical values, whereas numerical authority is determined by the Structured Track and its explicit numerical anchor. Evidence retrieval supplements historical, statistical, rule-based, and case-based information, while numerical anchoring defines the authoritative numerical values for the current interpretation. The two mechanisms therefore provide evidence supplementation and numerical constraint, respectively, and jointly support management-oriented interpretations that are supported by external evidence and consistent with the structured outputs.
3.6. Multi-Level Verification and Provenance Auditing
The input to the Semantic Track consists of the supplier profile available up to the prediction origin, the structured numerical anchor, and the retrieved evidence. The supplier profile provides operational context beyond the information used for structured prediction. For supplier i at prediction origin t, let denote the input to the Semantic Track. The generation, verification, and prove-nance-auditing processes are expressed as
where denotes the domain-adapted semantic generation process, with as the generated management-oriented interpretation. denotes post-generation verification, where is the numerical anchor defined in Section 3.5, is the supplier historical statistics at the prediction origin, and is the resulting verification record. denotes provenance auditing, is the domain-adaptation corpus, and records the sources and temporal status of numerical statements in the generated content. Both verification and auditing operate on the raw generated output and are stored as additional records without modifying the original interpretation.
Verification is conducted at three levels: business rules, as-of statistics, and cross-track logic. Business-rule verification checks whether numerical values fall within reasonable ranges, whether the risk thresholds are used consistently with the definitions in this study, and whether the study-defined operational criteria are correctly stated. As-of statistical verification compares statements concerning supplier historical levels and statistical ranges with the historical statistics available at the prediction origin. This process identifies statements that clearly deviate from the current historical state without using information from after the prediction origin. Cross-track logical-consistency verification checks whether the risk assessment and management recommendations are consistent with the on-time delivery estimate, quality reference indicator, and delivery-reliability risk category contained in the numerical anchor. These three levels respectively assess business-rule compliance, as-of statistical consistency, and consistency between the two tracks, thereby providing a structured check of each generated interpretation.
In addition to these consistency checks, provenance auditing is performed on numerical statements in the generated interpretation. The audit first determines whether each numerical value can be traced to the current input, including the structured numerical anchor, supplier profile, or currently admissible retrieved evidence. If no match is found, the value is further checked against historical numerical values in the adaptation corpus for the same supplier. For statements matching historical training values, the most recent supplier record available at the prediction origin is then used to determine whether the value remains valid. This distinction separates valid historical restatements from stale restatements. If no source can be identified, the statement is recorded as a numerical claim with unidentified provenance. This audit characterizes the relationship between generated numerical values, current inputs, and historical adaptation information, thereby providing a basis for analyzing numerical traceability in semantic interpretation.
The verification and provenance-audit results are stored as additional records, including consistency flags, numerical sources, and their temporal status, and are output together with the original semantic interpretation. The on-time delivery estimate, quality reference indicator, and delivery-reliability risk category provided by the Structured Track remain fixed throughout this process. Verification and auditing record the relationships between the semantic interpretation and the structured outputs, historical statistics, and source information. Figure 2 summarizes the complete end-to-end inference process, from supplier-profile extraction, structured prediction, evidence retrieval, and numerical anchoring to semantic generation, multi-level verification, and provenance auditing. Subsequent semantic evaluation is conducted on the raw generated outputs, while the corresponding audit records are used for controlled experiments, case analysis, and human review.
Figure 2.
End-to-end inference procedure of the dual-track method.
4. Case Study and Experimental Evaluation
4.1. Industrial Data, Temporal Protocols, and Experimental Settings
4.1.1. Data Sources and Sample Construction
This study evaluates the proposed dual-track framework using anonymized supplier operational data from an automotive manufacturing enterprise. The data include order, receipt, and incoming-inspection records, monthly macro-environmental indicators, downstream vehicle in-service fault feedback, and domain evidence corpora used for retrieval by the Semantic Track. Table 2 summarizes the scale, constructed variables or evidence, and role of each data source.
Table 2.
Data sources, scale, constructed variables or evidence, and roles in the framework.
Lead time is defined as the number of calendar days between the order date and the receipt date. For records with negative lead times, a unified data-reconstruction rule is applied: the order date is shifted back by one calendar year, and the candidate correction is accepted only when the recalculated lead time falls within 0–120 days. Under this rule, 491 records are corrected, accounting for 17.4% of all batch-level records. Another 24 records still yield no valid lead time and are therefore excluded from the calculation of average lead time and on-time delivery rate. This rule is a data-processing heuristic rather than a record-by-record confirmation of the true original order dates. Its sensitivity is further examined in Section 4.2.
The batch-level records are aggregated by supplier entry and actual receipt month to form 71 monthly profiles. Of the 16 original supplier entries, two contain only a single monthly observation and therefore cannot form prediction samples with subsequent observed outcomes. These two entries are excluded from the prediction evaluation. The final modeling set contains 14 entries, including 12 anonymized suppliers and two procurement aggregation categories representing domestic and imported components, respectively. On-time delivery is determined according to the enterprise’s data-processing rules, with a 60-day delivery threshold for the imported category and a 30-day threshold for all other entries.
Months without procurement activity are not artificially filled with zero values. Therefore, the prediction target is defined as the on-time delivery rate in the next observed period for the same modeling entry rather than in a fixed next calendar month. This procedure yields 55 valid prediction samples. Among them, 51 samples (92.7%) have a one-month interval between adjacent observations, while three have two-month intervals and one has a three-month interval. Among the 41 frozen evaluation origins, 37 (90.2%) correspond to strictly one-month intervals.
Each structured input consists of the quality pass rate, on-time delivery rate, and average lead time from the three most recent observed periods, forming a nine-dimensional historical feature vector. When fewer than three historical observations are available, the earliest available observation is used for left padding. Quality pass rate and on-time delivery rate are dimensionless proportions, whereas lead time is measured in days. All preprocessing parameters that require estimation from data are fitted only on the training partition and then applied to the corresponding test origin.
4.1.2. Temporal Evaluation Protocols
The Structured Track is evaluated using two temporally valid protocols. The frozen rolling-origin protocol contains 41 fixed test origins, while the leave-one-supplier-out (LOSO) protocol contains 55 held-out predictions. For each prediction origin, a historical sample is included in the training set only if its target month is no later than that origin. This constraint prevents realized outcomes from later months of other modeling entries from leaking into the current prediction. All data preprocessing, hyperparameter selection, and model fitting are performed under this temporal constraint.
Persistence and exponential smoothing can be evaluated at all prediction origins. Learning models that require training across modeling entries are fitted only when at least 10 training samples remain after temporal truncation. Therefore, 36 origins are available for fitting under each protocol. Mean absolute error (MAE) is used as the primary metric for structured prediction, while macro-F1 is used to evaluate the three-category delivery-reliability risk classification. The sensitivity of the 0.30 and 0.70 risk thresholds is further analyzed in Section 4.2.
The Semantic Track is evaluated using the same 41 frozen origins. Across different configurations, the numerical anchor values, temporally admissible evidence pool, output template, and verification rules are kept fixed to provide a consistent basis for mechanism comparison.
4.1.3. Model Implementation and Semantic Track Configuration
The Structured Track compares nine interface implementations: persistence, exponential smoothing, Ridge, Lasso, kNN, random forest, XGBoost, MLP, and GRU. Their main hyperparameter settings are summarized in Table 3. For models evaluated with multiple random seeds, continuous predictions are first averaged across seeds and then mapped to risk categories using the thresholds defined in Section 3.3.
Table 3.
Structured predictors and their main configurations.
The Semantic Track uses Qwen2.5-3B-Instruct and undergoes lightweight CPT followed by LoRA-SFT. Before training, the adaptation corpus is audited for target information. Three SFT instructions containing reconstructed evaluation target values, together with their corresponding CPT-derived fragments, are excluded before training. The final SFT dataset contains 128 instructions, of which 115 are used for training and 13 for validation. The CPT corpus contains 233 segments, divided into 209, 12, and 12 segments for training, validation, and testing, respectively. The maximum sequence length is set to 384 tokens. A length audit confirms that all 128 SFT samples are fully retained without truncation of the main text.
The generation configuration is determined using 14 development origins. Configuration selection is based only on generation-side metrics and does not use realized target values or prediction errors from the formal evaluation. Once selected, the configuration is frozen and applied uniformly to the 41 formal evaluation origins. The final setting uses greedy decoding with a temperature of 0, a maximum generation length of 256 tokens, and a repetition penalty of 1.05. All formal evaluations of the Semantic Track are based on unmodified raw generations. The verification and provenance-auditing modules only record the checking results and do not automatically modify or regenerate the generated text. Table 4 summarizes the adaptation, retrieval, and generation configurations of the semantic track.
Table 4.
Semantic-track adaptation and retrieval configuration.
4.1.4. Evaluation Metrics and Statistical Analysis
The Structured Track uses mean absolute error (MAE) as the primary evaluation metric, while macro-F1 is used to assess the three-category delivery-reliability risk classification. For the Semantic Track, the main metrics include six-element coverage, four-section format compliance, degeneration rate, pooled violation density, numerical occurrence rate, and conditional anchor fidelity. The numerical occurrence rate indicates whether the generated text contains at least one extractable numerical value. Conditional anchor fidelity is defined as the proportion of explanations containing extractable numerical values in which at least one value differs from the current on-time delivery-rate anchor by no more than 0.05. These two metrics respectively characterize numerical referencing behavior and consistency with the anchor after a numerical value is referenced, and are therefore reported separately rather than combined into a single metric.
Detailed analyses of numerical provenance, stale historical restatements, and evidence-layer utilization are reported separately in Section 4.4. Paired comparisons are conducted using 10,000 bootstrap resamples. Point-level differences are reported with bias-corrected and accelerated (BCa) confidence intervals. Supplier-clustered bootstrap resampling is additionally used to account for correlations among multiple prediction origins from the same supplier, and Holm correction is applied to prespecified multiple comparisons. Comparisons of Semantic Track mechanisms further use McNemar’s test and the paired Wilcoxon test.
4.2. Model Selection and Sensitivity Analysis of the Structured Track
4.2.1. Comparison of Structured Predictors
This section compares the nine candidate implementations of the structured prediction interface defined in Section 3.3. All models are evaluated under the two temporal evaluation protocols described in Section 4.1.2. MAE is used as the primary model-selection criterion, while macro-F1 provides an additional evaluation of the three-category delivery-reliability risk classification. Table 5 and Figure 3 summarize the results.
Table 5.
Performance of structured predictors under the two temporal evaluation protocols.
Figure 3.
Comparison of structured predictors. (a) MAE under the two evaluation protocols, with error bars showing the standard deviations over 10 random seeds (dashed lines: MAE of persistence); (b) predicted versus observed values under the frozen protocol, where GRU uses the mean prediction across random seeds, and the horizontal line indicates the low-risk threshold of 0.70 (dashed diagonal: perfect prediction).
Under both protocols, persistence achieves the lowest MAE and the highest macro-F1, with values of 0.252 and 0.445 under the frozen protocol and 0.279 and 0.486 under the LOSO protocol, respectively. Exponential smoothing ranks second on both metrics. Among the seven cross-entry learning models, GRU achieves the lowest MAE of 0.336 under the frozen protocol, while kNN achieves the lowest MAE of 0.337 under the LOSO protocol. These values are approximately 0.084 and 0.058 higher than those of persistence, respectively. These results indicate that the most recently observed supplier state contains substantial predictive information for the next observed period in the current short-history panel.
This finding is consistent with the temporal structure of the panel. Most modeling entries have short monthly histories. Under strict temporal constraints, the cross-entry training samples available at later prediction origins mainly come from earlier months. For example, at the prediction origins in March and April 2025, the mean admissible training targets are 0.204 and 0.319, respectively, whereas the corresponding mean test targets reach 0.604 and 0.701. Both exhibit a difference of approximately 0.39. As shown in Figure 3b and Figure 4, predictions from the cross-entry learning models therefore concentrate in a lower range, and neither Ridge nor GRU classifies any origin as low risk. In contrast, persistence directly uses the most recent observed on-time delivery rate of the target entry, allowing it to respond more directly to recent changes in supplier performance.
Figure 4.
Confusion matrices of risk categories for persistence, Ridge, and GRU under the frozen protocol. (Rows denote the observed categories, and columns denote the predicted categories. For GRU, the categories are assigned based on the mean prediction across random seeds.).
Based on these temporally valid evaluation results, persistence is selected as the implementation of the Structured Track under the current data conditions. Its outputs serve as the authoritative numerical anchors for the subsequent semantic experiments. The structured prediction interface itself remains predictor-independent. When longer supplier histories or richer time-varying exogenous information becomes available, candidate predictors can be re-evaluated under the same protocol, and the interface implementation can be updated accordingly.
4.2.2. Robustness Checks
To further examine whether the selection of the Structured Track implementation depends on a single evaluation setting, this study investigates the relative performance of candidate predictors under variations in risk-category thresholds, anomalous-date handling, and prediction horizons.
Risk categories are derived from continuous on-time delivery rates. Therefore, the effect of classification thresholds is first examined by remapping the observed and predicted values using (0.20, 0.60) and (0.40, 0.80), in addition to the baseline thresholds of (0.30, 0.70). Changing the thresholds substantially alters the distribution of observed risk categories. Under the frozen protocol, the numbers of high-, medium-, and low-risk samples change from 18, 10, and 13 under the baseline thresholds to 11, 9, and 21 under the lower thresholds and 19, 14, and 8 under the higher thresholds, respectively. Persistence maintains the highest macro-F1 across all three threshold settings and both evaluation protocols. Its macro-F1 values are 0.445, 0.508, and 0.542 under the frozen protocol and 0.486, 0.447, and 0.525 under the LOSO protocol. Exponential smoothing consistently ranks second across all settings. In contrast, six to seven of the remaining models change their rankings as the thresholds vary, with maximum rank shifts of five to six positions. Thus, the rankings of the two leading predictors remain consistent within the predefined threshold range, whereas the classification rankings of the other models are more sensitive to threshold selection.
The treatment of anomalous dates affects the composition of the monthly panel. Therefore, the influence of the date-correction rule described in Section 4.1.1 is further examined. After excluding all 491 batch-level records that satisfy the correction rule and reconstructing the panel, four supplier-entry–month profiles disappear entirely. The number of prediction samples decreases from 55 to 51, and the number of frozen evaluation origins decreases from 41 to 37. Persistence still achieves the lowest MAE under both protocols, with values of 0.255 and 0.321 under the frozen and LOSO protocols, respectively. The corresponding values for the main dataset with date corrections are 0.252 and 0.279. Although the panel composition and absolute error levels change, the selection of the Structured Track implementation remains unchanged.
The prediction target in this study is defined as the on-time delivery rate in the next observed period. Because a small number of consecutive observations are separated by multiple calendar months, an additional analysis is conducted using only samples in which the prediction origin and the next observed period are exactly one calendar month apart. This subset contains 37 frozen origins and 51 LOSO origins. Persistence again achieves both the lowest MAE and the highest macro-F1 under the two protocols, with values of 0.266 and 0.433 under the frozen protocol and 0.291 and 0.477 under the LOSO protocol, respectively. Among the seven learning models, GRU retains the lowest MAE under the frozen protocol, while kNN retains the lowest MAE under the LOSO protocol. These results are consistent with those obtained using the complete next-observed-period dataset.
4.3. Controlled Experiments on Semantic Mechanisms in the Dual-Track Framework
This section uses controlled experiments to examine the respective roles of domain adaptation, numerical anchoring, and evidence retrieval in the Semantic Track. All nine configurations generate raw explanations at the same 41 frozen evaluation origins. The structured outputs, evidence pool, output template, and verification rules are kept fixed across configurations. The experiments employ a 2 × 2 × 2 full-factorial design combining Base/SFT, retrieval off/on, and anchoring off/on. An additional rule-gated retrieval configuration is included under the SFT condition, yielding 369 raw generations in total.
Table 6 summarizes the semantic evaluation results for the nine configurations. Six-element coverage and four-section format compliance assess the structural completeness of explanations. The explanation-level violation rate and pooled violation density evaluate consistency violations in the generated content, while the training-value restatement rate characterizes the model’s tendency to reproduce historical training values. Table 7 reports the statistical test results for six predefined paired comparisons. Based on these metrics, the following subsections examine the effects of domain adaptation, numerical anchoring, and evidence retrieval on the behavior of the Semantic Track.
Table 6.
Semantic evaluation results across the nine configurations.
Table 7.
Statistical tests for six predefined paired comparisons.
4.3.1. Domain Adaptation and Explanation Structure
The effect of domain adaptation on explanation structure is the most evident. As shown in Table 6, the four Base configurations achieve only 0–14.6% four-section compliance, whereas the corresponding SFT configurations increase to 68.3–78.0%. Under the condition of enabled numerical anchoring, the two predefined adaptation comparisons in Table 7 show that six-element coverage increases from 4.22 for Base–R0–A1 to 5.51 for SFT–R0–A1 without retrieval, and from 4.15 for Base–R1–A1 to 5.49 for SFT–R1–A1 with retrieval. Both differences remain significant after Holm correction. These results indicate that domain adaptation enables the model to organize explanations more consistently according to the task structure of risk assessment, supplier traceability, cause analysis, and management recommendations.
The effects of domain adaptation on violation metrics and generation stability differ from those on structural metrics. Under identical retrieval and anchoring conditions, all four Base/SFT paired comparisons show reductions in explanation-level violation rates in the same direction. However, the differences in explanation-level violation rate and pooled violation density between the two adaptation comparisons in Table 7 are not statistically significant after Holm correction. Meanwhile, degeneration occurs only in the SFT configurations: all four Base configurations have a degeneration rate of 0, whereas SFT configurations range from 19.5% to 31.7%. The default configuration, SFT–R1–A1, achieves a four-section compliance rate of 78.0% (32/41) with a degeneration rate of 19.5% (8/41). Therefore, domain adaptation mainly improves the structural organization and element coverage of explanations. Numerical constraints on structured outputs are provided by numerical anchoring, while generation stability remains one of the primary limitations of the Semantic Track.
4.3.2. Numerical Anchoring and Numerical Authority
Numerical anchoring is evaluated using the numerical occurrence rate and conditional anchor fidelity, with the results presented in Table 8. Since the Structured Track currently adopts persistence, the most recent on-time delivery rate may still appear as part of the supplier profile input when anchoring is disabled. Therefore, this experiment examines whether explicit anchoring enables the model to maintain consistency with the structured outputs, rather than whether numerical information is available.
Table 8.
Numerical occurrence rate and conditional anchor fidelity across configurations.
In the SFT model, numeric anchoring clearly improves conditional anchor fidelity. It rises from 34.4% to 100.0% without retrieval and from 87.5% to 96.2% with retrieval. With retrieval enabled, anchoring also reduces the numeric occurrence rate from 97.6% to 63.4%. Anchoring therefore does not increase numerical citation. Instead, it constrains the model to follow the structured result when it cites a value.
The Base model generally shows high conditional anchor fidelity. However, numerical matching does not mean that the model recognizes numerical authority. The provenance audit shows that 39 of the 41 anchor-matching values in Base–R0–A0 can be traced to the prompt input, as can 115 of the 119 in Base–R1–A1. Meanwhile, the Base model has much lower four-part compliance and six-element coverage than the SFT model. Numerical agreement is therefore insufficient to show whether the Semantic Track follows the numerical authority of the structured result. The role of explicit anchoring is to specify the value with which the explanation must remain consistent.
4.3.3. Evidence Retrieval and Its Interaction Effects
Evidence retrieval provides the Semantic Track with historical, statistical, and rule-based information available at the prediction origin. For the SFT models, when numerical anchoring is disabled, retrieval increases the six-element coverage from 4.24 (SFT–R0–A0) to 5.54 (SFT–R1–A0), with the difference remaining significant after Holm correction (p < 0.001). When numerical anchoring is enabled, retrieval does not further improve coverage (5.49 vs. 5.51). These results indicate that retrieved evidence can supplement the background information required for interpretation, while the coverage becomes relatively stable once anchoring is enabled.
Retrieval also changes the sources of generated numerical statements. Without anchoring, retrieval increases conditional anchor fidelity from 34.4% to 87.5% and reduces the training-value restatement rate from 8.7% to 0.0%. With anchoring enabled, the training-value restatement rate decreases from 24.4% to 7.3%. Since retrieved evidence may contain numerical values from different time periods or statistical definitions, retrieval itself cannot determine which numerical values should be treated as authoritative for the current interpretation. Therefore, retrieval provides external evidence and reduces historical training-value restatements, whereas numerical anchoring specifies the structured outputs that the interpretation must follow. Their combination enables the Semantic Track to incorporate external evidence while maintaining the unique numerical authority of the Structured Track. The actual utilization of retrieved evidence is further analyzed through provenance auditing in Section 4.4.
As shown in Table 7, the effect of retrieval on pooled violation density is not statistically significant under either anchoring condition. Since this metric uses the number of verifiable numerical statements as the denominator, while the coverage scope and statement composition vary across configurations, its interpretation requires consideration of coverage, explanation-level violation rate, and violation types. The distribution of violation types is shown in Figure 5. Statistical-range violations dominate across all configurations, whereas business-rule violations mainly appear in configurations with anchoring enabled. This observation is consistent with the result in Table 7 that anchoring without retrieval increases violation density significantly (+0.169, Holm-adjusted p = 0.026).
Figure 5.
Violation-type counts across the nine configurations. (Business-rule and statistical-range violations are counted based on numerical statements, and the same statement may be counted in both categories. Logical-consistency violations are counted at the explanation level.)
4.4. Provenance Auditing and Evidence Utilization Analysis
This section analyzes the numerical sources in the raw generated texts, the temporal validity of historical numerical values, and the utilization of retrieved evidence based on the provenance-auditing mechanism defined in Section 3.6. The rule-gated retrieval strategy is also evaluated. All audits are conducted based on the raw generations and their corresponding retrieval traces.
4.4.1. Numerical Provenance Auditing
The provenance audit first matches generated numerical values with the current prompt inputs. Unmatched values are then compared with historical numerical values from the adaptation corpus associated with the same modeling entry. Their temporal validity is further determined according to the most recent available panel record at the prediction origin. Under the default configuration, SFT–R1–A1, all 50 numerical occurrences consistent with the structured anchor can be traced back to the current prompt input.
The training-value restatement rates are presented in Table 6. The Base models are not domain-adapted, and their restatements mainly reflect numerical overlaps with historical values, with rates ranging from 0.3% to 11.3%. Without retrieval, numerical anchoring increases the restatement rate of Base and SFT models from 1.0% to 11.3% and from 8.7% to 24.4%, respectively. Therefore, the restatement rate only indicates the degree of overlap between generated numerical values and historical records. The temporal validity of these values must be further examined with respect to the prediction origin.
Accordingly, this study compares training-value restatements with the most recent available panel records of the same modeling entry. The results are shown in Figure 6. All nine restatements in SFT–R0–A0 are stale restatements. In SFT–R0–A1, the default configuration, and the rule-gated retrieval configuration, valid restatements account for 17 out of 20, 6 out of 8, and 9 out of 12 restatements, respectively. Base–R0–A1, Base–R1–A0, and Base–R1–A1 also contain 3, 1, and 5 stale restatements, respectively, indicating that stale restatements can also occur due to numerical overlap in Base configurations. Since the total number of restatements across configurations is limited to 0–27, this analysis is used to identify historical numerical values that have been replaced by updated records rather than to rank different configurations.
Figure 6.
Valid and stale training-value restatements in the nine settings. (A restatement is valid if it differs by no more than 0.01 from the most recent panel record available at the prediction origin; all others are stale. The number above each bar is the total number of restatements.).
4.4.2. Evidence-Layer Utilization and Numerical–Evidence Correspondence
Across the 41 evaluation origins, the point-wise retrieval process returns 123 temporally admissible evidence fragments. Their distribution among the five evidence layers is summarized in Table 9. Supplier historical cases, domain management rules, and supplier time-series statistics contribute 75, 33, and 14 fragments, respectively, accounting for 99.2% of all retrieved results. Compliance documents are retrieved only once, and downstream fault cases do not appear in the final top-3 retrieval results. Since no manually annotated relevance labels are available, the historical cases and statistical summaries of the queried modeling entry itself are used as a heuristic relevance set. Under this definition, Recall@3, MRR, and nDCG@3 of the retrieval process are 0.675, 0.976, and 0.743, respectively, which evaluate the retrieval capability of entry-specific historical information.
Table 9.
Scale, temporal admissibility, and retrieval use of the five evidence layers.
The downstream fault-case layer contains 48 documents that satisfy the temporal admissibility requirement at all evaluation origins. Therefore, its zero retrieval frequency cannot be fully attributed to temporal filtering. The median dense similarity of this layer is 0.590, which is lower than that of historical supplier cases (0.820). Manual inspection of sampled texts indicates that fault cases mainly describe vehicle in-service abnormalities and quality feedback, whereas the current queries primarily focus on supplier monthly delivery performance. The two types of information differ in both query semantics and evidence usage scenarios. In the production ranking, the median first-hit rank of fault evidence is 17. When the complete candidate set is expanded and temporal filtering and rank fusion are reapplied, this median rank decreases to 6, but the evidence still does not enter the top-three results.
The correspondence between generated numerical values and retrieved evidence reflects the actual utilization of external evidence. For Base configurations with retrieval enabled, a total of 588 generated numerical values are audited. The proportions of values with exact correspondence, rounded equivalence, and substantial discrepancy with retrieved evidence are 79.9%, 12.8%, and 7.3%, respectively. For SFT retrieval configurations, the corresponding proportions among 325 generated numerical values are 63.1%, 13.5%, and 23.4%, respectively. Combining the first two categories, 92.7% of numerical values in Base configurations and 76.6% in SFT configurations can be associated with numerical information from the current retrieved evidence. Because these aggregated proportions involve different configurations and generation behaviors, they are not used for model ranking but rather for identifying numerical statements requiring further review.
4.4.3. Rule-Gated Retrieval
To evaluate the optimization potential of retrieval invocation, this study further examines the rule-gated retrieval strategy. The strategy determines whether retrieval is triggered according to the deviation of structured predictions from recent historical states, the risk category, and the quality reference indicator. Based on the raw explanations generated by SFT–R0–A1 at the 41 evaluation origins, the 26 origins containing at least one verifier violation are defined as evidence-critical cases. The identification capability of the gating strategy is then evaluated using these cases as references.
The results of the rule-gated retrieval strategy are shown in Figure 7. The gating mechanism is triggered 24 times, including 17 correctly identified evidence-critical cases and 7 false triggers. Another 9 evidence-critical cases are not detected. The precision, recall, and F1-score are 0.708, 0.654, and 0.680, respectively. These nine missed cases indicate that some explanations depend on evidence in ways that cannot be identified from structured states before generation. Compared with retrieval at every prediction origin, the rule-gated strategy reduces retrieval calls by 17, corresponding to a reduction of 41.5%.
Figure 7.
Triggering results and identification of evidence-critical cases for rule-gated retrieval. (Evidence-critical cases refer to prediction origins where the raw SFT–R0–A1 explanations contain at least one verifier violation. The left bar represents the 24 retrieval triggers, and the right bar represents the 26 evidence-critical cases.).
As shown in Table 6 and Table 8, the rule-gated configuration and the default always-on retrieval configuration achieve six-element coverage values of 5.44 and 5.49, four-section compliance rates of 73.2% and 78.0%, and conditional anchor fidelities of 95.7% and 96.2%, respectively. The training-value restatement rate of the gated configuration is 14.0%, which is higher than the 7.3% achieved by the default configuration. Therefore, rule-gated retrieval can serve as an alternative strategy when retrieval cost is constrained, whereas always-on retrieval remains the default configuration adopted in this study.
4.5. Domain Expert Evaluation
To further evaluate the practical performance of explanations generated by the Semantic Track, three automotive OEM professionals were invited to participate in a blind evaluation, including two procurement engineers and one quality engineer. From the 41 frozen evaluation origins, 10 origins were selected through stratified sampling according to the predicted risk categories, including 6 high-risk, 3 medium-risk, and 1 low-risk case, covering 10 modeling entries. For each origin, explanations were generated using three configurations: A, Base–R0–A1; B, SFT–R0–A1; and C, SFT–R1–A1. The three configurations used the same structured numerical anchors and reference panels, resulting in 30 anonymized explanations. Each explanation was independently evaluated by two experts, producing 60 evaluation records. Experts used a five-point scale to assess five dimensions: correctness, evidence support, clarity, actionability of recommendations, and practical usefulness. The results are presented in Table 10. Inter-rater agreement (Krippendorff’s α) ranges from 0.012 for correctness to 0.766 for actionability, so the mean scores should be interpreted together with this variation.
Table 10.
Domain expert evaluation results of the three Semantic Track configurations.
As shown in Table 10, domain adaptation mainly changes the management-oriented expression characteristics of the generated explanations. Compared with configuration A, configuration B improves the actionability score from 1.40 to 2.75, indicating that domain adaptation strengthens the connection between risk analysis and management recommendations. Meanwhile, the evidence-support score of B decreases from 2.30 to 1.50. This indicates that without external retrieval, domain adaptation can improve task-related expression but cannot independently provide external evidence corresponding to the current prediction state. The higher evidence-support score of configuration A may be attributed to the tendency of the Base model to reproduce supplier information already included in the prompt. In contrast, the adapted model generates more management-oriented recommendations, but these recommendations are not simultaneously supported by sufficient external evidence.
After retrieval is introduced, the correctness score of configuration C increases from 2.40 in B to 2.80, and the evidence-support score increases from 1.50 to 2.05. These changes are consistent with the design objective of retrieval, which is to supplement temporally admissible external evidence for semantic interpretation. The results indicate that retrieval provides additional evidential support for generated explanations, while its role mainly lies in supplementing interpretation rather than independently determining the overall management evaluation.
The practical usefulness scores of the three configurations are 1.95, 1.95, and 2.00, respectively, remaining generally similar across configurations. This indicates that the improvements introduced by domain adaptation and retrieval have not yet translated into an increase in experts’ overall direct-use assessment. This result reflects the current deployment boundary of the Semantic Track: explanation structure, evidence support, and recommendation generation capabilities can be enhanced through different mechanisms, but generated outputs still require integration with human review and auditing mechanisms before practical management deployment. Combined with the preceding verification and provenance analyses, the primary value of the Semantic Track is to provide traceable and verifiable risk interpretations and decision-support information, rather than replace supply-chain experts in making independent management judgments.
4.6. End-to-End Case Analysis
To illustrate how the dual-track framework operates end to end and where its boundaries lie, three cases are selected from the 41 frozen evaluation origins. Each case involves a single anonymized supplier. All cases use the raw generations of the default setting SFT–R1–A1 without manual editing. The cases represent a typical run, a Structured Track prediction failure, and a Semantic Track generation failure. Table 11 presents the results.
Table 11.
Representative end-to-end cases under the default configuration.
M/2025-02 illustrates a typical run of the framework. The structured risk judgment agrees with the observed outcome. The Semantic Track organizes its explanation and management recommendations around the anchor. However, some details without evidence support are not flagged by the verifier. Even when the overall judgment is correct, the generated explanation still requires human review.
D/2025-04 illustrates the prediction boundary of the Structured Track. The Semantic Track remains consistent with the structured anchor, but the structured prediction does not capture the subsequent change in supplier status. Numeric anchoring therefore ensures consistency between the two tracks, but it does not ensure that the prediction itself is correct. As an independent interface, the structured predictor can be replaced without changing the semantic explanation or the audit process.
H/2025-04 illustrates the generation boundary of the Semantic Track. The structured risk judgment is correct. However, the generation degenerates and introduces details without evidence support, so the explanation is incomplete. Numeric anchoring can constrain key values, but it cannot eliminate the generation instability of the language model itself.
The three cases show that the dual-track framework preserves the division of responsibility between numerical judgment and language explanation. Retrieval and auditing also support subsequent review. However, the framework cannot eliminate structured prediction errors or the uncertainty of the generative model. Semantic Track outputs should therefore enter a human review process as supporting explanations with evidence and audit information.
5. Discussion
5.1. Why the Dual-Track Design Requires a Replaceable Structured Interface
The structured-track results demonstrate the importance of designing the prediction component as an adaptable interface within an industrial decision-support architecture. Under the evaluated short-panel setting, no learned predictor outperforms persistence, indicating that predictor selection should be determined by data characteristics and temporally valid evaluation rather than by model complexity alone.
This result supports defining the structured track as a replaceable input–output interface. The current framework uses persistence as the structured implementation. This choice suits the short-panel data in this study, and its applicability is limited to the current data conditions. When longer, richer, and temporally admissible supplier histories become available, the predictor in the structured interface can be reselected according to data size, temporal dependence, and task requirements. Specifically, statistical, machine learning, and deep time-series models can be compared under a unified temporally valid evaluation protocol. Persistence should serve as a strong baseline, and performance at origins where supplier states change should receive particular attention. The predictor can then be selected by jointly considering prediction error, cross-supplier generalization, stability, and model complexity.
The above analysis indicates that the structured prediction module should be designed as a system component that adjusts to data conditions. In this framework, the structured track passes only frozen risk estimates and grades to the semantic track and does not take part in explanation generation. The semantic track retrieves evidence and organizes the explanation, and its output is subject to verification and provenance auditing. Therefore, updating the predictor does not affect semantic explanation, retrieval, numeric anchoring, or verification. This division of roles allows forecasting errors to remain visible and reviewable. Persistence cannot anticipate abrupt recovery or deterioration in supplier performance. When an anchor is wrong, the semantic track may still produce a coherent explanation around it. The exposed structured outputs, evidence sources, and verification records allow such errors to be identified during human review.
The semantic track is likewise organized into modules with distinct functions. The factorial experiments show that domain adaptation improves task structure and domain expression. Retrieval supplies external evidence. Numeric anchoring keeps the explanation consistent with the structured results. Therefore, the contribution of this framework lies in enabling a flexible connection between quantitative prediction and traceable explanation under different industrial data conditions. The prediction component can be updated as data conditions change, while the explanation, evidence, and auditing processes remain stable.
5.2. Managerial Implications and Sustainability Relevance
The proposed dual-track framework provides reviewable decision-support information for supplier risk monitoring in automotive supply chains. The structured track produces delivery-reliability risk estimates. The semantic track organizes explanations and management recommendations based on recent operational indicators, supplier history, and management rules. It also retains the numeric anchors, retrieved evidence, and audit records. The expert evaluation in Section 4.5 shows that actionability scores tend to increase after domain adaptation and that evidence support recovers after retrieval is added. However, the overall usefulness scores of all three configurations are about 2 on a 5-point scale. The framework is therefore suited to supporting procurement and quality personnel in risk screening, evidence checking, and response planning. Specific management decisions still require human review.
From the perspective of sustainable supply-chain management, timely identification of delivery risk may give firms more room to adjust purchasing plans, coordinate supplier capacity, and arrange inventory and transport. Early risk checks and supply coordination may reduce the need for expedited transport and extra inventory after delivery problems occur. This may support joint improvement in resource efficiency and supply-chain resilience [5,6]. This paper does not measure transport, inventory, or resource consumption. These potential benefits also depend on prediction accuracy, managerial response, and actual operating conditions, and they require further validation in future research.
Practical use of the framework also requires clear boundaries between risk judgment and managerial responsibility. The cases in Section 4.6 show that structured predictions may fail to capture changes in supplier status in time. Generated explanations may also contain details without evidence support or may degenerate. Numeric anchoring, evidence retrieval, and provenance auditing should therefore jointly serve human review. Downstream vehicle fault records can provide leads for retrospective investigation of quality problems. However, without complete links among vehicles, parts, and production batches, the specific causes still need further verification. In addition, the delivery risk grades in this study are study-defined operational grades, and their sensitivity is reported in Section 4.2. They are suitable for setting monitoring priorities and managerial review, and they should not be used directly as a basis for contractual penalties or supplier liability.
5.3. Implications for Evaluation Under Small-Sample Industrial Data
When supplier histories are limited, the evaluation of a dual-track system needs to address predictive ability, explanation credibility, and practical value, and temporal validity is their common precondition. In the short supplier panel used in this study, later observations from other suppliers may not yet be available at the current prediction origin. Temporal constraints therefore need to cover the entire training set and extend to retrieval evidence and verification statistics, and the adaptation corpora need to be screened for target information. This ensures that the evaluation matches the information available at the time of prediction.
The comparison of structured predictors needs to consider both overall performance and performance when supplier states change. Persistence has a natural advantage at origins where the state is stable. When delivery performance changes, different predictors may show different error patterns. Therefore, in addition to overall MAE, the evaluation should use change-oriented subsets, the persistence baseline, resampling clustered by modeling entry, and multiplicity correction to assess model performance under the current data conditions.
The evaluation of semantic explanations needs to examine both the sources of numerical values and their evidence support. Numeric provenance distinguishes values from the current input and values from the adaptation corpora, and it identifies conflicts between historical values and the current state. The correspondence between stated values and retrieved evidence reflects how well the generated content is supported by evidence. The cases in Section 4.6 further show that automated verification may flag values that agree with the current anchor and evidence, and may also miss generated details without evidence support. Numeric provenance, evidence correspondence, and verifier flags should therefore be analyzed together to support human review.
Technical evaluation also needs to be combined with the professional judgment of business users. This study conducts an expert evaluation on five dimensions: correctness, evidence support, clarity, actionability, and usefulness. The results show that improvements in explanation structure and content coverage have not yet translated into higher overall usefulness scores. Combining temporally valid prediction evaluation, provenance-checkable generation evaluation, and domain-expert evaluation therefore provides complementary evidence for evaluating dual-track decision-support systems.
5.4. Limitations and Future Research Directions
The results of this paper are constrained by the data scope, the prediction task, and the conditions of semantic generation. First, the experiments are based on a short supplier panel from a single automotive enterprise, and the comparison of structured predictors depends on the limited observation history. Because some months have no supply records, the prediction target is the next observed period, and the actual time interval may vary. In addition, some abnormal order dates are corrected with a heuristic rule, and Section 4.2 examines the related sensitivity. These data conditions are important premises for the prediction evaluation in this paper.
Second, the structured track uses the on-time delivery rate as its main prediction target. Quality performance serves as a separate reference indicator, and the risk grades use study-defined operational thresholds. The current framework is therefore oriented mainly to delivery-reliability risk analysis. The structured predictor does not yet provide calibrated predictive uncertainty, and the rule gate triggers retrieval mainly from structured states. Its applicability to other supply-risk dimensions and to more complex temporal patterns requires further study.
The quality of semantic explanations depends on generation stability, the relevance of retrieved evidence, and the effectiveness of verification rules. In the default configuration, 19.5% of outputs still degenerate. Retrieval relevance is evaluated mainly with heuristic criteria, and automated verification may produce false flags and misses. Downstream fault cases do not enter the top three evidence items returned for delivery-risk queries, and their role in quality-related tasks remains to be tested. Instructions derived from fault feedback in the adaptation corpora were checked and contain no supplier delivery target information. However, their source records have not been screened by prediction origin, and some records are later than the corresponding evaluation origins. The temporal availability of the adaptation information therefore requires further verification. In addition, the expert evaluation was conducted by three professionals from an automotive OEM and covers ten evaluation origins. It provides preliminary business evidence on explanation quality, and the long-term effects of use still need further examination.
Based on these conditions, future work will proceed in three directions:
- Expanding the data scope and structured prediction capability. Long-term, continuous supplier operating data from multiple enterprises can be introduced. Abnormal dates can be further verified with original purchasing records, and candidate predictors can be compared again under a uniform prediction horizon. Prediction targets and related features for quality, capacity, inventory, and logistics can also be added step by step, and risk-threshold calibration and predictive uncertainty estimation can be studied.
- Improving semantic generation and evidence checking. Generation constraints and context-aware verification rules can be optimized. Human-annotated evidence relevance data can be used to improve cross-layer retrieval. The role of downstream fault cases can be tested in quality tasks where supplier, part, and batch links are available. Future work will also add signals observable before generation to the retrieval gate, such as the number of admissible evidence items and the distance between the predicted value and the risk thresholds. Temporal screening will be applied uniformly to the adaptation corpora. These steps aim to improve the completeness, evidence support, and verifiability of explanations.
- Conducting practical management and sustainability validation. The scale of the domain-expert evaluation can be expanded, and prospective application studies can be carried out in real procurement and quality management workflows. These studies can examine the effects of the framework on risk identification, managerial response, and decision efficiency. Operational indicators such as expedited transport, inventory cost, and resource consumption can then be used to evaluate its potential sustainability benefits.
6. Conclusions
This paper addresses supplier delivery-reliability risk analysis under private, small-sample conditions in automotive supply chains. It proposes a dual-track decision-support framework that combines structured prediction with traceable semantic explanation. The structured track produces delivery-reliability estimates and risk grades, and it adapts to different data conditions through a replaceable interface. The semantic track combines domain adaptation and retrieval augmentation to turn frozen structured results into risk explanations and management recommendations. Numeric anchoring and provenance auditing further establish checkable links among prediction results, generated content, and external evidence. Together, they provide a modular decision-support architecture for supplier risk monitoring.
Experiments on real automotive supply-chain data verify the functions of the framework’s components. Under the current short-panel conditions, persistence achieves an MAE of 0.252 under the frozen evaluation and 0.279 under LOSO evaluation. No learned predictor achieves a lower MAE than this baseline, which provides experimental support for the current implementation of the structured interface. Domain adaptation improves explanation structure and content coverage. Retrieval augmentation introduces external evidence that meets the temporal admissibility condition, and numeric anchoring strengthens the consistency between generated explanations and structured results. Across the 41 frozen evaluation origins, the default semantic configuration has a four-section compliance rate of 78.0% and a conditional anchor fidelity of 96.2%, while 19.5% of outputs still degenerate. The expert evaluation shows different trends in actionability and evidence support, but the overall usefulness scores of all three configurations are about 2. The scope of these results is constrained by the single-enterprise, short-panel data and the limited scale of the expert evaluation.
The practical value of the framework lies in combining delivery-reliability judgments with checkable risk explanations. It provides the information that procurement and quality personnel need for risk screening, evidence checking, and preparation of managerial responses. The end-to-end cases further show that numeric anchoring constrains the consistency between generated explanations and structured results. However, prediction errors and unsupported details in the generated content still need to be identified through human review. Methodologically, this paper emphasizes combining temporally valid prediction evaluation, provenance-checkable generation evaluation, and domain-expert evaluation. This combination provides a multidimensional basis for evaluating dual-track decision-support systems in small-sample industrial settings. By supporting supplier risk identification and managerial coordination, the framework also offers a potential route to better inventory and transport arrangements and more efficient use of supply-chain resources.
Future research will use long-term data from multiple enterprises to extend structured prediction and uncertainty estimation. It will further improve semantic generation, evidence retrieval, and verification, and it will test the business effects of the framework through larger expert evaluations and practical management applications. Operational indicators such as transport, inventory, and resource consumption will also be used to evaluate the actual effects of the framework on supply-chain resilience and sustainability performance.
Author Contributions
Conceptualization, W.Y. and Z.S.; methodology, W.Y. and Z.S.; software, Z.S.; validation, W.Y. and S.L.; formal analysis, W.Y.; investigation, Z.S.; resources, E.P.; data curation, S.L.; writing—original draft preparation, Z.S.; writing—review and editing, W.Y. and Q.F.; visualization, Z.S.; supervision, S.L. and Q.F.; project administration, E.P.; funding acquisition, S.L. All authors have read and agreed to the published version of the manuscript.
Funding
This work was supported in part by the National Natural Science Foundation of China (NSFC), China, under Project 52307065; and in part by the Fundamental Research Funds for the Central Universities, China.
Institutional Review Board Statement
Not applicable.
Informed Consent Statement
Not applicable.
Data Availability Statement
The data presented in this study are available on request from the corresponding author. The data are not publicly available because they consist of proprietary supplier performance and quality-inspection records provided by the collaborating enterprise under a confidentiality agreement.
Acknowledgments
The authors thank the collaborating enterprise for providing access to the operational records used in this study.
Conflicts of Interest
The authors declare no conflicts of interest. The funders had no role in the design of the study; in the collection, analyses, or interpretation of data; in the writing of the manuscript; or in the decision to publish the results.
Abbreviations
The following abbreviations are used in this manuscript:
| BM25 | Best Matching 25 |
| CPT | Continual Pre-Training |
| SFT | Supervised Fine-Tuning |
| EV | Electric Vehicle |
| LLM | Large Language Model |
| LoRA | Low-Rank Adaptation |
| LOSO | Leave-One-Supplier-Out |
| MAE | Mean Absolute Error |
| MLP | Multilayer Perceptron |
| MRR | Mean Reciprocal Rank |
| PMI | Purchasing Managers’ Index |
| RAG | Retrieval-Augmented Generation |
References
- Gao, Z.; Xie, H.; Yang, X.; Zhang, L.; Yu, H.; Wang, W.; Liu, Y.; Xu, Y.; Ma, B.; Liu, X. Electric vehicle lifecycle carbon emission reduction: A review. Carbon Neutraliz. 2023, 2, 528–550. [Google Scholar] [CrossRef] [Scilit]
- Cheng, Z.-Q.; Dong, Y.; Shi, A.; Liu, W.; Hu, Y.; O’Connor, J.; Hauptmann, A.G.; Whitefoot, K. Shield: Llm-driven schema induction for predictive analytics in ev battery supply chain disruptions. In Proceedings of the 2024 Conference on Empirical Methods in Natural Language Processing: Industry Track, Miami, FL, USA, 12–16 November 2024; pp. 303–333. [Google Scholar]
- Gabellini, M.; Civolani, L.; Calabrese, F.; Bortolini, M. A Deep Learning Approach to Predict Supply Chain Delivery Delay Risk Based on Macroeconomic Indicators: A Case Study in the Automotive Sector. Appl. Sci. 2024, 14, 4688. [Google Scholar] [CrossRef] [Scilit]
- Rezki, N.; Mansouri, M. Machine Learning for Proactive Supply Chain Risk Management: Predicting Delays and Enhancing Operational Efficiency. Manag. Syst. Prod. Eng. 2024, 32, 345–356. [Google Scholar] [CrossRef] [Scilit]
- Negri, M.; Cagno, E.; Colicchia, C.; Sarkis, J. Integrating sustainability and resilience in the supply chain: A systematic literature review and a research agenda. Bus. Strategy Environ. 2021, 30, 2858–2886. [Google Scholar] [CrossRef] [Scilit]
- Doetsch, S.; Huchzermeier, A. The intersection of supply chain resilience and sustainability from a theoretical and practical perspective: An integrated framework. J. Clean. Prod. 2024, 484, 144306. [Google Scholar] [CrossRef] [Scilit]
- Darom, N.A.; Hishamuddin, H.; Ramli, R.; Nopiah, Z.M. An inventory model of supply chain disruption recovery with safety stock and carbon emission consideration. J. Clean. Prod. 2018, 197, 1011–1021. [Google Scholar] [CrossRef] [Scilit]
- Singh, A.; Goel, A.; Chauhan, A.; Singh, S.K. Sustainability of electronic product manufacturing through e-waste management and reverse logistics. Sustain. Futures 2025, 9, 100490. [Google Scholar] [CrossRef] [Scilit]
- Li, Y.; Sukhotu, V. Enhanced Digital Capabilities for Building Resilient Supply Chains: Exploring Visibility, Collaboration, and Resilience in China’s Electric Vehicle Industry. World Electr. Veh. J. 2025, 16, 63. [Google Scholar] [CrossRef] [Scilit]
- Kembro, J.; Näslund, D.; Olhager, J. Information sharing across multiple supply chain tiers: A Delphi study on antecedents. Int. J. Prod. Econ. 2017, 193, 77–86. [Google Scholar] [CrossRef] [Scilit]
- Dey, S.; Kumar, S. Fostering information sharing willingness: An organizational privacy calculus for industry 4.0 supply chains. J. Organ. Comput. Electron. Commer. 2024, 34, 370–399. [Google Scholar] [CrossRef] [Scilit]
- Baryannis, G.; Dani, S.; Antoniou, G. Predicting supply chain risks using machine learning: The trade-off between performance and interpretability. Future Gener. Comput. Syst. 2019, 101, 993–1004. [Google Scholar] [CrossRef] [Scilit]
- Sadeghi, R.K.; Ojha, D.; Kaur, P.; Mahto, R.V.; Dhir, A. Explainable artificial intelligence and agile decision-making in supply chain cyber resilience. Decis. Support. Syst. 2024, 180, 114194. [Google Scholar] [CrossRef] [Scilit]
- Song, Z.; Xie, Y.; Yang, L.; Zhao, Y. Large language models in supply chain management: A systematic literature review and application framework. Int. J. Prod. Res. 2026, 64, 7144–7184. [Google Scholar] [CrossRef] [Scilit]
- Jackson, I.; Jesús Saénz, M.; Ivanov, D.; Ma, B.J. Supply chain mapping through retrieval-augmented generation: Applications to the electronics industry. J. Oper. Res. Soc. 2026, 77, 1798–1818, Correction in J. Oper. Res. Soc. 2026, 77, i. https://doi.org/10.1080/01605682.2026.2683301. [Google Scholar] [CrossRef] [Scilit]
- Tan, M.; Merrill, M.A.; Gupta, V.; Althoff, T.; Hartvigsen, T. Are language models actually useful for time series forecasting? Adv. Neural Inf. Process. Syst. 2024, 37, 60162–60191. [Google Scholar] [CrossRef] [Scilit]
- Makridakis, S.; Spiliotis, E.; Assimakopoulos, V. The M4 Competition: 100,000 time series and 61 forecasting methods. Int. J. Forecast. 2020, 36, 54–74, Erratum in Int. J. Forecast. 2021, 37, 1308–1309. https://doi.org/10.1016/j.ijforecast.2021.01.013. [Google Scholar] [CrossRef] [Scilit]
- Huang, L.; Yu, W.; Ma, W.; Zhong, W.; Feng, Z.; Wang, H.; Chen, Q.; Peng, W.; Feng, X.; Qin, B. A survey on hallucination in large language models: Principles, taxonomy, challenges, and open questions. ACM Trans. Inf. Syst. 2025, 43, 1–55. [Google Scholar] [CrossRef] [Scilit]
- Xu, R.; Qi, Z.; Guo, Z.; Wang, C.; Wang, H.; Zhang, Y.; Xu, W. Knowledge conflicts for llms: A survey. In Proceedings of the 2024 Conference on Empirical Methods in Natural Language Processing, Miami, FL, USA, 12–16 November 2024; pp. 8541–8565. [Google Scholar]
- Ho, W.; Zheng, T.; Yildiz, H.; Talluri, S. Supply chain risk management: A literature review. Int. J. Prod. Res. 2015, 53, 5031–5069. [Google Scholar] [CrossRef] [Scilit]
- Baryannis, G.; Validi, S.; Dani, S.; Antoniou, G. Supply chain risk management and artificial intelligence: State of the art and future research directions. Int. J. Prod. Res. 2019, 57, 2179–2202. [Google Scholar] [CrossRef] [Scilit]
- Schroeder, M.; Lodemann, S. A systematic investigation of the integration of machine learning into supply chain risk management. Logistics 2021, 5, 62. [Google Scholar] [CrossRef] [Scilit]
- Gabellini, M.; Calabrese, F.; Civolani, L.; Regattieri, A.; Galizia, F. A predictive data-driven approach for supply chain quality risks in the automotive sector. In Proceedings of the SUMMER SCHOOL FRANCESCO TURCO. PROCEEDINGS 2023, Genoa, Italy, 6–8 September 2023; pp. 1–7. [Google Scholar]
- Yan, W.; Song, Z.; Liu, S.; Pan, E. Supplier Evaluation in the Electric Vehicle Industry: A Hybrid Model Integrating AHP-TOPSIS and XGBoost for Risk Prediction. Sustainability 2026, 18, 977. [Google Scholar] [CrossRef] [Scilit]
- Lahri, V.; Singh, N.K.; Virmani, N. Prioritising criteria for sustainable battery supplier selection in the EV sector using fuzzy-ordinal priority approach. Int. J. Ind. Eng. Oper. Manag. 2026, 8, 66–88. [Google Scholar] [CrossRef] [Scilit]
- Shahrabifarahani, S.; Torabi, S.A.; Rahiminia, M. Circular sustainable supply chain network design for electronic devices. Environ. Dev. Sustain. 2025, 1–34. [Google Scholar] [CrossRef] [Scilit]
- Ma, Q.; Li, H. A decision support system for supplier quality evaluation based on MCDM-aggregation and machine learning. Expert. Syst. Appl. 2024, 242, 122746. [Google Scholar] [CrossRef] [Scilit]
- Kosasih, E.E.; Papadakis, E.; Baryannis, G.; Brintrup, A. A review of explainable artificial intelligence in supply chain management using neurosymbolic approaches. Int. J. Prod. Res. 2024, 62, 1510–1540. [Google Scholar] [CrossRef] [Scilit]
- Heydarbakian, S.; Spehri, M. Interpretable machine learning to improve supply chain resilience, an industry 4.0 recipe. IFAC-PapersOnLine 2022, 55, 2834–2839. [Google Scholar] [CrossRef] [Scilit]
- Phillips, P.J.; Hahn, C.A.; Fontana, P.C.; Yates, A.N.; Greene, K.; Broniatowski, D.A.; Przybocki, M.A. Four Principles of Explainable Artificial Intelligence; National Institute of Standards and Technology: Gaithersburg, MD, USA, 2021.
- Lewis, P.; Perez, E.; Piktus, A.; Petroni, F.; Karpukhin, V.; Goyal, N.; Küttler, H.; Lewis, M.; Yih, W.-t.; Rocktäschel, T. Retrieval-augmented generation for knowledge-intensive nlp tasks. Adv. Neural Inf. Process. Syst. 2020, 33, 9459–9474. [Google Scholar]
- Hu, E.J.; Shen, Y.; Wallis, P.; Allen-Zhu, Z.; Li, Y.; Wang, S.; Wang, L.; Chen, W. Lora: Low-rank adaptation of large language models. arXiv 2021, arXiv:2106.09685. [Google Scholar]
- Ji, Z.; Lee, N.; Frieske, R.; Yu, T.; Su, D.; Xu, Y.; Ishii, E.; Bang, Y.J.; Madotto, A.; Fung, P. Survey of hallucination in natural language generation. ACM Comput. Surv. 2023, 55, 1–38. [Google Scholar] [CrossRef] [Scilit]
- Asai, A.; Wu, Z.; Wang, Y.; Sil, A.; Hajishirzi, H. Self-rag: Learning to retrieve, generate, and critique through self-reflection. In Proceedings of the International Conference on Learning Representations, Vienna, Austria, 7–11 May 2024; pp. 9112–9141. [Google Scholar]
- Es, S.; James, J.; Anke, L.E.; Schockaert, S. Ragas: Automated evaluation of retrieval augmented generation. In Proceedings of the 18th Conference of the European Chapter of the Association for Computational Linguistics: System Demonstrations, St. Julian’s, Malta, 17–22 March 2024; pp. 150–158. [Google Scholar]
- Saad-Falcon, J.; Khattab, O.; Potts, C.; Zaharia, M. Ares: An automated evaluation framework for retrieval-augmented generation systems. In Proceedings of the 2024 Conference of the North American Chapter of the Association for Computational Linguistics: Human Language Technologies (Volume 1: Long Papers), Mexico City, Mexico, 16–21 June 2024; pp. 338–354. [Google Scholar]
- Li, Y.; Starly, B. Building a knowledge graph to enrich ChatGPT responses in manufacturing service discovery. J. Ind. Inf. Integr. 2024, 40, 100612. [Google Scholar] [CrossRef] [Scilit]
- Fan, S.; Wu, Y.; Yang, R. Measuring firm-level supply chain risk using a generative large language model. Finance Res. Lett. 2025, 77, 107111. [Google Scholar] [CrossRef] [Scilit]
- Li, Y.; Ko, H.; Ameri, F. Integrating graph retrieval-augmented generation with large language models for supplier discovery. J. Comput. Inf. Sci. Eng. 2025, 25, 021010. [Google Scholar] [CrossRef] [Scilit]
- Liu, C.-Y.; Chou, J.-S. Automated legal consulting in construction procurement using metaheuristically optimized large language models. Autom. Constr. 2025, 170, 105891. [Google Scholar] [CrossRef] [Scilit]
- Jannelli, V.; Schoepf, S.; Bickel, M.; Netland, T.; Brintrup, A. Agentic LLMs in the supply chain: Towards autonomous multi-agent consensus-seeking. Int. J. Prod. Res. 2026, 1–31. [Google Scholar] [CrossRef] [Scilit]
- Zouaghi, I.; Beldjoudi, S.; Gunasekaran, A.; Fosso Wamba, S.; Sahrane, S. Balancing performance and innovation in AI-driven supply chains through temperature-scaled hallucination control. Int. J. Prod. Res. 2026, 64, 4341–4378. [Google Scholar] [CrossRef] [Scilit]
- AlMahri, S.; Xu, L.; Brintrup, A. Enhancing supply chain visibility with knowledge graphs and large language models. Int. J. Prod. Res. 2026, 64, 2178–2209. [Google Scholar] [CrossRef] [Scilit]
- Yang, A.; Zhang, B.; Hui, B.; Gao, B.; Yu, B.; Li, C.; Liu, D.; Tu, J.; Zhou, J.; Lin, J. Qwen2. 5-math technical report: Toward mathematical expert model via self-improvement. arXiv 2024, arXiv:2409.12122. [Google Scholar]
- Robertson, S.; Zaragoza, H. The probabilistic relevance framework: BM25 and beyond. Found. Trends ® Inf. Retr. 2009, 4, 1–174. [Google Scholar] [CrossRef] [Scilit]
- Cormack, G.V.; Clarke, C.L.; Buettcher, S. Reciprocal rank fusion outperforms condorcet and individual rank learning methods. In Proceedings of the 32nd International ACM SIGIR Conference on Research and Development in Information Retrieval, Boston, MA, USA, 19–23 July 2009; pp. 758–759. [Google Scholar]
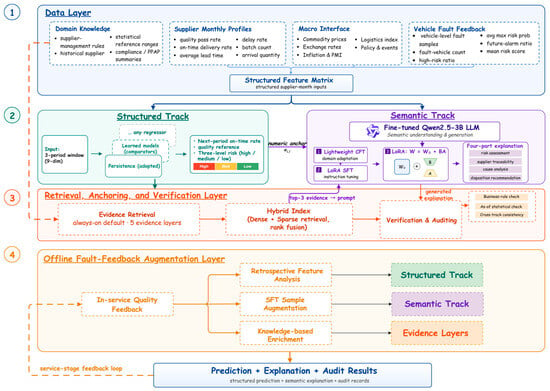
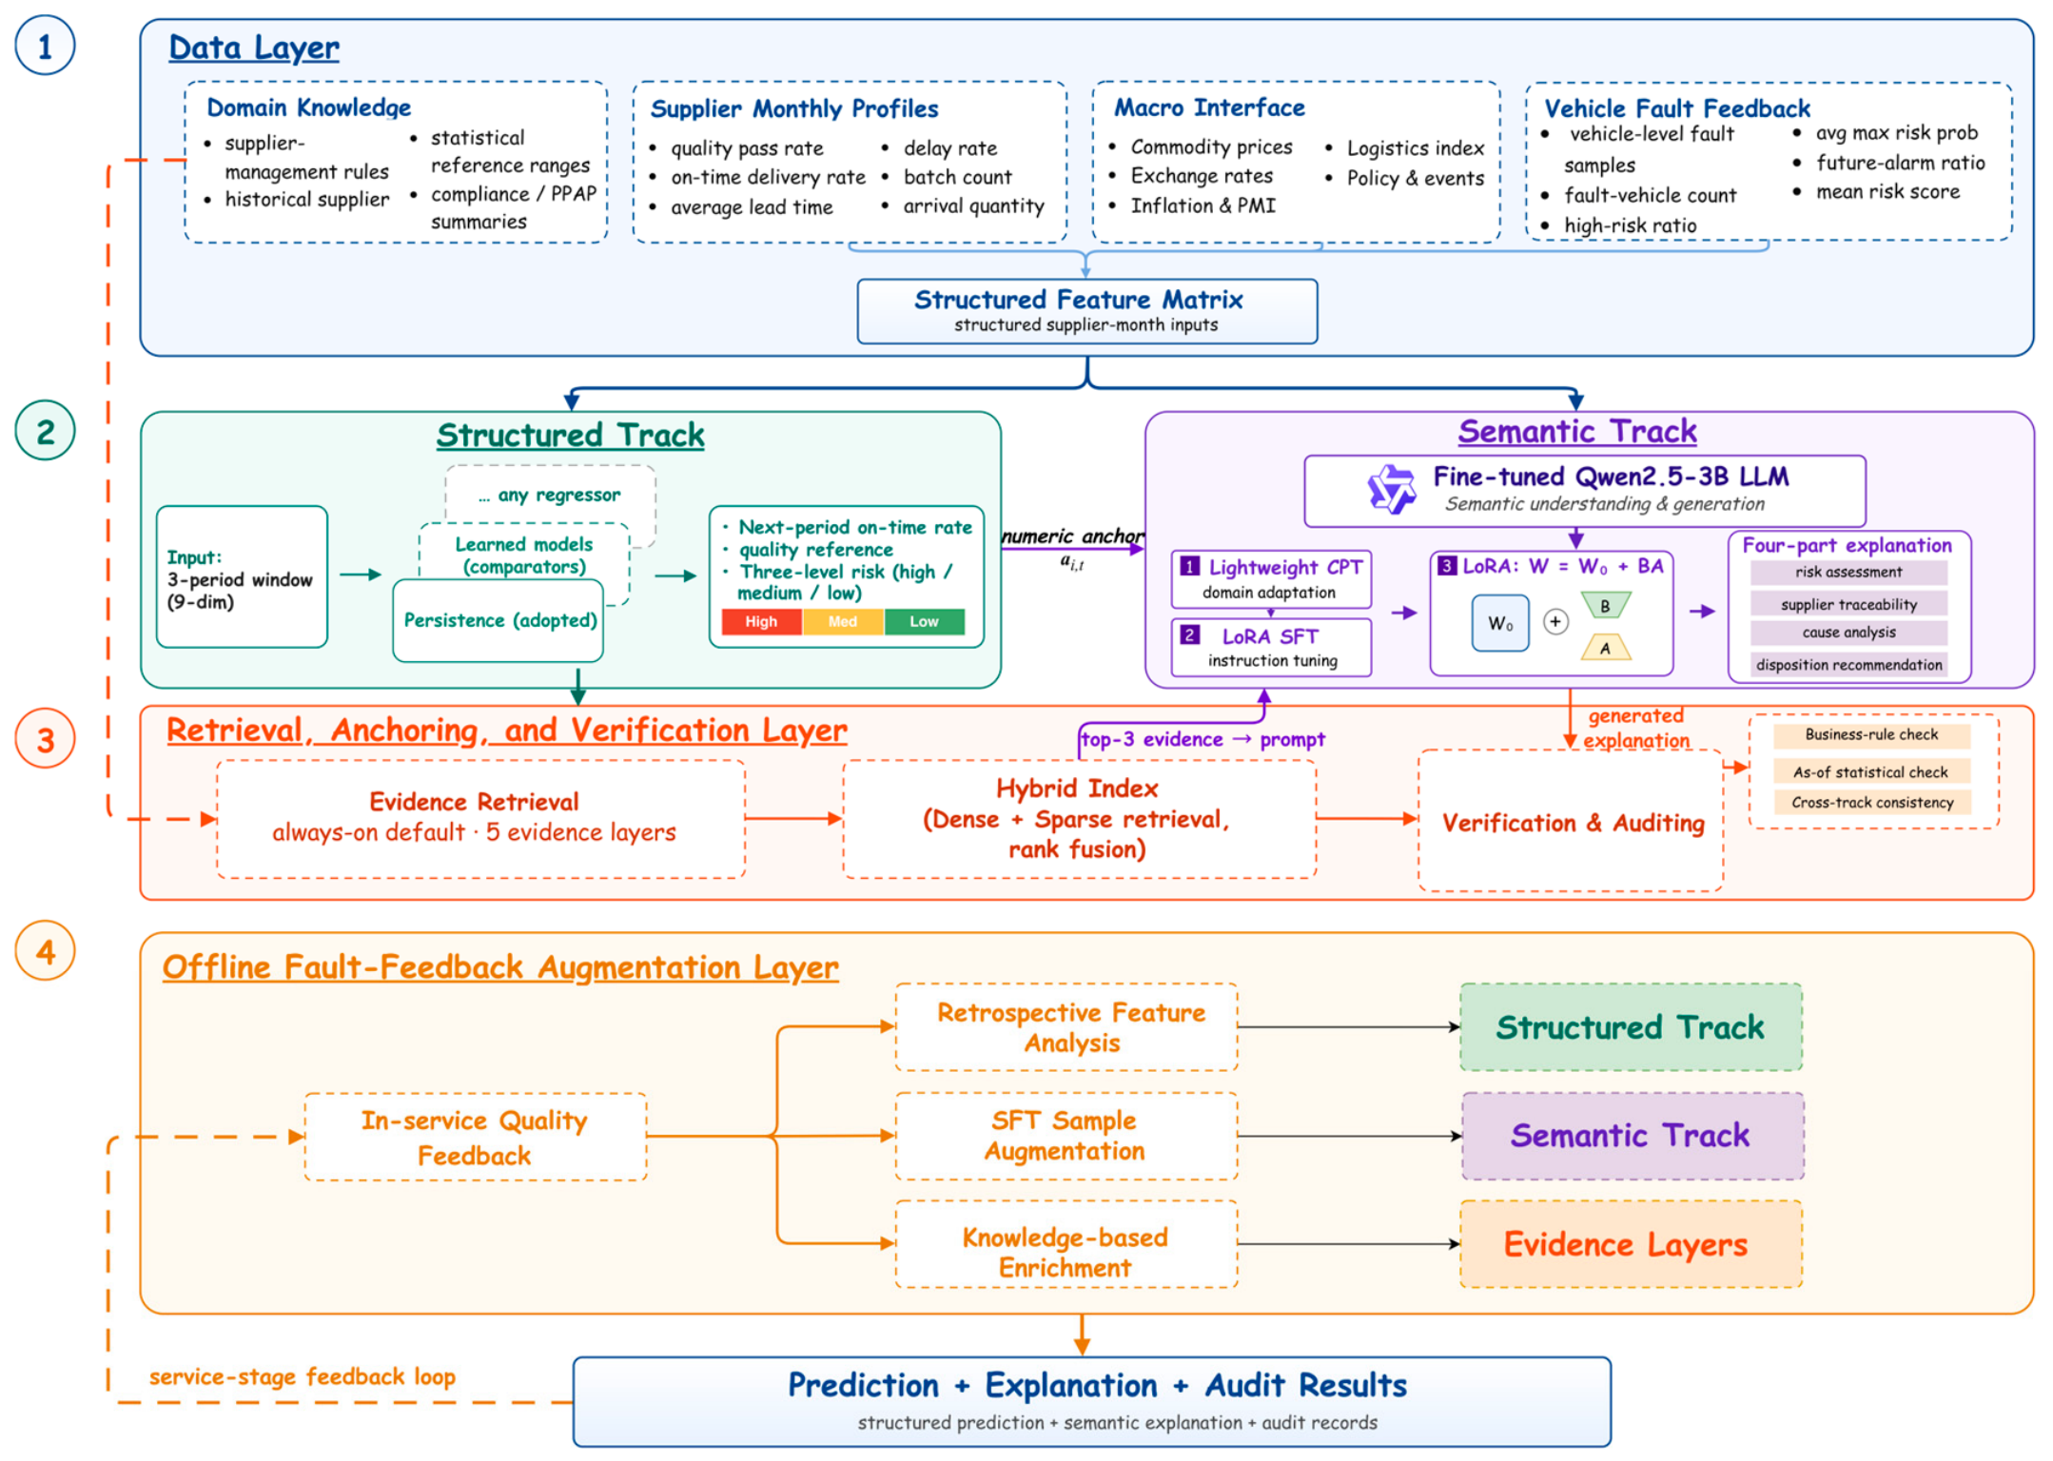
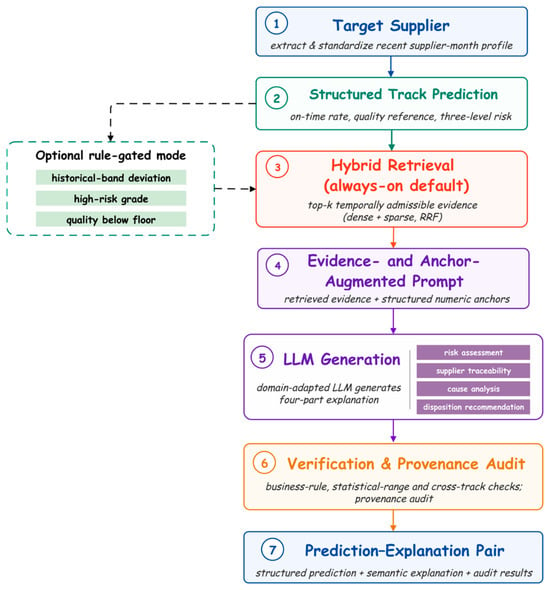
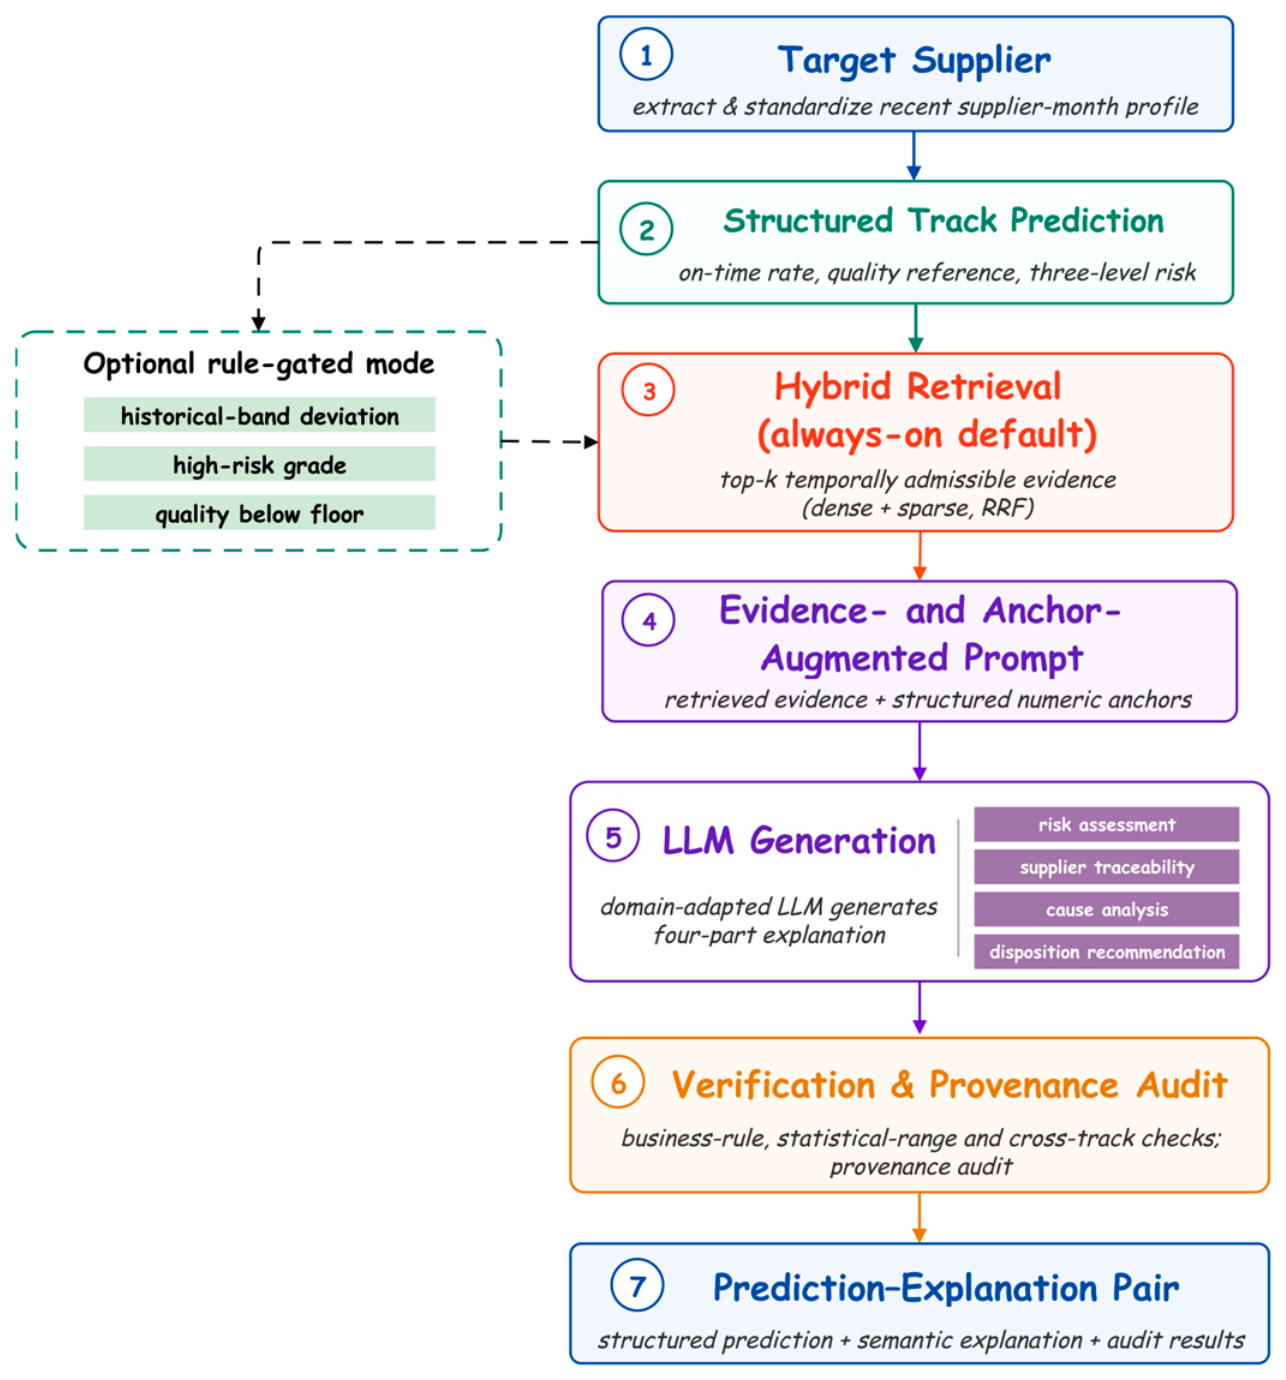
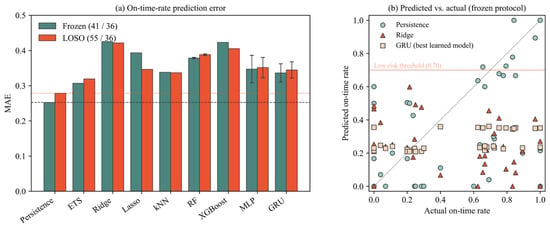
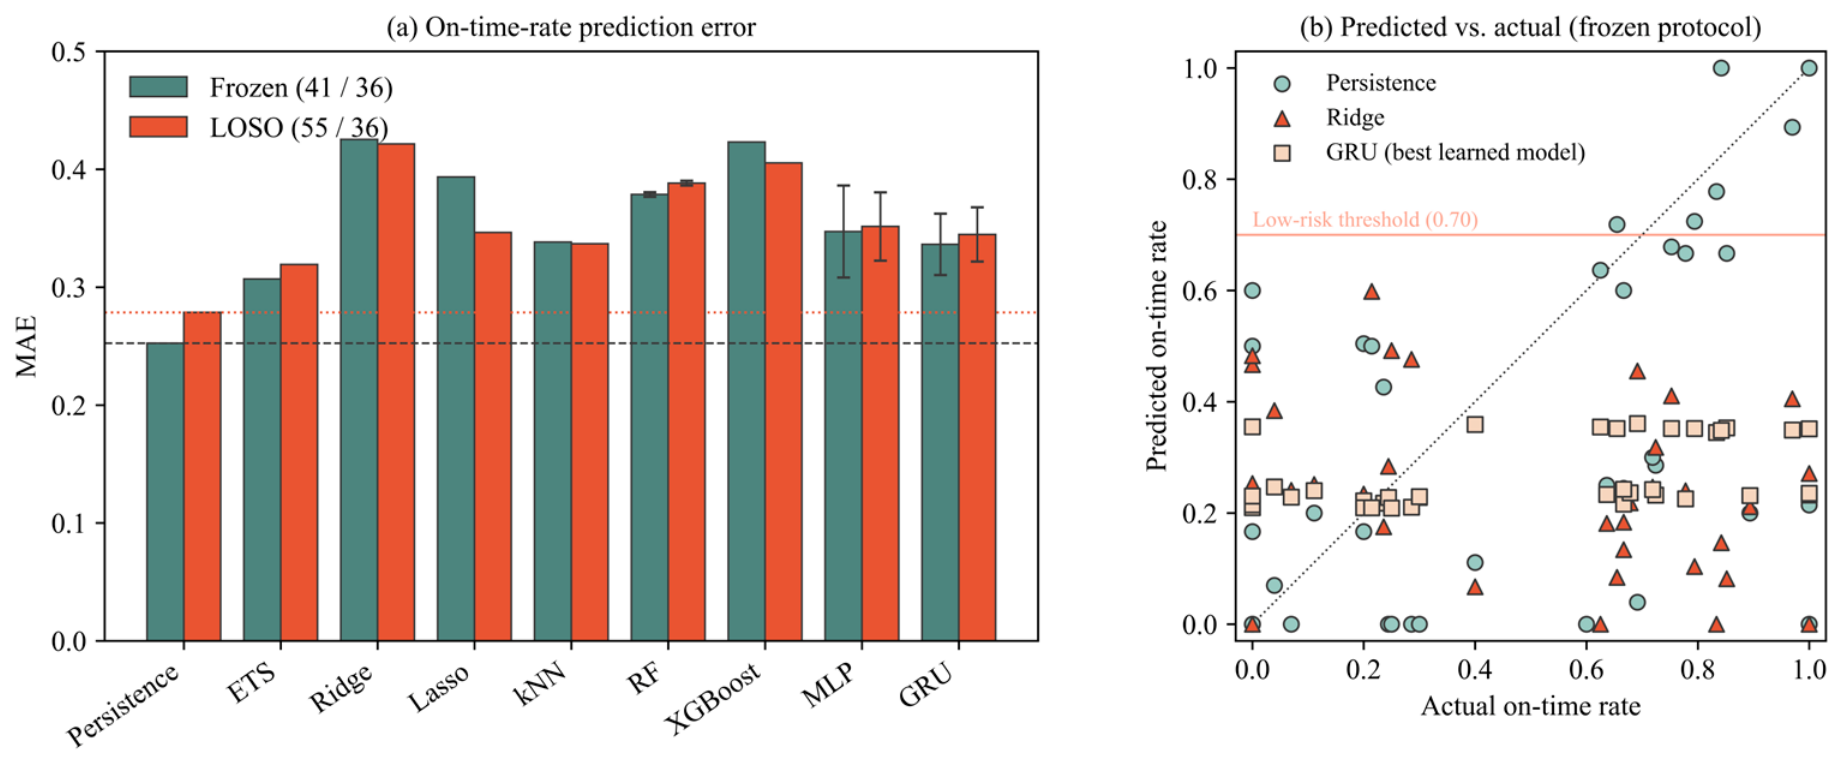
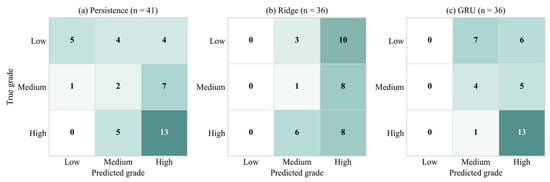
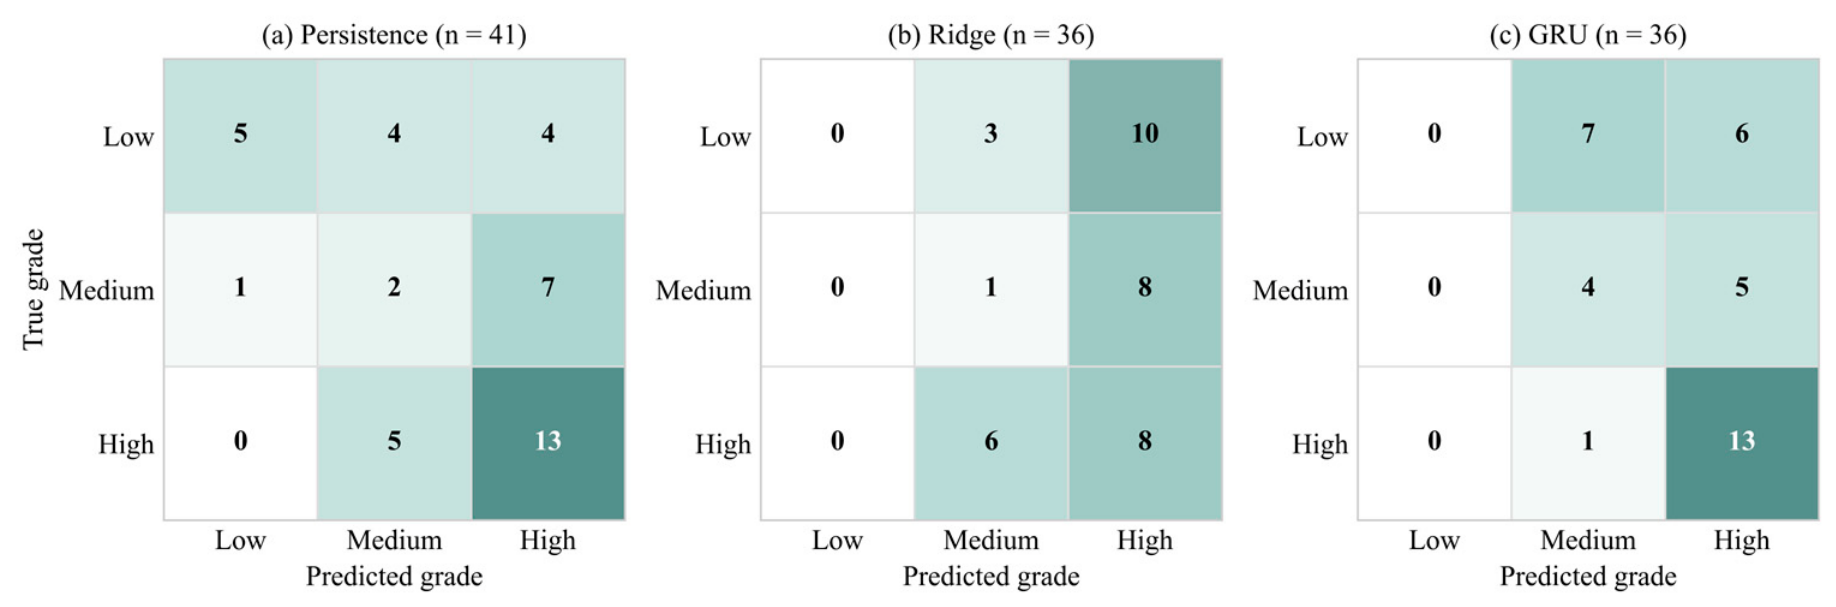
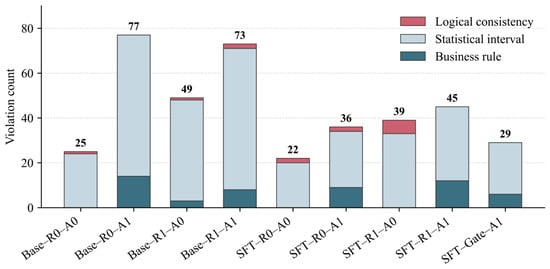
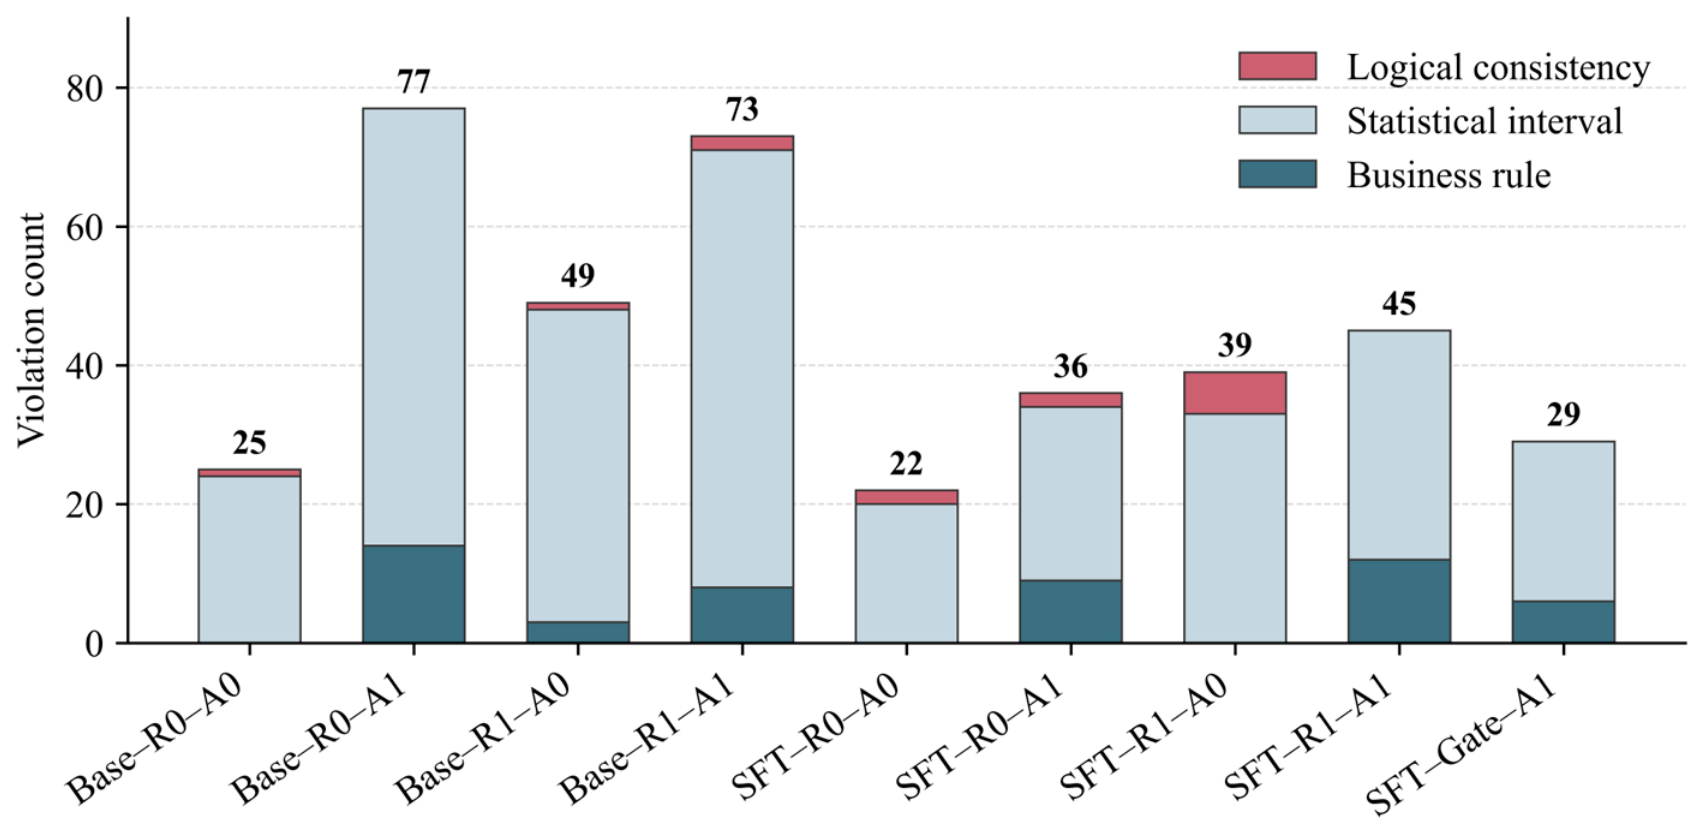
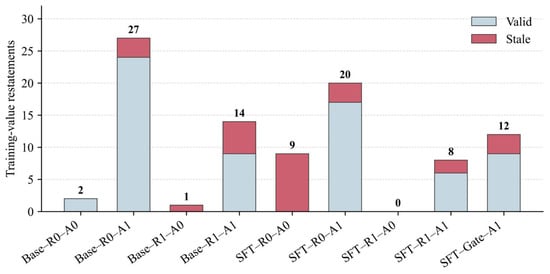
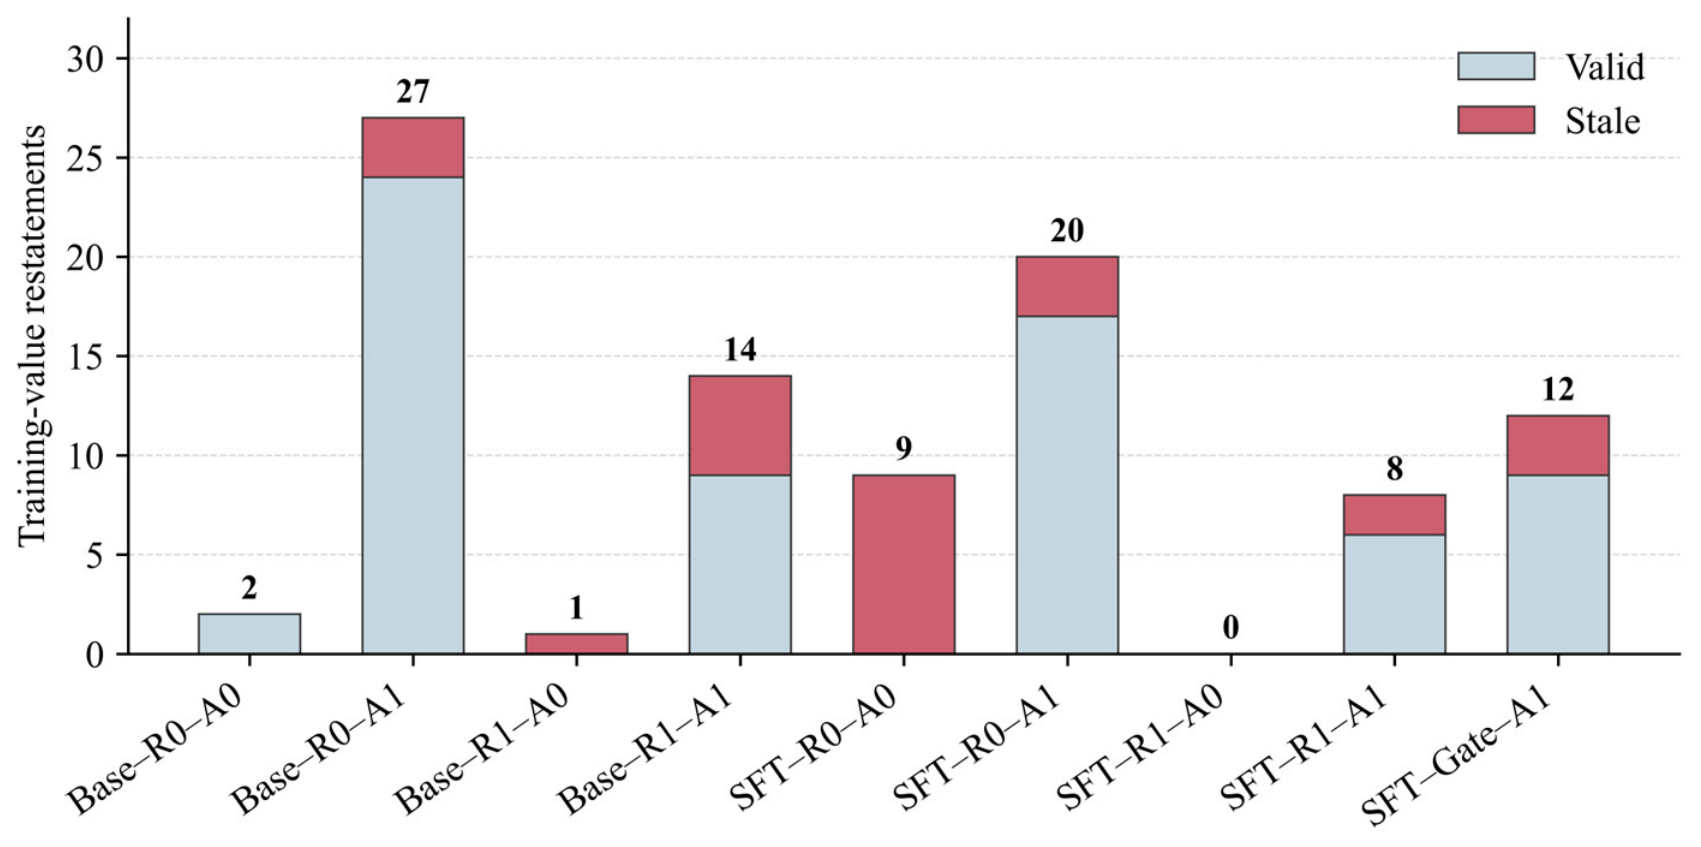
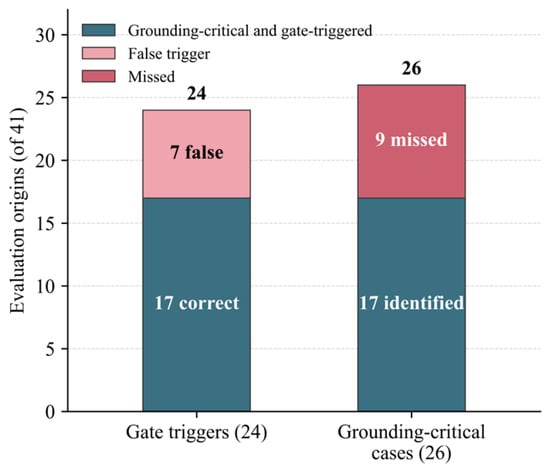
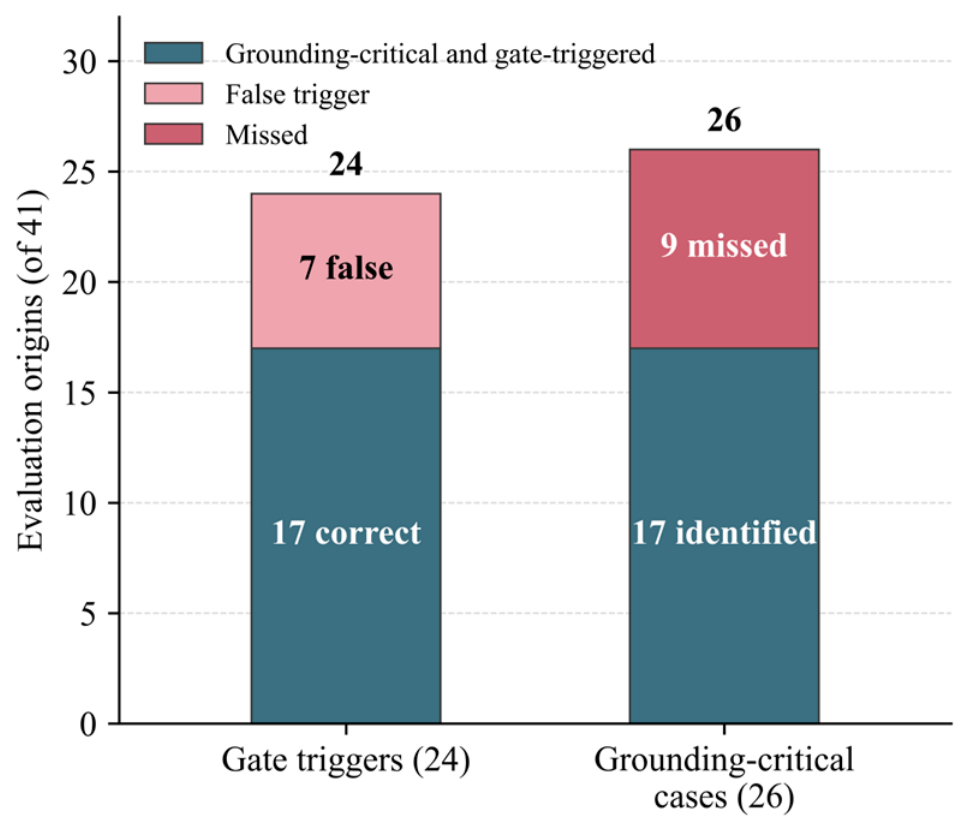

Disclaimer/Publisher’s Note: The statements, opinions and data contained in all publications are solely those of the individual author(s) and contributor(s) and not of MDPI and/or the editor(s). MDPI and/or the editor(s) disclaim responsibility for any injury to people or property resulting from any ideas, methods, instructions or products referred to in the content. |
© 2026 by the authors. Licensee MDPI, Basel, Switzerland. This article is an open access article distributed under the terms and conditions of the Creative Commons Attribution (CC BY) license.