


Abstract
Invasive albizia (Falcataria falcata (L.) Greuter & R. Rankin) trees pose an increasing threat to infrastructure, transportation networks, and public safety in Hawai’i because their rapid growth and shallow root systems make them susceptible to windthrow during severe weather events. However, comprehensive spatial information on albizia distribution remains limited, constraining invasive-species management, hazard mitigation, and sustainable infrastructure planning. This study evaluates the applicability of a GeoAI-based framework for identifying invasive-tree-related infrastructure exposure at a regional planning scale. This study develops a GeoAI framework using a U-Net convolutional neural network with a ResNet-34 backbone to detect and map albizia canopy from 0.6 m National Agriculture Imagery Program (NAIP) aerial imagery. Training data from two geographically distinct areas, Mānoa and Kahalu’u, were used for model development and iterative refinement. The final model achieved a precision of 0.76, compared with 0.64 in the initial iteration, and was applied to estimate potential tree-fall exposure through spatial proximity analysis of roads and buildings. Following manual quality control, approximately 2 km2 of albizia canopy were identified within the study area. More than 53 km of roads and 2300 buildings were located within the potential tree-fall exposure zone, including portions of major transportation corridors such as Pali Highway, Likelike Highway, and Interstate H-3. By integrating scalable invasive-tree detection with infrastructure exposure assessment, the framework provides a spatial decision-support tool for prioritizing vegetation management, hazard mitigation, and infrastructure maintenance. The approach contributes to sustainability by supporting more targeted use of management resources, reducing potential disruption to critical infrastructure and essential access, and strengthening long-term community and infrastructure resilience.
1. Introduction
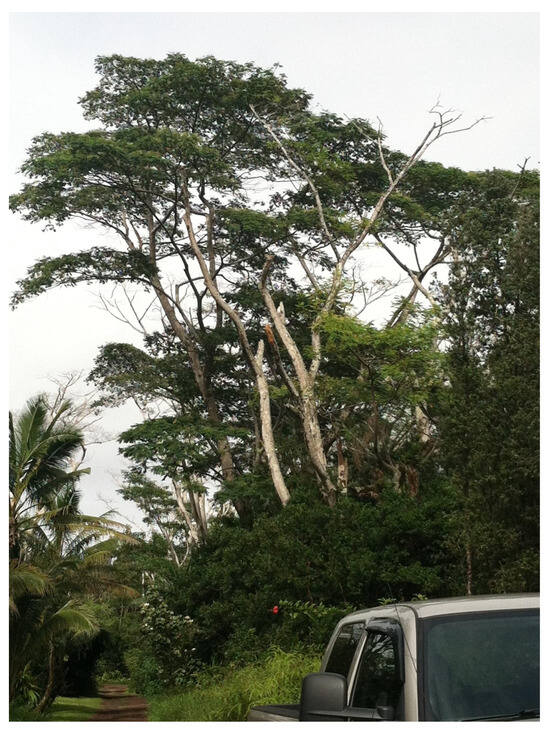
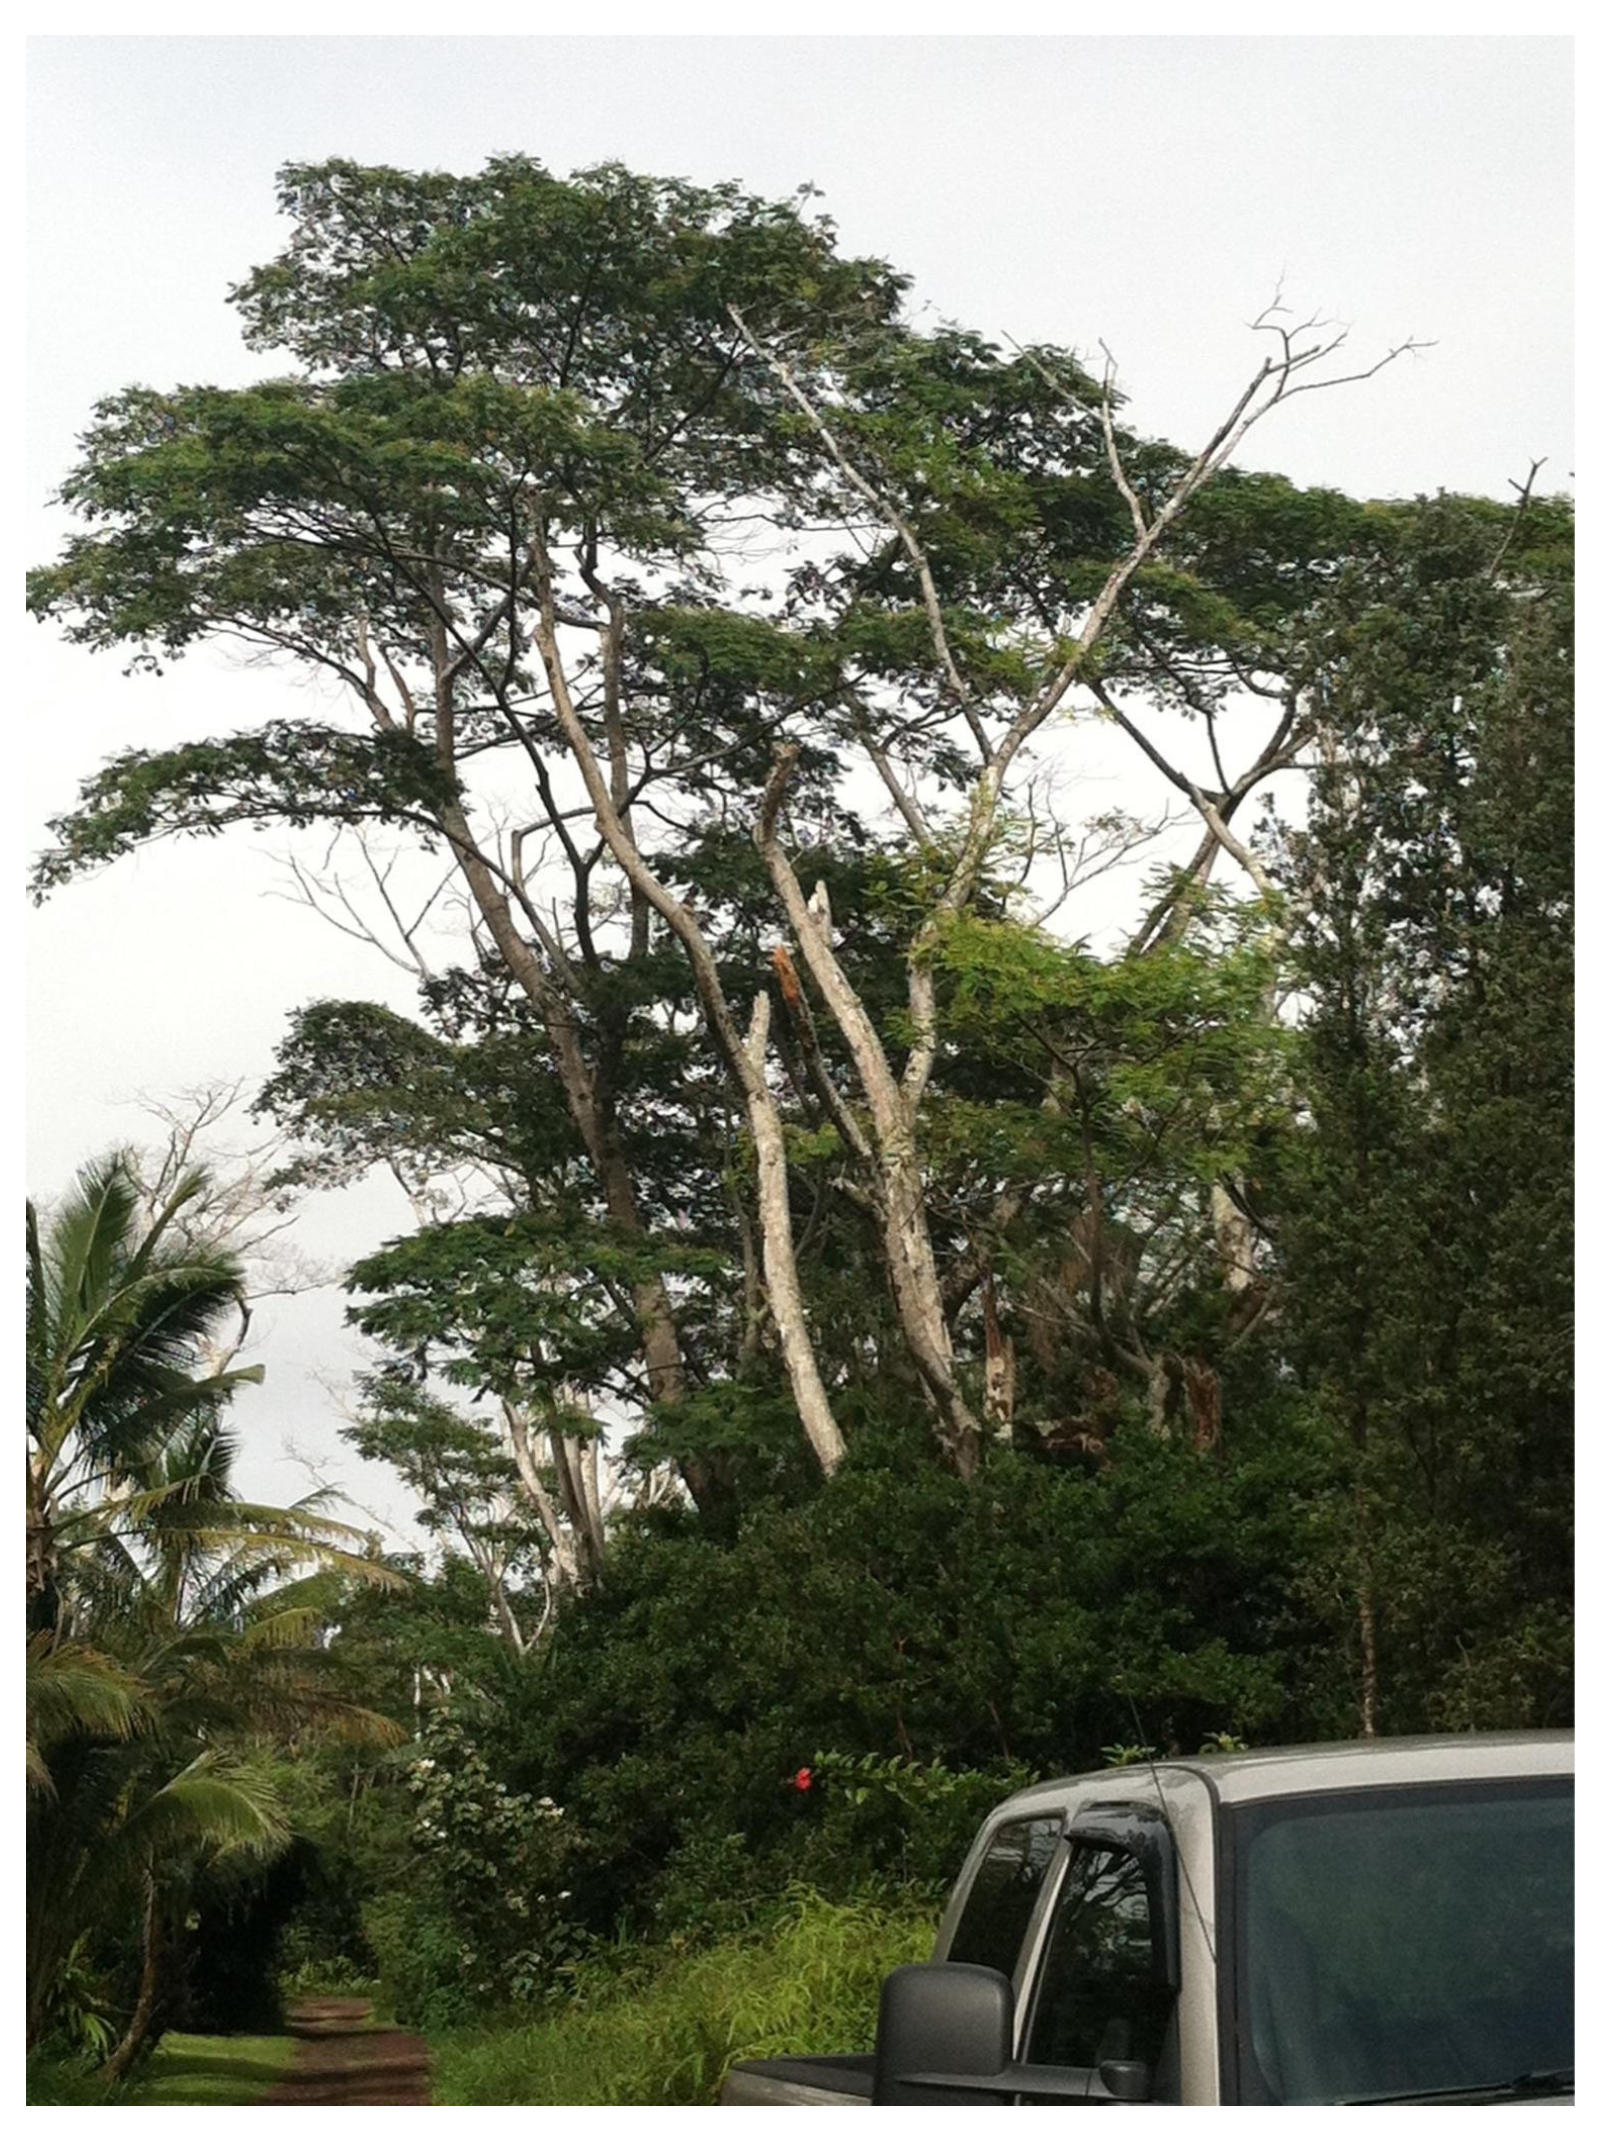
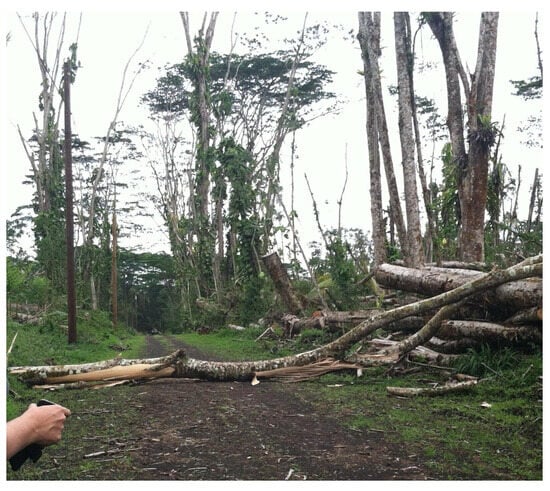
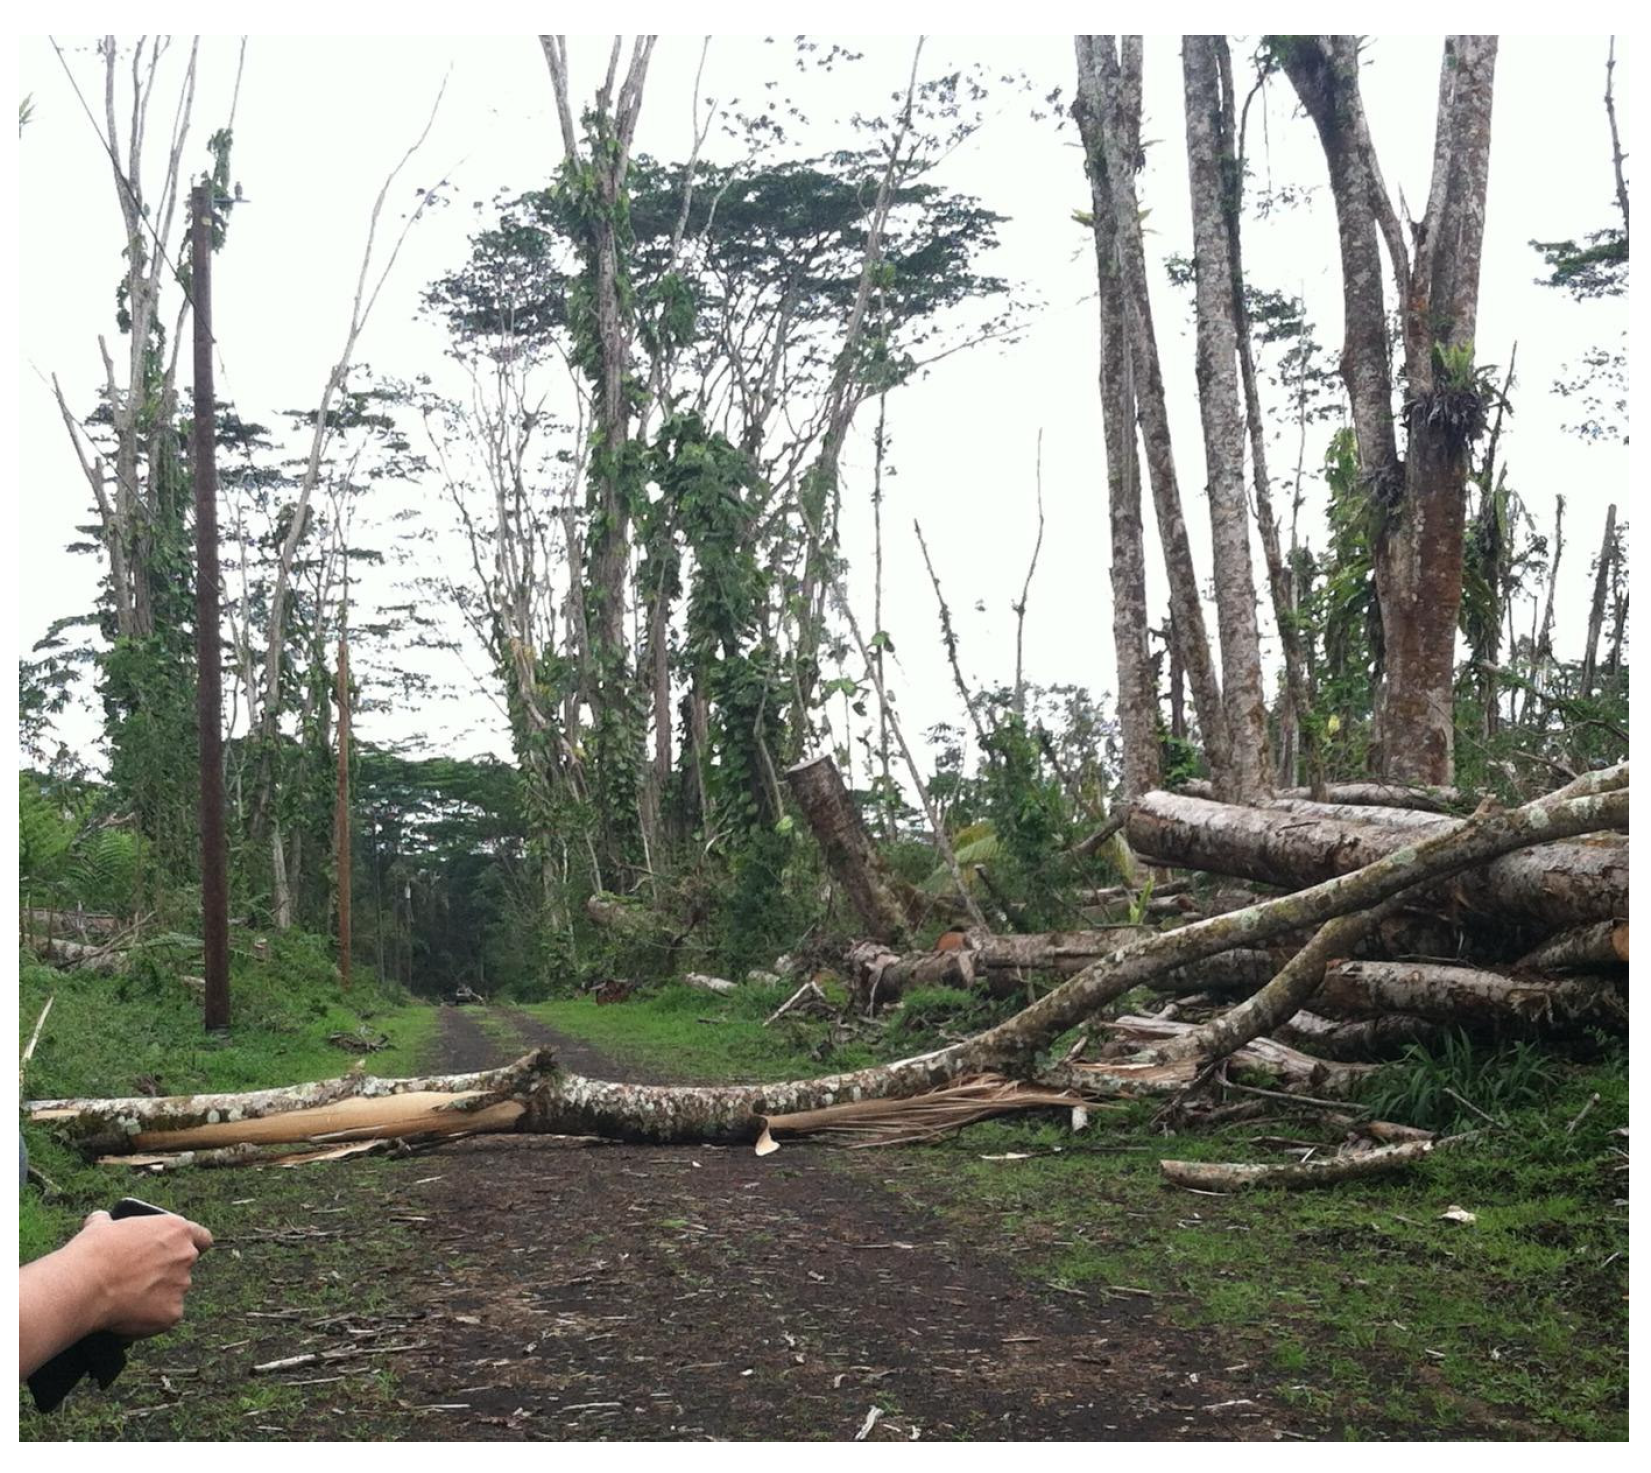
Invasive plant species pose increasing ecological, economic, and infrastructure management challenges in tropical and subtropical regions worldwide. Their impacts are expected to intensify as climate change increases the frequency and severity of extreme weather events, creating growing demands for effective monitoring, hazard assessment, and resilience planning. In Hawai’i, the invasive albizia (F. falcata) tree has become a particularly significant public safety concern because its rapid growth, large canopy, and shallow root system make it highly susceptible to windthrow during severe storms. Albizia trees can grow up to 4.5 m (15 ft) per year and reach heights of approximately 45 m (150 ft), increasing the likelihood of widespread infrastructure damage when trees fail during high-wind events [1]. During Hurricane Iselle in 2014, hundreds of albizia trees fell across the Puna District of Hawai’i Island, blocking roads, damaging buildings, and disrupting electrical service (Figure 1 and Figure 2) [2]. The event highlighted the importance of understanding the spatial distribution of hazardous trees to support emergency response, infrastructure management, and long-term disaster preparedness.
Figure 1.
Albizia trees in Puna, Hawai’i near the roadway. (Image source: Jolie Wanger).
Figure 2.
Downed albizia trees in Puna, Hawai’i following Hurricane Iselle. (Image source: Jolie Wanger).
Effective mitigation requires accurate information on where hazardous trees occur and which infrastructure assets they threaten. However, comprehensive field inventories are labor-intensive and impractical over large geographic areas, while previous mapping efforts in Hawai’i have generally been localized, employed diverse methodologies, or lacked the spatial detail needed for infrastructure planning applications [3,4]. Although the 2017 Albizia Management Strategic Plan for Hawai’i included a generalized distribution map for O’ahu, the mapping methodology was not documented and the resulting products were insufficient for planning-scale hazard assessment [5]. These limitations illustrate the need for scalable, repeatable approaches capable of producing high-resolution invasive species maps suitable for infrastructure risk assessment.
Recent advances in GeoAI—the integration of geospatial analysis and artificial intelligence—provide new opportunities for large-area environmental monitoring and planning [6]. GeoAI has experienced rapid adoption across geographic disciplines [7], and planning scholars have increasingly recognized its potential to transform spatial analysis, decision support, and planning education [8]. Within emergency management, GIS and GeoAI have become important decision-support tools for hazard assessment, response coordination, and post-disaster recovery, although their operational implementation remains uneven [9]. As hurricanes, flooding, wildfires, and other climate-related hazards become more frequent and severe, particularly in island environments such as Hawai’i, integrating GeoAI into disaster mitigation and preparedness frameworks has become increasingly important [10].
Remote sensing provides a foundation for regional-scale forest monitoring because it enables spatially continuous observation across extensive and often inaccessible landscapes [11]. Multispectral imagery supplies spectral and textural information useful for differentiating vegetation types and tree species [12]. Airborne imaging spectroscopy has demonstrated excellent capability for species discrimination [13], but high acquisition costs and limited spatial coverage constrain its operational application across large regions [14]. High-resolution unmanned aerial vehicle (UAV) imagery provides exceptional spatial detail but is generally restricted to relatively small study areas [15]. In contrast, publicly available imagery programs, including the National Agriculture Imagery Program (NAIP), Sentinel, and WorldView, offer broad geographic coverage and increasingly high spatial resolution suitable for planning-scale analyses [11,14,16]. Studies integrating high-resolution imagery with airborne LiDAR have further demonstrated strong potential for individual tree detection and forest mapping [17]. Because NAIP imagery is freely available across the United States at sub-meter resolution, it provides an attractive foundation for developing cost-effective and transferable GeoAI workflows for large-area vegetation mapping.
Deep learning has substantially advanced remote sensing analysis by enabling automatic extraction of complex spatial features from imagery [18]. Convolutional neural networks (CNNs) have demonstrated strong performance for tree crown recognition, land cover classification, and tree species identification because they effectively learn hierarchical spectral and textural patterns [19,20]. Object detection approaches, including R-CNN and YOLO architectures, are widely applied to individual tree detection and segmentation [21,22,23], while object-based image analysis may be particularly suitable where tree crowns are spatially distinct, such as urban and peri-urban environments [17]. Pixel-based semantic segmentation methods have likewise shown strong performance for species-level mapping, including invasive vegetation detection using UAV imagery [24]. Among these methods, U-Net has emerged as ONE of the most widely adopted architectures for semantic segmentation in remote sensing because of its ability to accurately delineate vegetation at the pixel level [20]. Despite these advances, model generalization remains a significant challenge, as models developed in one geographic setting often experience reduced performance when transferred to new landscapes or imagery conditions [20,24].
Within Hawai’i, previous efforts to map albizia have been limited in geographic extent and have employed a variety of remote sensing approaches. A study in the South Hilo District applied object-based classification to QuickBird satellite imagery to identify albizia near roads and streams [4]. Another study on Hawai’i Island used guided classification of WorldView-2 imagery to estimate albizia distribution [3]. Although these studies demonstrated the feasibility of remote sensing for invasive species mapping, they were designed for localized applications and did not integrate mapped tree distributions with infrastructure exposure analysis. Likewise, the statewide strategic plan provided only a generalized distribution map without documented methodology or sufficient spatial detail for planning applications [5]. To our knowledge, no previous study has combined deep learning classification of publicly available NAIP imagery with infrastructure proximity analysis to support planning-scale assessment of albizia hazards on O’ahu.
Addressing this gap has direct relevance to sustainability because invasive-tree management involves interconnected environmental, infrastructural, and social challenges. Unmanaged invasive vegetation can alter ecosystem conditions while threatening transportation networks, buildings, emergency access, and the continuity of essential services. At the same time, vegetation-management agencies often operate with limited spatial information and constrained resources. Scalable approaches that identify where invasive vegetation intersects with critical infrastructure can therefore support more targeted interventions, efficient allocation of management resources, and long-term infrastructure and community resilience.
Accordingly, this study develops and evaluates a GeoAI-based spatial decision-support framework for mapping invasive albizia canopy and assessing potential infrastructure exposure. A U-Net semantic segmentation model with a ResNet-34 backbone was trained using 0.6 m National Agriculture Imagery Program (NAIP) aerial imagery and training samples from two geographically distinct areas on O’ahu, i.e., Mānoa and Kahalu’u. The resulting model was subsequently applied across a larger regional study area to map albizia distribution and estimate the potential exposure of roads and buildings through spatial proximity analysis. The broader objective is to demonstrate how publicly available imagery and deep learning can generate planning-relevant information for sustainable infrastructure management, disaster preparedness, and climate-resilient planning.
This study makes three primary contributions. First, it develops a scalable GeoAI workflow for regional mapping of invasive albizia using publicly available high-resolution aerial imagery, demonstrating a practical and transferable approach for large-area invasive species detection. Second, it integrates species distribution mapping with transportation and building infrastructure data to quantify potential tree-fall exposure, illustrating how GeoAI-derived products can directly support planning and hazard assessment. Third, it evaluates model performance across contrasting landscapes and identifies methodological strengths and limitations that inform future applications of deep learning for operational environmental monitoring. Collectively, these contributions demonstrate how GeoAI-based invasive-species mapping can be translated into spatial decision support for sustainability, climate adaptation, and infrastructure and community resilience.
2. Materials and Methods
2.1. Study Area and Data
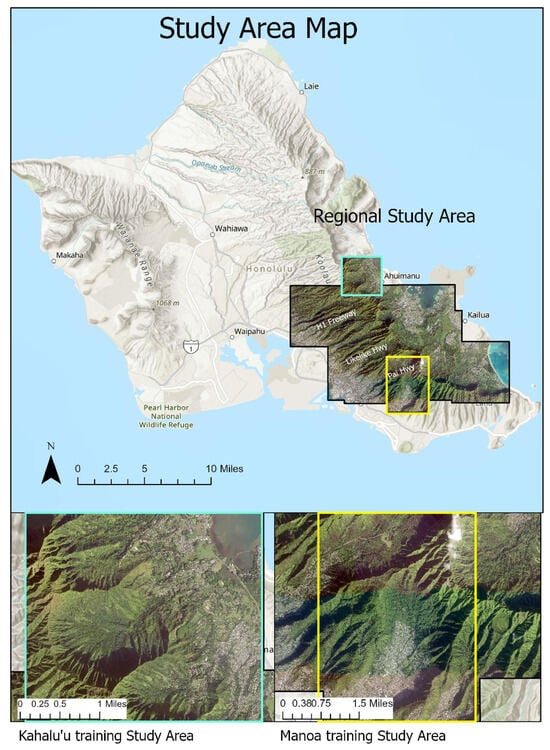
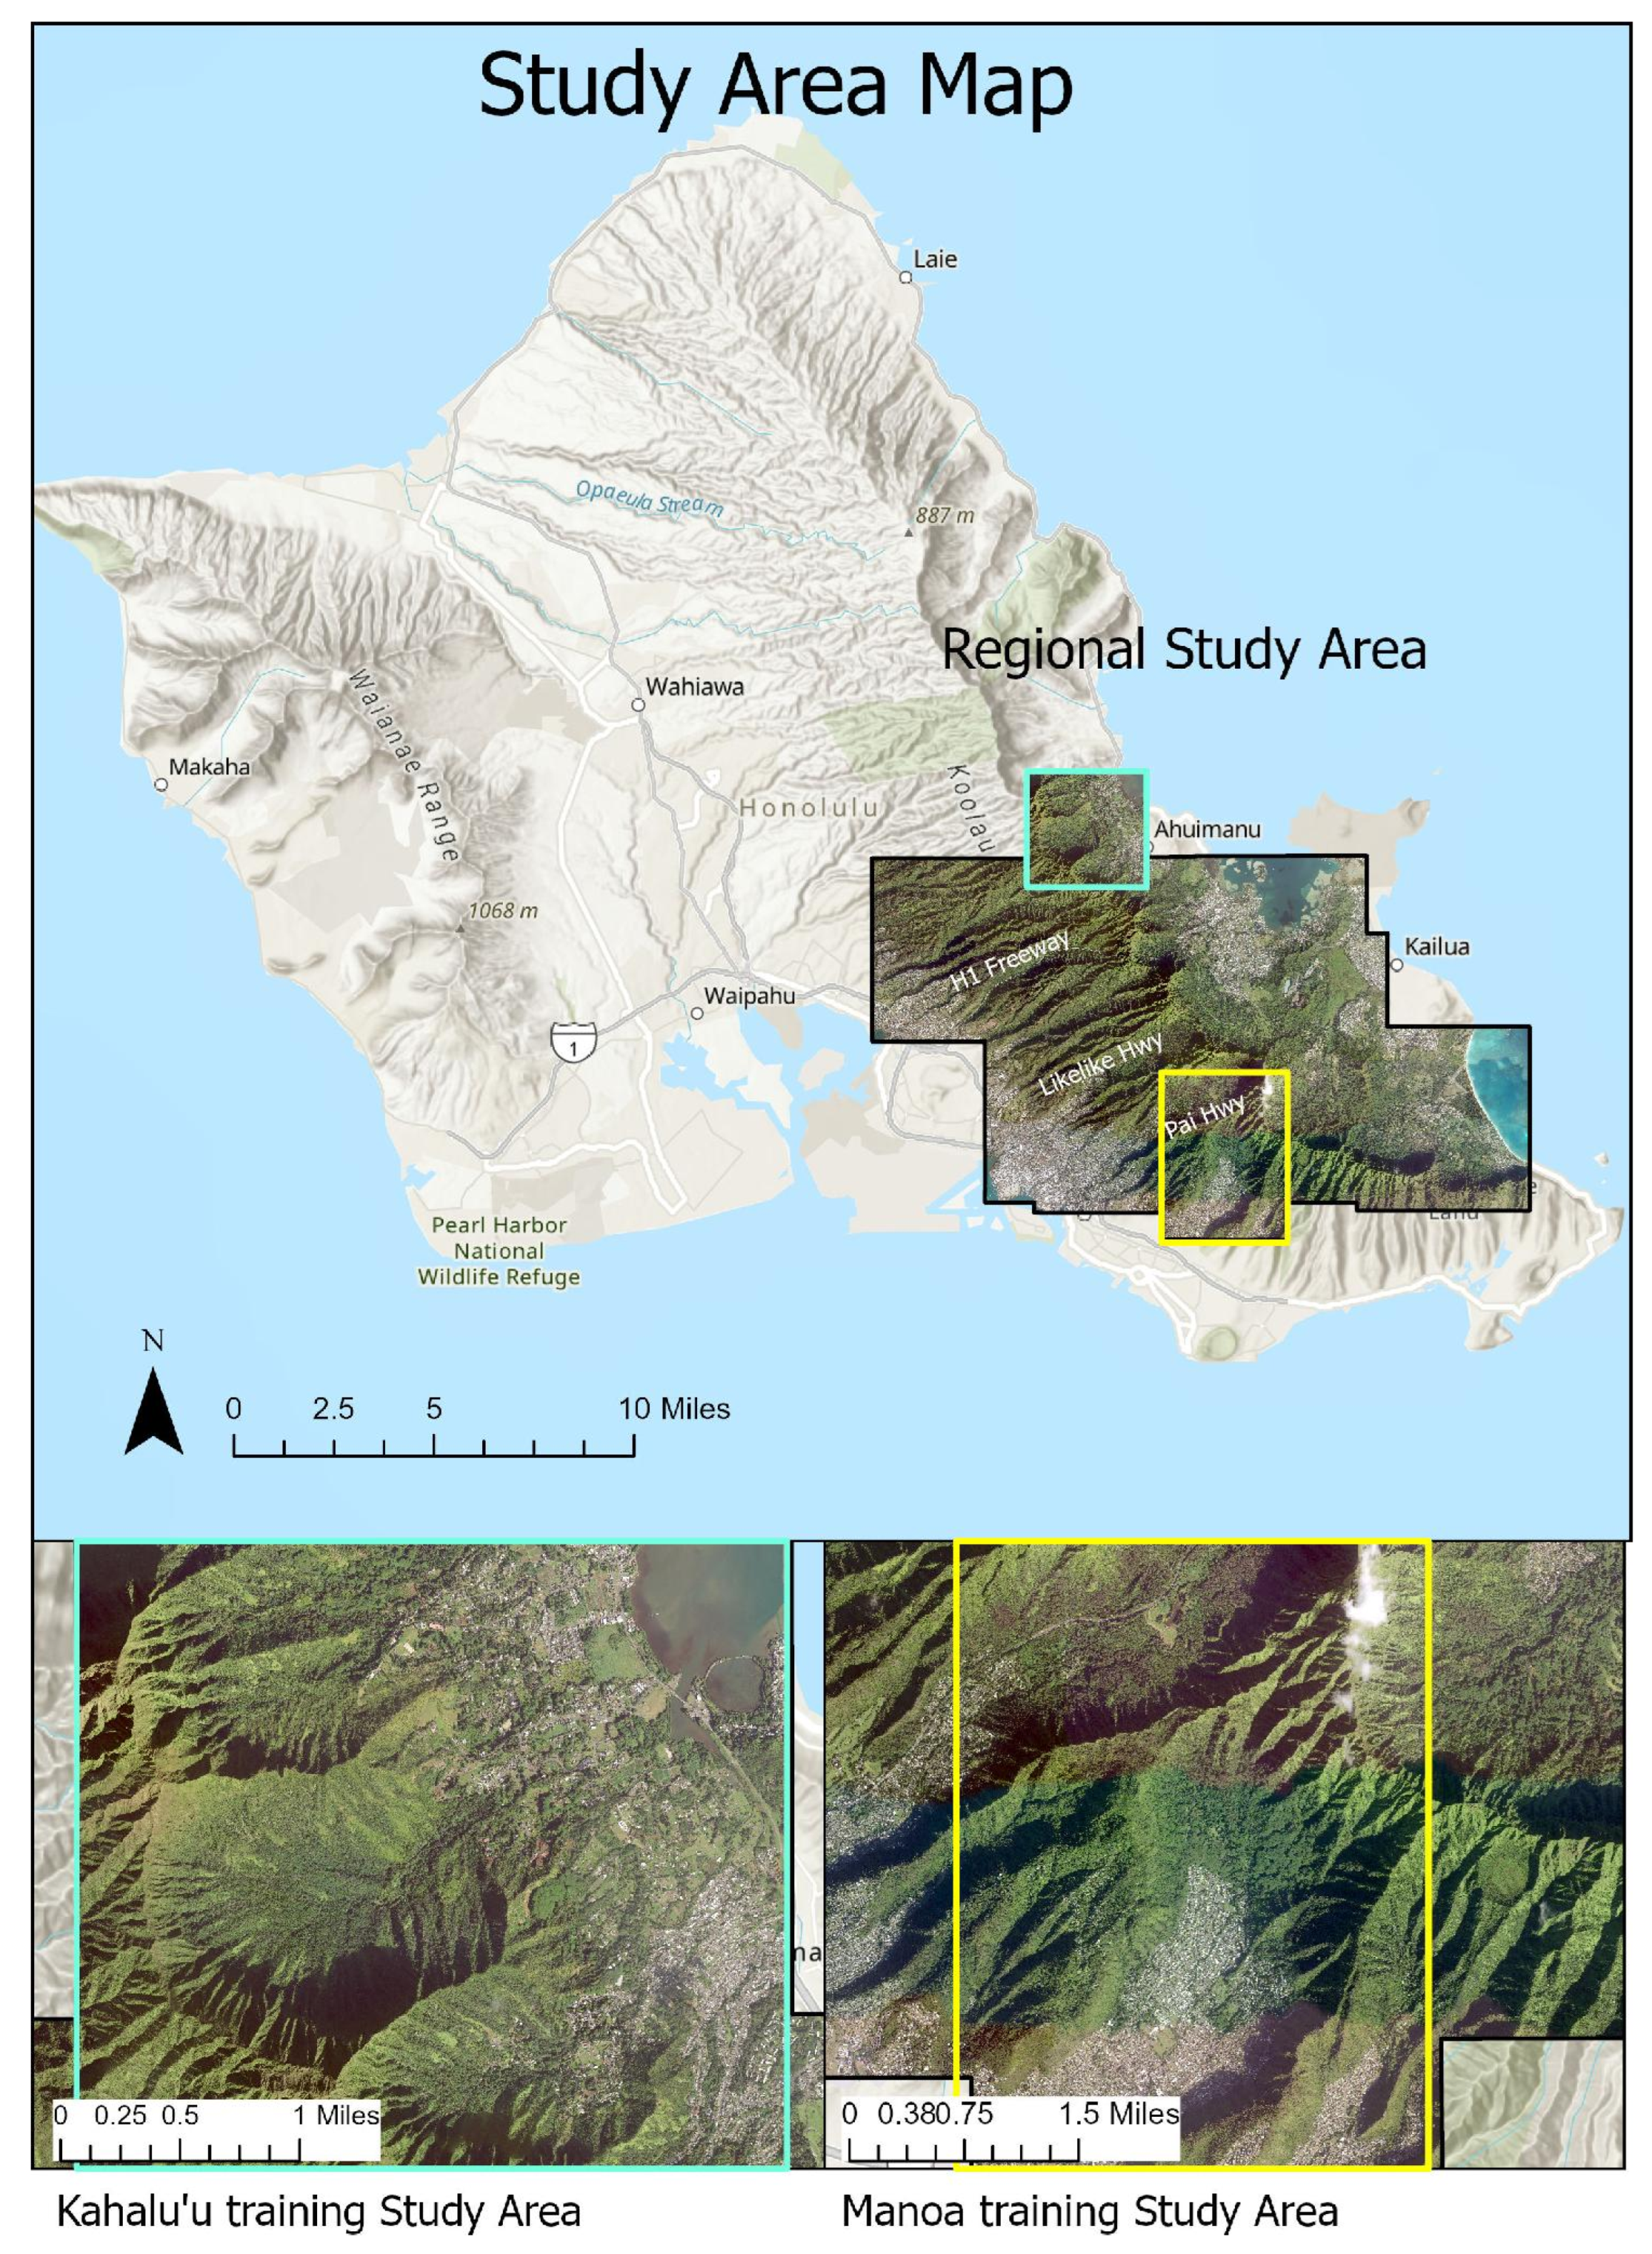
This study focuses on the windward and leeward southern Ko’olau region of O’ahu, Hawai’i (Figure 3), encompassing the communities of Mānoa, Kalihi, Kahalu’u, Kailua, Kāne’ohe, and Waimānalo (approximately 21.3° N, 157.8° W). The study area was selected because it contains documented concentrations of invasive albizia, based on the statewide distribution map presented in the Albizia Management Strategic Plan for Hawai’i [5]. Mānoa Valley is also recognized as the presumed site where albizia was first introduced to O’ahu by the botanist Joseph Rock at Lyon Arboretum in 1917 [25].
Figure 3.
Regional study area and model training areas on O’ahu, Hawai’i. Basemap source: Esri and its data providers; aerial imagery source [26]: USDA Farm Service Agency, National Agriculture Imagery Program (NAIP), 2021 [27].
The study region includes several of O’ahu’s principal transportation corridors, including Pali Highway, Likelike Highway, Interstate H-3, and Kahekili Highway, all of which serve as important commuter and emergency evacuation routes. The windward portion of the study area receives substantially higher rainfall than the leeward side, resulting in wetter soil conditions that, together with albizia’s shallow root systems, increase susceptibility to windthrow during severe weather events. Including both windward and leeward environments also captures a broad range of land cover, canopy conditions, and spectral variability, improving the diversity of training data available for model development.
This study utilized multispectral aerial imagery from the National Agriculture Imagery Program (NAIP), which provides ortho-rectified imagery at a spatial resolution of 0.6 m [27]. The 2021 statewide NAIP imagery for Hawai’i served as the primary input dataset for the GeoAI analysis. At the time of the analysis, the 2021 imagery was the most recent statewide NAIP imagery available for Hawai’i. The imagery includes four spectral bands (red, green, blue, and near-infrared) and was collected during leaf-on conditions, which are advantageous for vegetation classification. NAIP was selected because its sub-meter spatial resolution is well suited for identifying tree canopy patterns while providing complete regional coverage using publicly available imagery [16]. Although satellite platforms such as Sentinel-2 provide more frequent image acquisition, their coarser spatial resolution can limit individual-tree and species-level discrimination, particularly in heterogeneous landscapes where individual pixels may contain mixed canopy and background signals [28,29]. Because albizia trees typically persist for multiple years and the objective of this study was spatial mapping rather than temporal change detection, the 2021 NAIP imagery provided an appropriate balance between spatial detail and regional coverage. However, the use of imagery from a single acquisition year limits the assessment of temporal variability and represents a limitation of the study.
In addition to NAIP imagery, three publicly available infrastructure datasets were obtained from the Honolulu Open Geospatial Data Portal [30] for infrastructure exposure analysis: (1) O’ahu Road Centerlines, (2) Major Roads, and (3) Building Footprints, all maintained by the City and County of Honolulu.
2.2. GeoAI-Based Analytical Framework
This study developed a GeoAI-based analytical framework that integrates deep learning-based image classification with GIS-based infrastructure exposure analysis to identify areas where invasive albizia may pose potential risks to transportation and built infrastructure. Rather than focusing solely on tree species classification, the framework links GeoAI-derived land cover information with spatial analysis to generate planning-relevant decision-support information for disaster preparedness and resilience planning.
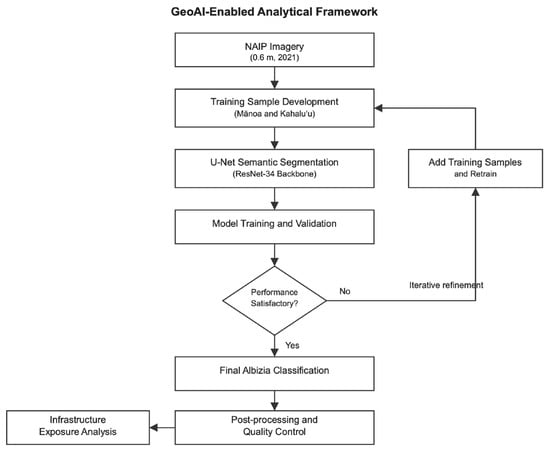
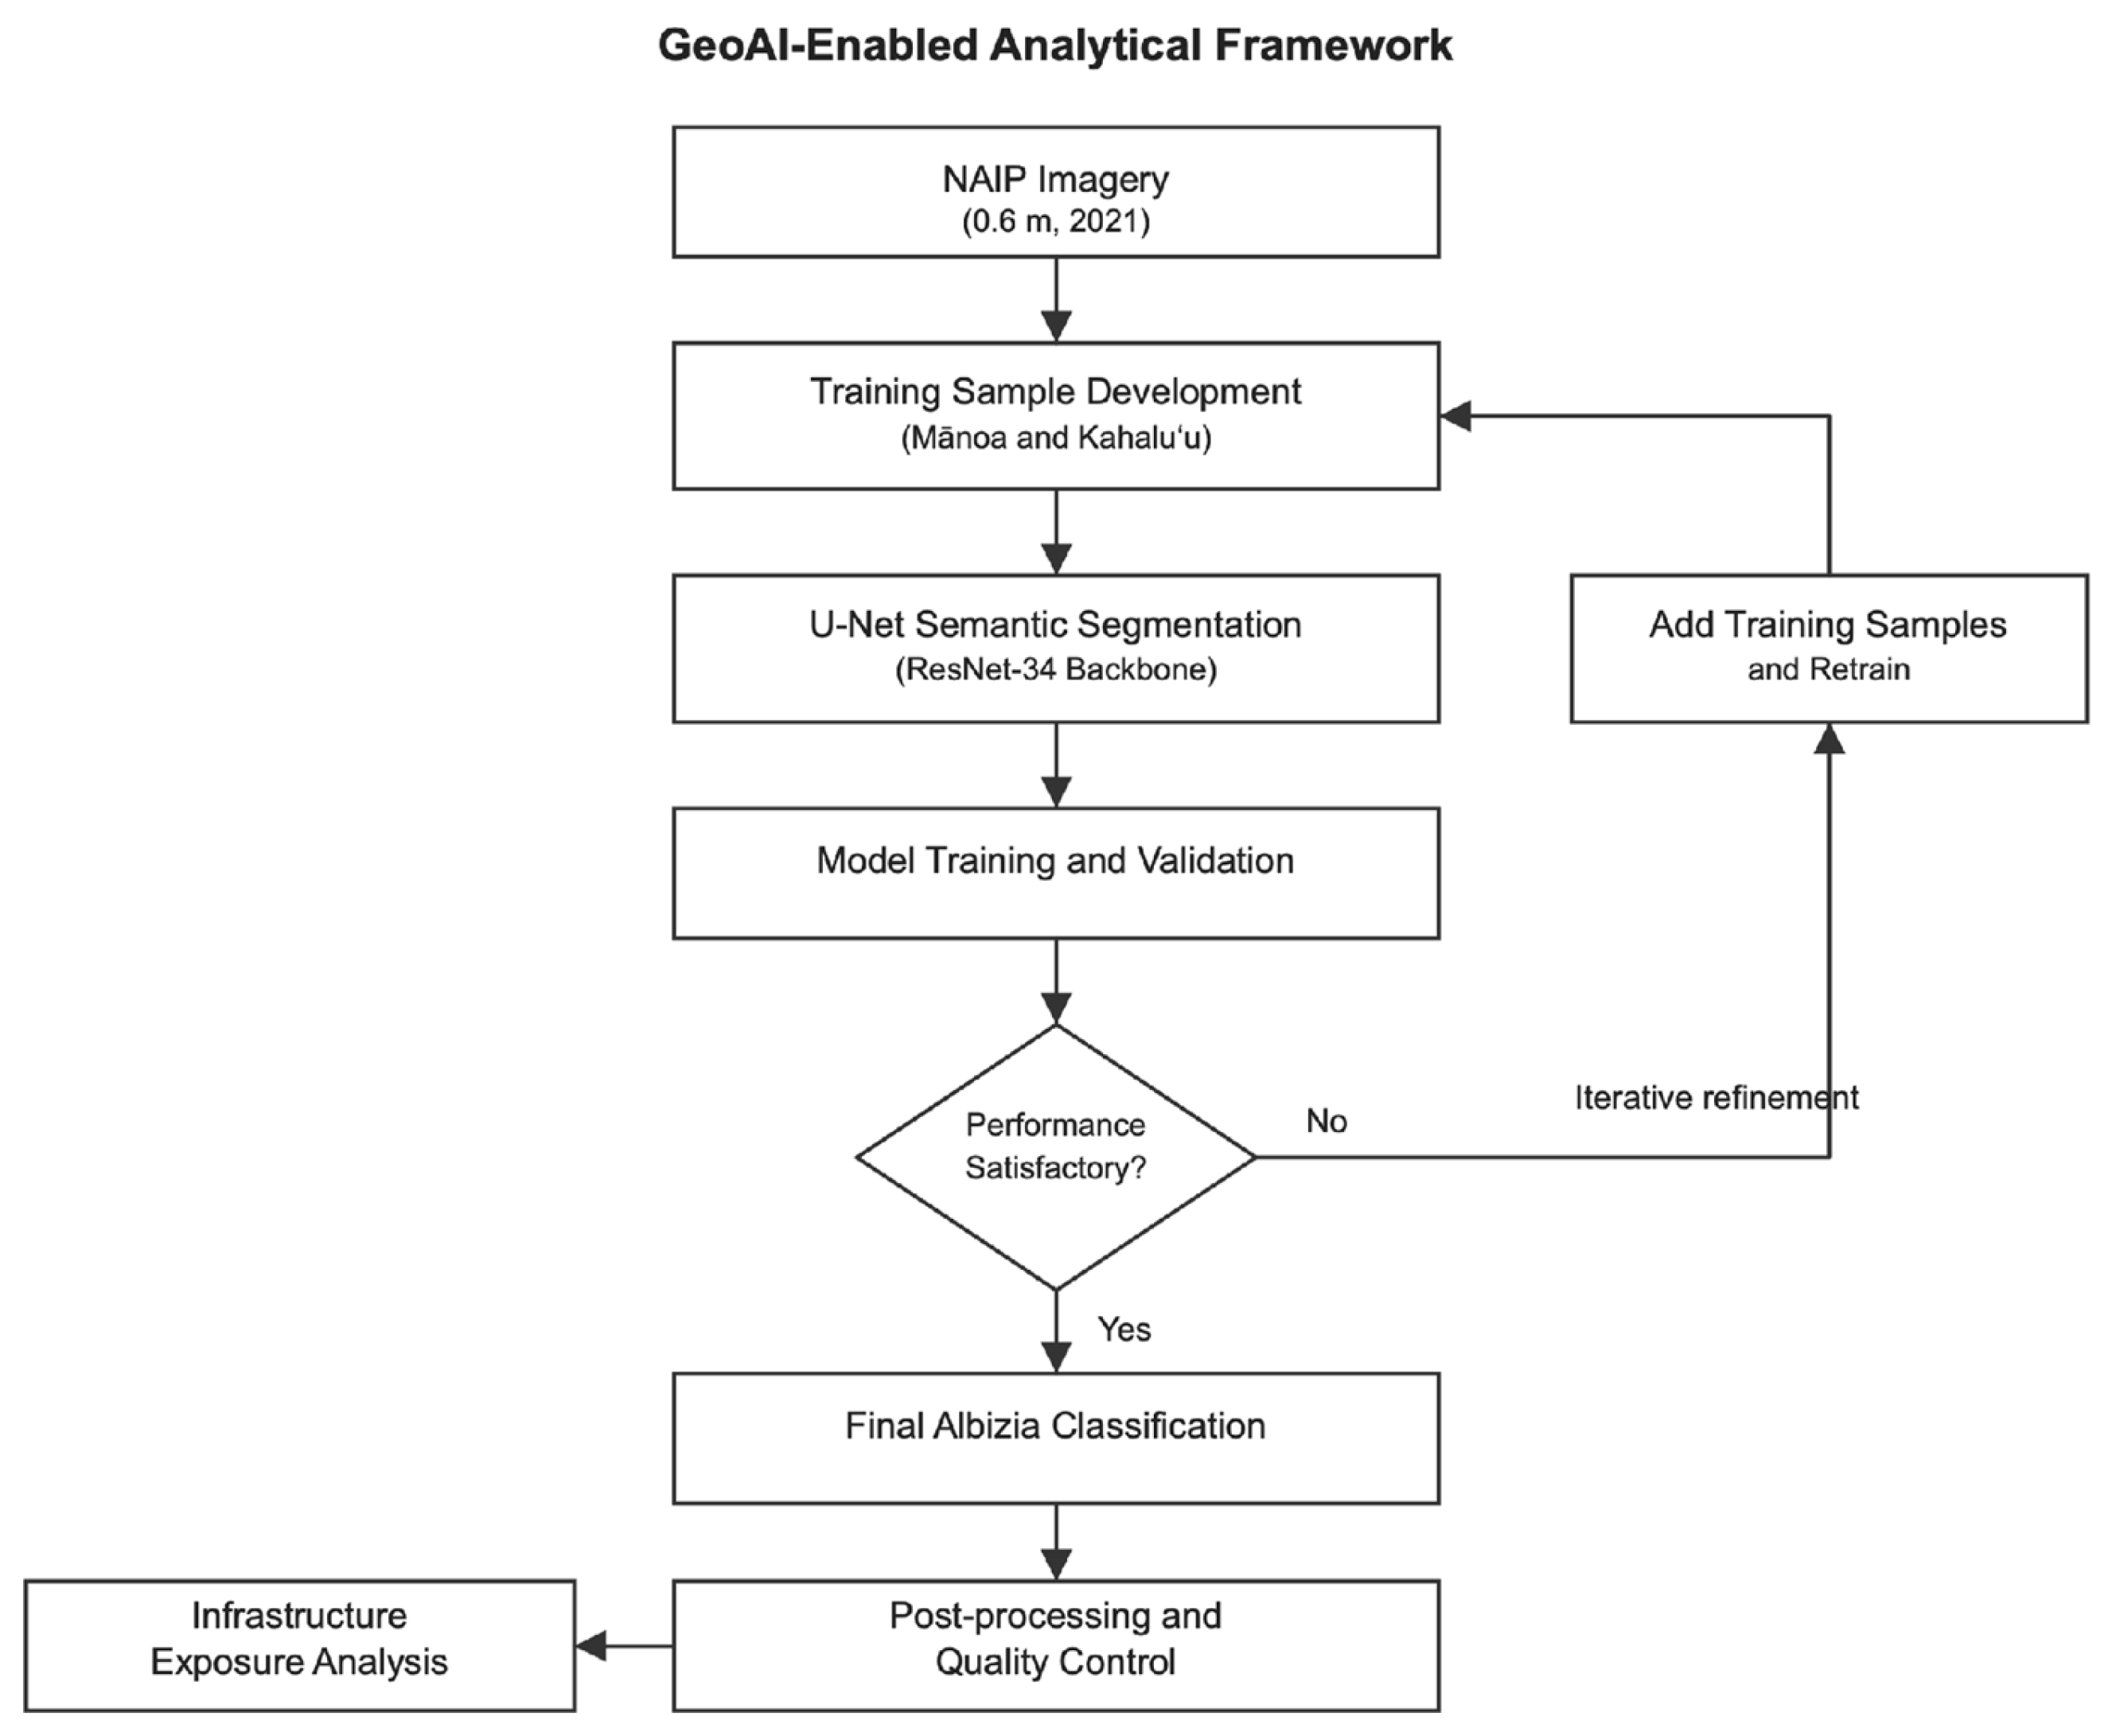
The analytical workflow consisted of five major steps: (1) selection and preparation of the 2021 statewide NAIP aerial imagery for Hawai’i; (2) development of manually labeled training samples; (3) iterative training and validation of a U-Net semantic segmentation model; (4) post-processing and quality control; and (5) spatial analysis of potential infrastructure exposure through proximity analysis (Figure 4).
Figure 4.
Overview of the GeoAI-enabled analytical framework for invasive albizia mapping and infrastructure exposure assessment.
Albizia canopy was mapped using a U-Net semantic segmentation model with a ResNet-34 encoder backbone implemented within the ArcGIS Pro (v3.6) deep learning framework. U-Net employs an encoder–decoder architecture with skip connections that combine contextual information with fine spatial information, enabling precise pixel-level localization [31]. The ResNet-34 backbone enhances feature extraction through residual learning, which facilitates the training of deeper networks [32]. This architecture was selected because it supports pixel-level classification, allowing the model to delineate irregular canopy shapes and capture fine-scale spatial patterns without requiring individual tree crowns to be predefined as discrete objects.
A pixel-based semantic segmentation approach was selected to evaluate its ability to distinguish albizia canopy texture, color, and spatial patterns within heterogeneous forest environments, following the invasive species mapping approach demonstrated by da Silva et al. [24]. Compared with object-based methods, pixel-based classification avoids dependence on individual crown delineation and enables continuous classification across heterogeneous vegetation communities.
The model was developed using training samples exported as 256 × 256-pixel image tiles with a stride of 128 pixels in both the x- and y-directions. Across the training dataset, Albizia represented approximately 10.0% of labeled pixels and background/non-Albizia approximately 90.0%, corresponding to an Albizia-to-background ratio of approximately 1:9. During model training, the exported image tiles were cropped to the 224 × 224-pixel chip size specified in the ArcGIS Pro training configuration. The model was trained with a batch size of 16 and a maximum of 20 epochs. The training samples were internally partitioned into 90% training and 10% validation data. The learning rate was automatically selected by ArcGIS Pro, with the training log reporting a range of approximately 1.32 × 10⁻⁵ to 1.32 × 10⁻⁴. Validation loss was monitored throughout training to assess model convergence. Class balancing, mixup, and focal loss were not applied. Data augmentation used the default ArcGIS Pro 3.6 transformations, including cropping, dihedral affine transformations, brightness and contrast adjustments, and zoom. GPU acceleration was used during training.
2.3. Model Development and Validation
Training data were developed through an iterative workflow using two geographically distinct study areas. Mānoa served as the primary training site because of its historical association with albizia introduction and extensive canopy presence. Kahalu’u, located approximately 15 km north of Mānoa on O’ahu’s windward coast, was incorporated to increase geographic diversity within the training dataset and improve model generalization across varying environmental conditions.
Training labels were created by manually delineating albizia canopy polygons from NAIP imagery using the ArcGIS Pro Training Samples Manager. Only canopy areas that could be confidently identified through visual interpretation were included to maximize label quality and minimize uncertainty within the training dataset.
Model development consisted of three iterative training rounds. Following each iteration, additional training samples were incorporated to improve model performance based on visual inspection of classification outputs. Training image chips were regenerated before each iteration using ArcGIS Pro. Table 1 summarizes the progression of training sample development and associated precision metrics. Because only a single year of NAIP imagery was available for Hawai’i, the training dataset incorporated geographic variability but not temporal variability. Consequently, model transferability across different image acquisition dates remains an important consideration for future research.
Table 1.
Summary of iterative model training and precision metrics 1.
Model performance was evaluated using both training diagnostics and post-classification accuracy assessment. During model development, ArcGIS Pro generated training performance metrics, including precision and validation loss, which were used to monitor model improvement across successive training iterations (Table 1).
Following model development, classification accuracy was assessed in the Mānoa and Kahalu’u model-development areas using 200 visually interpreted reference points in each area. Reference points were selected using an equalized stratified random sampling design to ensure balanced representation of albizia and non-albizia classes, consistent with established principles for remote-sensing classification accuracy assessment [33]. The reference points were derived from the same NAIP imagery used to develop the training labels. Although field verification was not conducted, the reference points were interpreted by an analyst with specialized knowledge of Hawai’i’s forests, familiarity with the study areas, and an understanding of characteristic tree morphology. Local and ecological knowledge therefore informed the visual identification of albizia in the reference data. Because the assessment was conducted within the model-development areas using the same source imagery, it evaluates classification agreement within these landscapes rather than performance in a geographically independent test area.
2.4. Infrastructure Exposure Analysis
Following classification, an analyst conducted a visual review to identify and remove obvious false positives that could not reasonably represent tree canopy. These included classifications associated with large grassy areas, golf courses, marshlands, and coastal water surfaces. The same analyst who developed the training samples conducted the visual review, drawing on familiarity with the study areas and characteristic albizia morphology. The classified raster was then converted to polygons, and the post-processed albizia polygons were dissolved prior to the infrastructure exposure analysis. This human-in-the-loop quality control step improved the reliability of subsequent exposure estimates by reducing readily identifiable classification errors while preserving the original model outputs for performance evaluation.
Following quality control, the classified albizia polygons were dissolved, and a 45.7 m (150 ft) buffer was generated to represent the documented maximum height of mature albizia trees [5] and the corresponding potential tree-fall exposure zone. Consequently, subsequent buffer distances were measured from the edges of the resulting mapped canopy patches rather than from individual tree stems or crowns. As an additional sensitivity analysis, proximity-based risk zones were defined using documented albizia tree heights and hazard-tree distance assumptions (Table 2). The higher-risk zone (≤30 m) represents infrastructure located within the lower range of mature albizia tree height; the moderate-risk zone (>30 to ≤45.7 m) extends to the documented maximum tree height; and the lower-risk zone (>45.7 to ≤68.58 m) extends to 1.5 times the documented maximum tree height as a conservative hazard-tree distance.
Table 2.
Sensitivity analysis of infrastructure exposure across proximity-based risk zones.
The resulting buffer polygons were intersected with three publicly available infrastructure datasets obtained from the City and County of Honolulu, including O’ahu Road Centerlines, Major Roads, and Building Footprints. Summary statistics were then calculated to quantify the extent of roads and buildings located within the potential tree-fall exposure zone.
3. Results
3.1. Classification Performance
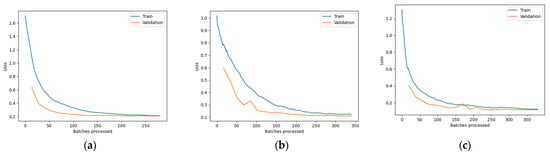
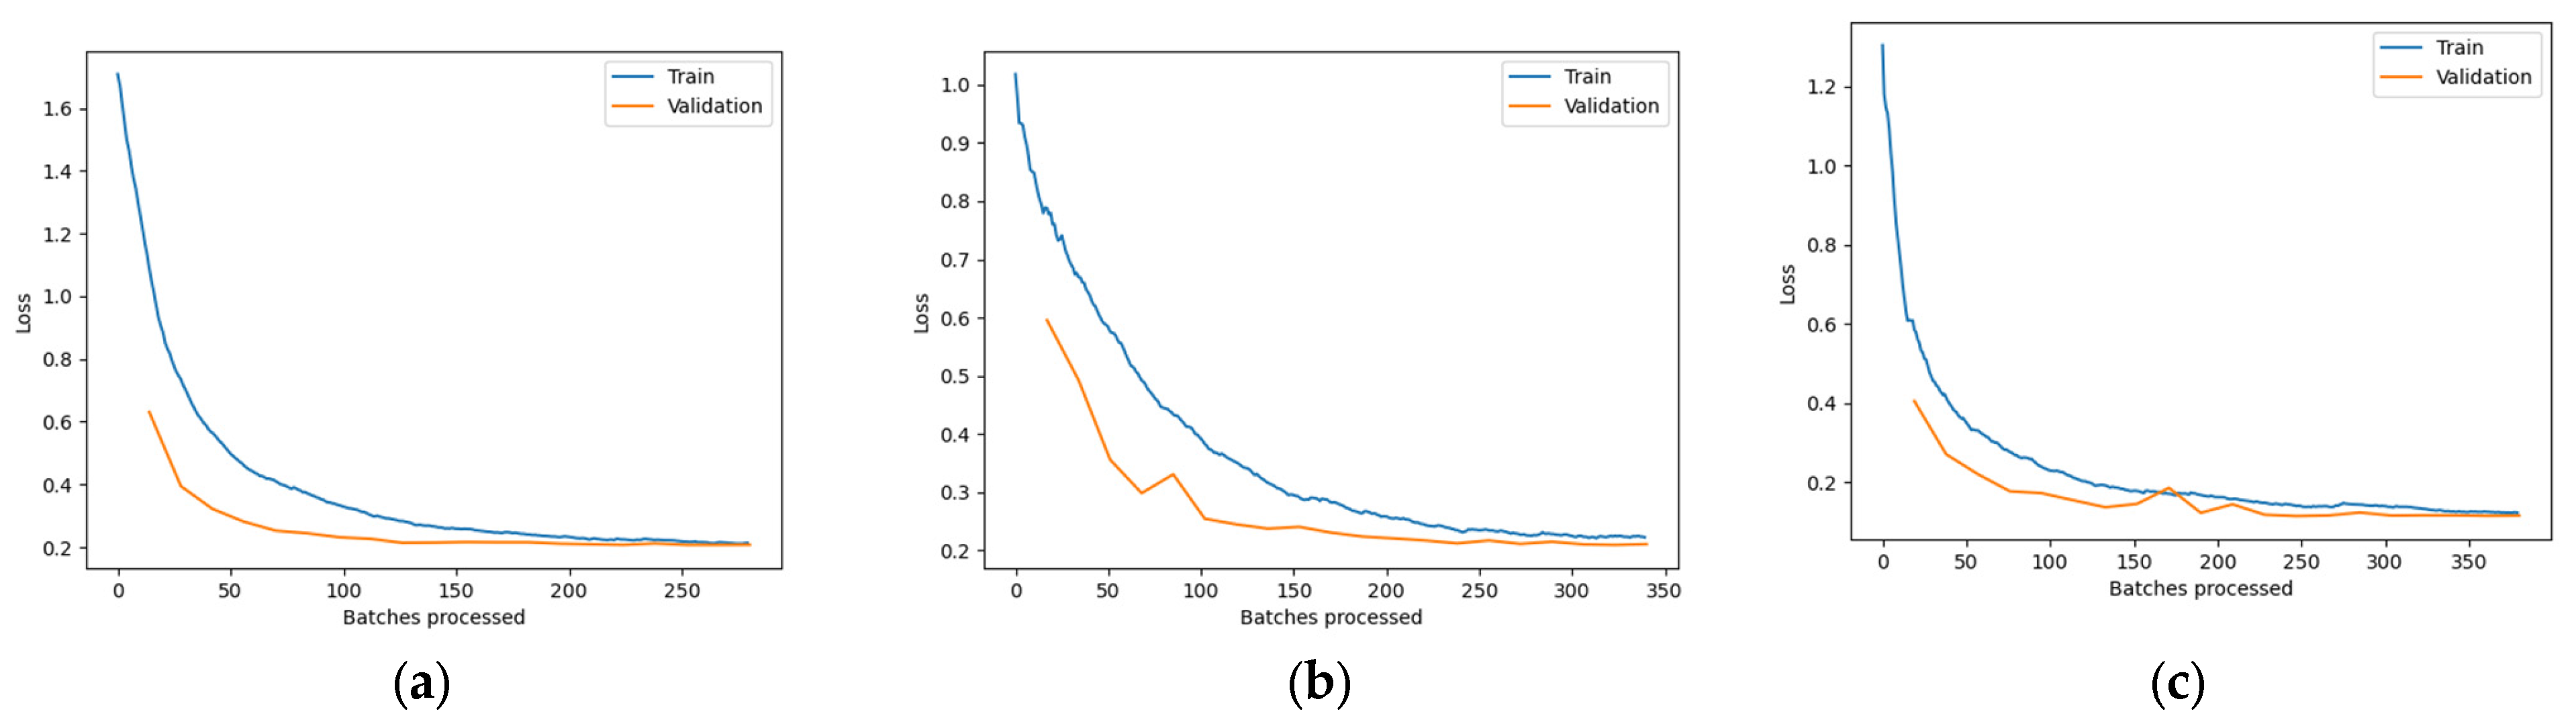
The deep learning model demonstrated generally effective albizia detection, although classification performance varied between the two model-development areas. Classification performance improved through iterative refinement of the training dataset. Training and validation loss decreased rapidly during the early stages of each training iteration before gradually converging, indicating stable model optimization without evidence of substantial overfitting (Figure 5). Training precision improved from 0.64 in Iteration 1 to 0.76 in Iteration 3 with a dip to 0.60 following the incorporation of additional training samples from both Mānoa and Kahalu’u (Table 1).
Figure 5.
Training and validation loss curves across three iterations of model development. (a) Iteration 1; (b) Iteration 2; (c) Iteration 3.
The accuracy assessment based on 200 visually interpreted reference points per study area using equalized stratified random sampling demonstrated stronger classification performance in Mānoa than in Kahalu’u (Table 3). The Mānoa model achieved an overall accuracy of 92.5% with a Kappa coefficient of 0.85, indicating strong agreement between classified and reference data. In comparison, the Kahalu’u model achieved an overall accuracy of 83.0% with a Kappa coefficient of 0.66, indicating moderate to substantial agreement.
Table 3.
Summary of model validation metrics.
Given the equalized stratified sampling design and the strong class imbalance in the mapped landscape, class-specific metrics provide a more informative basis for interpreting albizia classification performance than overall accuracy and Kappa alone. For the albizia class, recall (equivalent to producer’s accuracy) was high in both Mānoa (0.989) and Kahalu’u (0.985), indicating very few omission errors. In contrast, precision (equivalent to user’s accuracy) declined from 0.860 in Mānoa to 0.670 in Kahalu’u, reflecting substantially greater commission error in the more heterogeneous Kahalu’u landscape. Correspondingly, F1 decreased from 0.920 to 0.798, while IoU decreased from 0.851 to 0.663. These results indicate that the model was highly sensitive to albizia presence but tended to overpredict albizia, particularly in heterogeneous landscapes.
Visual inspection indicated that albizia canopy texture and crown structure were generally distinctive enough to support effective pixel-based classification. The primary classification errors occurred where large grassy surfaces, particularly golf courses, parks, and marshes, were misclassified as albizia because of spectral and textural similarities in the NAIP imagery. An additional error observed during earlier training iterations, in which nearshore ocean areas were incorrectly classified as albizia, was eliminated in the final model. Collectively, these results indicate high sensitivity to potential albizia canopy but also substantial commission error in heterogeneous landscapes.
3.2. Regional Infrastructure Exposure Assessment
Following model training and accuracy assessment, the final classification model was applied to the regional study area encompassing portions of Kahalu’u, Kailua, Kāne’ohe, Waimānalo, Mānoa, and adjacent leeward Ko’olau communities. Following vector conversion and post-processing, the initial model output contained approximately 3.82 km2 of area classified as albizia. Visual inspection indicated that many false positives occurred in large grassy areas, golf courses, marshlands, and coastal water surfaces. Subsequent visual quality control removed approximately 1.85 k2 of obvious false-positive areas, leaving approximately 1.97 m2 of classified albizia canopy for the infrastructure exposure analysis.
A 45.7 m (150 ft) buffer was generated around classified albizia polygons based on the documented maximum height of mature albizia trees [5], representing a potential tree-fall exposure zone. The same buffering and spatial-intersection procedures were applied to both the raw and quality-controlled model outputs. Before manual quality control, 96 km of roads, including 27 km of major roads, and 4632 buildings were located within the potential exposure zone. After false-positive classifications were removed, these estimates decreased to 53 km of roads, including 18 km of major roads, and 2309 buildings. These changes represent reductions of approximately 45% in exposed road length, 33% in exposed major-road length, and 50% in exposed building count, demonstrating that false-positive classifications in the raw model output could substantially overestimate potential infrastructure exposure. Table 4 summarizes these results.
Table 4.
Summary of regional infrastructure exposure assessment.
Among the transportation corridors identified as potentially exposed were Pali Highway, Likelike Highway, Interstate H-3, Kahekili Highway, and Kalaniana’ole Highway, all of which serve important commuter, evacuation, and emergency-access functions. The sensitivity analysis further illustrates how estimated infrastructure exposure varies across the three proximity-based risk zones (Table 2). Within the closest proximity zone (≤30 m), 1152 buildings and 28 km of roads were located near the quality-controlled albizia canopy classification.
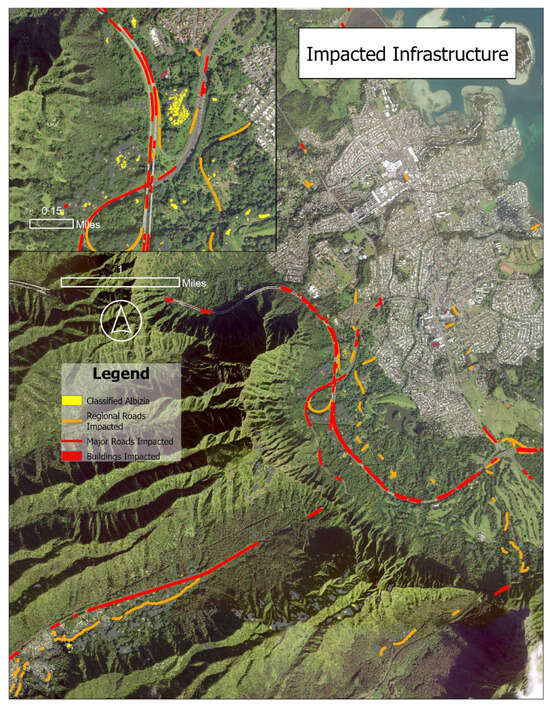
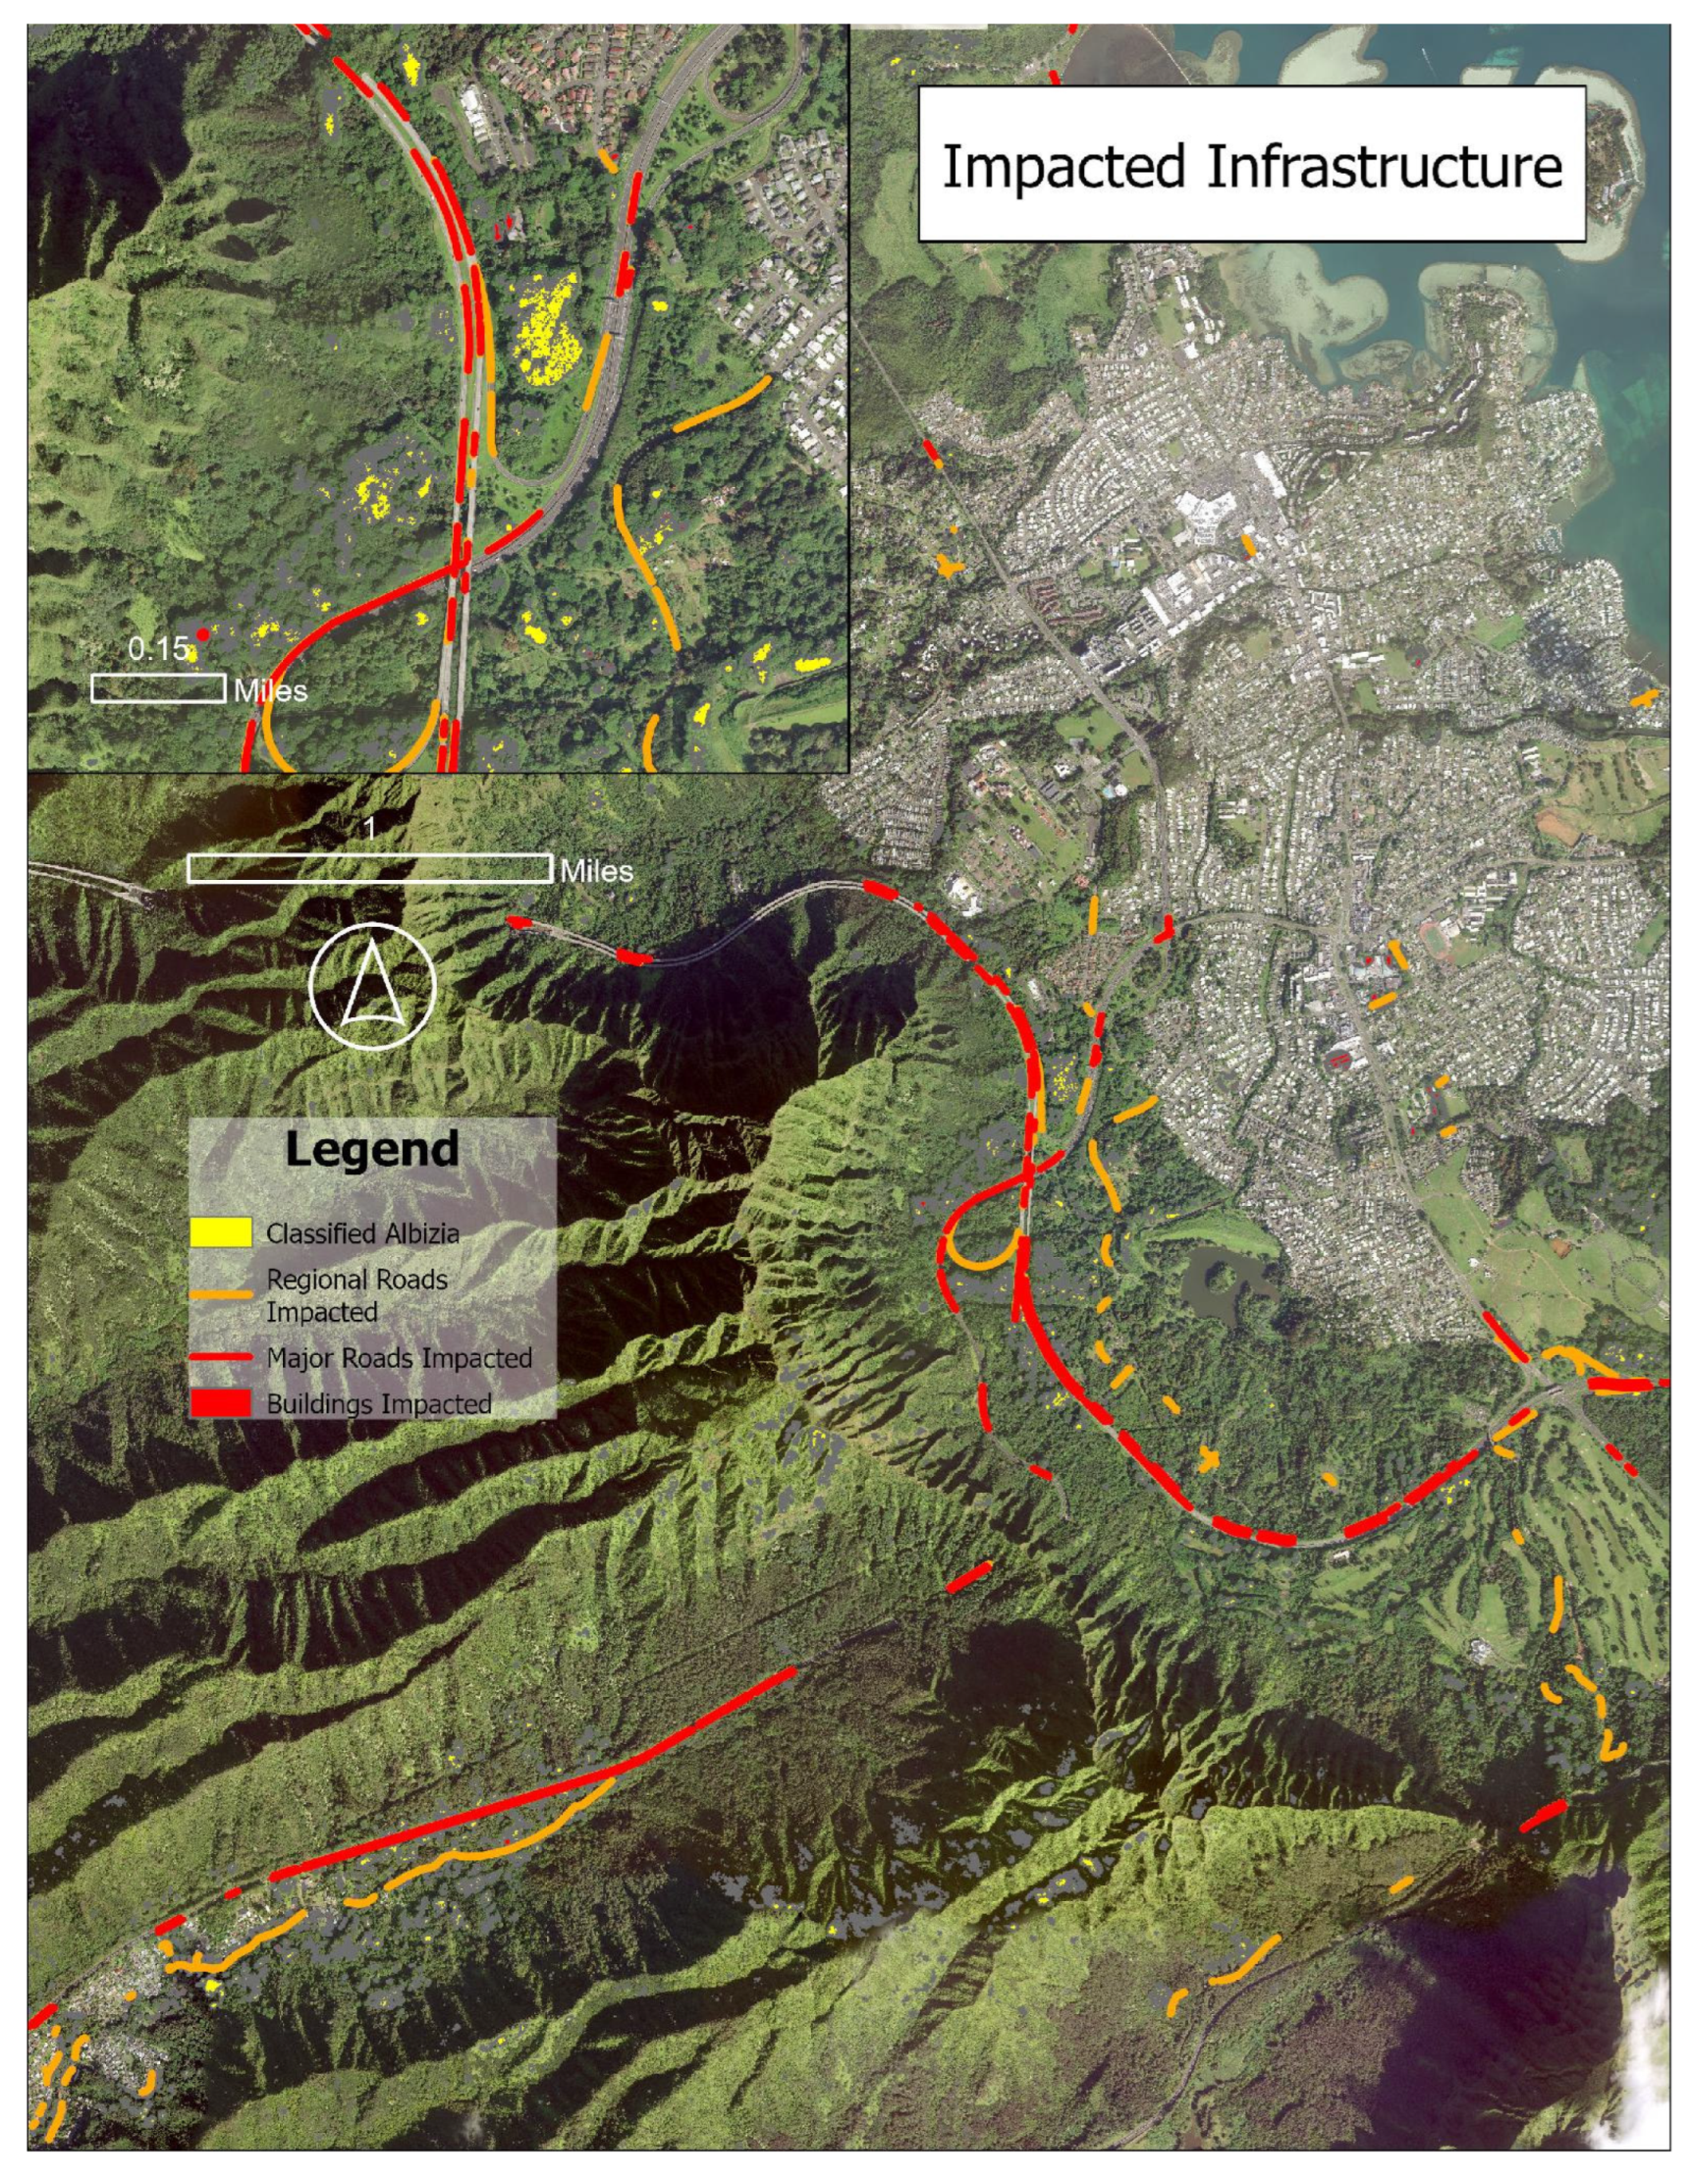
Figure 6 highlights one of the largest concentrations of potential infrastructure exposure, where Interstate H-3, Likelike Highway, and Pali Highway converge to connect windward communities with urban Honolulu. These findings should be interpreted as planning-scale indicators of potential hazard exposure rather than precise estimates of tree failure because they are influenced by classification uncertainty and the conservative buffer assumptions adopted in this study.
Figure 6.
Regional infrastructure exposure assessment showing classified albizia canopy and potential exposure of roads and buildings. Aerial imagery source: USDA Farm Service Agency, National Agriculture Imagery Program (NAIP), 2021 [27].
3.3. Site-Level Infrastructure Exposure
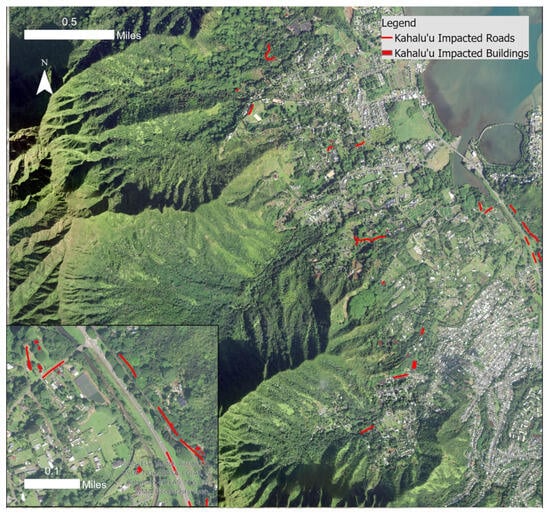
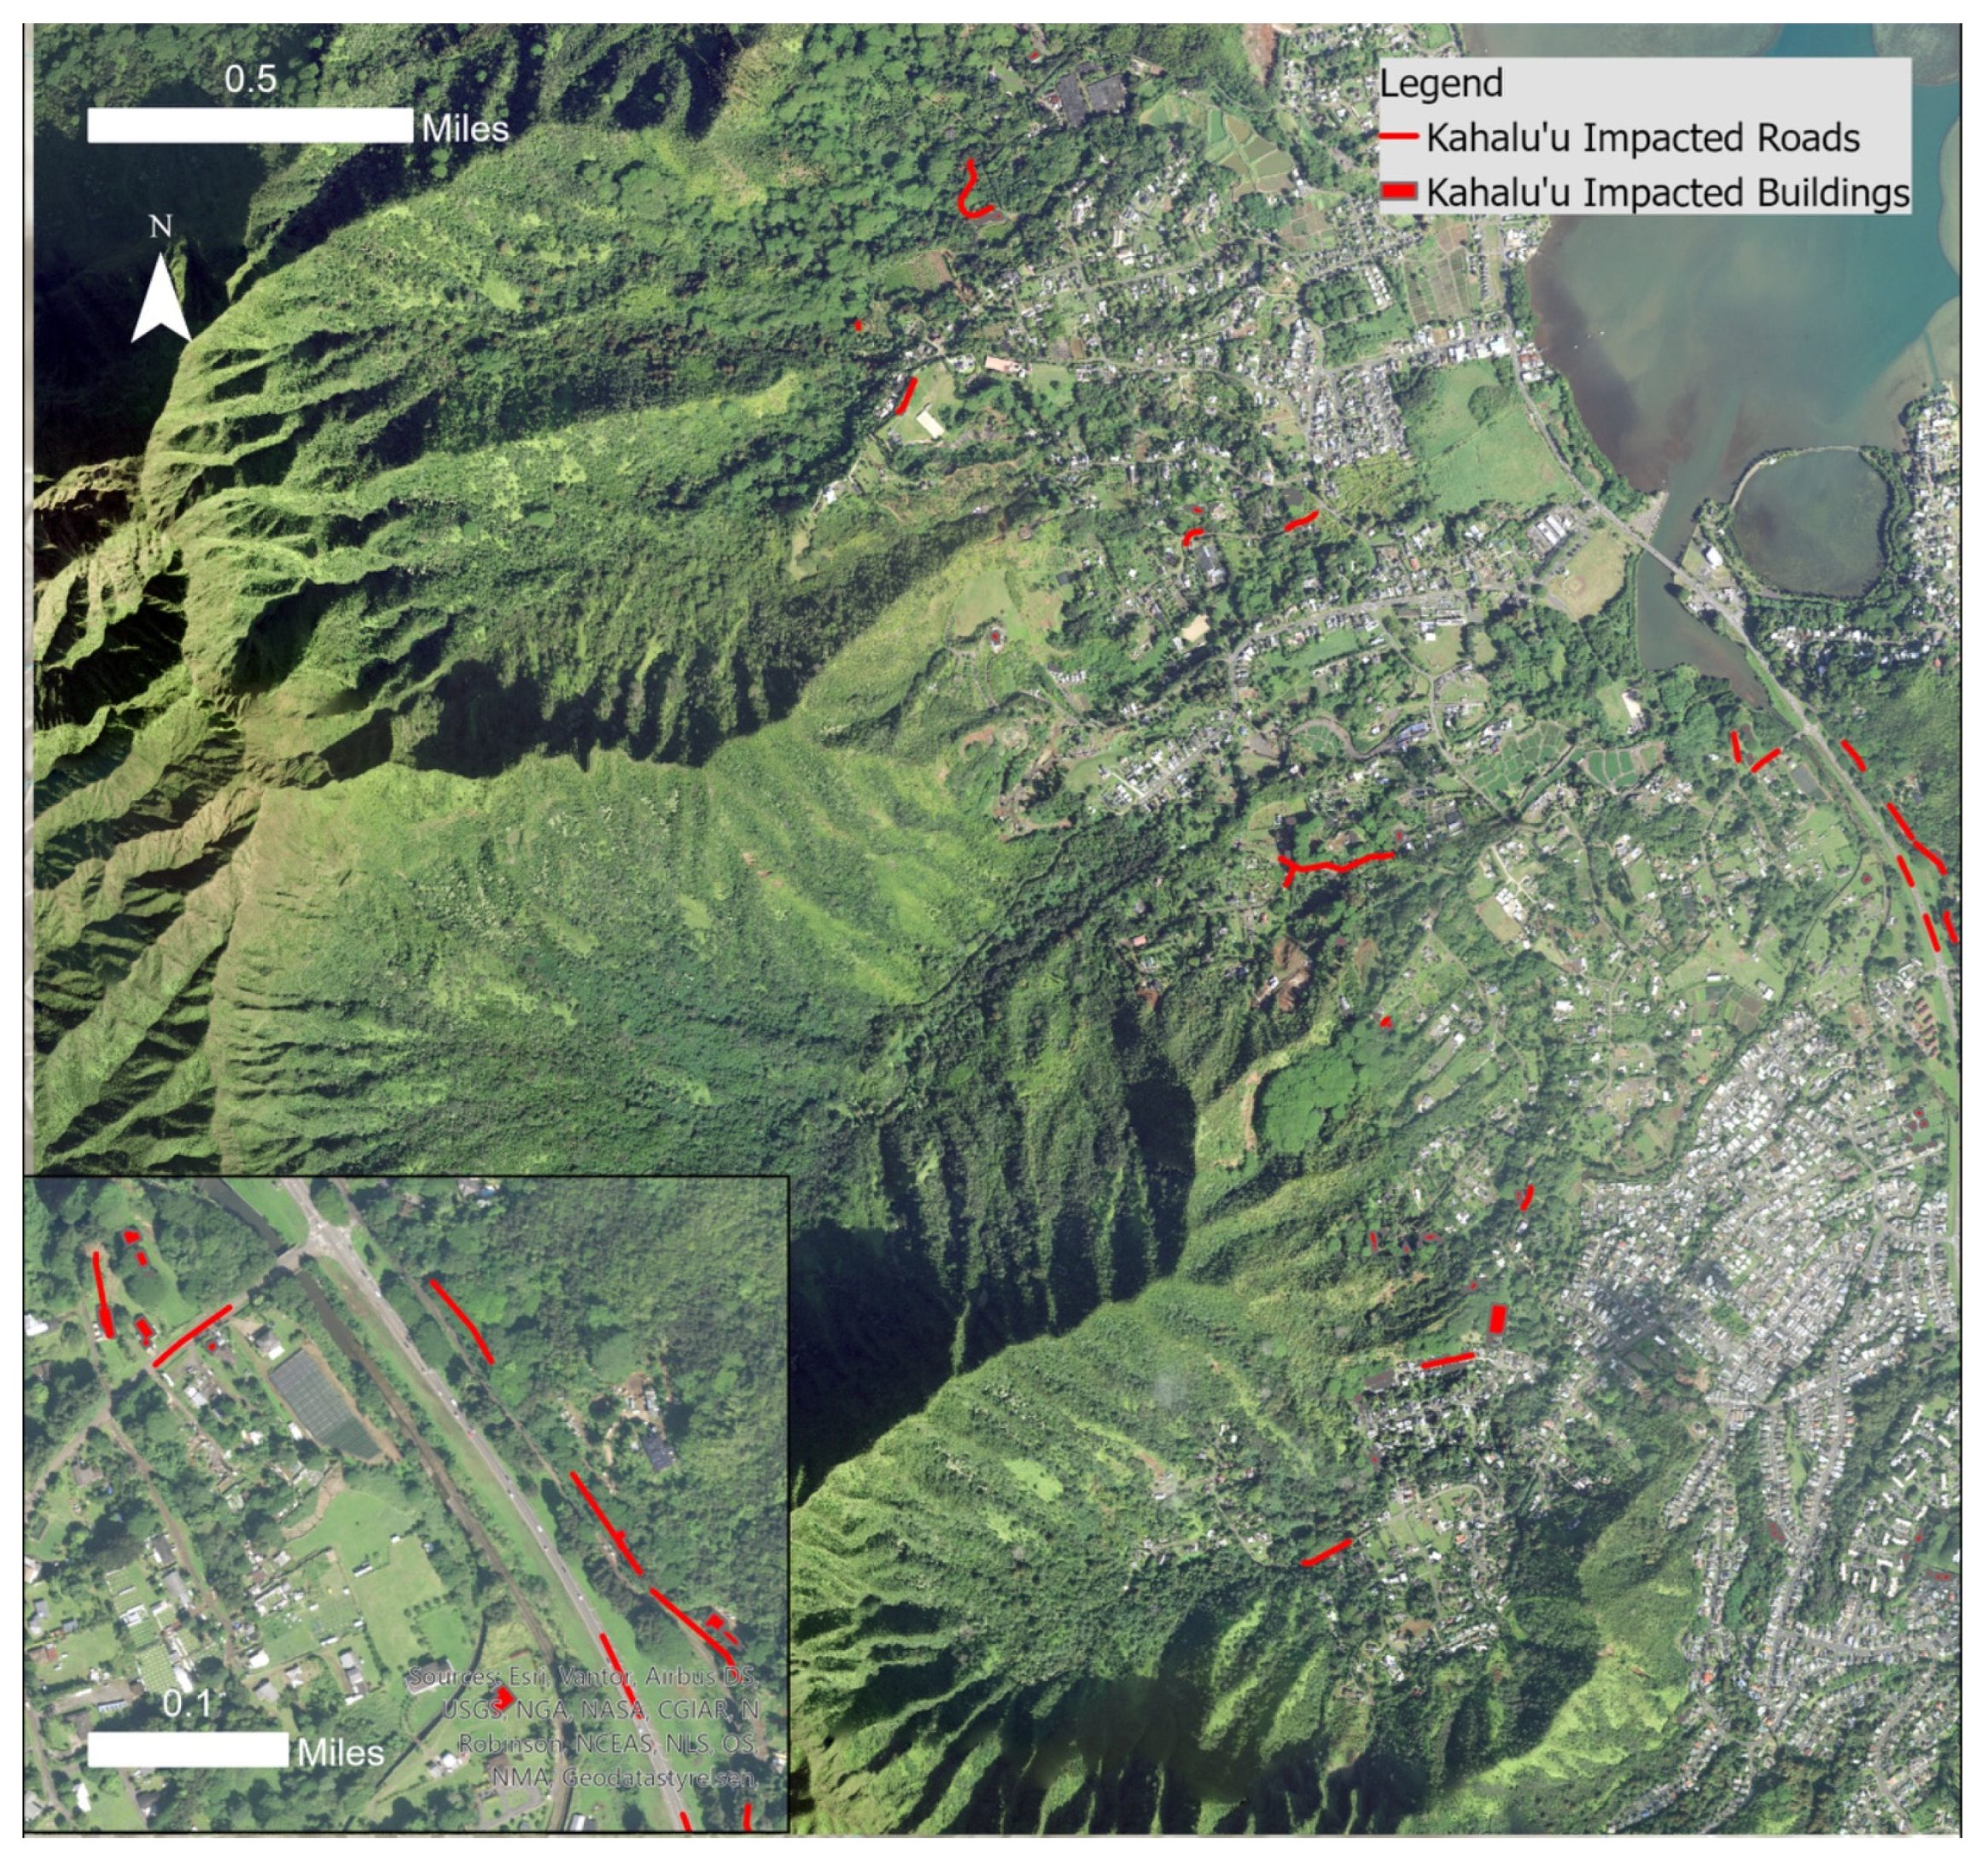
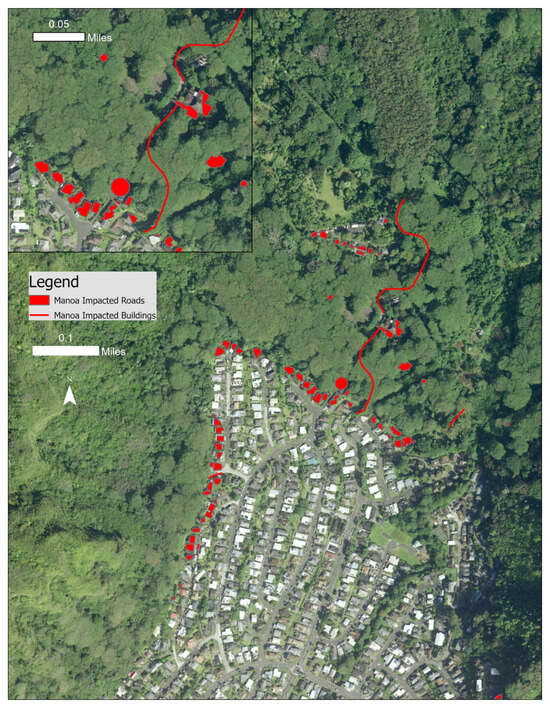
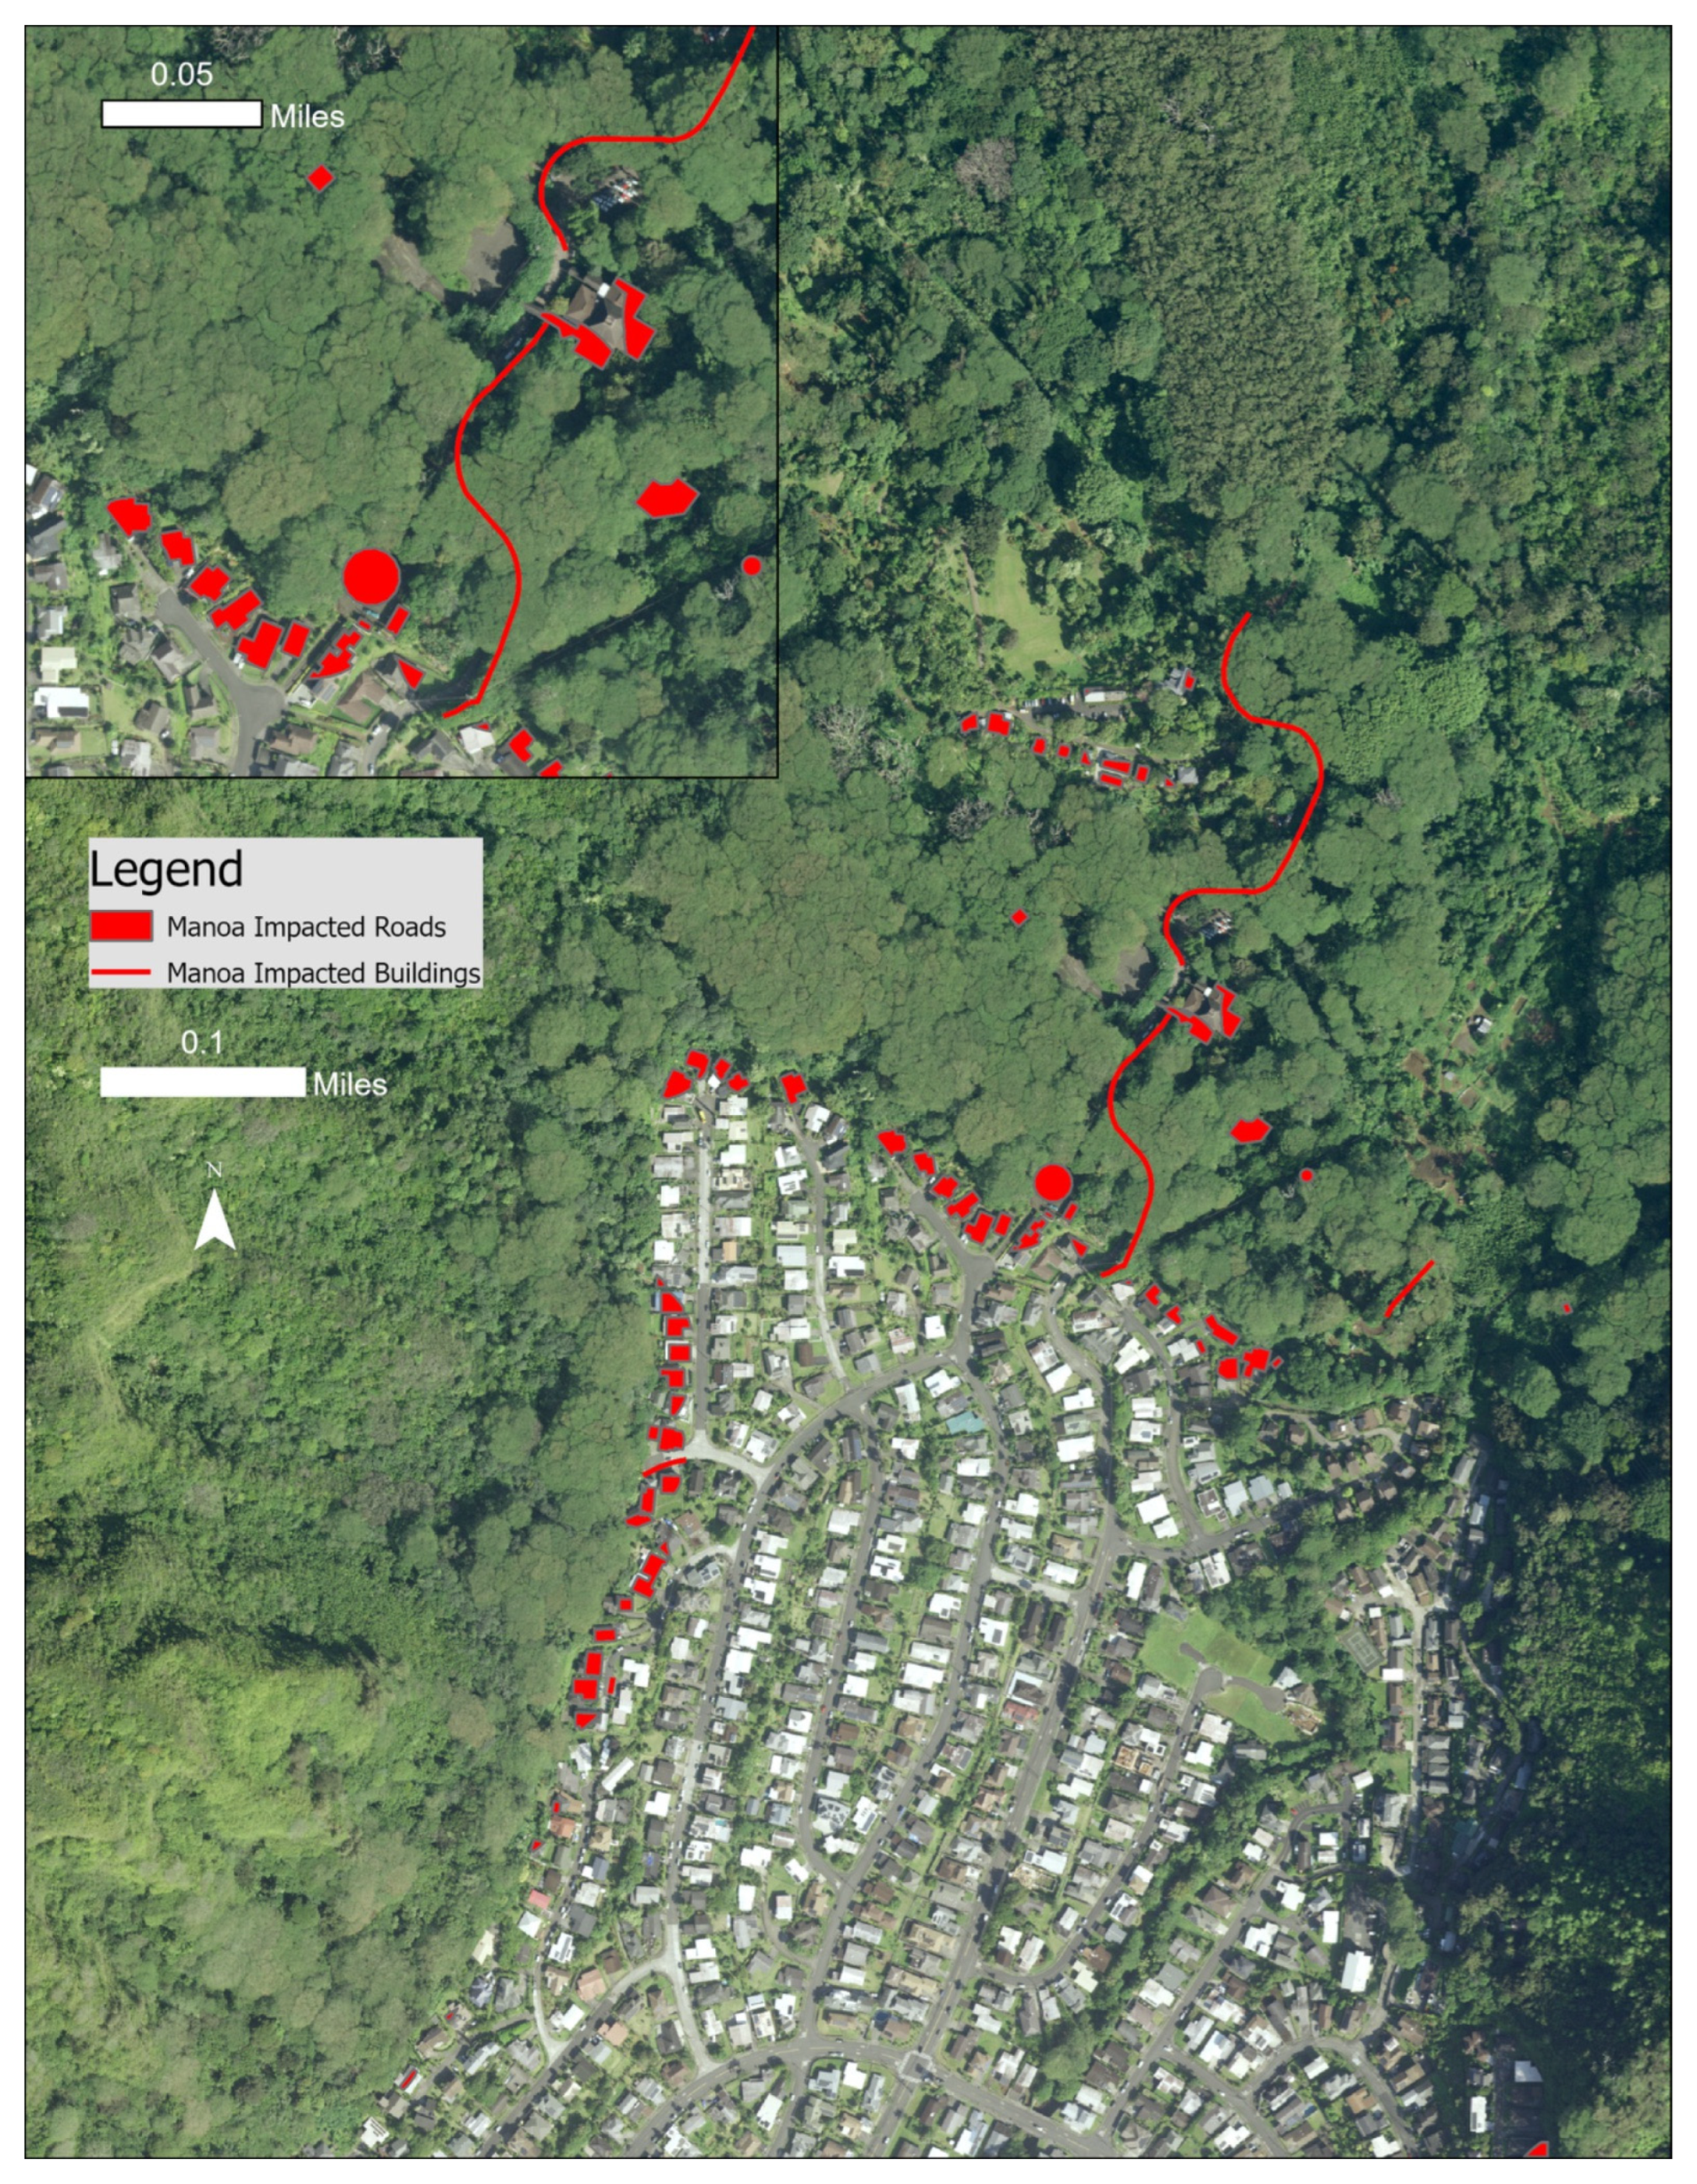
To demonstrate potential planning applications at finer spatial scales, the analytical framework was also applied to the Mānoa and Kahalu’u study areas using the same 45.7 m buffer distance. The resulting maps (Figure 7 and Figure 8) illustrate how the methodology can support rapid identification of locations where vegetation management may reduce potential infrastructure vulnerability.
Figure 7.
Site-level infrastructure exposure assessment for the Kahalu’u study area showing roads and buildings located within the potential albizia tree-fall exposure zone. Aerial imagery source: USDA Farm Service Agency, National Agriculture Imagery Program (NAIP), 2021 [27].
Figure 8.
Site-level infrastructure exposure assessment for the Mānoa study area showing roads and buildings located within the potential albizia tree-fall exposure zone. Aerial imagery source: USDA Farm Service Agency, National Agriculture Imagery Program (NAIP), 2021 [27].
In Kahalu’u (Figure 7), several albizia concentrations were identified adjacent to Kahekili Highway, a principal transportation corridor and evacuation route serving the windward coast. These locations represent potential priorities for field verification and vegetation management because tree failure could affect regional transportation connectivity during severe weather events.
In Mānoa (Figure 8), numerous buildings located along the upper valley slopes, including a water storage facility and surrounding structures, were situated within the potential tree-fall exposure zone. The site-level analyses also reinforced the regional validation results by demonstrating more reliable classification performance in densely forested environments than in heterogeneous urban and suburban settings.
Within the two model development areas, approximately 2.5 km of roads and 222 buildings in Mānoa, and 1.8 km of roads and 138 buildings in Kahalu’u, were located within the potential albizia tree-fall exposure zone (Table 5). Although these estimates do not represent predicted tree failures or actual infrastructure damage, they provide a practical basis for identifying locations where field assessment, vegetation management, or additional monitoring may be prioritized. When combined with local knowledge and engineering or arboricultural assessments, this information can support more targeted allocation of limited vegetation management resources and improve preparedness for future severe weather events.
Table 5.
Summary of site-level infrastructure exposure assessment.
4. Discussion
4.1. Implications for Disaster Preparedness and Urban Resilience
This study demonstrates that a GeoAI-enabled analytical framework can support planning-scale infrastructure exposure screening for disaster preparedness and urban resilience. Rather than replacing conventional field inventories or engineering assessments, the proposed framework provides a semi-automated approach for screening large geographic areas to identify locations where invasive albizia trees may increase potential infrastructure exposure during severe wind events. These findings are consistent with previous research highlighting the growing role of GeoAI in hazard assessment, emergency management, and disaster risk reduction [9,10].
The principal contribution of this study lies not solely in the application of deep learning for invasive tree mapping, but in linking GeoAI-derived canopy classification with infrastructure exposure analysis to produce planning-relevant information. Previous albizia mapping efforts in Hawai’i have primarily focused on species distribution [3,4], while remote sensing and machine learning applications more broadly have demonstrated the utility of these methods for invasive species detection and mapping [16,24]. The present study extends this work by integrating mapped albizia canopy with transportation and building infrastructure to support disaster preparedness and infrastructure resilience planning. This integration translates remotely sensed vegetation information into decision-support products that can assist agencies in prioritizing vegetation management, identifying locations for field verification, and supporting pre-disaster mitigation.
The regional analysis identified more than 53 km of roads and over 2300 buildings within the potential albizia tree-fall exposure zone, including segments of Interstate H-3, Pali Highway, Likelike Highway, Kahekili Highway, and Kalaniana’ole Highway. These corridors serve important commuter, evacuation, and emergency response functions for O’ahu. Although the analysis does not predict actual tree failure, the results suggest that invasive vegetation represents an underrecognized component of climate-related infrastructure vulnerability. As climate-related hazards, including severe wind events, continue to pose risks to infrastructure and communities, proactive vegetation management may become an increasingly important component of transportation resilience and disaster preparedness.
From a planning perspective, the analytical framework offers a practical approach for prioritizing limited mitigation resources. Comprehensive field inventories of hazardous trees are labor-intensive, time-consuming, and costly, making island-wide assessments difficult for many agencies. By screening large geographic areas, GeoAI can help focus subsequent field investigation on locations where potential infrastructure exposure is greatest. Because the framework relies on publicly available NAIP imagery and open infrastructure datasets, it also demonstrates a practical pathway for local governments and resource-constrained agencies to incorporate GeoAI into resilience planning without relying on costly proprietary data sources. Importantly, the proposed framework is intended to complement, rather than replace, existing vegetation management practices by providing an efficient first-stage screening tool for identifying priority areas for field investigation and more detailed site-specific assessment.
4.2. Strengths, Limitations, and Future Research
The results highlight both the strengths and limitations of the proposed GeoAI-enabled analytical framework. A principal strength of the framework is its ability to integrate publicly available aerial imagery, deep learning, and GIS analysis into a semi-automated GeoAI workflow capable of rapidly identifying areas where invasive albizia may threaten transportation and building infrastructure. Compared with traditional field inventories, the approach substantially reduces the time and effort required to generate regional-scale information while providing spatially explicit outputs that support planning and decision making. At the same time, several limitations should be considered when interpreting and applying the results.
The analytical framework extends previous albizia mapping efforts in Hawai’i in several important respects. Earlier studies employed object-based classification using QuickBird imagery [4] or guided classification of WorldView-2 imagery [3] within relatively limited geographic extents. In contrast, this study demonstrates the feasibility of applying deep learning semantic segmentation using publicly available NAIP imagery across a substantially larger regional study area while integrating the resulting classifications with infrastructure exposure analysis. The use of publicly available imagery further improves the scalability, transferability, and cost-effectiveness of the framework for planning applications.
The results also highlight both the capabilities and limitations of pixel-based semantic segmentation. Classification performance was strongest in the predominantly forested Mānoa landscape, where albizia canopy exhibited distinctive spectral and textural characteristics. Performance declined in the more heterogeneous Kahalu’u environment, where large grassy areas, golf courses, and marshes occasionally exhibited spectral characteristics similar to albizia canopy. Another potential source of error is confusion between albizia and other large-crowned species with similar spectral or canopy characteristics, such as monkeypod (Samanea saman). Because species identity was determined through visual interpretation of the NAIP imagery rather than field verification, some degree of species-level misclassification cannot be ruled out. Future validation incorporating field-verified reference data and species-specific morphological characteristics would help assess this source of uncertainty.
The reduced classification performance observed in the more heterogeneous Kahalu’u landscape highlights the importance of further model refinement before broader geographic application. Such refinement could include expanding the training dataset to encompass a wider range of geographic settings and landscape conditions.
Another limitation relates to the validation design. The post-classification accuracy assessment was conducted within the same two geographic areas used for model development and used visual interpretation of the same NAIP imagery used to develop the training samples. Consequently, the reported accuracy metrics reflect classification performance within the model-development areas rather than model performance in a geographically independent area. Future research should evaluate model performance in additional geographic areas and incorporate field-verified reference data where feasible to further assess model generalization.
The need for manual quality control also limits full automation and reduces the scalability advantages of the deep learning approach, particularly in heterogeneous landscapes where commission errors are more frequent. Accordingly, the current framework is best characterized as a human-in-the-loop screening approach rather than a fully automated monitoring system. Obvious false positives in open areas were relatively easy to identify through visual inspection, although their removal required additional processing time. In contrast, false positives in dense or remote forested areas may be more difficult to detect and verify. Any remaining false positives may result in overestimation of classified albizia canopy and the associated infrastructure exposure. Further model refinement and more diverse training data could reduce the need for manual post-processing and improve scalability for broader operational applications.
Several additional limitations should be considered when interpreting the infrastructure exposure estimates. First, the buffer analysis represents a simplified planning assumption based on proximity to classified albizia canopy. Because the classified albizia polygons were dissolved prior to buffering, buffer distances were measured from the edges of mapped canopy patches rather than from individual tree stems or crowns. Consequently, the resulting exposure estimates are influenced by mapped patch geometry as well as the assumed buffer distance and should not be interpreted as individual-tree fall-distance estimates. The 45.7 m baseline distance was based on the documented maximum height of mature albizia trees [5]. However, actual tree-failure behavior and the resulting zone of impact depend on multiple factors, including tree dimensions and structural condition, wind exposure, root and soil conditions, and site characteristics [34]. The uniform buffer therefore represents a simplified planning assumption rather than a prediction of individual-tree failure or fall distance. This approach may therefore overestimate exposure in some locations while underestimating it in others. Second, the two-dimensional buffer analysis does not account for topography or local wind conditions. Trees located well below road elevation may present relatively limited risk despite falling within the horizontal buffer, whereas trees located upslope may threaten infrastructure beyond the mapped buffer distance. Consequently, the mapped exposure estimates should be interpreted as planning-scale indicators intended to support prioritization rather than parcel-level hazard predictions or engineering-grade risk assessments.
An important finding of this study is that effective application of GeoAI continues to benefit from human expertise, particularly for training-sample development, interpretation of model outputs, and quality control. This is consistent with previous research emphasizing the continuing role of human expertise and human–machine collaboration in remote-sensing and geospatial machine learning workflows [35,36]. In this study, analyst knowledge was required both to develop training samples and to identify obvious false positives during post-processing. Accordingly, the framework is more appropriately characterized as a semi-automated, human-in-the-loop approach than as a fully automated monitoring system.
Several opportunities exist to further improve both the analytical framework and its planning applications. Expanding the training dataset to include a broader range of geographic settings, vegetation communities, and land cover types would likely improve model generalization while reducing the need for manual post-processing. Incorporating multi-temporal imagery acquired across different seasons and years may further improve classification robustness and support long-term monitoring of invasive species dynamics.
While pixel-based semantic segmentation has been widely applied to invasive species mapping [24,37], future studies should evaluate object-based detection approaches, including Faster R-CNN, YOLO, and emerging foundation models, to determine whether they improve classification performance in complex urban and heterogeneous landscapes [38]. Integrating additional geospatial datasets, including airborne LiDAR for tree height estimation, digital elevation models, soil moisture indicators, and wind exposure data, could improve representation of the physical processes governing tree failure and produce more realistic infrastructure exposure assessments.
Beyond methodological enhancements, future work should expand the analytical framework to incorporate critical facilities, utility infrastructure, land ownership, and social vulnerability indicators. Integrating these datasets would support more comprehensive assessments of community resilience by linking invasive vegetation management with broader climate adaptation, infrastructure resilience, and emergency preparedness strategies. Such advances would further strengthen the role of GeoAI as a practical decision-support tool for sustainable planning in Hawai’i and other regions facing similar environmental and infrastructure challenges.
5. Conclusions
This study developed and applied a GeoAI-enabled analytical framework that integrates deep learning semantic segmentation, publicly available NAIP aerial imagery, and GIS-based infrastructure analysis to detect and map invasive albizia (F. falcata) and assess potential tree-fall exposure to roads and buildings across a large portion of southern Ko’olau, O’ahu, Hawai’i. The framework identified approximately 1.97 km2 (486 acres) of albizia canopy within the regional study area and estimated that more than 53 km of roads and 2300 buildings were located within the potential tree-fall exposure zone. Several major transportation corridors, including Interstate H-3, Pali Highway, Likelike Highway, Kahekili Highway, and Kalaniana’ole Highway, exhibited substantial potential exposure, underscoring the importance of invasive vegetation management for transportation resilience and emergency preparedness.
Beyond mapping invasive species, this study demonstrates how GeoAI can translate remotely sensed data into planning-relevant information that supports disaster preparedness, infrastructure resilience, and climate adaptation. By integrating species detection with infrastructure exposure analysis, the proposed framework provides a practical screening tool that can help planners and emergency managers prioritize field investigations and allocate limited vegetation management resources more effectively. Because the framework relies on publicly available imagery and widely accessible geospatial tools, it also offers a semi-automated and cost-effective approach that may be transferable to other regions facing invasive vegetation hazards.
Several limitations remain. Classification performance was lower in heterogeneous urban environments than in predominantly forested landscapes, and manual post-processing was required to remove obvious false-positive classifications. In addition, the simplified buffer-based exposure analysis does not account for factors such as tree condition, topography, wind dynamics, or slope, and therefore should be interpreted as a planning-scale screening approach rather than an engineering-grade hazard assessment. Future research should expand the geographic diversity of training data, incorporate multi-temporal imagery and additional environmental datasets, and evaluate alternative deep learning architectures to improve classification accuracy and operational applicability.
As climate change increases the frequency and intensity of extreme weather events, timely and spatially explicit information on vegetation-related hazards will become increasingly important for protecting communities and critical infrastructure. This study demonstrates the potential of GeoAI-enabled planning frameworks to bridge advances in artificial intelligence and geospatial analysis with practical decision support, providing a semi-automated approach for strengthening disaster preparedness, infrastructure resilience, and sustainable planning in Hawai’i and other regions facing similar environmental challenges.
Author Contributions
Conceptualization, J.W. and S.S.; methodology, J.W. and S.S.; formal analysis, J.W.; investigation, J.W., S.S. and Y.J.; data curation, J.W.; visualization, J.W.; writing—original draft preparation, J.W.; writing—review and editing, J.W., S.S. and Y.J.; supervision, S.S. All authors have read and agreed to the published version of the manuscript.
Funding
This research received no external funding.
Institutional Review Board Statement
Not applicable.
Informed Consent Statement
Not applicable.
Data Availability Statement
The original data presented in this study are openly available online at [27,30]. The training samples, trained model, classification outputs, and derived datasets generated during this study are available from the corresponding author upon reasonable request.
Acknowledgments
During the preparation of this manuscript, the authors used ChatGPT (OpenAI, GPT-5.5) to assist with improving the language of the manuscript. The authors carefully reviewed, edited, and verified all content generated with this assistance and take full responsibility for the content of this publication.
Conflicts of Interest
The authors declare no conflicts of interest.
Abbreviations
The following abbreviations are used in this manuscript:
| Faster R-CNN | Faster Region-based Convolutional Neural Network |
| GIS | Geographic Information System |
| GeoAI | Geographic Artificial Intelligence |
| GPU | Graphics Processing Unit |
| LiDAR | Light Detection and Ranging |
| NAIP | National Agriculture Imagery Program |
| UAV | Unmanned Aerial Vehicle |
| U-Net | U-shaped Convolutional Neural Network Architecture |
| USDA | United States Department of Agriculture |
| YOLO | You Only Look Once |
| SAM | Segment Anything Model |
References
- THE TARGET: Albizia (Falcataria moluccana). Available online: https://dlnr.hawaii.gov/hisc/info/biocontrol/latest-biocontrol/falcataria-moluccana/ (accessed on 24 April 2024).
- Staff. UH Hilo to Do Post Iselle Damage Assessment and Albizia Mapping. UH Hilo Stories. Available online: https://hilo.hawaii.edu/chancellor/stories/2014/09/05/albizia-mapping/ (accessed on 24 April 2024).
- Gaertner, J.A. Mapping Invasive Species: Albizia Distribution in the Hawaiian Islands. In Proceedings of the HIGICC UH Hilo Geospatial Expo, Hilo, HI, USA, 4 August 2017. [Google Scholar]
- Mapping Invasive Trees in Hilo, Hawaii, Using GIS. Available online: https://www.esri.com/news/arcwatch/1011/feature.html (accessed on 5 May 2024).
- Watson, J.C. Strategic Plan for the Control and Management of Albizia in Hawaii; Invasive Species Hawaii Council: Honolulu, HI, USA, 2018.
- ESRI. GeoAI: AI-Driven Geospatial Workflows. Available online: https://www.esri.com/en-us/capabilities/geoai/overview (accessed on 24 April 2024).
- Yang, X. Progress in Urban Remote Sensing: An Overview. In Urban Remote Sensing, 1st ed.; Yang, X., Ed.; Wiley: Hoboken, NJ, USA, 2021; pp. 3–13. [Google Scholar] [CrossRef] [Scilit]
- Sanchez, T.W. Planning on the Verge of AI, or AI on the Verge of Planning. Urban Sci. 2023, 7, 70. [Google Scholar] [CrossRef] [Scilit]
- National Research Council; Division on Earth and Life Studies; Board on Earth Sciences and Resources; Mapping Science Committee; Committee on Planning for Catastrophe: A Blueprint for Improving Geospatial Data, Tools, and Infrastructure. Successful Response Starts with a Map: Improving Geospatial Support for Disaster Management; National Academies Press: Washington, DC, USA, 2007. [Google Scholar]
- Khan, A.; Gupta, S.; Gupta, S.K. Multi-hazard disaster studies: Monitoring, detection, recovery, and management, based on emerging technologies and optimal techniques. Int. J. Disaster Risk Reduct. 2020, 47, 101642. [Google Scholar] [CrossRef] [Scilit]
- Li, X.; Chen, W.Y.; Sanesi, G.; Lafortezza, R. Remote Sensing in Urban Forestry: Recent Applications and Future Directions. Remote Sens. 2019, 11, 1144. [Google Scholar] [CrossRef] [Scilit]
- Chen, X.; Shen, X.; Cao, L. Tree Species Classification in Subtropical Natural Forests Using High-Resolution UAV RGB and SuperView-1 Multispectral Imageries Based on Deep Learning Network Approaches: A Case Study within the Baima Snow Mountain National Nature Reserve, China. Remote Sens. 2023, 15, 2697. [Google Scholar] [CrossRef] [Scilit]
- Somers, B.; Asner, G.P. Invasive Species Mapping in Hawaiian Rainforests Using Multi-Temporal Hyperion Spaceborne Imaging Spectroscopy. IEEE J. Sel. Top. Appl. Earth Obs. Remote Sens. 2013, 6, 351–359. [Google Scholar] [CrossRef] [Scilit]
- Guo, X.; Li, H.; Jing, L.; Wang, P. Individual Tree Species Classification Based on Convolutional Neural Networks and Multitemporal High-Resolution Remote Sensing Images. Sensors 2022, 22, 3157. [Google Scholar] [CrossRef] [Scilit]
- Fassnacht, F.E.; Latifi, H.; Stereńczak, K.; Modzelewska, A.; Lefsky, M.; Waser, L.T.; Straub, C.; Ghosh, A. Review of studies on tree species classification from remotely sensed data. Remote Sens. Environ. 2016, 186, 64–87. [Google Scholar] [CrossRef] [Scilit]
- Thapa, N.; Narine, L.L.; Fan, Z.; Yang, S.; Tiwari, K. Detection of invasive plants using NAIP imagery and airborne LiDAR in coastal Alabama and Mississippi, USA. Ann. For. Res. 2023, 66, 63–77. [Google Scholar] [CrossRef] [Scilit]
- Wan, H.; Tang, Y.; Jing, L.; Li, H.; Qiu, F.; Wu, W. Tree species classification of forest stands using multisource remote sensing data. Remote Sens. 2021, 13, 144. [Google Scholar] [CrossRef] [Scilit]
- Li, Y.; Zhang, H.; Xue, X.; Jiang, Y.; Shen, Q. Deep learning for remote sensing image classification: A survey. WIREs Data Min. Knowl. Discov. 2018, 8, e1264. [Google Scholar] [CrossRef] [Scilit]
- Fan, W.; Tian, J.; Troles, J.; Döllerer, M.; Kindu, M.; Knoke, T. Comparing Deep Learning and MCWST Approaches for Individual Tree Crown Segmentation. ISPRS Ann. Photogramm. Remote Sens. Spat. Inf. Sci. 2024, X-1–2024, 67–73. [Google Scholar] [CrossRef] [Scilit]
- Grondin, V.; Fortin, J.-M.; Pomerleau, F.; Giguère, P. Tree detection and diameter estimation based on deep learning. For. An. Int. J. For. Res. 2023, 96, 264–276. [Google Scholar] [CrossRef] [Scilit]
- Beloiu, M.; Heinzmann, L.; Rehush, N.; Gessler, A.; Griess, V.C. Individual Tree-Crown Detection and Species Identification in Heterogeneous Forests Using Aerial RGB Imagery and Deep Learning. Remote Sens. 2023, 15, 1463. [Google Scholar] [CrossRef] [Scilit]
- Ren, S.; He, K.; Girshick, R.; Sun, J. Faster r-cnn: Towards real-time object detection with region proposal networks. In Proceedings of the Advances in Neural Information Processing Systems, 28, Montreal, QC, Canada, 7–12 December 2015; pp. 91–99. [Google Scholar]
- Redmon, J.; Divvala, S.; Girshick, R.; Farhadi, A. You only look once: Unified, real-time object detection. In Proceedings of the IEEE Conference on Computer Vision and Pattern Recognition, Las Vegas, NV, USA, 27–30 June 2016; pp. 779–788. [Google Scholar]
- da Silva, S.D.P.; Eugenio, F.C.; Fantinel, R.A.; de Paula Amaral, L.; dos Santos, A.R.; Mallmann, C.L.; dos Santos, F.D.; Pereira, R.S.; Ruoso, R. Modeling and detection of invasive trees using UAV image and machine learning in a subtropical forest in Brazil. Ecol. Inform. 2023, 74, 101989. [Google Scholar] [CrossRef] [Scilit]
- Albizia. ArcGIS StoryMaps. Available online: https://storymaps.arcgis.com/stories/2b9d3f757cfe4fa3b53e43a3a38542f3 (accessed on 5 May 2024).
- Esri. “Topographic” [Basemap]. Scale Not Given. “World Topographic Map”. 19 February 2012. Available online: https://www.arcgis.com/home/item.html?id=30e5fe3149c34df1ba922e6f5bbf808f (accessed on 22 September 2026).
- Farm Service Agency (FSA). Available online: https://www.fsa.usda.gov/ (accessed on 5 May 2024).
- Plakman, V.; Janssen, T.; Brouwer, N.; Veraverbeke, S. Mapping species at an individual-tree scale in a temperate forest, using sentinel-2 images, airborne laser scanning data, and random forest classification. Remote Sens. 2020, 12, 3710. [Google Scholar] [CrossRef] [Scilit]
- Wegmueller, S.A.; Monahan, W.B.; Townsend, P.A. Tree condition and analysis program–Detecting forest disturbance at the tree level across the contiguous United States with high resolution imagery. J. For. 2024, 122, 31–53. [Google Scholar] [CrossRef] [Scilit]
- Hawaii Statewide GIS Program. Geospatial Data Portal. Available online: https://geoportal.hawaii.gov (accessed on 5 May 2024).
- Ronneberger, O.; Fischer, P.; Brox, T. U-net: Convolutional networks for biomedical image segmentation. In International Conference on Medical Image Computing and Computer-Assisted Intervention; Springer International Publishing: Cham, Switzerland, 2015; pp. 234–241. [Google Scholar]
- He, K.; Zhang, X.; Ren, S.; Sun, J. Deep residual learning for image recognition. In Proceedings of the IEEE Conference on Computer Vision and Pattern Recognition; IEEE: Piscataway, NJ, USA, 2016; pp. 770–778. [Google Scholar]
- Olofsson, P.; Foody, G.M.; Herold, M.; Stehman, S.V.; Woodcock, C.E.; Wulder, M.A. Good practices for estimating area and assessing accuracy of land change. Remote Sens. Environ. 2014, 148, 42–57. [Google Scholar] [CrossRef] [Scilit]
- International Society of Arboriculture. ISA-Basic-Tree-Risk-Assessment-Form-Instructions; International Society of Arboriculture: Atlanta, GA, USA, 2025; Available online: https://www.isa-arbor.com/Portals/0/Assets/PDF/Certification-Applications/ISA-Basic-Tree-Risk-Assessment-Form-Instructions.pdf (accessed on 17 June 2026).
- Robinson, C.; Ortiz, A.; Malkin, K.; Elias, B.; Peng, A.; Morris, D.; Dilkina, B.; Jojic, N. Human-machine collaboration for fast land cover mapping. Proc. AAAI Conf. Artif. Intell. 2020, 34, 2509–2517. [Google Scholar] [CrossRef] [Scilit]
- Portelli, R.A.; Pope, P. Sensing and Human Factors Research: A Review. Photogramm. Eng. Remote Sens. 2022, 88, 55–64. [Google Scholar] [CrossRef] [Scilit]
- Whiteside, T.G.; Boggs, G.S.; Maier, S.W. Comparing object-based and pixel-based classifications for mapping savannas. Int. J. Appl. Earth Obs. Geoinf. 2011, 13, 884–893. [Google Scholar] [CrossRef] [Scilit]
- Moin, M. Object Detection: A Journey from R-CNN to Mask R-CNN and YOLO. Augmented Startups. Available online: https://medium.com/augmented-startups/object-detection-a-journey-from-r-cnn-to-mask-r-cnn-and-yolo-698ba097d490 (accessed on 8 May 2024).

Disclaimer/Publisher’s Note: The statements, opinions and data contained in all publications are solely those of the individual author(s) and contributor(s) and not of MDPI and/or the editor(s). MDPI and/or the editor(s) disclaim responsibility for any injury to people or property resulting from any ideas, methods, instructions or products referred to in the content. |
© 2026 by the authors. Licensee MDPI, Basel, Switzerland. This article is an open access article distributed under the terms and conditions of the Creative Commons Attribution (CC BY) license.