


Abstract
The macroalga Kappaphycus alvarezii is a renewable source of bioactive compounds with potential in nanobiotechnology, particularly the green synthesis of metallic nanoparticles, where its extracts act as reducing and stabilizing agents. The aim of this study was to investigate the green synthesis of silver nanoparticles (AgNPs) using aqueous extracts of K. alvarezii, evaluating the influence of pH, silver nitrate (AgNO3) and extract concentration, temperature, and reaction time, through two 23 factorial designs with central points, as well as characterizing the obtained AgNPs by ultraviolet–visible spectroscopy (UV-Vis), dynamic light scattering (DLS), zeta potential, nanoparticle tracking analysis (NTA), and transmission electron microscopy (TEM). The selected synthesis conditions were identified as pH 13, 5.0 mg mL−1 extract, and 2.5 mM AgNO3, with two effective combinations of temperature and reaction time: 50 °C for 30 min or 60 °C for 15 min. The formation of AgNPs was confirmed by a surface plasmon resonance band at ~420 nm, showing spherical morphology, a negative zeta potential, and particle sizes ranging from 93–100 nm (NTA) to 174–192 nm (DLS), the latter reflecting the presence of aggregates in suspension. Colloidal behavior indicated partial stability, with a tendency toward aggregation during prolonged storage. Overall, these findings demonstrate the potential of K. alvarezii as a sustainable source of bioactive compounds for the synthesis of AgNPs, supporting its applicability as an antioxidant nanomaterial platform. Further biological validation and comprehensive sustainability assessments are required to evaluate its potential applications in sectors such as health, cosmetics, and agriculture. This approach reinforces the principles of Green Chemistry and aligns with several Sustainable Development Goals (SDGs), including SDG 3, 9, 12, and 14, particularly regarding the sustainable sourcing of the biomass used.
1. Introduction
Nanotechnology is an emerging field of science focused on the manipulation of materials at the nanoscale, enabling the development of nanomaterials with unique physicochemical properties and applications across several industrial, biomedical, and environmental sectors [1,2,3]. Among these materials, metallic nanoparticles, particularly silver nanoparticles (AgNPs), stand out due to their high chemical stability, antimicrobial activity, and potential applications in environmental remediation, biomedicine, agriculture, cosmetics, and food packaging [4,5,6]. AgNPs can be synthesized through physical, chemical, and biological methods using top-down or bottom-up approaches [2,7,8]. However, conventional methods have limitations, including high cost, elevated energy consumption, the use of toxic reagents, and the generation of hazardous residues and environmental impacts [4,7]. In this context, increasing attention has been directed toward green synthesis approaches, which employ biological extracts as sources of biomolecules capable of acting as reducing and stabilizing agents, providing a sustainable and environmentally friendly alternative for nanoparticle production [6,9]. Beyond reducing the environmental footprint of nanoparticle production, this approach also supports circular economy principles by valorizing biomass from already-established aquaculture and coastal farming activities, transforming a renewable marine resource into a high-value biotechnological product.
Phyconanotechnology has emerged as an interdisciplinary field that employs marine algae as “biofactories” for the synthesis of metallic nanoparticles [7,10]. Algae from different taxonomic groups, including Phaeophyta (brown algae), Rhodophyta (red algae), Chlorophyta (green algae), and Cyanophyta (cyanobacteria or blue-green algae), have been applied in nanoparticle synthesis. These organisms offer several advantages, such as high metal ion hyperaccumulation capacity, rapid growth, ease of handling, and economic feasibility for industrial-scale applications [8,11,12,13,14]. The red macroalga K. alvarezii, considered highly relevant for industrial applications, is particularly notable due to its high carrageenan content, a sulfated polysaccharide widely used as a gelling agent in the food and pharmaceutical industries, and is extensively cultivated in coastal waters of Southeast Asia, especially in Malaysia, Indonesia, and the Philippines [2,6,15].
K. alvarezii has shown great potential as a source for the green synthesis of AgNPs, not only because of its high polysaccharide content but also due to the presence of biologically active compounds, including fibers, pigments, proteins, vitamins, minerals, saturated and unsaturated fatty acids, and phytoconstituents such as phenolics, terpenoids, and phlorotannins, which act as reducing, stabilizing, and capping agents by converting Ag+ ions into Ag0 nanoparticles [4,7,8,9,12,13,14]. These mechanisms make the process faster and more efficient than traditional synthesis methods while reducing environmental impacts and enhancing therapeutic, antimicrobial, and antioxidant properties [6,7,16].
Despite the promising potential of green synthesis mediated by K. alvarezii, obtaining AgNPs with controlled size, morphology, and properties remains a challenge due to the complexity of the biological systems involved. Although earlier K. alvarezii-mediated studies confirmed AgNP formation, their synthesis protocols either relied on a single, fixed reaction condition without testing any process variable, or varied a single process variable at a time, rather than employing a formal statistical experimental design capable of capturing interactions between variables [2,6,15] Therefore, the present study aimed to investigate the green synthesis of AgNPs using aqueous extracts of K. alvarezii, evaluate the experimental parameters influencing nanoparticle formation through two 23 full factorial designs (FFD) with three central points, and characterize the nanoparticles in terms of physicochemical properties and stability. This work systematically screens five process variables, uses biomass commercially cultivated on the Brazilian coast for carrageenan and biostimulant production, applies Nanoparticle Tracking Analysis as an independent sizing technique, and follows colloidal behavior over 30 days of storage.
2. Materials and Methods
2.1. Materials
K. alvarezii was collected from the marine farm of Algastech company located on the coast of Paraty, Rio de Janeiro, Brazil (coordinates 23°13′39.6″ S and 44°37′25.6″ W). The reagents used were silver nitrate (Plat Lab, Guarulhos, SP, Brazil), ABTS [2,2′-azino-bis(3-ethylbenzothiazoline-6-sulfonic acid)] (Sigma-Aldrich, St. Louis, MO, USA), potassium persulfate (Sigma-Aldrich), sodium hydroxide (NaOH) (Sigma-Aldrich), nitric acid 65% P.A. ACS grade (HNO3) (Neon, Suzano, SP, Brazil), DPPH (2,2-diphenyl-1-picrylhydrazyl) (Sigma-Aldrich), Trolox (6-hydroxy-2,5,7,8-tetramethylchromane-2-carboxylic acid) (Sigma-Aldrich), Folin–Ciocalteu reagent (Dinâmica Química, Indaiatuba, SP, Brazil), sodium carbonate (Sigma-Aldrich), gallic acid (3,4,5-trihydroxybenzoic acid) (Sigma-Aldrich), aluminum chloride (Sigma-Aldrich), absolute ethanol P.A. ACS grade (Labsynth, Diadema, SP, Brazil), sodium nitrite (Sigma-Aldrich), sodium hydroxide (Sigma-Aldrich), and quercetin [2-(3,4-dihydroxyphenyl)-3,5,7-trihydroxy-4H-1-benzopyran-4-one] (Sigma-Aldrich).
2.2. Aqueous Extracts of K. alvarezii
The algal biomass was washed with water, dried in a forced-air circulation oven (Marconi, MA035, Piracicaba, SP, Brazil) at 45 °C for approximately 48 h, and subsequently ground using a knife mill (Marconi, MA048). The dried biomass was suspended in distilled water at a 1:100 (w/v) ratio. The mixture was maintained at room temperature for 15 h in the dark. Subsequently, the suspension was heated at 60 °C for 30 min under constant agitation at 120 rpm. Finally, the mixture was vacuum-filtered using germination paper as the filtering medium, and the resulting filtrate was collected as the aqueous extract.
2.3. Experimental Design for the Green Synthesis of AgNPs
AgNO3 was used as the silver-ion precursor, while the aqueous extract of K. alvarezii served as both the bioreducing and stabilizing agents. The reactions were carried out by mixing the aqueous extract and AgNO3 solution at a 1:1 (v/v) ratio, and the reported concentrations refer to their initial values prior to mixing. The formation of AgNPs was initially monitored by visual observation of the reaction mixture’s color change from colorless to dark brown, indicating the reduction of silver ions and the formation of nanoparticles.
The experimental strategy was structured as a sequential exploratory approach, in which preliminary factor evaluation was followed by two factorial designs (FFD-I and FFD-II). These factorial designs were used to obtain preliminary information on the influence of the investigated process variables and to guide the selection of experimental conditions for subsequent characterization and investigation.
2.3.1. Step 1: Preliminary Evaluation of Factors Influencing AgNP Synthesis
An initial screening study was conducted to evaluate the main factors affecting the green synthesis of AgNPs. The effects of pH (3, 5, 8, 10, and 13), aqueous extract concentration (1.0, 2.5, 5.0, 7.5, and 10.0 mg mL−1), AgNO3 concentration (1.0, 2.5, 5.0, 7.5, and 10.0 mM), and combined reaction temperature and time conditions (20 °C for 75 min, 30 °C for 60 min, 40 °C for 45 min, 50 °C for 30 min, and 60 °C for 15 min) were investigated. The results obtained at this stage enabled the identification of the most favorable conditions for AgNP synthesis and the definition of the experimental ranges for the subsequent factorial designs.
2.3.2. Step 2: Evaluation of Synthesis Parameters Using a Full Factorial Design with Three Center Points (FFD-I)
Based on the conditions established in Stage 1, a 23 full factorial design with three center points (FFD-I) was employed as an exploratory factorial design to preliminarily assess the individual effects and possible interactions among AgNO3 concentration (1.0, 1.75, and 2.5 mM), aqueous extract concentration (5.0, 7.5, and 10.0 mg mL−1), and reaction temperature (40, 50, and 60 °C) on the green synthesis of AgNPs. The reaction time was adjusted based on the applied temperature, corresponding to 45 min at 40 °C, 30 min at 50 °C, and 15 min at 60 °C, in order to maintain a comparable reaction extent across temperature levels, following established literature protocols. Consequently, temperature and reaction time were not varied independently in this design, and their individual effects cannot be statistically decoupled; any effect attributed to temperature in FFD-I should therefore be interpreted as the combined effect of temperature and its associated reaction time. Table 1 presents the experimental design matrix used in this study.
Table 1.
Experimental design matrix of a 23 full factorial design with three center points used for the green synthesis of AgNPs.
2.3.3. Step 3: Extended Evaluation of Synthesis Parameters Using a Full Factorial Design with Three Center Points (FFD-II)
Based on the results obtained from the first factorial design, a second 23 full factorial design with three center points (FFD-II) was conducted as an exploratory assessment to further investigate the most promising operational conditions for AgNP synthesis. The factorial design was intended to provide preliminary information on the effects of the investigated process variables and to identify conditions potentially relevant for subsequent investigations, rather than to establish predictive models or confirmatory optimization. In this step, the effects of AgNO3 concentration (1.0, 1.75, and 2.5 mM), reaction temperature (50, 55, and 60 °C), and reaction time (15, 22.5, and 30 min) were evaluated. The concentration of aqueous extract was kept constant at 5.0 mg mL−1. The corresponding experimental design matrix is presented in Table 1.
2.4. Characterization of K. alvarezii Aqueous Extracts
2.4.1. Total Phenolic Content
Total phenolic compounds (TPCs) were quantified according to the Folin–Ciocalteu method described by Singleton and Rossi (1965) [17]. Absorbance was measured using a UV-Vis spectrophotometer (Unico, UV2150, Dayton, NJ, USA) at 765 nm. The total phenolic content was determined from linear regression equations (Equation (1)) obtained from a gallic acid standard curve prepared at known concentrations (25, 50, 75, 100, 250, and 500 µg mL−1). The results were expressed as gallic acid equivalents (GAEs) per gram of dry weight (DW), and all analyses were performed in triplicate.
where
- A: Mean sample absorbance;
- b: y-intercept of the calibration curve;
- V: Sample volume (mL);
- a: Slope of the calibration curve;
- m: Sample mass (g).
2.4.2. Total Flavonoid Content
Total flavonoid content (TFC) was determined according to the methods described by Christ and Muller (1960) [18] and Barnum (1977) [19]. Absorbance readings were performed using a UV-Vis spectrophotometer (Unico UV2150) at 510 nm. The flavonoid content was quantified using the linear regression equations (Equation (2)) derived from a quercetin standard curve prepared at known concentrations (25, 50, 75, 100, 250, and 500 µg mL−1). The results were expressed as quercetin equivalents (QEs) per gram of dry weight (DW), and all analyses were carried out in triplicate.
where
- A: Mean sample absorbance;
- b: y-intercept of the calibration curve;
- V: Sample volume (mL);
- a: Slope of the calibration curve;
- m: Sample mass (g).
2.4.3. Antioxidant Activity
Calibration curves for the DPPH and ABTS assays were prepared using Trolox standard solutions at concentrations of 60, 80, 100, 150, 173, 200, and 240 µmol L−1.
DPPH
The DPPH radical scavenging assay was performed according to the method described by Brand-Williams, Cuvelier, and Berset (1995) [20]. Briefly, 0.1 mL of sample was added to 2.9 mL of DPPH solution (0.2 mmol L−1 2,2-diphenyl-1-picrylhydrazyl in absolute ethanol), previously adjusted to an absorbance of approximately 0.600 at 515 nm using a UV-Vis spectrophotometer (Unico UV2150). The reaction mixture was homogenized with a vortex mixer and incubated at room temperature for 30 min in the dark. Absorbance readings were subsequently recorded at 515 nm. The percentage of radical scavenging activity was calculated using Equation (3). All assays were performed in triplicate.
where
- Sc: Absorbance of control sample;
- Se: Absorbance of extract sample.
ABTS
The ABTS radical scavenging assay was performed as described by Miller and Rice-Evans (1996) [21] and Re et al. (1999) [22]. The ABTS+ radical cation [2,2′-azino-bis(3-ethylbenzothiazoline-6-sulfonic acid)] was generated using potassium persulfate (2.45 mmol L−1) and ABTS solution (7 mmol L−1), and the absorbance was adjusted to approximately 0.700 at 734 nm using a UV-Vis spectrophotometer (Unico UV2150). For the analysis, 0.1 mL of the sample was added to 4.9 mL of the ABTS+ radical solution. The reaction mixture was homogenized and maintained at room temperature for 6 min in the dark. Subsequently, absorbance readings were recorded at 734 nm. The antioxidant capacity of the samples was determined using Equation (3). All assays were performed in triplicate.
2.5. Characterization of AgNPs
The formation of AgNPs was identified and monitored by UV-Vis spectrophotometry (Femto, Cirrus 80, São Paulo, SP, Brazil). The plasmonic profile was analyzed within the wavelength range of 350–600 nm, allowing the detection of the surface plasmon resonance (SPR) peak of AgNPs between 400 and 450 nm, which is characteristic of spherical AgNPs and indicative of their presence in the colloidal solution [23]. The hydrodynamic diameter, particle size distribution, and polydispersity index (PDI) were determined by Dynamic Light Scattering (DLS) using a ZetaSizer Nano ZS90 (Malvern Panalytical, Malvern, Worcs, UK). Samples were diluted in ultrapure water at ratios of 1:5, 1:10, 1:20, and 1:40 to establish the optimal analytical condition, selecting the dilution that provided the highest signal stability and quality.
Nanoparticle Tracking Analysis (NTA) was conducted using a NanoSight NS300 system (Malvern Panalytical) to determine the particle size distribution and particle concentration of the synthesized AgNPs. Surface charge and colloidal stability were assessed by zeta potential measurements using a ZetaSizer Nano ZS90 (Malvern Panalytical). The morphology and particle size of the AgNPs were further characterized by Transmission Electron Microscopy (TEM) using a JEOL JEM-1400 Flash microscope (JEOL, Akishima, Tokyo, Japan).
Colloidal stability was also monitored over time (0, 3, 6, 24, and 48 h; 7, 15, and 30 days) by UV-Vis spectrophotometry in the wavelength range of 350–600 nm, with particular emphasis on the SPR band.
Furthermore, total phenolic and flavonoid contents and antioxidant activity (DPPH and ABTS) assays were performed to evaluate the bioactive properties of the synthesized AgNPs. The AgNPs were used directly from the synthesis suspension. The pH was adjusted to approximately neutral conditions by adding 1 mol L−1 HNO3 (nitric acid) solution, and the final pH was measured using a calibrated pH meter (Gehaka, PG2000, São Paulo, SP, Brazil) prior to the assays. For comparison purposes, the aqueous extract (10, 7.5 and 5.0 mg mL−1) and AgNO3 solutions (2.5, 1.75, and 1.0 mM) used for the green synthesis were evaluated separately as controls. The extract and AgNO3 solutions were used directly, without pH adjustment, with the AgNO3 solution serving as a negative control.
2.6. Data Analysis
All results are expressed as mean ± standard deviation. The effects of the process variables on each response were evaluated by analysis of variance (ANOVA) of the full factorial designs using Statistica software (v7.0). Statistical significance of the effects and regression models was established at p < 0.05 by comparing the calculated F-value with the corresponding critical F-value.
3. Results and Discussion
3.1. Characterization of K. alvarezii Aqueous Extracts
The antioxidant activity and the contents of total phenolics and flavonoids in K. alvarezii aqueous extracts varied with the concentration used for AgNP synthesis (Table 2). Overall, increasing extract concentration led to higher values for all parameters evaluated, with the highest antioxidant activity and bioactive compound contents observed at 10.0 mg mL−1.
Table 2.
Antioxidant activity (DPPH and ABTS) and total phenolic and flavonoid contents of aqueous extracts at the concentrations used for AgNP synthesis.
The DPPH radical scavenging activity ranged from 2.1 to 2.5%, whereas the antioxidant activity determined by the ABTS assay ranged from 4.4 to 8.0%. At all concentrations evaluated, ABTS values were higher than those obtained with the DPPH assay, indicating greater capacity of the extracts in neutralizing the ABTS+ radical than the DPPH radical. This difference may be attributed to the chemical characteristics of the radicals used, as the ABTS assay is more sensitive to hydrophilic compounds [24], which predominate in aqueous macroalgal extracts [25].
Total phenolic content ranged from 1.15 to 1.63 mg GAE g−1 DW, showing an increasing trend with increasing extract concentration. Similarly, flavonoid content was highest at 10.0 mg mL−1 (8.50 mg QE g−1 DW), decreasing to 7.3 and 3.3 mg QE g−1 DW at 7.5 and 5.0 mg mL−1, respectively. The higher concentrations of phenolic metabolites and flavonoids were associated with greater antioxidant activity, as these compounds act as electron and hydrogen donors, promoting the neutralization of reactive species [26].
3.2. Green Synthesis of AgNPs
The two-stage FFD approach was employed as a screening tool to evaluate the effect of multiple process variables (pH, extract concentration, AgNO3 concentration, temperature, and time) while minimizing the number of trial-and-error experiments. The primary criterion for selecting synthesis conditions was the qualitative formation of a well-defined surface plasmon resonance band, defined as a single, symmetric absorption peak within the 400 to 450 nm range. This is a direct and widely accepted spectroscopic indicator of AgNP formation. Total phenolic and flavonoid contents and antioxidant activity (DPPH, ABTS) were assessed as complementary bioactivity characterization of the resulting nanoparticles, rather than as the primary optimization target.
3.2.1. Step 1: Preliminary Evaluation of Factors Influencing AgNP Synthesis
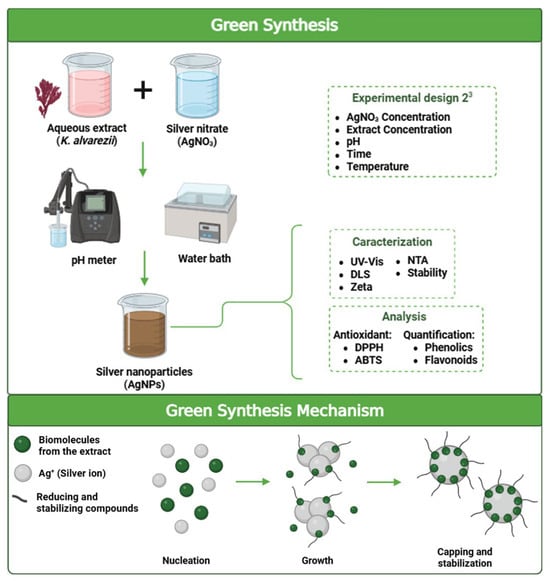
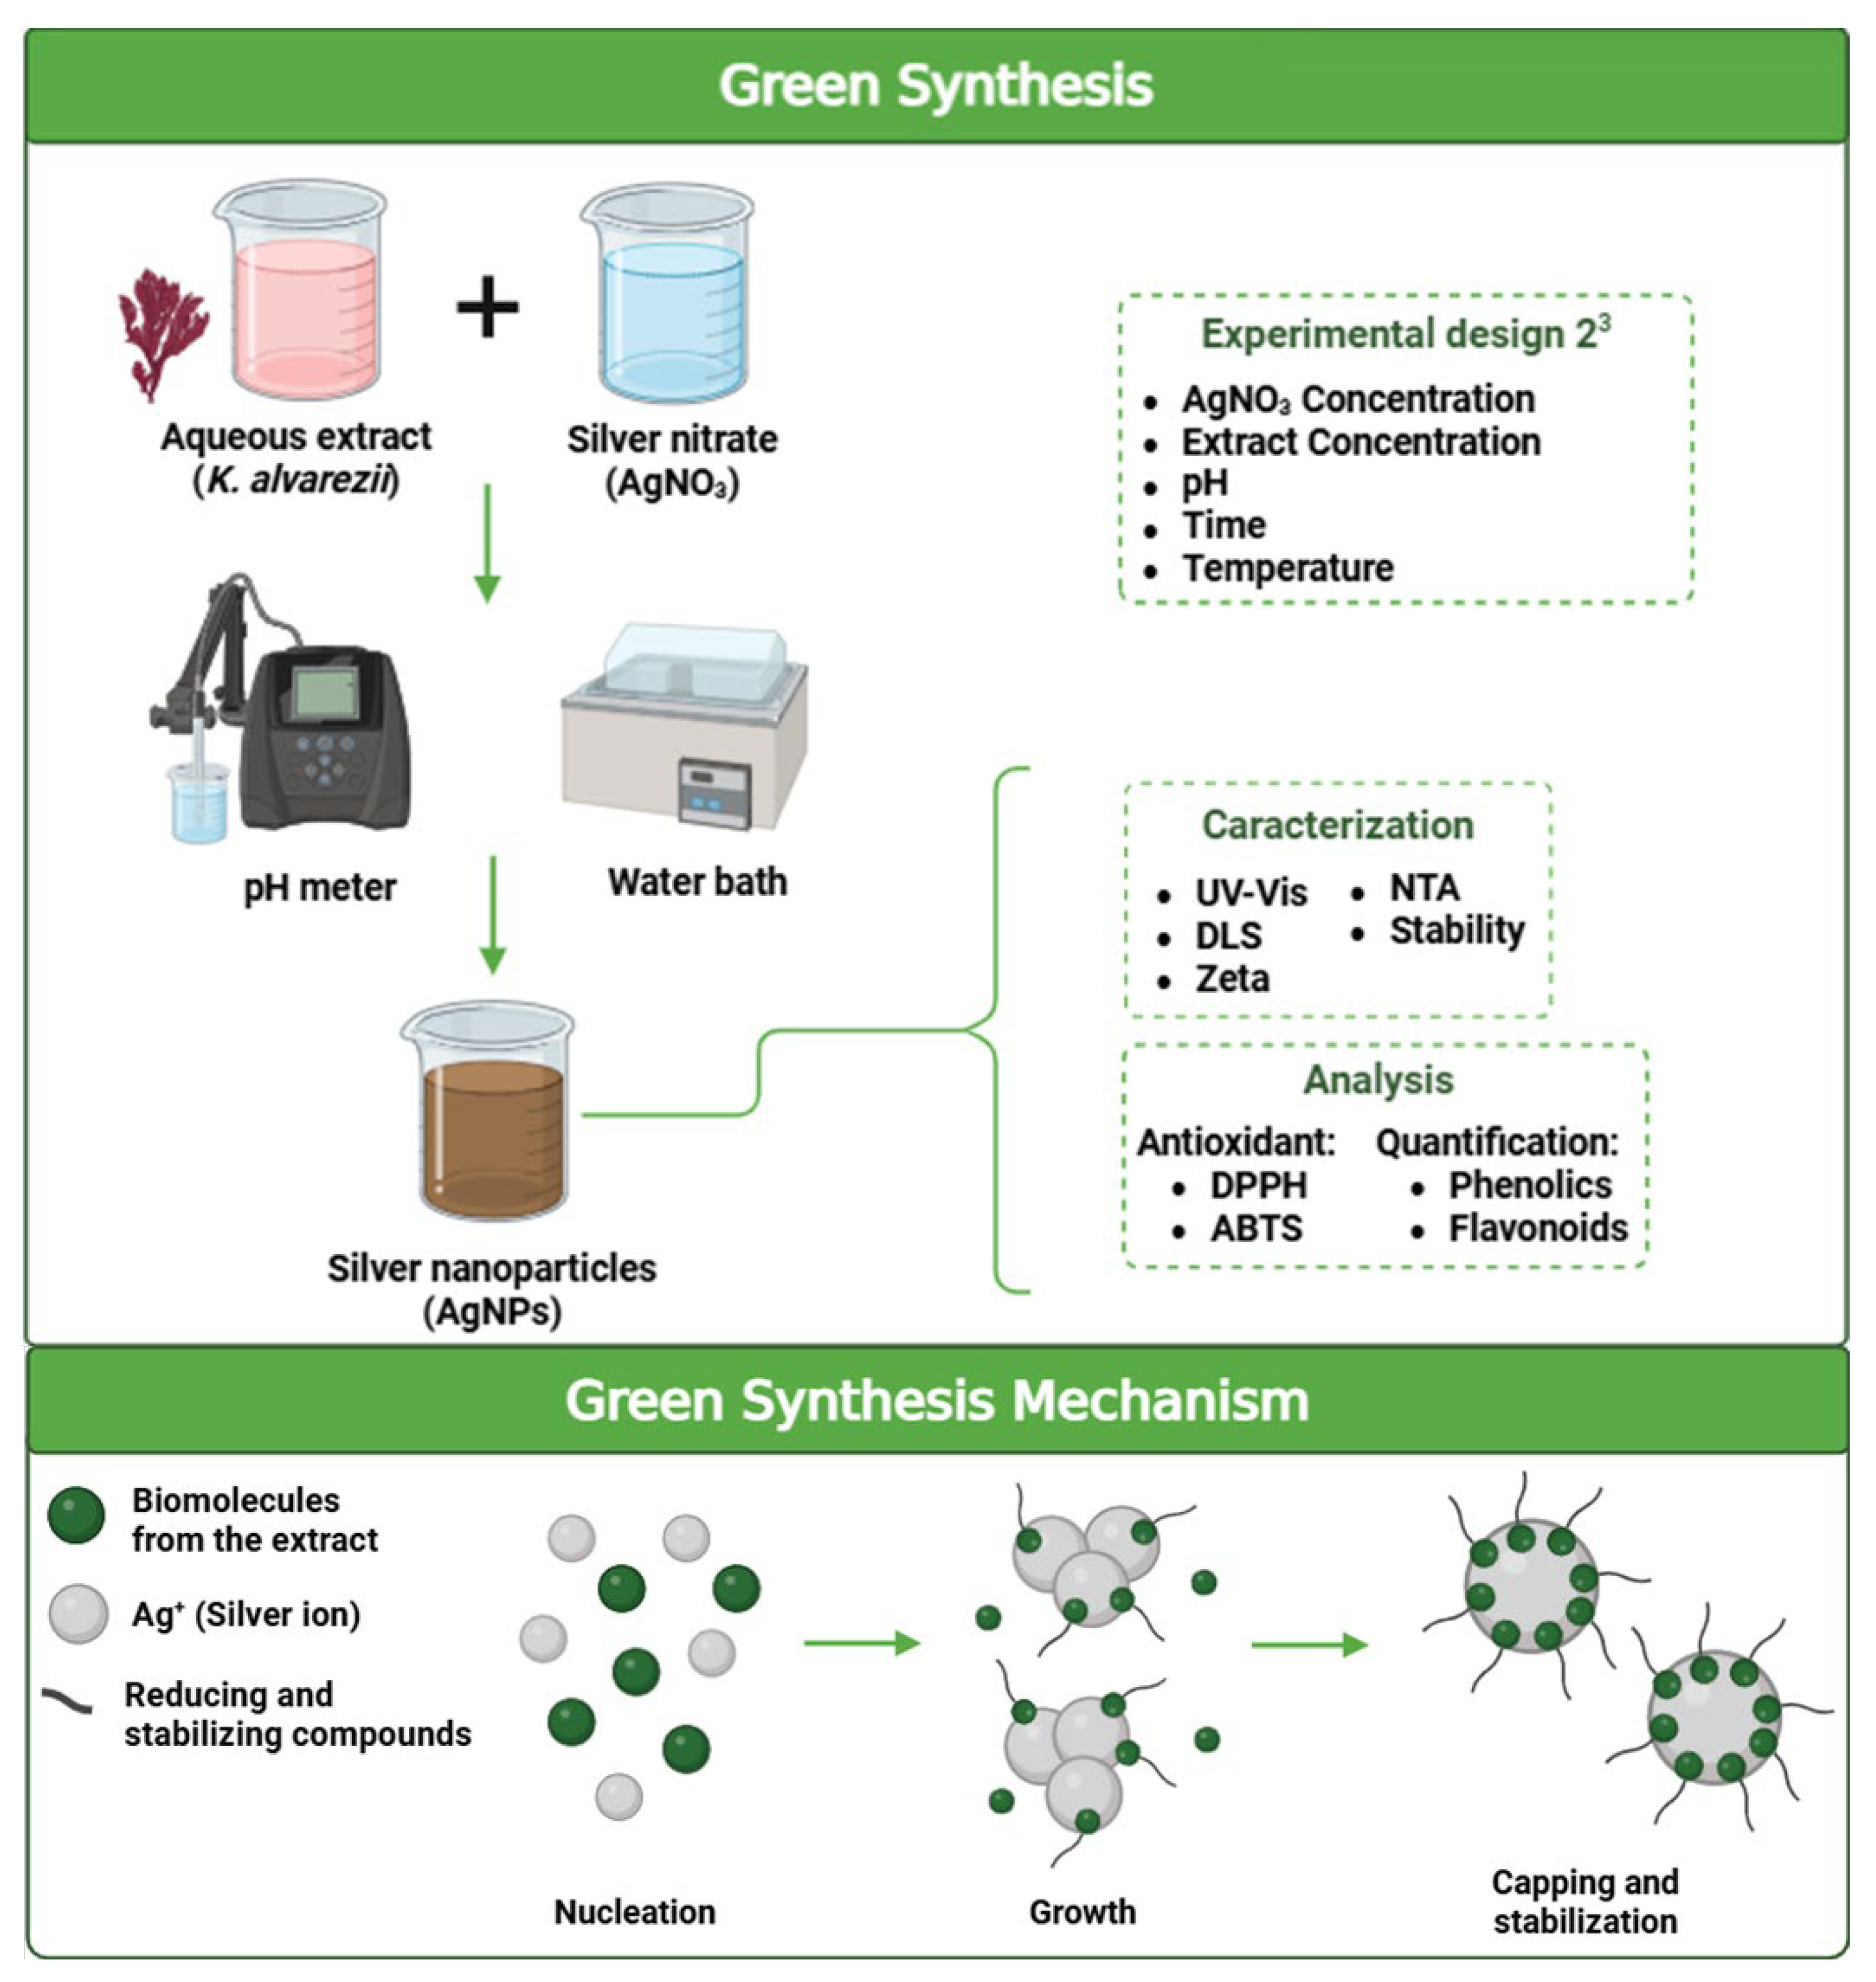
The influence of different variables was analyzed to identify characteristic plasmonic peaks of AgNPs and determine the selected conditions for nanoparticle synthesis. The formation of AgNPs could be visually observed through the color change in the solution, induced by the phytochemicals present in the aqueous extract, which act as electron donors in the reduction of Ag+ ions (Figure 1). This phenomenon is associated with SPR, in which free electrons on the metallic nanoparticles interact with light, generating characteristic absorption bands whose intensity increases over time, resulting in color variations from colorless to dark brown [2,27]. The excitation of the SPR peak at approximately 420 nm, observed by UV-Vis spectrophotometry, is consistent with the reduction of Ag+ to Ag0 mediated by compounds present in the aqueous extract and is widely used as an indirect spectroscopic indicator of AgNP formation [2]. Furthermore, the broadening of the SPR band also provides important information regarding nanoparticle characteristics, including size, aggregation, shape, coating type, and polydispersity, which are essential parameters for the standardization of the green synthesis process [10,14].
Figure 1.
Schematic representation of the green synthesis of AgNPs and the mechanism involved in the reduction of Ag+ ions.
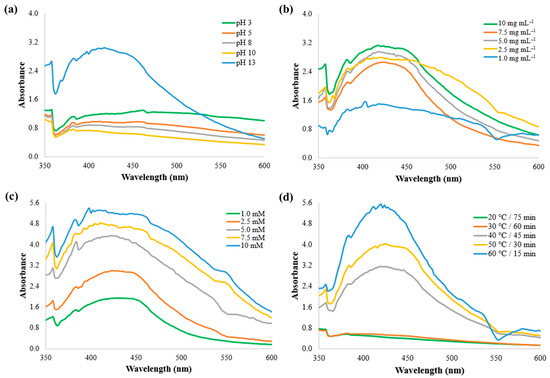
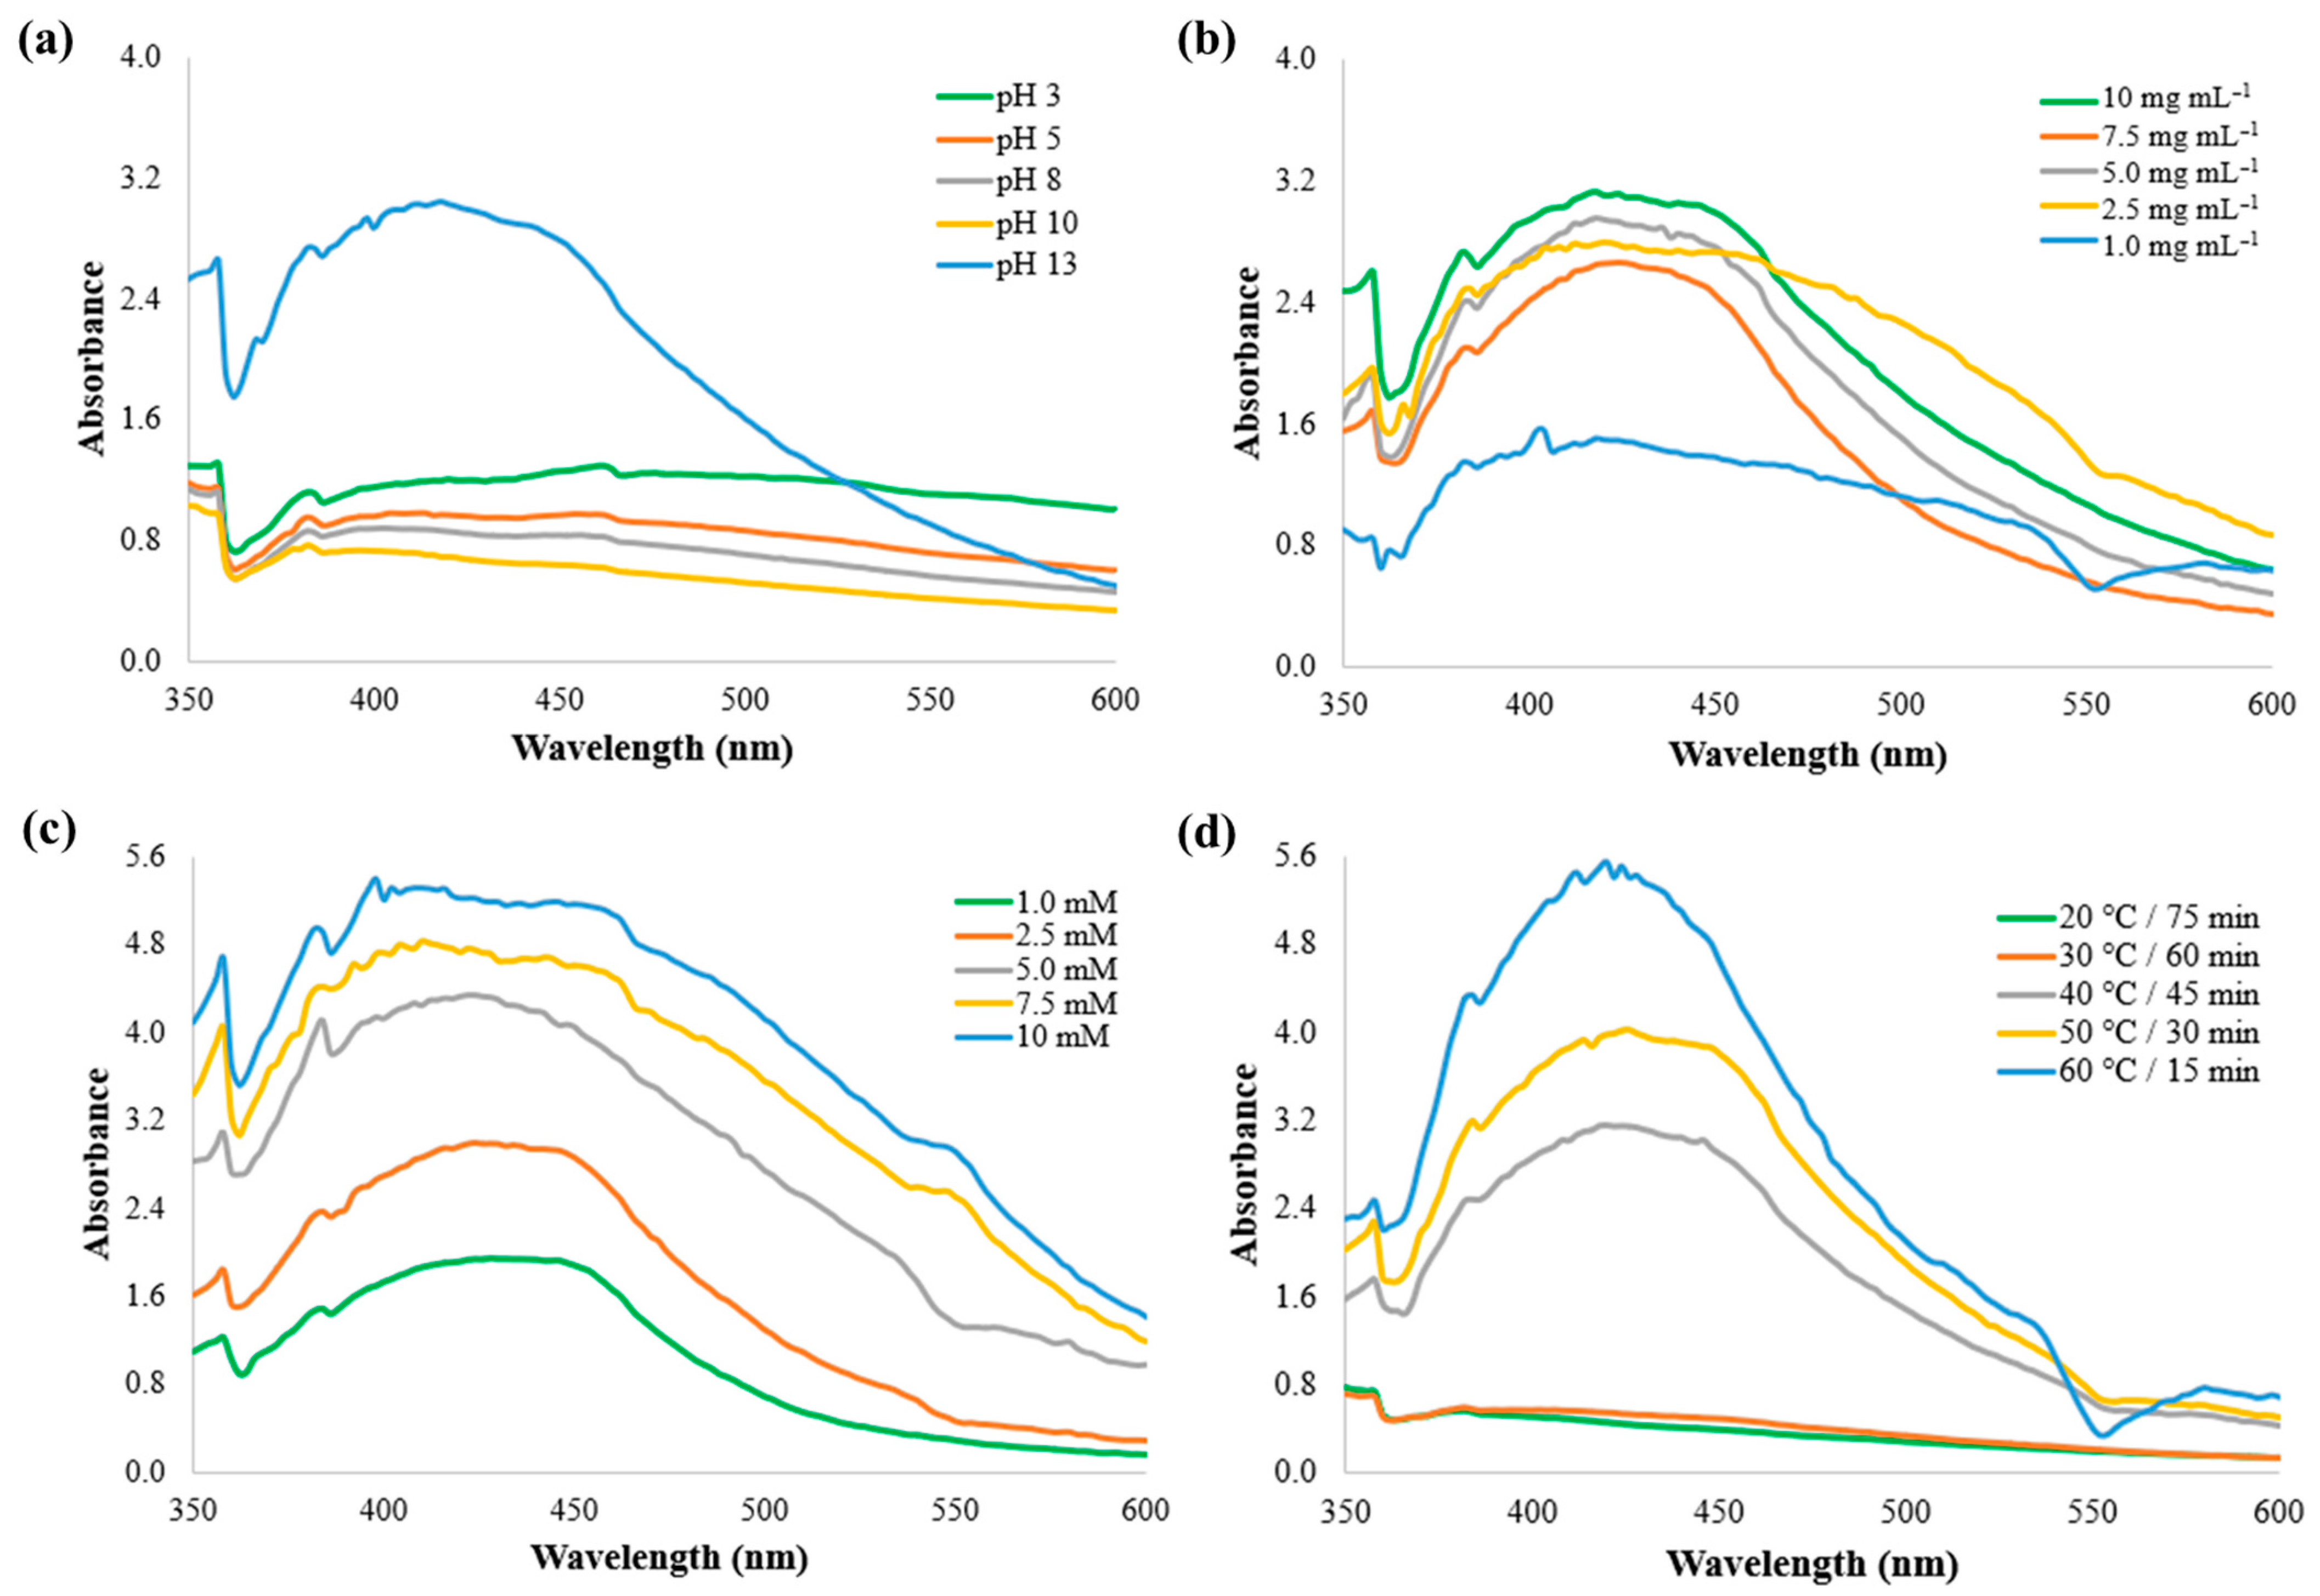
The pH was adjusted by adding 1 mol L−1 NaOH (sodium hydroxide) solution, and the final pH was measured using a calibrated pH meter (Gehaka PG2000). Among the pH values evaluated, alkaline pH (13) was the only condition that exhibited a characteristic absorbance peak, indicating the formation of AgNPs (Figure 2a). This result corroborates previous studies demonstrating that high pH values contribute to preventing nanoparticle aggregation, while also enhancing the reducing power of the functional groups present in the extract, thereby promoting particle capping and stabilization [4,13]. The evaluation of the influence of aqueous extract concentration demonstrated that concentrations of 5.0, 7.5, and 10 mg mL−1 exhibited the most well-defined plasmonic peaks, indicating nanoparticle formation (Figure 2b). The relationship between aqueous extract concentration and AgNP production can be attributed to the increased availability of reducing and stabilizing compounds present in the reaction medium. Thus, intermediate concentrations favor particle formation and stabilization, whereas excessively high concentrations may compromise the definition of plasmonic peaks due to nanoparticle aggregation. This behavior may be associated with the rapid nucleation of unstable particles, which interact with free Ag+ ions in the reaction mixture, resulting in the formation of larger AgNPs [4,14,28,29,30].
Figure 2.
UV-Vis spectrophotometric monitoring of AgNP formation under different synthesis conditions: (a) pH, (b) aqueous extract concentration, (c) silver nitrate concentration, and (d) reaction temperature and time.
The evaluation of the influence of silver nitrate concentration on AgNP synthesis demonstrated that increasing concentration led to higher plasmonic peak intensity, indicating greater nanoparticle formation in the reaction solution. However, a decrease in peak definition was observed at higher concentrations, suggesting particle aggregation. Therefore, concentrations of 1 mM and 2.5 mM were selected to standardize the process, as they exhibited more well-defined plasmonic peaks and more controlled nanoparticle formation (Figure 2c). This behavior may be related to the increased size and aggregation of AgNPs at higher concentrations of AgNO3, thereby compromising synthesis [4,11].
The analysis of the influence of temperature and reaction time revealed that conditions of 40, 50, and 60 °C, controlled using a water bath (Inbras, ALB800S, Jardinópolis, SP, Brazil), combined with reaction times of 45, 30, and 15 min, resulted in well-defined plasmonic peaks within the characteristic wavelength range (Figure 2d), indicating nanoparticle formation. These conditions were therefore selected as they favored the synthesis and stabilization of AgNPs.
Lower temperatures (20 and 30 °C) were also ineffective for nanoparticle formation, highlighting the direct influence of temperature on the green synthesis of AgNPs. Increasing the temperature enhances the reaction rate and particle production, thereby controlling their morphological characteristics, such as size and shape. Furthermore, higher temperatures promote a faster reduction of Ag+ ions by bioactive compounds in the aqueous extracts due to increased molecular kinetic energy, thereby favoring the nucleation and growth of nanoparticles [4,6,11].
Reaction incubation time, together with temperature, influences the synthesis of AgNPs. An increase in contact time accelerates particle biosynthesis; therefore, as the incubation period is extended, an enhancement in the intensity of the SPR band is observed, indicating an increase in the number of formed and non-aggregated AgNPs [7,8,29]. Comparison of the absorption spectra obtained for all tested variables enabled identification of the conditions that exhibited the most intense plasmonic peak in the characteristic region for AgNP formation (~420 nm). The most favorable conditions were pH 13; aqueous extract concentrations of 5.0, 7.5, and 10 mg mL−1; AgNO3 concentrations of 1.0 and 2.5 mM; and time-temperature combinations of 40 °C for 45 min, 50 °C for 30 min, and 60 °C for 15 min. These parameters were selected for subsequent analyses and the application of factorial designs.
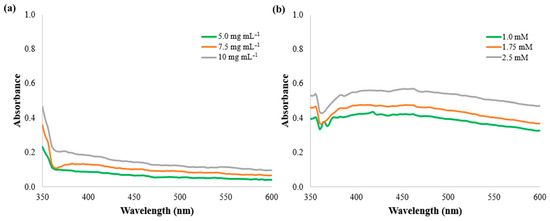
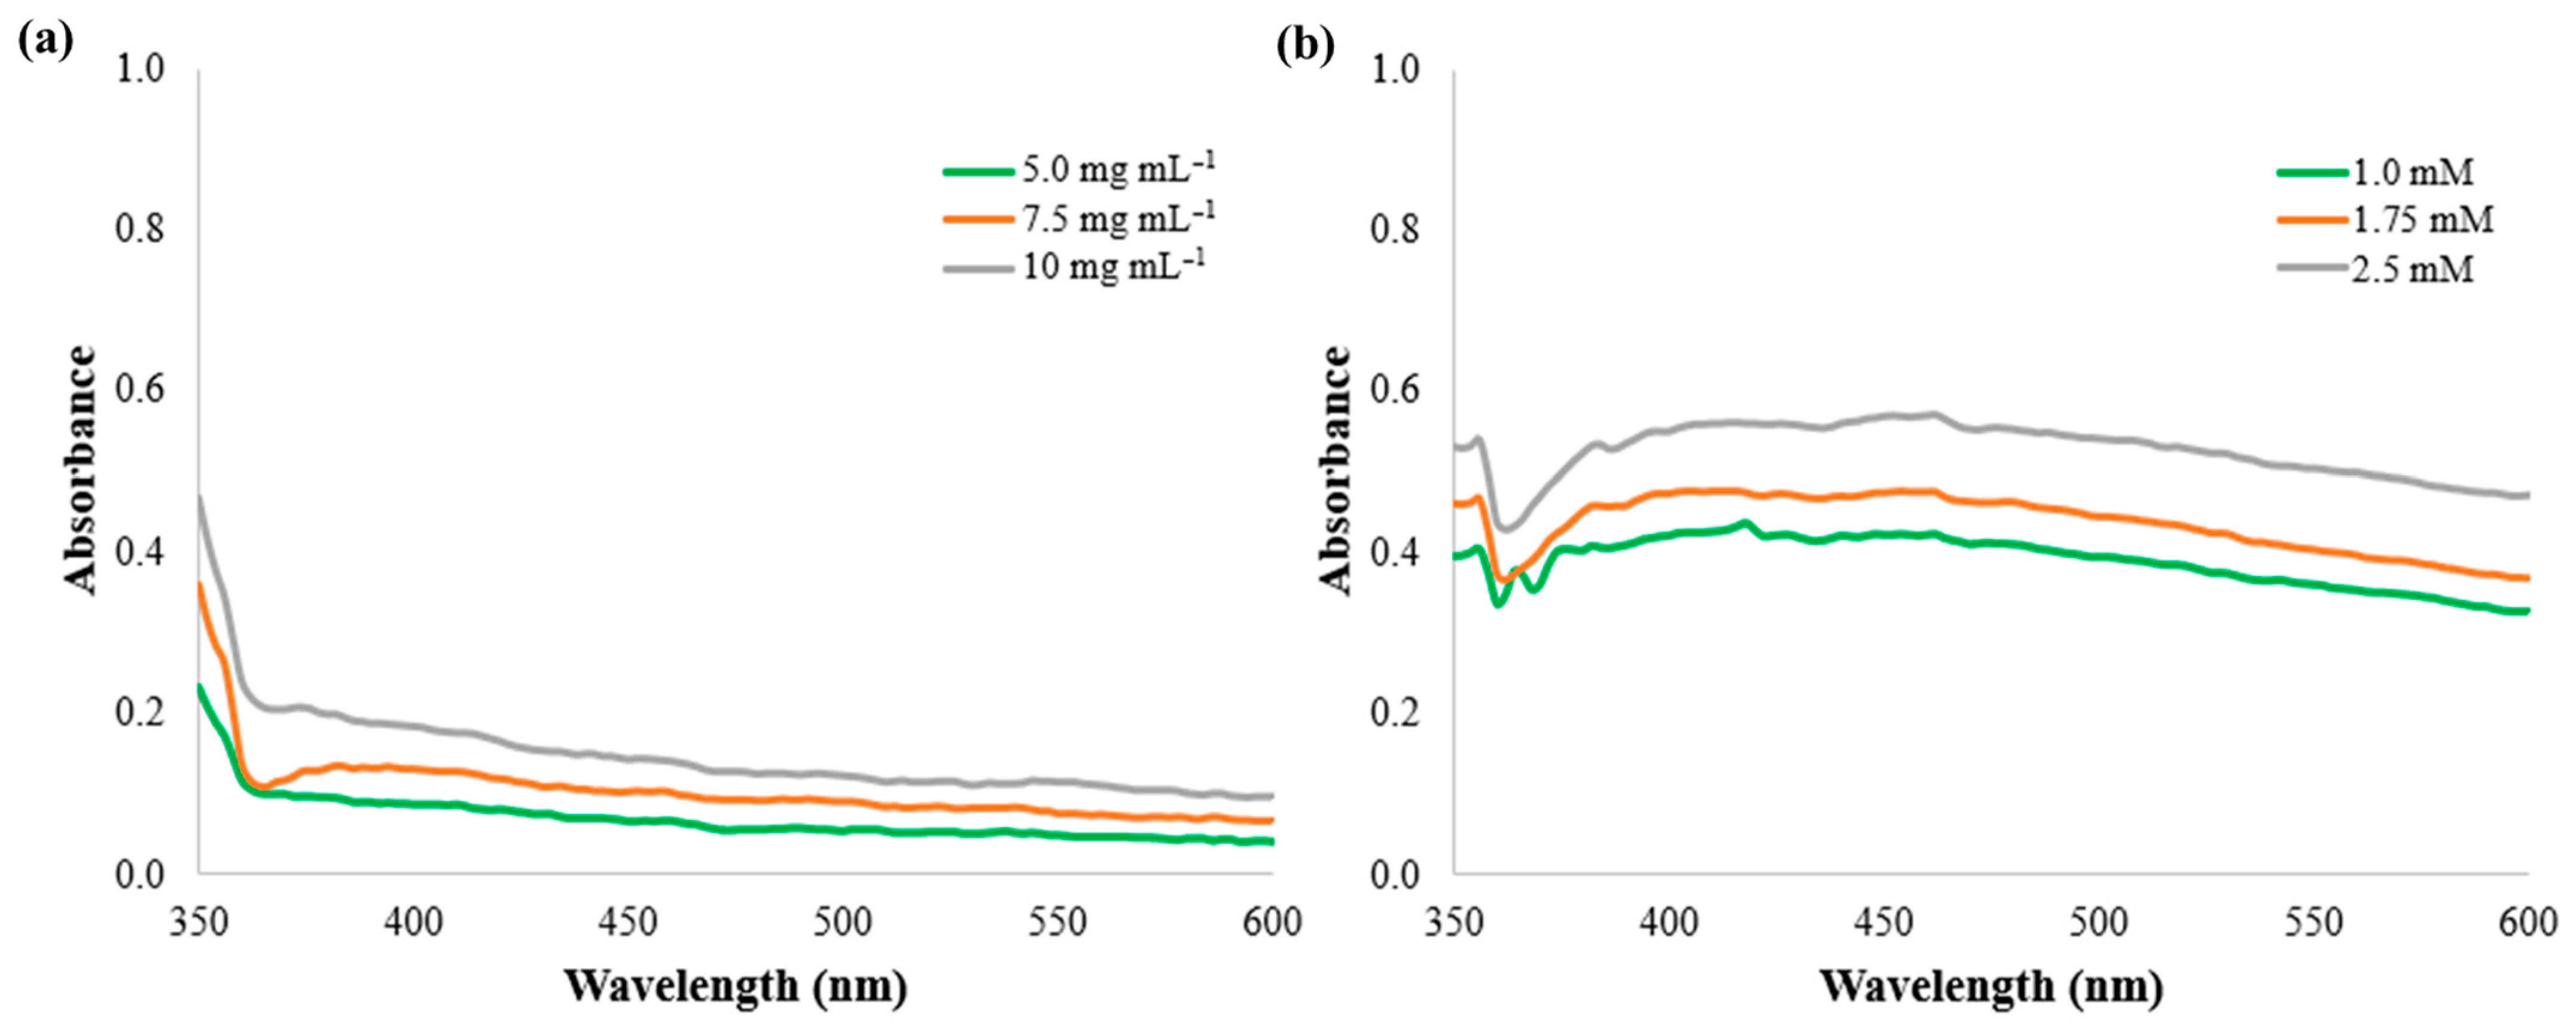
To confirm that nanoparticle formation occurred only after the green synthesis reaction, the AgNO3 solution (1.0, 1.75, and 2.5 mM) and the aqueous extract (5, 7.5, and 10 mg mL−1) were individually analyzed by UV-Vis spectroscopy. Neither solution exhibited the characteristic SPR around 420 nm, indicating the absence of AgNPs (Figure 3). These results confirm that the plasmonic peak observed in the reaction mixtures is associated with the formation of AgNPs, resulting from the interaction between Ag+ ions and the bioactive compounds present in the aqueous extract of K. alvarezii.
Figure 3.
UV-Vis spectra of the concentrations of aqueous extract of K. alvarezii (a) and AgNO3 solution (b) used in the green synthesis.
3.2.2. Step 2: Evaluation of Synthesis Parameters Using a Full Factorial Design with Three Center Points (FFD-I)
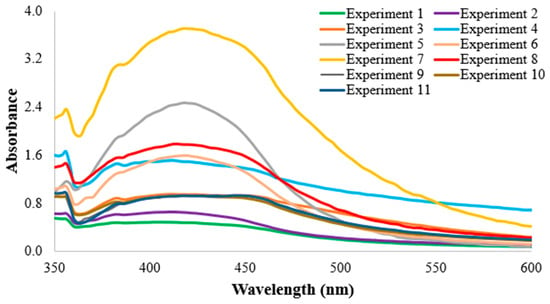
The 23 full factorial design with three center points (FFD-I) was constructed based on the evaluation of three independent variables, aqueous extract concentration, AgNO3 concentration, and temperature, the latter combined with a temperature-dependent reaction time. Based on the analysis of the UV-Vis spectra, two experimental conditions were identified as yielding the highest absorption intensities and the most well-defined SPR band characteristic of AgNPs (Figure 4). These conditions corresponded to experiments 5 and 7. Experiment 5 was performed using an aqueous extract concentration of 5.0 mg mL−1, AgNO3 at 1.0 mM, and a temperature of 60 °C, whereas experiment 7 employed the same aqueous extract concentration (5.0 mg mL−1), AgNO3 at 2.5 mM, and a temperature of 60 °C.
Figure 4.
UV-Vis spectrophotometric monitoring of AgNP formation under the experimental conditions evaluated in the FFD-I design.
The AgNPs obtained under both conditions also exhibited relevant antioxidant activity (Table 3). In experiment 5, DPPH and ABTS radical scavenging activities of 15.6% and 16.5%, respectively, were observed, along with total phenolic and flavonoid contents of 2.4 mg GAE g−1 DW and 14.5 mg QE g−1 DW, respectively. In contrast, the AgNPs produced in experiment 7 exhibited greater antioxidant capacity, with DPPH and ABTS radical scavenging activities of 26.6% and 33.7%, respectively, as well as total phenolic and flavonoid contents of 2.7 mg GAE g−1 DW and 44.2 mg QE g−1 DW, respectively.
Table 3.
Antioxidant activity (DPPH and ABTS) and total phenolic and flavonoid contents of AgNPs obtained under the conditions evaluated in the FFD-I experimental design.
Analysis of variance (ANOVA) indicated that the calculated F values for DPPH and ABTS radical scavenging activities, as well as for total phenolic content, were lower than the corresponding critical F values (Table 4). These results demonstrate that the evaluated synthesis parameters did not significantly affect these response variables within the investigated experimental range. In contrast, flavonoid content exhibited a calculated F value higher than the critical F value, indicating a significant effect of the experimental factors on this response. This result suggests that flavonoid incorporation and/or retention during AgNP synthesis is more sensitive to variations in synthesis conditions than antioxidant activity or total phenolic content. As a complementary analysis, ANOVA was performed to evaluate whether the same process variables also influenced the bioactivity of the resulting AgNPs (Table 4).
Table 4.
ANOVA of the effects of the independent variables on antioxidant activity (DPPH and ABTS) and on the total phenolic and flavonoid contents of AgNPs obtained in the FFD-I experimental design.
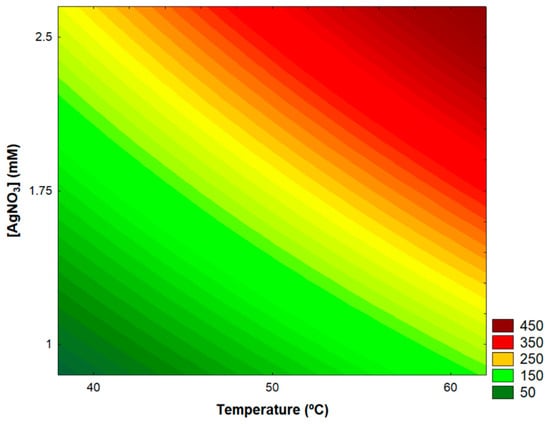
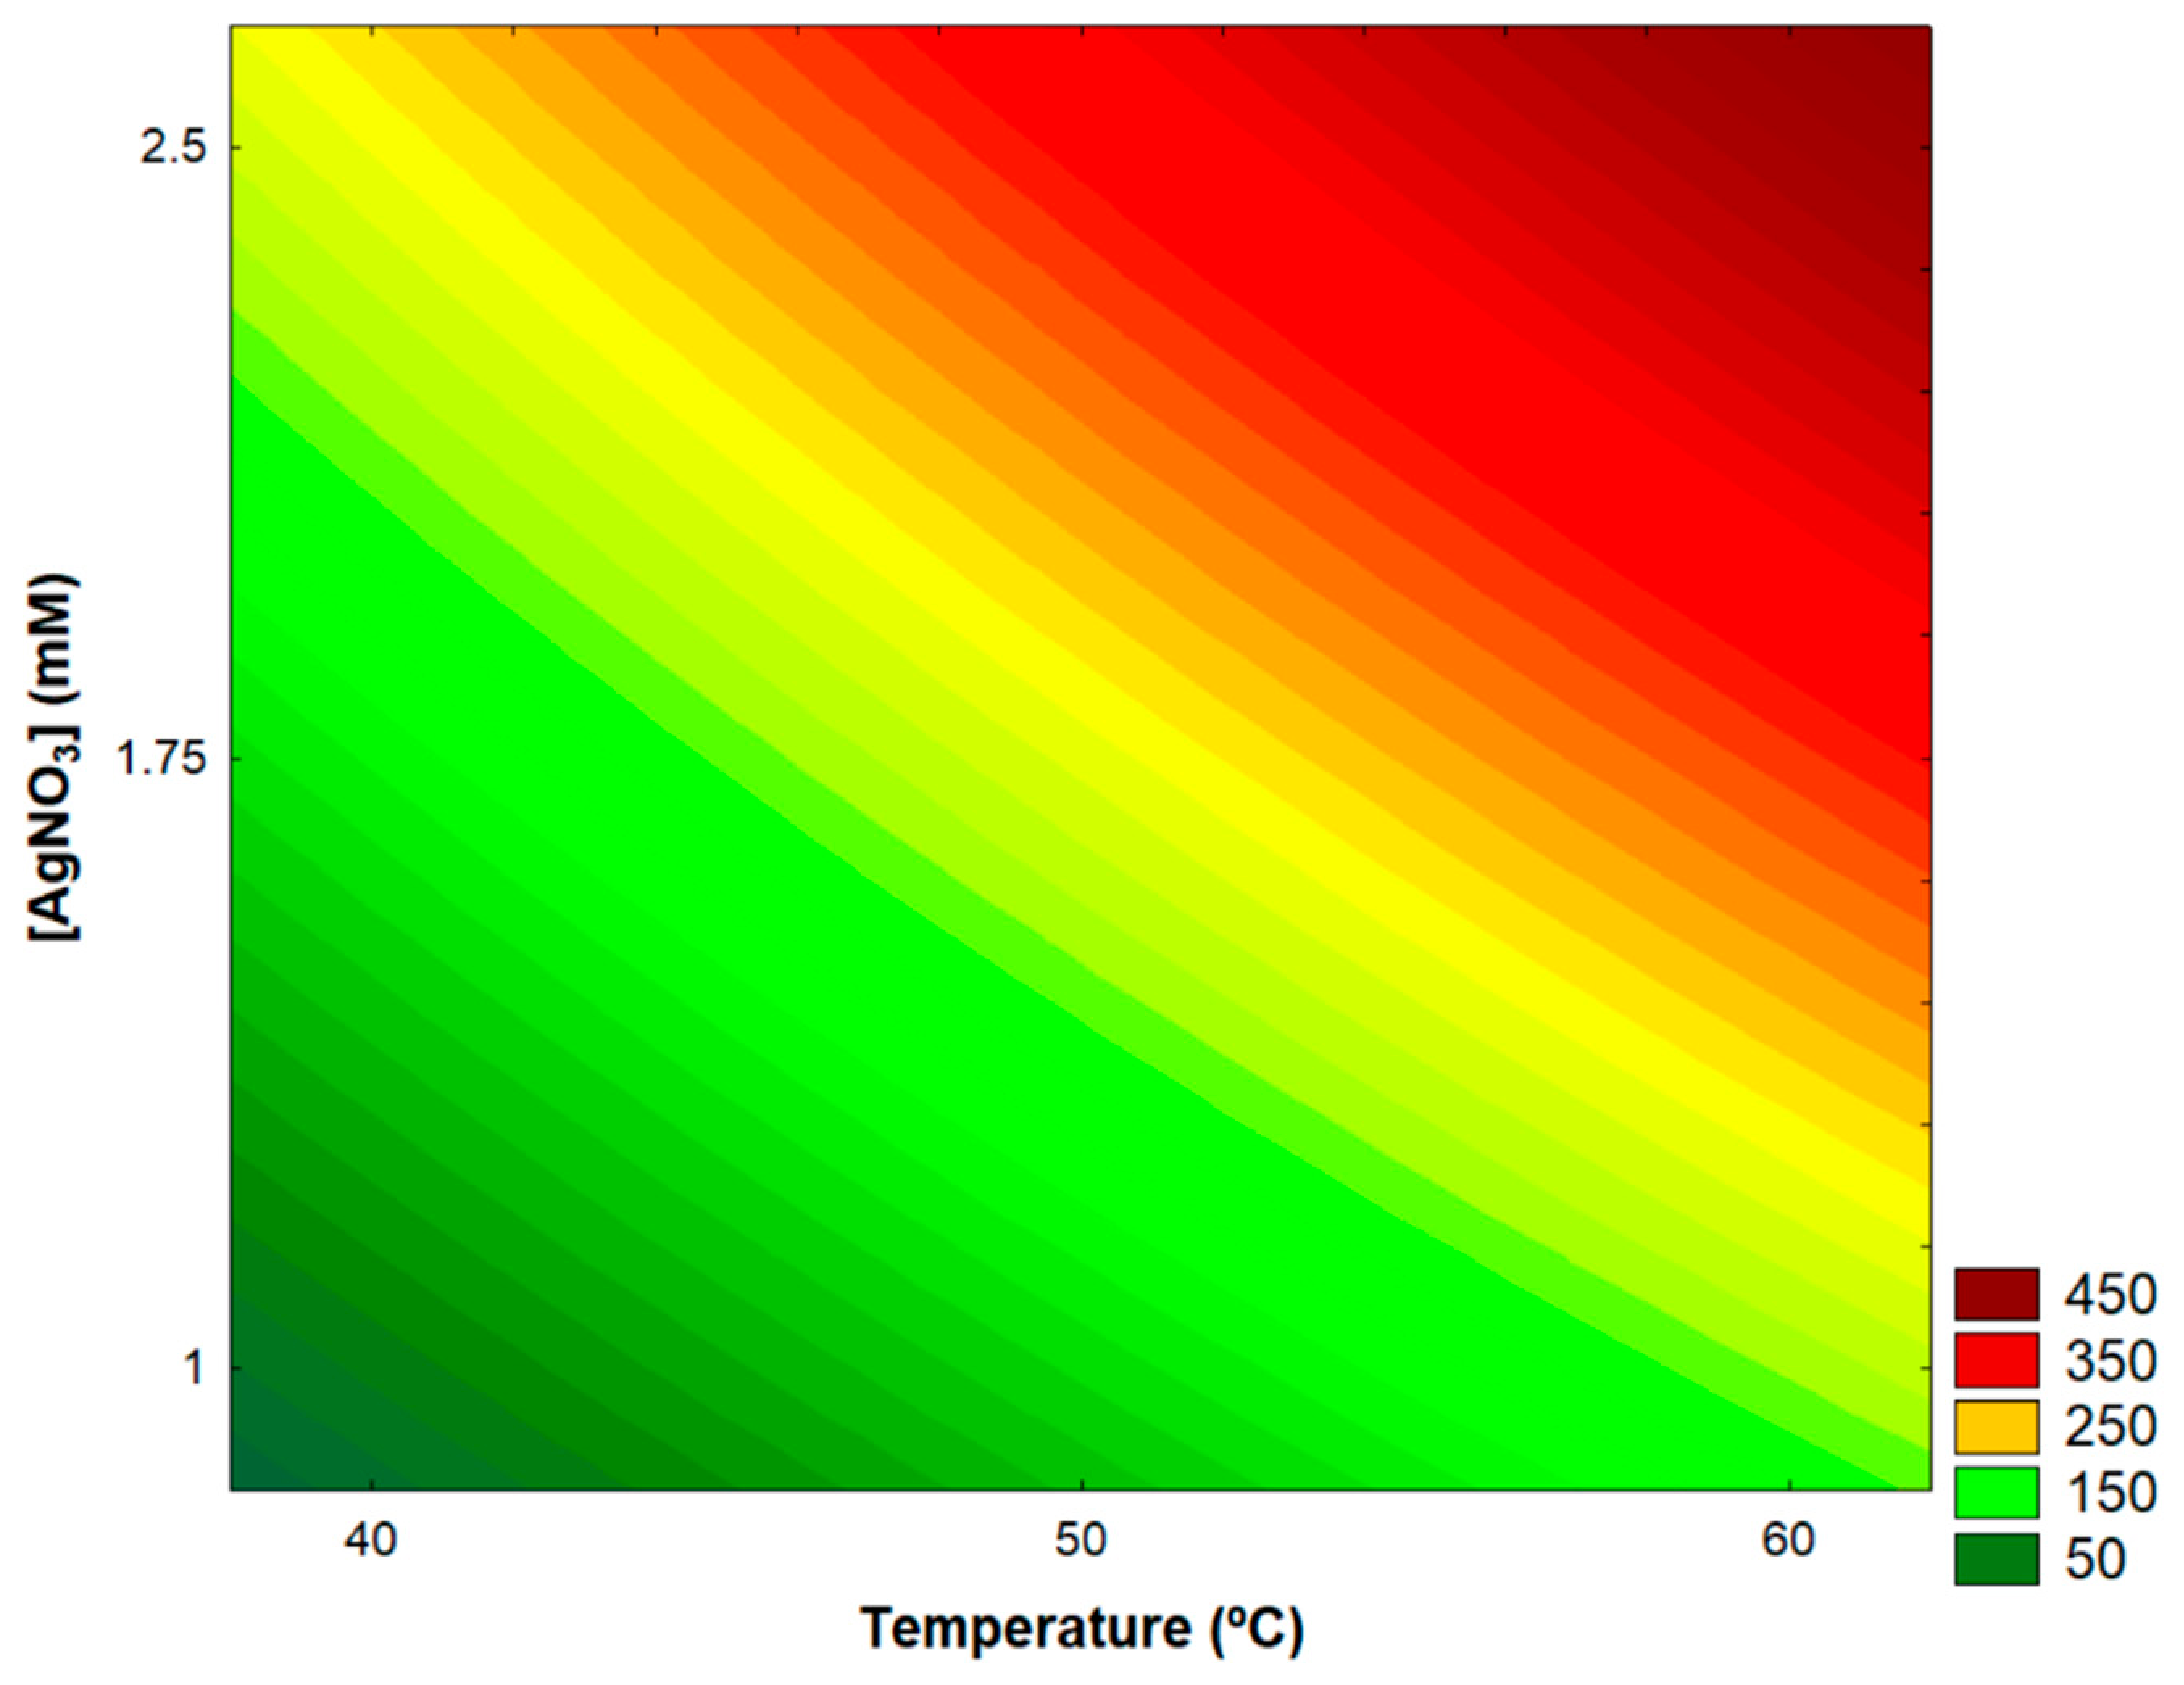
The analysis of the estimated effects revealed that AgNO3 concentration was the only factor that significantly affected the evaluated response variable (p = 0.008292) (Table 5). The positive estimated effect (16.82492) indicates that increasing the AgNO3 concentration increased the response, highlighting the importance of silver ion availability during nanoparticle synthesis. This behavior is likely associated with enhanced nucleation and growth processes, which directly influence nanoparticle formation. In contrast, aqueous extract concentration (p = 0.290056) and temperature (p = 0.114919) did not have statistically significant effects within the experimental range investigated. Likewise, none of the interaction terms were statistically significant (p > 0.05). However, the interaction between aqueous extract concentration and temperature had a p-value close to the significance threshold (p = 0.052738), suggesting a potential interaction effect that warrants further investigation. The negative estimated effect observed for this interaction indicates that the simultaneous increase in both factors tends to decrease the response relative to their individual effects (Figure 5).
Table 5.
Estimated effects and experimental p-values of the independent variables and their interactions on flavonoid content in the FFD-I experimental design.
Figure 5.
Contour plot of flavonoid content as a function of temperature and silver nitrate concentration at an aqueous extract concentration of 5 mg mL−1.
Overall, these findings demonstrate that the AgNO3 concentration was the primary factor influencing the response variable, whereas the remaining factors and their interactions had limited effects under the experimental conditions evaluated.
Overall, the results obtained from the FFD-I demonstrated that AgNO3 concentration and temperature (jointly with its associated reaction time) were the most relevant factors affecting AgNP synthesis, primarily influencing flavonoid content. Furthermore, the evaluated conditions enabled the identification of experimental combinations that were more favorable for obtaining nanoparticles with enhanced spectral characteristics and antioxidant activity. Based on these findings, a second experimental design (FFD-II) was conducted, incorporating reaction time as an additional variable to further standardize the synthesis process and more precisely define the conditions for the production of AgNPs.
3.2.3. Step 3: Extended Evaluation of Synthesis Parameters Using a Full Factorial Design with Three Center Points (FFD-II)
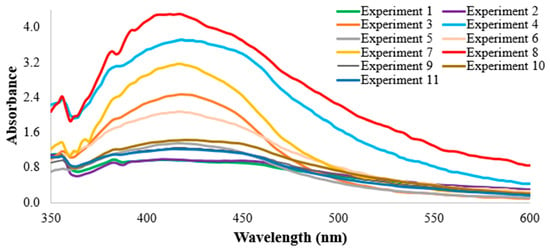
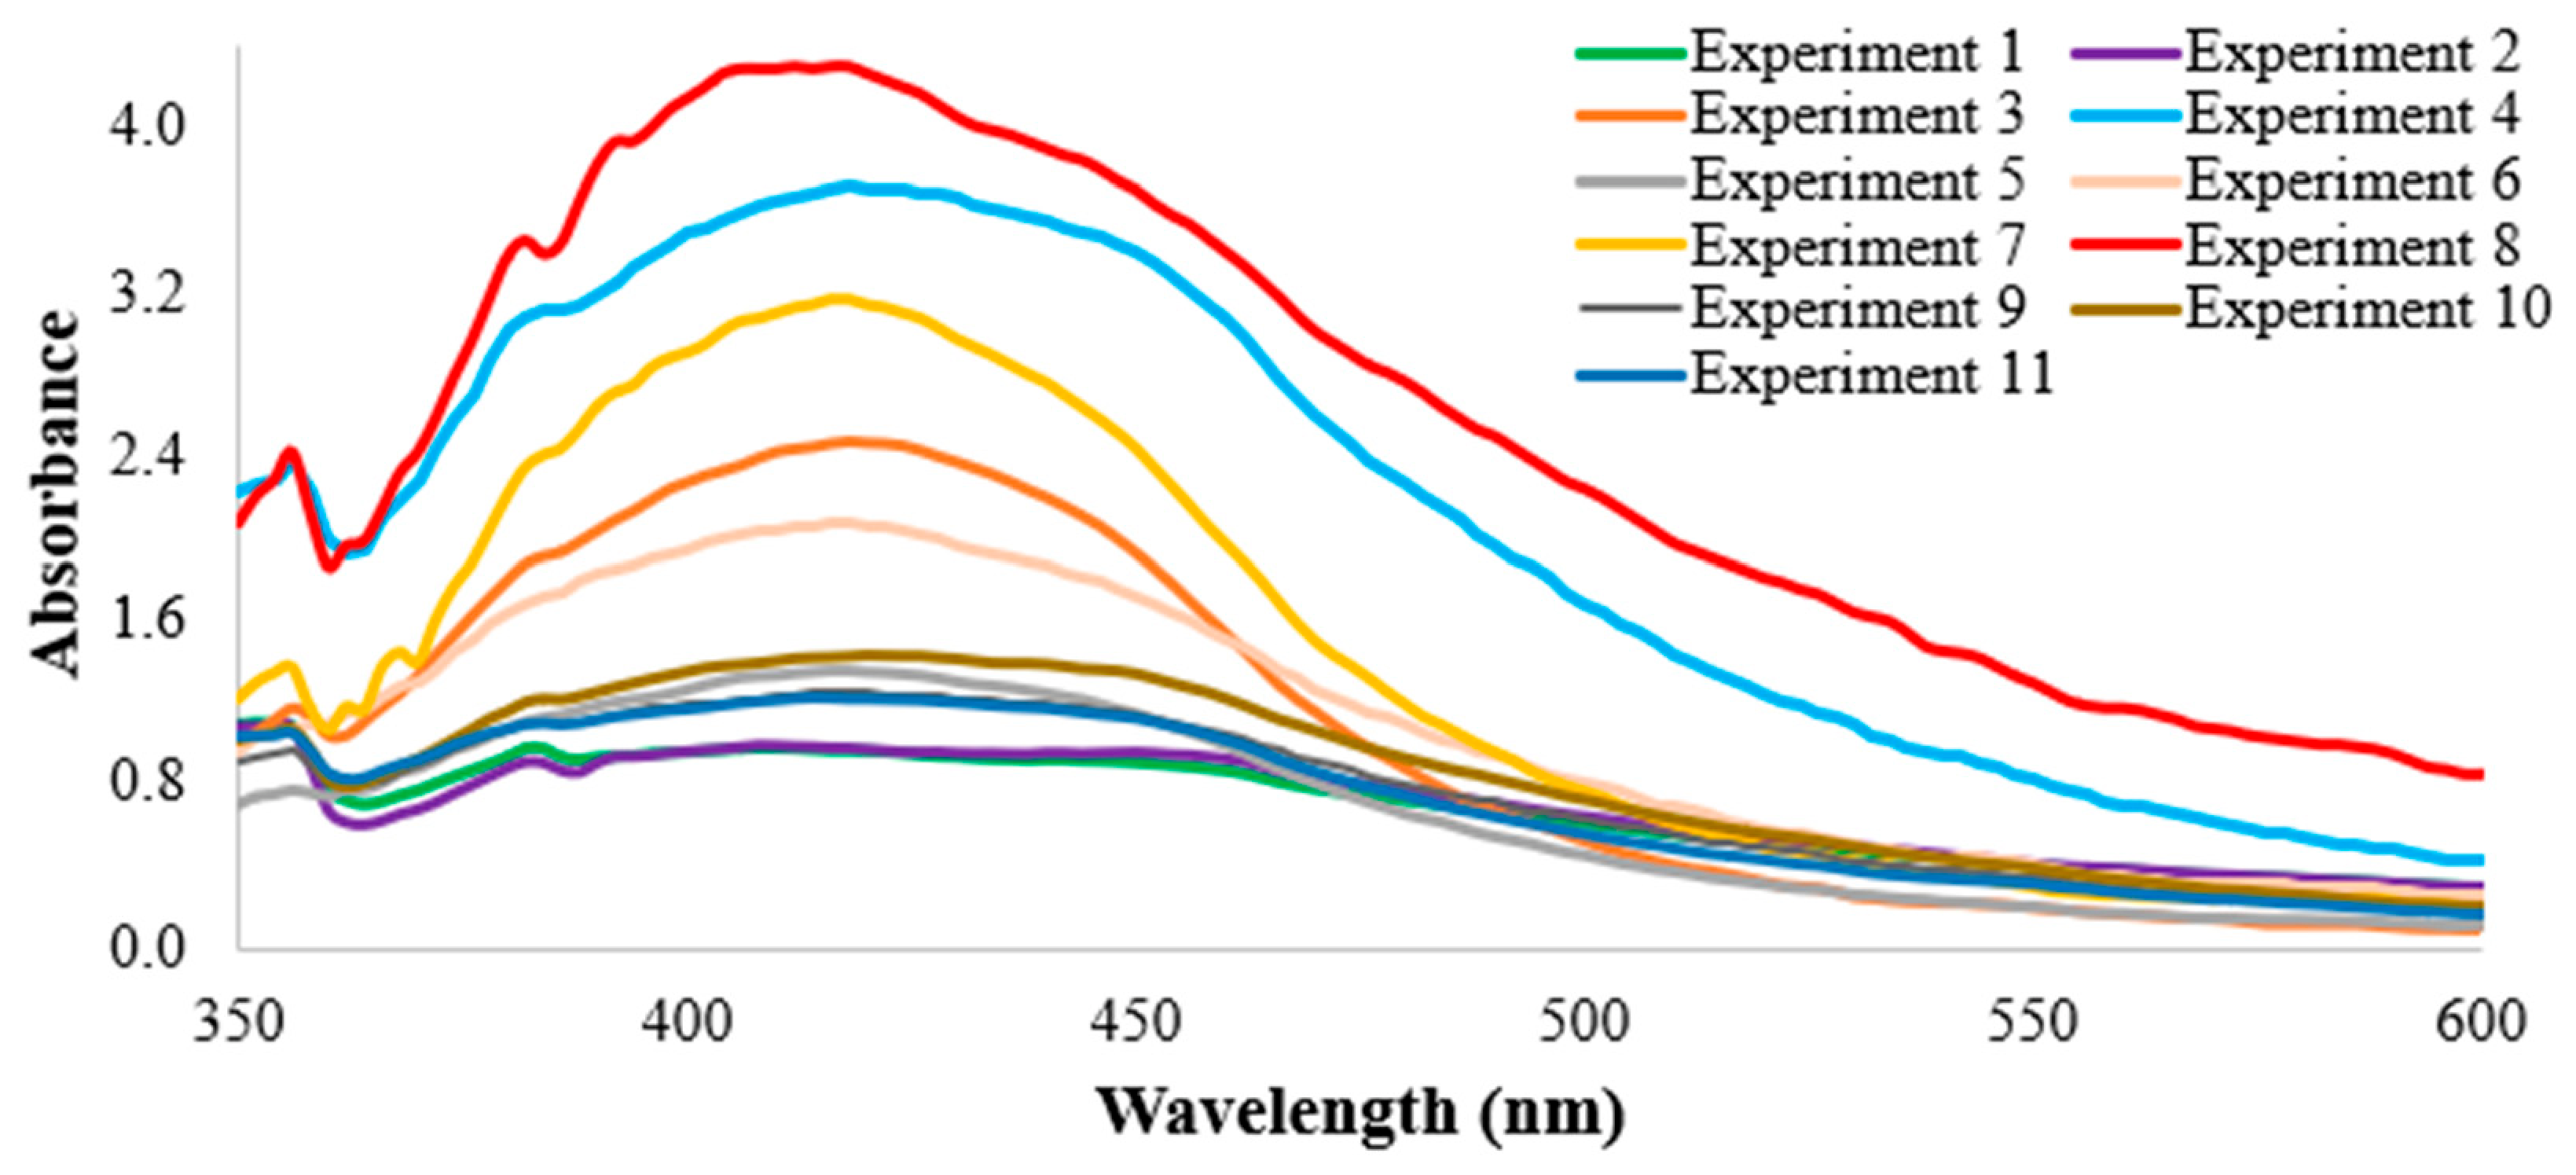
The best SPR results obtained from the FFD-II matrix were observed in experiments 3 (1 mM AgNO3, 60 °C, and 15 min reaction time) and 4 (2.5 mM AgNO3, 60 °C, and 15 min reaction time), which had also been selected in the first experimental matrix, as well as in experiments 6 (2.5 mM AgNO3, 50 °C, and 30 min reaction time) and 7 (1 mM AgNO3, 60 °C, and 30 min reaction time), which were specific to the second matrix. These experiments exhibited more well-defined SPR bands and, under the evaluated conditions, showed enhanced antioxidant activity and higher contents of phenolic compounds and flavonoids.
Experiment 6 exhibited DPPH and ABTS radical scavenging activities of 52% and 51.7%, respectively, along with total phenolic and flavonoid contents of 5.6 mg GAE g−1 DW and 54.6 mg QE g−1 DW, respectively. In contrast, experiment 7 showed DPPH and ABTS radical scavenging activities of 29.7% and 26.1%, respectively, as well as total phenolic and flavonoid contents of 3.0 mg GAE g−1 DW and 12.3 mg QE g−1 DW, respectively (Table 6). Although experiment 7 did not exhibit the highest quantitative values for antioxidant activity and bioactive compounds, its more pronounced and well-defined SPR band suggests the formation of AgNPs (Figure 6). The higher antioxidant activity observed for the synthesized AgNPs relative to the aqueous extract alone is consistent with a pattern widely reported in the green synthesis literature, in which biosynthesized AgNPs frequently exhibit greater antioxidant capacity than the corresponding algal extracts [31]. At least two, non-mutually exclusive, explanations have been proposed in the literature for this type of observation: (1) a direct contribution of the silver species to antioxidant activity through single-electron and hydrogen atom transfer mechanisms [32]; (2) adsorption and consequent surface concentration of bioactive compounds on the nanoparticle, which could enhance their interaction with DPPH and ABTS radicals relative to the same compounds freely dispersed in solution [33]. We emphasize that these are still speculative hypotheses based on existing literature, and further studies are needed to confirm and better elucidate the mechanisms involved.
Table 6.
Antioxidant activity (DPPH and ABTS) and total phenolic and flavonoid contents of AgNPs obtained under the conditions evaluated in the FFD-II experimental design.
Figure 6.
UV-Vis spectrophotometric monitoring of AgNP formation under the experimental conditions evaluated in the FFD-II design.
AgNPs exhibit a variety of optical properties directly associated with SPR, which is highly dependent on the particles’ morphology [34]. The SPR band provides valuable information regarding the size and shape of the synthesized nanoparticles [2]. Therefore, factorial experimental designs were employed to identify the most representative SPR bands, which are essential for process standardization, considering that each experimental variable may influence nanoparticle synthesis.
The results demonstrated that AgNP synthesis significantly increased the contents of phenolic compounds and flavonoids compared with the corresponding aqueous extracts and silver nitrate solutions used in the synthesis, particularly for nanoparticles exhibiting more intense SPR bands. These observations are consistent with previous studies reporting higher phenolic and flavonoid contents in AgNPs than in the corresponding crude extracts [35,36]. One possible explanation for this observation is a greater availability of bioactive compounds adsorbed on the AgNP surface, which could in turn contribute to the increased antioxidant activity observed; however, this study did not include the controls necessary to test this hypothesis, such as a comparison of washed nanoparticles versus the corresponding supernatant, and surface adsorption of these compounds was not directly confirmed. Furthermore, the results indicate that green synthesis may improve the stability and bioavailability of these compounds, as also reported by Velgosova [37], Liang et al. [38], and Silva [39]. In addition, the AgNPs exhibited strong antioxidant potential across different assays. This may be associated with the adsorption of phenolic compounds and flavonoids onto the nanoparticle surface, as well as their small particle size and increased surface area [40,41]; however, these remain hypotheses that were not directly tested in the present study.
The ANOVA results indicated that none of the evaluated response variables had statistically significant regression models, as the calculated F-values were lower than the critical F-value (6.163). Among the evaluated responses, ABTS showed the highest F-value (5.919), suggesting a relatively greater contribution of the independent variables to the antioxidant activity, although the effect was not statistically significant. Similarly, the total phenolic and flavonoid contents showed F-values of 3.875 and 3.573, respectively, indicating that the differences observed among the experimental runs were not sufficient to establish a significant effect of the investigated factors (Table 7). As a complementary analysis, ANOVA was performed to evaluate whether the same process variables also influenced the bioactivity of the resulting AgNPs (Table 7).
Table 7.
ANOVA of the effects of the independent variables on antioxidant activity (DPPH and ABTS) and on the total phenolic and flavonoid contents of AgNPs obtained in the FFD-II experimental design.
Although statistical significance was not achieved, the absence of a significant result does not necessarily imply a lack of practical relevance [42]. Thus, the observed response patterns were considered preliminary information that may contribute to interpreting the experimental system and guide subsequent investigations. Given the exploratory purpose of FFD-II, these observations were not interpreted as statistically validated effects or predictive relationships between the process variables and bioactivity responses. Nevertheless, the factorial design provided useful information for selecting experimental conditions based on the predefined SPR criterion.
Based on the criterion defined in Section 3.2 (a single, symmetric SPR band between 400 and 450 nm), four samples were selected for further characterization: experiments 3 (1 mM AgNO3, 60 °C, 15 min), 4 (2.5 mM AgNO3, 60 °C, 15 min), 6 (2.5 mM AgNO3, 50 °C, 30 min), and 7 (1 mM AgNO3, 60 °C, 30 min) from the FFD-II experimental matrix.
Although experiment 8 exhibited the highest SPR absorbance and the highest DPPH, ABTS, TPC, and TFC values, its SPR band was less well-defined and less symmetric compared with those of the selected samples. The higher SPR absorbance intensity may be associated with greater AgNP formation [43]; however, changes in the SPR profile, such as band broadening and its shift toward longer wavelengths, may be related to nanoparticle agglomeration [44], which may compromise their stability. Therefore, the individual values obtained from each assay, considered independently, were not regarded as sufficient to define the most suitable sample for further characterization.
3.3. Characterization of Green-Synthesized AgNPs
3.3.1. Particle Size Distribution and Zeta Potential
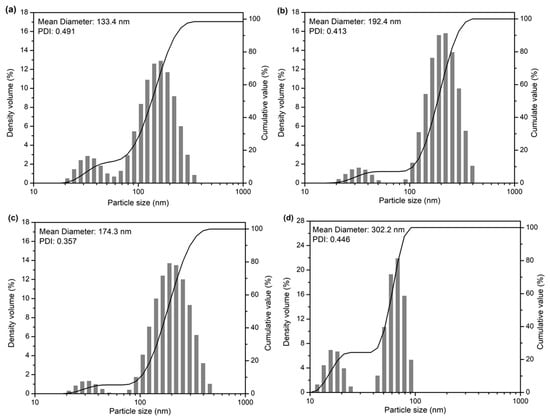
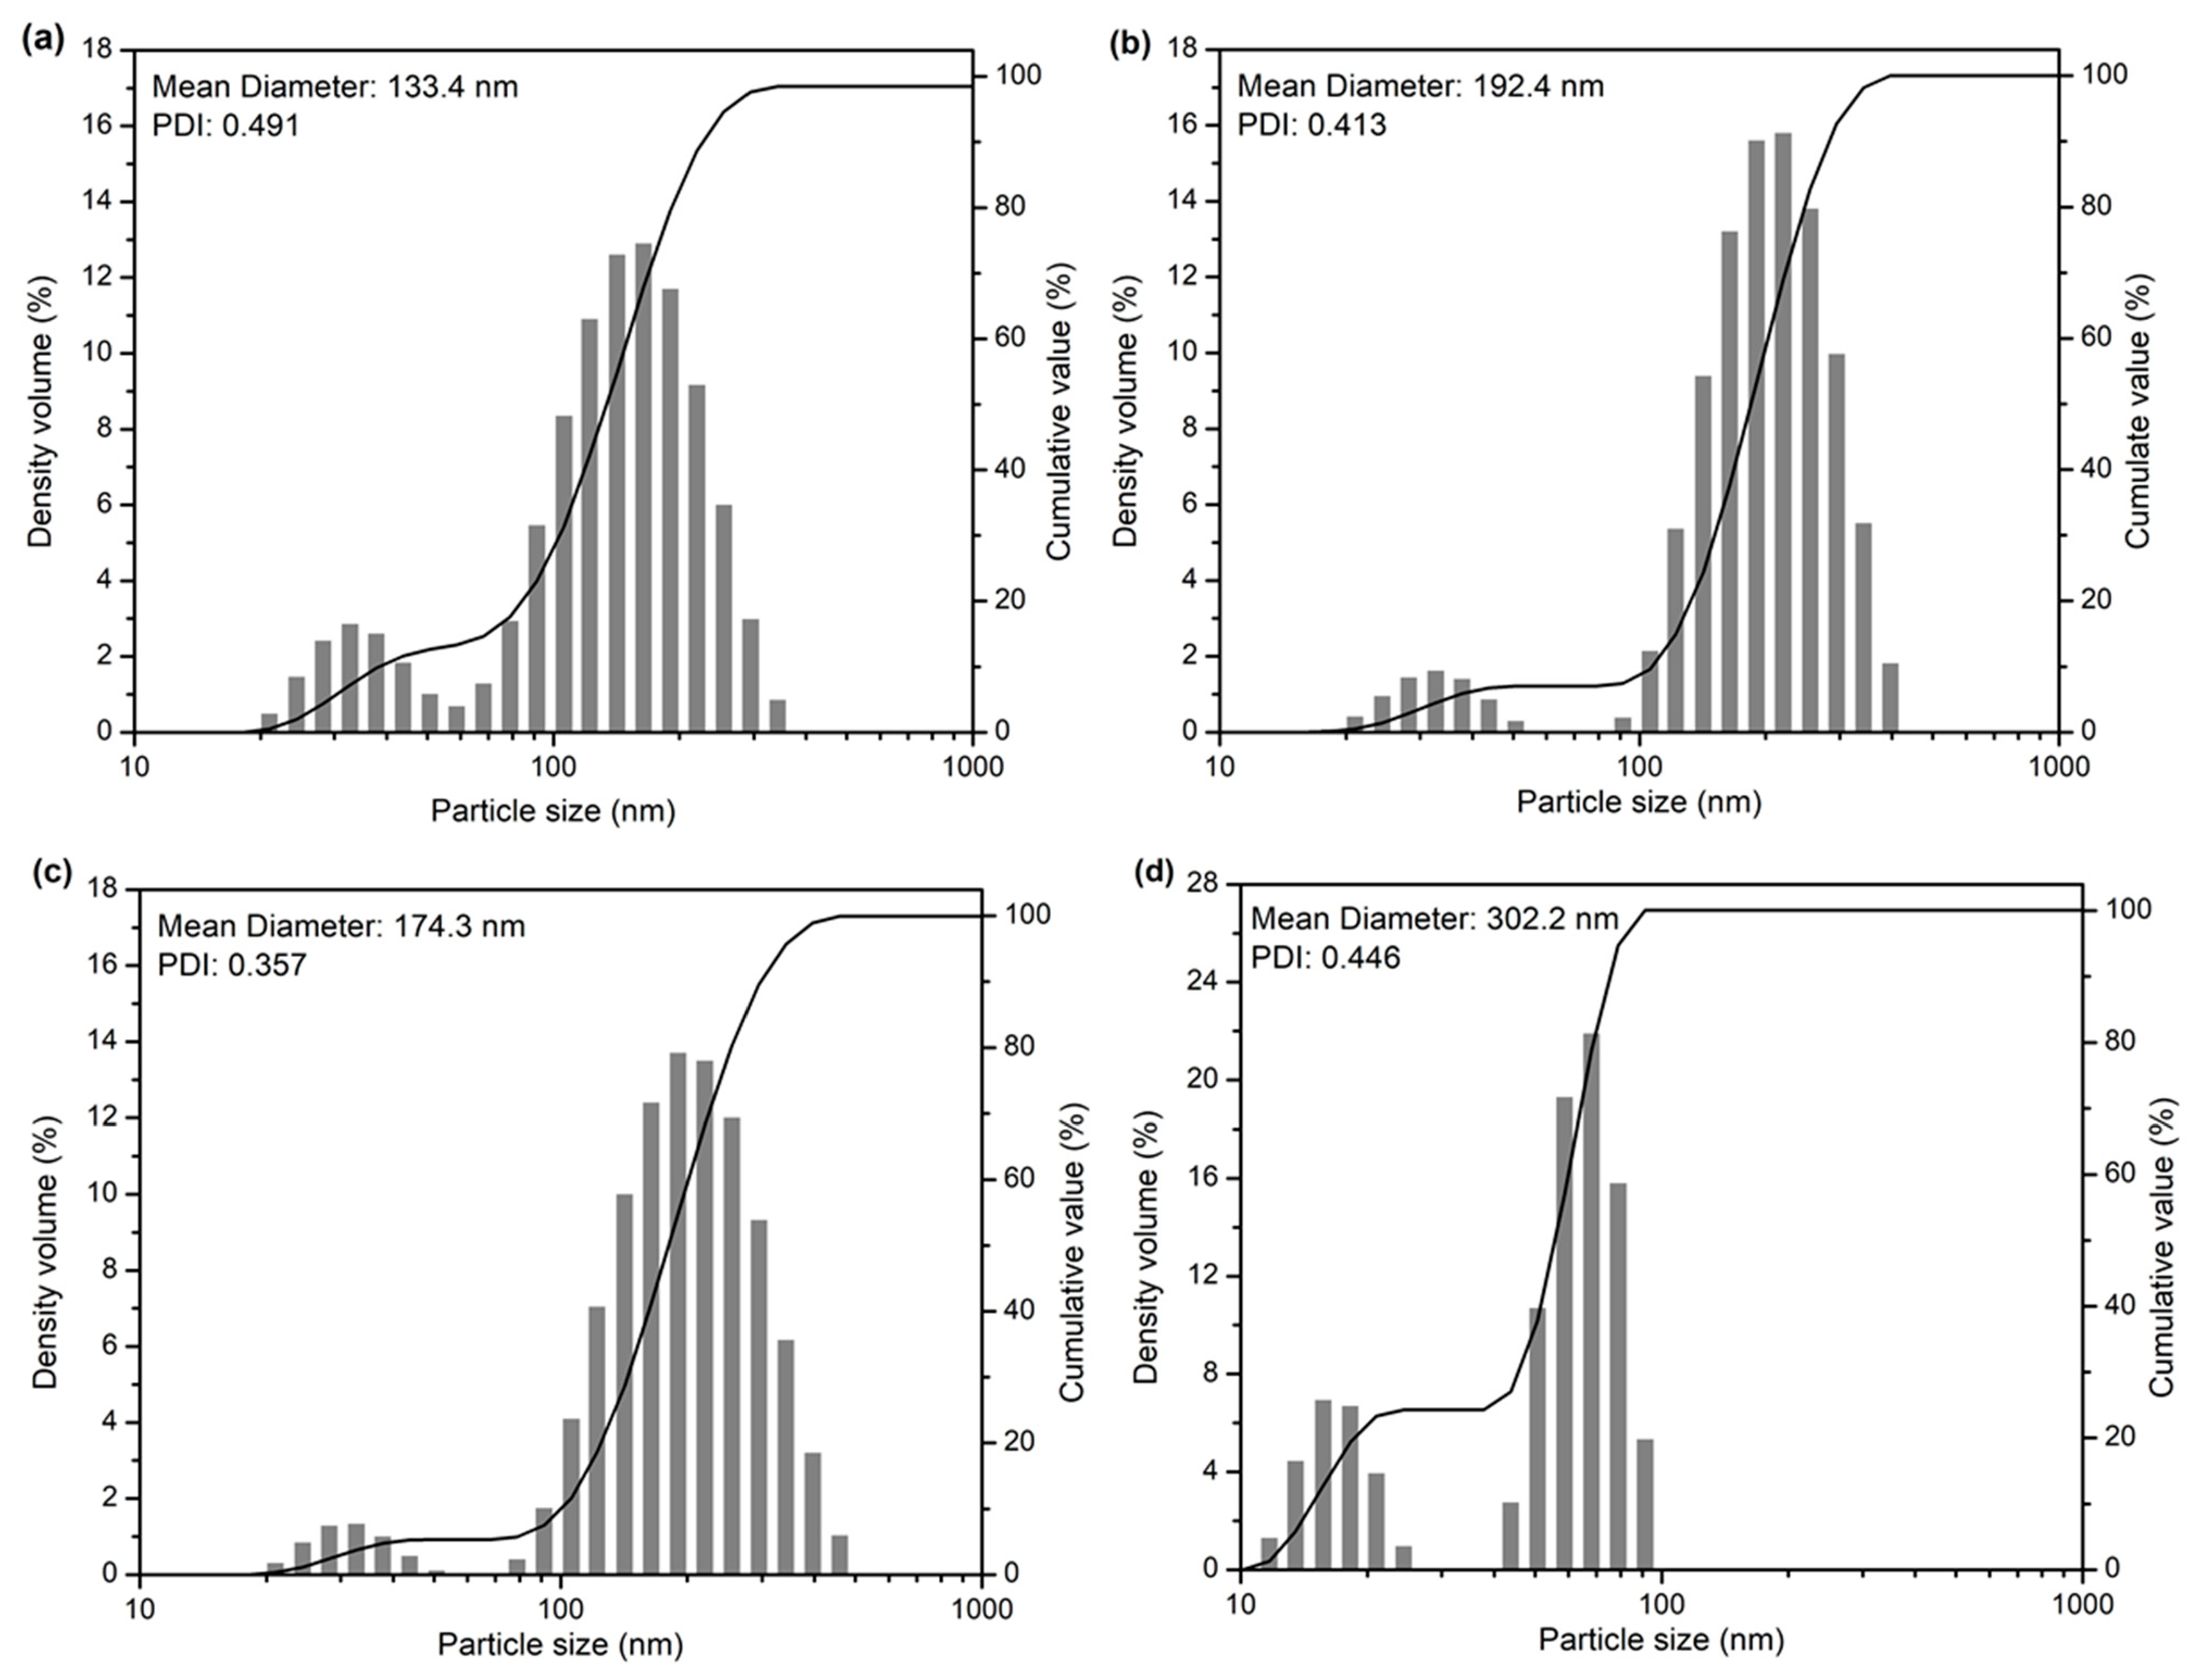
Experiments 4 (2.5 mM AgNO3, 60 °C, 15 min) and 6 (2.5 mM AgNO3, 50 °C, 30 min) exhibited the most promising results, as evidenced by more well-defined peaks and lower percentage variation in particle size, with mean diameters of 192.4 nm and 174.3 nm, respectively, as determined by the instrument (Figure 7b,c). In contrast, experiments 3 (1 mM AgNO3, 60 °C, 15 min) and 7 (1 mM AgNO3, 60 °C, 30 min) showed less uniform size distributions, with mean diameters of 133.4 nm and 302.2 nm, respectively, along with broader peaks and greater variability, indicating lower nanoparticle homogeneity (Figure 7a,d).
Figure 7.
Particle Size Distribution of AgNPs from experiments 3 (a) (1 mM AgNO3, 60 °C, 15 min), 4 (b) (2.5 mM AgNO3, 60 °C, 15 min), 6 (c) (2.5 mM AgNO3, 50 °C, 30 min), and 7 (d) (1 mM AgNO3, 60 °C, 30 min).
The polydispersity index (PDI) ranged from 0.357 to 0.491, with the lowest values observed in experiments 4 and 6, suggesting a more homogeneous particle-size distribution, a lower degree of aggregation, and greater particle uniformity. In contrast, experiments 3 and 7 exhibited PDI values close to 0.5, indicating greater heterogeneity within the colloidal suspension, with a broader size distribution and distinct aggregation states. PDI values below 0.7 are generally considered acceptable for reliable cumulant fitting in DLS measurements [45]. However, values closer to zero indicate a more homogeneous particle-size distribution, whereas values approaching or exceeding 0.4–0.5, as observed in the present study, indicate a moderately broad size distribution rather than a strictly monodisperse system. Accordingly, the PDI values obtained (0.357–0.491) reflect a moderate degree of polydispersity and are consistent with the aggregation behavior observed in the samples, rather than a highly homogeneous colloidal system.
The observed variation in particle diameter may be attributed to aggregation, particularly in suspensions with high concentrations of AgNPs [15]. Despite this variability, the particle sizes remained within the nanometric range and were consistent with those reported in the literature for AgNPs synthesized using different species of red algae, with diameters ranging from 12.5 to 100 nm [46] and from 55 to 99 nm [47]. Similarly, AgNPs synthesized using K. alvarezii exhibited an average diameter of 73 nm, with silver ion reduction mediated by the polysaccharides and functional groups present in the algal extract [48]. Considering the limitations of DLS in distinguishing individual nanoparticles from aggregates, nanoparticle tracking analysis (NTA) was subsequently performed. This technique provides a more sensitive and accurate assessment of particle size, size distribution, and nanoparticle concentration in colloidal suspensions, allowing for a more comprehensive characterization of the synthesized AgNPs.
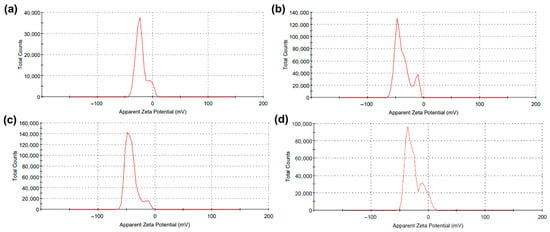
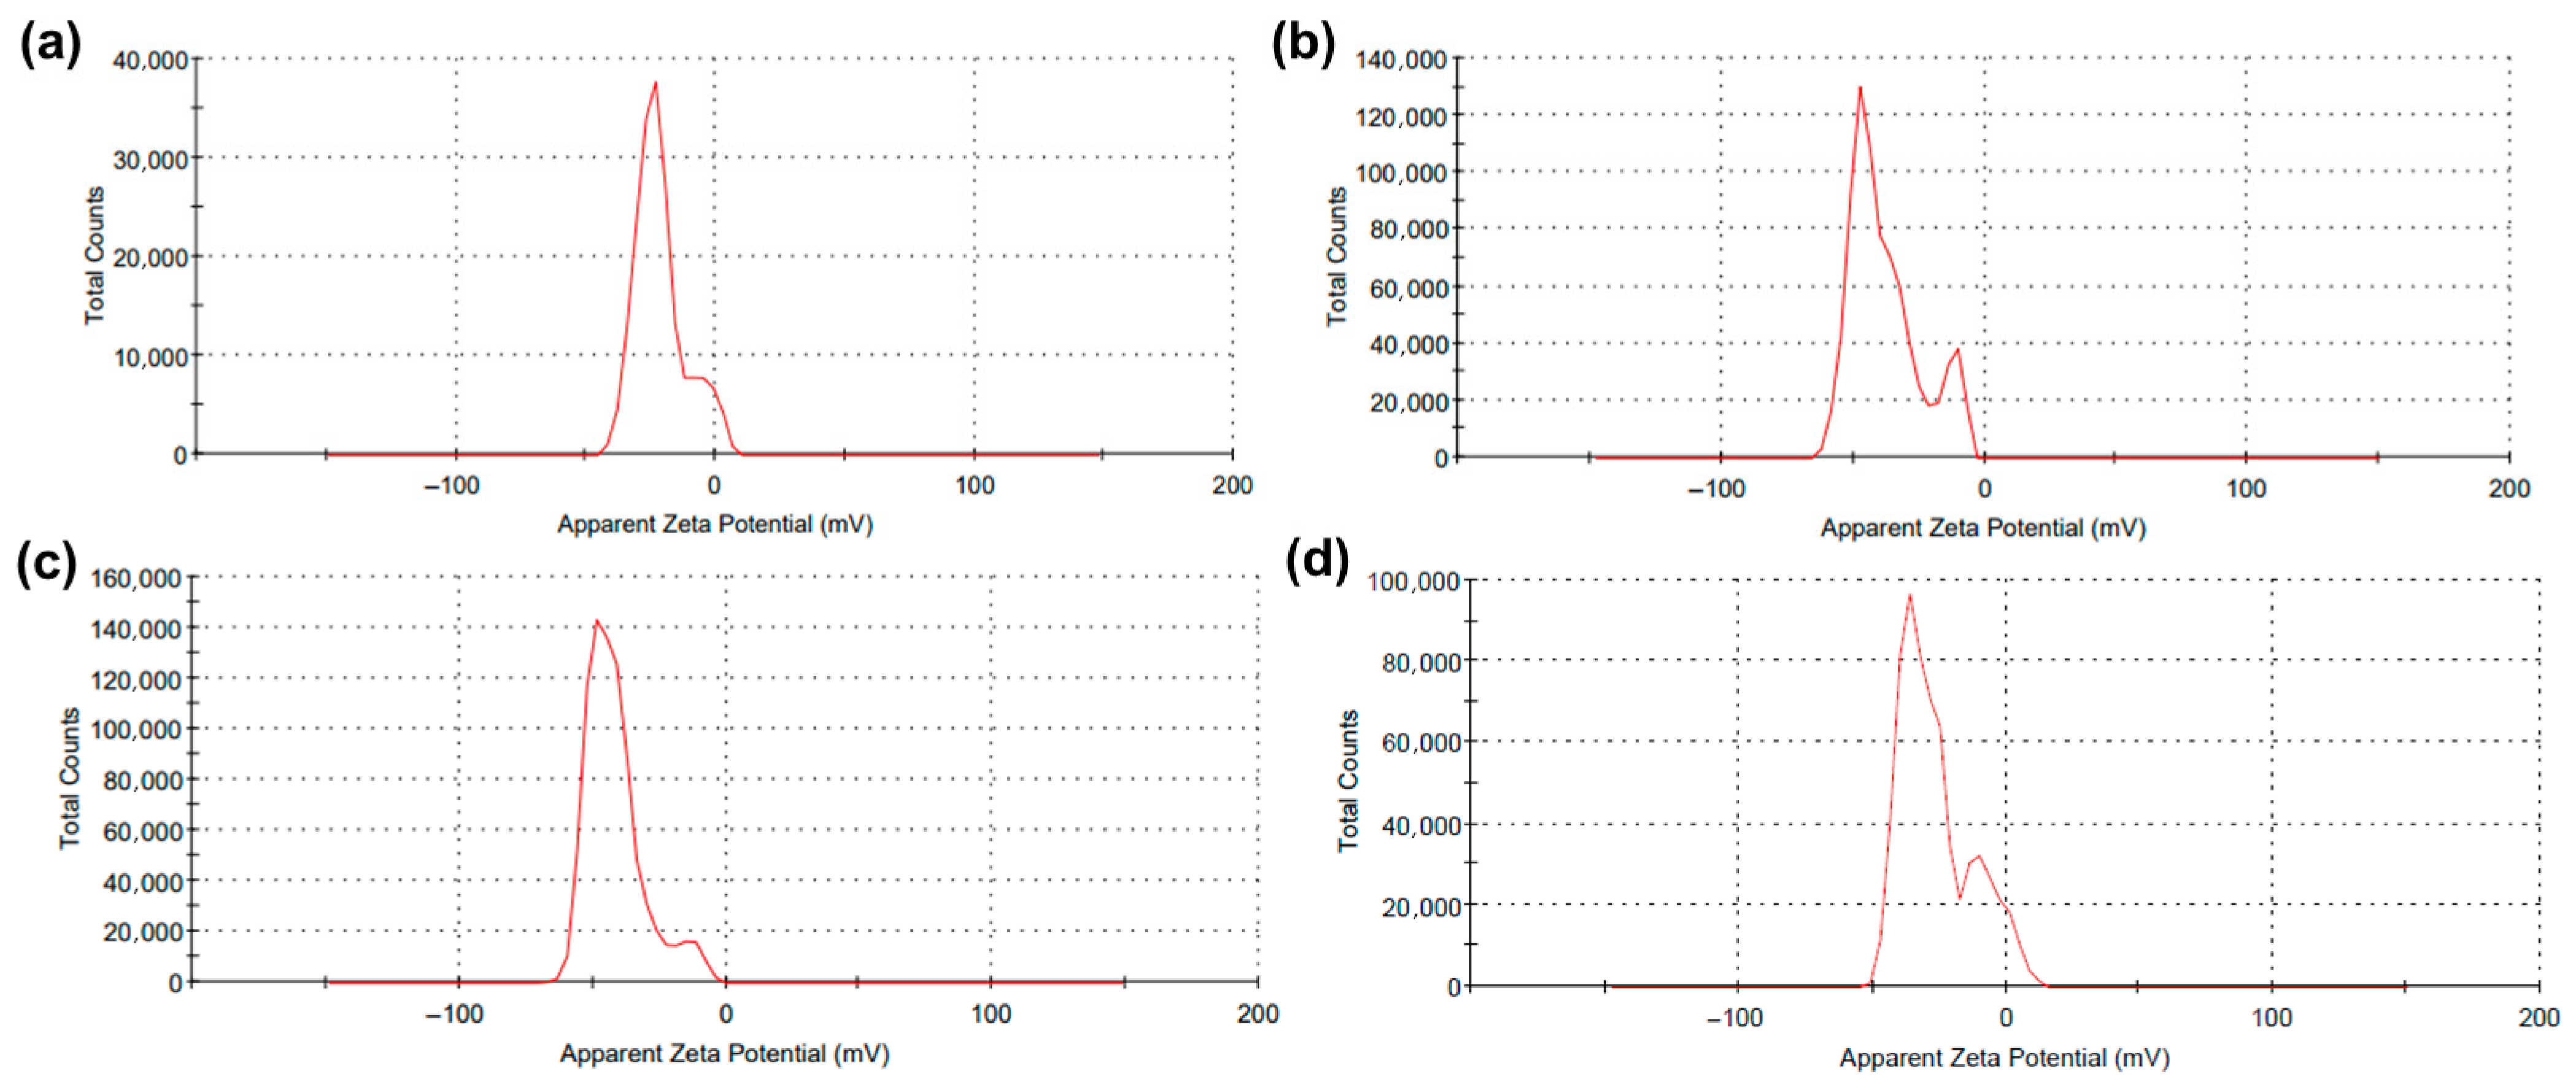
The zeta potential profiles of the synthesized AgNPs are presented in Figure 8, while the corresponding mean values are summarized in Table 8. Samples from experiments 4 and 6 exhibited zeta potentials of −37.8 mV and −41.5 mV, respectively, consistent with good electrostatic stabilization at the time of measurement, based on established zeta potential thresholds. This indicates potential colloidal stability rather than confirmed long-term stability. Absolute zeta potential values greater than 30 mV are generally considered indicative of stable suspensions, as electrostatic repulsion between particles minimizes aggregation phenomena [15,27].
Figure 8.
Zeta potential distribution profiles of AgNPs obtained from experiments 3 (a) (1 mM AgNO3, 60 °C, 15 min), 4 (b) (2.5 mM AgNO3, 60 °C, 15 min), 6 (c) (2.5 mM AgNO3, 50 °C, 30 min), and 7 (d) (1 mM AgNO3, 60 °C, 30 min).
Table 8.
Zeta potential and conductivity values of the synthesized AgNPs from experiments 3, 4, 6, and 7.
Experiments 3 and 7 exhibited zeta potentials of −21.3 mV and −28.6 mV, respectively, suggesting lower colloidal stability and a greater tendency toward particle aggregation. These findings are consistent with the DLS results, in which samples 4 and 6 also exhibited lower PDI values and more homogeneous particle-size distributions, further supporting more favorable initial colloidal behavior for these suspensions.
The zeta potential values obtained for experiments 4 and 6 are in agreement with those previously reported for AgNPs synthesized using K. alvarezii. Faried et al. [15] reported zeta potentials of −31.83 mV and −35.86 mV, while Faried et al. [27] observed an average value of −35.86 ± 2.80 mV for nanoparticles produced from the same biomass. The agreement between these findings and the results of the present study suggests that the metabolites and polysaccharides present in K. alvarezii effectively act as stabilizing agents, maintaining a negative surface charge and thereby enhancing the colloidal stability of the synthesized AgNP suspensions.
3.3.2. Nanoparticle Tracking Analysis, Morphological Characterization, and Stability Assessment of AgNPs
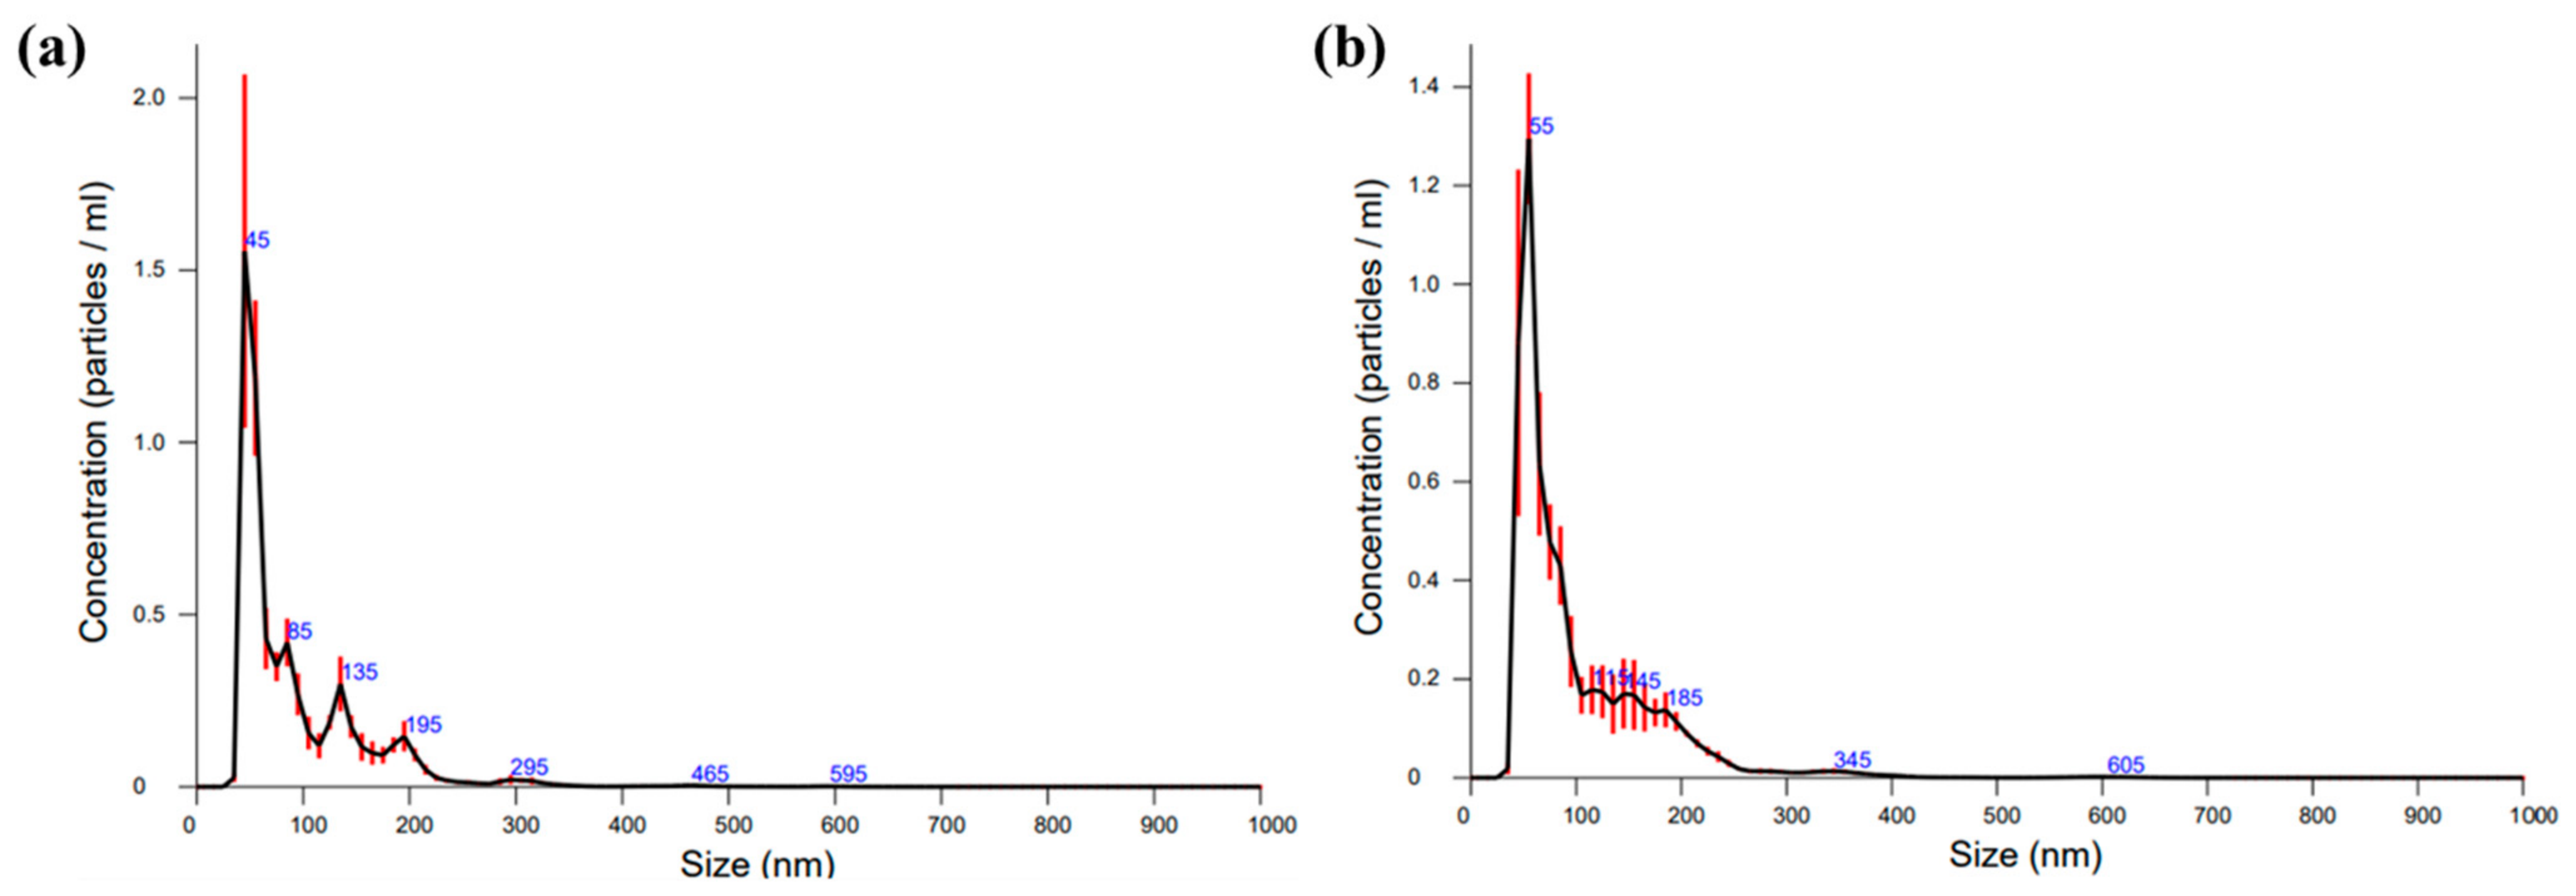
Nanoparticle Tracking Analysis (NTA) was performed on experiments 4 (2.5 mM AgNO3, 60 °C, 15 min) and 6 (2.5 mM AgNO3, 50 °C, 30 min), which were selected based on their more favorable DLS and zeta potential profiles at the time of measurement. The mean particle diameters obtained were 93.9 nm and 99.9 nm for samples 4 and 6, respectively (Figure 9 and Table 9). These values are consistent with those reported for AgNPs synthesized using K. alvarezii and other species of the same genus, for which particle sizes ranging from 52 to 104 nm [49] and approximately 80 nm [2] have been described.
Figure 9.
Particle size distribution profiles of AgNP experiments 4 (a) (2.5 mM AgNO3, 60 °C, 15 min) and 6 (b) (2.5 mM AgNO3, 50 °C, 30 min) determined by nanoparticle tracking analysis.
Table 9.
Particle size distribution parameters and concentration of AgNPs in experiments 4 and 6 were determined by nanoparticle tracking analysis.
In addition to determining the mean particle size, NTA enabled the evaluation of nanoparticle size distribution. The span values obtained for both samples (1.94–2.07) indicate a relatively broad particle-size distribution, consistent with the moderate-to-broad polydispersity also observed by DLS (PDI 0.357–0.491). Taken together, these results indicate that, despite reproducible synthesis conditions, the resulting AgNP suspensions are not strictly monodisperse.
A comparison between the NTA and DLS results revealed differences in the mean particle diameters estimated by the two techniques. While DLS indicated mean particle sizes of 192.4 nm and 174.3 nm for samples 4 and 6, respectively, NTA yielded lower values, close to 100 nm. This discrepancy has been widely reported in the literature and is associated with the measurement principles of each technique. DLS tends to overestimate particle size due to the greater contribution of larger particles and aggregates to the light-scattering signal, whereas NTA tracks individual nanoparticles in suspension, providing a more representative estimate of the actual particle-size distribution [50].
According to Monakhova, Shalaev, and Gorev [50], particle sizes determined by DLS may be 10–30% larger than those obtained by NTA, particularly in heterogeneous systems or in the presence of small aggregates. Although NTA measurements may exhibit greater variability due to the individual tracking of particles, this technique provides more accurate information regarding particle size distribution and nanoparticle concentration in suspension. Furthermore, the particle sizes obtained in the present study are within the range reported for AgNPs synthesized from Kappaphycus spp., reinforcing the effectiveness of the proposed synthesis route in producing nanoparticles with suitable dimensions and a relatively homogeneous size distribution.
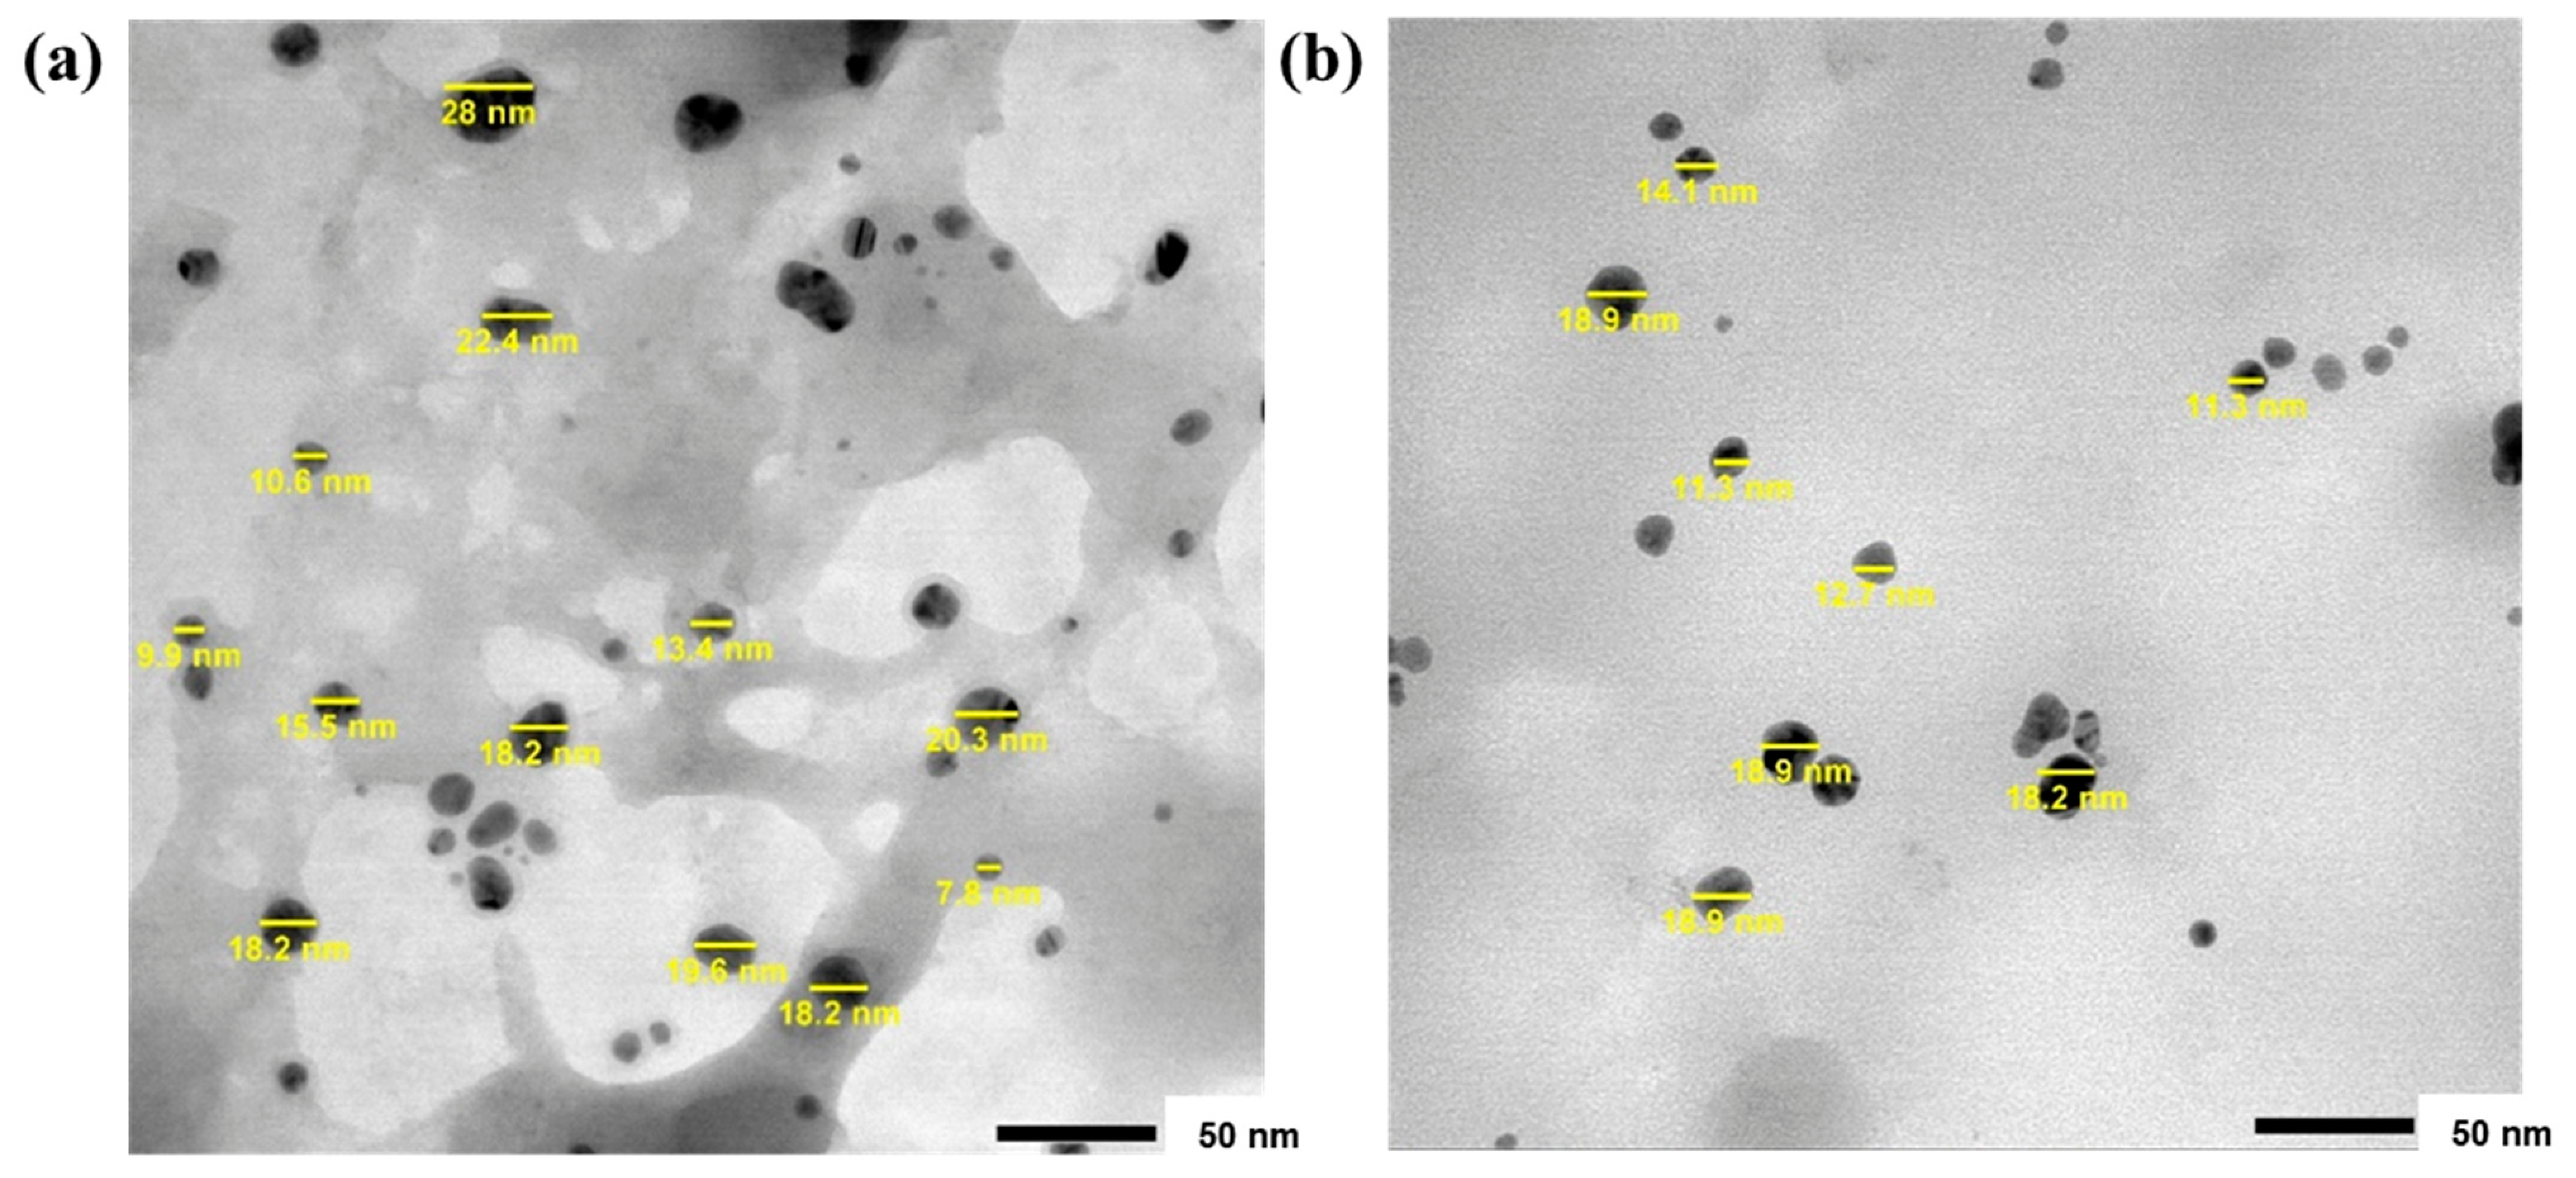
Transmission Electron Microscopy (TEM) images revealed that the synthesized nanoparticles exhibited a predominantly spherical morphology, with particle sizes ranging from 7.8 to 28.0 nm for experiment 4 and from 11.3 to 18.9 nm for experiment 6 (Figure 10a,b). In addition, agglomerates were observed in both samples, corroborating the results previously obtained by DLS and NTA, which also indicated particle aggregation in the colloidal suspensions.
Figure 10.
Morphological characterization of AgNP experiments 4 (a) (2.5 mM AgNO3, 60 °C, 15 min) and 6 (b) (2.5 mM AgNO3, 50 °C, 30 min) by transmission electron microscopy.
The presence of larger particles may be due to the coalescence or aggregation of smaller nanoparticles during TEM sample preparation. This behavior has been frequently reported in the literature for AgNPs synthesized from K. alvarezii, in which both individual nanoparticles and agglomerated structures have been observed by TEM [2,6].
The differences observed among particle sizes determined by TEM, DLS, and NTA reflect the distinct characteristics of each technique and provide evidence of aggregates in the AgNP suspensions. While TEM revealed predominantly spherical nanoparticles with diameters below ~30 nm, DLS and NTA analyses yielded larger average particle sizes, particularly for DLS. This behavior suggests that a fraction of the nanoparticles exists as aggregates in suspension, contributing to the increased hydrodynamic diameters measured by light-scattering-based techniques.
Although the absolute particle sizes obtained by DLS, NTA, and TEM differed substantially, reflecting the distinct physical principles of each technique, their combined use provided a more comprehensive characterization of the synthesized AgNPs. TEM confirmed the morphology and size of individual, non-aggregated nanoparticles, whereas the hydrodynamic techniques (DLS and NTA) assessed the particle-size distribution across the nanoparticle population in suspension, including the detection of aggregates within the colloidal system that TEM alone does not capture. Collectively, these findings indicate that the synthesized AgNPs exhibit nanometric dimensions, a relatively homogeneous size distribution, and colloidal stability consistent with the zeta potential values observed for the selected samples.
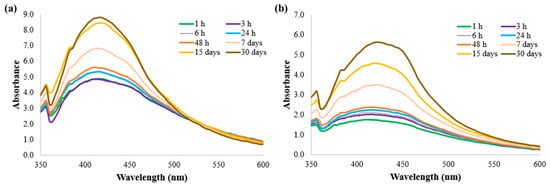
The stability of AgNP experiments 4 (2.5 mM AgNO3, 60 °C, 15 min) and 6 (2.5 mM AgNO3, 50 °C, 30 min) was evaluated throughout the storage period by monitoring the UV-Vis absorption spectra immediately after synthesis and after 3 h, 6 h, 24 h, 48 h, 7 days, 15 days, and 30 days. The spectral variations observed over time are presented in Figure 11. UV-Vis monitoring provides an indirect assessment of colloidal behavior over time, based on spectral changes associated with aggregation, and does not directly quantify particle size or aggregation state at each time point. A more comprehensive assessment of long-term stability would benefit from periodic DLS and zeta potential measurements throughout storage. Such analyses were beyond the scope of the present study but represent an important direction for future research.
Figure 11.
UV-Vis absorption spectra of AgNP experiments 4 (a) (2.5 mM AgNO3, 60 °C, 15 min) and 6 (b) (2.5 mM AgNO3, 50 °C, 30 min) during storage.
Analysis of the spectral profiles revealed progressive changes in the surface plasmon resonance bands, indicating alterations in the colloidal behavior of the nanoparticles during storage. In parallel, changes in suspension color and the gradual formation of precipitates were observed, particularly after extended storage periods. These findings suggest AgNP aggregation, which increases the effective particle size and promotes sedimentation under gravitational forces.
The increase in aggregation may also affect the intensity and profile of the plasmonic bands, as interactions between neighboring nanoparticles modify their optical properties and light absorption behavior. A similar behavior was observed by Conceição et al. [51], who reported precipitate formation in AgNP suspensions synthesized using purple Ipe extract and attributed this phenomenon to the progressive aggregation of nanoparticles during storage.
Similarly, a study using Trillium govanianum extracts observed an increase in the intensity of the SPR band at 426 nm over the reaction time, without any shift in the maximum wavelength over a five-day period [52]. This behavior was also verified in the present work, where an increase in the plasmonic peak intensity at approximately 420 nm was observed, with no significant changes in wavelength, characteristic of AgNP formation. Strategies such as using an ultrasonic bath or an ultrasonic probe may be employed to promote nanoparticle disaggregation and improve the stability of the colloidal suspension without compromising its structural integrity.
3.4. Sustainability Assessment and Green Chemistry Perspective
The results demonstrated the establishment of a green synthesis protocol for AgNPs using K. alvarezii biomass. This approach promotes the development of nanomaterials of biotechnological interest by employing a renewable natural resource, reducing the need for hazardous chemical reagents and techniques, and contributing to processes with lower environmental impact. Accordingly, this study aligns with the principles of Green Chemistry [53] by using marine macroalgal extracts as reducing and stabilizing agents, thereby enabling milder reaction conditions and reducing the generation of hazardous waste. Furthermore, this strategy contributes to the United Nations Sustainable Development Goals (SDGs) [54], particularly SDG 3 (Good Health and Well-being), by enabling the development of nanoparticles with potential biomedical applications; SDG 9 (Industry, Innovation and Infrastructure), by promoting innovative biotechnological processes based on renewable marine resources; SDG 12 (Responsible Consumption and Production), through the sustainable use of natural biomass as an alternative to conventional reagents; and, in terms of feedstock sourcing, aligns with SDG 14 (Life Below Water) by valorizing marine biomass already cultivated for other commercial purposes.
From an environmental and economic standpoint, the use of K. alvarezii aqueous extracts as reducing and stabilizing agents offers clear advantages over conventional chemical synthesis routes, which typically rely on hazardous reagents such as sodium borohydride or high-temperature citrate reduction, require substantial energy input, and generate toxic byproducts [55,56]. By replacing these inputs with a biomass already cultivated at commercial scale for carrageenan extraction, this approach exemplifies circular economy principles, adding value to an existing production chain without creating additional pressure on marine ecosystems or requiring dedicated cultivation solely for nanoparticle synthesis [57,58]. However, the alkaline pH (13) required for synthesis involves NaOH, a caustic reagent, which should be considered when evaluating the overall sustainability of the process. NaOH is energy-intensive to produce, increases the burden of effluent neutralization, and may shift environmental impacts downstream rather than eliminate them. The present study did not assess quantitative green chemistry metrics, such as the E-factor and life-cycle assessment, or aquatic ecotoxicity evaluations of the synthesized AgNPs. These analyses represent important directions for future research, particularly considering the well-documented potential of AgNPs to affect aquatic organisms.
4. Conclusions
This study demonstrated the feasibility of green synthesis of AgNPs using bioactive compounds present in aqueous extracts of the red macroalga K. alvarezii, thereby highlighting a sustainable route. Process standardization was achieved by monitoring the surface plasmon resonance band at approximately 420 nm, which is consistent with the reduction of Ag+ to Ag0. The use of FFD-I and FFD-II enabled the screening of process variables and the identification of reproducible conditions for AgNP formation, evidenced by a well-defined plasmonic band, including aqueous extract concentration (5.0 mg mL−1), silver nitrate concentration (2.5 mM), temperatures between 50 and 60 °C, and reaction times between 15 and 30 min.
Phytochemical analyses revealed flavonoids and phenolic compounds involved in nanoparticle reduction and stabilization. Their possible contribution to the increased antioxidant activity observed in the synthesized AgNPs, whether through adsorption onto the nanoparticle surface or a catalytic effect of the silver species, remains a hypothesis that was not directly tested in the present study. From a physicochemical perspective, the nanoparticles exhibited predominantly spherical morphology, a mean size below 100 nm, and an adequate polydispersity index. The negative zeta potential and short-term colloidal behavior indicate partial colloidal stability, with a tendency toward aggregation and precipitation observed during prolonged storage.
As a direction for future work, a response surface methodology, such as a central composite or Box–Behnken design, could be employed to specifically model and optimize the bioactivity responses (antioxidant activity and phenolic/flavonoid content) of the synthesized AgNPs, complementing the process screening approach adopted in the present study.
Thus, K. alvarezii proved to be a promising renewable source for the green synthesis of AgNPs with relevant physicochemical and biological properties. By replacing hazardous chemical reagents with biomass already integrated into an established aquaculture value chain, the proposed approach has the potential to offer a safer and more resource-efficient alternative to conventional synthesis methods, consistent with circular economy principles. Overall, this study contributes to the development of sustainable antioxidant nanomaterials from marine macroalgae, aligned with Green Chemistry principles. The observed antioxidant activity, together with the antimicrobial, cytotoxic, and other biological properties reported for green-synthesized AgNPs, supports their potential applications in cosmetics, pharmaceuticals, and agriculture. However, further validation through specific assays, including antimicrobial activity, cytotoxicity, and silver ion release, is required for the AgNPs produced in this study and represents an important direction for future research. In addition, future studies should incorporate complementary confirmatory techniques, such as XRD, EDX, ICP, and FTIR, to determine the crystalline structure, elemental composition, residual Ag+ content, and functional groups involved in the bioreduction process, which were beyond the scope of the present study.
Author Contributions
Conceptualization, R.M.G.d.S. and M.M.; methodology, G.O.d.C., R.M.G.d.S., É.F.R., C.C.M.F. and F.O.G.; investigation, G.O.d.C.; resources, A.L.F., L.S., R.M.G.d.S. and M.M.; data curation, G.O.d.C. and É.F.R.; writing—original draft preparation, G.O.d.C. and É.F.R.; writing—review and editing, J.G.d.M., É.F.R., L.S., A.L.F., C.C.M.F., F.O.G., R.M.G.d.S. and M.M.; visualization, J.G.d.M., F.O.G. and C.C.M.F.; supervision, R.M.G.d.S. and M.M.; project administration, R.M.G.d.S. and M.M.; funding acquisition, R.M.G.d.S. and M.M. All authors have read and agreed to the published version of the manuscript.
Funding
This research was funded by São Paulo Research Foundation (FAPESP/Brazil), grant number 2025/04542-0.
Institutional Review Board Statement
Not applicable.
Informed Consent Statement
Not applicable.
Data Availability Statement
The original contributions presented in this study are included in the article. Further inquiries can be directed to the corresponding author.
Acknowledgments
This study was supported by the São Paulo Research Foundation Grant—FAPESP No. 2024/10127-2, 2024/21128-0, 2025/04542-0, 2025/02662-8, and 2025/25484-8.
Conflicts of Interest
Author Mozart Marins is currently affiliated with Algastech Aquiculture Research and Development, Ribeirão, SP, Brazil. The remaining authors declare that the research was conducted in the absence of any commercial of financial relationships that could be constructed as a pontential conflicts of interest.
References
- Samal, K. Recent Advances in Green-Synthesized Nanoparticles: Mechanisms, Environmental and Pharmaceutical Applications, Challenges, and Future Perspectives. Next Nanotechnol. 2026, 10, 100620. [Google Scholar] [CrossRef] [Scilit]
- Khan, M.S.; Soundhararajan, R.; Srinivasan, H. Synthesis and Characterization of Kappaphycus alvarezii Derived Silver Nanoparticles and Determination of Antibacterial Activity. Mater. Chem. Phys. 2022, 282, 125985. [Google Scholar] [CrossRef] [Scilit]
- de Jesus Leopoldo, C.; Vechio, G.H. Del nanotecnologia e suas aplicações. Rev. Interface Tecnológica 2020, 17, 144–154. [Google Scholar] [CrossRef] [Scilit]
- Dhaka, A.; Chand Mali, S.; Sharma, S.; Trivedi, R. A Review on Biological Synthesis of Silver Nanoparticles and Their Potential Applications. Results Chem. 2023, 6, 101108. [Google Scholar] [CrossRef] [Scilit]
- Duman, H.; Eker, F.; Akdaşçi, E.; Witkowska, A.M.; Bechelany, M.; Karav, S. Silver Nanoparticles: A Comprehensive Review of Synthesis Methods and Chemical and Physical Properties. Nanomaterials 2024, 14, 1527. [Google Scholar] [CrossRef] [Scilit] [PubMed]
- Jaffar, S.S.; Saallah, S.; Misson, M.; Siddique, S.; Roslan, J.; Lenggoro, W. Green Synthesis, Characterization and Antimicrobial Efficacy of Silver Nanoparticles from Kappaphycus alvarezii Extract. Res. Chem. Intermed. 2024, 50, 3435–3452. [Google Scholar] [CrossRef] [Scilit]
- Singh, S.; Maurya, P.; Soni, K. Utilization of Algae for the Green Synthesis of Silver Nanoparticles and Their Applications. Am. J. Nano Res. Appl. 2023, 11, 1–9. [Google Scholar] [CrossRef] [Scilit]
- Uzair, B.; Liaqat, A.; Iqbal, H.; Menaa, B.; Razzaq, A.; Thiripuranathar, G.; Fatima Rana, N.; Menaa, F. Green and Cost-Effective Synthesis of Metallic Nanoparticles by Algae: Safe Methods for Translational Medicine. Bioengineering 2020, 7, 129. [Google Scholar] [CrossRef] [Scilit] [PubMed]
- Mukherjee, A.; Sarkar, D.; Sasmal, S. A Review of Green Synthesis of Metal Nanoparticles Using Algae. Front. Microbiol. 2021, 12, 693899. [Google Scholar] [CrossRef] [Scilit] [PubMed]
- Shankar, P.D.; Shobana, S.; Karuppusamy, I.; Pugazhendhi, A.; Ramkumar, V.S.; Arvindnarayan, S.; Kumar, G. A Review on the Biosynthesis of Metallic Nanoparticles (Gold and Silver) Using Bio-Components of Microalgae: Formation Mechanism and Applications. Enzym. Microb. Technol. 2016, 95, 28–44. [Google Scholar] [CrossRef] [Scilit] [PubMed]
- Barciela, P.; Carpena, M.; Li, N.-Y.; Liu, C.; Jafari, S.M.; Simal-Gandara, J.; Prieto, M.A. Macroalgae as Biofactories of Metal Nanoparticles; Biosynthesis and Food Applications. Adv. Colloid Interface Sci. 2023, 311, 102829. [Google Scholar] [CrossRef] [Scilit] [PubMed]
- Chan, S.S.; Low, S.S.; Chew, K.W.; Ling, T.C.; Rinklebe, J.; Juan, J.C.; Ng, E.P.; Show, P.L. Prospects and Environmental Sustainability of Phyconanotechnology: A Review on Algae-Mediated Metal Nanoparticles Synthesis and Mechanism. Environ. Res. 2022, 212, 113140. [Google Scholar] [CrossRef] [Scilit] [PubMed]
- Chaudhary, R.; Nawaz, K.; Khan, A.K.; Hano, C.; Abbasi, B.H.; Anjum, S. An Overview of the Algae-Mediated Biosynthesis of Nanoparticles and Their Biomedical Applications. Biomolecules 2020, 10, 1498. [Google Scholar] [CrossRef] [Scilit] [PubMed]
- Khanna, P.; Kaur, A.; Goyal, D. Algae-Based Metallic Nanoparticles: Synthesis, Characterization and Applications. J. Microbiol. Methods 2019, 163, 105656. [Google Scholar] [CrossRef] [Scilit] [PubMed]
- Faried, M.; Shameli, K.; Miyake, M.; Hajalilou, A.; Kalantari, K.; Zakaria, Z.; Hara, H.; Khairudin, N.B.A. Synthesis of Silver Nanoparticles via Green Method Using Ultrasound Irradiation in Seaweed Kappaphycus alvarezii Media. Res. Chem. Intermed. 2016, 42, 7991–8004. [Google Scholar] [CrossRef] [Scilit]
- de Almeida, P.D.O.; Bozorgzadeh, S.A.; Martins, I.J.F.; Golbashirzadeh, M. Marine Algae-Derived Nanoparticles (MADNs): Green Synthesis, Characterization, and Therapeutic Applications. Discov. Appl. Sci. 2025, 7, 461. [Google Scholar] [CrossRef] [Scilit]
- Singleton, V.L.; Rossi, J.A. Colorimetry of Total Phenolics with Phosphomolybdic-Phosphotungstic Acid Reagents. Am. J. Enol. Vitic. 1965, 16, 144–158. [Google Scholar] [CrossRef] [Scilit]
- Christ, B.; Müller, K.H. Zur Serienmäßigen Bestimmung Des Gehaltes an Flavonol-Derivaten in Drogen. Arch. Pharm. 1960, 293, 1033–1042. [Google Scholar] [CrossRef] [Scilit] [PubMed]
- Barnum, D.W. Spectrophotometric Determination of Catechol, Epinephrine, Dopa, Dopamine and Other Aromatic Vic-Diols. Anal. Chim. Acta 1977, 89, 157–166. [Google Scholar] [CrossRef] [Scilit] [PubMed]
- Brand-Williams, W.; Cuvelier, M.E.; Berset, C. Use of a Free Radical Method to Evaluate Antioxidant Activity. LWT-Food Sci. Technol. 1995, 28, 25–30. [Google Scholar] [CrossRef] [Scilit]
- Miller, N.J.; Rice-Evans, C.A. Spectrophotometric Determination of Antioxidant Activity. Redox Rep. 1996, 2, 161–171. [Google Scholar] [CrossRef] [Scilit] [PubMed]
- Re, R.; Pellegrini, N.; Proteggente, A.; Pannala, A.; Yang, M.; Rice-Evans, C. Antioxidant Activity Applying an Improved ABTS Radical Cation Decolorization Assay. Free Radic. Biol. Med. 1999, 26, 1231–1237. [Google Scholar] [CrossRef] [Scilit] [PubMed]
- Adrianto, N.; Panre, A.M.; Istiqomah, N.I.; Riswan, M.; Apriliani, F.; Suharyadi, E. Localized Surface Plasmon Resonance Properties of Green Synthesized Silver Nanoparticles. Nano-Struct. Nano-Objects 2022, 31, 100895. [Google Scholar] [CrossRef] [Scilit]
- Gulcin, İ. Antioxidants: A Comprehensive Review. Arch. Toxicol. 2025, 99, 1893–1997. [Google Scholar] [CrossRef] [Scilit] [PubMed]
- Araújo, P.G.; Nardelli, A.E.; Fujii, M.T.; Chow, F. Antioxidant Properties of Different Strains of Kappaphycus alvarezii (Rhodophyta) Farmed on the Brazilian Coast. Phycologia 2020, 59, 272–279. [Google Scholar] [CrossRef] [Scilit]
- Zhong, B.; Robinson, N.A.; Warner, R.D.; Barrow, C.J.; Dunshea, F.R.; Suleria, H.A.R. LC-ESI-QTOF-MS/MS Characterization of Seaweed Phenolics and Their Antioxidant Potential. Mar. Drugs 2020, 18, 331. [Google Scholar] [CrossRef] [Scilit] [PubMed]
- Faried, M.; Shameli, K.; Miyake, M.; Hara, H.; Khairudin, N.B.A. Green Sonochemical Synthesis of Silver Nanoparticles Using Marine Seaweed as Biopolymer Media. Dig. J. Nanomater. Biostruct. 2015, 10, 1419–1426. [Google Scholar]
- Chugh, D.; Viswamalya, V.S.; Das, B. Green Synthesis of Silver Nanoparticles with Algae and the Importance of Capping Agents in the Process. J. Genet. Eng. Biotechnol. 2021, 19, 126. [Google Scholar] [CrossRef] [Scilit] [PubMed]
- Aboelfetoh, E.F.; El-Shenody, R.A.; Ghobara, M.M. Eco-Friendly Synthesis of Silver Nanoparticles Using Green Algae (Caulerpa serrulata): Reaction Optimization, Catalytic and Antibacterial Activities. Environ. Monit. Assess. 2017, 189, 349. [Google Scholar] [CrossRef] [Scilit] [PubMed]
- Priya Velammal, S.; Devi, T.A.; Amaladhas, T.P. Antioxidant, Antimicrobial and Cytotoxic Activities of Silver and Gold Nanoparticles Synthesized Using Plumbago Zeylanica Bark. J. Nanostructure Chem. 2016, 6, 247–260. [Google Scholar] [CrossRef] [Scilit]
- Bedlovičová, Z.; Strapáč, I.; Baláž, M.; Salayová, A. A Brief Overview on Antioxidant Activity Determination of Silver Nanoparticles. Molecules 2020, 25, 3191. [Google Scholar] [CrossRef] [Scilit] [PubMed]
- Elemike, E.; Fayemi, O.; Ekennia, A.; Onwudiwe, D.; Ebenso, E. Silver Nanoparticles Mediated by Costus afer Leaf Extract: Synthesis, Antibacterial, Antioxidant and Electrochemical Properties. Molecules 2017, 22, 701. [Google Scholar] [CrossRef] [Scilit] [PubMed]
- Trendafilova, I.; Popova, M. Porous Silica Nanomaterials as Carriers of Biologically Active Natural Polyphenols: Effect of Structure and Surface Modification. Pharmaceutics 2024, 16, 1004. [Google Scholar] [CrossRef] [Scilit] [PubMed]
- Ranjani, S.; Parthasarathy, P.; Rameshkumar, P.; VimalKumar, U.; Hemalatha, S. Pungent Anti-Infective Nanocolloids Manipulate Growth, Biofilm Formation, and CTX-M-15 Gene Expression in Pathogens Causing Vibriosis. Aquac. Int. 2021, 29, 859–869. [Google Scholar] [CrossRef] [Scilit]
- Salari, S.; Esmaeilzadeh Bahabadi, S.; Samzadeh-Kermani, A.; Yosefzaei, F. In-Vitro Evaluation of Antioxidant and Antibacterial Potential of GreenSynthesized Silver Nanoparticles Using Prosopis Farcta Fruit Extract. Iran. J. Pharm. Res. 2019, 18, 430–455. [Google Scholar] [PubMed]
- Abdel-Aziz, M.S.; Shaheen, M.S.; El-Nekeety, A.A.; Abdel-Wahhab, M.A. Antioxidant and Antibacterial Activity of Silver Nanoparticles Biosynthesized Using Chenopodium Murale Leaf Extract. J. Saudi Chem. Soc. 2014, 18, 356–363. [Google Scholar] [CrossRef] [Scilit]
- Velgosova, O.; Dolinská, S.; Podolská, H.; Mačák, L.; Čižmárová, E. Impact of Plant Extract Phytochemicals on the Synthesis of Silver Nanoparticles. Materials 2024, 17, 2252. [Google Scholar] [CrossRef] [Scilit] [PubMed]
- Liang, W.; Zhou, C.; Jin, S.; Fu, L.; Zhang, H.; Huang, X.; Long, H.; Ming, W.; Zhao, J. An Update on the Advances in the Field of Nanostructured Drug Delivery Systems for a Variety of Orthopedic Applications. Drug Deliv. 2023, 30, 2241667. [Google Scholar] [CrossRef] [Scilit] [PubMed]
- da Silva, R.M.G.; Rosatto, P.A.P.; Pereira, I.d.N.; Zibordi, L.C.; Santos, H.H.; Granero, F.O.; Figueiredo, C.C.M.; Santiago, P.S.; Prata Gaona, C.A.; Nicolau-Junior, N.; et al. Green Synthesis of Silver Nanoparticles Using Pyrostegia Venusta Extract, Characterization and Estimation of Antioxidant, Antiglycation and Anti-Aging Activities. J. Genet. Eng. Biotechnol. 2025, 23, 100539. [Google Scholar] [CrossRef] [Scilit] [PubMed]
- Khuda, F.; Jamil, M.; Ali Khan Khalil, A.; Ullah, R.; Ullah, N.; Naureen, F.; Abbas, M.; Shafiq Khan, M.; Ali, S.; Muhammad Umer Farooqi, H.; et al. Assessment of Antioxidant and Cytotoxic Potential of Silver Nanoparticles Synthesized from Root Extract of Reynoutria japonica Houtt. Arab. J. Chem. 2022, 15, 104327. [Google Scholar] [CrossRef] [Scilit]
- dos Santos, V.H.M.; de Oliveira Costa, M.M.; Granero, F.O.; Figueiredo, C.C.M.; Santos, H.H.; Benevides, P.J.C.; Nicolau-Junior, N.; Debiagi, P.E.A.; Silva, L.P.; da Silva, R.M.G. Green Biosynthesis of Silver Nanoparticles Using Anthocyanins-Rich Extract from Euterpe edulis Fruits (AnthocyanOx®): Assessment in Vitro of Antioxidant and Antiglycation Activities, and in Silico Anti-Aging Activity. Food Bioprod. Process. 2025, 151, 189–201. [Google Scholar] [CrossRef] [Scilit]
- Loureiro, L.; Gameiro, M. Interpretação Crítica Dos Resultados Estatísticos: Para Lá Da Significância Estatística. Rev. Enferm. Ref. 2011, III Série, 151–162. [Google Scholar] [CrossRef] [Scilit]
- Sultana, R.; Kumari, A.S.; Ayodhya, D.; Maragoni, V. Monowave Synthesis of Silver Nanoparticles Using Guar Gum: Characterization, Anticancer, Antimicrobial, Antioxidant and Catalytic Activities. Results Chem. 2023, 6, 101082. [Google Scholar] [CrossRef] [Scilit]
- Savvidou, M.G.; Kontari, E.; Kalantzi, S.; Mamma, D. Green Synthesis of Silver Nanoparticles Using the Cell-Free Supernatant of Haematococcus pluvialis Culture. Materials 2023, 17, 187. [Google Scholar] [CrossRef] [Scilit] [PubMed]
- Liaqat, N.; Jahan, N.; Khalil-ur-Rahman; Anwar, T.; Qureshi, H. Green Synthesized Silver Nanoparticles: Optimization, Characterization, Antimicrobial Activity, and Cytotoxicity Study by Hemolysis Assay. Front. Chem. 2022, 10, 952006. [Google Scholar] [CrossRef] [Scilit] [PubMed]
- Murugesan, S.; Elumalai, M.; Dhamotharan, R. Green Synthesis of Silver Nanoparticles from Marine Alga Gracilaria edulis. Biosci. Biotechnol. Res. Commun. 2011, 4, 105–110. [Google Scholar]
- Priyadharshini, R.I.; Prasannaraj, G.; Geetha, N.; Venkatachalam, P. Microwave-Mediated Extracellular Synthesis of Metallic Silver and Zinc Oxide Nanoparticles Using Macro-Algae (Gracilaria edulis) Extracts and Its Anticancer Activity Against Human PC3 Cell Lines. Appl. Biochem. Biotechnol. 2014, 174, 2777–2790. [Google Scholar] [CrossRef] [Scilit] [PubMed]
- Ganesan, V.; Aruna Devi, J.; Astalakshmi, A.; Nima, P.; Thangaraja, A. Eco- Friendly Synthesis of Silver Nanoparticles Using a Sea Weed, Kappaphycus alvarezii (Doty) Doty Ex P.C. Silva. Int. J. Eng. Adv. Technol. 2013, 2, 559–563. [Google Scholar]
- Baskar, B.B. Biosynthesis of Silver Nanoparticles Using Kappaphycus Species. Int. J. Res. Pharm. Sci. 2013, 3, 5873–5878. [Google Scholar]
- Monakhova, P.A.; Shalaev, P.V.; Gorev, I.N. Rapid Characterization of Synthesized Nanoparticles’ Liquid Dispersions Using Nanoparticle Tracking Analysis. Mater. Proc. 2023, 14, 65. [Google Scholar] [CrossRef] [Scilit]
- da Conceição, E.F.; dos Santos Freitas Viana, D.; Rocha, A.F.R.; de Morais da Silva, V.; Vieira, J.G.C.; de Oliveira, A.M.M.; de Menezes, B.T.B.; de Sá, M.V.A.; dos Santos, L.N.; Lizanio, T.M. Análise da estabilidade de nanopartículas de prata estabilizadas em extrato de ipê-roxo (Tabebuia impetiginosa (Mart. ex Dc.) Standl.). Braz. J. Implantol. Health Sci. 2024, 6, 2335–2367. [Google Scholar] [CrossRef] [Scilit]
- Manzoor, S.I.; Jabeen, F.; Patel, R.; Alam Rizvi, M.M.; Imtiyaz, K.; Malik, M.A.; Dar, T.A. Green Synthesis of Biocompatible Silver Nanoparticles Using Trillium govanianum Rhizome Extract: Comprehensive Biological Evaluation and in Silico Analysis. Mater. Adv. 2025, 6, 682–702. [Google Scholar] [CrossRef] [Scilit]
- United States Environmental Protection Agency (EPA) Green Chemistry. Available online: https://www.epa.gov/greenchemistry (accessed on 6 July 2026).
- United Nations. Sustainable Development Goals. Available online: https://sdgs.un.org/goals (accessed on 6 July 2026).
- Doan, L.; Pham, N.V.H.; Nguyen, P.B.N.; Le, Q.N.; Phung, T.K.; Ngo, T.T. Marine Algae as Sustainable Platforms for the Green Synthesis of Metal Nanoparticles. ACS Omega 2026, 11, 15598–15616. [Google Scholar] [CrossRef] [Scilit] [PubMed]
- Teh, H.Y.; Lam, M.K.; Chai, Y.H.; Lim, J.W.; Wong, V.-L.; Tan, I.S.; Lau, S.Y.; Cheng, Y.W. Green Synthesis of Silver Nanoparticles by Algae: Advancements, Challenges and Sustainable Prospects. Mater. Today Chem. 2024, 42, 102389. [Google Scholar] [CrossRef] [Scilit]
- Mandal, A.K.; Nayak, R.; Pradhan, B.; Behera, C.; Behera, A.K.; Parida, S.; Patra, S.; Hembram, P.; Jena, M. Algal-Derived Nanoparticles and Their Antibacterial Potential: Current Evidence and Future Prospectives. J. Microbiol. Methods 2023, 211, 106790. [Google Scholar] [CrossRef] [Scilit] [PubMed]
- Marcek Chorvatova, A.; Uherek, M.; Mateasik, A.; Bruncko, J.; Matusikova, I.; Sedlakova-Kadukova, J. Synthesis-Dependent Effects of Silver Nanoparticles on the Green Freshwater Alga Chlorella vulgaris. Algal Res. 2026, 95, 104614. [Google Scholar] [CrossRef] [Scilit]

Disclaimer/Publisher’s Note: The statements, opinions and data contained in all publications are solely those of the individual author(s) and contributor(s) and not of MDPI and/or the editor(s). MDPI and/or the editor(s) disclaim responsibility for any injury to people or property resulting from any ideas, methods, instructions or products referred to in the content. |
© 2026 by the authors. Licensee MDPI, Basel, Switzerland. This article is an open access article distributed under the terms and conditions of the Creative Commons Attribution (CC BY) license.