


Abstract
The Italian coastal zone is a dynamic and fragile environment that is characterized by high ecological vulnerability and subjected to strong anthropogenic pressures that significantly alter its natural morphology and environmental balance. In this scenario, port infrastructures represent about 35% of the Italian artificial coast and have a significant influence on coastal dynamics and seabed integrity. This study proposes a new methodology based on polygon-based mapping to calculate the spatial extent and distribution of the transformation areas associated with port development. This allows us to define a new specific indicator, named the Port Pressure Indicator, to assess the impact of port infrastructures. The proposed analysis highlights that port-related pressures on the marine-coastal zone are driven by two main factors: large-scale ports, which account for more than half of the total transformation areas, and a widespread network of minor ports, which are responsible for the systematic fragmentation of coastal continuity. By providing a standardized measurement of transformation areas, this approach supports coastal spatial planning and monitoring. Moreover, it provides a baseline for assessing spatial pressure and supporting integrated coastal zone management assessments.
1. Introduction
The coastal zone represents one of the most complex, dynamic, and fragile environments globally, characterized by high ecological vulnerability and severe anthropogenic pressure. Over the past century, intensive coastal urbanization, often termed coastalisation, has concentrated approximately 40% of the global population and key socioeconomic activities within 100 km of the shoreline [1,2,3]. The growing artificialization of coastal areas has significantly altered the physical environment, disrupting littoral dynamics with consequences for seabed characteristics and water quality [4,5,6,7]. In European coastal areas, the cumulative physical disturbance generated by such anthropogenic pressures is reported to affect approximately 86% of the territory [3]. In this context, port infrastructures play a key role: about 9% of the Italian coast is occupied by artificial structures, 35% of which (approximately 275 km) consist of such facilities [8]. This value accounts for more than 5% of the national low-lying coast and reaches 8% when compared to the total length of sandy beaches [9].
This spatial footprint is the direct cumulative result of how these infrastructures have evolved over the long term. Historically, port development transitioned from pre-industrial coastal shelters to large-scale logistical hubs during the post-WWII economic boom and the rise of containerization of the 1970s and 1980s [10,11]. To accommodate growing trade volumes and modern vessel drafts, these areas expanded both inland and seaward, causing substantial land take and seafloor alteration [11,12,13].
In Italy, these port-induced physical alterations are particularly critical given the extensive spatial footprint of port infrastructures, which rank among the pressures with the largest spatial extents at the national scale [14]. In general, in the marine environment, the construction of port facilities (e.g., breakwaters, quays, and offshore breakwaters) results in the loss of the natural seabed by replacing it with artificial structures. Additionally, the semi-enclosed spatial configuration of harbour basins typically modifies local hydrodynamics, inducing a potential accumulation of sediments, litter, and contaminants, as well as grain-size changes [15,16,17,18,19]. Finally, in terrestrial areas, excavation activities undertaken for the construction or expansion of harbour basins, canal ports, or quay facilities involve the physical removal of land, leading to the irreversible conversion of terrestrial environments into marine areas.
To address the scale and complexity of these physical footprints, the literature emphasizes the necessity of mapping and quantifying these physical footprints to manage coastal vulnerability. Geospatial and GIS-based frameworks have been widely implemented to monitor impacts due to port expansions in diverse coastal contexts [12]. Despite the significant footprint of port-induced transformations, the coastal monitoring and spatial planning literature still lacks a comprehensive assessment methodology. In Italy, coastal artificialization has been traditionally assessed at the national scale through linear indicators, resulting in a one-dimensional representation of coastal transformations [9]. However, integrated spatial planning requires a methodological shift towards georeferenced polygon-based analyses [20,21], which facilitate a more accurate quantification of the spatial extent of anthropogenic pressures associated with port infrastructure. Indeed, polygon-based mapping overcomes the systematic underestimations of traditional linear metrics, enabling an accurate assessment of such anthropogenic pressure [22]. To compare different coastal areas, normalizing these metrics is fundamental to eliminate landscape-size dependency [23]. Finally, utilizing standardized, GIS-based geometric baselines drastically reduces the subjectivity and high positional uncertainty typical of traditional visual shoreline indicators [24]. Assessing these port-induced spatial changes as a proxy for anthropogenic pressure closely aligns with European environmental policies. Primarily, it supports the EU Integrated Coastal Zone Management (ICZM) approach (Recommendation 2002/413/EC) [25], which recognizes the escalating pressure on coastal resources driven by near-shore and on-shore infrastructure development. Furthermore, it contributes to the implementation of the EU Water Framework Directive (2000/60/EC) [26] by providing the basis for identifying significant morphological modifications and classifying water bodies as artificial or heavily modified. Evaluating these transformations is fully consistent with the Marine Strategy Framework Directive (MSFD, Directive 2008/56/EC) [27], which identifies physical loss as a major source of pressure impacting seafloor integrity. Finally, it aligns with the EU Nature Restoration Regulation (Regulation (EU) 2024/1991) [28], which targets coastal ecosystems and permits using spatial data on pressures and threats.
In this context, this study proposes a novel geospatial methodology based on polygon-based mapping within a GIS environment to quantify the spatial footprint of port transformations across both emerged and submerged environments.
This paper categorizes port-induced transformation areas into three main categories, mapping both permanent seafloor modifications and the transition of coastal zones from emerged to submerged environments: Seabed Obstruction and Seabed Alteration, and Land Excavation. The polygon mapping approach makes it possible to delineate and quantify the 2D spatial footprints of these transformations along the Italian coastline at municipal and regional levels. Finally, the study introduces the Port Pressure Indicator, a novel synthetic metric that normalizes total transformed areas against available low-lying shorelines, providing an objective and scalable framework for comparing anthropogenic pressure across different coastal regions.
2. Materials and Methods
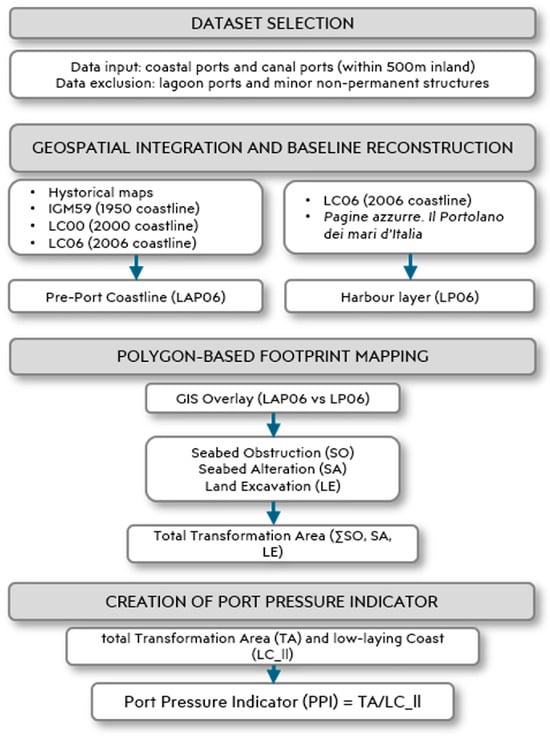
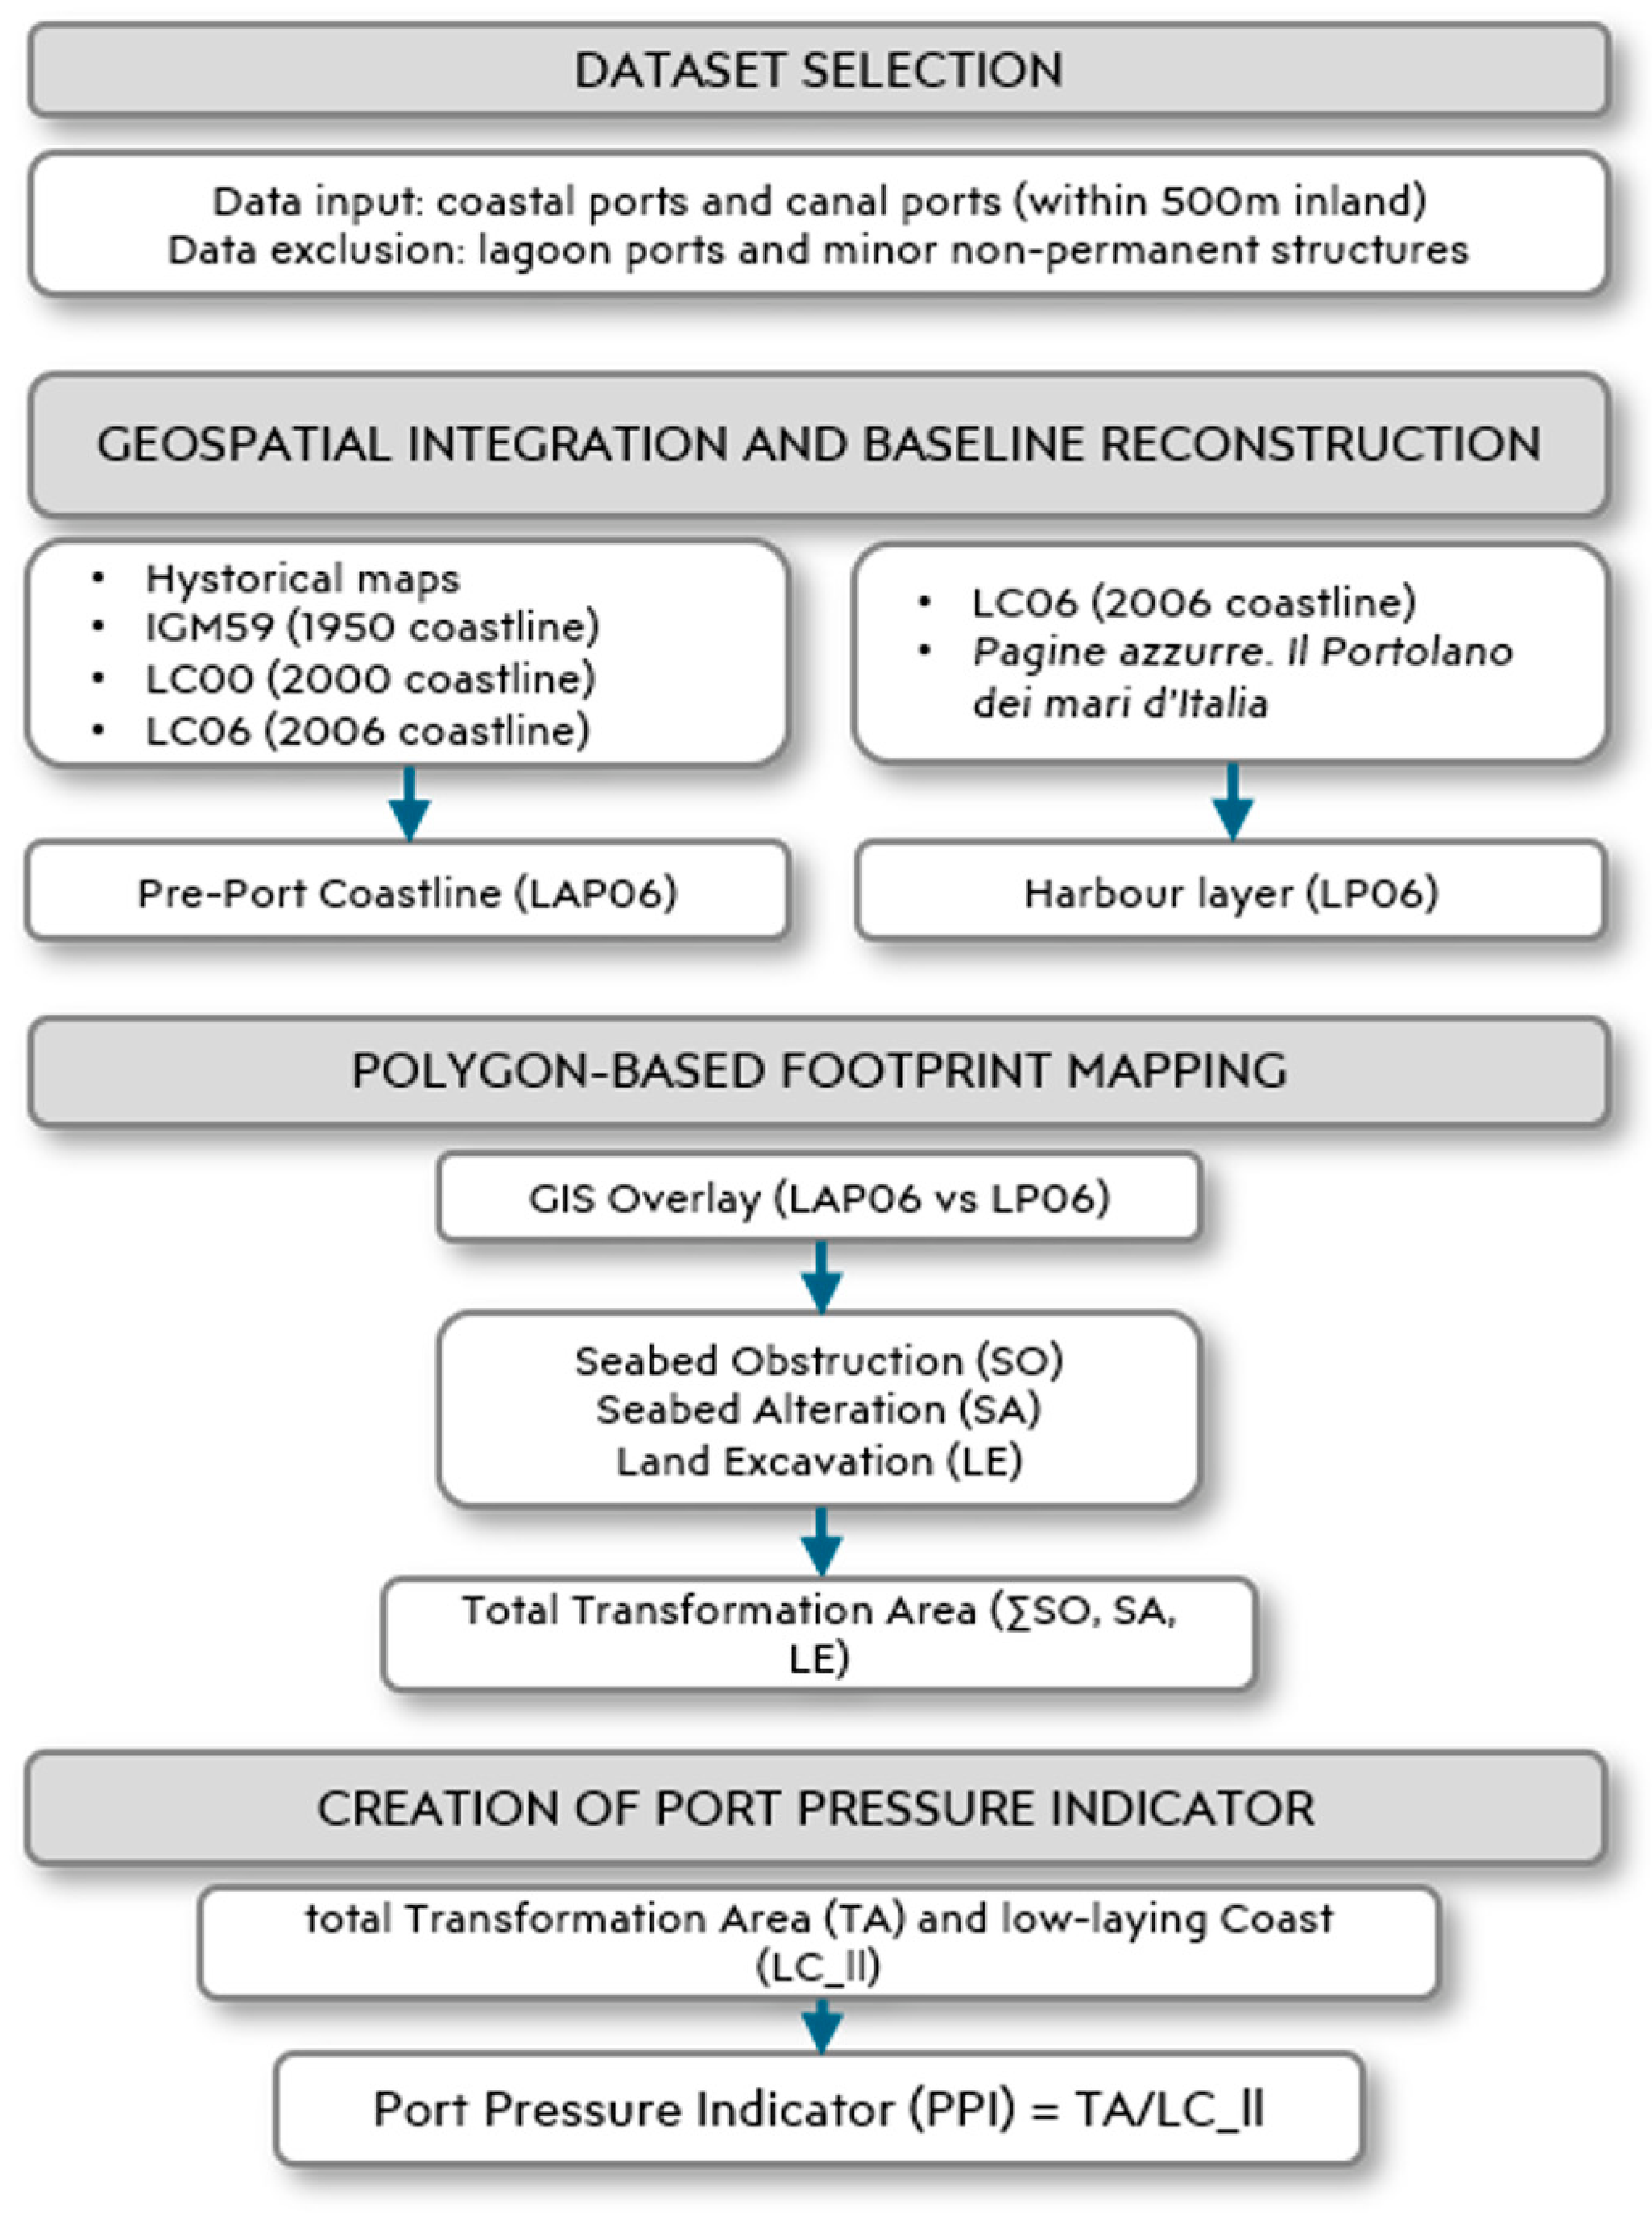
The methodological framework adopted in this study is shown in the flowchart in Figure 1.
Figure 1.
Flowchart of the methodological framework.
2.1. Dataset and Geospatial Analysis
The analysis included only coastal ports located directly along the coastline and canal ports situated within 500 m inland of the coastline. Ports located in lagoons were excluded due to their specific environmental context, while minor maritime structures were excluded because they are non-permanent facilities or serve functions other than port operations. Based on these selection criteria, a spatial analysis was carried out within a GIS environment using ESRI ArcMap (v. 10.8.2) [29] by integrating several vector layers, each with a different level of accuracy.
In particular, the following datasets were used:
- -
- IGM50 (1950 Coastline). The IGM50 dataset was created through the digitization of the historical coastline derived from IGM (Istituto Geografico Militare) topographic maps at a scale of 1:25,000. These maps (most of which were produced during the 1950s) provide a reliable representation of the configuration of Italian ports in that period. A positional uncertainty of ±25 m was assumed for this dataset, reflecting the cartographic accuracy of the source material. This level of uncertainty is considered acceptable for the analysis of port infrastructures, whose dimensions are generally at least one order of magnitude larger.
- -
- LC00 (Coastline 2000) and LC06 (Coastline 2006). These datasets are available within the ISPRA Coastal Configuration GeoDatabases (AC00 and AC06, [8]). They derive from high-resolution orthophotographs provided by the Italian Ministry for the Environment, with spatial resolutions of 1 m and 0.5 m for AC00 and AC06, respectively [17]. The digitization procedure ensures a positional accuracy within 3 m of the actual shoreline. These datasets classify the coastline into “natural coast” and “artificial coast”; in the case of artificial coast associated with ports and marinas, the coastline is further categorized as “port infrastructure” [30].
- -
- LP06 (Harbour Layer 2006). The LP06 layer is included in the ISPRA AOM06 GeoDatabase [8]. The dataset derives from the LC06 layer integrated with the information reported in the “Pagine azzurre. Il Portolano dei mari d’Italia”, an Italian nautical guide providing detailed technical, geographical, and infrastructural data on national ports and marinas [31]. This integration made it possible to associate “port infrastructures” (as defined in LC06) with their corresponding ports and to define their specific functions (e.g., military port, commercial port). According to these criteria, 674 coastal ports were identified. Moreover, the LP06 layer was integrated with the closing line separating the port basins from the open sea. This line was drawn across the harbour mouth, identified by official marine navigation lights (red and green beacons). The coordinates of these beacons were extracted from the “Pagine azzurre. Il Portolano dei Mari d’Italia” [7].
All the datasets mentioned above are freely available on ISPRA Coastal Portal [8].
2.2. Baseline Reconstruction
The key element of the methodology lies in the creation of the 2006 Pre-Port Coastline (LAP06). This geospatial layer represents the baseline coastal configuration prior to the port infrastructures built up to 2006. This layer establishes the reference baseline required to quantify coastal changes induced by port construction.
To create the LAP06 layer, different construction periods were considered:
- -
- For recent ports (2000–2006): the baseline is represented by the LC00 layer;
- -
- For mid-to-late 20th-century ports (1950–2000): the baseline is represented by the IGM50 layer;
- -
- For historical pre-1950 ports: a specific analysis was conducted. For less complex infrastructures, such as ports with a single breakwater, the baseline was derived from a straight line connecting the breakwater’s root points; for major historical ports, the baseline reconstruction was supported by historical archival maps, archeological site mapping, and heterogeneous documentary sources.
2.3. Transformation Area Polygons
Based on the physical impacts induced by port infrastructure on coastal environments, three types of port transformation were identified:
- -
- Seabed Obstruction (SO): This category includes portions of the seabed occupied by port structures and facilities (e.g., piers, quays, breakwaters, and land reclamation areas) inducing the permanent replacement of the natural substrate [32]. This transformation also entails the loss of pre-existing marine habitats [33] and it corresponds to the physical loss pressure sensu (MSFD, 2008/56/EC) [27].
- -
- Seabed Alteration (SA): This category includes marine areas within port basins that are subject to bathymetric, morphological, and sediment grain-size modifications. These changes result from the low hydrodynamic conditions characterizing port basins, as well as from dredging activities required to maintain port operability.
- -
- Land Excavation (LE): This category includes terrestrial areas that are permanently submerged due to port construction. It also encompasses the terminal reaches of river channels that have undergone morphological modifications to ensure navigability.
The total transformation areas (TAs) are defined by the sum of these three components.
The polygons representing the transformation areas (SO, SA, LE) were defined through a GIS overlay mapping between the LP06 and LAP06 layers, based on the following criteria:
- -
- SO Polygons: identify submerged areas in LAP06 but occupied by infrastructure or landfills (emerged areas) in LP06.
- -
- LE Polygons: identify emerged areas in LAP06 but transformed into water bodies or port basins in LP06.
- -
- SA Polygons: identify submerged areas in both layers, located within the harbour mouth as delimited by maritime signalling.
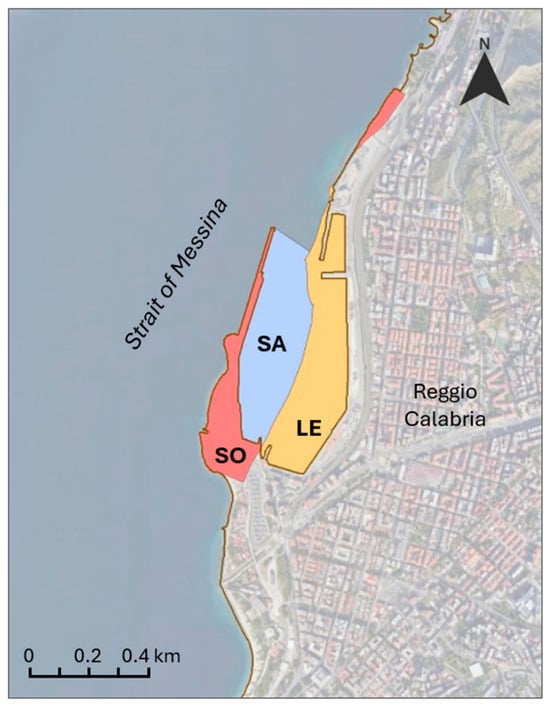
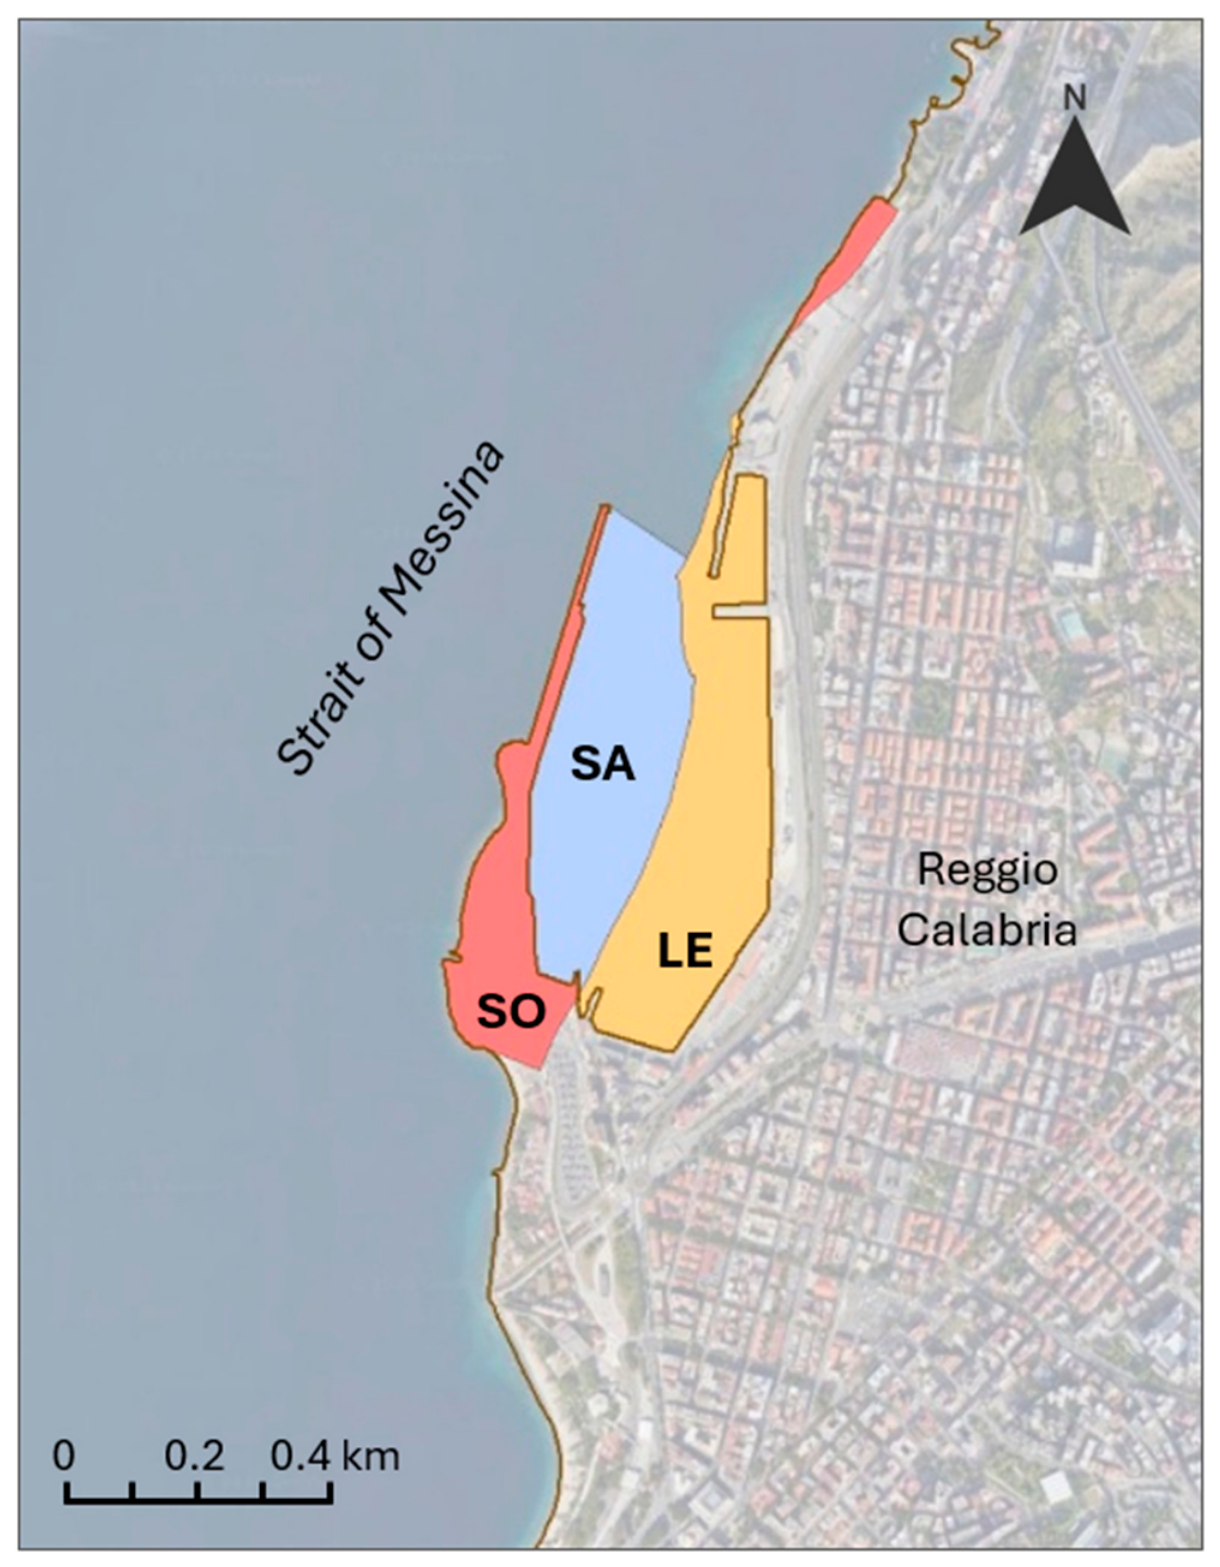
Figure 2 shows the spatial distribution of the transformation areas (SO, LE, and SA) in the Port of Reggio Calabria.
Figure 2.
Spatial distribution of transformation areas in the Port of Reggio Calabria: (Seabed Obstruction (SO) in red, Seabed Alteration (SA) in grey and Land Excavation (LE) in orange).
Using spatial overlay operations, each polygon was linked to administrative boundaries (municipality and region) and classified according to the 2006 Eurostat LAU codes.
Administrative territorial boundaries were used to assign SO and LE polygons to the municipal level. A specific criterion was adopted for SA polygons: for port basins facing the territory of a single municipality, the assignment was automatic; in the case of basins shared among multiple municipalities (e.g., the ports in the Gulf of Poets, Gulf of Augusta, etc.), the polygon was attributed to the municipality hosting the Port System Authority (or the port management body).
To explore patterns among coastal municipalities based on the three impact-related variables (SO, SA, and LE), a Principal Component Analysis (PCA) was performed. The analysis was conducted on 32 municipalities with values greater than 1% for at least one of the three variables. Statistical analyses were performed using R version 3.6.2 (12 December 2019) [34] and the ade4 package [35,36,37,38].
2.4. Port Pressure Indicator
A Port Pressure Indicator (PPI) was developed to assess the intensity of port-related pressure along low-lying coastlines. The indicator was calculated for each coastal region as the ratio between the port transformation area (TA, m2) and the length of the natural low-lying coastline (LC_ll, m). The resulting indicator is expressed in metres (m).
where
PPI = TA/LC_ll
TA (m2) = transformation areas;
LC_ll (m) = length of the low-lying coastlines.
The indicator represents the equivalent mean width of coastal areas transformed by port infrastructure along the regional low-lying coastline. By normalizing the transformed area to the length of the low-lying coastline, the indicator enables a comparison of the relative pressure of port infrastructures among regions with different coastal extents.
Conceptually, the PPI is conceived as a direct accounting spatial metric that quantifies the physical footprint of port-induced transformations per unit of low-lying coastline length. As a direct geometric measurement derived from spatial overlay analysis, its reliability stems from the resolution and topological accuracy of the underlying geodatabases, rather than from predictive or statistical modelling.
For the calculation of PPI, regional coastline length was estimated, excluding high-coast sectors, which are generally not suitable for port infrastructure development. The low-lying coastline used to calculate PPI comprises beaches and rocky shores characterized by an elevation less than 5 m. Selecting a stable topographic elevation baseline instead of dynamic, subjective visual waterlines is crucial for establishing a repeatable reference [24].
3. Results and Discussion
The analysis conducted at the national scale identified a total of 674 coastal ports, of which 31 were built between 2000 and 2006, and 422 between the 1950s and 2000; the remaining 221 were already in existence, at least partially, prior to the 1950s.
3.1. Analysis of Port Transformation Areas
A total of 3641 polygons of the port transformation areas (SO, SA and LE) were identified and mapped, covering a total area of 231.7 km2. This value highlights the considerable magnitude of the impact induced by port infrastructures on the coastal zone.
In detail, polygons associated with the three components are distributed as follows:
- -
- 2041 polygons relating to SO, corresponding to a total area of 44.3 km2;
- -
- 517 polygons relating to SA, covering a total area of 174.9 km2;
- -
- 1083 polygons relating to LE, for a total area of 12.5 km2.
The integration of geographic data with administrative units (municipalities) revealed that out of a total of 644 coastal municipalities, 319 host ports of different types and sizes, and are therefore associated with coastal zone transformation processes. The analysis of the frequency of the transformation areas reveals a prevalence of municipalities with SO (303), followed by those with SA (281) and LE (234) components.
Data related to SO (Seabed Obstruction), SA (Seabed Alteration), LE (Land Excavation), and TA (Total Transformation Area, sum of the three components) are reported in Table 1. This table includes municipalities with at least one parameter value greater than 1% of the respective national total. Parameter values smaller than 1% are indicated with an asterisk (*) and do not indicate zero values. The full dataset is available in Table S1 (Supplementary Materials).
Table 1.
Distribution of SO, SA, LE and TA, expressed in km2 and %, in municipalities with at least one parameter value greater than 1% of the respective national total (* indicates parameter values smaller than 1%).
Distribution of Seabed Obstruction (SO)
The analysis of the distribution of the 2041 SO polygons shows a very strong geographic polarization: out of the 319 surveyed coastal municipalities, 70% of the total area of 44.3 km2 is concentrated within just 22 municipalities (Table 1).
Overall, two main drivers influence the distribution of SO. The first is the historical city-port linkage in morphologically constrained territories (e.g., Genoa, La Spezia, Naples, and Ancona), where seaward expansion represented the only solution to the lack of hinterland space; the second is the functional specialization of the ports, which distinguishes logistics hubs that require large container terminals and Ro-Ro ones (e.g., Trieste, Livorno, Olbia) and major industrial-logistics infrastructures (e.g., Taranto, Civitavecchia, Augusta, Porto Torres). Conversely, SO transformations are absent in 17 municipalities (Table S1); these cases feature canal ports or inland ports excavated from emergent land which, by definition, do not obstruct the original seabed.
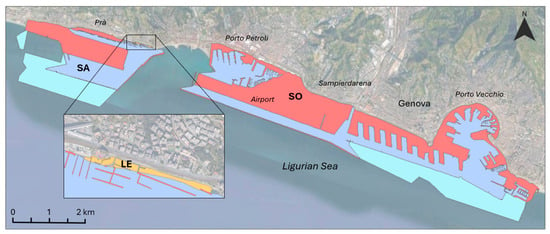
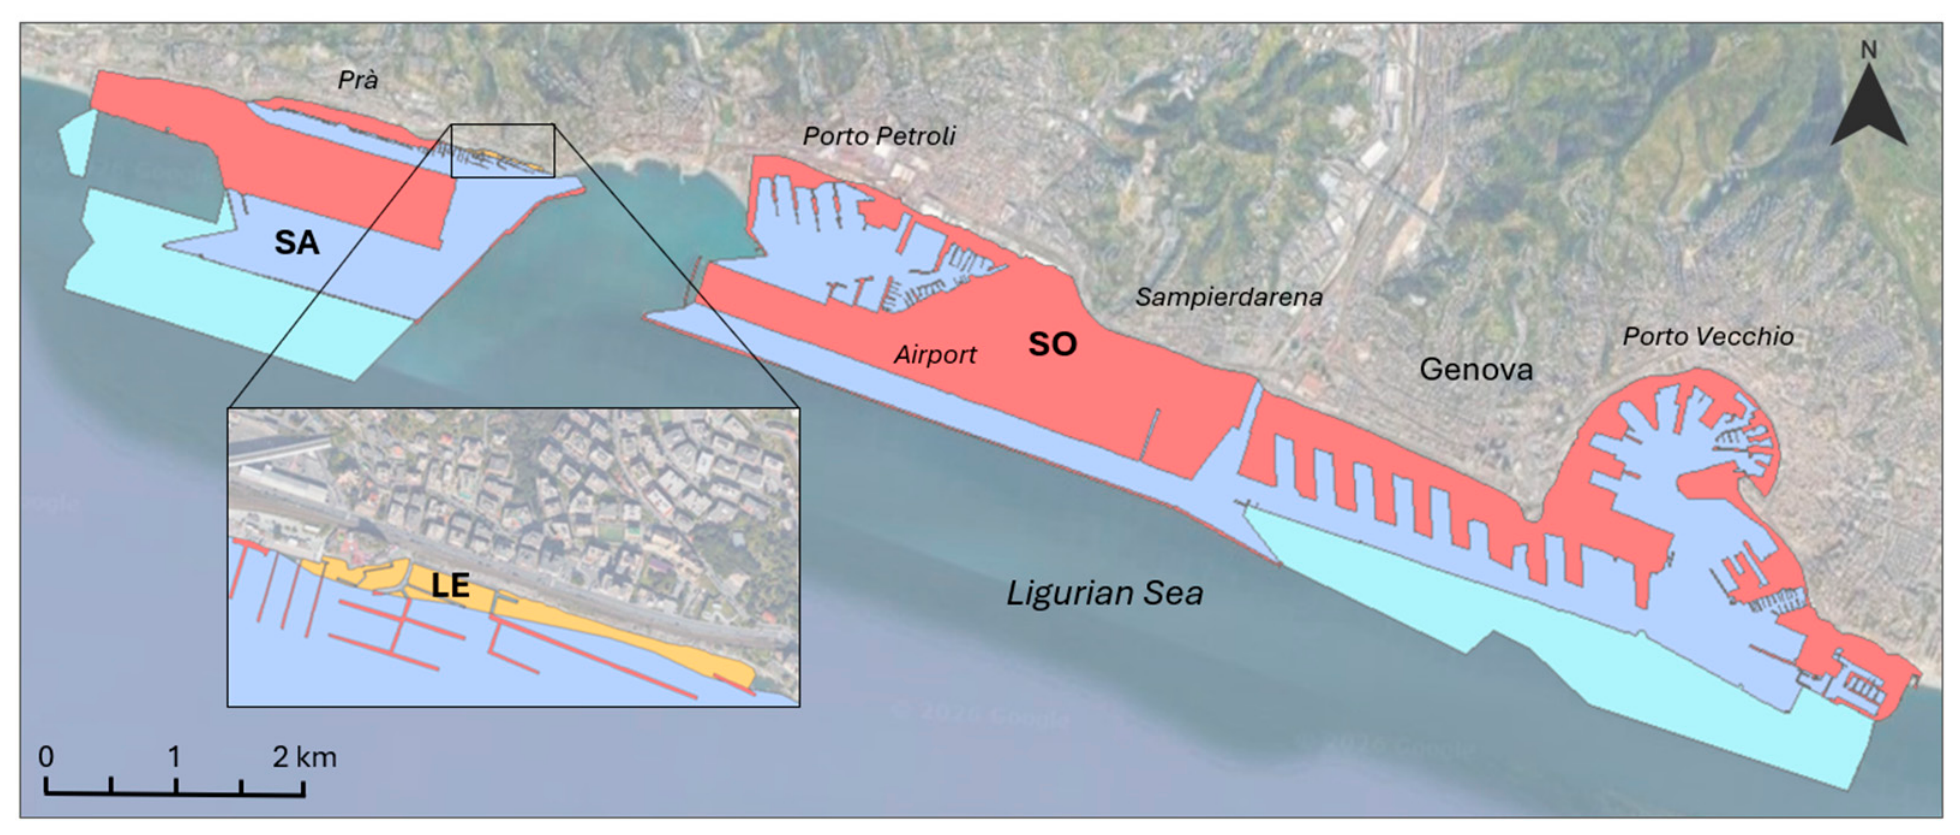
The most significant contribution comes from the municipality of Genoa which, covering 8.1 km2, accounts for 18.3% of the total national value. This high incidence is related to the specific historical-morphological evolution of the Ligurian port, characterized by a progressive functional stratification: from the historical core of the Porto Vecchio to the 20th-century expansions of Sampierdarena, up to the more recent constructions of Pra’ and the Porto Petroli. In this context, the topography (which limits the availability of flat land, compressing settlements and infrastructures along a narrow coastal strip) has favoured the seaward expansion interventions [39]. The SO includes the polygons relating to the airport area (1.65 km2), which are closely integrated with the Porto Petroli basin and the adjacent marinas (Figure 3).
Figure 3.
Transformation areas in Genova port: SO (red), SA (indigo) and SA related to the future expansion areas (light blue), LE (orange, in the zoom area).
Distribution of Seabed Alteration (SA)
The SA component involves 281 municipalities, exceeding the 1% national threshold in 13 of them, while it is absent in 38 of them. The highest values are localized in the municipalities of Taranto, Augusta, La Spezia, and Trieste, which alone account for more than 50% of the national SA value. This result derives from the geographic configuration of these ports, which were developed by enclosing large natural bays and inlets, thus potentially overestimating the actual transformed surface areas. Due to the vast scale of these infrastructures—which often span multiple adjacent municipalities—and the absence of maritime administrative boundaries, the SA area was fully assigned to the primary municipality, identified as the seat of the Port System Authority or the port management body.
The absence of the SA component in the 38 municipalities is attributable to three port typologies for which the corresponding polygon cannot be defined: ports entirely created by excavating terrestrial areas, including canal ports; industrial piers; and ports that do not require downdrift protection structures.
Distribution of Land Excavation (LE)
Land Excavation was detected in 234 municipalities. Specifically, 14 municipalities provide a contribution exceeding the 1% national threshold, accounting for approximately 75% of the total national area (Table 1). In the remaining 221 municipalities, LE is negligible, while the component is absent in 85 municipalities (Table S1).
The largest contribution is present in Ravenna and Gioia Tauro municipalities, which together account for one-third of the national value. In Ravenna, the leading example of an Italian coastal canal port, the excavation is the result of a historical process of expanding natural canals and water bodies [40]. This model is also observed in Fiumicino, Viareggio, and Terracina. Gioia Tauro represents an emblematic example of the conversion of terrestrial areas into large industrial port basins. Ports characterized by the same LE typology as Gioia Tauro (including Cagliari, Cassano allo Ionio, Corigliano Calabro, Jesolo, La Spezia, Livorno, Monfalcone, Reggio Calabria, and Santa Giusta) account for approximately 50% of the national LE total (Table 1). A peculiar case is represented by the port of Livorno, where the expansion of the northern sector, although comparable to the Gioia Tauro model, was integrated with the pre-existing hydraulic system consisting of the Arno flood diversion channel (Scolmatore) and the Navicelli Canal.
Data analysis highlights a significant disproportion between major port hubs and widespread small-to-medium port facilities: the 221 municipalities with LE values < 1% account for 24.6% of the national total. However, this corresponds to an extremely limited average excavation area per municipality (approximately 14,000 m2), confirming that most Italian ports do not significantly alter the emerged coastal areas, being limited to modest reconfigurations of local port basins. Indeed, only a few ports account for the highest LE values.
PCA
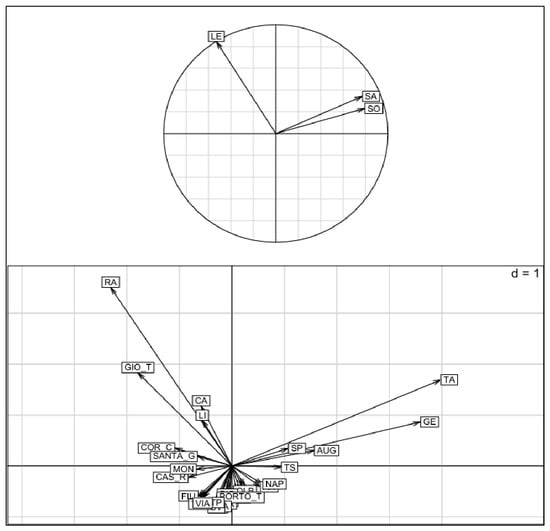
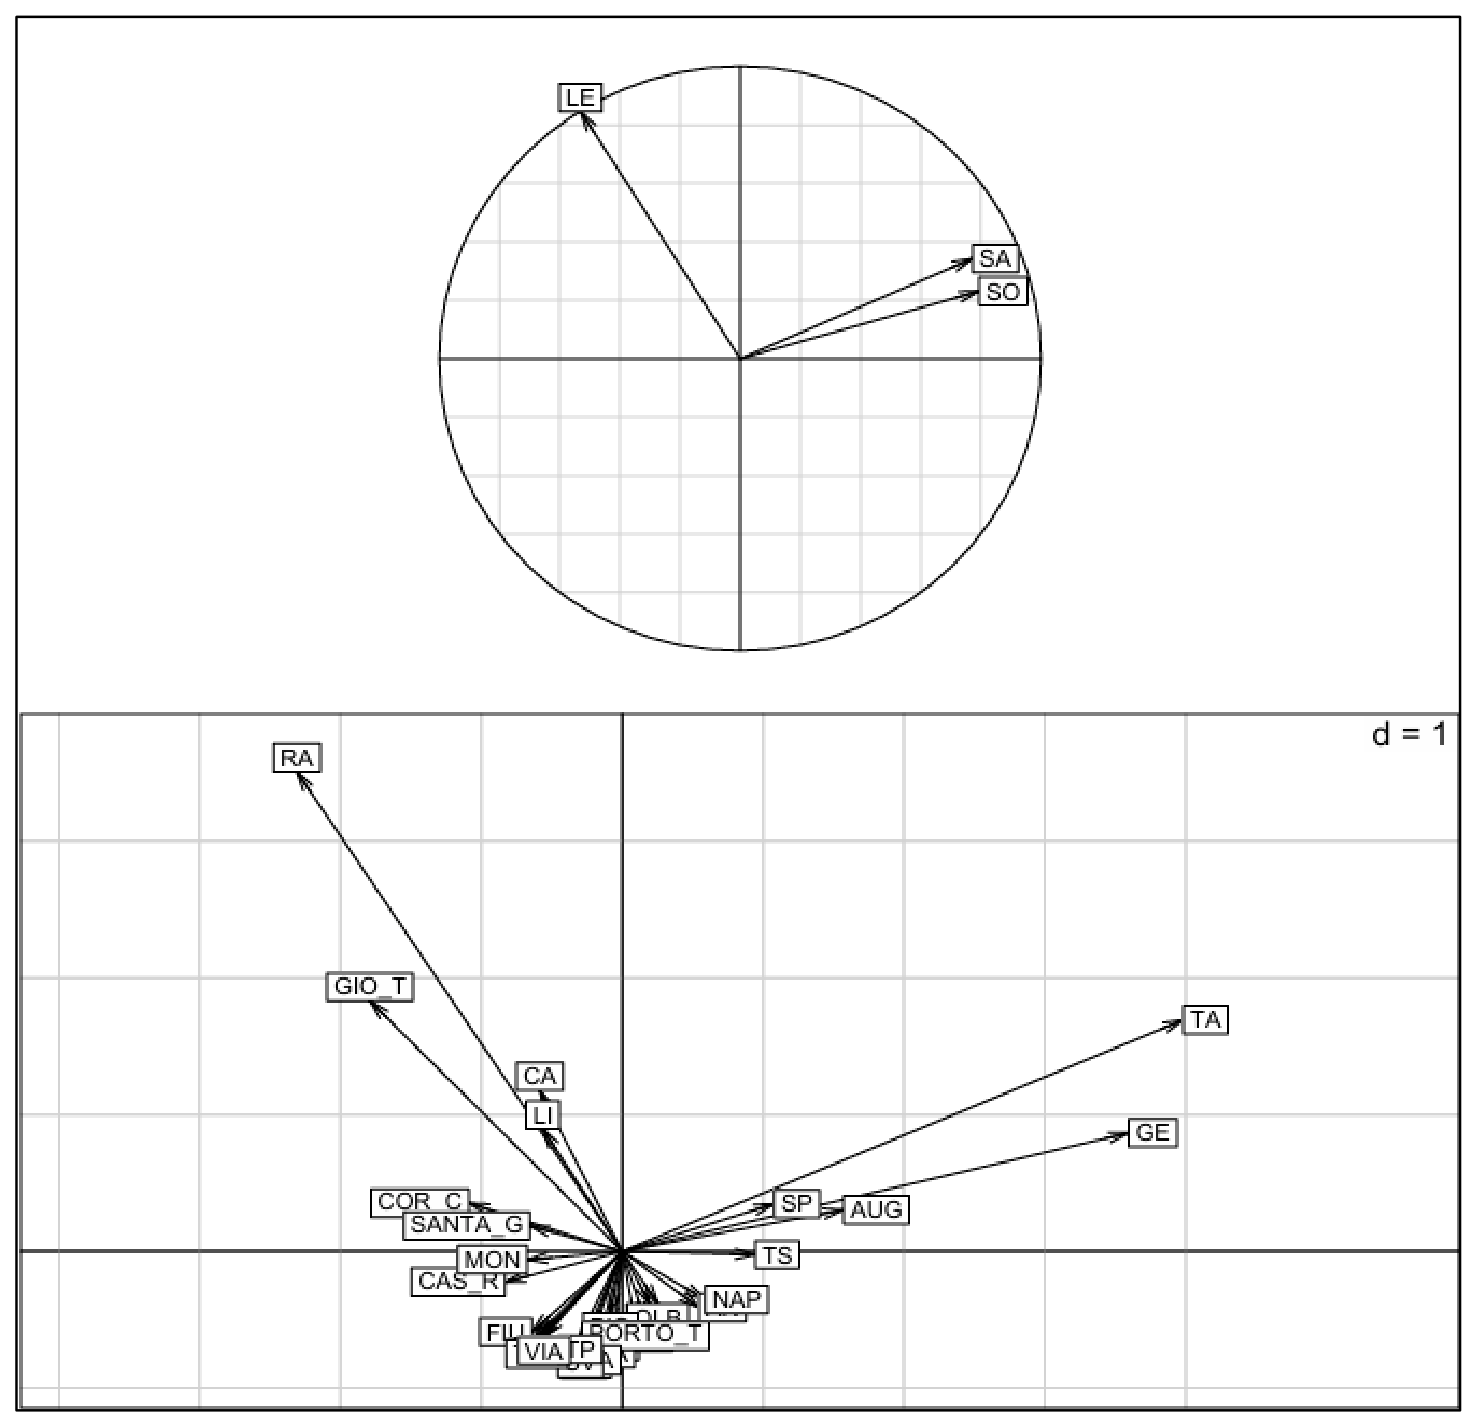
The PCA performed to investigate the distribution of coastal municipalities according to the three impact typologies is shown in Figure 4. The first two principal components explain approximately 80% of the total variance, with Factor 1 accounting for 50.29% and Factor 2 for 29.53% of the explained variance. The ordination diagram highlights a clear separation between the two main impact typologies: LE, mainly represented along Factor 2, and SO and SA, which are primarily associated with Factor 1 (Figure 4). The first quadrant highlights the strong correlation between SO and SA.
Figure 4.
PCA.
Taranto (TA) and Genoa (GE) exhibit high values for both variables. Taranto, which shows the highest SA value, is characterized by a port basin that largely overlaps with the boundaries of its natural sheltered water body (Mar Grande), which has been historically modified and enclosed for industrial and petrochemical activities. Genoa represents a particularly relevant case, showing the highest SO values. The progressive increase in maritime traffic, both in terms of volume and vessel size and draft, has taken place within a coastal setting characterized by severe topographic constraints. Consequently, the current Port Master Plan (Piano Regolatore Portuale, PRP) includes a seaward expansion expected to increase the surface area of enclosed water bodies (SA) by 4.3 km2. Factor 2, which explains nearly one-third of the total variance, is mainly associated with the LE variable and is almost orthogonal to the other two variables, indicating a substantially independent pattern. Ravenna (RA) and Gioia Tauro (GIO_T), characterized by the highest LE values, are located along this axis. Ravenna is a canal port whose development was based on pre-existing historical waterways and naturally occurring water bodies. In contrast, Gioia Tauro was created through the excavation of areas obtained by converting agricultural land or low-density urbanized areas. Conversely, the dense clustering of the majority of municipalities around the origin reflect negligible contributions to the overall variance. Municipalities positioned in this central region (such as FIU) exhibit low values for SA and SO while remaining independent from LE, thus contributing minimally to the overall variance.
3.2. Analysis of the Total Transformation Area (TA)
The total transformation area (TA), obtained from the sum of the SO, SA, and LE components, provides a quantitative measure of the overall anthropogenic footprint associated with port infrastructures. Italian municipalities with TA values greater than 1% account for approximately 70% of the national transformed surface area (Table 1).
The average TA value of the 20 municipalities with the highest values (0.88 km2), which together account for 76% of the corresponding national total, is nearly 50 times higher than the average value observed in the remaining 299 municipalities (0.02 km2) (Table S1). In 69 of these 299 municipalities, the area transformed by port infrastructure does not exceed 100,000 m2. These sites are frequently characterized by small-scale ports, in some cases with transformation areas below 1000 m2, directly excavated into rocky coastlines. The spatial distribution of TA values at the municipal scale confirms the patterns observed for the individual components: most of the transformed area is concentrated in a limited number of municipalities, whereas the remaining areas show a widespread distribution along the entire coastline.
Furthermore, the data were aggregated at the regional level (Table 2), revealing that 72.3% of the transformation areas are concentrated in just four coastal regions: Puglia (27%), Sicilia (17.7%), Liguria (16%), and Sardegna (11.6%).
Table 2.
Distribution of transformation areas (SO, SA, LE and TA) at regional scale, expressed in km2 and percentages (%).
Regarding the SO pressure, the highest values are found in Liguria (26.9%, due to the presence of Genoa and La Spezia), Sicily (14.2%, including Augusta, Palermo, Trapani, and Catania), and Puglia (13.1%, with Taranto, Bari, and Brindisi); these regions alone account for nearly 50% of the overall national value. The influence of a few major ports is even more evident for the LE component, where Ravenna and Gioia Tauro drive the high percentages recorded for Calabria (25.7%) and Emilia-Romagna (23.8%). A similar pattern is observable for SA, where Puglia (Taranto, Brindisi, and Bari) accounts for one-third of the national value.
3.3. Port Pressure Indicator (PPI)
To provide synthetic data useful for monitoring the pressure of port infrastructures on the coastline, a Port Pressure Indicator (PPI) was developed. This metric relates the transformation areas (TAs) to a specific coastal morphological parameter, the natural low-lying coastline (LC_ll) derived from the ISPRA AC06 GeoDB.
The values of PPI are presented in Table 3.
Table 3.
PPI values for coastal regions.
The PPI values highlight a highly heterogeneous situation; Friuli-Venezia Giulia and Liguria show extremely high values (256 m and 307 m, respectively), because their large port systems and widespread marinas are concentrated along a limited stretch of natural low-lying coast. More moderate values are observed in Puglia (93 m), where the extensive coastline development and generally flat morphology compensate for the pressure generated by large port infrastructures. Sicily and Sardinia show lower PPI values (38 m and 34 m, respectively), mainly due to the long extension of their low-lying coasts. In Lazio and Calabria, the PPI values (18 m and 11 m, respectively) decrease further due to the coexistence of extensive stretches of low-lying natural coastline and one major port infrastructure—specifically, Civitavecchia in Lazio and Gioia Tauro in Calabria. The lowest values were recorded in Veneto (3 m) and Basilicata (2 m). In Veneto, this is due to the methodology adopted, which did not survey lagoon ports despite their widespread presence along the coastline. In Basilicata, the low value can be attributed to the high naturalness of the coast, which is almost entirely devoid of port structures. Ultimately, the PPI values outline a picture that differs from the one based on transformation areas (TAs). By relating the TA to the actual extent of the coastline, the PPI provides a more realistic measure of anthropogenic pressure.
4. Conclusions
This study introduces a novel methodological framework for assessing anthropogenic impacts along the Italian coastline due to port infrastructures and marinas using a polygon-based spatial mapping approach that extends beyond traditional linear assessments. This approach allows the definition of a new specific indicator, named the Port Pressure Indicator, to assess the impact of port infrastructures. Moreover, the proposed methodology enables a quantitative estimation of the spatial footprint of port transformations in the coastal zone. The results show a substantial anthropogenic footprint, with mapped transformation areas (TAs) covering 231.7 km2, quantifying the spatial extent of permanent physical loss (SO) and identifying the areas potentially exposed to port-induced environmental alterations (SA and LE). The analysis identifies a clear geographical and functional polarization of these pressures. On one hand, the large-scale expansion of major logistics and industrial ports—such as Taranto, Genoa, Augusta, La Spezia, and Trieste—accounts for approximately 50% of the total transformed area. On the other hand, a widespread network of smaller marinas contributes to the progressive fragmentation of coastal morphological and spatial continuity.
The application of the Port Pressure Indicator (PPI) reveals that the magnitude of port-related impacts is not solely determined by the absolute extent of the infrastructures but also depends strongly on the morphological characteristics of the surrounding coastal setting. Extreme cases, such as Liguria (PPI = 307 m) and Friuli-Venezia Giulia (PPI = 256 m), show how intensive port development along limited stretches of natural low-lying coastline can generate disproportionately high pressure compared with regions characterized by more extensive natural shorelines.
From a management perspective, mapping and classifying port-induced physical transformations into Seabed Obstruction, Seabed Alteration, and Land Excavation allows the Port Pressure Indicator to deliver a normalized measure of the cumulative infrastructure footprint. Unlike traditional linear indicators that provide only a one-dimensional measure of coastal occupation, the PPI delivers a normalized two-dimensional (area-based) assessment of physical loss. It enables national and regional authorities to perform consistent comparisons of anthropogenic pressure across diverse morphological settings and spatial scales (local to regional). Indeed, as validated by recent integrated coastal zone management (ICZM) literature, such a composite spatial indicator is crucial for sustainable planning, serving two distinct roles: first, as a “status indicator” during preliminary assessments to pinpoint high-pressure coastal sectors, and second, as a “validator indicator” in advanced planning phases, ensuring that future master plans do not exceed predefined ecological and physical pressure thresholds [22].
Regarding future research, the primary development of this work will consist of applying the proposed polygon-based framework to updated, contemporary spatial datasets. Moreover, this methodology can be further expanded by incorporating port systems located within extensive lagoon environments, as well as terrestrial areas associated with port activities, aiming to better capture the cross-domain impacts (land–sea) of maritime infrastructure. Specifically, for ports situated within large gulfs, an analytical methodology should be developed to improve the characterization and mapping of the Seabed Alteration areas through spatial and quantitative metrics, thereby avoiding potential overestimations resulting from the geometric closure of harbour mouths. While the proposed methodology offers a consistent, if non-exhaustive, reconstruction of port-related impacts, it also enables the integration of new datasets and the continuous updating of data and analyses over time.
By integrating information on coastal transformation with conservation objectives, the proposed methodology will contribute to sustainable coastal spatial planning, establishing a standardized baseline for Integrated Coastal Zone Management (ICZM) [25] and EU Nature Restoration Regulation [28] to assess cumulative spatial pressures. In conclusion, this study provides a valuable knowledge framework to support sustainable coastal planning, informed decision-making, and to support the planning tools needed for the conservation of coastal environments under increasing anthropogenic pressures.
Supplementary Materials
The following supporting information can be downloaded at: https://www.mdpi.com/article/10.3390/su18189280/s1, Table S1: Distribution of Seabed Obstruction (SO), Seabed Alteration (SA), Land Excavation (LE) in Italian coastal municipalities.
Author Contributions
Conceptualization, F.D., M.L.C., D.P., P.L.V. and R.P.; methodology, F.D., M.L.C. and R.P.; software, F.D.; validation, R.P.; formal analysis, F.D., M.L.C. and R.P.; data curation, F.D., M.L.C. and R.P.; writing—original draft preparation, F.D., M.L.C., D.P., P.L.V. and R.P.; writing—review and editing, M.L.C., D.P. and P.L.V.; supervision, A.B. All authors have read and agreed to the published version of the manuscript.
Funding
This research received no external funding.
Institutional Review Board Statement
Not applicable.
Informed Consent Statement
Not applicable.
Data Availability Statement
The original contributions presented in this study are included in the article/Supplementary Material. Further inquiries can be directed to the corresponding authors.
Conflicts of Interest
The authors declare no conflicts of interest.
References
- Neumann, B.; Vafeidis, A.T.; Zimmermann, J.; Nicholls, R.J. Future Coastal Population Growth and Exposure to Sea-Level Rise and Coastal Flooding—A Global Assessment. PLoS ONE 2015, 10, e0118571. [Google Scholar] [CrossRef] [Scilit]
- Lagarias, A.; Stratigea, A. Coastalization patterns in the Mediterranean: A spatiotemporal analysis of coastal urban sprawl in tourism destination areas. GeoJournal 2023, 88, 2529–2552. [Google Scholar] [CrossRef] [Scilit]
- Korpinen, S.; Laamanen, L.; Bergström, L.; Nurmi, M.; Andersen, J.H.; Haapaniemi, J.; Therese Harvey, E.T.; Murray, C.J.; Peterlin, M.; Kallenbach, E.; et al. Combined effects of human pressures on Europe’s marine ecosystems. Ambio 2021, 50, 1325–1336. [Google Scholar] [CrossRef] [Scilit]
- Martins, F.; De Almeida, A.B.; Pinho, L. Have you Ever Listened Coastal Inhabitants? Know What they Think. J. Coast. Res. 2009, 1242–1246. [Google Scholar]
- Marriner, N.; Morhange, C.; Kaniewski, D.; Carayon, N. Ancient harbour infrastructure in the Levant: Tracking the birth and rise of new forms of anthropogenic pressure. Sci. Rep. 2014, 4, 5554. [Google Scholar] [CrossRef] [Scilit]
- Chapapría, V.E.; Peris, J.S.; González-Escrivá, J.A. Coastal monitoring using unmanned aerial vehicles (UAVs) for the management of the Spanish Mediterranean coast: The case of almenara-Sagunto. Int. J. Environ. Res. Public Health 2022, 19, 5457. [Google Scholar] [CrossRef] [Scilit]
- Taormina, B.; Claquin, P.; Vivier, B.; Navon, M.; Pezy, J.P.; Raoux, A.; Dauvin, J.C. A review of methods and indicators used to evaluate the ecological modifications generated by artificial structures on marine ecosystems. J. Environ. Manag. 2022, 310, 114646. [Google Scholar] [CrossRef] [Scilit]
- ISPRA—Portale Delle Coste. Available online: https://sinacloud.isprambiente.it/portal/apps/sites/#/coste (accessed on 29 July 2026).
- ISPRA—Indicatori Ambientali: Coste. Available online: https://indicatoriambientali.isprambiente.it/it/temi/coste (accessed on 29 July 2026).
- Carella, F.; De Martino, P.; Soffietti, F.; Negretto, V.; Musco, F. The spatial and governance dilemma of small and medium-sized Italian ports (SMPs): Maritime spatial planning (MSP) as a potential response. Water 2024, 16, 251. [Google Scholar] [CrossRef] [Scilit]
- Romeo, S. La parabola delle aree portuali-industriali in Italia: Una prospettiva storica. The spatial and governance dilemma of small and medium-sized Italian ports (SMPs): Maritime spatial planning (MSP) as a potential response. Ital. Contemp. 2024, 305, 267–288. [Google Scholar] [CrossRef] [Scilit]
- Foti, G.; Barbaro, G.; Barillà, G.C.; Mancuso, P. Shoreline changes due to the construction of ports: Case study—Calabria (Italy). J. Mar. Sci. Eng. 2023, 11, 2382. [Google Scholar] [CrossRef] [Scilit]
- Nigro, M.; De Domenico, M.; Murgia, T.; Stimilli, A. The Port Sector in Italy: Its “Keystones” for an Energy-Effective Growth. preprint 2024. [Google Scholar] [CrossRef] [Scilit]
- Paganelli, D.; La Valle, P.; Pulcini, M.; Proietti, R.; Nicoletti, L.; La Porta, B.; Lattanzi, L.; Pazzini, A.; Targusi, M.; Gabellini, M. Towards an evaluation of physical loss pressure in the Italian seas for the implementation of the marine strategy framework directive. J. Mar. Biol. Assoc. UK 2018, 98, 61–69. [Google Scholar] [CrossRef] [Scilit]
- Garcin, M.; Vende-Leclerc, M. Coastline artificialization and land use changes in coastal cities-Implication for coastal management in Noumea (New Caledonia). In Proceedings of the XVIèmes Journées Nationales Génie Côtier–Génie Civil, Le Havre, France, 8–10 December 2020. [Google Scholar] [CrossRef] [Scilit]
- Casado-Martínez, M.C.; Forja, J.M.; DelValls, T.A. A multivariate assessment of sediment contamination in dredged materials from Spanish ports. J. Hazard. Mater. 2009, 163, 1353–1359. [Google Scholar] [CrossRef] [Scilit]
- Schernewski, G.; Escobar Sánchez, G.; Wandersee, P.; Lange, X.; Haseler, M.; Nassour, A. Marine macro-litter (plastic) pollution of German and north African Marina and City-Port Sea floors. Appl. Sci. 2023, 13, 11424. [Google Scholar] [CrossRef] [Scilit]
- Mali, M.; Dell’Anna, M.M.; Mastrorilli, P.; Damiani, L.; Ungaro, N.; Gredilla, A.; de Vallejuelo, S.F.O. Identification of hot spots within harbour sediments through a new cumulative hazard index. Case study: Port of Bari, Italy. Ecol. Indic. 2016, 60, 548–556. [Google Scholar] [CrossRef] [Scilit]
- Li, D.; Li, P.; Shi, Y.; Sheerin, E.D.; Zhang, Z.; Yang, L.; Xiao, L.; Hill, C.; Gordon, C.; Ruether, M.; et al. Stress-induced phase separation in plastics drives the release of amorphous polymer micropollutants into water. Nat. Commun. 2025, 16, 3814. [Google Scholar] [CrossRef] [Scilit]
- García-Ayllón, S.; Gómez, F.; Bianco, F. Analysis of the spatial correlation between port areas configuration and alterations of the coastal shoreline: A multidisciplinary approach using spatiotemporal GIS indicators. Land 2022, 11, 1800. [Google Scholar] [CrossRef] [Scilit]
- Gomez, F.J.; García-Ayllón, S. Analysis of the relationship between coastal development and the alteration of beach shorelines: A retrospective view based on spatial indicators. In Proceedings of the SUPTM 2022 Conference Proceedings Sciforum-054503, Cartagena, Spain, 17–19 January 2022. [Google Scholar] [CrossRef] [Scilit]
- Ovejero Campos, A.; Fernández, E.; Suárez Eiroa, B.; Urbieta, P.; Méndez Martínez, G. A composite indicator to assess artificialization at the land-sea interface: A case study in NW Spain. Reg. Stud. Mar. Sci. 2022, 53, 102408. [Google Scholar] [CrossRef] [Scilit]
- Alphan, H. Multi-temporal analysis of urbanisation patterns as coastal development indicators: Eastern Mediterranean coast of Turkey. Ecol. Indic. 2021, 121, 106994. [Google Scholar] [CrossRef] [Scilit]
- Boak, E.H.; Turner, I.L. Shoreline definition and detection: A review. J. Coast. Res. 2005, 21, 688–703. [Google Scholar] [CrossRef] [Scilit]
- Recommendation 2002/413/EC; Recommendation of the European Parliament and of the Council of 30 May 2002 concerning the implementation of Integrated Coastal Zone Management in Europe. Publications Office of the European Union: Luxembourg, 2002.
- Directive 2000/60/EC; Directive 2000/60/EC of the European Parliament and of the Council of 23 October 2000 establishing a framework for Community action in the field of water policy. Publications Office of the European Union: Luxembourg, 2000.
- Directive 2008/56/EC; Directive 2008/56/EC of the European Parliament and of the Council of 17 June 2008 establishing a framework for community action in the field of marine environmental policy (Marine Strategy Framework Directive). Publications Office of the European Union: Luxembourg, 2008.
- Regulation (EU) 2024/1991; Regulation (EU) 2024/1991 of the European Parliament and of the Council of 24 June 2024 on nature restoration and amending Regulation (EU) 2022/869. Publications Office of the European Union: Luxembourg, 2024.
- ESRI. ArcGIS Desktop: Release 10.8.2; Environmental Systems Research Institute: Redlands, CA, USA, 2021. [Google Scholar]
- D’Ascola, F.; Cassese, M.L.; Lugeri, N.; Pesarino, V.; Salmeri, A. The ISPRA geodatabase for monitoring and analysis of the state of the Italian coasts: An example of its application to the Rocchette-Castiglione della Pescaia coastline. In Proceedings of the Ninth International Symposium “Monitoring of Mediterranean Coastal Areas: Problems and Measurement Techniques”, Livorno, Italy, 14–16 June 2022; p. 27. [Google Scholar] [CrossRef] [Scilit]
- Pagine azzurre. Il Portolano Dei Mari d’Italia. Available online: https://www.pagineazzurre.com/dev/ (accessed on 29 July 2026).
- Foden, J.; Rogers, S.I.; Jones, A.P. Human pressures on UK seabed habitats: A cumulative impact assessment. Mar. Ecol. Prog. Ser. 2011, 428, 33–47. [Google Scholar] [CrossRef] [Scilit][Green Version]
- Mayer-Pinto, M.; Johnston, E.L.; Hutchings, P.A.; Marzinelli, E.M.; Ahyong, S.T.; Birch, G.; Booth, D.J.; Creese, R.G.; Doblin, M.A.; Figueira, W.; et al. Sydney Harbour: A review of anthropogenic impacts on the biodiversity and ecosystem function of one of the world’s largest natural harbours. Mar. Freshw. Res. 2015, 66, 1088–1105. [Google Scholar] [CrossRef] [Scilit]
- R Core Team R: A Language and Environment for Statistical Computing; R Foundation for Statistical Computing: Vienna, Austria, 2019; Available online: https://www.R-project.org/ (accessed on 22 July 2026).
- Chessel, D.; Dufour, A.; Thioulouse, J. The ade4 Package—I: One-Table Methods. R News 2004, 4, 5–10. Available online: https://cran.r-project.org/doc/Rnews/ (accessed on 22 July 2026).
- Dray, S.; Dufour, A. The ade4 Package: Implementing the Duality Diagram for Ecologists. J. Stat. Softw. 2007, 22, 1–20. [Google Scholar] [CrossRef] [Scilit]
- Dray, S.; Dufour, A.; Chessel, D. The ade4 Package—II: Two-Table and K-Table Methods. J. Stat. Softw. R News 2007, 7, 47–52. Available online: https://cran.r-project.org/doc/Rnews/ (accessed on 22 July 2026).
- Bougeard, S.; Dray, S. Supervised Multiblock Analysis in R with the ade4 Package. J. Stat. Softw. 2018, 86, 1–17. [Google Scholar] [CrossRef] [Scilit]
- Brandolini, P.; Faccini, F.; Paliaga, G.; Piana, P. Man-made landforms survey and mapping of an urban historical center in a coastal Mediterranean environment. Geogr. Fis. Din. Quat. 2018, 41, 23–34. [Google Scholar] [CrossRef] [Scilit]
- Orioli, V. Ravenna, la darsena e la città. IN_BO. Rich. Progett. Territ. Città Archit. 2013, 4, 135–148. [Google Scholar] [CrossRef] [Scilit]

Disclaimer/Publisher’s Note: The statements, opinions and data contained in all publications are solely those of the individual author(s) and contributor(s) and not of MDPI and/or the editor(s). MDPI and/or the editor(s) disclaim responsibility for any injury to people or property resulting from any ideas, methods, instructions or products referred to in the content. |
© 2026 by the authors. Licensee MDPI, Basel, Switzerland. This article is an open access article distributed under the terms and conditions of the Creative Commons Attribution (CC BY) license.