


Abstract
Remote and northern communities in Canada experience disproportionately high food insecurity rates. Reliance on shipped-in produce with short shelf lives and processed food means prices are high and nutrition rates are low. Greenhouses allow for local food production, protecting plants from the external environment and maintaining optimal growing conditions. This paper presents a community-scale solar-powered off-grid greenhouse energy system which incorporates heating and lighting loads. A modelling methodology, integrating OSeMOSYS and other open-sourced methods, is described for creating the demand profiles and developing the energy systems for such greenhouses. Location-specific and time-dependent geographical data are used, and increasing lengths of growing seasons are investigated for various locations across Canada. Yearly results and overall costs for different length growing seasons allow for detailed analyses of the working of the system, capturing meaningful aspects of the design and operation that may otherwise be lost in an averaged modelling approach. Results show the system is able to lengthen the growing season for all locations at reasonable cost. More northerly locations, understandably, are unable to function year-round, and the most southerly locations suffer from inconsistent solar irradiance levels related to weather patterns, requiring an oversized battery. Many locations, including those in Yukon and Alberta, were found to benefit from long periods of solar availability, requiring a more modest system and excess solar generation in the summer, giving microgrid expansion potential.
1. Introduction
Greenhouses are becoming popular in northern Canada to provide locally grown fresh produce, providing a potential solution to address food insecurity and helping to improve diets. However, they are plagued by high costs and often use diesel generators with expensive shipped-in fuel to supply lighting and heating [1,2,3,4]. Using renewable energy to support greenhouses in northern regions may allow for longer growing seasons and prevent further dependence on unstable grid connections or diesel generators. Solar energy is understood to be an attractive energy source in the northern regions of Canada, although seasonal variations are a challenge [5]. According to a charity working with First Nations communities to support local food production across Canada, Sustainable Food Security Social Enterprise [6], many communities express interest in solar power and batteries to support the growing season. However, this raises issues of the cost-effectiveness of such a single-purpose solution and the scale of infrastructure required. To date, few studies have looked at solar energy infrastructure to support greenhouse heating and lighting. Conducting individual on-site studies for each location is not feasible due to the skills and time required.
This paper presents an off-grid solar-powered greenhouse system with an integrated methodology for scaling and costing such systems depending on the location. To illustrate its utility, eight case study locations across Canada are modelled, determining the parameters and comparative costs for community-scale solar-powered greenhouses. The locations include various Canadian climate zones and latitudes, which are studied with the aim of artificially increasing the length of the growing season.
2. Literature Review
Greenhouse studies to date have focussed on parameter and climate control modelling [7,8,9,10,11,12,13,14] and generally do not consider the integration of renewable energy in colder climates. Most models use differential or difference equations to define the physical parameters of the greenhouse [15]. Many recent models are based on some of the first mechanistic dynamic greenhouse internal climate models developed by Bot in 1983 [7] and DeZwart in 1996 [8]. Simple models for control and optimisation purposes are made by reducing these complex models [9,10,11,12,14,16]. The internal climate profiles provide essential insight into plant growing conditions or parameter control optimisation necessary to support commercial greenhouse operations. Therefore, these models inform the wider energy system by generating lighting, ventilation, and heating demands. However, the models themselves are not integrated with the energy generation for system modelling.
Typically, commercial greenhouses have a grid connection for electricity and a gas or oil supply. Several studies present energy management strategies for greenhouses [4,17,18,19,20,21]. Similar to the above-mentioned climate models, these studies use mathematical equations to represent the parameters of a greenhouse and optimise cost or energy usage for variable control management, using the thermal profile, crop growth and yield prediction, economics, etc. While such models could be used in the optimisation of the proposed solar-based system, the complexity of setting up these models makes them more appropriate for commercial use for specific crops and cost-effective yields. The Transient System Simulation Tool (TRNSYS), for example, is a popular tool for greenhouse modelling [2,11,22,23,24]. However, this system is a commercial system that requires paid subscriptions to operate. In addition, high coding and computation skills are associated with such energy modelling frameworks [25].
Most integrated energy research in the field focuses on greenhouse systems in hot and arid climates [26,27,28,29,30], where integrating renewable energy is easier due to the abundance of solar irradiance and a lack of seasons. Therefore, there is a need for new approaches integrating generation and storage into greenhouse energy systems, specifically in colder regions [31]. This paper fills this gap, providing an open-source modelling framework to assess the integration of renewable energy into greenhouses deployed in colder, northern, off-grid locations.
3. Background
Growing seasons in Canada range from 200 days, in locations such as southern British Columbia and Ontario, to as few as ten days per year in northern Northwest Territories [32].
Greenhouses are often considered for local food production to address the intersection of environmental and socioeconomic issues. Greenhouses provide a controlled environment, protecting plants from the external climate, insects, and animals. The ability to control conditions within a greenhouse, such as temperature, humidity, soil types and depths, moisture content, and nutrient levels, creates a plant-friendly environment that results in higher yields. Protection from external weather systems and seasonal climates also allows greenhouses to support the growth of a wide range of plants beyond their natural growing seasons and locations, which is ideal for improving the nutritional value of food locally available.
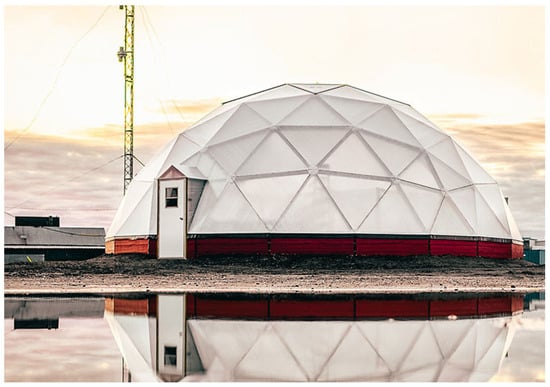
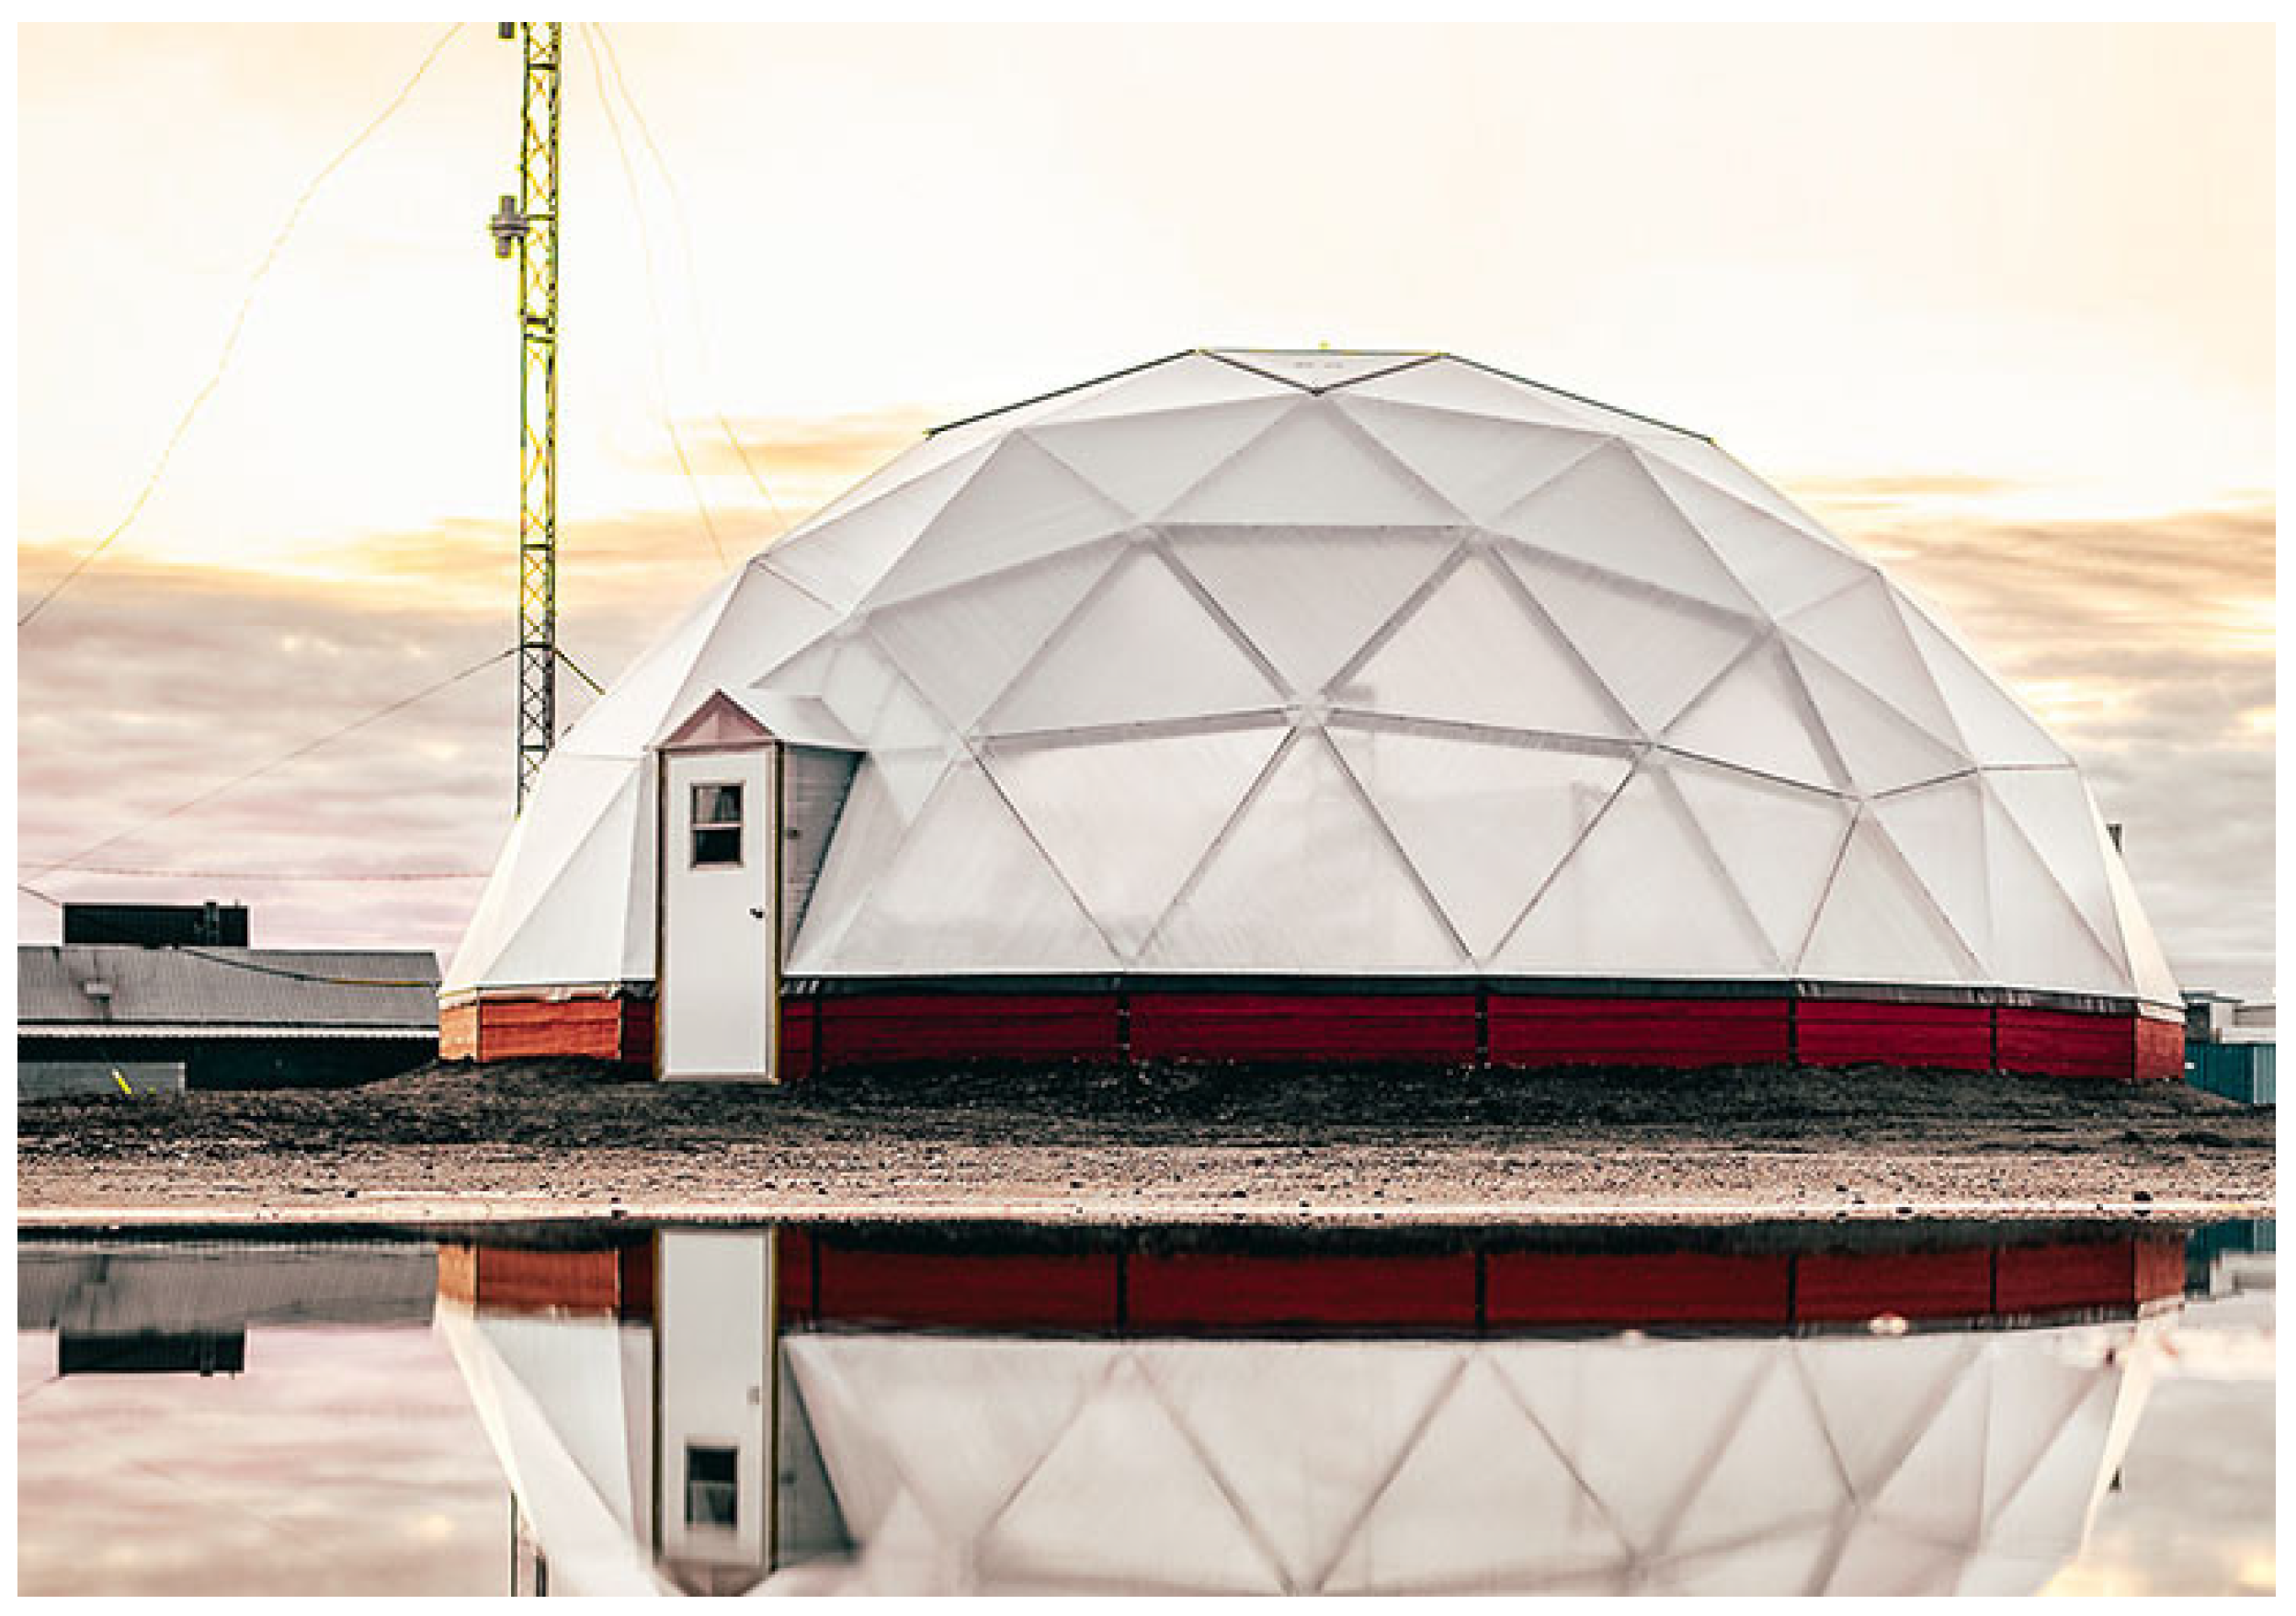
The geodesic dome or ’igloo’-shaped greenhouse is designed for energy efficiency and strength, Figure 1, and has become increasingly popular for community-scale greenhouse production [33]. It is found to be resistant to wind, hail, and snow due to its aerodynamic shape and the use of strong triangular beam structures. The curved outer envelope also allows for airflow and even heat distribution throughout the day as the sun moves. It minimises heat loss by having a surface area of around 40% smaller than similar-sized rectangular structures. As connections to the national grid are often unstable or do not exist in remote regions, diesel generators that rely on costly shipped fossil fuels have, to date, provided the most reliable energy source.
Figure 1.
Growing dome [34].
4. Solar-Powered Greenhouse System
The main parameters that require control to support plant growth in greenhouses are the indoor temperature, relative humidity, the concentration of carbon dioxide (CO2), and lighting. Table 1 shows the range of these parameters for optimum crop growth. According to [4], temperature changes create the most significant difference in crop yield, followed by light intensity, humidity, and finally CO2 concentration. Providing stable and reliable temperatures and lighting for plant growth is a greenhouse’s top priority while providing adequate ventilation avoids CO2 depletion. Much of a conventional greenhouse’s energy demand is typically spent on heating and cooling [35].
Table 1.
Optimum crop growth conditions [36].
Typically, the electricity demand of a greenhouse is mostly spent on lighting [19]. A minimum of between 10 and 12 h of exposure to photosynthetically active radiation (PAR) is required. The light spectrum utilised by plants for photosynthesis can be targeted by artificial lighting, not only allowing for the number of PAR hours to be increased, regardless of the time of day or year, but also supplementing the light intensity of hours in the day with insufficient natural solar irradiance levels. By delivering light at various wavelengths for plant development at different growth stages, light-emitting diodes (LED) have become popular in greenhouses due to their significantly lower energy consumption [37].
4.1. System Topology
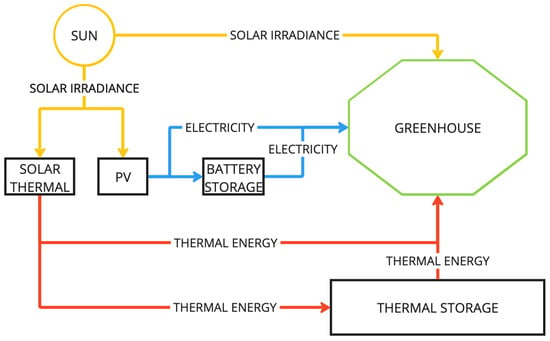
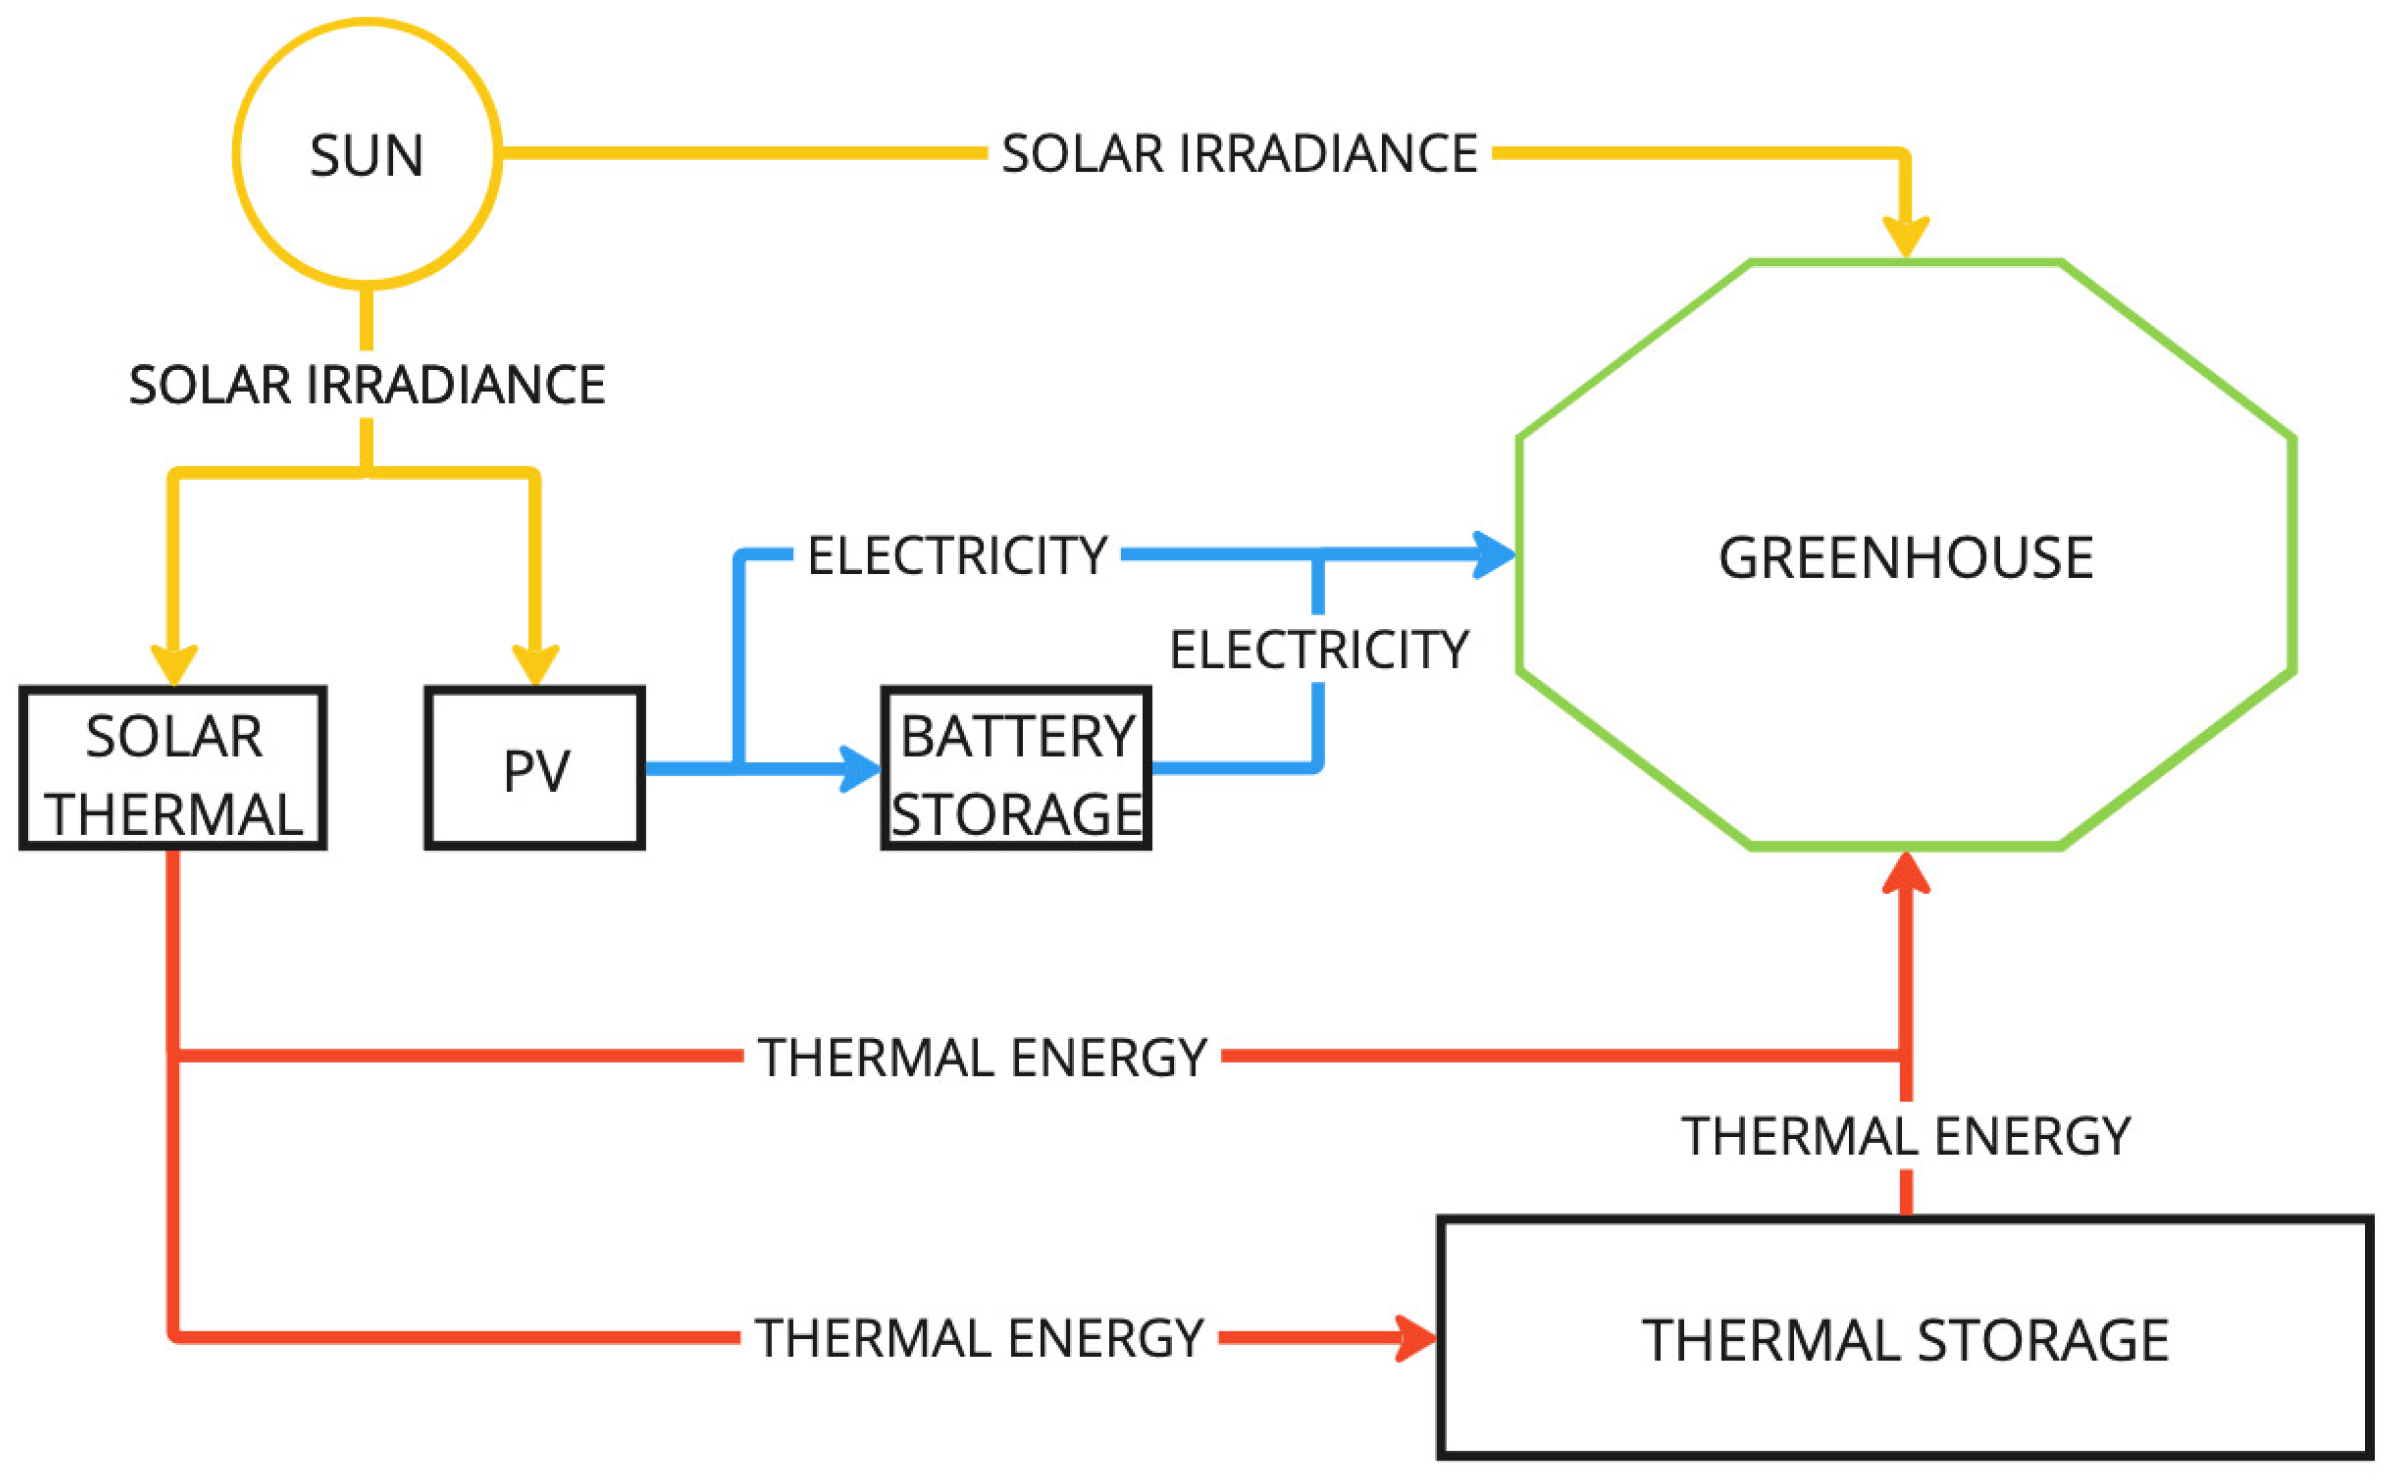
Regulating greenhouse parameters to maintain high crop yield requires a systematic approach typical of commercial-scale greenhouses. However, community-scale greenhouses lack the resources to support such systems. The energy system chosen here has all the elements to extend the growing season in greenhouses across Canada, focusing on the main needs of heating and lighting. The greenhouse is supplied by photovoltaic (PV) panels, flat-plate solar thermal collectors (STC), lithium-ion battery storage, and water tank-based thermal energy storage (TES), Figure 2. These technologies are selected due to their accessibility, ease of installation and maintenance, and scalability by modularisation. Solar energy captured by the PV and STC panels as electricity and heat, respectively, is delivered directly to the greenhouse or stored for later use in the battery and thermal storage systems. This allows the incident solar energy during the day to be applied to the greenhouse in the late evening, night, or early morning, or stored over several days, until needed [38].
Figure 2.
System component diagram ©2025 IEEE, used with permission from IEEE Proceedings [38].
Integrating controlled thermal energy storage (TES) into energy systems has the potential to reduce running costs, increase reliability, and stabilise indoor temperatures [39]. Water-based TES is the most common as it is the least complex and has the lowest costs [39], and has therefore been selected for this study paired with solar thermal collectors.
Generating solar energy from PV and STC panels are some of the most widely used renewable energy technologies [35]. The scalability of such panels allows them to be integrated conveniently into energy systems. The upfront cost and low solar irradiance levels at particular times of the year in Canada mean that justifying such an investment requires careful choices, significantly limiting many communities from implementing this technology. Furthermore, the optimum temperature range and light exposure coupled with the external conditions of northern climates imply that storage is essential to meet the greenhouse’s demand, and in design optimisation.
Here, we consider the ventilation and humidity loads for community-scaled greenhouses to be passive, requiring manual input with convection draft ventilation. No grid connection or diesel generators are included at this stage.
Controllers are also necessary for parameter control. However, an optimal controller requires perfect foresight to account for weather changes and maintain greenhouse conditions, taking into consideration the non-dispatchable nature of solar and without oversizing the energy technologies. Optimisation methods are able to provide such ’foresight’ using previous demand data. Therefore, a controller technology is not shown for the proposed solar system at this stage.
4.2. Modelling Approach
As noted in Section 2, modelling of the integration of renewable energy to support greenhouses has been limited, especially for colder and northern communities. To fill this gap, we apply the OSeMOSYS [25] open-source energy modelling system. OSeMOSYS is an energy system optimisation framework used for investment decision planning and scenario modelling. Developed as an open-sourced and freely available tool, it informs energy strategies at a high level.
OSeMOSYS is an energy modelling framework written in the GNU MathProg linear programming language. The framework, solved with a linear programming solver such as the open-source CBC solver or commercial solvers such as Gurobi or CPLEX, allows for the specification of an inter-connected energy system that represents the greenhouse being modelled. It has a linear optimisation approach, computing the energy generation and production to meet the exogenously determined demand while minimising the system’s total cost. To meet the thermal and electrical energy demands, OSeMOSYS optimises the sizing of technologies to provide the most cost-effective greenhouse system solution. As OSeMOSYS has perfect foresight, it acts as the controller for the system, optimising energy management and flow between the energy generation technologies, the storage systems, and the greenhouse.
5. Models and Methods
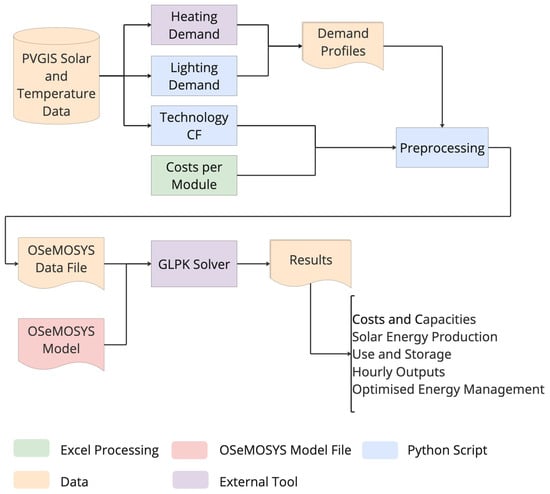
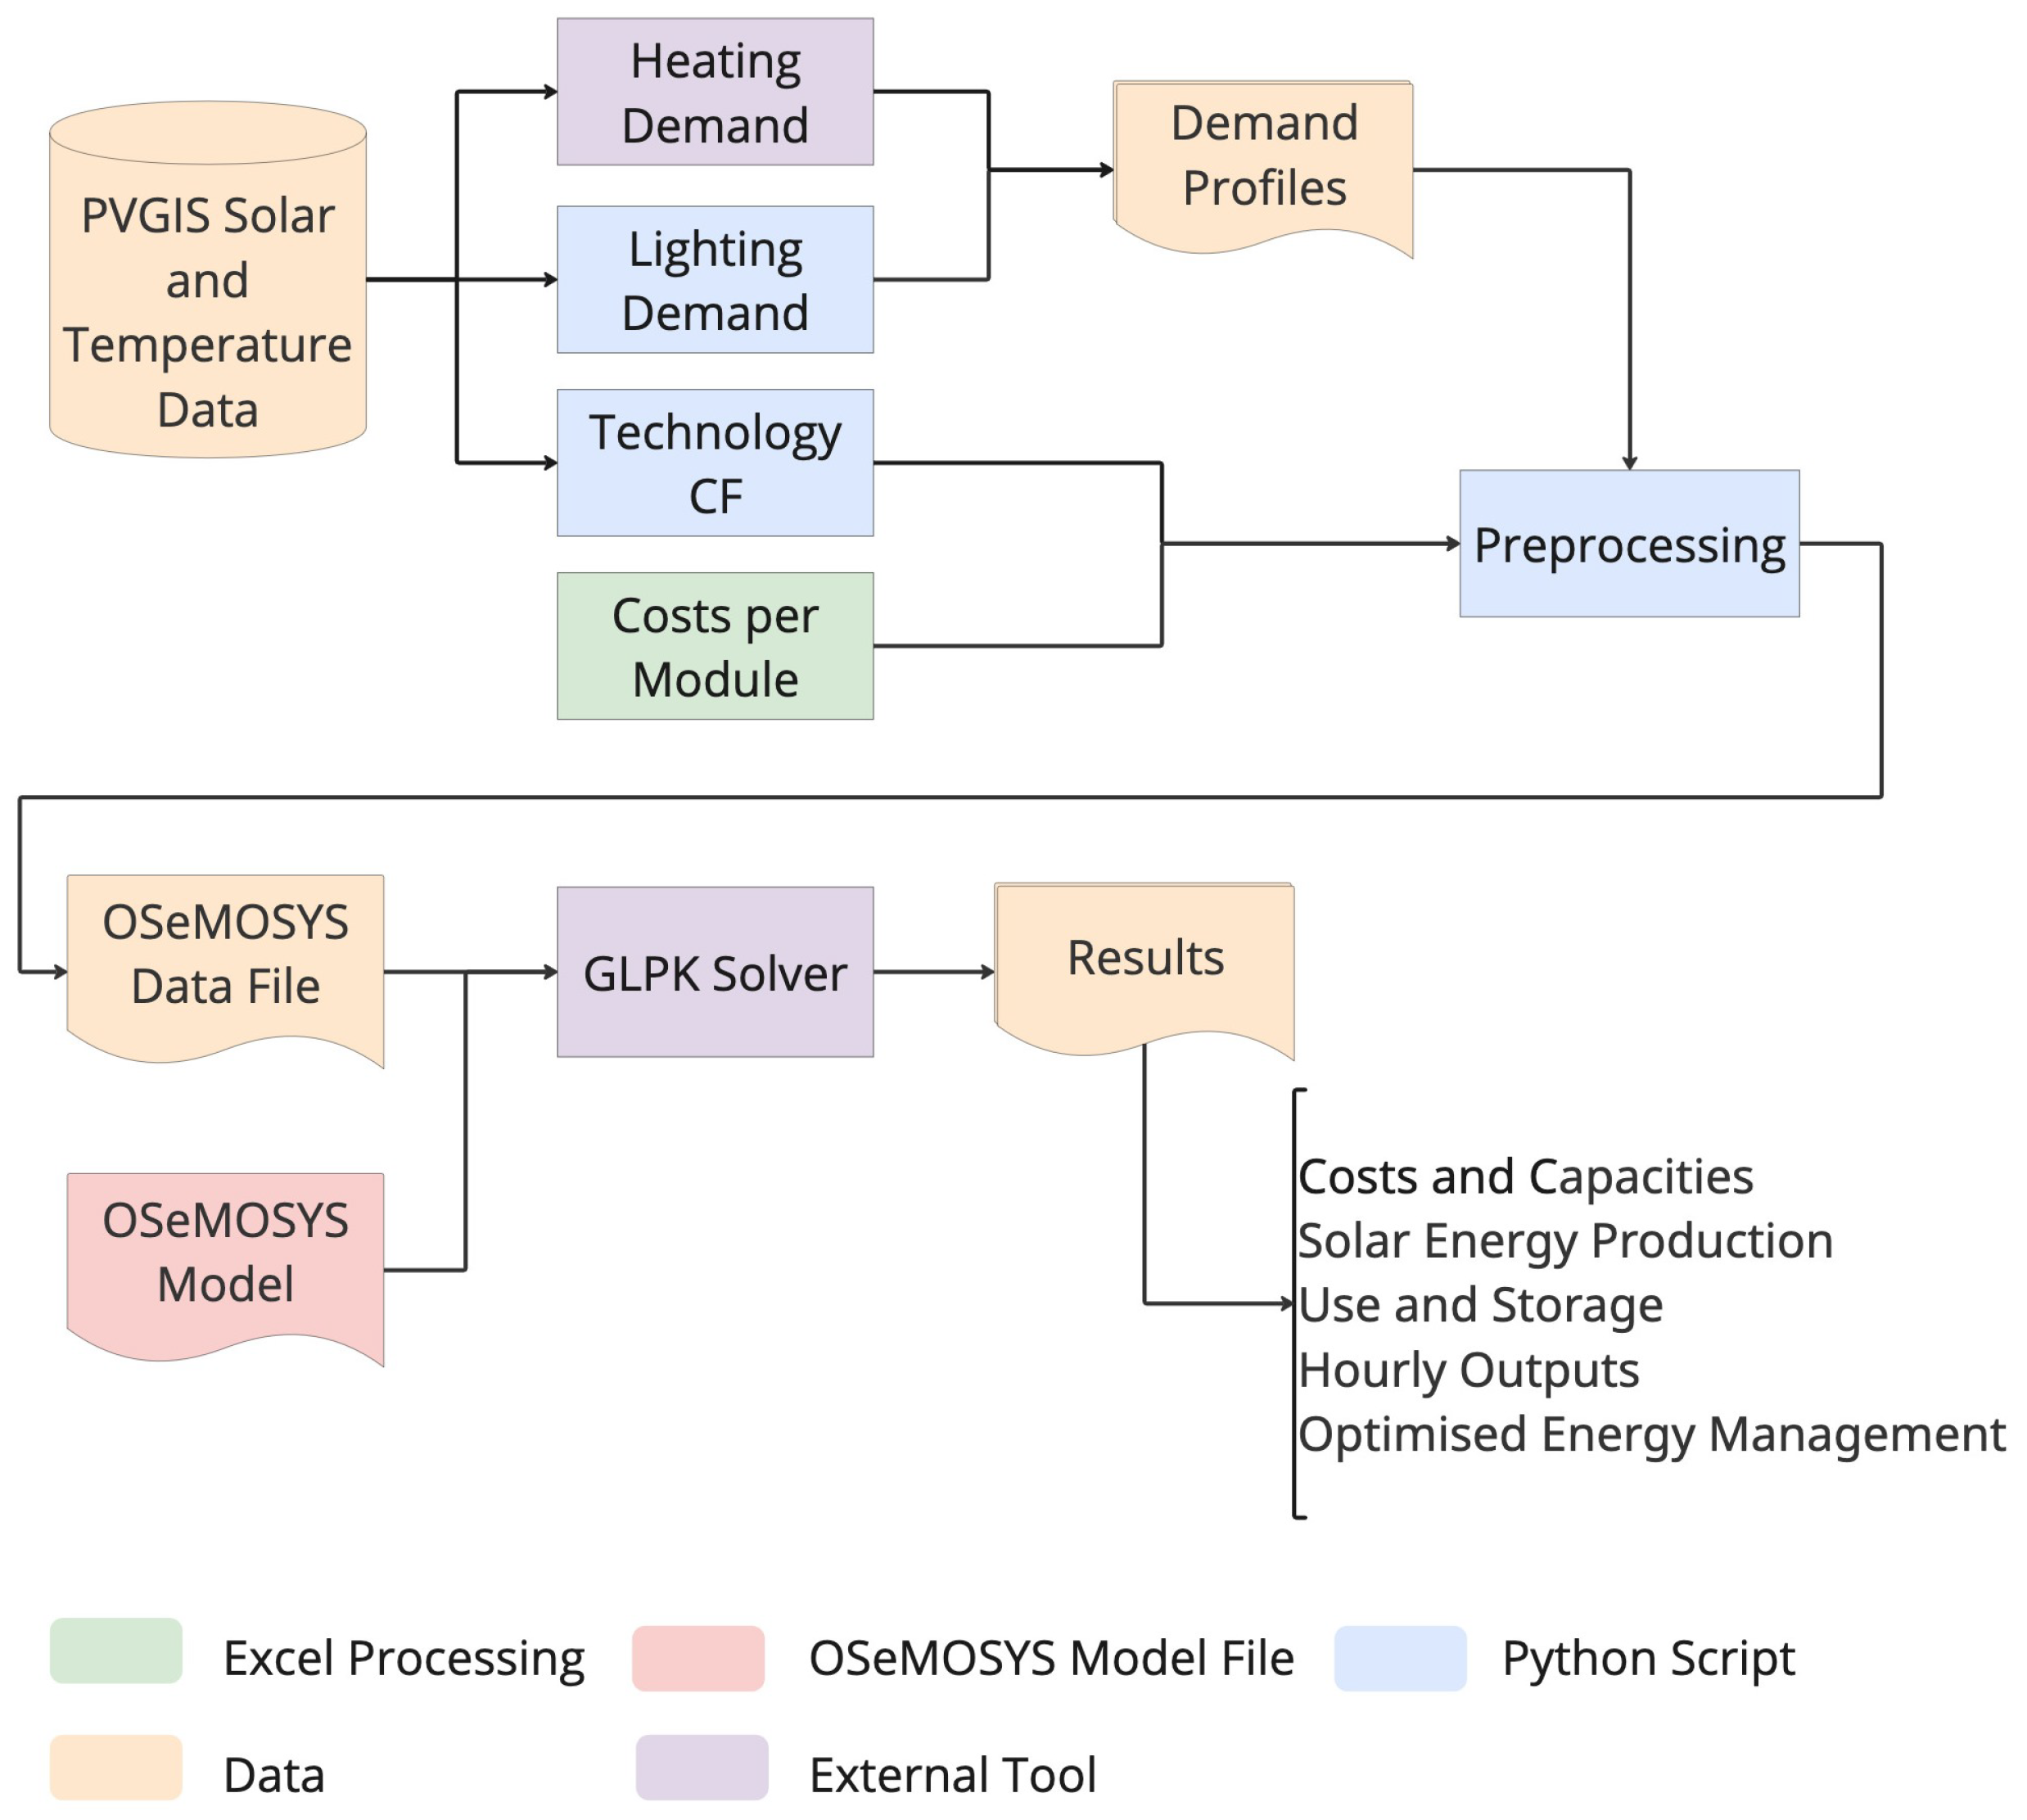
Our methodology uses open-source models, data, and software, to provide the input Data File for the OSeMOSYS framework, Figure 3. OSeMOSYS models, including technology capacity factors (CF) and costs, are then added to the Data File and processed using the GLPK solver [40]. This finds the optimum design for the whole year, on the basis of total cost, working with an hourly resolution. When the optimisation is finished, the system costs, capacities of energy technologies, and hourly energy flows within the greenhouse system are ultimately outputted.
Figure 3.
Modelling Work Flow.
5.1. Heating Demand Model
In order to determine the heating demand for each location, the behaviour of the thermal inertia of the structure and the absorption of solar irradiance over the course of the day must be accounted for while allowing for any heat loss or gain through the envelope. Ref. [41] presents a model for this in the context of heating and cooling demand for liveable buildings. The model can be tailored with a specific solar gain for the envelope and heat retention, along with a number of other coefficients [38].
5.2. Lighting Demand Model
In order to determine the lighting demand for each location, we implemented a two-step conditional model [38] using location-dependent hourly solar irradiance data [42]. First, each 24 h period is assessed against the minimum daily solar irradiance threshold of 840 W/m2 per day. If this condition is not met and lighting is required for that day, each hour is then compared to the minimum hourly threshold of 70 W/m2 until at least 12 h of sufficient lighting are achieved, which meets the requirements for most crop types. A supplementary lighting demand is calculated if this hourly threshold is not met, using Equation (1) [29].
where D = lighting demand W/m2, A = area of greenhouse m2, MSI = minimum solar irradiance W/m2, SI = solar irradiance W/m2, and T = transmittance factor of greenhouse envelope (%).
No assumptions have been made on the type of supplementary lighting, as modern greenhouse LEDs use targeted wavelengths to significantly improve efficiency and overall plant growth [19].
5.3. OSeMOSYS System Model
The OSeMOSYS model determines and optimises the flow of energy between the energy generation technology, the storage systems, and the greenhouse. The model is set up with hourly intervals over the year with a tailorable growing period.
Hourly solar irradiance and temperature data from 2015 are inputted as raw data and provide the basis for the lighting and heating demand, as stated above, and the capacity factors (CF) of energy generation technologies. The STC CF applies a 70% heat absorption percentage for each 2 m2 flat-plate collector to the total solar irradiance absorbed [43]. Using an optimal slope and azimuth for each location, Ref. [42] generates the output PV CF of each 1 kWp panel, incorporating default PVGIS system losses of 14%.
Table 2 shows the capital costs and operational costs, presented in CAD/capacity, of each of the technologies implemented in Figure 2.
In order to best represent the battery energy storage and thermals storage in OSeMOSYS, linking technologies are modelled for each of the energy storage technologies: a charger and inverter connecting the battery and a thermal intake and output valve connecting the thermal storage. These technologies allow the model to deliver energy to the storage and produce energy from the storage. The costs of these linking technologies also include any other equipment costs associated with the energy generation and storage technologies. Energy conversion losses for each storage system are incorporated in OSeMOSYS using these linking technologies. Efficiency rates of 90% and 70% are applied to the battery and thermal energy storage, respectively [39,44].
Table 2.
Technology costs.
Fixed costs represent the annual operational and maintenance costs the technologies require throughout their lifetime (manpower as well as supplies). These costs are used for our comparison study purposes. If the model were to be applied to assess the viability of a specific greenhouse, the costs, including transportation of panels to remote locations and other costs, such as those for an appropriate TES system, should be updated accordingly. The fixed costs may also be higher in northern regions than estimated but, given these are small compared to the capital costs, the impact of this is expected to be minimal. Government subsidies and incentives will also significantly impact the costs for such a system and would need to be included in any commercial evaluation for a specific site. For the purposes of this study, these incentives and programs are not included as they vary by province in Canada and over time and would need to be considered at the time of decision-making.
5.4. Case Studies
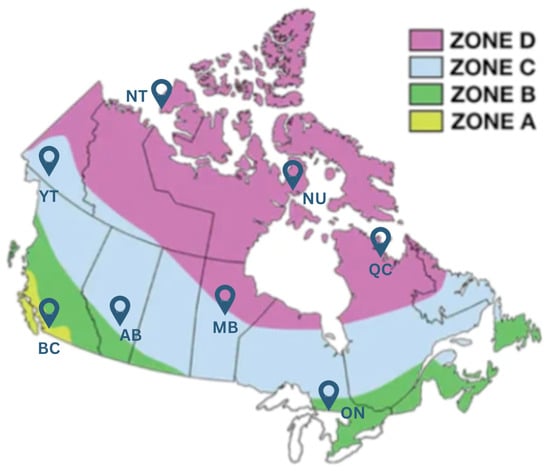
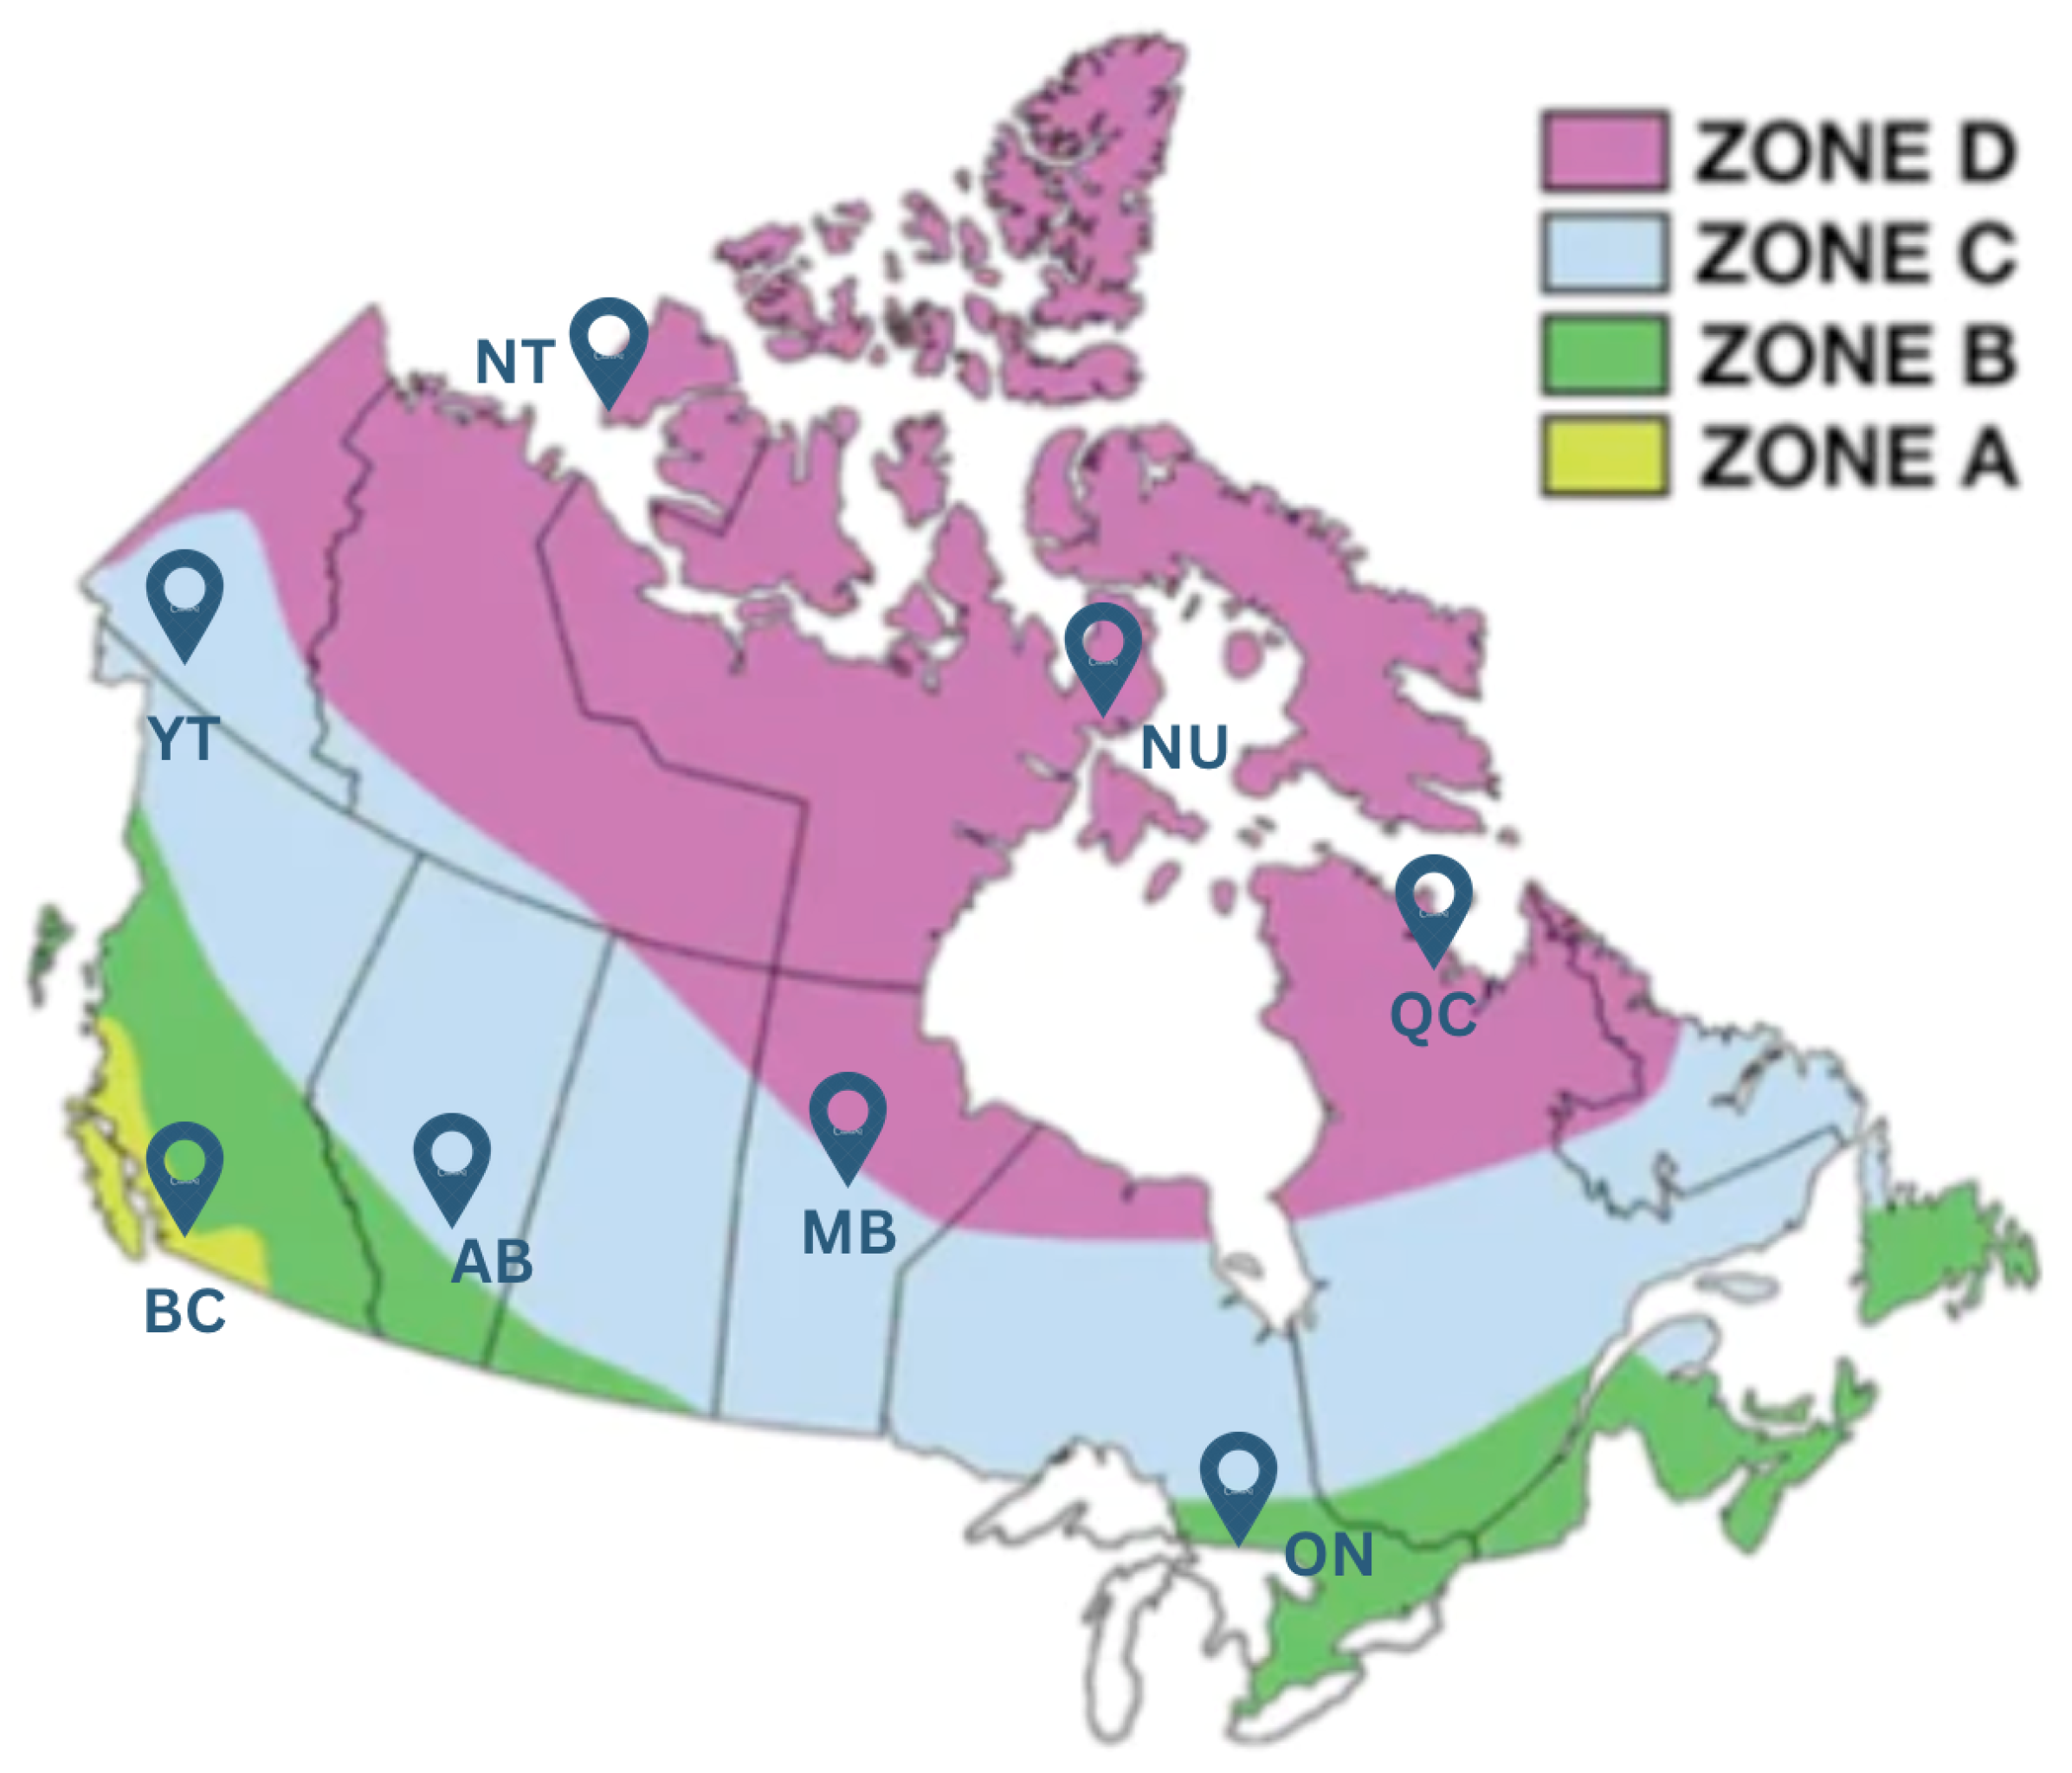
Eight locations are chosen within Canada to compare greenhouse energy systems in different geographical regions; Table 3. Note that Sachs Harbour in Northwest Territories, location NT in Figure 4, is 640 km north of the Arctic Circle [47]. These locations are selected to represent different climate zones within Canada based on heating demand days (HDD), as shown in Figure 4, with a focus on northern and remote locations. As such, only one location is chosen in each of Zones A and B, while three locations in each of Zones C and D are chosen, to have a higher sampling rate in the northern and remote locations, giving different latitudes, noting that these zones are not purely aligned with latitude. HDD is often used for agriculture and building requirements, representing how frequently a location’s temperature drops below 18 °C in a year. Zone A, for example, has up to 133 HDD per year, averaged over 30 years, while Zone D has over 233 [48]. The low-temperature days do not, however, align with solar irradiance levels. Much of northern Canada experiences low temperatures with high levels of solar irradiance.
Table 3.
Length of growing seasons in case study locations.
Figure 4.
Sample locations and climate zones of Canada [48].
5.5. Growing Seasons
Canada‘s ’average’ outdoor growing season has been from the beginning of April to the end of August, 153 days [32]. However, as shown in Figure 4, there is a significant variation in climate across Canada. Table 3 shows the average length of the outdoor growing season of each of the selected case study locations.
We focus on fresh vegetables that are hard to transport to northern locations, challenging to store, and often have short shelf lives. These crops are generally more expensive in remote locations than staples such as rice, potatoes, and wheat which have long shelf lives and can be stored over the winter.
Considering the limited space available in greenhouses and the aim of diversifying available produce, the crops considered for this study are vegetables and leafy greens. From planting to harvest, different vegetables have different growing periods. Short-term vegetables have growing periods between 30 and 100 days [49]. Leafy greens such as spinach and lettuce, for example, can be harvested after as little as 45 days, although they can keep growing for much longer. Medium-term vegetables typically take between 60 and 180 days to reach maturity, such as root vegetables like carrots, beetroot, and radishes. Finally, long-term vegetables, such as potatoes, onions, and chillies, can take between 120 and 180 days to reach maturity.
Using these growing periods as a basis, Table 4 shows the growing season scenarios for this study. Scenario 1 considers the harvest of fast-growth crops with a growing period of 45 days. Scenarios 2 and 3 represent seasons necessary for short and medium/long-term vegetables, respectively. Scenario 4 spans three consecutive short-term growing seasons, representing back-to-back planting of short-term vegetables. Scenario 5 spans four short-term growing seasons, pushing the greenhouse to operate year-round. A growing dome is used as a reference for the size of a community-scaled greenhouse, a 12.5 m dome with a floor area of 127 m2 and a height of 5 m at its centre [50].
Table 4.
Growing season scenarios.
6. Results
The heating and lighting demand profiles are created by the preprocessing models, Section 5, Figure 3.
6.1. Demand Profiles
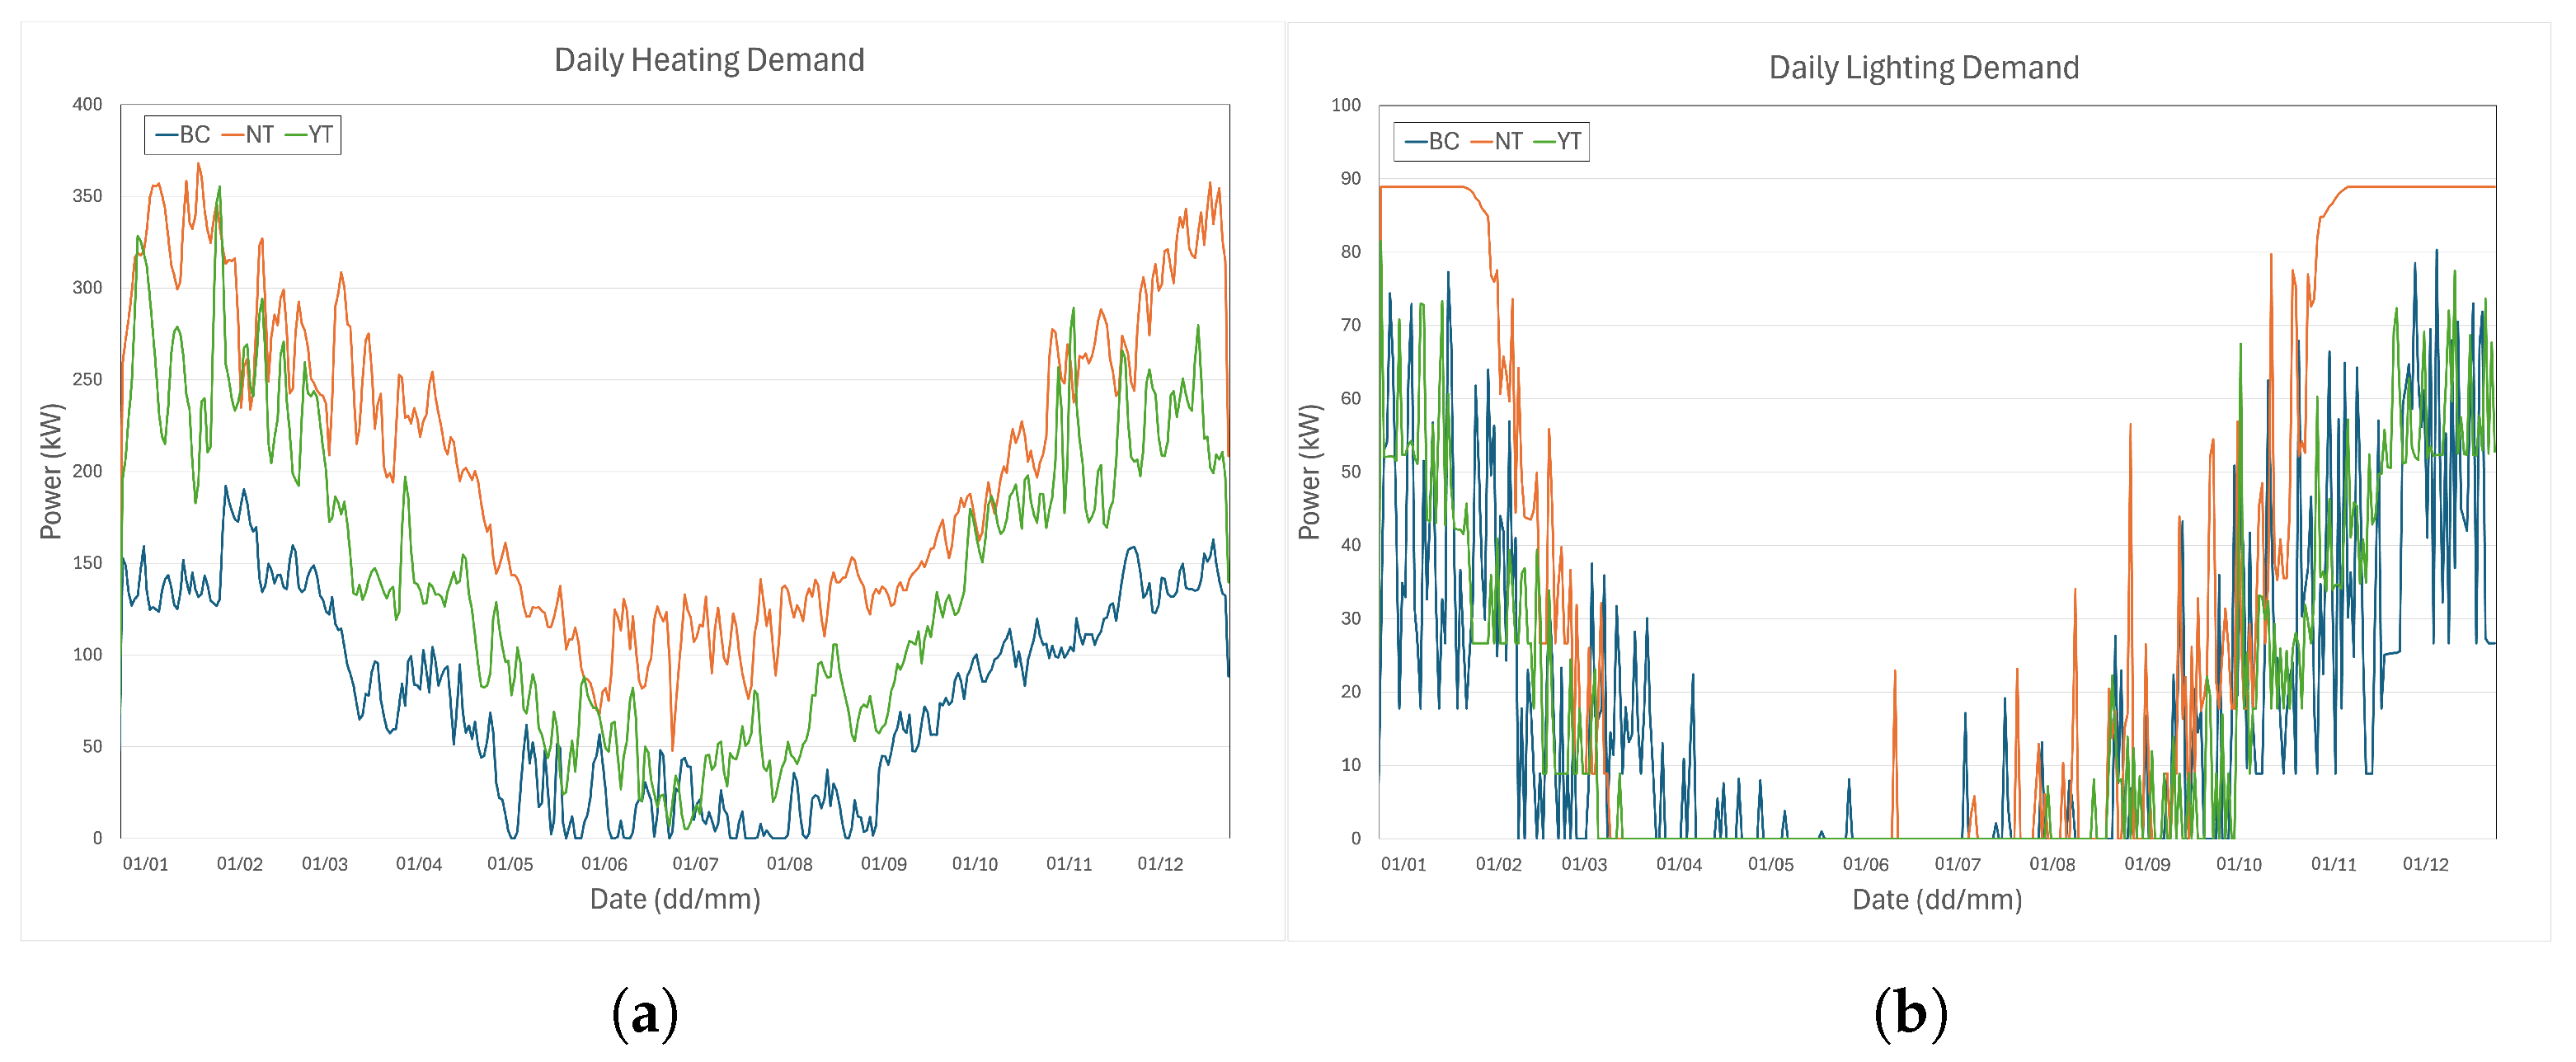
Figure 5a shows the year-long daily heating demands for three geographically extreme case study locations: Simon Fraser University in British Columbia (BC) 49.276 N 122.916 W, Whitehorse, Yukon (YT) 60.73 N–134.996 W, and Sachs Harbour in Northwest Territories (NT), 71.99 N 125.242 W, representing temperate oceanic and sub-arctic climates of Canada. As can be seen from this graph, the most northern location has a significantly higher heating demand throughout the year, as expected, Figure 4, reaching a peak demand of over 300 kW per day at the end of January. There is a daily demand throughout the year, as no location achieves consistently high temperatures that would allow for no added heating in the summer months.
Figure 5.
Year-long daily demands for BC, YT, and NT locations: (a) heating demand; (b) lighting demand.
Figure 5b shows the daily lighting demands for the same three case studies. As shown in the NT lighting demand, shown in orange, there are consistently high winter lighting demands, as Sachs Harbour experiences periods of no sunlight. In the summer months; however, the demand drops to zero for prolonged periods. The BC location experiences a smaller range of lighting demand. However, it lacks periods of consistent sunlight in the summer and has a widely varying lighting demand throughout most of the year. The YT location has a similar trend to BC; however, it has more consistent levels of solar irradiance throughout the summer, again resulting in prolonged periods of zero lighting demand.
6.2. Hourly Energy Management Simulations
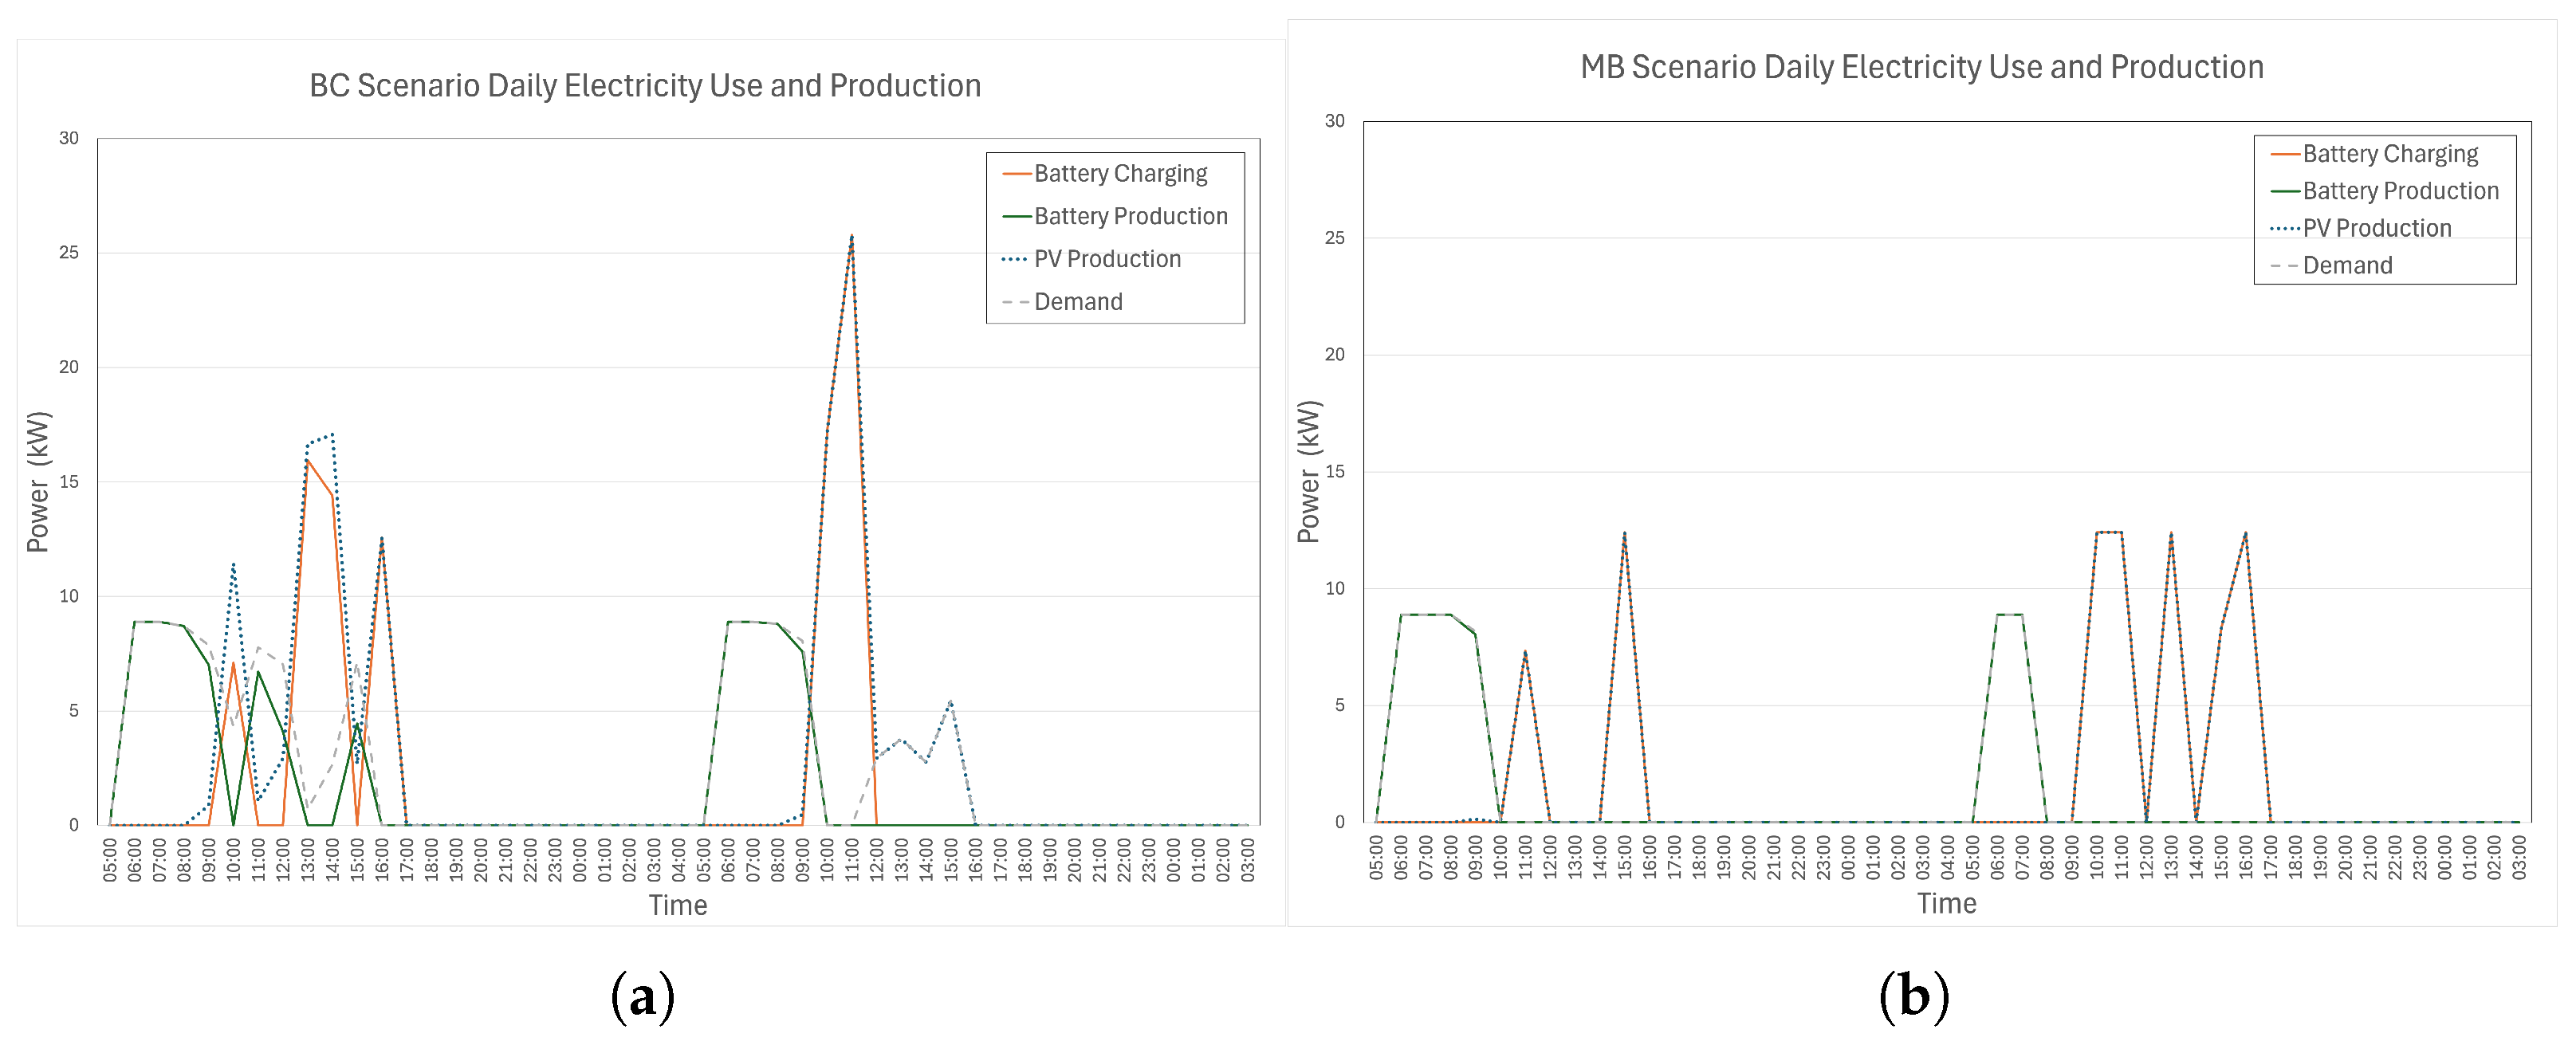
Figure 6 shows the daily electricity use and generation by the simulated system to meet the lighting demand over 48 h for (a) BC and (b) MB locations in February from the Growing Season 4 scenario. These locations are selected to showcase the simulation results, highlighting the daily energy flow between the generation technologies, storage, and the greenhouse. The shorter days in BC, Figure 6a, in February result in a lighting demand in the morning of both days, which is met by the battery storage system. Due to cloudy conditions, the first day shows fluctuating lighting demands even during the day. This demand is met by both the battery storage and directly by the PV panels. The second day experiences more consistent levels of solar irradiance, with the early morning lighting supplied by the battery; later, the PV panels charge the battery and meet demand without the need for the storage system. Demand drops to zero for large portions of the summer months. In the BC case, at noon, the battery is fully charged and the PV is used solely to provide some additional lighting at that time. PV generation charges the battery for several hours in the day; the model optimises this charging period, charging the battery energy storage for later use.
Figure 6.
Daily electricity use and generation: February: (a) BC ©2025 IEEE * (b) MB. (* Used with permission from IEEE Proceedings [38]).
The MB location shows more consistent levels of PV generation than the BC location, in February Figure 6b. Lighting is only required in the morning, allowing the PV to charge the battery more consistently for the rest of the day. In contrast, in the summer, when there is lower demand, the PV can charge the storage faster and there are more periods when the PV is not required to charge the battery. On most days during these months, no supplementary lighting is required. Again, the model optimises these charging periods in preparation for meeting lighting demands later in the day when the sun sets.
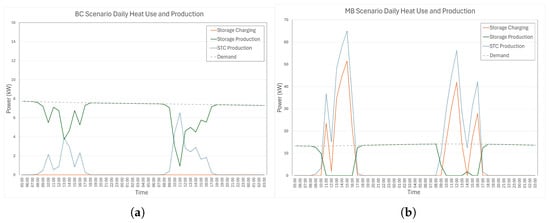
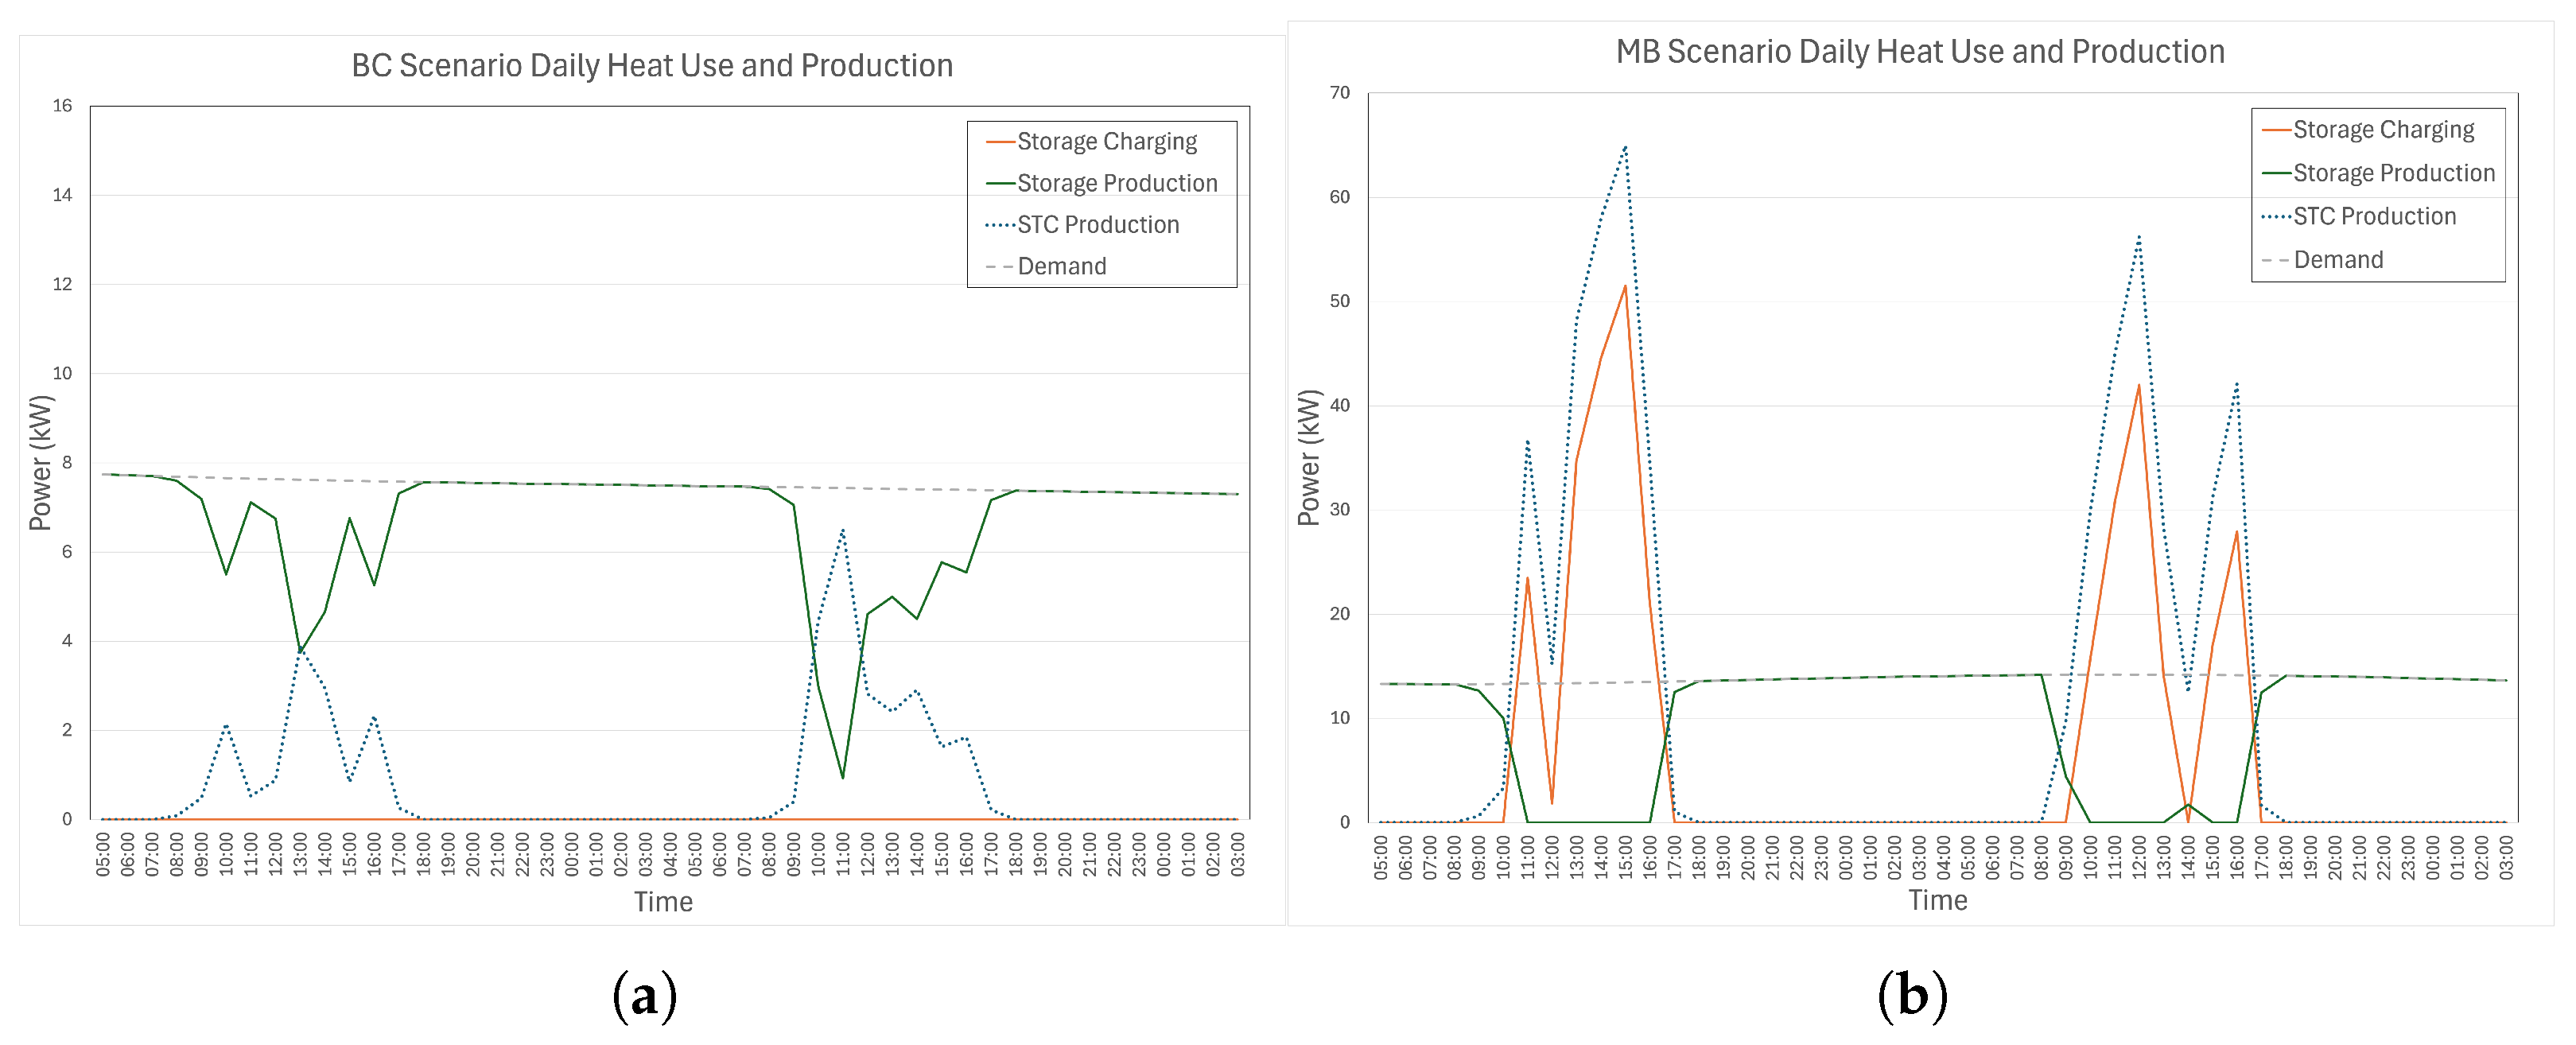
Figure 7 shows the daily heating use and production for the same 48 h periods in February from the Growing Season 4 scenario. Due to the more constant heating demand in BC in Figure 7a, the thermal storage system is required to meet the demand throughout the night. The lower levels of solar irradiance experienced in February also result in the need for thermal storage to assist in heating the greenhouse during the day. The second day experiences higher levels of solar irradiance; however, neither day results in sufficient levels for storage to recharge. Given the downward trend of demand, it can be assumed that the improved weather and the solar gain of the greenhouse result in a steady decrease in heating requirements. The OSeMOSYS optimisation controls the timing of storage charging and the scale of the storage system and STC to ensure demand is met throughout the year. The storage system is, therefore, only charged on days with sufficient solar irradiance.
Figure 7.
Daily heating use and production: February: (a) BC ©2025 IEEE * (b) MB. (* Used with permission from IEEE Proceedings [38]).
Figure 7b shows significantly higher STC production for MB compared to BC over the two days in February. Despite slight dips at periods of the day, the STC is able to meet the greenhouse demand and charge the storage with very little need for supplementary storage production during the day. During the summer, there is significantly lower heating demand during the day and higher levels of thermal generation, increasing the available heating supply during the night. Similar to BC, during the summer, the storage supplies low levels of heating on cooler nights or directly from the STC if those temperatures persist during the day.
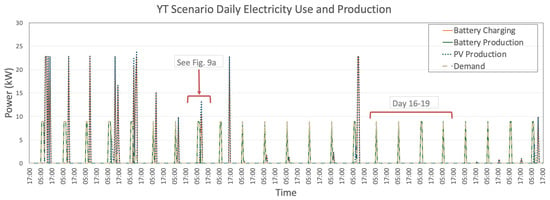
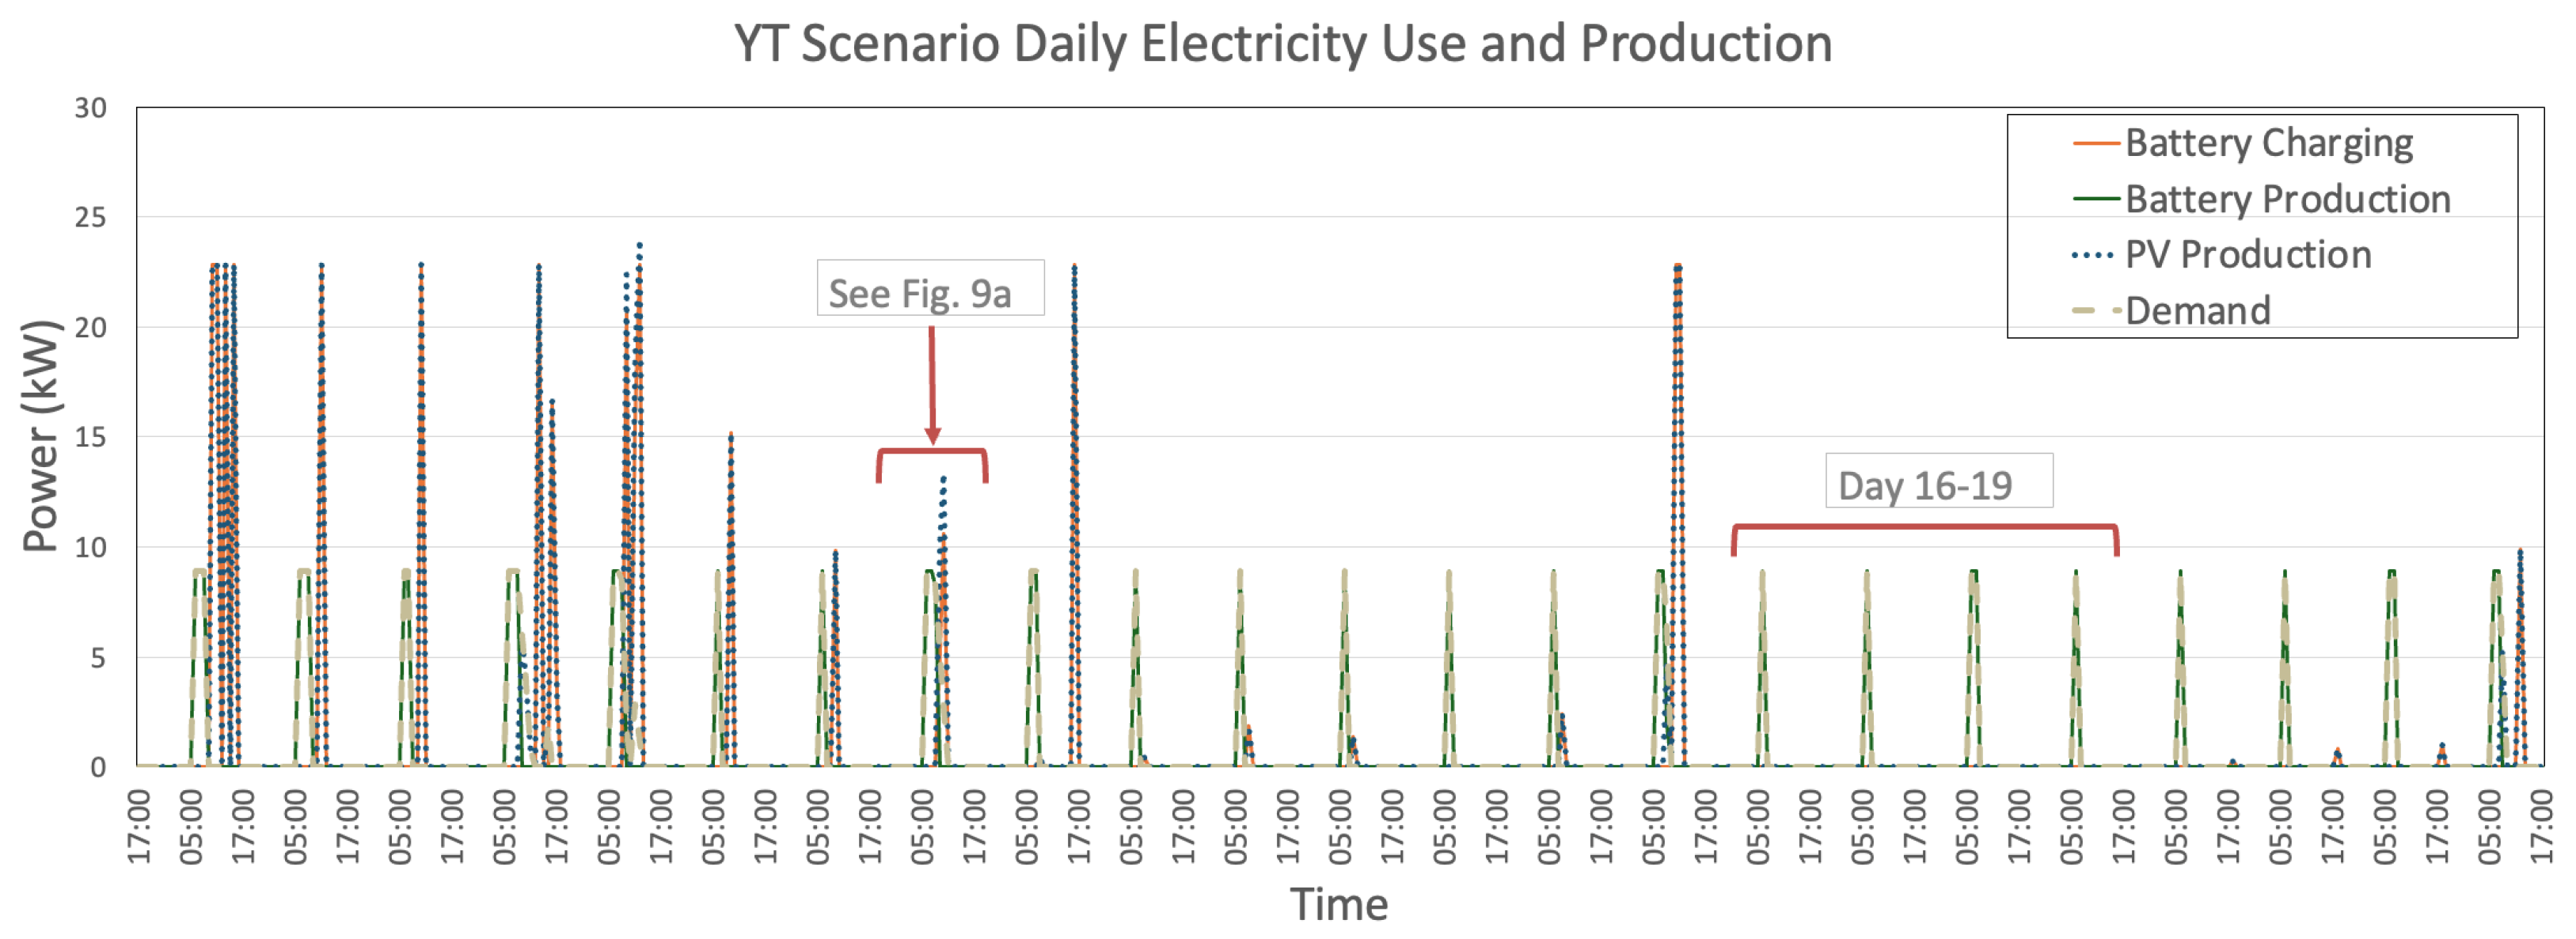
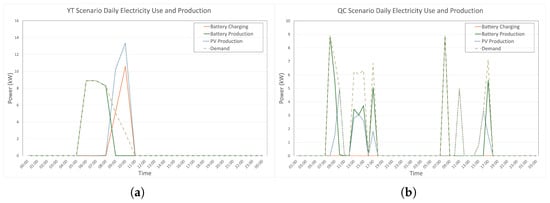
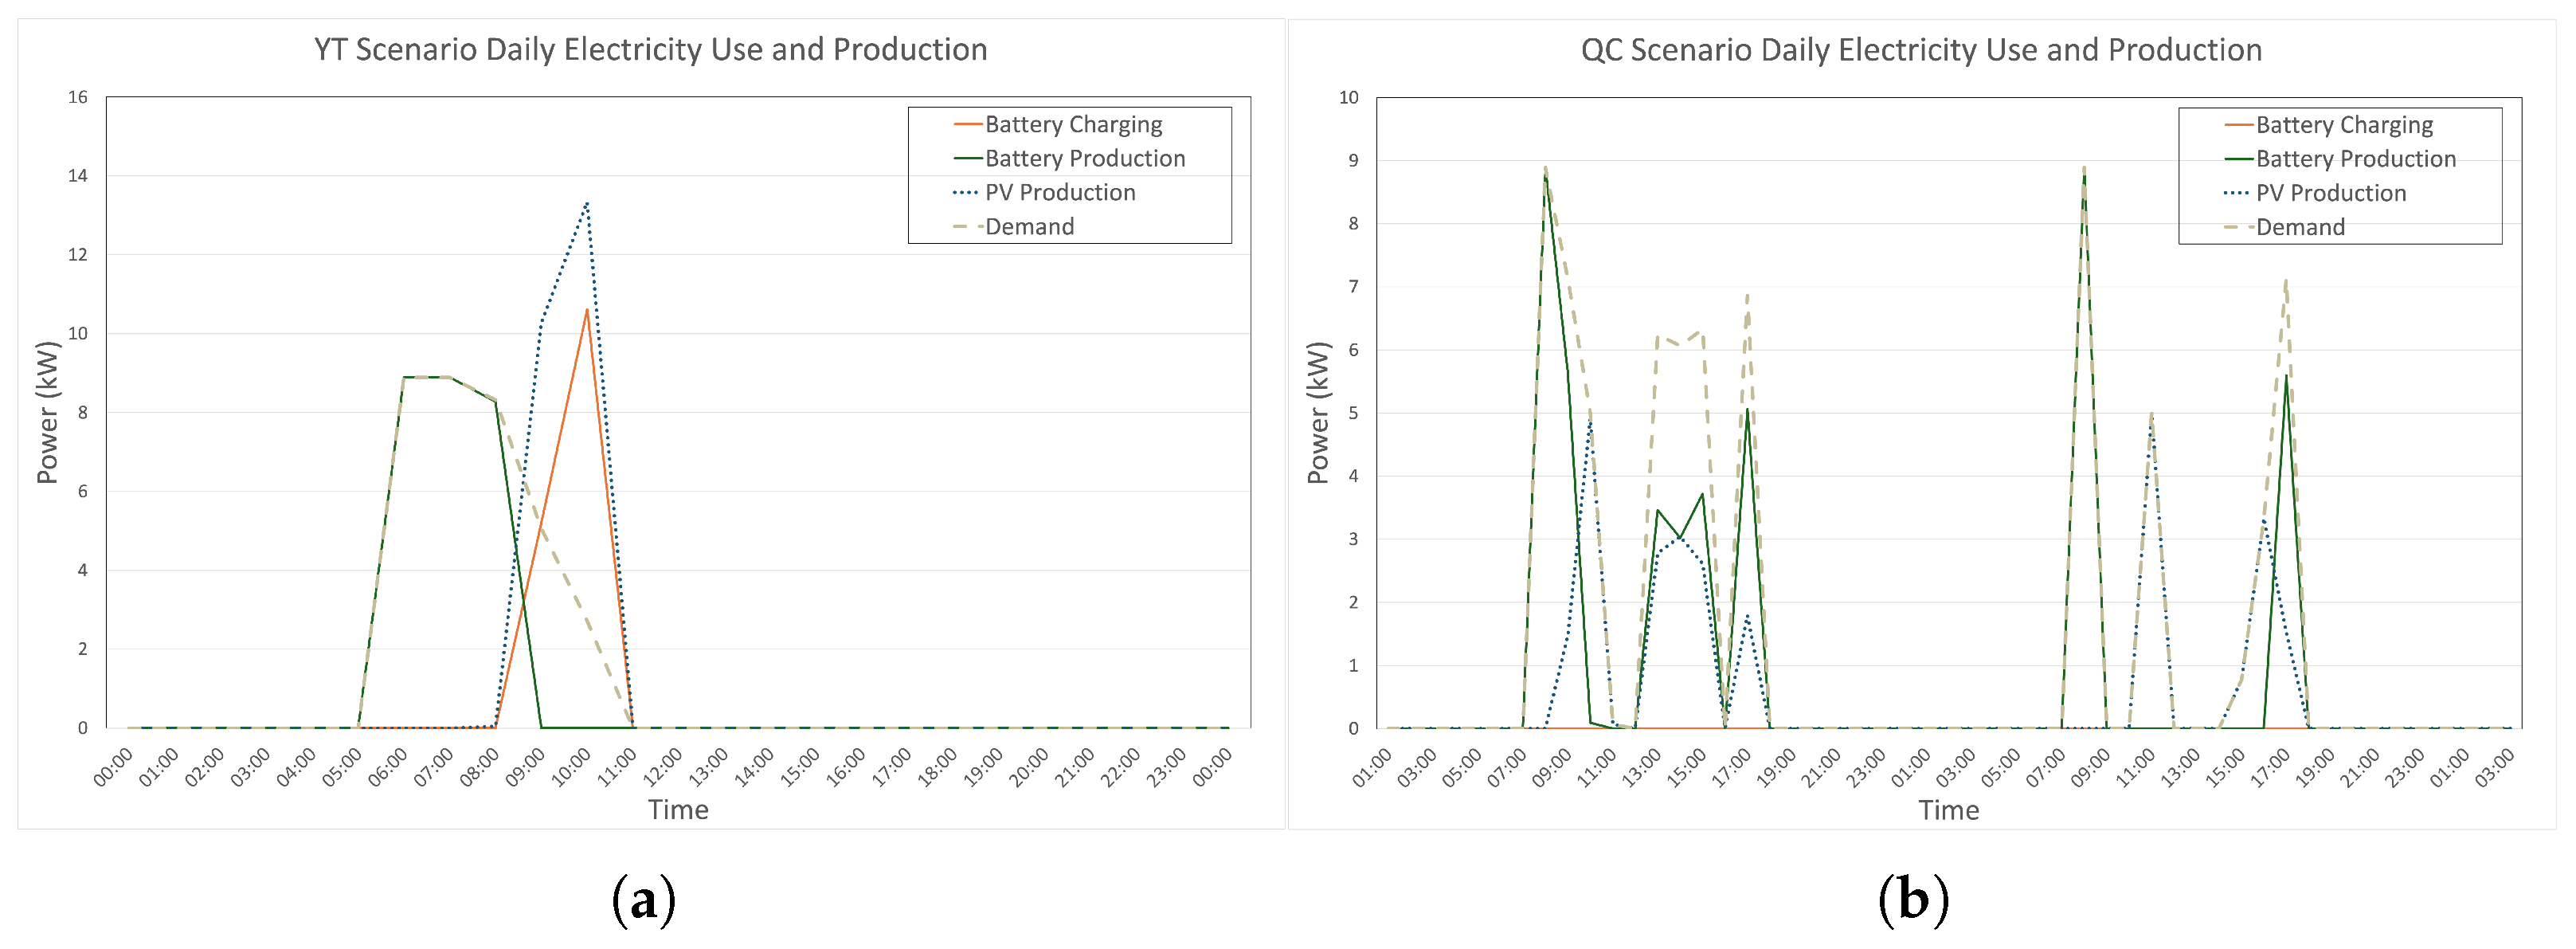
Figure 8 shows the daily electricity use and generation for the YT location across 23 days in February and March from the Growing Season 5 scenario. Here, we see multiple days with no battery charging, days 16 to 19, but still with some early morning battery use for supplementary lighting. This period is transitioning into spring with less demand for lighting and more consistent levels of solar irradiance for battery charging, removing the need for more frequent charging. The Year-Long Growing Season (5) requires a large battery compared to the shorter growing seasons. The less frequent periods of charging are, therefore, highlighting the larger battery capacity needed for these longer growing seasons.
Figure 8.
YT electricity use and generation: Weeks 7 to 11 of the year.
On the highlighted day shown in Figure 9a, there is demand for lighting from early morning until 11:00 am. The battery production meets the lighting demand in the early morning until the PV generation begins to meet this demand directly. Modest levels of solar irradiance for the rest of the day also allow for some battery charging, while the PV panel continues to enhance the lighting in the greenhouse to meet the required minimum light levels for the crop.
Figure 9.
Daily electricity use and generation: (a) YT, highlighted (see Figure 8); (b) QC, March.
The QC location, Figure 9b from the Growing Season 5 scenario, relies on the battery system more frequently throughout the day to supplement direct PV generation, as well as to extend the natural solar day. The battery and PV generation are both required to meet demands throughout both days. No battery charging is shown on these days as there is insufficient solar irradiance to meet demand in the greenhouse without aid from both the PV and battery systems.
6.3. System Designs
Table 5 shows the optimised technology capacities and capital costs for each growing season scenario and location. The costs represent the capital costs of technologies over 25 years of greenhouse operation, including the replacement of technologies dependent on their expected lifespan. Growing Season 1 has relatively low system costs due to the short growing period and high solar irradiance levels. Three locations require only 1 kW of installed PV capacity, and YT requires none, contributing to the lower overall costs. However, thermal storage is required for all case studies, as heating is required for all locations, even in the summer. A general trend of increasing STC installation with climate zones is seen in this growing season, as expected. The three locations with significantly higher overall costs, even for Growing Season 1, QC, NU, and NT, are all located in climate zone D, highlighting the impact of climate and temperature. QC has the highest overall cost, requiring the largest PV and thermal battery installations. NT requires considerable PV, though small battery storage, as each day has reliable high solar irradiance levels, negating the need for larger storage. Despite its northern location, YT is able to support the short growing season with no installed PV or battery storage due to sufficient levels of solar irradiance, resulting in the lowest system costs for this growing season. In contrast, BC, although a more southern location, requires a somewhat larger PV and battery installation than expected due to its more variable weather and inconsistent levels of sunlight.
Table 5.
Comparison of system designs for growing seasons and locations.
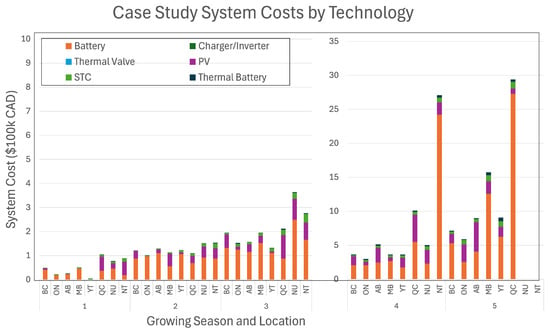
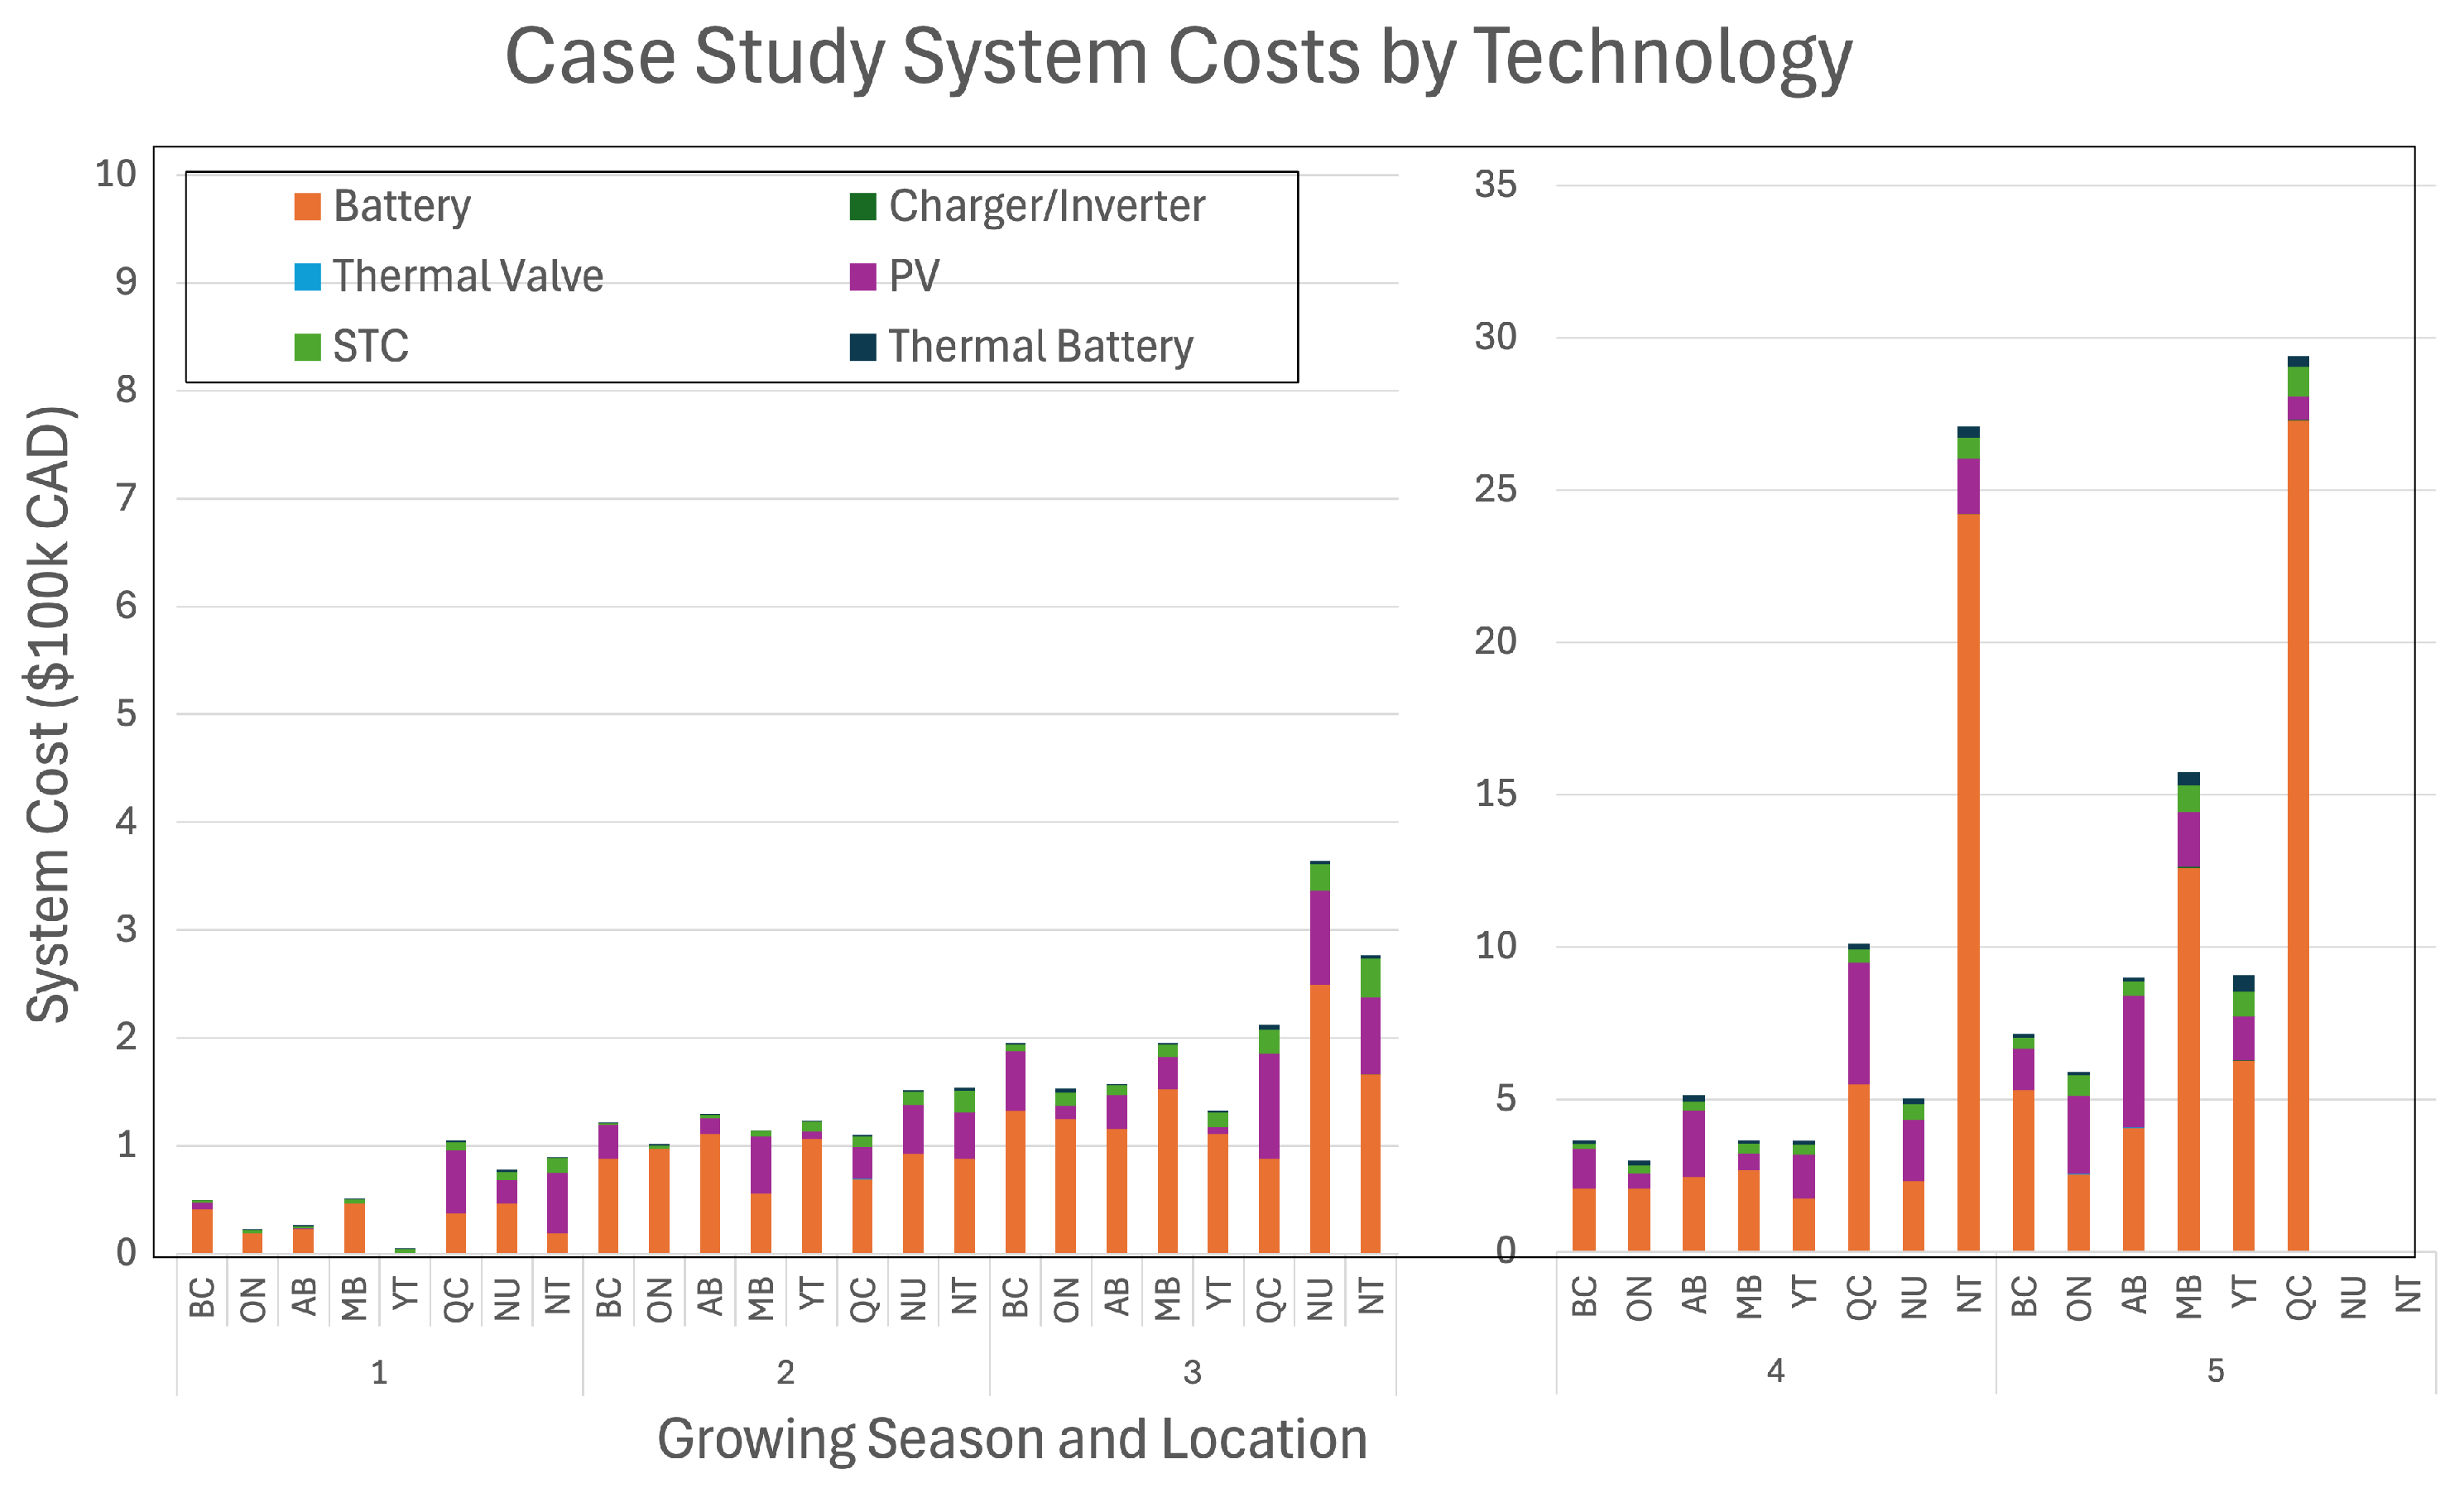
Figure 10 shows the cost distribution for each of the case study locations across all five growing seasons, cut off at $1.5 million, broken down by the capital cost of each technology. The two most northern locations are unable to run year-round, as they experience periods of no sunlight. This results in difficult choices for either long-term seasonal storage options or more diverse energy generation technology.
Figure 10.
Case study costs For each growing season and location.
7. Discussion
The installation of STC increases as expected when extending the growing seasons, with lower costs than the PV, Table A1 (Appendix A). With increasing length of season, the solar irradiance levels can become more varied, depending on location, while daily temperatures change more steadily. Therefore, extending the growing period, regardless of location, requires a more linear increase in STC installation to support the heating demand.
The low cost of thermal storage and the need for heating supply at night results in the model relying heavily on this technology. Battery storage, on the other hand, is significantly more expensive. Therefore, battery capacities are minimised throughout all locations and growing seasons by the optimisation to keep down overall costs. A consequence of this is the trade-off between the capacities of PV and battery. This trade-off depends heavily on the location and length of growing season. This highlights the importance of modelling specific locations using demand profiles created from time-dependent and geographic data.
Several locations, such as BC, YT, and AB, also use large PV installations to keep battery capacity down and compensate for the low light intensity. Weak light exposure caused by cloudy days, even in the summer, results in the need to over-install PV to provide a sufficient energy supply. Furthermore, BC and QC have larger PV installations than locations in similar latitudes and climate zones. In Growing Season 3, for example, BC requires 162 kW of PV, whereas ON requires only 36 kW. QC requires over 1000 kW of PV in Growing Season 4, while NU and NT both require less than 600 kW. On the other hand, YT does not require much PV until Growing Season 4, when the installed capacity increases from 20 kW to 420 kW. Therefore, this growing season scenario has significantly over-installed PV for the summer months to meet the demand of extending the season from 183 days to 273 days. This over-installation, however, lends itself well to an isolated microgrid electrical system, where there is a large summer load.
However, the YT location is near the electricity grid, and there is a high penetration of solar power in the isolated Yukon grid already, with insufficient summer loads, along with insufficient winter hydro power [51]. Therefore, such an over-installation of solar PV and the year-round growing season 5 are unlikely to be adopted. Clearly, a detailed study would need to be performed, taking into account the regulatory conditions, if such a choice were to be considered at any location.
The ON location for Growing Season 2 requires only 1 kW of PV, coupled with a larger battery installation of 21 kWh. This apparent anomaly is attributed to the southerly location with long periods of cloudy conditions, requiring long periods of battery use with minimal charging. The constraint on the model to have an isolated energy system with no grid input can result in higher installed battery capacities, particularly for southern BC and southern ON with inconsistent solar irradiance levels, Figure 5. However, for locations with similar climates, with established grid access, these battery capacities can be significantly reduced, giving considerable cost savings.
The space required for energy generation technology is also significantly lower for STC. With 2 m2 panels, the largest area requirement is for the QC location’s year-round growing seasons, just under 630 m2. This is approximately five times the area of the modelled greenhouse. The largest area requirement for PV installation is AB’s year-round growing season, with 6371 m2, approximately 50 times the area of the greenhouse, assuming an average panel area of 5 m2/kW [52,53]. However, with a grid connection and 88 kWh battery, this represents a significant alternative revenue source.
Using [54] as a reference, an approximate yield per growing season can be estimated for a 127 m2 growing dome. An approximate yield of 150 kg of tomatoes or similar vegetables per three-month growing season is used to calculate the cost of yields per kg, see Table 5. Limited information is available on up-to-date vegetable prices in rural northern communities in Quebec, Nunavut, and Northwest Territories. A survey conducted in 2017, however, priced celery at 11.65 CAD/kg and carrots at 6.19 CAD/kg in Naujaat, Nunavut [55]. Even with expected inflation of prices in the seven years since, the cost of yields for NU is significantly higher than expected supermarket prices. In Vancouver, tomato prices vary seasonally in the range of 5–10 CAD/kg [56,57]. This is approximately four times that of Growing Season 1’s yield price for the BC scenario. This implies that for BC, a grid connection is desirable to allow PV to support the greenhouse financially without the need for battery storage. YT’s yield cost for Growing Season 1 is the lowest, at $3/kg. With supermarket prices between $4.50 and $7 [58,59], the greenhouse for this location provides lower-cost yields by relying on low-cost thermal storage to supply heating. Although these cost of yield numbers are quite simplified and would vary by crop, weather, and other factors, the fact that these costs are in line with prices in various locations is promising, especially the added value to northern communities to have fresh produce available at times when it might not be cost-effective to ship it from southerly locales. Note that shipping costs in some regions are higher during the summer, as some roads become impassible.
To provide a comparison, the modelled demands for three locations, Figure 3, can be costed for electricity from diesel generation rather than the solar PV, on the basis that the capital costs of the solar PV and battery are very high, Figure 10. At around 50% efficiency as a best case, using a local generator, year-round use requires 33,000 L for BC, 59,000 L for NT, and 41,000 L for YT. The costs per L are given in the Appendix A Table A1. Clearly, these are very high and the costs for lighting alone over 25 years comes to 1.55 m, which is about twice the cost of the PV, and remains higher even if the battery is replaced after 12.5 years (half the 25 year lifetime). This is to be expected. Using keroscene heaters (diesel) for direct heating is efficient but extremely costly, even in BC, and compares extremely unfavourably with natural gas. Similarly, at a commercial electricity rate of 6 cents per kWh, the grid-connected lighting bill would be around $20,000, which again reflects intensive use [19].
Choosing Scenario 2 (92 days) for NT provides a diesel for lighting usage of 825 L, which is small, and even with the high price of roughly $3 per L, the costs are $2475. At $62,000 over 25 years, this is around half that of the solar PV system and battery. This could be expected, as the Solar PV system is not in use for much of the useful growing season. However, by choosing the solar PV, 2.2 tCO2 would be saved per year, as well as removing other pollutants, which would be a valuable improvement in quality of life. As BC and YT is mostly hydro electricity and solar PV (YT), there is little carbon saving in these cases. Clearly much can be learned from the results presented, but local conditions need to be considered, not least concerning the intensity of use of the greenhouse.
Low-cost and low-technology strategies are often implemented in a greenhouse to maintain temperatures, either providing heating or cooling. Such strategies include insulating northern walls to prevent heat loss, adding a black lining to absorb and release heat, shade covering to maintain lower temperatures at peak times of the day, thermal water sinks to regulate night temperatures, and passive wind ventilation units [2]. Nevertheless, greenhouses in more extreme climates require significant energy input to raise or lower ambient temperatures to those suitable for plant growth. The controlled environment of greenhouses makes more efficient use of water, produces less waste, reduces the need for high levels of chemical fertiliser and pesticides, and typically has a smaller overall carbon footprint compared with standard western outdoor agriculture.
By optimising over specific years of daylight and temperature GIS data, the system design can be made more robust to climatic variations.
8. Conclusions
The results show the feasibility of extending the naturally short-growing season greenhouse in northern locations. It was found that the proposed scalable greenhouse energy system met the requirements of almost all growing season lengths for all locations, with exceptions for the two most northern communities that experience periods of no sunlight. In particular, the low cost of thermal storage makes it an attractive investment for all locations and could reduce reliance on the grid or diesel for heating demands, reducing emissions.
Our modelling methodology used here appropriately incorporates sufficient detail to represent the energy and system requirements of each location across Canada and provides an estimate of total system costs while allowing an investigation of the characteristics of the system per location. Using real solar and temperature hourly data from 2015, the optimised systems presented above capture meaningful aspects of the design and operation that may otherwise be lost in an averaged modelling approach. The open-sourced methodology can be tailored for other locations world-wide and different case studies, including in-depth analysis for a particular location.
The conceptual system designs can inform decision-making from both the community perspective, considering the detailed results of the modelling for each specific location and its impact on the system design, and wider policies for government support and subsidies to such communities.
The results also highlight the opportunities for such a greenhouse system to be the core of a microgrid either to be sustainably energy self-sufficient or to sell electricity back to the grid or other users; the Yukon (YT) location is a great example of this opportunity. For shorter seasons in the more northerly locations, the consistently high levels of solar irradiance provide a significant motivation for more northern locations to adopt solar energy greenhouses.
9. Limitations and Areas of Further Study
This study presents a valid analysis of renewable greenhouses and provides an adaptable methodology. For commercial use, location-dependent data and demand profiles should be incorporated and current market prices for components as available at remote location will need to be included. Using multi-year data to avoid specific yearly weather patterns and identify weather sensitivity, as well as climate projections of future weather data, is also recommended. Benchmarking the study results against an installed greenhouse at one of these locations, as well as testing with a variety of real-world costs and factors, would also allow for more detailed investigation of the factors affecting the system but this is beyond the scope of this study.
The assumption of manual ventilation and humidity control in the greenhouse for operation in remote locations may not be valid in all conditions, especially in locations where it is cold and humid. Again, benchmarking against an installed greenhouse in these locations would allow this to be considered.
As stated above, reliance on solar energy for generation limits the growing season of more northern locations. Therefore, exploring other renewable energy sources for implementation on a community scale warrants further investigation, such as wind and geothermal.
Developing community microgrids in remote locations to diversify demands may identify synergies between load profiles. By exploring capacity building for rural communities, renewable greenhouses could be used as central elements of the energy systems. Communities interested in exploring electric vehicles, for example, could benefit from optimised simulations of charging patterns using surplus solar energy and battery storage.
Author Contributions
Conceptualization, A.C.W., T.N. and P.R.P.; methodology, A.C.W., T.N. and P.R.P.; formal analysis, A.C.W., T.N. and P.R.P.; writing—original draft preparation, A.C.W.; writing—review and editing, A.C.W., T.N. and P.R.P.; supervision, T.N. and P.R.P.; project administration, A.C.W.; funding acquisition, P.R.P. All authors have read and agreed to the published version of the manuscript.
Funding
We acknowledge the support of the Natural Sciences and Engineering Research Council of Canada (NSERC) CREATE 554770-2021 and RGPIN/6943-2020.
Institutional Review Board Statement
Not applicable.
Informed Consent Statement
Not applicable.
Data Availability Statement
The data presented in this study are available in [PVGIS] [https://re.jrc.ec.europa.eu/pvg_tools/en/#MR (Accessed: 11 November 2025)] [Energy Modelling for Greenhouses] [https://github.com/annieculliswatson/Energy-Modelling-for-Greenhouses (Accessed: 11 November 2025)].
Acknowledgments
This article is a revised and expanded version of a paper entitled Multiphysics Energy Systems Demand Modelling for Community-Scale Greenhouses, which was presented at the 2025 IEEE/SICE International Symposium on System Integration (SII), 21–24 January 2025, Munich, Germany [38].
Conflicts of Interest
The authors declare no conflicts of interest.
Appendix A
Table A1.
Cost of diesel.
References
- Chen, A.; Natcher, D. Greening Canada’s Arctic food system: Local food procurement strategies for combating food insecurity. Can. Food Stud. Rev. Can. Des ÉTudes L’Aliment. 2019, 6, 140–154. [Google Scholar] [CrossRef] [Scilit]
- Henshaw, P. Modelling changes to an unheated greenhouse in the Canadian subarctic to lengthen the growing season. Sustain. Energy Technol. Assess. 2017, 24, 31–38. [Google Scholar] [CrossRef] [Scilit]
- CBC. High Arctic Haulers, Igloo-Shaped Greenhouses are Growing Nutritious, Affordable Food in Canada’s North, 2019. Available online: https://www.cbc.ca/television/higharctichaulers/igloo-shaped-greenhouses-are-growing-nutritious-affordable-food-in-canada-s-north-1.5365796 (accessed on 15 October 2022).
- Hussain, A.; Choi, I.S.; Im, Y.H.; Kim, H.M. Optimal operation of greenhouses in microgrids perspective. IEEE Trans. Smart Grid 2019, 10, 3474–3485. [Google Scholar] [CrossRef] [Scilit]
- Government of Canada. Residential Solar Is Financially Viable in Some Provinces and Territories, but Not in Others; Government of Canada: Ottawa, ON, Canada, 2018.
- Sustainable Food Security. Sustainable Food Security, A Social Enterprise, 2025. Available online: https://sustainablefoodsecurity.com/ (accessed on 4 March 2025).
- Bot, G. Greenhouse Climate: From Physical Processes to a Dynamic Model. Ph.D. Thesis, Wageningen Agricultural University, Wageningen, The Netherlands, 1983. [Google Scholar]
- DeZwart, H. Analyzing Energy-Saving Options in Greenhouse Cultivation Using a Simulation Model. Ph.D. Thesis, Wageningen Agricultural University, Wageningen, The Netherlands, 1996. [Google Scholar]
- Hasni, A.; Taibi, R.; Draoui, B.; Boulard, T. Optimization of greenhouse climate model parameters using particle swarm optimization and genetic algorithms. Energy Procedia 2011, 6, 371–380. [Google Scholar] [CrossRef] [Scilit]
- Zou, Q.; Ji, J.; Zhang, S.; Shi, M.; Luo, Y. Model Predictive Control Based on Particle Swarm Optimization of Greenhouse Climate for Saving Energy Consumption. In Proceedings of the 2010 World Automation Congress, Kobe, Japan, 19–23 September 2010; Technical Report; IEEE: Piscataway, NJ, USA, 2010. [Google Scholar]
- Qi, D.; Zhang, K.; Zhao, C.; Li, A.; Song, B.; Li, A. Optimized model predictive control for solar assisted earth air heat exchanger system in greenhouse. Renew. Energy 2024, 228, 120582. [Google Scholar] [CrossRef] [Scilit]
- Wacker, J.D.; Verheul, M.J.; Righini, I.; Maessen, H.; Stanghellini, C. Optimisation of supplemental light systems in Norwegian tomato greenhouses—A simulation study. Biosyst. Eng. 2022, 215, 129–142. [Google Scholar] [CrossRef] [Scilit]
- Mahmood, F.; Luqman, M.; Al-Ansari, T. Application of a dynamic hybrid energy-crop yield model to support the co-utilisation of mega infrastructure for food security. Environ. Technol. Innov. 2023, 31, 103157. [Google Scholar] [CrossRef] [Scilit]
- Asgari, N.; McDonald, M.T.; Pearce, J.M. Energy Modeling and Techno-Economic Feasibility Analysis of Greenhouses for Tomato Cultivation Utilizing the Waste Heat of Cryptocurrency Miners. Energies 2023, 16, 1331. [Google Scholar] [CrossRef] [Scilit]
- López-Cruz, I.L.; Fitz-Rodríguez, E.; Salazar-Moreno, R.; Rojano-Aguilar, A.; Kacira, M. Development and analysis of dynamical mathematical models of greenhouse climate: A review. Eur. J. Hortic. Sci. 2018, 83, 269–279. [Google Scholar] [CrossRef] [Scilit]
- Mahmood, F.; Govindan, R.; Bermak, A.; Yang, D.; Al-Ansari, T. Data-driven robust model predictive control for greenhouse temperature control and energy utilisation assessment. Appl. Energy 2023, 343, 121190. [Google Scholar] [CrossRef] [Scilit]
- Zhuang, P.; Liang, H.; Pomphrey, M. Stochastic Multi-Timescale Energy Management of Greenhouses with Renewable Energy Sources. IEEE Trans. Sustain. Energy 2019, 10, 905–917. [Google Scholar] [CrossRef] [Scilit]
- Bozchalui, M.C.; Cañizares, C.A.; Bhattacharya, K. Optimal energy management of greenhouses in smart grids. IEEE Trans. Smart Grid 2015, 6, 827–835. [Google Scholar] [CrossRef] [Scilit]
- Mehboob, N.; Farag, H.E.; Sawas, A.M. Energy consumption model for indoor cannabis cultivation facility. IEEE Open Access J. Power Energy 2020, 7, 222–233. [Google Scholar] [CrossRef] [Scilit]
- Naseer, M.; Persson, T.; Righini, I.; Stanghellini, C.; Maessen, H.; Verheul, M.J. Bio-economic evaluation of greenhouse designs for seasonal tomato production in Norway. Biosyst. Eng. 2021, 212, 413–430. [Google Scholar] [CrossRef] [Scilit]
- Peng, Y.; Ma, X.; Wang, Y.; Li, M.; Gao, F.; Zhou, K.; Aemixay, V. Energy performance assessment of photovoltaic greenhouses in summer based on coupled optical-electrical-thermal models and plant growth requirements. Energy Convers. Manag. 2023, 287, 117086. [Google Scholar] [CrossRef] [Scilit]
- Bambara, J.; Athienitis, A. Experimental evaluation and energy modeling of a greenhouse concept with semi-transparent photovoltaics. Energy Procedia 2015, 78, 435–440. [Google Scholar] [CrossRef] [Scilit]
- Beaulac, A.; Lalonde, T.; Haillot, D.; Monfet, D. Energy modeling, calibration, and validation of a small-scale greenhouse using TRNSYS. Appl. Therm. Eng. 2024, 248, 123195. [Google Scholar] [CrossRef] [Scilit]
- Yeo, U.H.; Lee, S.Y.; Park, S.J.; Kim, J.G.; Cho, J.H.; Decano-Valentin, C.; Kim, R.W.; Lee, I.B. Rooftop Greenhouse: (2) Analysis of Thermal Energy Loads of a Building-Integrated Rooftop Greenhouse (BiRTG) for Urban Agriculture. Agriculture 2022, 12, 787. [Google Scholar] [CrossRef] [Scilit]
- Howells, M.; Rogner, H.; Strachan, N.; Heaps, C.; Huntington, H.; Kypreos, S.; Hughes, A.; Silveira, S.; DeCarolis, J.; Bazillian, M.; et al. OSeMOSYS: The Open Source Energy Modeling System. An introduction to its ethos, structure and development. Energy Policy 2011, 39, 5850–5870. [Google Scholar] [CrossRef] [Scilit]
- Abedrabboh, O.; Koç, M.; Biçer, Y. Modelling and analysis of a renewable energy-driven climate-controlled sustainable greenhouse for hot and arid climates. Energy Convers. Manag. 2022, 273, 116412. [Google Scholar] [CrossRef] [Scilit]
- Riahi, J.; Vergura, S.; Mezghani, D.; Mami, A. Smart and renewable energy system to power a temperature-controlled greenhouse. Energies 2021, 14, 5499. [Google Scholar] [CrossRef] [Scilit]
- Ozcan, Z.; Bilir, L.; Caglar, B. Modelling and analysis of heat pump integrated Photovoltaics-Wind systems for an agricultural greenhouse in Turkey. Appl. Therm. Eng. 2024, 248, 123364. [Google Scholar] [CrossRef] [Scilit]
- Watson, R.T.; Boudreau, M.C.; van Iersel, M.W. Simulation of greenhouse energy use: An application of energy informatics. Energy Inform. 2018, 1, 1. [Google Scholar] [CrossRef] [Scilit]
- Goo, J.; Shin, H.; Kwak, Y.; Park, D.Y.; Huh, J.H. Development of an applicability and performance evaluation tool based on energy simulation for smart greenhouse cooling packages. Appl. Therm. Eng. 2024, 240, 122240. [Google Scholar] [CrossRef] [Scilit]
- Altes-Buch, Q.; Quoilin, S.; Lemort, V. A modeling framework for the integration of electrical and thermal energy systems in greenhouses. Build. Simul. 2022, 15, 779–797. [Google Scholar] [CrossRef] [Scilit]
- Natural Resources Canada. Growing Seasons; Natural Resources Canada: Ottawa, ON, Canada, 2025. [Google Scholar]
- Growing Spaces. Geodesic Dome Greenhouse Shape; Growing Spaces: Pagosa Springs, CO, USA, 2023. [Google Scholar]
- Green Iglu. Green Iglu 2021. Available online: https://www.greeniglu.com/ (accessed on 13 October 2023).
- Cuce, E.; Harjunowibowo, D.; Cuce, P.M. Renewable and sustainable energy saving strategies for greenhouse systems: A comprehensive review. Renew. Sustain. Energy Rev. 2016, 64, 34–59. [Google Scholar] [CrossRef] [Scilit]
- Rudge, S. Greenhouses for the Northern Climate; Technical Report; Yukon Government: Whitehorse, YT, Canada, 2015.
- Katzin, D.; Marcelis, L.F.; van Mourik, S. Energy savings in greenhouses by transition from high-pressure sodium to LED lighting. Appl. Energy 2021, 281, 116019. [Google Scholar] [CrossRef] [Scilit]
- Cullis Watson, A.; Niet, T.; Palmer, P. Multiphysics Energy Systems Demand Modelling for Community-Scale Greenhouses. In Proceedings of the 2025 IEEE/SICE International Symposium on System Integration (SII), Munich, Germany, 21–24 January 2025. [Google Scholar]
- Sarbu, I.; Sebarchievici, C. A comprehensive review of thermal energy storage. Sustainability 2018, 10, 191. [Google Scholar] [CrossRef] [Scilit]
- Makhorin, A. GLPK (GNU Linear Programming Kit), 2012. Available online: https://www.gnu.org/software/glpk/ (accessed on 20 March 2025).
- Staffell, I.; Pfenninger, S.; Johnson, N. A global model of hourly space heating and cooling demand at multiple spatial scales. Nat. Energy 2023, 8, 1328–1344. [Google Scholar] [CrossRef] [Scilit]
- PVGIS. Hourly Radiation Data, 2020. Available online: https://joint-research-centre.ec.europa.eu/pvgis-photovoltaic-geographical-information-system_en (accessed on 1 December 2022).
- Omeiza, L.A.; Abid, M.; Dhanasekaran, A.; Subramanian, Y.; Raj, V.; Kozak, K.; Mamudu, U.; Azad, A.K. Application of solar thermal collectors for energy consumption in public buildings—An updated technical review. J. Eng. Res. 2024. [Google Scholar] [CrossRef] [Scilit]
- Adeyemo, A.A.; Alves, E.; Marra, F.; Brandao, D.; Tedeschi, E. Suitability assessment of high-power energy storage technologies for offshore oil and gas platforms: A life cycle cost perspective. J. Energy Storage 2023, 61, 106643. [Google Scholar] [CrossRef] [Scilit]
- Ramasamy, V.; Zuboy, J.; Woodhouse, M.; O’shaughnessy, E.; Feldman, D.; Desai, J.; Walker, A.; Margolis, R.; Basore, P. U.S. Solar Photovoltaic System and Energy Storage Cost Benchmarks, with Minimum Sustainable Price Analysis: Q1 2023; Technical Report; NREL: Golden, CO, USA, 2023.
- Rockenbaugh, C.; Dean, J. High Performance Flat Plate Solar Thermal Collector Evaluation; Technical Report; NREL: Golden, CO, USA, 2016.
- Smithsonian’s National Museum of Natural History. Eyewitness to Change; Smithsonian’s National Museum of Natural History: Washington, DC, USA, 2008. [Google Scholar]
- Henderson, S. A Primer on Climate Zones for Home Construction in Canada, 2023. Available online: https://bluehouseenergy.com/blogs/bhe-blog/a-primer-on-climate-zones (accessed on 14 May 2024).
- Murthy, N. Know Your Veggies and Their Lifespan. The New Indian Express, 23 April 2016.
- Growing Spaces. 42’ Growing Dome Large Greenhouse Kit; Growing Spaces: Pagosa Springs, CO, USA, 2021. [Google Scholar]
- Yukon Energy. The Impact of Solar on the Yukon Grid; Yukon Energy: Whitehorse, YT, Canada, 2025; Available online: https://yukonenergy.ca/about-us/news-events/the-impact-of-solar-on-the-yukon-grid/ (accessed on 30 October 2025).
- SunWatts. 550 Watt Phono Solar Mono XXL Solar Panel, 2024. Available online: https://sunwatts.com/ (accessed on 26 July 2024).
- Longi. LS72-550M. Charge Solar 2023. Available online: https://www.chargesolar.com/product/ls72-550m/ (accessed on 26 July 2024).
- Barbosa, G.L.; Almeida Gadelha, F.D.; Kublik, N.; Proctor, A.; Reichelm, L.; Weissinger, E.; Wohlleb, G.M.; Halden, R.U. Comparison of land, water, and energy requirements of lettuce grown using hydroponic vs. Conventional agricultural methods. Int. J. Environ. Res. Public Health 2015, 12, 6879–6891. [Google Scholar] [CrossRef] [Scilit] [PubMed]
- Government of Nunavut. 2017 Nunavut Food Price Survey, Comparison of Nunavut & Canada CPI Food Price Basket Items; Government of Nunavut: Iqaluit, NU, Canada, 2017.
- Numbeo. Food Prices in Vancouver, Canada, 2024. Available online: https://www.numbeo.com/food-prices/in/Vancouver (accessed on 25 July 2024).
- Save on Foods. Tomotoes, 2024. Available online: https://www.saveonfoods.com/sm/delivery/rsid/2290/results?q=tomotoes (accessed on 25 July 2024).
- Yukon Bureau of Statistics. Yukon Monthly Statistical Review, June 2024; Technical Report; Government of Yukon: Whitehorse, YT, Canada, 2024.
- Expatistan. Cost of Living in Whitehorse, Canada; Expatistan: Whitehorse, YT, Canada, 2024; Available online: https://www.expatistan.com/cost-of-living/whitehorse (accessed on 31 July 2024).
- BVD Petroleum. Retail Diesel Prices, 2024. Available online: https://bvdgroup.com/petroleum/prices/ (accessed on 18 July 2024).
- Esso. Blind River Esso, 2024. Available online: https://www.esso.ca/en-ca/find-station/esso-blindriver-on-blindriveresso-200319913 (accessed on 18 July 2024).
- Makivvik. Halutik Enterprises, 2024. Available online: https://www.makivvik.ca/halutik-enterprises/ (accessed on 18 July 2024).
- Jamal, M. Fuel prices set to increase across Nunavut starting Saturday. Nunatsiaq News, 31 March 2023.
- Government of Northwest Territories. Fuel Services; Government of Northwest Territories: Yellowknife, NT, Canada, 2024. Available online: https://www.inf.gov.nt.ca/en/services/fuel-services/prices (accessed on 10 July 2024).

Disclaimer/Publisher’s Note: The statements, opinions and data contained in all publications are solely those of the individual author(s) and contributor(s) and not of MDPI and/or the editor(s). MDPI and/or the editor(s) disclaim responsibility for any injury to people or property resulting from any ideas, methods, instructions or products referred to in the content. |
© 2026 by the authors. Licensee MDPI, Basel, Switzerland. This article is an open access article distributed under the terms and conditions of the Creative Commons Attribution (CC BY) license.