


Abstract
As climate change increasingly threatens sustainable development goals, climate risk has emerged as a critical factor shaping corporate strategic decisions and capital allocation behavior. Using a sample of Chinese A-share listed firms over the period 2008 to 2024, this study constructs a firm-level climate risk index through textual analysis of annual report disclosures and examines its effect on corporate green investment. We find that climate risk is positively associated with corporate green investment. Mechanism analysis reveals that climate risk operates through dual pathways: it enhances firms’ green strategic orientation as the internal governance mechanism, and heightens public green attention as the external governance mechanism, both of which are positively related to increasing firms’ green investment. Heterogeneity analysis shows that the promoting effect is more pronounced for state-owned enterprises, heavy-polluting firms, firms with negative media coverage, and firms located in northern regions of China. Further analysis reveals that climate risk is more strongly associated with green transformation investment over end-of-pipe treatment investment, and firms that increase green transformation investment in response to climate risk achieve stronger firm growth. These findings provide new evidence on how climate risk shapes corporate environmental behavior, offering practical insights for promoting sustainable investment and advancing corporate contributions to sustainable development.
1. Introduction
In recent years, global climate change has continued to intensify, with extreme weather events such as heatwaves, floods, and droughts increasing in both frequency and severity. Climate-related extreme weather events have cost the global economy more than $2 trillion over the past decade, and the World Economic Forum’s Global Risks Report 2026 identifies such hazards as the most severe global risk over the next decade. These pressures are imposing mounting costs on economic systems worldwide, compelling governments and firms alike to accelerate their responses to climate change. In China, where the dual carbon targets of peaking emissions by 2030 and achieving carbon neutrality by 2060 have placed green transformation at the center of national economic strategy, the urgency of corporate climate action is particularly pronounced [1]. Against this backdrop, clarifying climate change’s impacts on firm behavior and unpacking pathways linking climate risk to corporate action are essential prerequisites for high-quality economic development.
Climate change not only affects macroeconomic stability but also directly influences the strategic decisions of individual firms. Extreme weather events can disrupt production, damage fixed assets, erode operating cash flows, and increase uncertainty about future revenues, all of which heighten firms’ incentives to adjust their investment strategies [2]. At the same time, the ongoing global low-carbon transition places extra transitional constraints on firms via regulatory tightening, carbon pricing, and shifting investor preferences [3]. In this context, corporate green investment has emerged as a critical strategic response through which firms reduce their climate-related exposure, demonstrate environmental commitment to external stakeholders, and contribute to the broader low-carbon transition. It is therefore theoretically important and policy-relevant to understand the mechanisms through which climate risk shapes firms’ green-investment decisions.
A growing body of research has examined the economic consequences of climate risk on firm behavior. Studies have shown that physical climate shocks erode firm profitability and raise financing costs [4,5], while transition risks alter long-run investment incentives and strategic resource allocation [6,7].
In measuring firm-level climate risk, two main methods have been adopted in the literature. The first method relies on objective regional climate data, such as temperature anomalies, disaster records, or CO2 emissions per unit of GDP, to construct climate risk indices that reflect the actual physical hazard conditions firms face in their operating locations [8,9]. While this approach captures objective exposure with relative accuracy, it cannot reflect how individual managers perceive and respond to climate threats, which is ultimately what impacts firm-level investment decisions. The second method constructs firm-level, text-based climate risk index measures by extracting climate-related keywords from annual reports or earnings call transcripts, thereby capturing managerial perception and the disclosure of climate risk at the firm level [10,11]. As this strand of literature emphasizes, it is how managers perceive and internalize climate threats that shapes strategic and investment behavior. We follow this second approach, classifying annual report textual keywords into acute physical risk, chronic physical risk, and transition risk to yield a more comprehensive measure of firm-level climate risk exposure.
Regarding the determinants of corporate green investment, existing research has examined both internal firm characteristics and external environmental factors. On the internal side, scholars have identified corporate governance structures [12], executive environmental orientation and risk preferences, and firm financial characteristics as important factors of environmental investment decisions. Firms with stronger governance mechanisms and longer-horizon incentive structures tend to allocate more capital toward green activities [13]. On the external side, environmental regulation [14] and digital transformation [15] have been identified as significant external factors that constrain green investment. More recently, public attention and investor scrutiny have been recognized as informal governance forces that exert sustained pressure on firms to improve their environmental performance [16].
Despite this breadth, two critical gaps limit the cumulative contribution of existing work. On the one hand, the mechanisms linking climate risk to green investment remain poorly understood. Whether firms respond through internal strategic adjustment, through external stakeholder pressure, or through both has not been systematically examined. On the other hand, by treating green investment as a single aggregate, existing studies often conflate green transformation with end-of-pipe treatment [17]. Hart and Ahuja (1996) assess that these two investment types reflect distinct strategic intents, and grouping them together obscures whether firms are pursuing genuine low-carbon transitions or merely symbolic compliance [18].
Using a sample of Chinese A-share listed firms, we examine the relationship between climate risk and corporate green investment. We then test a dual-pathway mediation framework with green strategic orientation and public green attention. We further decompose green investment into green transformation investment and end-of-pipe treatment investment. Our results confirm that climate risk correlates positively with green investment through both internal and external governance mechanisms independently. The effect is concentrated in green transformation investment, suggesting that climate risk is associated with substantive strategic commitment rather than symbolic compliance.
Our findings offer new insights into climate risk, dual governance mechanisms, and corporate green investment. Understanding how climate risk shapes green investment through both internal and external governance channels, and why it tends to favor substantive transformation over symbolic compliance, can help design more effective policies that direct climate pressure toward high-quality green capital allocation.
This paper’s structure is as follows: Section 2 covers the theoretical framework and research hypotheses. Section 3 details the research data and methodology. Section 4 discusses the results. Section 5 tests the potential mechanisms through which climate risk impacts corporate green investment. Section 6 describes heterogeneity analyses. Section 7 discusses the further results, and Section 8 concludes.
2. Literature Review and Hypotheses Development
2.1. Theoretical Background
Understanding how climate risk shapes corporate green investment requires theoretical frameworks that operate at multiple levels of analysis. At the cognitive level, the attention-based view posits that firm behavior is fundamentally determined by where decision-makers direct their limited attention [19]. Managers operate under bounded rationality and cannot respond to all environmental signals simultaneously. It is therefore the allocation of managerial attention that proximately guides strategic priorities and resource allocation decisions.
Yet attention alone does not translate directly into investment action. Dynamic capabilities theory holds that firms sustain competitive advantage by sensing environmental changes and redeploying their internal resources and organizational processes in response to external turbulence. This framework explains how attentional responses are institutionalized within firms through the development of formal governance structures and strategic commitments that channel resources toward adaptive action.
Aside from internal considerations, firms are also subject to external governance pressures from a broad network of stakeholders, whose expectations and actions shape corporate behavior independently of internal strategic intent. Institutional theory holds that firms seek organizational legitimacy by conforming to externally recognized structures and behaviors, while stakeholder theory emphasizes that diverse external stakeholders have material consequences for corporate performance and survival. These frameworks explain how external social and institutional pressures constitute an independent governance force that operates in parallel with internal strategic adaptation.
By integrating these perspectives, this study proposes a dual-pathway theoretical framework in which climate risk impacts corporate green investment through both internal and external governance channels simultaneously. This integrated framework offers a more complete theoretical account of how firms respond to environmental uncertainty than prior studies drawing on a single theoretical lens, and theorizes internal and external pathways as complementary mechanisms.
2.2. Climate Risk and Corporate Green Investment
Attention-based view (ABV) posits that decision-makers’ attention is a scarce and finite resource, and that the more attention executives allocate to a particular issue, the more organizational resources and strategic responses that issue will receive. Joseph and Wilson (2018) propose that firm behavior is therefore not solely determined by objective environmental conditions but is fundamentally mediated by how managers perceive, interpret, and prioritize external stimuli [19]. Climate risk, as an intensifying source of environmental uncertainty, constitutes a powerful attentional stimulus that reshapes executive cognition and strategic priority-setting [3].
Physical climate events such as floods, droughts, and extreme temperatures impose direct operational disruptions, damage productive assets, and erode cash flow stability [20]. These tangible losses heighten the managerial awareness of climate exposure and signal the inadequacy of existing risk management frameworks [21]. At the same time, the transition toward a low-carbon economy introduces a set of strategic pressures. Tightening environmental regulations, the expansion of carbon pricing mechanisms, and shifting preferences among investors and consumers collectively raise the cost of carbon-intensive activities and increase the forward-looking value of green assets [22,23]. As these pressures accumulate in firms’ information environment, executives are prompted to redirect attention resources from short-term operational goals toward longer-term green strategic commitments [24].
From a corporate investment perspective, this attentional reallocation has direct implications for capital allocation behavior. Firms that perceive heightened climate risk face growing pressure to invest in climate-resilient infrastructure, cleaner production processes, and low-carbon technologies as a means of reducing their long-run risk exposure and securing access to green financing channels [25]. We therefore propose the following:
H1.
Climate risk is positively associated with corporate green investment.
2.3. The Internal Governance Mechanism: Green Strategic Orientation
Dynamic capabilities theory holds that firms sustain competitive advantage by sensing environmental changes and reconfiguring internal resources in response to external turbulence [26]. As climate risk intensifies, firms are compelled to embed environmental sustainability into their core stratege through formalized targets, management systems, and governance structures, a process that finds its organizational expression in green strategic orientation [27]. Firms with strong green strategic orientation have mature internal environmental governance structures. Accordingly, they interpret heightened climate risk not as an isolated operational risk, but as a strategic imperative that requires proactive organizational adjustment [28]. By formalizing environmental accountability, institutionalizing green management practices, and integrating environmental criteria into strategic planning, firms develop the internal organizational capacity to translate climate risk perception into sustained environmental action [29].
The literature shows that firms with clear environmental targets and formalized governance structures are more likely to direct capital toward pollution control, energy efficiency, and clean technology adoption, as green investment becomes the primary instrument through which strategic environmental commitments are operationalized [30]. Moreover, the institutional embeddedness of environmental goals reduces managerial short-termism in green capital allocation, ensuring that investment decisions reflect long-term strategic priorities rather than short-term financial considerations [31]. In this sense, green strategic orientation may function as an internal organizational channel via which climate risk perception translates into tangible green-investment behavior. We therefore propose the following:
H2.
Climate risk is positively linked to firms’ green strategic orientation, which in turn shows a positive association with corporate green investment.
2.4. The External Governance Mechanism: Public Green Attention
Institutional theory suggests that firms seek organizational legitimacy by conforming to externally recognized structures and behaviors, which helps mitigate the environmental negative externalities of corporate activities [32]. As a key information bridge linking firms and external stakeholders, corporate annual reports help convey information to outside audiences. When firms disclose heightened climate risk exposure, this raises public awareness of their environmental vulnerabilities and may reduce public confidence in their investment value and future growth prospects [22]. Against the backdrop of China’s deepening societal consensus around low-carbon development, such disclosure intensifies the public scrutiny of corporate environmental conduct, generating legitimacy pressure on firms to demonstrate credible environmental commitment [33].
Faced with heightened public green attention, external stakeholders strengthen monitoring and constraint over firms’ green performance through external governance mechanisms [34]. Their “vote with their feet” behavior imposes direct reputational costs on firms perceived as environmentally irresponsible, providing firms with external motivation to increase green investment as a tangible response to public scrutiny. Simultaneously, as market expectations for green development grow, firms are increasingly inclined to scale up environmental investment to meet public demand for green initiatives. By projecting positive environmental signals, they cultivate a favorable corporate image and safeguard their social standing and market value [35]. We therefore propose the following:
H3.
Climate risk is positively associated with public green attention, which in turn exhibits a positive link with corporate green investment.
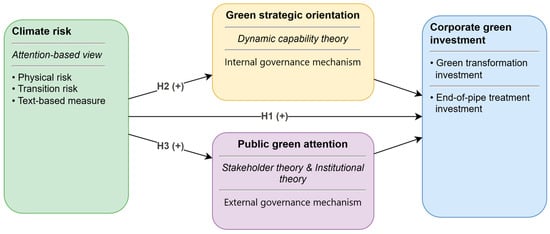
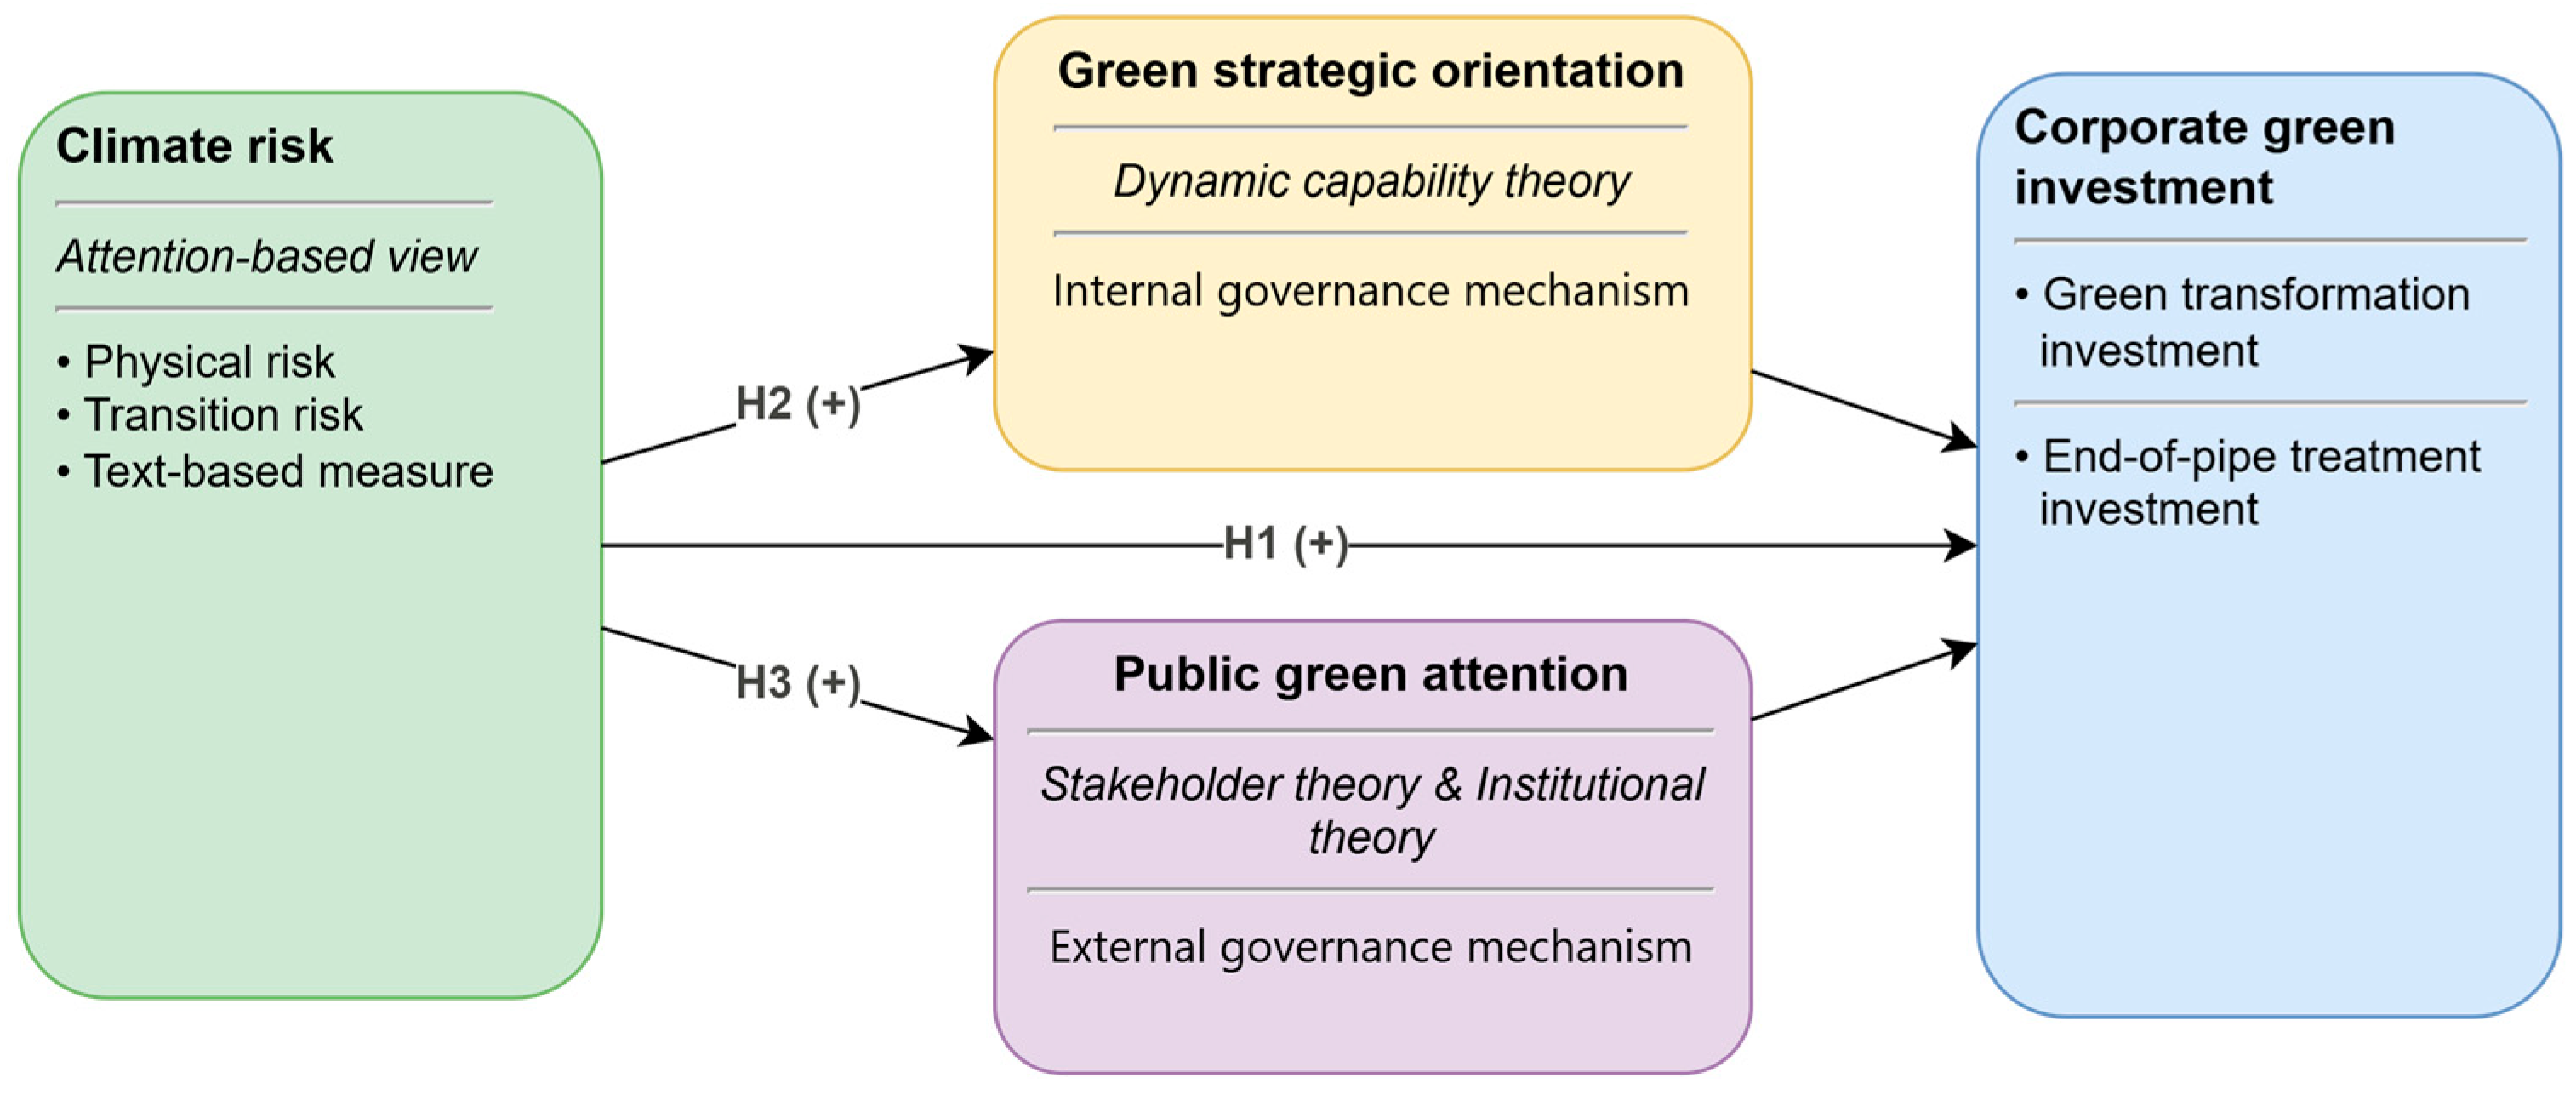
Figure 1 presents an illustration of the hypotheses to be tested in the theoretical model.
Figure 1.
Theoretical framework.
3. Data and Summary Statistics
3.1. Sample
This study uses Chinese A-share listed firms over the period 2008 to 2024 as the initial sample. Following standard practice in the literature, we apply the following screening criteria. First, we exclude firms designated as ST, ST*, or PT, as these firms face abnormal financial conditions that may confound the results. Second, we exclude firms in the financial industry, given their distinct regulatory environment and balance sheet structure. Third, we exclude firm–year observations with missing values for key variables. After these procedures, the final sample consists of 46,580 observations. Corporate green-investment data are collected from firms’ annual reports. Climate risk data are constructed through textual analysis of annual report disclosures using the WinGo Financial Text Data Platform. All remaining variables are retrieved from the CSMAR database. To mitigate the influence of outliers, all continuous variables are winsorized at the first and 99th percentiles.
3.2. Variables
3.2.1. Dependent Variable (Ginvest)
The dependent variable is corporate green investment (Ginvest). It refers to various forms of corporate expenditure directed at preventing and controlling environmental pollution and generating ecological benefits [36]. Following prior studies, we manually collect green-investment data from firms’ annual reports. Specifically, we identify and aggregate expenditure items in the construction-in-progress schedules of annual reports that are related to pollution prevention, ecological protection, and green production. These include desulfurization, denitrification, wastewater treatment, waste gas and residue disposal, energy conservation, dust removal, ecological restoration, and clean production projects, among others. The annual green-investment figure for each firm is obtained by summing all qualifying expenditure items. We add one to the total green-investment amount and take the natural logarithm to construct the final measure Ginvest.
3.2.2. Independent Variables (CR)
The independent variable is firms’ climate risk (CR). Before describing the construction of our measure, we clarify three related but distinct concepts that are often conflated in the literature. Climate risk exposure refers to the objective physical hazard conditions a firm faces as a result of its geographic location and industry characteristics, such as regional temperature anomalies [8]. Climate risk perception refers to how managers subjectively interpret and internalize climate-related threats [19]. Climate risk disclosure refers to the information firms formally communicate about climate risks in their public filings.
Given that firms vary substantially in their industrial structure, asset composition, and geographic distribution, the actual climate risk they face and the way they perceive and respond to it differ considerably across firms. Objective regional proxies capture the physical hazard common to all firms within a region but cannot reflect this firm-level heterogeneity in risk perception and strategic response. Text-based measures constructed from firms’ own annual report disclosures, by contrast, capture how individual managers interpret and communicate climate-related threats, making them more appropriate for studying how climate risk shapes firm-level investment behavior.
Following Sautner et al. (2023), we first identify a seed vocabulary of 76 climate risk-related keywords by drawing on the National Meteorological Science Data Center and the China Meteorological Disaster Yearbook [11]. We then apply machine learning techniques to train a word-embedding model on annual report corpora, using the Continuous Bag-of-Words (CBOW) model to identify the top ten semantically similar terms for each seed word, thereby expanding the final dictionary to 98 keywords. According to their content, these keywords are classified into three categories, namely acute risks, chronic risks and transition risks [11]. The climate risk index is measured as the frequency of climate risk keywords in a firm’s annual report, with higher values indicating greater exposure to climate risk.
3.2.3. Mediator Variables
This study employs two mediator variables, green strategic orientation (GSO) and public green attention (PGA), capturing the internal and external governance mechanisms, respectively, through which climate risk influences corporate green investment.
The first mediator variable is GSO, measured using seven binary indicators extracted from firms’ annual reports and CSR reports, including whether the firm has established an environmental protection philosophy, set environmental targets, built an environmental management system, obtained ISO 14000 [37] certification, conducted environmental education and training, organized environmental special activities, and implemented the “Three Simultaneities” system. The final GSO score is the sum of these seven indicators. Since GSO largely reflects managers’ attention to, cognition of, and strategic assessment of green-related undertakings, this composite measure captures the extent to which green priorities are embedded within the firm’s overall strategic framework [28].
The second mediator variable is PGA. We employ two complementary indicators to gauge external stakeholder scrutiny from distinct sources. The first is the public search index (PSI). Prior research demonstrates that internet search activity serves as a reliable proxy for public attention, reflecting the collective information-seeking behavior of diverse stakeholder groups in response to firm-level events [38]. We adopt the Baidu search index, constructed using stock ticker codes as search keywords, and take its natural logarithm. Higher values indicate greater public attention toward the focal firm.
The second is investor green attention (IGA), measured through textual analysis of investor relations activity records disclosed by Chinese listed firms. The content of questions posed by investors to management reflects their attention to specific topics [39]. Following Qian et al. (2025), we construct a green environmental keyword dictionary comprising terms such as “emission reduction,” “new energy,” “green development,” “environmental protection,” “environmental governance,” “low pollution,” and “sustainable development.” We apply this dictionary to identify questions related to green and environmental themes in investor relations records, and calculate the ratio of green-related questions to total investor questions in a given year as the IGA [40]. A higher ratio indicates greater institutional investor green attention.
3.2.4. Control Variables
According to the research of Ding et al. (2023), we include a set of control variables to address potential confounding effects [36]. At the firm level, the controls include firm size (Size), leverage (Lev), return on equity (ROE), capital intensity (CAP), fixed asset ratio (Fixed), Tobin’s Q (TobinQ), management expense ratio (Mfee), quick ratio (Quick), and firm age (Age). At the corporate governance level, we include board size (Board), CEO duality (Dual), the shareholding ratio of the largest shareholder (Top1), large-shareholder fund occupation (Occupy), and ownership type (SOE). All regressions further include year and industry fixed effects to account for time-varying trends and heterogeneous industry attributes.
In summary, the description of the relevant variables is shown in Table 1.
Table 1.
Description of related variables.
3.3. Empirical Model
To examine the relationship between climate risk and corporate green investment, we estimate the following baseline model:
where denotes green investment of firm i in year t, is the climate risk index, and represents the set of control variables described above. and denote industry and year fixed effects, respectively, and is the error term. Standard errors are clustered at the firm level.
To test the mediating roles, we adopt a three-step mediation procedure. The mediation models are specified as follows:
where represents the mediator variable, taking the value of GSO, PSI, or IGA in turn.
3.4. Descriptive Statistics
Table 2 presents the descriptive statistical results for the main variables in this paper. The Ginvest has a mean of 3.087 and a standard deviation of 6.234, with values ranging from zero to 23.526, indicating that there is still a significant difference in green-investment levels among Chinese listed firms, with some firms making substantial environmental expenditures while others make little to none. The CR has a mean of 0.189 and a standard deviation of 0.220, reflecting considerable divergence in the extent to which firms perceive and disclose climate-related threats. For the mediator variables, GSO has a mean of 1.503 out of a maximum possible score of seven, suggesting that the overall level of environmental strategic commitment among Chinese listed firms remains relatively low. The PSI has a mean of 9.694 with a standard deviation of 4.364, while IGA records a mean of 0.372. In addition, the values of all remaining variables fall within reasonable ranges.
Table 2.
Summary statistics.
4. Empirical Results
4.1. Baseline Regression Results
Table 3 reports the baseline regression results for the effect of CR on Ginvest. Column (1) includes only industry and year fixed effects without control variables. The coefficient of CR is positive and statistically significant at the 1% level. Column (2) adds the full set of control variables on the basis of Column (1). Although the coefficient of CR decreases slightly, it remains significant at the 1% level, with a value of 2.7911. In terms of economic significance, taking Column (2) as an example, a one-standard-deviation increase in CR (0.220) is associated with a 0.614 increase in Ginvest (0.220 × 2.7911 = 0.614).
Table 3.
The effect of climate risk on firms’ green investment.
The above results support H1. Climate risk prompts managers to pay closer attention to environmental information, interpret key signals embedded in the external environment, and proactively engage in green-investment practices in response to the challenges posed by climate change.
4.2. Test for Robustness
4.2.1. Alternative Regression Model
Since Ginvest is non-negative and exhibits a censored distribution with a large proportion of zero values, we follow Wang and Wang (2025) and re-estimate the baseline model using a panel fixed-effects Tobit model [41]. As reported in Column (1) of Table 4, the coefficient of CR remains significant at the 1% level, which is consistent with the baseline regression results. However, it should be noted that the Tobit regression coefficient alone reflects the direction and statistical significance of the relationship, but does not directly quantify the marginal effect of a unit change in climate risk on actual green-investment outcomes.
Table 4.
Robustness checks using alternative estimation methods and fixed effects specifications.
To further quantify the magnitude of the effect, we compute marginal effects following the Tobit estimation. The extensive margin shows that a one-unit increase in CR raises the probability of positive green investment by 0.1607 ***, while the intensive margin shows a 2.7946-unit increase in Ginvest conditional on positive investment (p < 0.001), consistent with the baseline OLS coefficient of 2.791. These results confirm that climate risk operates through both margins simultaneously. These findings suggest that climate risk raises the probability of firms initiating green-investment activities, while increasing the level of green investment among firms already undertaking green investment.
4.2.2. High-Dimensional Fixed Effects
To further account for unobserved heterogeneity at multiple levels, we progressively incorporate additional high-dimensional fixed effects on top of the baseline specification. Specifically, Column (2) additionally controls for firm fixed effects, Column (3) further replaces year fixed effects with industry-by-year fixed effects to absorb time-varying industry-level shocks, and Column (4) additionally incorporates province-by-year fixed effects to control for time-varying provincial heterogeneity simultaneously. As reported in Table 4, the coefficients of CR are 2.3784, 2.1812, and 1.9615 across the three columns, and all remaining positive significant at the 1% level. These results confirm that the positive effect of CR on Ginvest is robust to the inclusion of high-dimensional fixed effects, and is not impacted by the unobserved time-varying heterogeneity at the firm, industry, or provincial level.
4.2.3. Alternative Measures of Climate Risk
To ensure that our findings are not sensitive to the specific construction of the climate risk measure, we employ two alternative proxies for climate risk. The first alternative measure (CR_freq) is constructed by aggregating the sentence frequency of climate risk-related keywords appearing in each firm’s annual report in a given year, adding one and taking the natural logarithm.
The second alternative measure (CR_city) addresses potential selective disclosure bias inherent in text-based climate risk measures since the baseline measure reflects firms’ perceived and disclosed level of climate risk exposure, which may not fully capture actual physical climate risk. Following Guo et al. (2024), we therefore construct an alternative measure using the extreme climate risk at the city level where the firm is located as a proxy for the firm’s actual climate risk exposure [42]. To further validate the relationship between our baseline text-based measure and this objective physical proxy, we report the Pearson correlation between CR and CR_city. The correlation coefficient is 0.024 and significant at the 1% level, confirming that our text-based measure is positively associated with objective physical climate risk. As reported in Columns (1) and (2) of Table 5, the coefficients of both CR_freq and CR_city are positive significant. These results indicate that the baseline findings remain robust to alternative measures of the independent variable.
Table 5.
Robustness checks using alternative measures, lagged variables, and sample adjustments.
4.2.4. Two-Year Lag Period
Given that the effect of climate risk on managerial green-investment decisions may involve a time lag between risk perception and actual implementation, we re-estimate the baseline model using one-period and two-period lagged values of climate risk as the independent variable. As reported in Columns (3) and (4) of Table 5, the coefficients of CR_lag1 and CR_lag2 are 2.9273 and 2.9330, both statistically significant at the 1% level.
4.2.5. Excluding Special Periods
To rule out the potential confounding effects of extraordinary economic disruptions, we exclude observations from 2008, which corresponds to the global financial crisis, and from 2020 to 2022, which corresponds to the COVID-19 pandemic period. As reported in Columns (5) of Table 5, the coefficient of CR remains significant at the 1% level, with a value of 2.6701, which is consistent with the baseline results.
4.2.6. System GMM Estimation
Corporate green investment may exhibit dynamic persistence, whereby the current level of green investment is influenced by its prior levels. Estimating such a relationship using a static panel model may yield biased estimates. To address this concern, we augment the baseline model with a lagged dependent variable and estimate a dynamic panel model using the two-step system GMM estimator, which effectively controls for potential endogeneity. As reported in Column (1) of Table 6, the coefficient of CR remains positive significant at the 5% level. The AR(2) test yields a p-value of 0.119, indicating no second-order serial correlation in the residuals. The Hansen test of over-identifying restrictions yields a p-value of 0.182, confirming the validity of all instrumental variables and the absence of serious model misspecification. Taken together, these results confirm that the baseline finding is robust to the dynamic panel estimation approach.
Table 6.
Robustness checks addressing endogeneity.
4.2.7. Propensity Score Matching
To address potential endogeneity arising from sample-selection bias, we employ propensity score matching (PSM). We first use the industry–year median of climate risk as the threshold to classify firms into a treatment group (above the median) and a control group (below the median). We then use the control variables from the baseline regression as covariates and apply 1:3 nearest-neighbor matching with replacement to construct the matched sample.
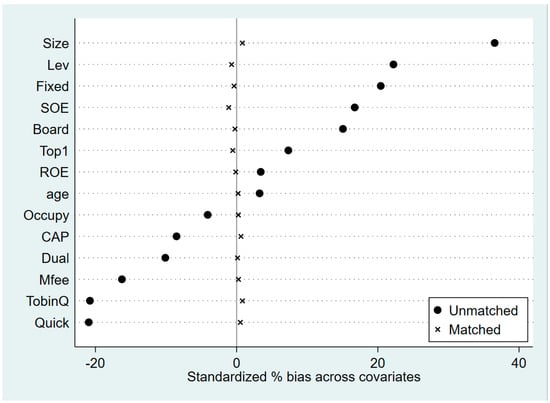
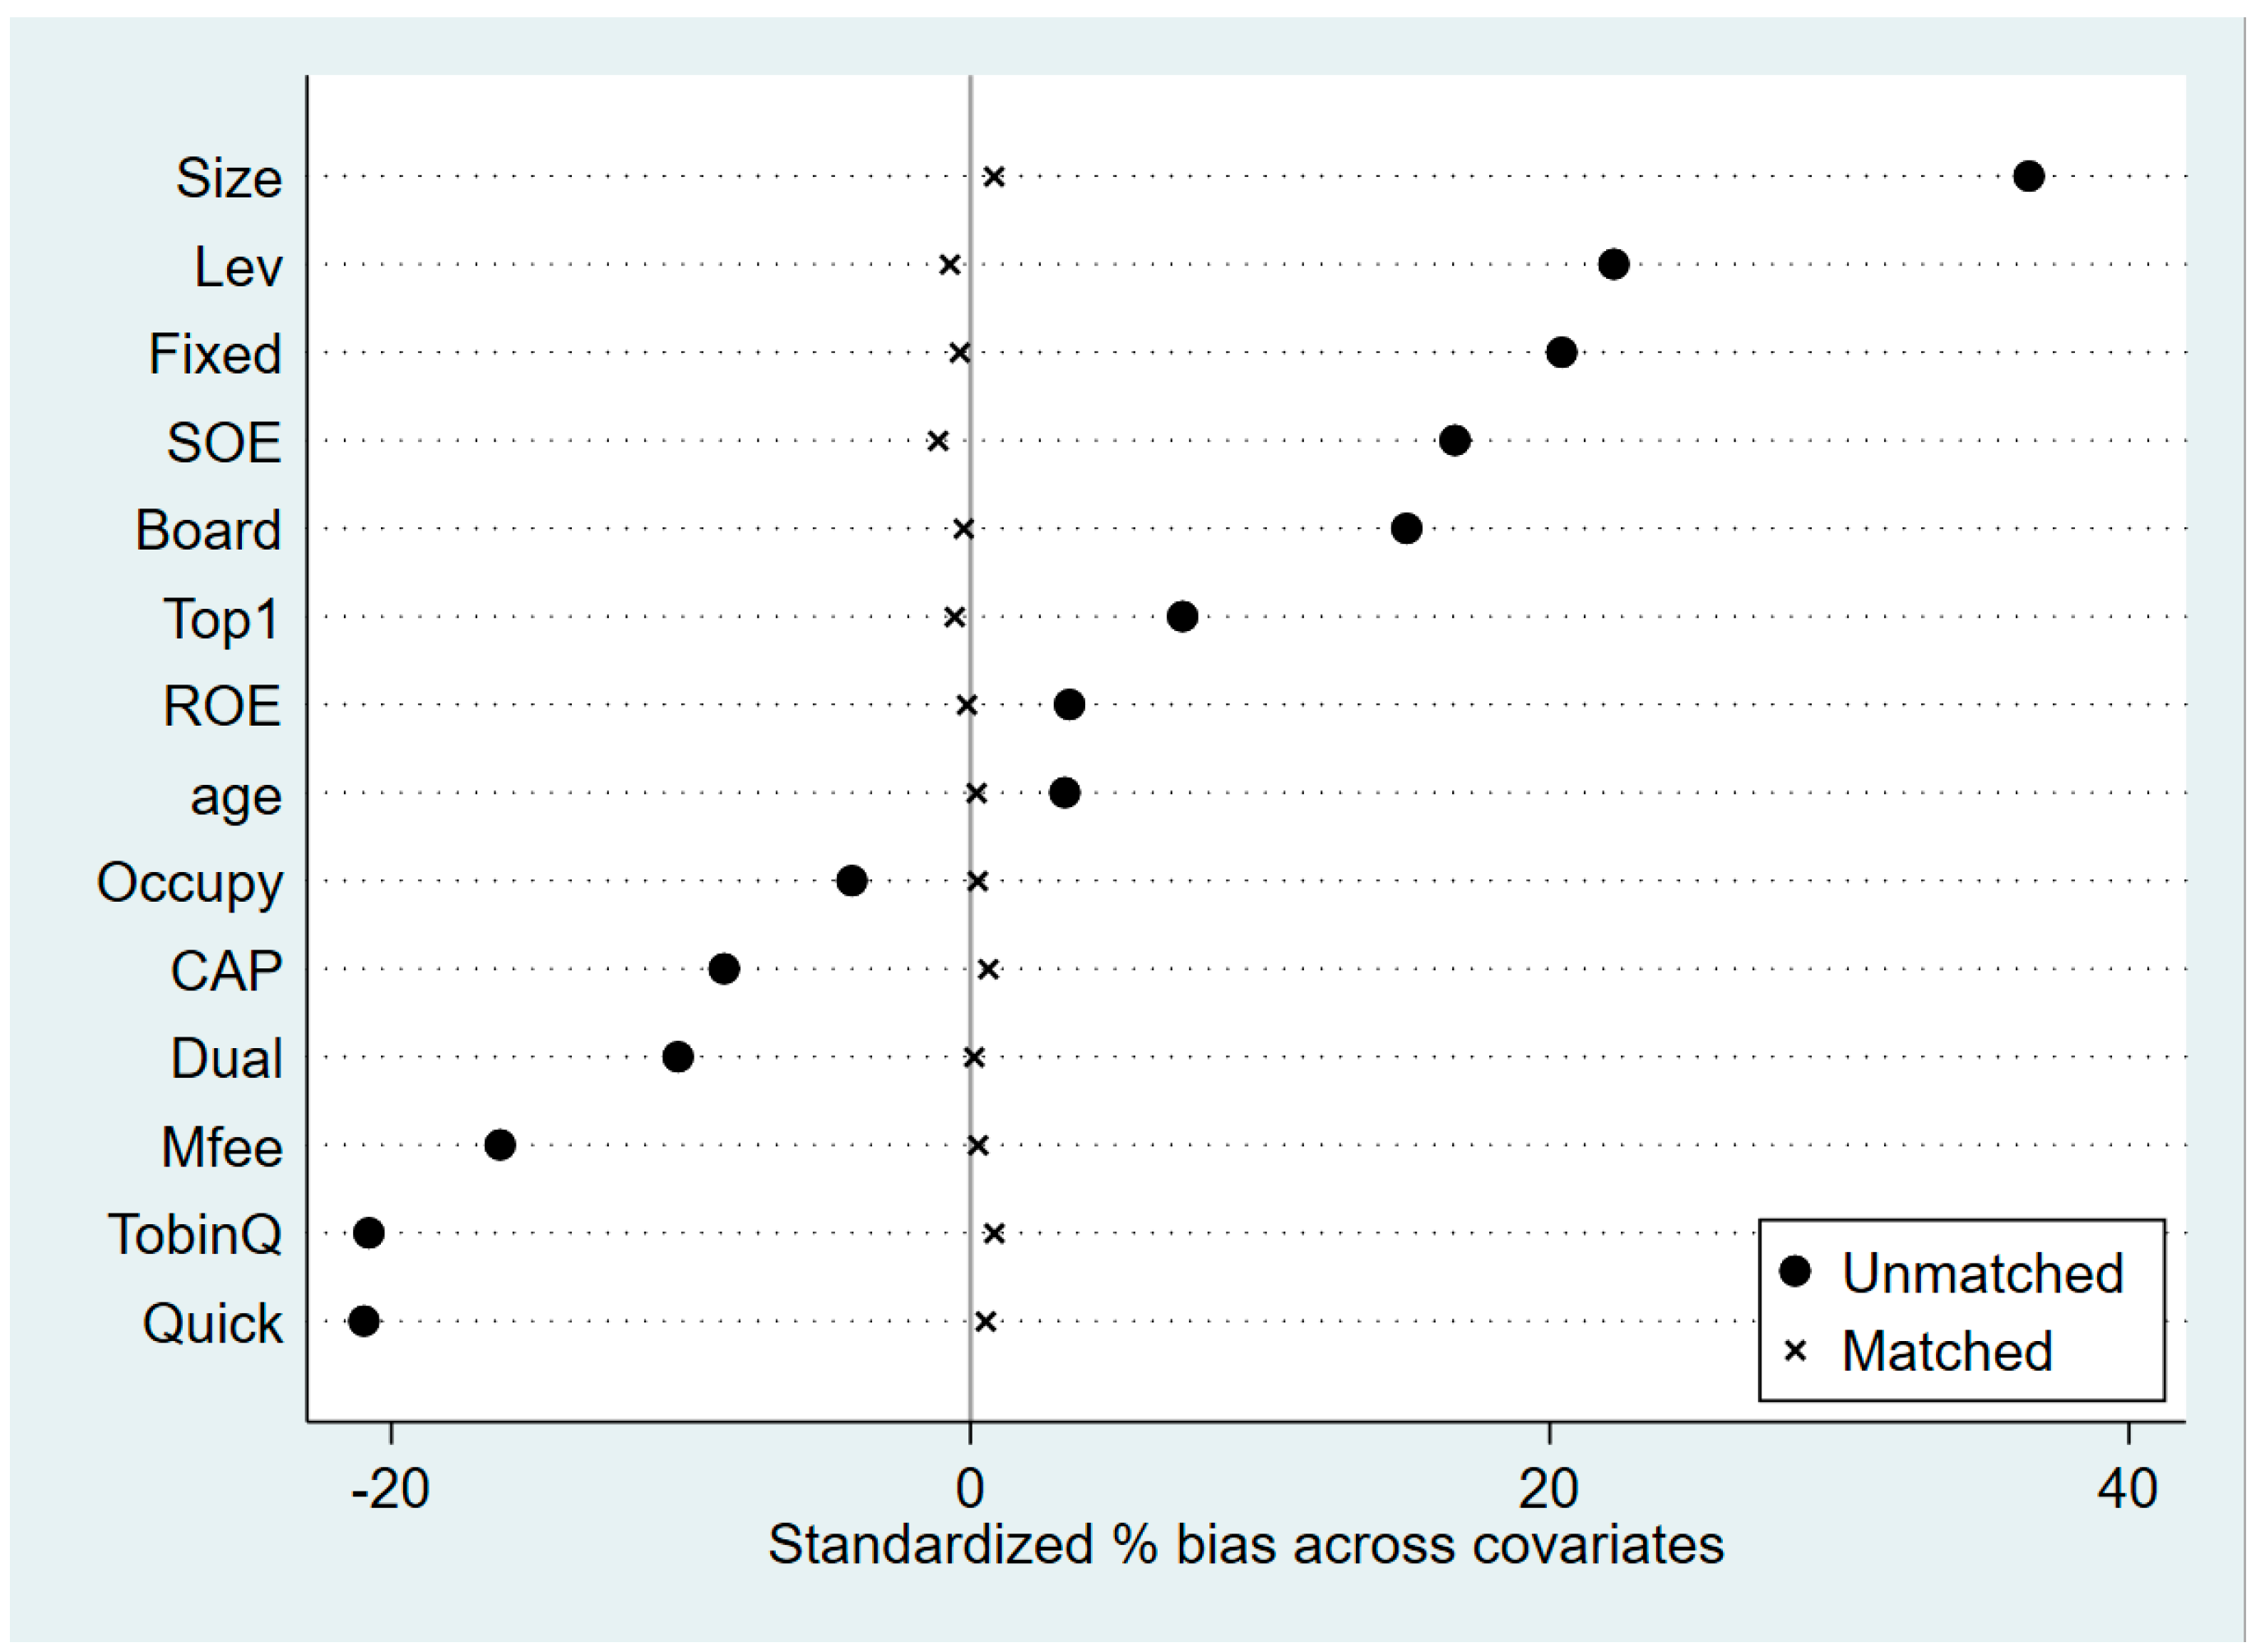
The balance tests reported in Table 7 and Figure 2 confirm the quality of the matching. After matching, the standardized percentage bias for all covariates falls within 10%, and the p-values are all greater than 0.05. Figure 2 further shows that the matched sample is concentrated around zero, indicating that the covariate distributions are well-balanced between the treatment and control groups and that sample-selection bias has been effectively addressed.
Table 7.
Balance test results for propensity score matching.
Figure 2.
Standardized bias before and after propensity score matching.
We then re-estimate the baseline regression using the matched sample. As reported in Column (2) of Table 6, the coefficient of CR remains statistically significant at the 1% level, with a value of 2.8457. These results indicate that the baseline findings remain robust after accounting for sample-selection bias.
4.2.8. Instrumental Variable Regression
To address potential endogeneity concerns arising from omitted variables in the relationship between climate risk and corporate green investment, we employ the industry–year average climate risk index excluding the firm itself (IV_CR) as an instrumental variable and estimate the model using two-stage least squares. Firms within the same industry tend to exhibit similar exposure to climate-related shocks, which satisfies the relevance requirement for the instrumental variable. Meanwhile, the climate risk conditions of peer firms in the same industry exert no direct influence on the green-investment decisions of a given focal firm. This feature supports the exogeneity assumption, making the instrument valid for our identification.
As reported in the first-stage regression results in Column (3) of Table 6, the coefficient of IV_CR is 0.1016 and statistically significant at the 1% level, indicating a positive spillover effect of industry-level climate risk on individual firm climate risk, which satisfies the relevance condition of the instrumental variable. The Kleibergen–Paap rk Wald F-statistic of 73.05 confirms the absence of weak instrument concerns, validating the effectiveness of the instrument. The second-stage regression results in Column (4) of Table 6 show that after controlling for endogeneity, the coefficient of CR remains positive and statistically significant at the 1% level, indicating that the positive association between CR and Ginvest remains robust after addressing endogeneity concerns.
5. Mechanism Analysis
5.1. The Internal Governance Mechanism
Table 8 reports the results of the mechanism analysis for GSO. Column (1) examines the effect of CR on GSO, showing that the coefficient of CR is statistically significant at the 1% level, with a value of 0.6378. This positive estimate suggests that greater climate risk exposure pushes managers to formulate environmental commitments, integrate sustainability into core strategies, and adopt formal green management practices, thus strengthening firms’ green strategic orientation. We note that alternative temporal ordering cannot be fully ruled out. Firms with stronger GSO may also be more alert to climate-related threats and therefore perceive higher climate risk exposure.
Table 8.
Mechanism analysis: the role of GSO.
Column (2) introduces GSO alongside CR into the regression with Ginvest as the dependent variable. The coefficient of GSO is significant at the 1% level, with a value of 0.1300, while the coefficient of CR remains significant at the 1% level, with a value of 2.7240. When firms establish a strong green strategic orientation, it helps reduce agency costs and mitigate managerial short-termism, aligning managerial incentives with long-term environmental goals and thereby promoting sustained green capital allocation. These results confirm that climate risk is positively associated with corporate green investment through the internal governance channel of GSO, supporting H2. This indicates that higher green strategic orientation further facilitates corporate green investment by lowering agency costs, alleviating managerial short-termism and aligning managers with long-term environmental objectives, supporting H2.
5.2. The External Governance Mechanism
Table 9 reports the results of the mechanism analysis for PGA, which is operationalized through two complementary measures, the PSI and IGA.
Table 9.
Mechanism analysis: the role of PGA.
Column (1) shows that the coefficient of CR on PSI is significant at the 1% level, with a value of 0.2958, indicating that climate risk significantly heightens public attention toward firms. This positive result implies that greater climate risk exposure raises public scrutiny of firms. Heightened climate risk exposure disclosed by firms draws stakeholder attention and amplifies reputational pressure from public opinion and media monitoring. Column (2) introduces PSI alongside CR into the regression with Ginvest as the dependent variable. The coefficient of PSI is positive and statistically significant at the 5% level, while the coefficient of CR remains significant at the 1% level, with a value of 2.5852. Faced with mounting public scrutiny, firms have strong incentives to signal credible environmental commitment through green investment, both to protect their social legitimacy and to maintain market trust and long-term corporate value.
Column (3) shows that the coefficient of CR on IGA is positive and statistically significant at the 1% level. This positive estimate suggests that heightened climate risk exposure draws greater investor green attention. Column (4) introduces IGA alongside CR into the regression with Ginvest as the dependent variable. The coefficient of IGA is significant at the 1% level, while the coefficient of CR remains positive and statistically significant at the 1% level, with a value of 2.4639. These results confirm that as investor green attention rises, firms face both stronger external governance pressure and improved access to green financing, collectively impacting greater green capital allocation, supporting H3.
6. Heterogeneity Analysis
6.1. Ownership
In China’s capital market, state-owned enterprises bear stronger environmental responsibilities and administrative assessment pressures, and consistently align with national strategies prioritizing green development and low-carbon growth. Consequently, when facing climate risk, state-owned enterprises are more likely to respond proactively through green investment to fulfill their social responsibilities and environmental commitments.
We divide our sample into state-owned and private firms to conduct subsample regressions. As reported in Columns (1) and (2) of Table 10, the coefficients of CR are 3.8419 and 2.1626, respectively, both significant at the 1% level, with the coefficient difference test yielding a p-value of 0.044, confirming that the promoting effect of climate risk on green investment is significantly stronger for state-owned enterprises, which is consistent with our theoretical expectation.
Table 10.
Heterogeneity analysis Results.
6.2. Pollution Intensity
Heavy-polluting industries are subject to more stringent environmental regulations and face greater reputational risks associated with environmental performance. Under the dual pressure of regulatory compliance and public scrutiny, firms in heavy-polluting industries are more sensitive to climate risk signals and have stronger incentives to demonstrate environmental commitment through substantive green investment. Furthermore, the physical damages associated with climate change impose more direct operational disruptions on heavy-polluting firms, further intensifying their motivation to engage in green investment as a risk mitigation strategy.
We classify sample firms into heavy-polluting and non-heavy-polluting groups according to the industry classification guidelines issued by the Ministry of Environmental Protection of China, and conduct group regressions based on this threshold. As reported in Columns (3) and (4), the coefficients of CR are 3.8753 and 2.2468, respectively, both significant at the 1% level, confirming that the promoting effect of climate risk on green investment is more pronounced for heavy-polluting firms.
6.3. Media Coverage Tone
Media coverage constitutes an important informal governance mechanism through which external stakeholders monitor and evaluate corporate environmental behavior. Firms receiving negative media coverage face heightened reputational pressure and social scrutiny, which substantially amplifies the urgency of responding to climate risk.
Following Clarkson et al. (2008), we measure media coverage tone using the Janis–Fadner coefficient, which ranges from −1 to one, where values closer to one indicate more positive media coverage of firms’ climate-related affairs and values closer to −1 indicate more negative coverage [43]. We divide the full sample into positive and negative media coverage groups based on the median value of this coefficient and conduct group regressions.
As reported in Columns (5) and (6) of Table 10, the coefficient of CR is positive and significant at the 1% level for firms with negative media coverage, with a value of 3.0330, while the coefficient for firms with positive media coverage is 2.7499, also significant at the 1% level. The coefficient difference test yields a p-value of 0.036, indicating that the promoting effect of climate risk on green investment is stronger for firms receiving negative media coverage.
6.4. Geographic Location
China’s northern and southern regions differ substantially in terms of climate conditions, industrial structure, and environmental governance intensity. Northern regions are characterized by more severe physical climate risk exposure, including greater frequency of extreme weather events such as droughts, sandstorms, and cold waves, as well as more carbon-intensive industrial structures that face stronger transition pressure under China’s dual carbon policy. These factors collectively create stronger institutional and physical incentives for firms in northern regions to respond to climate risk through green investment.
We divide the sample into northern and southern subgroups based on the Qinling–Huaihe geographical line, which is the conventional dividing boundary between northern and southern China, and conduct group regressions. As reported in Columns (7) and (8) of Table 10, the coefficients of CR are 3.4918 and 2.4299, respectively, both significant at the 1% level, with a coefficient difference test p-value of 0.002, confirming that the promoting effect of climate risk on green investment is significantly stronger for firms located in northern regions.
7. Further Analysis
7.1. Heterogeneous Effects on Green Transformation Investment and End-of-Pipe Treatment Investment
To gain a more nuanced understanding of how climate risk shapes corporate green-investment behavior, we decompose total green investment into two distinct components. Following prior studies, we define green transformation investment (GTI) as investment occurring at the production or business restructuring stage that reduces pollutant emissions from the source, and end-of-pipe treatment investment (ETI) as investment occurring at the post-production stage that directly treats already-generated pollutants such as waste gas, wastewater, and solid waste. This distinction is theoretically meaningful because the two types of investment reflect fundamentally different strategic intentions. GTI represents proactive and forward-looking environmental commitment oriented toward long-run structural decarbonization, while ETI primarily reflects reactive compliance responses targeting short-term pollution abatement. If climate risk prompts genuine strategic realignment rather than merely symbolic compliance, its effect should be more pronounced for GTI than for ETI.
Table 11 reports the regression results. The coefficient of CR is significant at the 1% level for GTI, with a value of 3.0448, while the coefficient for ETI is positive but only marginally significant at the 10% level, with a value of 0.5866. These results indicate that CR primarily appears to favor GTI rather than ETI, suggesting that climate risk exposure induces genuine strategic reorientation toward long-term green transition rather than merely triggering superficial compliance responses. This finding provides direct evidence on the substantive nature of corporate environmental responses to climate pressure.
Table 11.
Heterogeneous effects of climate risk on GTI and ETI.
7.2. Climate Risk, Green Transformation Investment and Firm Growth
We further investigate whether GTI enables firms to convert climate pressure into growth opportunities. From the perspective of the Porter hypothesis, environmental strategies can stimulate innovation, improve resource efficiency, and ultimately enhance firm performance [44]. In the context of climate risk, firms that proactively channel climate pressure into green transformation investment may develop distinctive capabilities in clean technology, resource management, and sustainable production processes, which can translate into competitive advantages and growth. Moreover, GTI targets fundamental changes in production processes and business models, thereby generating more durable efficiency gains and innovation spillovers that support sustained firm growth.
To test this conjecture, we use revenue growth rate (Growth) as a proxy for firm performance and construct the following interaction model. All key variables are lagged by one period to mitigate potential reverse causality, and standard errors are clustered at the firm level:
where denotes the revenue growth rate of firm i in year t, is the one-period lagged green transformation investment, is the one-period lagged climate risk index, and is their interaction term.
Table 12 reports the regression results. The coefficient of the interaction term is significant at the 5% level, with a value of 0.0017, indicating that under conditions of heightened climate risk, firms that proactively increase green transformation investment are better positioned to convert climate pressure into long-run growth opportunities. This finding provides novel evidence that the quality of corporate environmental responses to climate risk matters for long-term firm performance.
Table 12.
Further analysis: climate risk, green transformation investment, and firm growth.
8. Conclusions
Using a sample of Chinese A-share listed firms over the period 2008 to 2024, this study investigates the impact of climate risk on corporate green investment. We find that climate risk exhibits a positive association with corporate green investment. Mechanism tests confirm dual internal–external governance channels. Climate risk strengthens green strategic orientation as the internal pathway, while greater public and investor green attention generates external stakeholder pressure. Heterogeneity results show the effect is stronger for state-owned enterprises, heavy-polluting firms, firms with negative media coverage, and northern-region firms. Further analysis shows that the effect of climate risk is primarily concentrated in green transformation investment rather than end-of-pipe treatment investment, and that green transformation investment positively moderates the relationship between climate risk and firm growth, suggesting that firms proactively channeling climate pressure into green transformation investment are better positioned to achieve lasting competitive advantages.
These findings carry important implications for investors, policymakers, and corporate managers.
For investors and ESG analysts, our results suggest that the level of climate risk firms face, as captured through annual report disclosures, is positively associated with their subsequent green-investment behavior, providing investors with a useful signal for evaluating firms’ environmental commitment. The distinction between green transformation investment and end-of-pipe treatment investment is particularly relevant for evaluating the authenticity and strategic depth of corporate environmental commitments, as our empirical results show that climate risk primarily shapes the former rather than the latter. Investors seeking to identify firms with genuine sustainability orientation should therefore pay closer attention to the composition of green investment rather than its aggregate level. Moreover, we find that green transformation investment positively moderates the relationship between climate risk and firm growth. This suggests that firms adopting proactive green-investment strategies amid climate pressure constitute more appealing long-term investment targets.
For policymakers, first, our mechanism analysis shows that public and investor green attention constitute key external stakeholder pressure channels through which climate risk stimulates corporate green investment. Improved climate risk disclosure mitigates information asymmetry between firms and external stakeholders, enabling these pressure channels to function more effectively. Accordingly, policies that enhance the quality and transparency of climate risk disclosure can strengthen such stakeholder pressure and further promote corporate green investment. Second, our heterogeneity analysis reveals that the positive effect of climate risk on green investment is more pronounced among SOEs, heavy-polluting firms, firms with negative media coverage, and northern-region firms. These firms face higher physical climate risk exposure, stricter regulatory constraints, or stronger public pressure, which collectively renders them more responsive to climate risk signals in their green-investment decisions. Accordingly, policymakers can leverage this heightened responsiveness by designing targeted incentive mechanisms for these subgroups, including government subsidies and enhanced climate risk disclosure requirements, so as to improve overall policy effectiveness.
For corporate managers, our study underscores that responding to climate risk through green transformation investment, rather than merely end-of-pipe treatment, is a strategically superior approach. Not only does green transformation investment reflect a more fundamental commitment to long-run decarbonization, but it also enables firms to leverage climate pressure as a source of competitive advantage and long-run growth. Managers should therefore treat climate risk not as a cost to be minimized but as a strategic signal that, when responded to proactively through structural green investment, can generate durable competitive advantages and strengthen the firm’s enduring market position. Furthermore, we find that green strategic orientation serves as a significant internal governance channel. It suggests that managers should prioritize the formalization of environmental management systems and the integration of green targets into core strategic planning, as doing so can enhance firms’ internal capacity to respond to climate risk through sustained green investment.
Author Contributions
Conceptualization, H.P.; methodology, H.P.; funding acquisition, H.P.; supervision, X.L.; project administration, X.L.; resources, X.L.; validation, X.L.; software, Y.Z.; formal analysis, Y.Z.; data curation, Y.Z.; writing—original draft preparation, Y.Z.; writing—review and editing, H.P. and Y.Z. All authors have read and agreed to the published version of the manuscript.
Funding
This research was funded by the National Social Science Fund of China, grant number 22&ZD145, and the Academic Degree Graduate Student Science and Technology Innovation Project of Capital University of Economics and Business, grant number 2025KJCX027.
Institutional Review Board Statement
Not applicable.
Informed Consent Statement
Not applicable.
Data Availability Statement
The original contributions presented in this study are included in the article. Further inquiries can be directed to the corresponding author.
Conflicts of Interest
The authors declare no conflicts of interest.
References
- Zhang, S.; Chen, D.; Zou, Q. China’s green transformation under the dual incentives of economic growth and environmental protection. Int. Rev. Financ. Anal. 2025, 102, 104150. [Google Scholar] [CrossRef] [Scilit]
- Barnett, M.; Brock, W.; Hansen, L.P. Pricing uncertainty induced by climate change. Rev. Financ. Stud. 2020, 33, 1024–1066. [Google Scholar] [CrossRef] [Scilit]
- Liu, L.; Liu, L.; Liu, K.; Jiménez-Zarco, A.I. Climate policy and corporate green transformation: Empirical evidence from carbon emission trading. Res. Int. Bus. Financ. 2025, 74, 102675. [Google Scholar] [CrossRef] [Scilit]
- Chabot, M.; Bertrand, J.L. Climate risks and financial stability: Evidence from the European financial system. J. Financ. Stab. 2023, 69, 101190. [Google Scholar] [CrossRef] [Scilit]
- Ruan, X.; Ji, X.; Li, X. Climate risk and corporate cash holdings: Evidence based on the tourism industry. Financ. Res. Lett. 2025, 81, 107424. [Google Scholar] [CrossRef] [Scilit]
- Garcia-Villegas, S.; Martorell, E. Climate transition risk and the role of bank capital requirements. Econ. Model. 2024, 135, 106724. [Google Scholar] [CrossRef] [Scilit]
- Zhou, Q.; Ni, J.; Yang, C. Climate transition risk and industry returns: The impact of green innovation and carbon market uncertainty. Technol. Forecast. Soc. Change 2025, 214, 124056. [Google Scholar] [CrossRef] [Scilit]
- Cascarano, M.; Natoli, F.; Petrella, A. Entry, exit, and market structure in a changing climate. Eur. Econ. Rev. 2025, 176, 105027. [Google Scholar] [CrossRef] [Scilit]
- Bouri, E.; Rognone, L.; Sokhanvar, A.; Wang, Z. From climate risk to the returns and volatility of energy assets and green bonds: A predictability analysis under various conditions. Technol. Forecast. Soc. Change 2023, 194, 122682. [Google Scholar] [CrossRef] [Scilit]
- Huang, S.; Wang, X.; Xue, Y.; Zhang, X. CEOS’climate risk perception bias and corporate debt structure. J. Int. Money Financ. 2025, 151, 103254. [Google Scholar] [CrossRef] [Scilit]
- Sautner, Z.; Van Lent, L.; Vilkov, G.; Zhang, R. Firm-level climate change exposure. J. Financ. 2023, 78, 1449–1498. [Google Scholar] [CrossRef] [Scilit]
- McCarthy, S.; Oliver, B.; Song, S. Corporate social responsibility and CEO confidence. J. Bank. Financ. 2017, 75, 280–291. [Google Scholar] [CrossRef] [Scilit]
- Chițimiea, A.; Minciu, M.; Manta, A.M.; Ciocoiu, C.N.; Veith, C. The drivers of green investment: A bibliometric and systematic review. Sustainability 2021, 13, 3507. [Google Scholar] [CrossRef] [Scilit]
- Liao, X. Public appeal, environmental regulation and green investment: Evidence from China. Energy Policy 2018, 119, 554–562. [Google Scholar] [CrossRef] [Scilit]
- Yang, M.J.; Zhu, N. Online public opinion attention, digital transformation, and green investment: A deep learning model based on artificial intelligence. J. Environ. Manag. 2024, 371, 123294. [Google Scholar] [CrossRef] [Scilit] [PubMed]
- Delmas, M.A.; Toffel, M.W. Organizational responses to environmental demands: Opening the black box. Strateg. Manag. J. 2008, 29, 1027–1055. [Google Scholar] [CrossRef] [Scilit]
- Li, T.; Meng, X.; Wang, L.; Gong, Y. Will China’s carbon emission trading regulation really decrease the green investment of firms? A microperspective on corporate governance. Bus. Strategy Environ. 2025, 34, 2222–2238. [Google Scholar] [CrossRef] [Scilit]
- Hart, S.L.; Ahuja, G. Does it pay to be green? An empirical examination of the relationship between emission reduction and firm performance. Bus. Strategy Environ. 1996, 5, 30–37. [Google Scholar] [CrossRef]
- Joseph, J.; Wilson, A.J. The growth of the firm: An attention-based view. Strateg. Manag. J. 2018, 39, 1779–1800. [Google Scholar] [CrossRef] [Scilit]
- Hallegatte, S.; Ranger, N.; Mestre, O.; Dumas, P.; Corfee-Morlot, J.; Herweijer, C.; Wood, R.M. Assessing climate change impacts, sea level rise and storm surge risk in port cities: A case study on Copenhagen. Clim. Change 2011, 104, 113–137. [Google Scholar] [CrossRef] [Scilit]
- Gasbarro, F.; Pinkse, J. Corporate adaptation behaviour to deal with climate change: The influence of firm-specific interpretations of physical climate impacts. Corp. Soc. Responsib. Environ. Manag. 2016, 23, 179–192. [Google Scholar] [CrossRef] [Scilit]
- Bolton, P.; Kacperczyk, M. Do investors care about carbon risk? J. Financ. Econ. 2021, 142, 517–549. [Google Scholar] [CrossRef] [Scilit]
- Pham, S.D.; Nguyen, T.T.; Do, H.X. Impact of climate policy uncertainty on return spillover among green assets and portfolio implications. Energy Econ. 2024, 134, 107631. [Google Scholar] [CrossRef] [Scilit]
- Ren, X.; Li, W.; Li, Y. Climate risk, digital transformation and corporate green innovation efficiency: Evidence from China. Technol. Forecast. Soc. Change 2024, 209, 123777. [Google Scholar] [CrossRef] [Scilit]
- Li, X. Physical climate change exposure and firms’ adaptation strategy. Strateg. Manag. J. 2025, 46, 750–789. [Google Scholar] [CrossRef] [Scilit]
- Wang, C.L.; Ahmed, P.K. Dynamic capabilities: A review and research agenda. Int. J. Manag. Rev. 2007, 9, 31–51. [Google Scholar] [CrossRef] [Scilit]
- Larabi, C. Linking innovation capability, strategic orientation, and strategic renewal to sustainable performance: A dynamic capabilities perspective in Saudi small and medium enterprises. Bus. Strategy Environ. 2026, 35, 1255–1271. [Google Scholar] [CrossRef] [Scilit]
- Xiao, J.; Zhou, Y.; Zeng, P. How does green strategy orientation promote substantive green innovation? Evidence from Chinese manufacturing enterprises. Econ. Change Restruct. 2024, 57, 225. [Google Scholar] [CrossRef] [Scilit]
- Xiao, J.; Zeng, P.; Niu, L. Green strategy orientation and competitiveness: An optimal distinctiveness perspective. Manag. Decis. 2026, 64, 74–91. [Google Scholar] [CrossRef] [Scilit]
- Dai, Y.; Yang, Q.; Cao, C. Strategic corporate orientation, factor flow, green innovation. Int. Rev. Econ. Financ. 2025, 97, 103750. [Google Scholar] [CrossRef] [Scilit]
- Makpotche, M.; Bouslah, K.; M’Zali, B. Corporate governance and green innovation: International evidence. Rev. Account. Financ. 2024, 23, 280–309. [Google Scholar] [CrossRef] [Scilit]
- Galleli, B.; Amaral, L. Bridging institutional theory and social and environmental efforts in management: A review and research agenda. J. Manag. 2026, 52, 42–93. [Google Scholar] [CrossRef] [Scilit]
- Chu, Z.; Xu, J.; Lai, F.; Collins, B.J. Institutional theory and environmental pressures: The moderating effect of market uncertainty on innovation and firm performance. IEEE Trans. Eng. Manag. 2018, 65, 392–403. [Google Scholar] [CrossRef] [Scilit]
- Li, D.; Huang, M.; Ren, S.; Chen, X.; Ning, L. Environmental legitimacy, green innovation, and corporate carbon disclosure: Evidence from CDP China 100. J. Bus. Ethics 2018, 150, 1089–1104. [Google Scholar] [CrossRef] [Scilit]
- Yang, G.; Wang, C. Can external pressure promote enterprise environmental investment? A study based on the dual perspectives of the public and the government. Environ. Dev. Sustain. 2026, 28, 18663–18699. [Google Scholar] [CrossRef] [Scilit]
- Ding, Q.; Huang, J.; Chen, J. Does digital finance matter for corporate green investment? Evidence from heavily polluting industries in China. Energy Econ. 2023, 117, 106476. [Google Scholar] [CrossRef] [Scilit]
- ISO 14001; Environmental Management Systems—Requirements with Guidance for Use. International Organization for Standardization: Geneva, Switzerland, 2015.
- Zhou, B.; Ding, H. How public attention drives corporate environmental protection: Effects and channels. Technol. Forecast. Soc. Change 2023, 191, 122486. [Google Scholar] [CrossRef] [Scilit]
- Ardia, D.; Bluteau, K.; Boudt, K.; Inghelbrecht, K. Climate change concerns and the performance of green vs. brown stocks. Manag. Sci. 2023, 69, 7607–7632. [Google Scholar] [CrossRef] [Scilit]
- Qian, S.; Yang, Z.; Yang, L.; Zhang, Y. Institutional investors’ green attention and corporate greenwashing: The effectiveness of external governance. Econ. Anal. Policy 2025, 86, 2192–2206. [Google Scholar] [CrossRef] [Scilit]
- Wang, Y.; Wang, C. Climate risk and firms’ R&D investment: Evidence from China. Int. Rev. Econ. Financ. 2025, 99, 104066. [Google Scholar] [CrossRef] [Scilit]
- Guo, K.; Ji, Q.; Zhang, D. A dataset to measure global climate physical risk. Data Brief. 2024, 54, 110502. [Google Scholar] [CrossRef] [Scilit] [PubMed]
- Clarkson, P.M.; Li, Y.; Richardson, G.D.; Vasvari, F.P. Revisiting the relation between environmental performance and environmental disclosure: An empirical analysis. Account. Organ. Soc. 2008, 33, 303–327. [Google Scholar] [CrossRef] [Scilit]
- Porter, M.E.; Linde, C.V.D. Toward a new conception of the environment-competitiveness relationship. J. Econ. Perspect. 1995, 9, 97–118. [Google Scholar] [CrossRef] [Scilit]

Disclaimer/Publisher’s Note: The statements, opinions and data contained in all publications are solely those of the individual author(s) and contributor(s) and not of MDPI and/or the editor(s). MDPI and/or the editor(s) disclaim responsibility for any injury to people or property resulting from any ideas, methods, instructions or products referred to in the content. |
© 2026 by the authors. Licensee MDPI, Basel, Switzerland. This article is an open access article distributed under the terms and conditions of the Creative Commons Attribution (CC BY) license.