


Abstract
The study explores the paradigm shift in education brought about by the introduction of generative artificial intelligence (AI) tools, focusing on educational stakeholders’ self-reported perceptions rather than observed changes in teaching or learning outcomes. We consider stakeholders’ views on AI-based technologies within the teaching–learning process. The current study uses a cross-sectional empirical survey design with a sample of N = 917 respondents, including teachers, students, administrators, and management. It examines the use of advanced AI technologies such as ChatGPT, Gemini, DeepSeek, and Grok, and stakeholders’ perceived connection between digital skills and classroom performance, student motivation, and critical thinking. We also discuss the ethical dilemmas and structural challenges that accompany this digital change. Inferential statistics, such as One-Way ANOVA and the Pearson Chi-Square test, show statistically significant differences in perceptions and regulatory expectations across organizational responsibilities. The findings contribute to understanding how advanced digitalization is perceived to reshape traditional academic roles, offering practical insights for creating effective, responsible, and sustainable teaching practices.
1. Introduction
Artificial intelligence (AI) has become a central topic in the educational debate, fundamentally influencing content production, personalization of learning, assessment, administrative organization, and relationships between schools, students, and the community [1,2,3]. Because schools bear responsibility for students’ individual development, any technological innovation they adopt must respect the principles of fairness, transparency, and accountability [4,5].
The integration of AI in education promises to transform school management, didactic design, and inclusion through tools such as chatbots and adaptive assessment systems [3,6,7]. However, challenges arise regarding data protection, algorithmic transparency, and the need to develop teachers’ and students’ digital skills [2,5,8].
There are also various perspectives on the effects of AI on teachers’ professional autonomy and the potential threat of excessive surveillance or intervention into learners’ private domains [6,8].
The OECD and UNESCO have established ethical principles for the use of AI, emphasizing transparency, fairness, and the preservation of fundamental rights in education [2,5,9]. Here, AI literacy means the development of complex skills to engage with, manage, and modify these technologies [10,11,12].
The questionnaire used in this research, intended to collect perceptions on the integration of AI in education, was distributed in a wide variety of educational contexts, including pre-university schools and universities in Romania and partner institutions in several countries, such as Cadi Ayyad University (Morocco), University of Surabaya Faculty of Business and Economics (Indonesia), and the Faculty of Economics and Business at the University of Rijeka (Croatia). The questionnaire was wide-ranging, enabling data collection from national and international perspectives and across different educational levels. Full details of the data collection period are reported in Section 3.1.1.
Based on the results, the study attempts to highlight the benefits and drawbacks of AI in the educational domain as reported by respondents, stressing the importance of responsible AI management and the preservation of human contact in the learning process. Building on these findings, the study also attempts to propose a preliminary model offering guidance for the ethical and responsible use of AI in education, intended as a starting point for institutional discussion rather than a validated framework.
2. Literature Review
Over the past few decades, digital technologies have permeated practically every aspect of life, creating a postdigital society where humans and technology are inexorably linked and co-innovative [13]. Education itself has long been recognized as a key driver of peace, sustainable development, and lifelong learning [2]; digital technologies are increasingly embedded within this role, though their specific contribution to peacebuilding outcomes, as distinct from education’s broader role, remains an open empirical question beyond the scope of this study. The UNESCO Education 2030 Agenda highlights the need for inclusive, egalitarian, and quality education as a key to achieving the Sustainable Development Goals.
The rapid advancement of artificial intelligence (AI) is transforming educational paradigms worldwide. The 2021 UNESCO Recommendation on the Ethics of Artificial Intelligence and its complementary practical guidelines identify seven key areas for action, such as policy, governance, ethical standards, and promoting innovation through AI, and highlight the opportunities and risks of AI in education. Virtual and augmented reality, along with other immersive technologies, are increasingly used to support experiential learning activities that would otherwise be constrained by safety or cost considerations in some contexts.
AI-based automatic translation, video summarization, and personalized learning models can improve accessibility and personalization for different learners, especially those with language or cognitive impairments. But these technologies must be incorporated with care, with explicit data governance, and publicly reviewed to perform effectively.
The quantification of education—the translation of learning processes into data—enables the development of innovative teaching strategies and data-driven policies [7,14]. Learning analytics can support formative assessment, stimulate self-reflection, and identify early warning signs of learning difficulties. However, large-scale data collection raises concerns about privacy, data abuse, and the moral consequences of algorithmic decisions.
As AI systems become more sophisticated, debates over human agency and professional independence have become increasingly vociferous [15,16]. The first intelligent tutoring systems were built to push students along an algorithm; today’s systems empower students to make their own decisions, share in decision-making, and collaborate with artificial intelligence. AI can help teachers shed some of their more mundane chores and provide personalized instruction, but other scholars warn that excessive reliance on technology could erode teacher professionalism and relationships.
The literature suggests the need for inclusive solutions to reduce digital inequalities and inequities in access and competency [10,17,18]. The digital illiteracy of teachers and students remains a major impediment in many educational settings.
European policy initiatives such as the Digital Education Action Plan, the European Digital Competence Framework (DigComp 2.2), and recommendations for the Artificial Intelligence Act show commitment to responsible innovation, ethical standards, and the protection of rights in digital education. These documents foster high-quality, inclusive, and accessible digital education, from technological infrastructure (e.g., internet access) to soft skills (e.g., critical thinking and media literacy) [9,10,17,19].
Theoretical Framework: Sustainability as a Construct and the Role of Organizational Position
Although the title and introduction of this study reference sustainability, the construct requires explicit theoretical definition before it can meaningfully inform the study’s research questions and the interpretation of its findings. Recent conceptual scholarship distinguishes analytically between three related but non-equivalent constructs that are frequently conflated in the AI-in-education literature: sustainability in education, which concerns the institutional durability, efficiency, and continuity of educational systems under conditions of technological and economic change; sustainable education, a more demanding normative position that frames education as a value-based, human-centered project oriented toward long-term ethical and social flourishing; and education for sustainable development, which concerns curricular and pedagogical alignment with environmental and developmental goals [20]. Failing to maintain these distinctions risks treating any instance of technology adoption as evidence of “sustainability” by default, an ambiguity that recent scholarship published in this journal has explicitly cautioned against [20].
The present study is positioned primarily within the first of these constructs, sustainability in education, understood here as institutional capacity to adopt and govern AI-based technologies in a durable, equitable, and ethically accountable manner. This positioning, rather than the broader normative claims associated with sustainable education, directly informs the study’s research questions and the interpretation of its results. Specifically, the study operationalizes three sustainability-relevant dimensions identified in this literature: (i) institutional capacity for AI governance, reflected in stakeholders’ agreement with regulation and policy frameworks for AI in education (Section Multidimensional Attitudinal Analysis of Educational AI); (ii) professional development needs associated with AI adoption, reflected in the composite index of perceived educational process optimization (Section Multidimensional Attitudinal Analysis of Educational AI); and (iii) ethical governance expectations, reflected in support for human-centered regulatory approaches (Section Multidimensional Attitudinal Analysis of Educational AI). Two further dimensions commonly associated with sustainability in education—equitable access to AI-based tools across institutions and countries, and the long-term viability of adoption over time—are not directly operationalized by the present cross-sectional instrument; these are acknowledged as limitations in Section 7 rather than claimed as contributions of this study. It should be emphasized that the study measures stakeholders’ self-reported perceptions of these dimensions, not sustainability outcomes themselves; the findings that follow should accordingly be read as evidence about which sustainability-relevant dimensions are represented in stakeholders’ perceptions of AI adoption, not as empirical evidence that AI adoption is, in practice, institutionally sustainable, equitable, or durable.
This positioning also provides a theoretical rationale, beyond descriptive interest, for comparing perceptions across five organizational roles. Institutional accounts of technology governance in higher education emphasize that sustainable adoption depends on alignment—or at least manageable tension—between differently positioned actors: those who use a technology directly, those who implement it in daily practice, and those who govern, resource, and remain accountable for it [21]. In the present design, students and teachers primarily experience AI as end users and frontline implementers of teaching and learning practice, while administrators, management, and operational/support staff are positioned as governance and resource-allocation stakeholders responsible for institutional policy, training investment, and regulatory compliance. Comparing perceptions systematically across these positions is accordingly not merely a demographic control variable, but a direct empirical operationalization of the institutional-capacity dimension of sustainability at the center of this study’s framework, consistent with recent calls for AI governance in higher education to explicitly account for differentiated stakeholder responsibility [21].
Recent studies confirm that this gap remains unresolved. Cross-national designs with large samples exist but are typically confined to a single stakeholder group: OECD TALIS 2024 data covering teachers across 55 countries and territories provide extensive teacher-only coverage [22], while another cross-national dataset spanning several Central and Eastern European countries, together with Indonesia, Turkey and France, captures only student attitudes toward AI [23]. Conversely, studies that adopt a genuinely multi-stakeholder lens tend to rely on smaller or qualitative designs: a vignette-based study of AI acceptability included students, teachers, and parents but did not analyze administrators or management as distinct organizational categories [24], while a SWOT-based study of generative AI in higher education incorporated the perspectives of teachers, researchers, and administrators but excluded students and relied on qualitative rather than inferential analysis [25]. To our knowledge, no published study combines a large cross-sectional sample (N > 900), five statistically compared organizational roles (students, teachers, administrators, management, and operational/support staff), and participants recruited from institutions located in several countries within a single survey instrument. The present study addresses this gap. As detailed in Section 3.1.1 and Section 5, the differentiation this design reveals is primarily by organizational role rather than by type of AI application: perceptions of AI’s specific benefits do not separate into empirically distinct dimensions, but they vary substantially and consistently by stakeholder position, which is itself a finding of interest for a multi-role comparative design of this kind.
3. Materials and Methods
3.1. Participants and Research Design
The study adopts a quantitative, empirical cross-sectional survey design to explore stakeholder perceptions of the multi-dimensional role of Generative Artificial Intelligence (AI) in the teaching–learning process. The targeted population comprised key players in the educational environment: students, teaching staff, administrative staff, and management. A non-probability purposive and convenience sampling strategy was used to access a diverse set of respondents across these roles; as noted throughout this section, this sampling strategy does not establish that the resulting sample is statistically representative of the underlying population.
The final validated sample comprised N = 917 active participants. The detailed demographic and organizational profile of the sample is as follows:
- -
- Gender: Female (52%, n = 473), Male (48%, n = 444).
- -
- Residential Environment: Urban/City (53%, n = 485) and Rural/Village (47%, n = 432).
- -
- Age groups: 18–25 years (35%, n = 321), 25–35 years (21%, n = 193), 35–45 years (25%, n = 228), and over 45 years (19%, n = 175).
- -
- Educational Attainment (ISCED Classification): ISCED Level 5 (Short-term higher education: 24%, n = 218), ISCED Level 6 (bachelor’s degree or equivalent: 34%, n = 316), ISCED Level 7 (master’s degree or equivalent: 21%, n = 193), and ISCED Level 8 (PhD or equivalent: 21%, n = 190).
- -
- Organizational Position: Students (20%, n = 184), Teachers (20%, n = 184), Administrators (16%, n = 151), Management functions (16%, n = 150) and Operational/Support Staff (27%, n = 248).
Organizational position was collected as a single-choice item, so respondents selected exactly one category, and the five groups are mutually exclusive by survey design; the reported counts sum to the full sample (N = 917) with no overlap. Working definitions were as follows: students were individuals currently enrolled in a pre-university or higher education program; teachers held an instructional role with direct classroom or course responsibilities; administrators held non-instructional roles responsible for institutional administrative processes (e.g., enrollment, records, compliance); management functions comprised roles with strategic or supervisory decision-making authority (e.g., school or department leadership); and operational/support staff comprised other operational or support staff not captured by the preceding categories (e.g., technical, clerical, or auxiliary personnel). These category labels were presented to respondents without further definitional guidance in the instrument itself, so classification at the margins (for example, a teacher who also holds a minor administrative duty) relied on respondents’ self-identification of their primary role rather than on researcher-verified criteria; this is noted as a limitation in Section 7 of the main text.
- -
- Seniority in the organization: Less than one year (26%, n = 240), 1–5 years (20%, n = 183), 6–10 years (18%, n = 163), 11–16 years (18%, n = 168), and more than 16 years (18%, n = 163).
3.1.1. Instrument and Procedure for Data Collection
The 15-item benefits scale and the accompanying items described below were developed by the authors, conceptually informed by constructs from the Technology Acceptance Model and the European Framework for Digital Competence of Educators (DigCompEdu), without formal adaptation from a validated instrument. Item wording was refined through internal discussion among the authors prior to distribution. No formal expert panel review, cognitive pretesting, or pilot administration was conducted. The scale’s empirical factor structure, reliability, and measurement properties were evaluated post hoc on the full sample and are reported later in this section and discussed in Section 5. The complete survey instrument, covering all sections and items described in this section, is provided in Appendix A.
Data were obtained from a structured, self-administered online questionnaire on the Microsoft Forms platform (Microsoft Corporation, Redmond, WA, USA). This data-gathering process was active for a total of 168 days (from 28 January to 13 July 2026). It took an average of 4 min and 34 s to finish each questionnaire. This completion time is reported descriptively; on its own, it cannot establish response quality or attentiveness, and is discussed as a limitation in Section 7 of the main text.
The questionnaire was organized into primary theme areas to address the study objectives methodically:
- Demographic and professional profile: general background data (Age, Gender, Environment, Level of Education: ISCED, Position, Seniority) were gathered.
- AI Tool Use: investigating the use, prevalence, and scope of advanced Generative AI tools (such as ChatGPT, Gemini, DeepSeek, Grok, adaptive learning software, and automatic content generators) in academic contexts.
- Self-rated digital skills and perceived competence, including self-perceived digital skills, perceived institutional openness to innovation, and the application of AI in the classroom.
- Motivation and cognition: the perceived effects of AI on student engagement, instructor motivation, and the development of critical thinking.
- Ethical Dilemmas and Challenges: identify institutional hurdles, statutory constraints, and ethical dangers in the integration of AI in academia.
Attitudinal items were measured using Likert-type scales (1 = Strongly Disagree to 5 = Strongly Agree).
A 15-item Likert-type scale was used to measure the perceived benefits of artificial intelligence tools, rated on a 5-point scale (1: Strongly Disagree to 5: Strongly Agree). The scale was initially organized around three thematic item groupings reflecting the study’s conceptual framework: cognitive assistance, administrative automation, and immersive environments. As reported below and discussed in Section 5, subsequent factor analysis indicated that these groupings are not empirically distinct dimensions; they are retained here only as a thematic, content-based organization of the item pool, not as validated operational levels. Before running the inferential means analysis, the quality of the respondent sample was checked using the Kaiser–Meyer–Olkin (KMO) sampling adequacy test in SPSS to ascertain the statistical soundness of this instrument. Our analysis yielded a KMO index of 0.97, which is classified as excellent according to conventional psychometric benchmarks. This result indicates that the correlation matrix was suitable for factor analysis; it does not by itself establish the quality of the respondent sample or the validity of the proposed three-dimensional structure, which is examined further below.
To evaluate the dimensional structure of the 15-item benefits scale, an exploratory factor analysis (principal axis factoring) was conducted. Bartlett’s test of sphericity was significant (χ2 = 15,530.85, df = 105, p < 0.001), confirming that the correlation matrix was factorable. However, the eigenvalue pattern did not support the hypothesized three-factor structure: only one eigenvalue exceeded the conventional retention threshold of 1.0 (λ1 = 11.15), with a sharp drop to the second eigenvalue (λ2 = 0.57). A single general factor accounted for 74.3% of the common variance, with all 15 items loading strongly and fairly uniformly onto it (standardized loadings ranging from 0.81 to 0.90). When a three-factor solution was forced and obliquely rotated (promax) to mirror the hypothesized cognitive-support, administrative-automation, and immersive-environment dimensions, several items cross-loaded substantially across factors, and the three rotated factors were highly intercorrelated (r = 0.73 to 0.80).
As a further check, a confirmatory factor analysis specifying the three theoretical dimensions as correlated latent factors was estimated. The model showed acceptable-to-mediocre global fit (CFI = 0.958, TLI = 0.949, RMSEA = 0.091), but the latent factor correlations were very high (Cognitive–Automation r = 0.96; Cognitive–Immersive r = 0.92; Automation–Immersive r = 0.94), each well above the conventional 0.85 threshold used to establish discriminant validity between constructs. Taken together with the EFA results and the very high overall scale reliability (α = 0.97, see below), this pattern indicates that respondents did not empirically distinguish between the three proposed dimensions of AI benefit: the scale is better characterized, on the present data, as measuring a single, broad, strongly positive general attitude toward AI in education rather than three separable constructs. Consequently, the cognitive-support, administrative-automation, and immersive-environment labels used throughout Section 3 and Section 4 are retained here as a thematic, content-based organization of the item pool for descriptive purposes, rather than as empirically validated distinct constructs; this distinction is discussed further in Section 5 and Section 7, and its implications for Hypotheses H1–H3 are addressed in Section 5.
3.1.2. Statistical Analysis
Raw data were collected using Microsoft Forms and exported, cleaned, and coded for statistical analysis using IBM SPSS Statistics (Statistical Package for the Social Sciences), version 29 (IBM Corp., Armonk, NY, USA).
The analytical workflow used descriptive and inferential statistical techniques:
- -
- Descriptive statistics: frequencies, percentages, and mean scores were computed to map the baseline distribution of the responses.
- -
- Inferential statistics: to assess whether there were significant differences in perceptions, views on regulation, and expectations across different organizational roles, One-Way Analysis of Variance (One-Way ANOVA) tests were conducted for continuous Likert-scale items, and Pearson’s Chi-Square (χ2) tests of independence were performed for categorical crosstabulations.
- -
- Statistical significance: all inferential tests were consistently set a priori at α = 0.05 for the level of statistical significance.
3.1.3. Ethical Aspects and Data Availability
The study was conducted in strict accordance with the ethical guidelines for research involving human subjects. All participants were provided with an informed consent disclosure statement before starting the survey. Participation in the questionnaire was voluntary, and participants could withdraw at any time without penalty.
No Personally Identifiable Information (PII), such as names, email addresses, or IP addresses, was collected to ensure absolute secrecy and anonymity. Aggregated results from this dataset are reported throughout this manuscript.
The authors justify the availability of the de-identified raw dataset supporting the conclusions of this work upon reasonable request without any undue reservation for the sake of full transparency and scientific replication.
3.2. Research Objectives, Questions, and Hypotheses
The examination is based on a well-defined research design, aiming to establish a robust empirical methodology and develop an analytical framework with high explanatory power. Rather than treating the sample as a fixed, undifferentiated group, the research focuses on a multidimensional assessment of perceptions and acceptance of advanced digitalization across organizational levels. We constructed a hierarchical structure of study objectives to guide our investigation:
The main objective of this study is to conduct a multidimensional evaluation of institutional actors’ perspectives on the practical benefits of artificial intelligence technologies and to estimate the degree of openness or potential resistance to their digital integration.
Secondary objective: To evaluate the perceived influence of AI tools on the enhancement of the structural elements of the educational process (instruction, learning, and evaluation).
Specific objective: To identify and prioritize operational limitations and perceived risks in the process of implementing AI tools.
Within this objective, the main research question driving our investigation is: How does the perceived operational complexity of AI applications (ranging from cognitive support and administrative automation to immersive environments) relate to divergent or consensus views among respondents depending on their organizational roles?
To systematically approach this research question and ensure the validity and integrity of the empirical approach, five basic working hypotheses were proposed and operationalized in the survey questions:
H1.
The perception of the usefulness of AI as a cognitive support benefits from a homogeneous institutional consensus, without being significantly influenced by the role or function occupied by the respondents.
H2.
Depending on the functional and operational complexity of an organization, there is significant variability in assessing the usefulness of immersive AI solutions.
H3.
Respondents’ agreement on the benefits of AI in automating administrative and formatting tasks varies substantially depending on the volume of bureaucratic tasks and the professional profile of respondents.
H4.
The level of agreement on the contribution of AI to the efficiency of the teaching–learning–assessment process registers high values on all dimensions analyzed but shows variations in intensity between the components of direct assistance (e.g., virtual teachers, adaptive learning) and those of logistic automation (e.g., automatic verification of tests).
H5.
The perception of obstacles to AI adoption is uneven, with organizational stakeholders emphasizing the necessity for professional training of personnel above the technological or systemic risks inherent in intelligent systems.
In the next phases, the collected data were meticulously cleaned, coded, and analyzed using SPSS. These five hypotheses are tested by connecting central tendency metrics to inferential variance analysis (One-Way ANOVA, Chi-Square). We analyze whether the perceived advantages and disadvantages of AI are evenly integrated at the organizational level or differ significantly by technological complexity and stakeholder roles.
4. Results
This part presents the empirical findings of the study. The findings are presented systematically to achieve the research’s main objectives and to test the five stated working hypotheses. This section provides a detailed analysis of the current use of Generative AI techniques within the analyzed educational ecosystem. We then use inferential statistics, i.e., One-Way ANOVA and Pearson’s Chi-Square (χ2) tests of independence, to determine the extent to which stakeholder perceptions, perceived pedagogical efficacy, and ethical concerns differ significantly by organizational roles and demographic profiles.
4.1. Generative AI Tool Usage and Adoption Patterns
Table 1 consolidates the demographic and organizational characteristics of the sample; Figure 1, Figure 2, Figure 3, Figure 4, Figure 5 and Figure 6 present the same information graphically. Percentages are rounded to one decimal place and may not sum to exactly 100% within each characteristic.
Table 1.
Participant Characteristics (N = 917). Source: Authors’ own elaboration. Unless otherwise noted, all tables in this manuscript are the authors’ own elaboration based on the survey data described in Section 3.1.
Figure 1.
Demographic Distribution of Survey Participants. Source: Authors’ own elaboration.
Figure 2.
Organizational Survey Participant Seniority Distribution. Source: Authors’ own elaboration.
Figure 3.
Survey Participants’ Educational Levels As per ISCED Classification. Source: Authors’ own elaboration.
Figure 4.
Distribution of Survey Respondents by Organizational Role. Source: Authors’ own elaboration.
Figure 5.
Gender Distribution of the Survey Respondents. Source: Authors’ own elaboration.
Figure 6.
Respondent Demographics by Residential Environment. Source: Authors’ own elaboration.
The investigation used a large number of respondents (N = 917), providing a substantial empirical basis (Figure 1). Data were gathered over a 168-day period; potential shifts in stakeholder perceptions over the course of this period, given the rapid evolution of generative AI tools, are addressed as a limitation in Section 7 of the main text.
The age distribution (Table 1, Figure 1) spans four generational segments, with the largest cohort aged 18–25. As the sample was obtained through purposive and convenience sampling rather than probability sampling, this spread does not by itself establish representativeness of the target population; it is reported descriptively as context for the inferential tests that follow.
Professional seniority within the organization (Table 1, Figure 2) is broadly distributed across the five tenure bands, with the largest group holding less than one year of seniority. This distribution is reported descriptively as context for the analysis of institutional experience and perceptions of digital change that follows.
Formal education level was measured using the International Standard Classification of Education (ISCED; Table 1, Figure 3). The sample skews toward higher academic qualifications, with a bachelor’s degree or equivalent (ISCED 6) being the most common level, followed by substantial shares holding master’s (ISCED 7) and doctoral (ISCED 8) qualifications.
Organizational position (Table 1, Figure 4) shows Operational/Support Staff as the largest single group, with student and teacher cohorts equal in size (n = 184 each), and administrator and management functions similar in size. This distribution provides the basis for the role-based comparisons reported in Section Multidimensional Attitudinal Analysis of Educational AI.
Gender distribution (Table 1, Figure 5) was close to even, with a small majority of female respondents. This near-even split is reported descriptively as context for the sample profile; because the sample was drawn through purposive and convenience sampling, it does not by itself neutralize gender-related bias or guarantee the validity of gender-based comparisons.
Residential environment (Table 1, Figure 6) was also close to even between urban and rural settings. There is a documented gap between urban and rural areas in the infrastructure available to educational institutions, particularly in connectivity and technological support; the near-even split in this convenience sample provides some coverage of both settings, though it does not by itself establish representativeness or eliminate urban-centric bias.
Multidimensional Attitudinal Analysis of Educational AI
To evaluate the empirical validity and reliability of the measurement scales developed to test Hypotheses 1, 2, and 3 (H1, H2, and H3) regarding the perceived benefits of Generative AI across cognitive, administrative, and immersive dimensions, a detailed psychometric analysis of the 15-item Likert scale was conducted.
The Kaiser–Meyer–Olkin (KMO) test of sampling adequacy confirmed that this matrix is sampling adequate. The KMO index of 0.97 (Table 2) is in the range conventionally described as excellent, indicating that the correlation matrix exhibits high intercorrelations suitable for factor analysis. The internal consistency of the entire 15-item scale was also high (Cronbach’s α = 0.97) across the sample of N = 917 participants; however, a value this high may partly reflect item redundancy rather than superior validity and should be interpreted alongside the factor structure reported below rather than as a standalone indicator of measurement quality.
Table 2.
Descriptive Statistics and Reliability Analysis for Perceived AI Benefits (N = 917).
In the analysis of the specific subscales, all three showed very good reliability. The subscale Cognitive & Conceptual Support (α = 0.92) has high internal consistency. Within this construct, the highest overall agreement was observed in AI_COG_1 (Organization of ideas and arguments), with a mean of M = 4.77 (SD = 0.59), followed by AI_COG_2 (Access to complementary content), with M = 4.76 (SD = 0.61). These high mean scores suggest that educational stakeholders view generative technologies as effective cognitive partners for text optimization, brainstorming, and resource development.
The construct of Administrative & Collaborative Automation showed good reliability (α = 0.96) and comprised 7 operational components. The descriptive statistics show a remarkably dense cluster of high agreement, led by AI_AUT_1 (Automatic transcription, summary generation, and webinar translations) (M = 4.73, SD = 0.66). The stakeholders had high levels of agreement regarding the automation of formatting and repetitive workflows (AI_AUT_2: M = 4.72, SD = 0.69), the automatic organization of forum and chat discussions (AI_AUT_3: M = 4.72, SD = 0.69), and automated analysis of forum discussions for content moderation (AI_AUT_6: M = 4.72, SD = 0.68). Similarly, there was substantial homogeneous agreement for resource organization (AI_AUT_4: M = 4.71, SD = 0.72), document co-creation (AI_AUT_5: M = 4.70, SD = 0.71), and meeting transcription (AI_AUT_7: M = 4.70, SD = 0.70). These ratings suggest that institutional actors perceive standard artificial intelligence as capable of reducing the logistical, administrative, and collaborative costs typically involved in educational environments.
Finally, the Immersive & Interactive Environments sub-scale showed very good reliability (α = 0.92), but with a somewhat greater spread of responses. The agreement for AI_IMM_1 (Creating interactive simulated environments for experiments and virtual labs) was very high (M = 4.71, SD = 0.70). However, the items that used more advanced technical setups, such as virtual reality field trips (AI_IMM_2: M = 4.65, SD = 0.80) and AI-driven role-play characters (AI_IMM_3: M = 4.64, SD = 0.84) had the highest standard deviations in the dataset. The difference implies that, although there is general agreement on the strategic usefulness of immersive AI, the actual implementation or availability of the technology leads to somewhat more diverse opinions among stakeholders than is the case with traditional text-based cognitive support.
These subscale-level reliabilities and descriptive patterns are reported for completeness and comparability with the item-level literature. As detailed in Section 3.1.1, however, the exploratory and confirmatory factor analyses conducted on this scale did not support treating Cognitive Support, Administrative Automation, and Immersive Environments as empirically distinct constructs: a single general factor accounted for the large majority of common variance, and the latent correlations among the three theoretical dimensions exceeded 0.90. The ANOVA results reported below by “dimension” should therefore be read as comparisons of thematically grouped item averages rather than as tests involving three separable psychological constructs; this distinction, and its implications for Hypotheses H1–H3, is discussed in Section 5.
Reliability evidence was also computed for the composite measures derived from the remaining questionnaire blocks (Questions 8–14), beyond the 15-item benefits scale reported above. Internal consistency was high for the Q8 process-optimization composite (α = 0.960, 8 items), the Q10 risk-perception composite (α = 0.929, 6 items), the Q12 policy-support composite (α = 0.964, 7 items), the creative-use composite (α = 0.958, 7 items), and the meaning/motivation composite (α = 0.933, 4 items). The Q9 composite (4 items addressing distinct operational limitations of AI—discernment, technological dependence, data security, and training needs) showed markedly lower internal consistency (α = 0.626), consistent with these items capturing conceptually heterogeneous concerns rather than a single underlying construct; scores on this composite are accordingly interpreted with more caution and are not treated as a unidimensional scale in the analyses that follow.
To verify the statistical validity of the formulated hypotheses and determine the extent to which the institutional role modulates attitudes toward technology, we applied the One-Way ANOVA procedure for each of the three conceptual pillars. The results of the analysis of variance, reflecting the metric behavior of the vectors by respondents’ organizational positions, are summarized in Table 3.
Table 3.
One-Way ANOVA Results for AI Benefit Pillars Based on Organizational Position (N = 917).
Because Levene’s test was significant for every item reported in Table 3 (all p < 0.001), indicating heterogeneity of variance across the five organizational-position groups, the standard One-Way ANOVA results above were supplemented with Welch’s ANOVA (robust to unequal variances) for all 15 benefit items and the Q8 composite; results, including partial eta-squared effect sizes, are reported in Table 4. Every effect remained statistically significant under Welch’s correction, with effect sizes in the medium-to-large range (η2p = 0.17–0.25), confirming that the role-based differences reported throughout Section 4 are not an artifact of the variance-homogeneity violation.
Table 4.
Welch’s ANOVA and Effect Sizes for AI Benefit Items by Organizational Position (N = 917).
Games–Howell post-hoc comparisons (which do not assume equal variances or equal sample sizes) were run for the Q8 composite, the item set with the largest effect size. Students scored significantly lower than every other group (vs. Administrators, Operational/Support Staff, Management function, and Teachers; all p < 0.001), and Teachers scored significantly lower than Administrators, Operational/Support Staff, and Management function (all p < 0.001). Administrators, Operational/Support Staff, and Management function did not differ significantly from one another (all p > 0.14). This pattern—Students < Teachers < {Administrators, Operational/Support Staff, Management function}—is consistent across the benefit items and is discussed further in Section 5.
The ANOVA results (Table 3) show a robust and consistent statistical trend across all dimensions evaluated in our study model. All three operational pillars have p-values well below the significance threshold of 0.05 (Cognitive Support (F(4912) = 74.82, p < 0.001), Administrative Automation (F(4912) = 75.82, p < 0.001), and Immersive and Interactive Environments (F(4912) = 80.49, p < 0.001), contradicting any assumption of institutional uniformity. This pattern rules out the existence of a simple consensus within the organization. It reveals a strong diversity of views, fundamentally shaped by stakeholders’ positions within the institution. A close examination of the group means will clarify the direction of this statistical variance.
In the Cognitive Support construct, administrative and operational/support professionals show the highest degree of agreement (M = 4.96 and M = 4.95, respectively), followed by management staff (M = 4.91) and educators (M = 4.66). The student subsample gives a significantly more reserved evaluation (M = 4.23). Such a structural hierarchy is clearly reflected in the Administrative Automation pillar (Operational/Support Staff: M = 4.97; Students: M = 4.15) and is most pronounced in the Immersive and Interactive Environments construct, where students report the lowest comparative evaluation (M = 3.98) compared with the near-unanimous agreement of the operational/support staff (M = 4.97).
This systematic variance shows that employees, managers, and teaching professionals place a heavy premium on the pragmatic benefits of AI integration, such as reducing administrative tasks, stabilizing cognitive structuring, and automating workflows. Students, by contrast, take a more distanced, reserved stance across the full spectrum of AI capabilities. These results are consistent with Hypotheses H2 and H4 in showing that organizational role is associated with the intensity of perceived AI benefits; as noted in Section 5, however, because the cognitive-support, administrative-automation, and immersive-environments groupings are not empirically distinct dimensions, this pattern is better read as evidence of a single role-differentiated general attitude than as independent, construct-specific confirmation of H2. Functional role and institutional responsibility nonetheless emerge as the principal factors shaping expectations for AI integration across the educational and organizational framework.
Question 8 of the questionnaire asked institutional stakeholders how AI is embedded into the teaching–learning–assessment process. This dimension includes eight main items: expansion of the educational field, adaptive learning, support for students with unique needs, and assessment automation. Table 5 shows the distribution of responses as percentages over the 5-point Likert scale. The pooled results are used to determine general trends in stakeholders’ perceptions.
Table 5.
Analysis of AI Impact on Teaching, Learning, and Assessment (Q8) (N = 917).
Table 5 shows a very positive outlook and a strong institutional consensus regarding the capacity of artificial intelligence to transform educational systems. Absolute agreement (score 5) dominates the choices in the sample and exceeds the crucial 80% threshold for each item evaluated. This deep convergence suggests that technology is no longer seen as an external disruptive factor but as a core fundamental pillar for upgrading and modernizing traditional teaching, learning, and evaluation practices.
This consensus has led to features emphasizing accessibility, customization, and inclusiveness. In particular, “Supporting students with special needs” had the greatest absolute rating at the highest step of the Likert scale (83.8% for score 5) and an impressive cumulative agreement of 92.6% (scores 4 and 5 combined). Similarly, the content optimization “Expanding the educational field” (including interactive resources) was very well supported, with 83.2% absolute and 94.2% cumulative agreement. The high margins confirm a general institutional drift toward active, highly visible, and inclusive pedagogic techniques.
A further examination of the dataset’s asymmetries shows a comparatively lower top-tier rating for items concerning AI’s role in tasks traditionally performed by humans. The item “AI-assisted virtual teachers” obtained the lowest absolute top-tier score (80.7% at score 5), the highest level of neutrality (8.2% at score 3), and the highest cumulative disagreement (3.9% at scores 1 and 2). Even with low rejection rates in absolute terms, this structural variation is still substantial. Thus, although administrative automation and logistical support are readily endorsed, items concerning AI taking on roles closer to direct human interaction receive comparatively more reserved ratings, which is descriptive of the response pattern rather than evidence of any specific underlying concern, since attitudinal constructs such as professional or ethical concern were not directly measured. This pattern is consistent with H4, which predicts that agreement levels fluctuate as the AI application in question moves closer to the relational and emotional center of the educational process.
Apart from these descriptive margins, the inferential analysis using the One-Way ANOVA tests summarized in Table 5 shows that the respondent’s organizational position is a strong and statistically significant discriminator for all the dimensions investigated (p < 0.001 for all items). The most substantial perceptual gaps are observed particularly for “AI-assisted virtual teachers” (F(4912) = 64.90, p < 0.001) and “Automation of educational processes” (F(4912) = 57.58, p < 0.001). The high F-values indicate that, although operational personnel, administrators, and decision-makers report a highly pragmatic, efficiency-oriented pattern of agreement with these items, students report a substantially more reserved pattern of agreement across the same items; this describes the reported ratings only, since attitudinal constructs such as skepticism or detachment were not directly measured by this instrument. This statistical stratification shows that expectations regarding the optimization of the teaching–learning–assessment environment are not homogeneous but are profoundly shaped by individual functional responsibilities and positions within the institution.
To test whether the institutional position leads to substantial changes in perceptions of the digital transformation of instructional activities, we statistically examined the hypothesis presented in the methodological framework. To determine the general institutional attitude, a composite index of Perceived Educational Process Optimization was computed by averaging the eight items in Question 8 (Q8).
The findings of the analysis of variance presented in Table 6 indicate very large, statistically significant differences among the surveyed groups (F(4912) = 69.11, p < 0.001). This indicates that reported assessments of AI’s influence on teaching and learning differ significantly by organizational position; as with the other ANOVA results reported here, this is a cross-sectional association between role and reported agreement, and does not by itself establish that organizational position causes or explains these differences.
Table 6.
One-Way ANOVA for Organizational Position-Based Perceived Educational Process Optimization (N = 917).
Comparing the group means, the main variation lies in the difference between the student subsample and other institutional players. Administrative workers and teaching professionals are strongly in favor of AI-assisted virtual teachers and automated test grading (Operational/Support Staff: M = 4.96; Administrators: M = 4.92), whereas students reported a comparatively lower mean agreement (M = 4.13). This gap suggests that younger respondents report less favorable views of AI-based technologies in this area than staff do; whether this reflects lower trust, different expectations, or another factor was not directly measured and remains an open question. Teachers and school officials, by comparison, place high value on the logistical and structural support these tools provide. The results are consistent with H4′s prediction that agreement levels vary in intensity across the dimensions and components assessed, reflecting a meaningful influence of organizational role on perceptions of AI’s usefulness in teaching and learning.
The competitive gains mentioned above depend directly on identifying operational constraints within a technology adoption paradigm. In this regard, Q9 assessed stakeholders’ views on the dangers and systemic challenges posed by AI adoption. This dimension includes technical vulnerabilities (e.g., cognitive discernment and technological dependence) and logistical and organizational problems (e.g., data security, privacy hazards, and the need for continual staff training). To provide a balanced and critical view of these perceived dangers and barriers, the answers of the 917 respondents were pooled structurally, and the relative frequency distributions are described in Table 7.
Table 7.
Operational Constraints and Risks Associated with AI Implementation (Q9).
Inferential analysis applied to the risk dimension (Table 8) shows a deep fragmentation of opinions within institutions (F(4912) = 45.20; p < 0.001). This value underscores the obvious contrast in risk management. If students tend to dismiss or ignore the limitations of discernment and data privacy issues, the critical emphasis of policymakers (management) and teachers is on systemic vulnerabilities and the urgent need for training.
Table 8.
One-Way ANOVA Results for Organizational Position-Based AI Operational Limitations (N = 917).
These results are consistent with H5, which posits that perceptions of barriers are closely related to the level of administrative and legal responsibilities carried within the organization. The examination of the contentious aspects and societal ramifications of Artificial Intelligence in education, as outlined in Table 9, reveals a distinct, polarized array of responses among the surveyed group (N = 917).
Table 9.
The AI Controversy and Its Effects on Education (Q10; N = 917)—Results and ANOVA Test.
We ran a series of One-Way ANOVA tests for each unique risk item to examine whether demographic and functional profiles systematically alter perceptions of AI-related concerns (Table 9). The results show a highly significant difference in all investigated items by the respondents’ organizational rank (p < 0.001). The largest statistical difference is seen for the items “Lack of knowledge of reality” (F(4912) = 24.12, p < 0.001) and “AI-generated material pollutes the internet” (F(4912) = 21.80, p < 0.001).
These key values show that, although most of the sample demonstrates polarized disagreement (around step 1), the magnitude of this rejection is strongly moderated by the stakeholders’ roles. Academic personnel and administration report substantially higher agreement with statements about algorithmic truthfulness and material quality risks than students do; this difference in reported agreement is descriptive and should not be read as evidence of underlying attitudes such as leniency or optimism, which were not measured by this instrument. Also, the systematic differences for “Widening the digital divide” (F(4912) = 18.42, p < 0.001) show that infrastructural inequalities are considered much more urgent by administrative and policy-making actors than by frontline end-users.
To evaluate whether there is a systematic relationship between stakeholders’ institutional roles and the need for AI regulation in education, a bivariate analysis was conducted using Pearson’s Chi-Square (χ2) test of independence (Table 10). The results show a statistically significant association between the two variables (χ2 (16) = 96.00, p < 0.001); however, Cramér’s V = 0.162 indicates that the strength of this association is relatively small. Statistical significance and effect-size magnitude are therefore distinguished throughout the interpretation below.
Table 10.
Crosstabulation of AI Regulation Agreement by Organizational Position (Q11; —Chi-Square Test of Independence, N = 917).
The empirical findings show strong descriptive consensus across the entire educational environment for the need for AI control, with 89.7% of the total sample (N = 917) in agreement (Strongly Agree: 51.3%; Agree: 38.5%). However, when studied by organizational role, the severity of this viewpoint differs dramatically.
Institutional leaders and educators are the most vociferous in their desire for regulatory safeguards. The highest degree of agreement (“Strongly Agree”) is for Management (60.0%) and Teachers (57.1%), with cumulative agreement ratings of 91.3% and 88.1%, respectively. The student cohort is far less intense. Only 37.5% of students “Strongly Agree” with the regulation, while another 37.5% “Agree”. Students also had the highest percentages of neutrality (17.9%) and cumulative dissonance (7.1%) among the groups in the study.
This distributional difference suggests that the professional, legal, and operational duties within the academic setting greatly amplify the emphasis on human-centered protections. However, students also want protection but are somewhat more flexible or wary about strict regulatory controls and have a more open attitude towards the incorporation of technology.
The empirical data for the construction of a policy framework for generative AI, as shown in Table 11, indicate strong and broad consensus at the highest level of the Likert scale for all strategic items, with values consistently above 80.0% for strong agreement (score 5). Agreement is strongest for “Protecting the human being” (i.e., safeguarding human agency) at 82.6%, closely followed by “Monitoring and validation of artificial intelligence systems in education” (i.e., the need for independent audit procedures) at 82.0%. One-way ANOVA tests were performed on each component of the framework to determine whether the prioritization of policy was consistent across institutional levels.
Table 11.
Agreement with a Policy Framework for the Use of Generative AI in Education (Q12 and SPSS ANOVA test; N = 917).
The results indicate highly significant differences among all items by respondents’ organizational role (p < 0.001). The largest perceptual splits are for “Developing students’ skills on the use of AI” (F(4912) = 76.50, p < 0.001) and “Strengthening teachers’ capacity to use AI correctly” (F(4912) = 66.25, p < 0.001). This systematic variance shows that students largely view these rules through the pragmatic lens of personal skill development and immediate operational utility. In contrast, academic teachers and administrators evaluate them on structure and strategy, focusing on institutional preparedness, capacity development, and long-term management. The findings show a significant stratification of policy expectations, where the institutional hierarchy and professional responsibilities shape a specific focus on security, training, and ethical compliance.
The strategic recommendations for the creative and pedagogically applicable integration of Artificial Intelligence shown in Table 12 present a high level of positive expectation, with maximum levels of agreement (score 5) ranging from 78.6% to 81.4%. The dominant consensus is for the employment of macro-level organizational approaches (“Institutional strategies for responsible use”—81.4%), demonstrating a collective preference for structural planning over isolated, ad hoc programs.
Table 12.
Promoting Creative and Pedagogically Applicable Use of AI in Education (Results Q13 and SPSS ANOVA test; N = 917).
However, separate One-Way ANOVA tests indicate that institutional role remains a highly significant discriminator for these strategic expectations (p < 0.001). There were significant statistical differences between the groups assessed for “AI as a personalized mentor” (F(4912) = 64.85, p < 0.001) and “AI as a Teaching Facilitator” (F(4912) = 71.49, p < 0.001).
The systematic trend in the data indicates that administrative and executive professionals tend to identify AI integration primarily with system-wide effectiveness, resource optimization, and streamlining institutional procedures. At the same time, students assess these adaptive technologies against the measures of individualized learning, direct academic support, and personalized help. This discrepancy highlights the gap between the structural governance of administrative stakeholders and the immediate demand for individualized educational assistance from the student population.
The results of the investigation into the long-term systemic effects of AI on education (Table 13) suggest a fairly concentrated distribution of positive responses—the highly agreed responses (scoring 5) range from 78.3% to 79.7%. The highest agreement is for the instrumental value of AI as a medium for information distribution (“Sources of content and learning”—79.7%).
Table 13.
Long-Term Meaning and Impact of AI in Education (Q14 and SPSS ANOVA test; N = 917).
The results of the One-Way ANOVA indicate that the functional division of labor in the organization has a substantial impact on the anticipation of these long-term changes (p < 0.001). The greatest statistical differences between groups are seen in the variables “Creating ethical codes appropriate to sector” (F(4912) = 88.31, p < 0.001) and “Adaptation of actors to frequent ICT use” (F(4912) = 79.52, p < 0.001).
The results indicate that students found AI most useful in a practical, immediate way, for efficiently acquiring knowledge and accessing content. Professional personnel (educators, administrators, and management leaders), in contrast, regard structural adaptation, institutional compliance, and the proactive establishment of sector-specific ethical boundaries significantly more highly. This confirms the complexity of the long-term importance of AI, which is not regarded as a uniform change, but as an elaborate transition process in which professional responsibility increases the perceived need for rigorous ethical standards and methodical change management.
5. Discussion
Before interpreting the role-based differences reported in Section 4, it is necessary to revisit the dimensional structure of the AI-benefits scale, since this has direct consequences for how Hypotheses H1–H3 should be read. The factor analyses reported in Section 3.1.1 indicate that the hypothesized three-dimensional structure (cognitive support, administrative automation, immersive environments) is not empirically distinguishable in this sample: exploratory factor analysis extracted a single dominant factor accounting for 74.3% of common variance, and a confirmatory three-factor model, while showing acceptable-to-mediocre global fit indices, produced latent factor correlations of 0.92 to 0.96—well above the threshold at which constructs are considered discriminable. The most defensible reading of the data is therefore that respondents hold one broad, strongly favorable general attitude toward AI in education, rather than three differentiated evaluations of distinct AI applications. Hypotheses H1, H2, and H3 were formulated under the assumption that cognitive support, administrative automation, and immersive environments are separable constructs whose acceptance could vary independently by organizational role; because this assumption is not supported by the present data, the pillar-specific ANOVA results reported in Table 3 are better understood as three highly correlated views of the same underlying general-attitude effect rather than as independent confirmatory tests of three distinct hypotheses. This does not invalidate the finding that organizational role is associated with AI-perception scores—that association is robust and is discussed below—but it does mean the finding should be attributed to a single general factor rather than to three separable dimensions of perceived benefit, and H1–H3 should be interpreted jointly rather than as independent lines of evidence.
The results reported in Section 4 indicate that educational stakeholders’ perceptions of generative AI vary systematically by organizational role, across the three benefit dimensions examined (cognitive support, administrative automation, immersive environments), as well as in perceived risks and regulatory expectations. This pattern is broadly consistent with the prior literature suggesting that AI adoption in education is experienced unevenly across stakeholder groups, and that professional responsibility and institutional exposure shape how benefits and risks are weighed [3,6,8,15,16].
The pattern of support for the study’s hypotheses was mixed rather than uniform, though as noted above, H1 through H3 are best interpreted jointly as reflecting a single general attitude rather than three independent tests. Hypothesis H1 predicted a homogeneous, role-independent consensus on the perceived usefulness of AI as cognitive support. The significant between-group differences reported in Table 3 (F(4912) = 74.82, p < 0.001) contradict this prediction, and H1 is therefore not supported and should be treated as rejected rather than as part of a generally confirmed hypothesis set. This finding is informative in its own right: it suggests that institutional role shapes the general attitude toward AI even when that attitude is expressed through items nominally about the application generally perceived as least controversial, echoing broader concerns in the literature that professional context, and not exposure to the technology alone, drives differences in perception [8,15]. Hypotheses H2 through H5 received support broadly consistent with the reported analyses—understanding that, for H2 and H3 specifically, this support reflects the same underlying general-attitude effect rather than independent evidence about administrative-automation or immersive-environment perceptions as distinct constructs. H3 and H5 are additionally formulated in terms that only partly align with the One-Way ANOVA tests used to evaluate them; this mismatch between hypothesis wording and statistical test is addressed as a limitation in Section 7 of the main text.
Students consistently reported lower agreement than staff (teachers, administrators, management, and operational/support roles) across several benefit items, and were also somewhat less likely to strongly endorse AI regulation (Section 4, Table 10). Because the questionnaire did not directly measure constructs such as trust, skepticism, or risk tolerance, these differences are interpreted here only as differences in reported agreement; any explanation of why students respond more moderately remains a plausible hypothesis for future mixed-methods research rather than a conclusion supported by the present data.
The near-unanimous support for AI regulation across all roles (89.7% overall agreement), combined with a statistically significant but small association with organizational role (Cramér’s V = 0.162, Section 4), suggests that the demand for governance and oversight is a broadly shared value among stakeholders, even though its intensity differs somewhat by role. This is consistent with international guidance emphasizing that trust in AI systems in education depends on visible governance and accountability structures rather than on stakeholder group alone [4,6,9].
Finally, the consistently high mean scores and limited variance observed for several benefit items (Section Multidimensional Attitudinal Analysis of Educational AI) indicate pronounced ceiling effects in the response distributions. This pattern, together with the very high overall Cronbach’s alpha (α = 0.97) reported for the 15-item benefits scale, raises the possibility that item redundancy or acquiescence bias is present in the data; this possibility, and its implications for interpreting the reliability statistics, is discussed further in Section 7 of the main text. Taken together, the results support the general claim that organizational role is a relevant differentiator of AI perceptions in this sample, while cautioning against interpreting these cross-sectional associations as evidence of underlying psychological processes, causal effects on teaching or learning, or a fully confirmed hypothesis set.
6. Future Directions and Open Questions
Questions about the future of education have a speculative quality, suggesting that technology is not a silver bullet for systemic problems such as educational inequalities or teachers’ workloads. The discourse of technology companies and policymakers on AI in education does not always correspond to day-to-day classroom practice, and the present study cannot establish how strongly such discourse shapes actual policy or legislation; this remains an open question for future research rather than a claim advanced here. There is consensus that integrating AI and new technologies demands ongoing teacher training, ethical oversight, and respect for humanistic educational values.
Beyond the present sample, the broader international research literature on AI in education similarly holds that artificial intelligence and other digital technologies have transformative potential for education, but also raise significant ethical, social, and practical issues [6,9,20]. Ongoing research and policy development must balance innovation with equity, privacy, and the protection of personal freedom in learning environments.
7. Limitations
This study has several limitations that should be considered when interpreting the findings. First, the sample was obtained through non-probability purposive and convenience sampling rather than probability sampling. Although the sample is large (N = 917) and demographically varied, balanced proportions across categories such as gender, age, or residential environment do not establish statistical representativeness of the underlying population of educational stakeholders, and generalization beyond the sampled institutions should be made cautiously.
Second, the measures used throughout are self-reported perceptions collected at a single point in time. The cross-sectional design does not permit conclusions about actual teaching practice, learning outcomes, or the causal impact of generative AI on education; it captures stakeholders’ attitudes and expectations at the time of data collection. The 168-day data collection window (28 January to 13 July 2026) also coincided with a period of rapid change in generative AI tools and public debate, and it is possible that perceptions shifted over the course of data collection rather than remaining stable.
Third, respondents were drawn from institutions in Romania and partner institutions in Morocco, Indonesia, and Croatia, but the dataset does not include institution- or country-level identifiers, which prevents reporting of the number of respondents per country or institution and prevents a formal test of clustering by country or institution. Responses are nonetheless likely to be clustered within institutions and countries, which may violate the independence assumption underlying the One-Way ANOVA tests reported in Section 4; this should be addressed in future replications of this survey design by recording country/institution at the point of data collection and applying multilevel modeling or cluster-robust procedures. Response-rate metrics (the number of invitations sent, partial completions, and exclusions) were also not recorded during data collection and cannot be reported; only the final validated sample (N = 917) is available. Procedures used, if any, for translation or cultural adaptation of the questionnaire across the participating countries were likewise not documented and cannot be reconstructed retrospectively.
Fourth, the response distributions for several benefit items showed pronounced ceiling effects, and the overall Cronbach’s alpha for the 15-item benefits scale (α = 0.97) is high enough that item redundancy cannot be ruled out. Consistent with this, the factor analyses reported in Section 3.1.1 indicate that the three hypothesized benefit dimensions are not empirically distinct in this sample and are better characterized as a single general factor; this is treated throughout as a substantive finding about the scale’s construct validity (discussed in Section 5) rather than solely as a limitation, but it does mean that role-based comparisons framed by “dimension” in Section 4 should not be read as evidence about three separable constructs. The multiple One-Way ANOVA tests reported per questionnaire item were not corrected for multiple comparisons; applying a Bonferroni correction across all 51 item-level tests reported in this study, every test remains significant at the corrected threshold, and effect sizes (η2) for these tests range from 0.10 to 0.39 (median η2 = 0.22), indicating that the observed role-based differences are not an artifact of multiple testing. Post-hoc pairwise comparisons with adjusted p-values were not conducted and would strengthen the interpretation of these results in future analyses. Homogeneity of variance was also formally checked: Levene’s test was significant (p < 0.001) for all 15 benefit items and the Q8 composite, indicating that the equal-variance assumption underlying the standard One-Way ANOVA was violated throughout. As reported in Section Multidimensional Attitudinal Analysis of Educational AI and Table 4, Welch’s ANOVA (robust to unequal variances) and Games–Howell post-hoc comparisons were run as robustness checks; every effect remained statistically significant, indicating that the reported role-based differences are not an artifact of unequal variances across groups.
Finally, the instrument itself has not been published as supplementary material, and its development process (item generation, expert review, pilot testing) is not documented in this manuscript, nor were behavioral or learning-outcome measures included alongside the self-report items. Common-method bias, arising from the use of a single self-report instrument for all constructs, cannot be ruled out. The organizational-position categories (Section 3.1) were also self-selected without researcher-verified criteria, so classification at the margins between adjacent categories (e.g., Administrator, Management, and Operational/Support Staff) cannot be independently confirmed. Addressing these limitations in future research would strengthen confidence in the findings reported here.
8. The LID-AI Framework: A Preliminary Conceptual Proposal
The acronym LID-AI stands for Leadership, Instruction/Learning, and Development, reflecting its three axes (Leadership and Governance; Learning and Professional Development; Development of Competencies and Agency, detailed below). The model rests on a single guiding principle: no use of AI is approved merely because it is efficient. Each application must instead answer three questions—is it governed and accountable, are users supported and competent to use it, and does it produce learning, autonomy, and equity, rather than dependency or harm—before it is considered appropriate for adoption. Building on the perceptions reported in Section 4 and the discussion in Section 5, this section outlines the LID-AI model as a preliminary, practice-oriented framework rather than a validated model. It has not yet undergone independent peer evaluation, stakeholder validation, or empirical testing, and should be read as a conceptual proposal for future development and testing rather than as a confirmed outcome of this study. Some elements of the framework are grounded directly in the empirical findings reported above; others draw on established international frameworks for AI competence, governance, and ethics in education [2,3,4,10,26], and this distinction is noted where relevant below.
Outlining these implications only briefly would understate both their complexity and their immediacy. A model proposal, by contrast, responds to the need for realistic guidance, presenting an aspirational vision that remains grounded in the lived experiences of educational institutions.
The LID-AI model is presented in narrative and graphical forms to guarantee maximum clarity and relevance (Figure 7). The framework integrates the interrelated components of leadership and governance, professional development and skills, and agency, all of which are geared towards human rights, well-being, and educational significance.
Figure 7.
Three-Dimensional Representation of the LID-AI Model. Source: Authors’ own elaboration.
The model is built around three intersecting axes: leadership and governance, professional development, and competencies and agency. The three axes meet at a core that is human-centered and highlights pedagogical value, rights, and well-being. This graphical representation provides a holistic understanding of the interactions among the various elements that promote effective AI adoption in education.
This framework identifies three foundational dimensions—leadership and governance, professional development, and competencies and agency—which are supported by six cross-cutting principles: equity and inclusion; privacy and security; transparency; integrity and intellectual property; human oversight and accountability; and evidence-based assessment. These six principles are not sequential or causally ordered, and none is tied specifically to any one dimension; each applies uniformly across all three dimensions, as depicted by their shared placement above the model core in Figure 8. These elements, together, define the model’s key outcomes and provide essential guidance for the conscientious implementation of AI in educational settings.
Figure 8.
LID-AI Model Schema. Source: Authors’ own elaboration.
Implementing the LID-AI Framework: Operationalizing a Human-Centered Approach to AI in Education
The LID-AI paradigm is explicitly human-centric. It aims to go beyond theory and provide practical guidance to educational leaders, teachers, and decision-makers. To make the provenance of each dimension explicit, as distinct from prior frameworks, D1 and D2 are grounded primarily in this study’s empirical findings (stakeholders’ regulation/policy-support agreement, Section Multidimensional Attitudinal Analysis of Educational AI, Table 10 and Table 11, and the Q8 process-optimization composite, Section Multidimensional Attitudinal Analysis of Educational AI, Table 5 and Table 6, respectively), while D3 and the cross-cutting principles in Figure 8 draw more heavily on prior frameworks—chiefly UNESCO’s AI Competency Framework for Teachers [27]—than on items directly collected in this survey. The framework’s composition reflects the importance of:
- -
- D1: Leadership and Governance (empirically grounded)—clear policies, risk minimization, supervision, and principled procurement [2,10].
- -
- D2: Ongoing professional development (empirically grounded) through targeted training, innovative pedagogy, and collaborative practice communities [10,18].
- -
- D3: AI literacy, analytical reasoning, innovation, and learner independence (adapted from prior frameworks), building skills and empowering individuals [3].
Positioning LID-AI relative to existing international frameworks helps clarify what it adds and where it overlaps. UNESCO’s AI Competency Framework for Teachers [27], the most directly comparable published framework, organizes teacher competencies around five aspects, a human-centred mindset, ethics of AI, AI foundations and applications, AI pedagogy, and AI for professional development, each scaffolded across three progression levels. LID-AI’s D2 (Professional Development) and D3 (Competencies and Agency) overlap thematically with UNESCO’s professional-development and foundations/mindset aspects, and the six cross-cutting principles in Figure 8 (equity and inclusion, privacy and security, transparency, integrity, human oversight, and evidence-based assessment) cover similar ground to UNESCO’s ethics-of-AI aspect. Two differences are worth noting. First, UNESCO’s framework is pitched at the level of individual teacher competency and includes a dedicated AI-pedagogy aspect specifying classroom-level integration skills; LID-AI, by contrast, is pitched at the level of institutional leadership and governance (D1), a dimension without a direct counterpart in the teacher-focused UNESCO framework, but it does not include a comparably detailed pedagogy-integration dimension, since the underlying survey did not collect classroom-practice items. Second, UNESCO’s framework was developed through an extensive multi-stage expert and stakeholder consultation process and is accordingly a validated reference document, whereas LID-AI, as stated above, remains a preliminary conceptual proposal derived partly from the present study’s findings and partly from thematic alignment with existing frameworks; it has not undergone comparable validation and should not be read as a substitute for it.
The approach is based on the principle that AI should enhance educational opportunities and preserve human dignity, rights, and professional responsibility. The practical suggestions (policy, educator development, procedural steps, and ethical coherence) are offered as a starting point for institutional discussion and piloting; given that the framework has not yet undergone independent expert review, stakeholder validation, or empirical testing (Section 8, opening paragraph), claims about its readiness for direct real-world application should be treated with corresponding caution until such validation is available.
Visual aids, such as those in Figure 7 and Figure 8, clarify complex relationships, facilitate execution, and help stakeholders at all levels understand the bigger picture and the actions they may take. Visual aids support this goal, but the model itself is grounded in the study’s practical findings rather than in its visual representation.
This study proposes a model, informed by these findings, for educational institutions to adopt AI in an efficient, ethical, inclusive, and deeply human-centered way. The LID-AI framework seeks to bridge theoretical constructs with practice to ensure that advances in technology continually serve the growth and autonomy of learners, educators, and communities.
The study demonstrates, through the statistical analyses reported above, that stakeholder perceptions of AI in education differ meaningfully by organizational role. A detailed synthesis of these findings, including which hypotheses were and were not supported, is presented in the Conclusions below.
9. Conclusions
This study examined educational stakeholders’ self-reported perceptions of generative AI in teaching–learning contexts, testing five hypotheses about differences in perceived benefits, risks, and regulatory expectations across organizational roles. The pattern of results was mixed rather than uniformly confirmatory. Hypothesis H1, which predicted a homogeneous consensus on the cognitive-support benefits of AI regardless of institutional role, was not supported by the significant between-group differences reported in Section 4 and is therefore rejected. Hypotheses H2 through H5 received support broadly consistent with the reported analyses, subject to the caveats on hypothesis-test correspondence and multiple comparisons discussed in Section 7 of the main text. A further methodological finding qualifies H1–H3 specifically: factor analyses of the benefits scale (Section 3.1.1 and Section 5) indicate that the hypothesized cognitive-support, administrative-automation, and immersive-environment dimensions are not empirically distinct in this sample, and are better understood as a single general, strongly favorable attitude toward AI in education. H1–H3 should accordingly be read jointly, as evidence about this general attitude and its variation by organizational role, rather than as three independent tests of distinct constructs.
Within these limits, the findings indicate that teachers, students, administrators, and management perceive the benefits, risks, and regulatory needs of generative AI differently, and that these differences are shaped by institutional role rather than reflecting a single shared viewpoint. Institutional actors across all roles nonetheless expressed a consistent underlying concern for preserving the human dimension of teaching alongside the adoption of AI tools. Claims beyond this—about actual teaching practice, learning outcomes, or the causal impact of AI on education—are not supported by data from this cross-sectional perception survey and should be examined in future longitudinal or mixed-methods research.
The study’s contribution is primarily descriptive and exploratory: it maps stakeholder perceptions of generative AI across a large, multi-role, multi-country sample and proposes the LID-AI framework (Section 8) as a preliminary conceptual tool for further development and testing. Practical implications include the value of clear ethical guidelines, ongoing professional training, and governance structures that are responsive to the differing perspectives of teachers, students, administrators, and management, while preserving the centrality of human relationships in education.
Author Contributions
Conceptualization, V.S.C.G. and S.S.-I.; methodology, S.S.-I.; software, S.S.-I.; validation, S.S.-I.; formal analysis, S.S.-I.; investigation, S.S.-I. and V.S.C.G.; resources, S.S.-I. and V.S.C.G.; data curation, S.S.-I.; writing—original draft preparation, S.S.-I. and V.S.C.G.; writing—review and editing, S.S.-I. and V.S.C.G.; project administration, S.S.-I. All authors have read and agreed to the published version of the manuscript.
Funding
This research received no external funding.
Institutional Review Board Statement
In accordance with Romanian national legislation (Law no. 206/2004 on good conduct in scientific research), the General Data Protection Regulation (EU) 2016/679 (Recital 26), Romanian Law no. 190/2018, and the Code of University Ethics and Deontology of Valahia University of Targoviste, this study was exempt from formal ethical committee review. The research consisted of a non-interventional, fully anonymized online survey of consenting adult stakeholders, involving no personally identifiable information, no clinical or biomedical intervention, and no sensitive or vulnerable-population data, and therefore fell outside the mandatory jurisdiction of the University Ethics Commission and national bioethics boards.
Informed Consent Statement
Informed consent was obtained from all subjects involved in the study via an online preamble presented before the questionnaire. Participants were informed of the study’s purpose, the voluntary nature of participation, the right to withdraw at any time before submission, and the complete anonymity of responses; proceeding to and submitting the questionnaire constituted explicit consent to participate.
Data Availability Statement
The de-identified raw dataset supporting the conclusions of this article will be made available by the authors upon reasonable request.
Conflicts of Interest
The authors declare no conflicts of interest.
Appendix A. Full Survey Instrument
“The Paradigm Shift in Education: Stakeholder Perceptions of Generative AI in Teaching-Learning Dynamics”
The questionnaire was administered online via Microsoft Forms between 28 January and 13 July 2026 (N = 917 valid responses). It was developed by the authors, conceptually informed by constructs from the Technology Acceptance Model and the European Framework for Digital Competence of Educators (DigCompEdu), without formal adaptation from a previously validated instrument; no formal expert panel review, cognitive pretesting, or pilot administration was conducted (see Section 3.1.1 of the main text). All Likert-type items used a 5-point scale unless otherwise noted. Item order below follows the order of administration.
Appendix A.1. Demographic and Professional Profile
- 1. Check the box corresponding to your age category: *
1. 18–25 years old
2. 25–35 years old
3. 35–45 years old
4. Over 45 years old
- 2. Regarding your seniority within the organization, specify the category: *
1. Less than one year
2. 1–5 years
3. 6–10 years
4. 11–16 years
5. More than 16 years
- 3. Indicate the level of education you have completed: *
1. ISCED Level 5–Short-term higher education
2. ISCED Level 6–Bachelor’s Degree or equivalent
3. ISCED Level 7–Master’s degree or equivalent level
4. ISCED Level 8–PhD or equivalent
- 4. Specify the position you hold within your organization: *
1. Student
2. Teacher
3. Administrator
4. Management function
5. Operational/Support Staff
Note: single-choice item; categories are mutually exclusive by survey design (see Section 3.1 of the main text).
- 5. Gender: *
1. Male (M)
2. Female (F)
- 6. Environment: *
1. Urban (City)
2. Rural (Village)
Appendix A.2. Perceived Benefits of AI Tools
- What are the benefits of artificial intelligence tools, in your opinion?
Response scale: 1 = Strongly Disagree, 2 = Disagree, 3 = Neither Agree nor Disagree, 4 = Agree, 5 = Strongly Agree.
- Cognitive & Conceptual Support
1. [AI_COG_1] Organization of ideas and arguments
2. [AI_COG_2] Access to complementary content
3. [AI_COG_3] Access AI-enhanced search engines to extract relevant information and synthesize it
4. [AI_COG_4] Automatic comparison of texts and generation of summaries using natural language processing algorithms
5. [AI_COG_5] Facilitating the understanding and memorization of concepts
- Administrative & Collaborative Automation
1. [AI_AUT_1] Automatic transcription, summary generation, and webinar translations
2. [AI_AUT_2] Automating repetitive tasks, such as formatting documents and organizing visual resources
3. [AI_AUT_3] Automatically organize the exchange of ideas in forums and chats, identify key topics and summarize discussions
4. [AI_AUT_4] Organization of relevant digital resources (documents, images, videos)
5. [AI_AUT_5] Facilitating collaboration by co-creating AI-assisted digital documents and presentations
6. [AI_AUT_6] Automatic analysis of forum discussions to identify main topics and moderate content
7. [AI_AUT_7] Automatic transcription and organization of meeting notes and recordings
- Immersive & Interactive Environments
1. [AI_IMM_1] Creating interactive simulated environments for experiments and virtual labs
2. [AI_IMM_2] Use of AI and virtual reality for simulated field trips and interactive hands-on activities
3. [AI_IMM_3] Creating AI-controlled virtual characters for interactive role-playing
Note: as reported in Section 3.1.1 and Section 5 of the main text, exploratory and confirmatory factor analyses indicate that these three groupings are not empirically distinct dimensions in this sample; they are retained here as the original thematic organization under which items were administered.
Appendix A.3. Perceived Educational Process Optimization (Q8)
- Do you consider that the aspects listed below contribute to strengthening the teaching-learning-assessment process?
Response scale: 1 = Strongly Disagree, 2 = Disagree, 3 = Neither Agree nor Disagree, 4 = Agree, 5 = Strongly Agree.
1. Expanding the educational field and introducing interactive materials
2. Automation of educational processes
3. Adaptive learning
4. AI-assisted virtual teachers
5. Automatic test verification
6. Developing problem-solving skills
7. Supporting students with special needs
8. AI-assisted distance learning
Appendix A.4. Perceived Operational Limitations of AI (Q9)
- Like any technical system, AI has and will have limitations in operation:
Response scale: 1 = Strongly Disagree, 2 = Disagree, 3 = Neither Agree nor Disagree, 4 = Agree, 5 = Strongly Agree.
1. Lack of discernment
2. Technological dependence
3. Data security and privacy risks
4. The need for teacher training
Note: as reported in Section Multidimensional Attitudinal Analysis of Educational AI of the main text, this composite showed markedly lower internal consistency (α = 0.626) than the other composites, consistent with these four items addressing conceptually heterogeneous concerns rather than a single underlying construct.
Appendix A.5. The AI Controversy in Education (Q10)
- The controversy regarding artificial intelligence and its implications in education refers to:
Response scale: 1 = Strongly Disagree, 2 = Disagree, 3 = Neither Agree nor Disagree, 4 = Agree, 5 = Strongly Agree.
1. Widening the digital divide
2. Lack of traceability of models
3. AI-generated content pollutes the internet
4. Lack of understanding of reality
5. Reducing the diversity of opinions and marginalizing already excluded voices
6. Increased risk of counterfeiting
Appendix A.6. AI Regulation Agreement (Q11)
- Do you agree with the regulation of the use of artificial intelligence in education—a human-centered approach to artificial intelligence?
Response options: Strongly Agree/Agree/Neither Agree nor Disagree/Disagree/Strongly Disagree.
Appendix A.7. Policy Framework Agreement (Q12)
- You agree to a policy framework for the use of generative artificial intelligence in education, based on the following:
Response scale: 1 = Strongly Disagree, 2 = Disagree, 3 = Neither Agree nor Disagree, 4 = Agree, 5 = Strongly Agree.
1. Promoting linguistic and cultural inclusion, equity and diversity
2. Protecting the human being
3. Monitoring and validation of artificial intelligence systems in education
4. Developing students’ skills on the use of artificial intelligence
5. Strengthening teachers’ capacity to use artificial intelligence correctly
6. Promoting pluralism of opinion and diversity of ideas
7. Analysis of the long-term implications from a cross-sectoral and interdisciplinary perspective
Appendix A.8. Promoting Creative AI Use in Education (Q13)
- Promoting the creative use of artificial intelligence in education involves:
Response scale: 1 = Strongly Disagree, 2 = Disagree, 3 = Neither Agree nor Disagree, 4 = Agree, 5 = Strongly Agree.
1. Institutional strategies to facilitate the responsible and creative use of artificial intelligence
2. A “human-centered and pedagogically relevant” approach to interaction
3. Co-creation of the use of artificial intelligence in education
4. Artificial Intelligence as a Teaching Facilitator
5. Artificial intelligence as a “personalized mentor” for individualized learning
6. Artificial intelligence to support inquiry-based or project-based learning
7. Artificial intelligence in support of students with special needs
Appendix A.9. Perceived Long-Term Meaning of AI in Education (Q14)
- Artificial intelligence used in the educational system will mean:
Response scale: 1 = Strongly Disagree, 2 = Disagree, 3 = Neither Agree nor Disagree, 4 = Agree, 5 = Strongly Agree.
1. Adaptation of educational actors to the frequent use of ICT
2. Creating ethical codes on the use of tools appropriate to the sector
3. Sources of content and learning
4. Considerable help in adapting the curriculum for students with special educational needs
References
- Holmes, W.; Bialik, M.; Fadel, C. Artificial Intelligence in Education: Promises and Implications for Teaching & Learning; The Center for Curriculum Redesign: Boston, MA, USA, 2019. [Google Scholar]
- Luckin, R.; Holmes, W.; Griffiths, M.; Forcier, L.B. Intelligence Unleashed: An Argument for AI in Education; Pearson: London, UK, 2016. [Google Scholar]
- Ball, J.; Savin-Baden, M. Postdigital learning for a changing higher education. Postdigital Sci. Educ. 2022, 4, 753–771. [Google Scholar] [CrossRef] [Scilit] [PubMed]
- UNESCO. AI and Education: Guidance for Policy-Makers; UNESCO Publishing: Paris, France, 2021; ISBN 978-92-3-100447-6. Available online: https://unesdoc.unesco.org/ark:/48223/pf0000376709 (accessed on 12 July 2026).
- Biesta, G. What is education for? On good education, teacher judgement, and educational professionalism. Eur. J. Educ. 2015, 50, 75–87. [Google Scholar] [CrossRef] [Scilit]
- UNESCO. Recommendation on the Ethics of Artificial Intelligence; UNESCO Publishing: Paris, France, 2021; Available online: https://unesdoc.unesco.org/ark:/48223/pf0000381137 (accessed on 12 July 2026).
- Blikstein, P.; Zheng, Y.; Zhou, K.Z. Ceci n’est pas une école: The discourses of artificial intelligence in education through the lens of semiotic analytics. Eur. J. Educ. 2022, 57, 571–583. [Google Scholar] [CrossRef] [Scilit]
- Jääskelä, P.; Heilala, V.; Kärkkäinen, T.; Häkkinen, P. Student agency analytics: Learning analytics as a tool for analyzing student agency in higher education. Behav. Inf. Technol. 2021, 40, 790–808. [Google Scholar] [CrossRef] [Scilit]
- UNESCO World Commission on the Ethics of Scientific Knowledge and Technology (COMEST). Preliminary Study on the Ethics of Artificial Intelligence; UNESCO: Paris, France, 2019; Available online: https://unesdoc.unesco.org/ark:/48223/pf0000367823 (accessed on 12 July 2026).
- OECD. TALIS 2018 Results (Volume I): Teachers and School Leaders as Lifelong Learners; OECD Publishing: Paris, France, 2019. [Google Scholar] [CrossRef] [Scilit]
- Redecker, C. European Framework for the Digital Competence of Educators: DigCompEdu; Punie, Y., Ed.; EUR 28775 EN; Publications Office of the European Union: Luxembourg, 2017. [Google Scholar] [CrossRef]
- Facer, K.; Selwyn, N. Digital Technology and the Futures of Education; Paper Commissioned for the UNESCO Futures of Education Report; UNESCO: Paris, France, 2021; Available online: https://unesdoc.unesco.org/ark:/48223/pf0000377071 (accessed on 12 July 2026).
- Ross, J. Digital Futures for Learning: Speculative Methods and Pedagogies; Routledge: London, UK, 2023. [Google Scholar] [CrossRef] [Scilit]
- Sala, A.; Punie, Y.; Garkov, V.; Cabrera Giraldez, M. LifeComp: The European Framework for Personal, Social and Learning to Learn Key Competence; EUR 30246 EN; Publications Office of the European Union: Luxembourg, 2020. [Google Scholar] [CrossRef] [PubMed]
- Brod, G.; Kucirkova, N.; Shepherd, J.; Jolles, D.; Molenaar, I. Agency in educational technology: Interdisciplinary perspectives and implications for learning design. Educ. Psychol. Rev. 2023, 35, 25. [Google Scholar] [CrossRef] [Scilit]
- Sawyer, R.; Smith, A.; Rowe, J.; Azevedo, R.; Lester, J. Is more agency better? The impact of student agency on game-based learning. In Artificial Intelligence in Education; André, E., Baker, R., Hu, X., Rodrigo, M.M.T., du Boulay, B., Eds.; Springer: Cham, Switzerland, 2017; pp. 335–346. [Google Scholar] [CrossRef] [Scilit]
- Buckingham Shum, S.; Littlejohn, A.; Kitto, K.; Crick, R. Framing professional learning analytics as reframing oneself. IEEE Trans. Learn. Technol. 2022, 15, 634–649. [Google Scholar] [CrossRef] [Scilit]
- European Parliament; Council of the European Union. Regulation (EU) 2024/1689 of the European Parliament and of the Council of 13 June 2024 Laying Down Harmonised Rules on Artificial Intelligence (Artificial Intelligence Act). Off. J. Eur. Union Luxemb. 2024, L 2024/1689. [Google Scholar]
- European Commission. Digital Education Action Plan 2021–2027: Resetting Education and Training for the Digital Age; COM(2020) 624 Final; European Commission: Brussels, Belgium, 2020. [Google Scholar]
- Alam, G.M. Sustainable Education, Sustainability in Education and Education for Sustainable Development: The Reconciliation of Variables and the Path of Education Research in an Era of Technologization. Sustainability 2025, 17, 250. [Google Scholar] [CrossRef] [Scilit]
- Azevedo, L.; Robles, P.; Best, E.; Mallinson, D.J. Institutional Policies on Artificial Intelligence in Higher Education: Frameworks and Best Practices for Faculty. New Dir. Adult Contin. Educ. 2025, 2025, 70–78. [Google Scholar] [CrossRef] [Scilit]
- Tao, Y.; Viberg, O.; Varuvel Dennison, D.; Wu, Z.; Kizilcec, R.F. Teachers’ Perceived Benefits and Risks of AI Across Fifty-Five Countries: An Audit of LLM Alignment and Steerability. In Proceedings of the Thirteenth ACM Conference on Learning @ Scale (L@S ‘26), Seoul, Republic of Korea, 29 June–3 July 2026. [Google Scholar] [CrossRef] [Scilit]
- Skalka, J.; Przybyła-Kasperek, M.; Smyrnova-Trybulska, E.; Klimeš, C.; Farana, R.; Dagienė, V.; Dolgopolovas, V. Cross-national survey data on student attitudes toward artificial intelligence. Data Brief 2025, 62, 112022. [Google Scholar] [CrossRef] [Scilit] [PubMed]
- Karran, A.J.; Charland, P.; Trempe-Martineau, J.; Ortiz de Guinea Lopez de Arana, A.; Lesage, A.-M.; Sénécal, S.; Léger, P.-M. Multi-stakeholder perspective on responsible artificial intelligence and acceptability in education. npj Sci. Learn. 2025, 10, 44. [Google Scholar] [CrossRef] [Scilit] [PubMed]
- Humble, N.; Mozelius, P. Beyond the hype—How higher education stakeholders view the benefits and concerns of generative AI for teaching, research, and administration. Comput. Educ. Open. 2026, 10, 100381. [Google Scholar] [CrossRef] [Scilit]
- Vuorikari, R.; Punie, Y.; Cabrera, M. Emerging Technologies and the Teaching Profession: Ethical and Pedagogical Considerations Based on Near-Future Scenarios; Publications Office of the European Union: Luxembourg, 2020. [Google Scholar] [CrossRef] [PubMed]
- UNESCO. AI Competency Framework for Teachers; United Nations Educational, Scientific and Cultural Organization: Paris, France, 2024; ISBN 978-92-3-100707-1. [Google Scholar] [CrossRef] [Scilit]
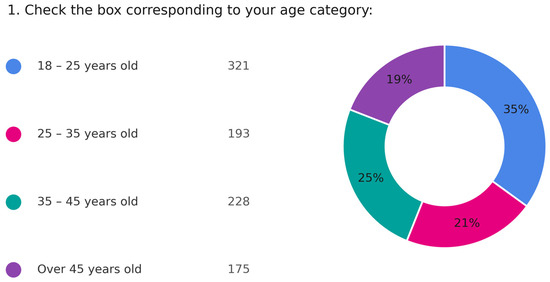
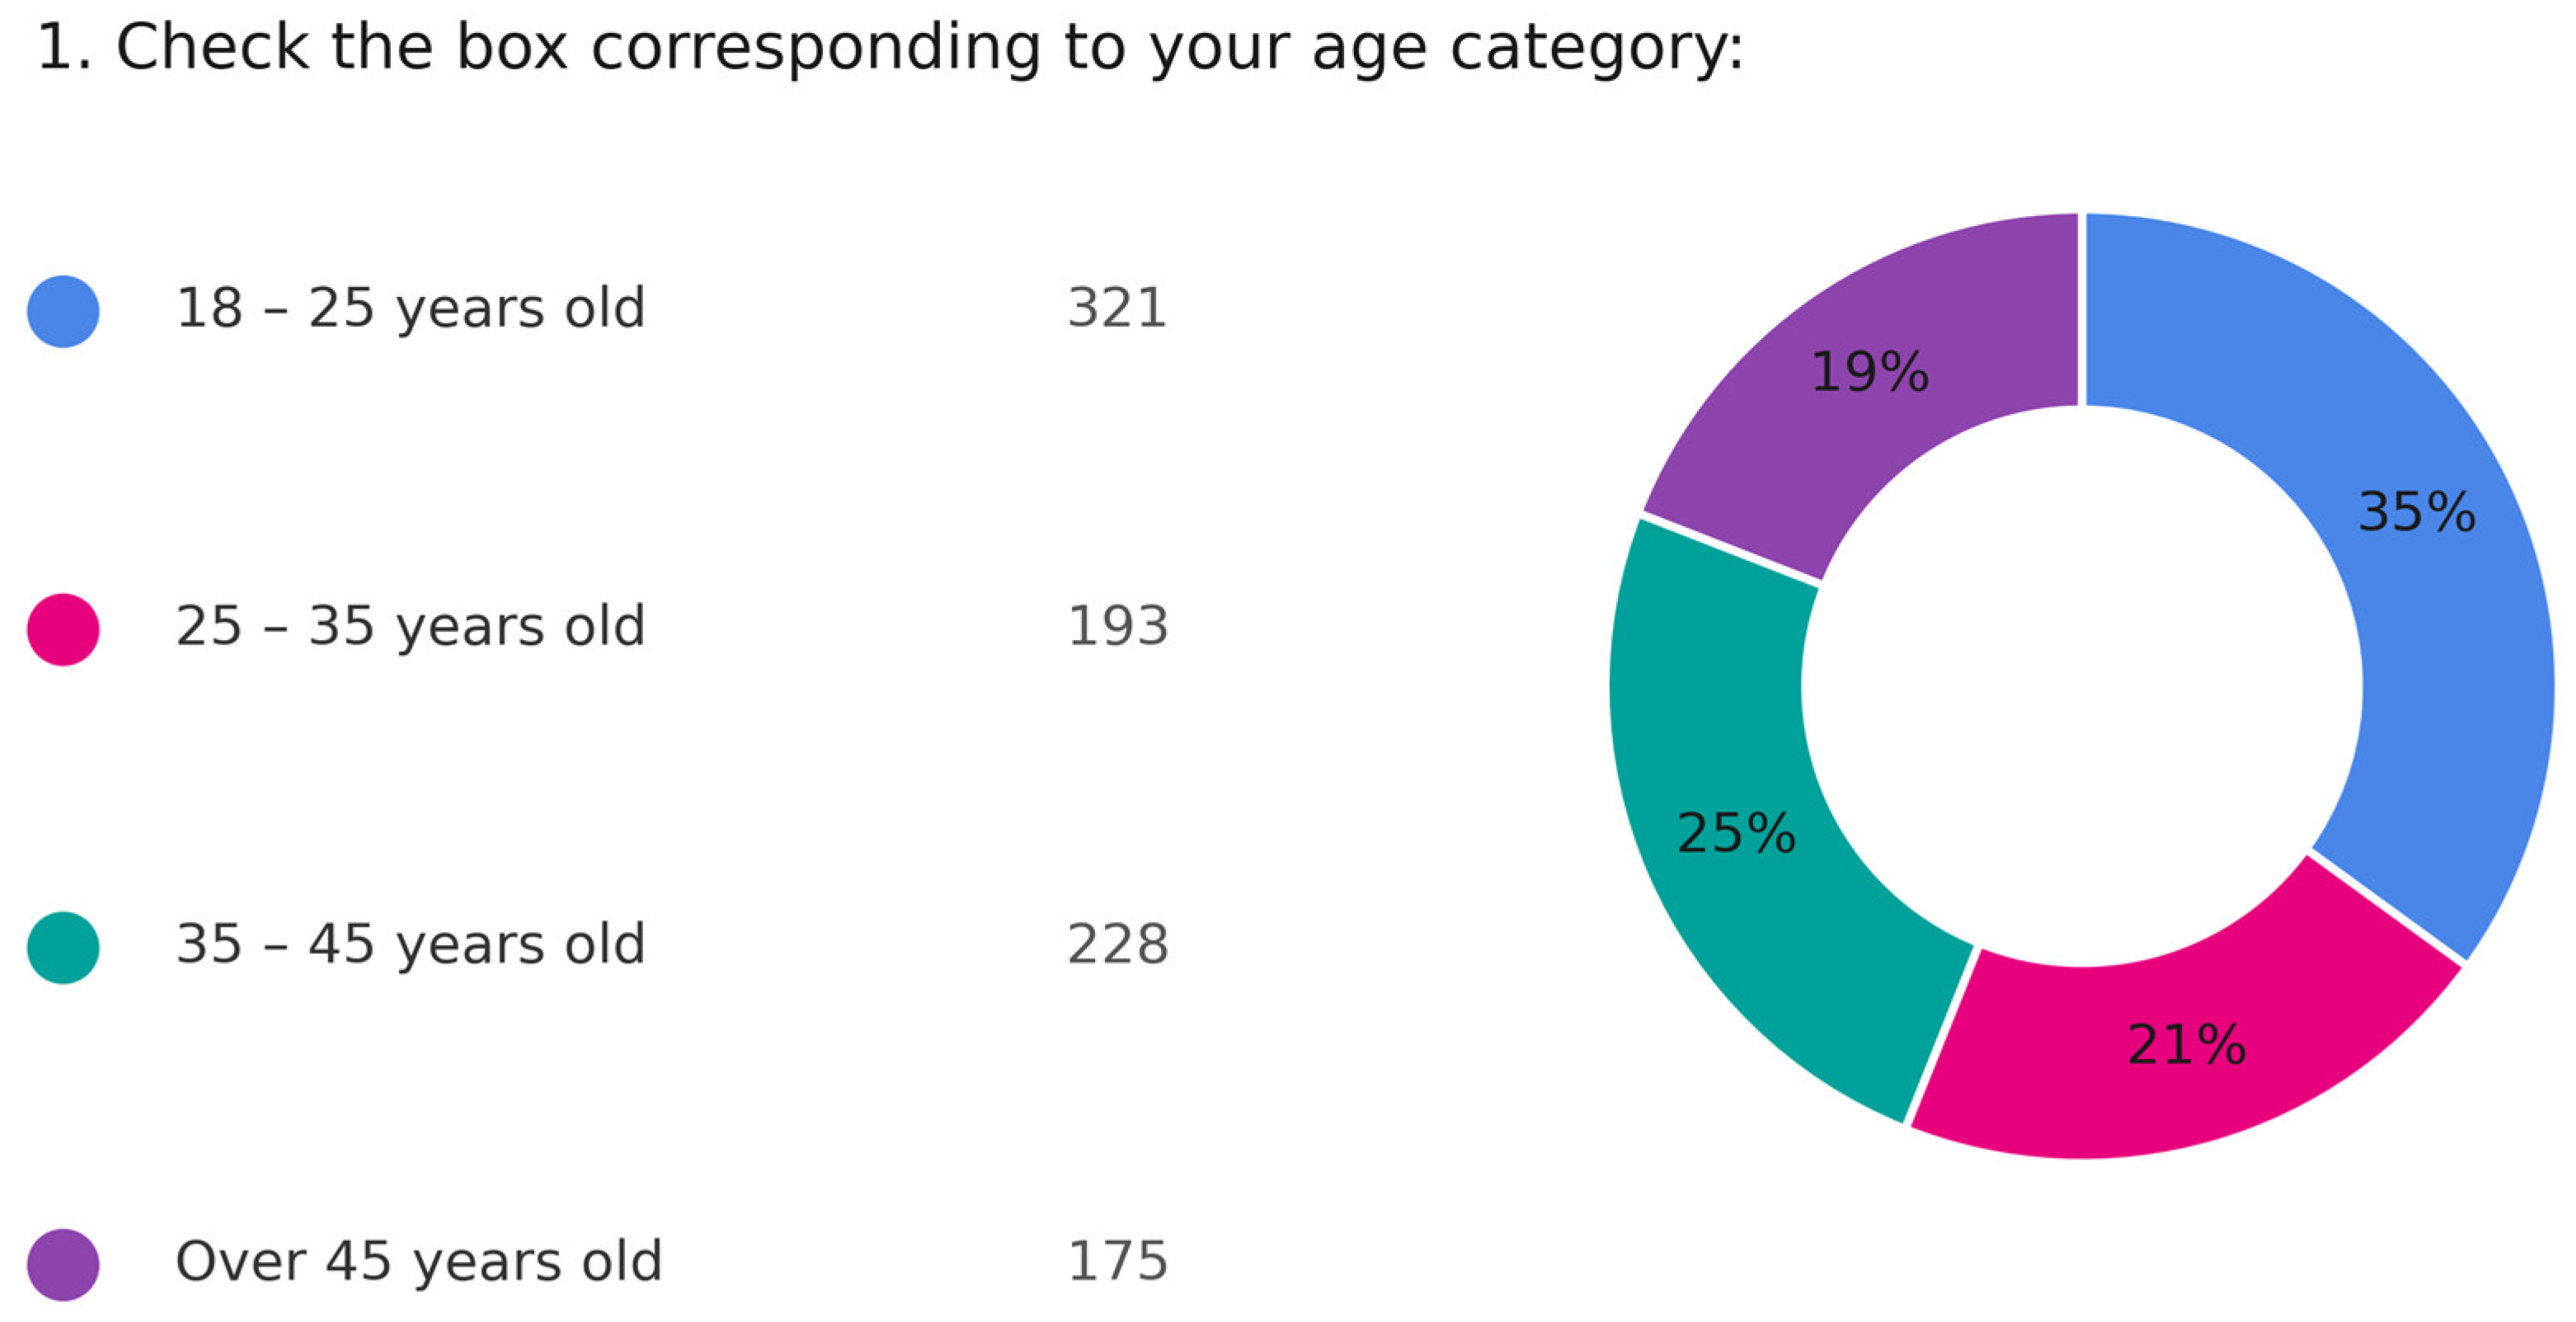
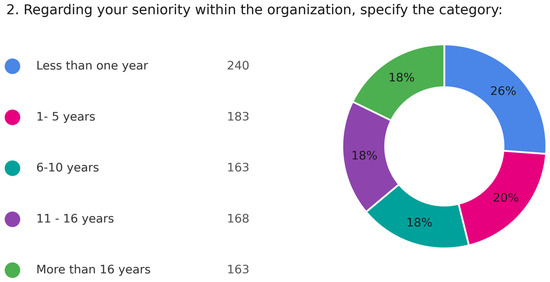
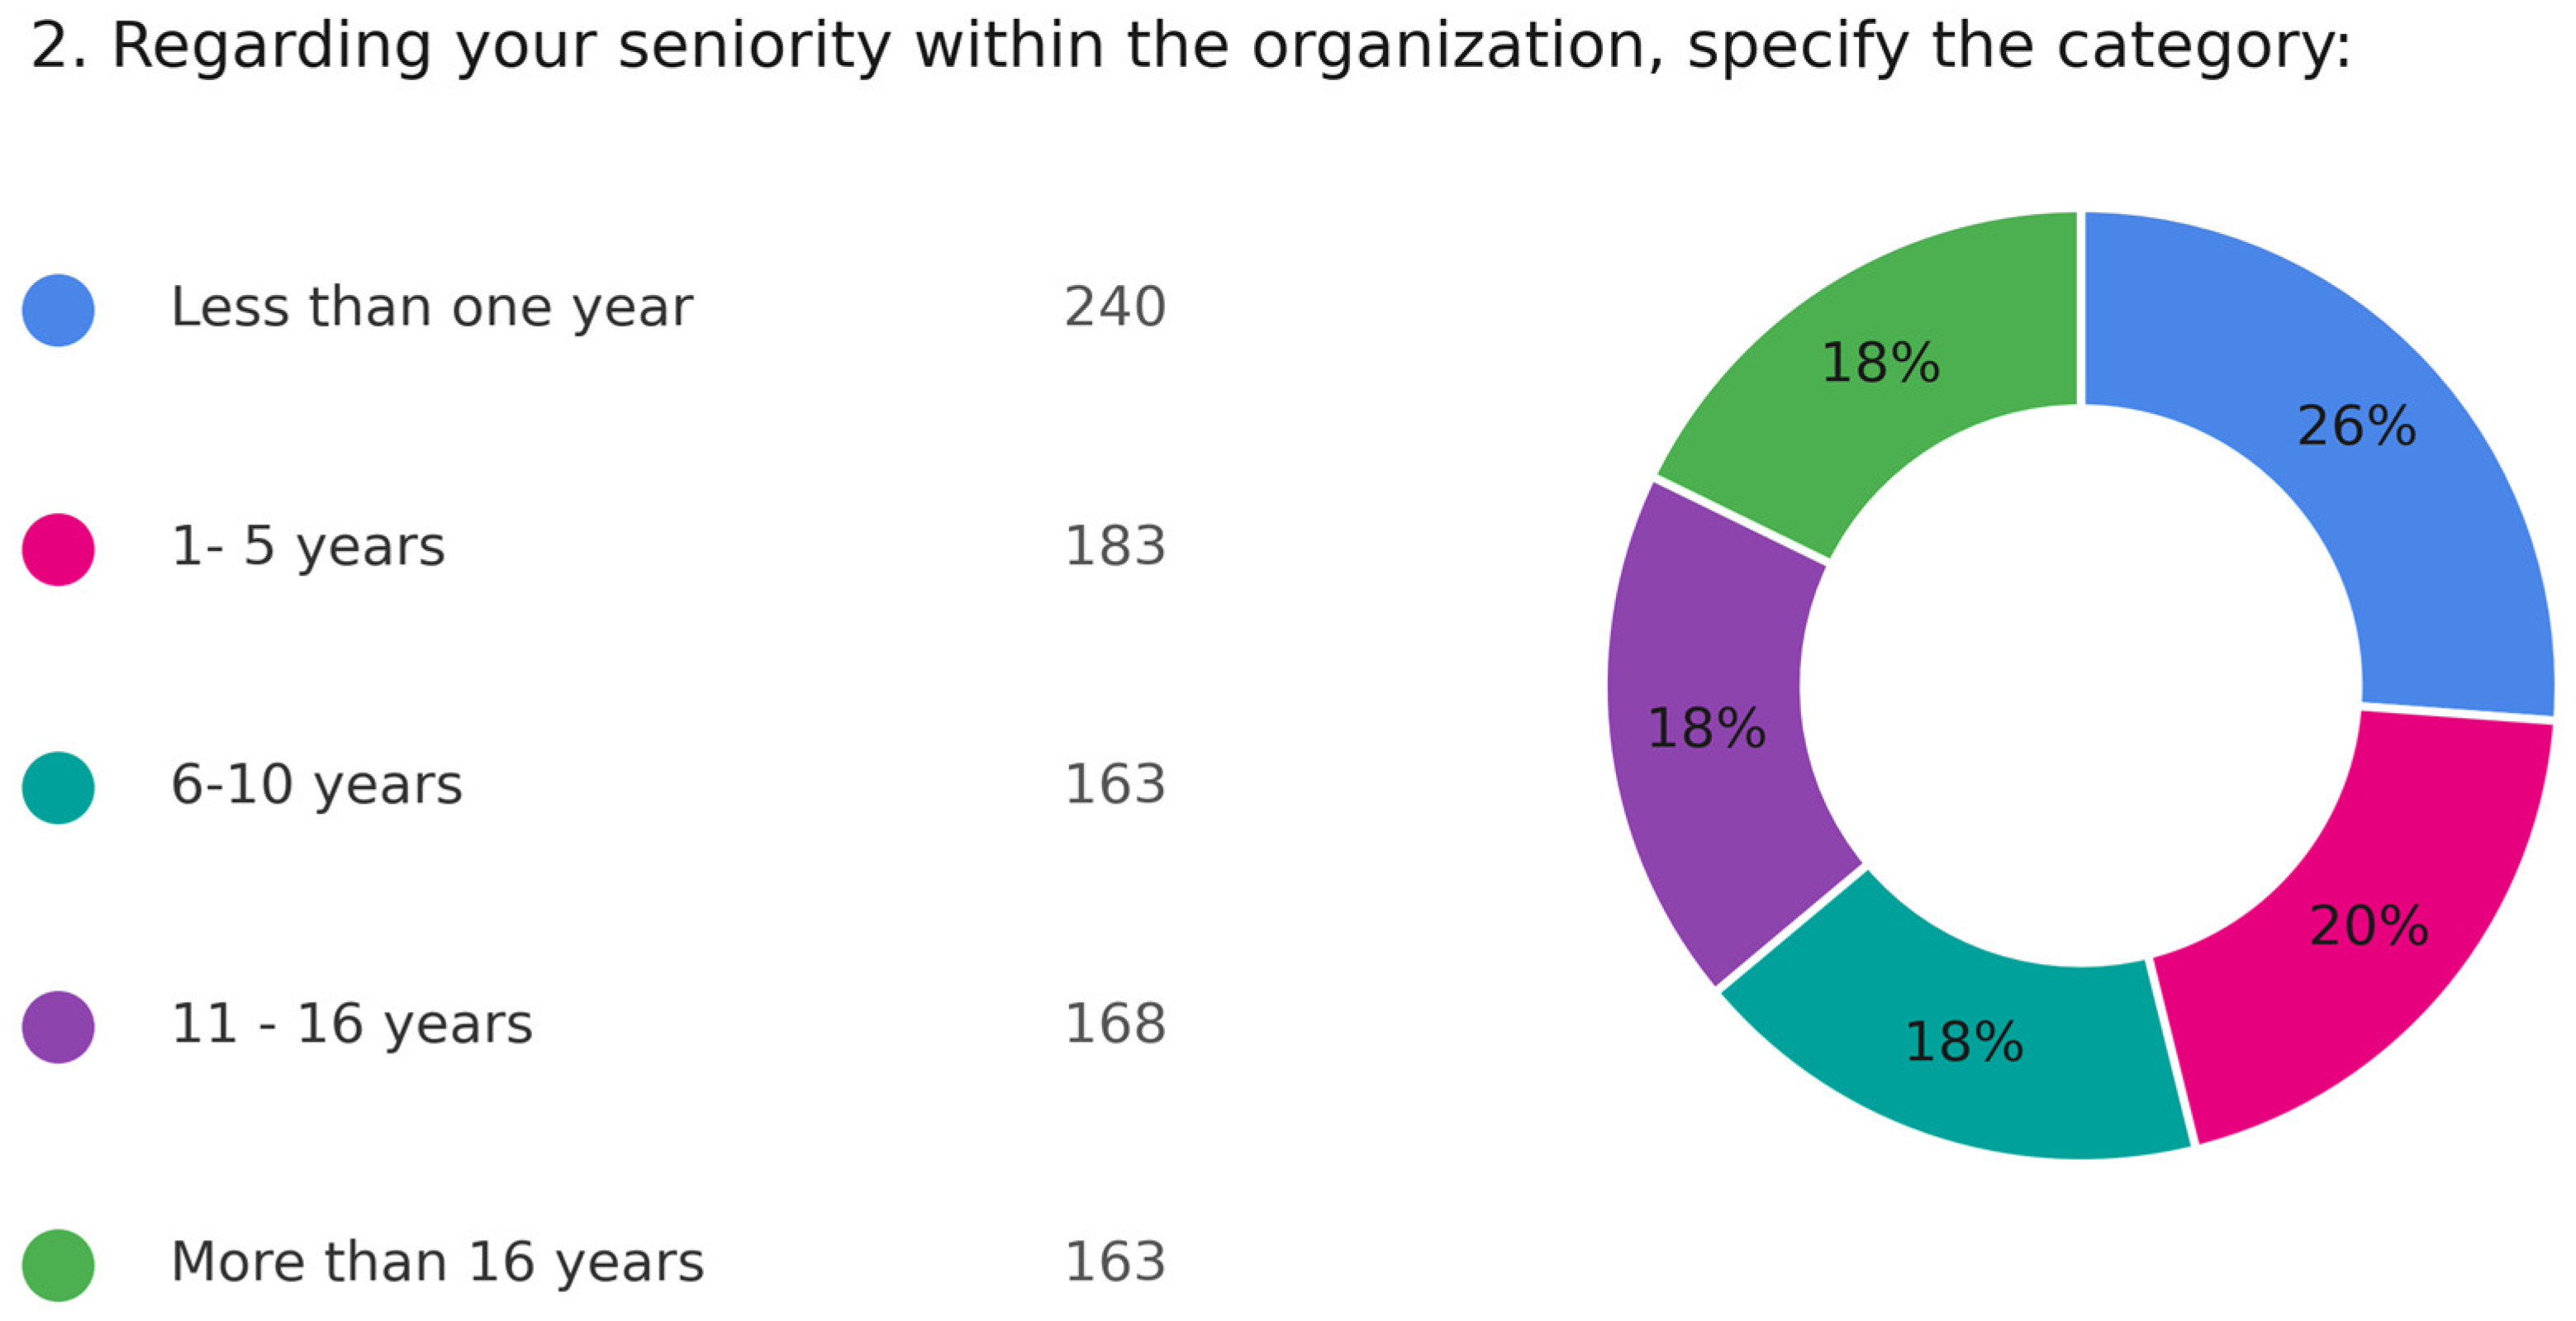
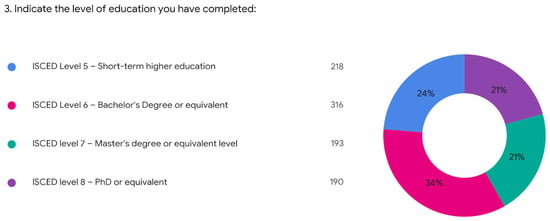
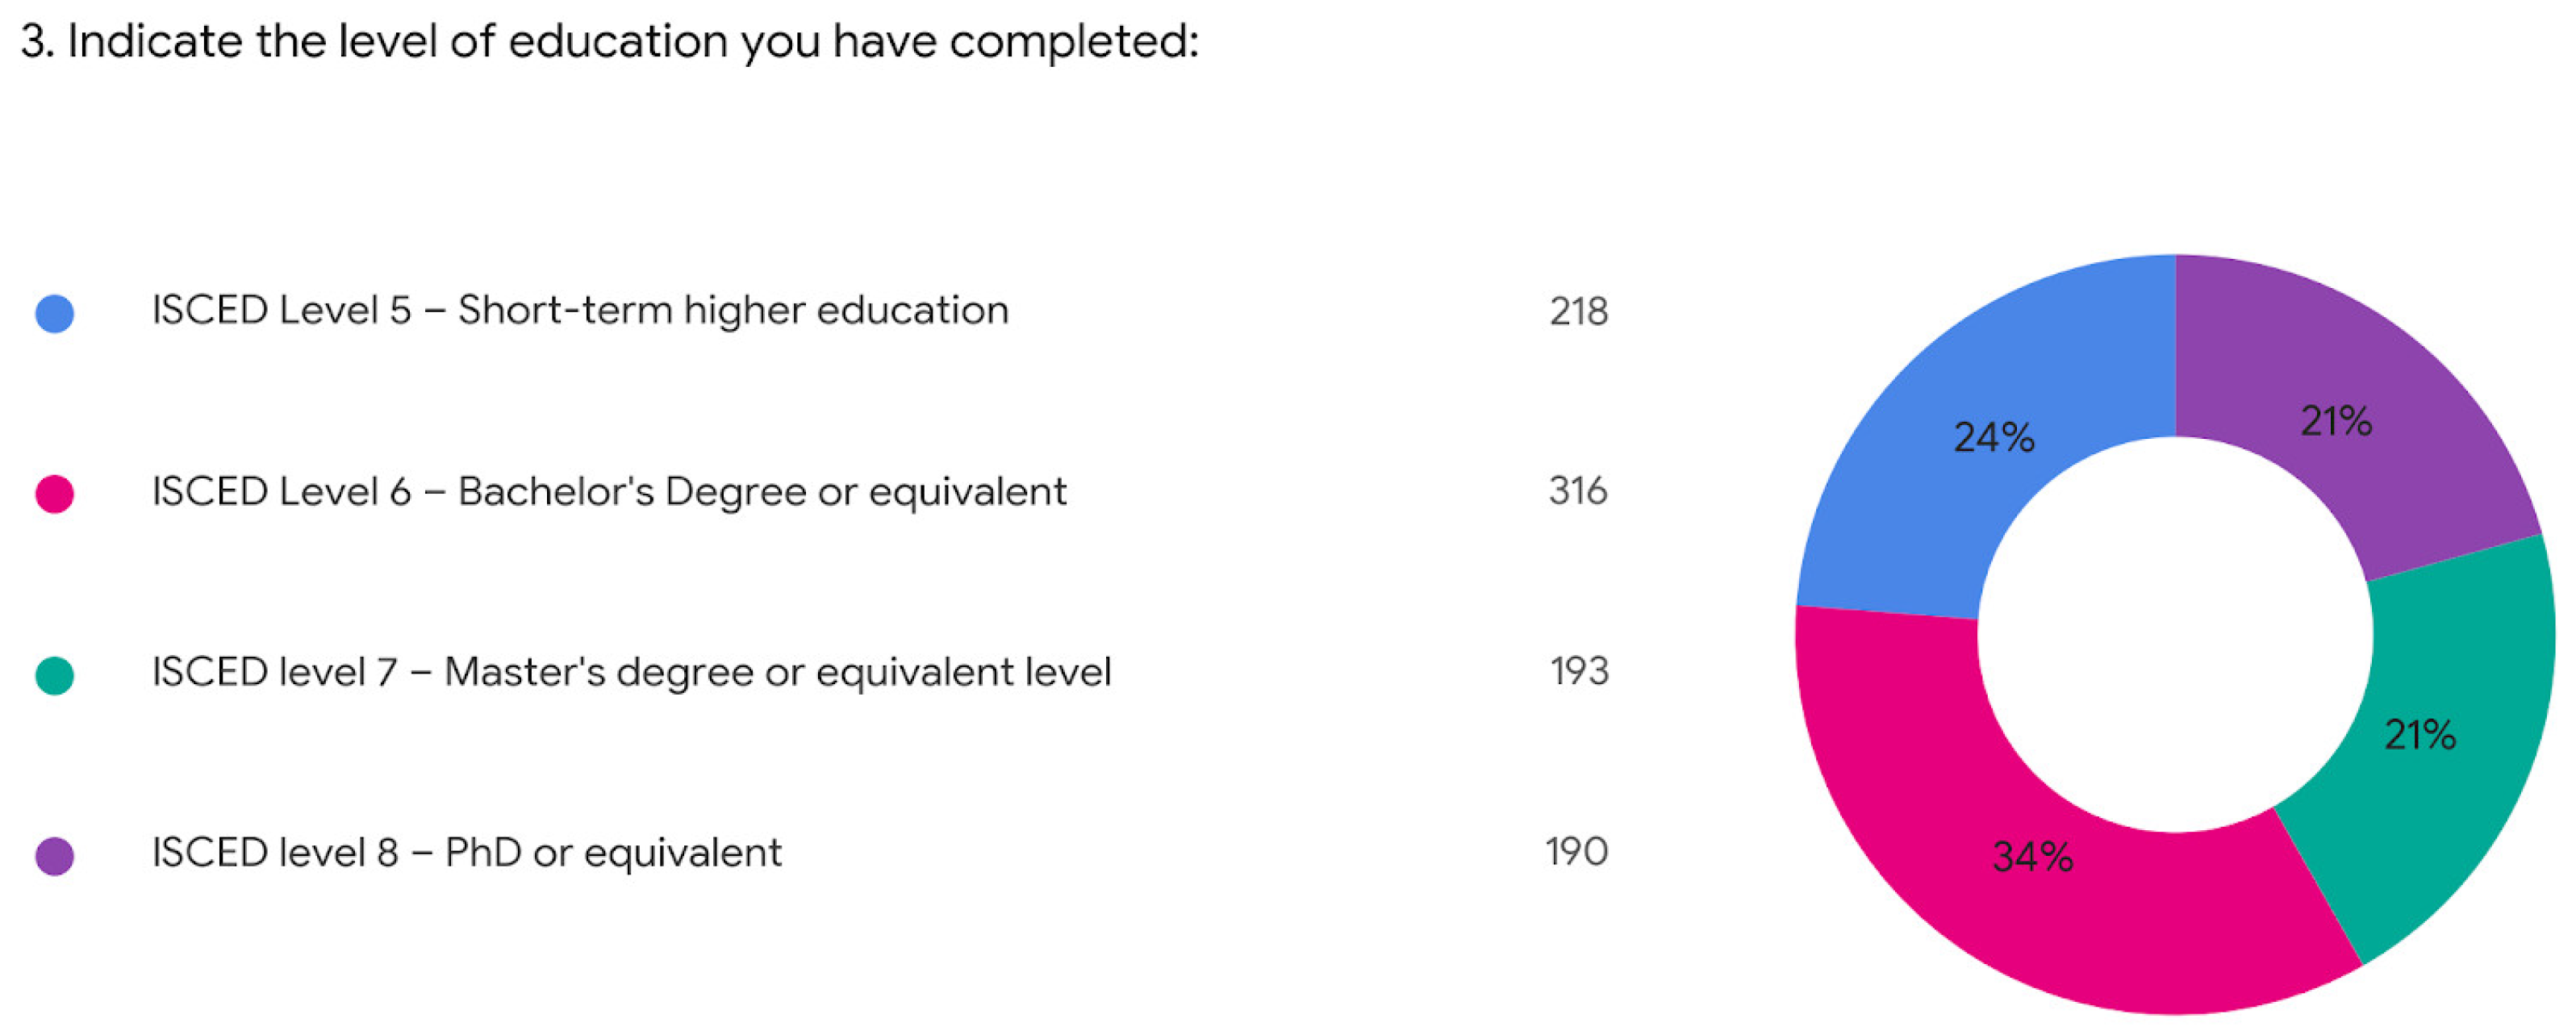
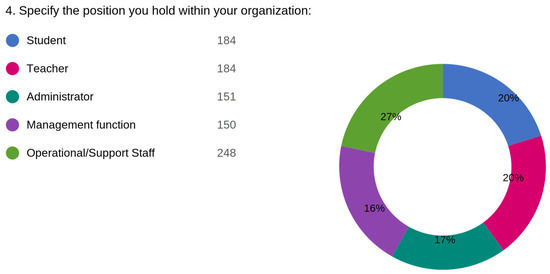
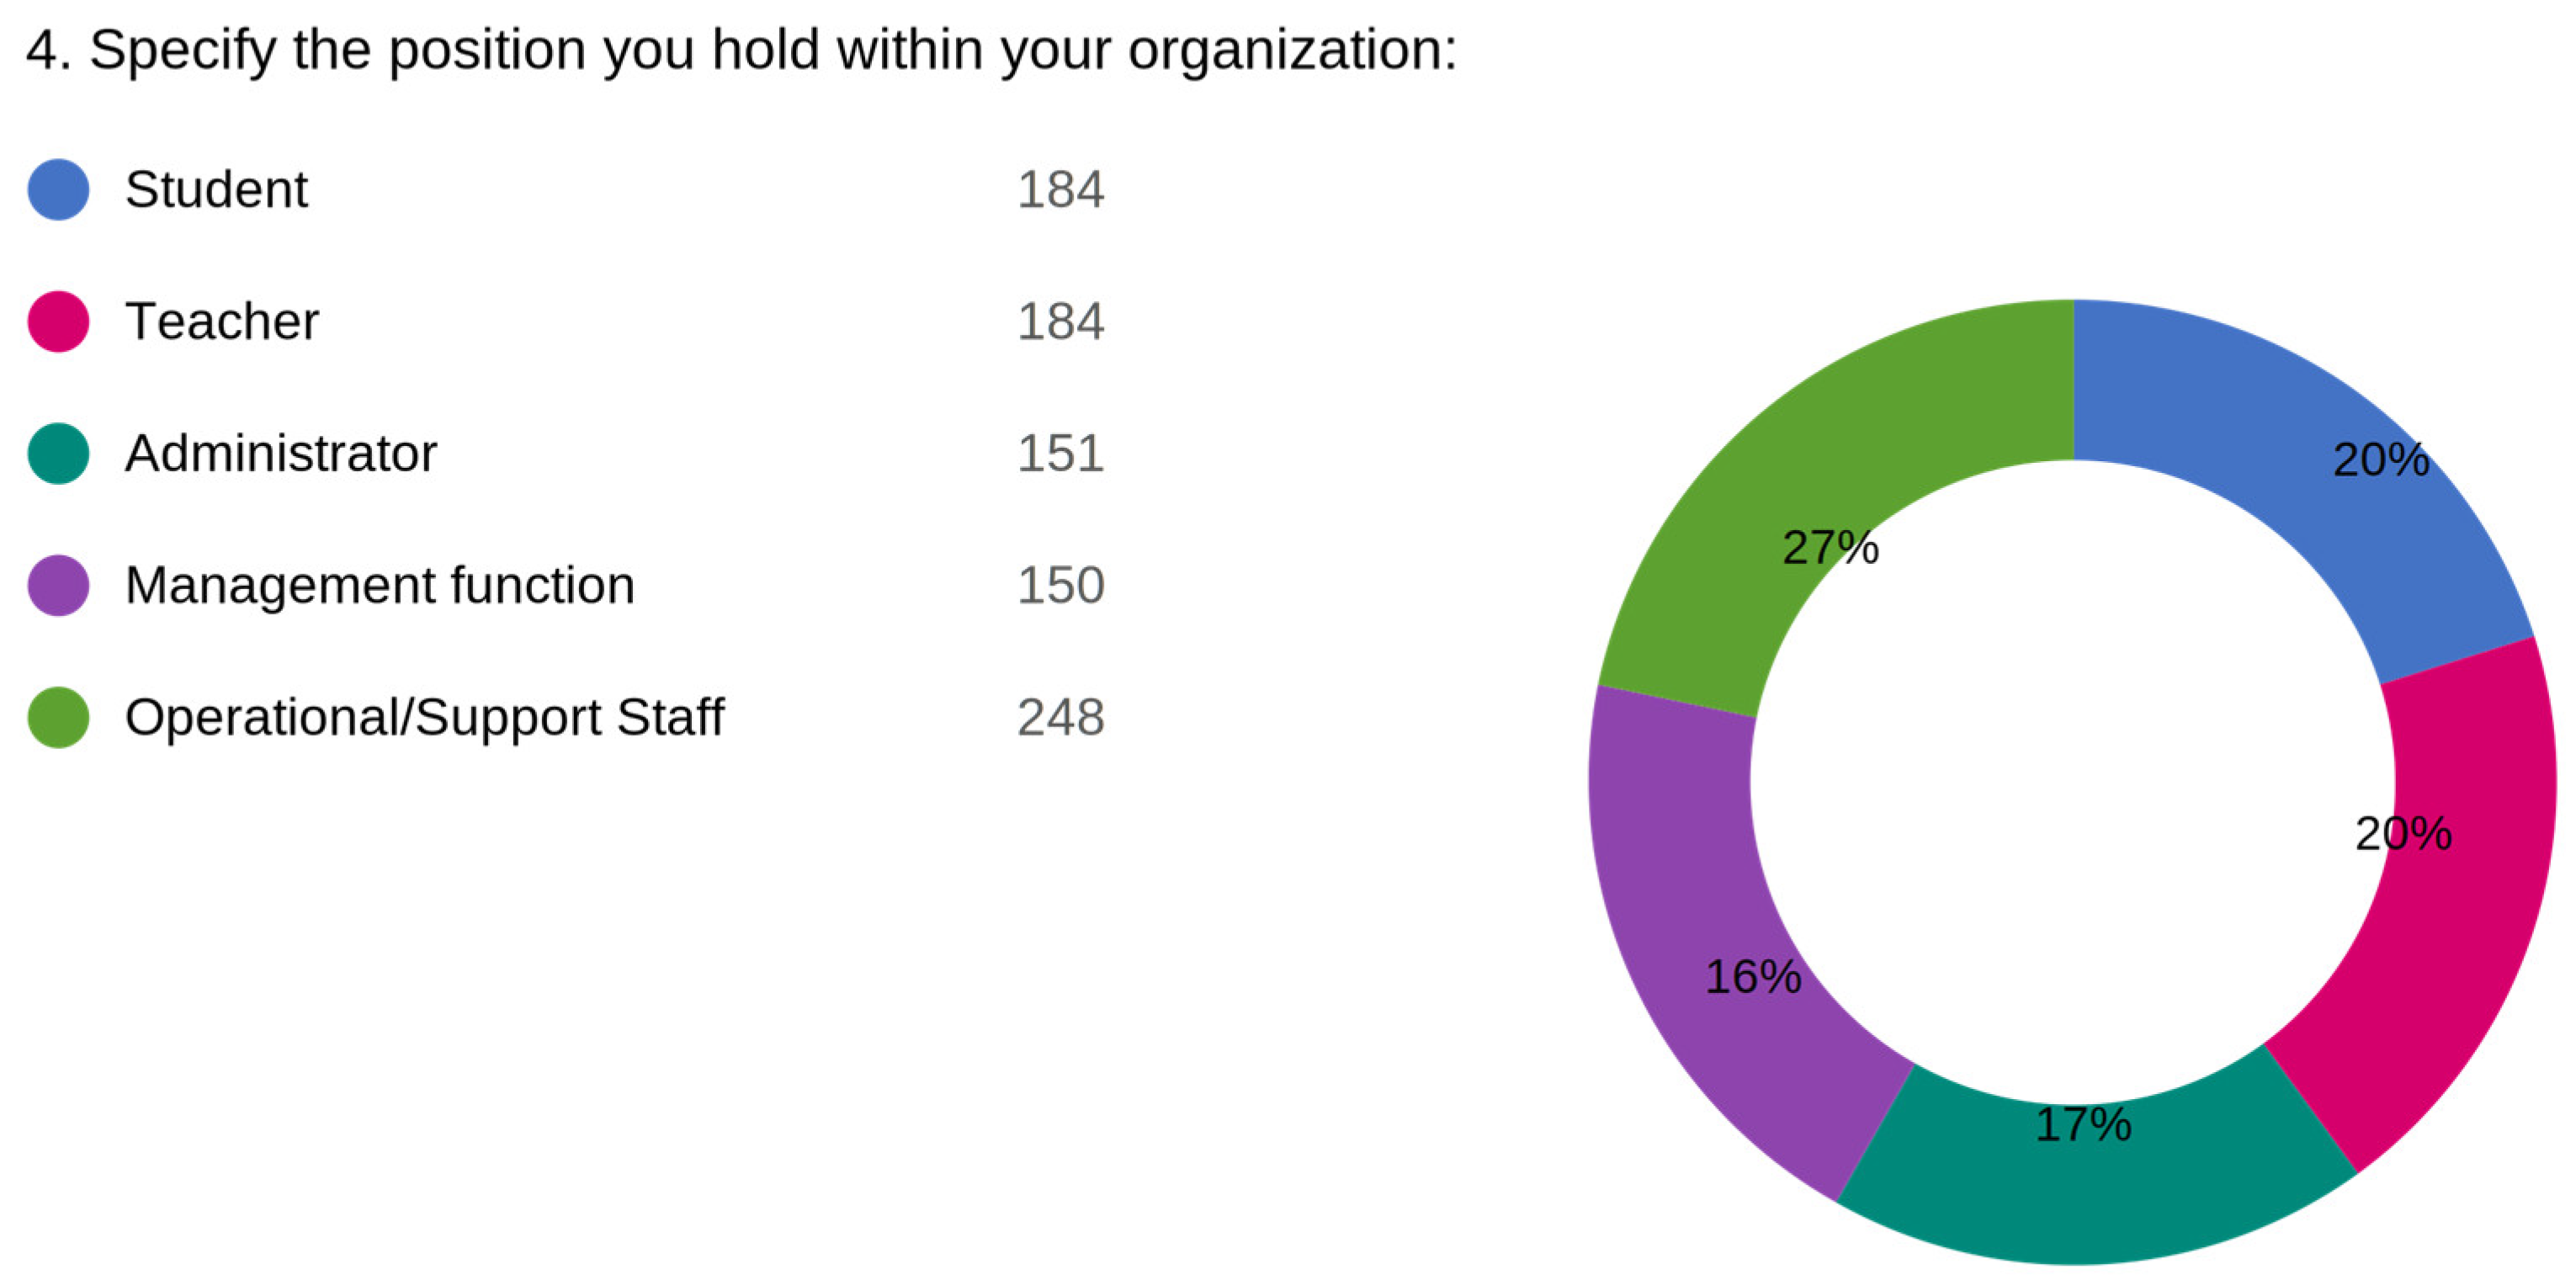
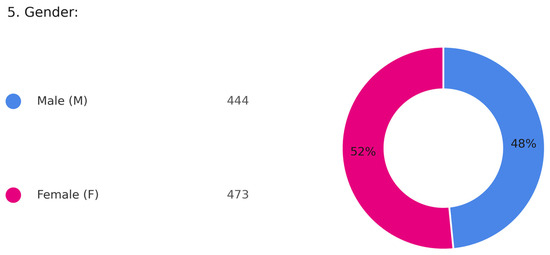
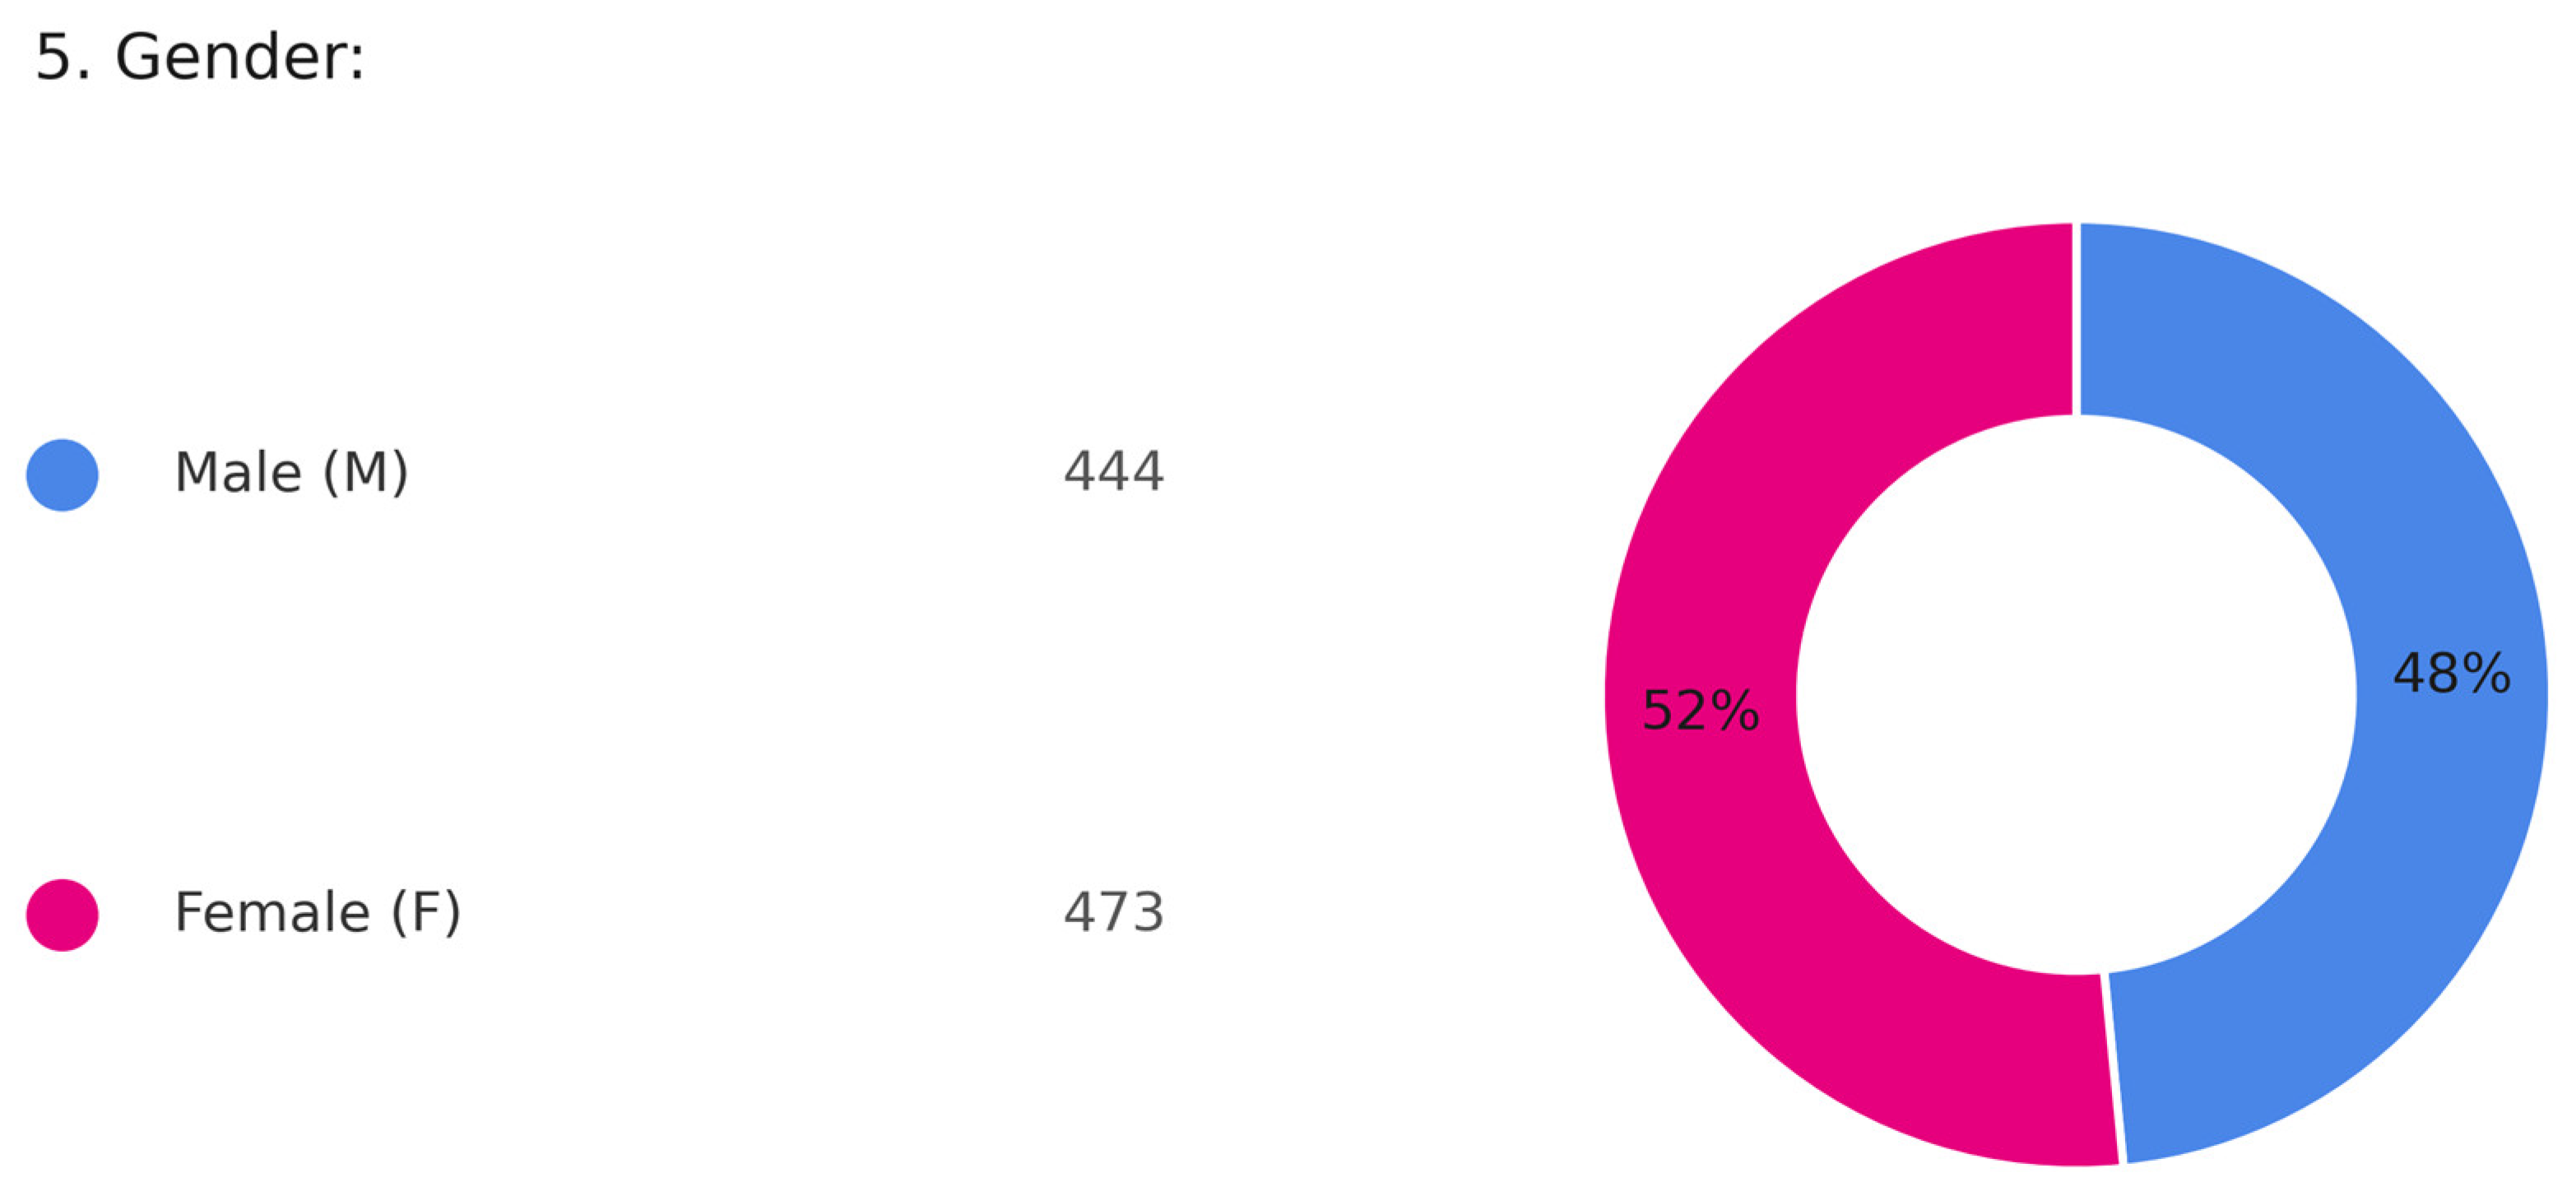
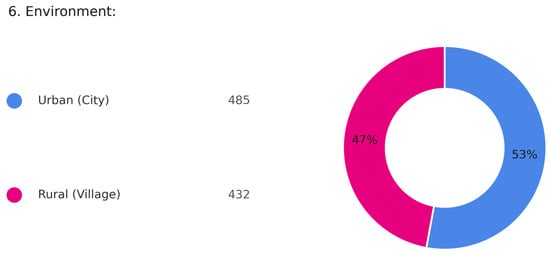
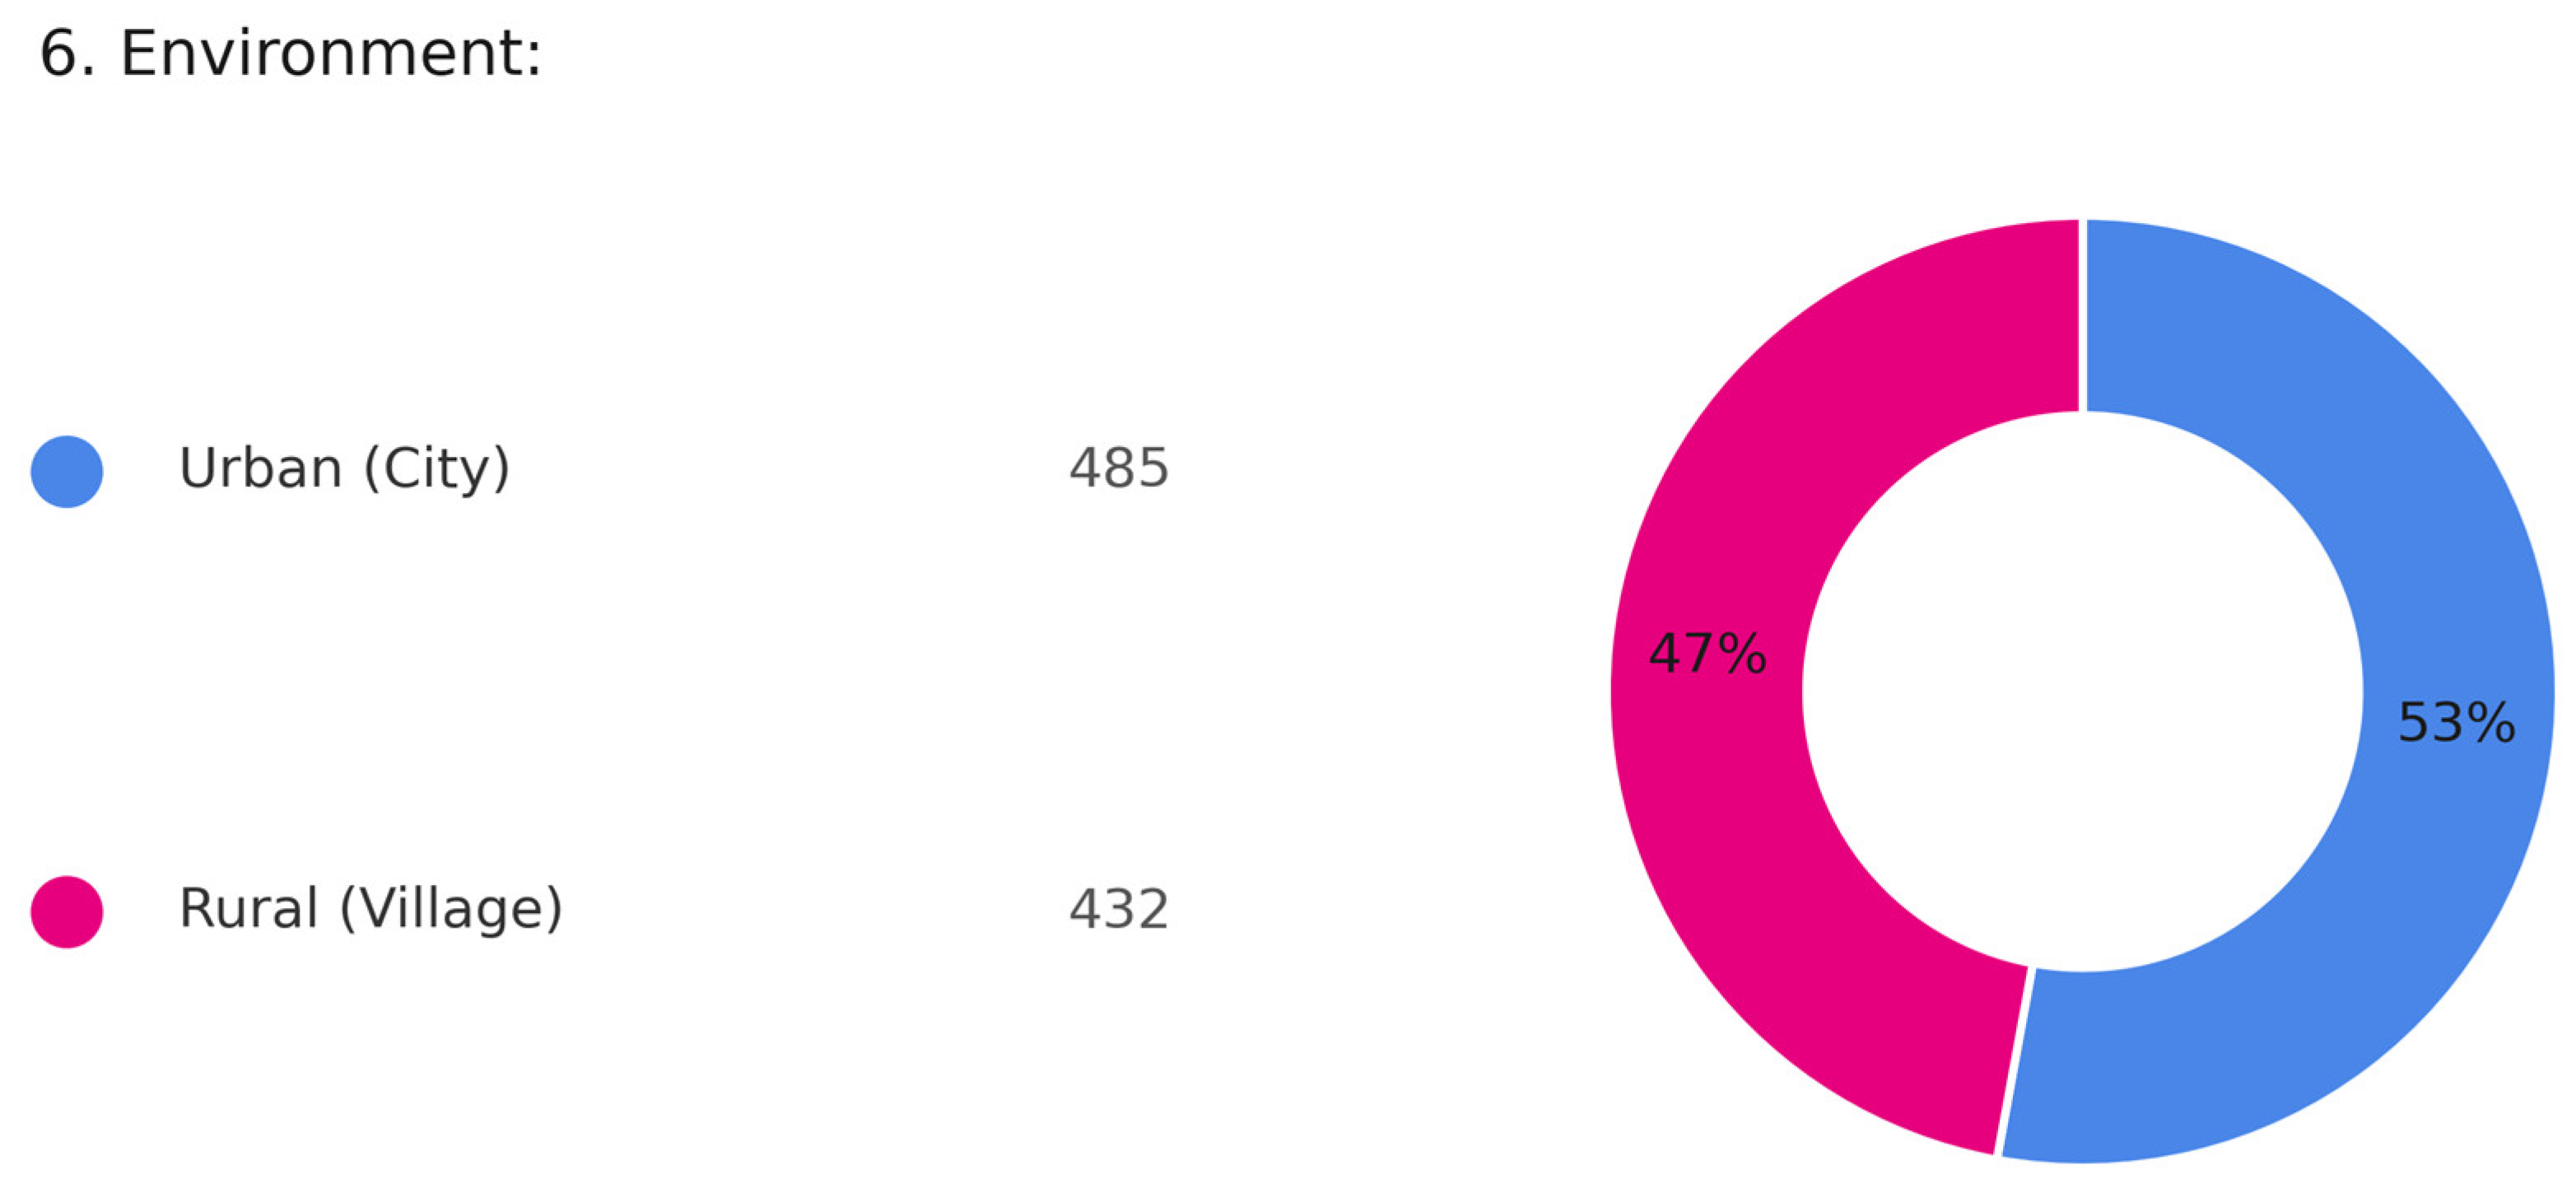
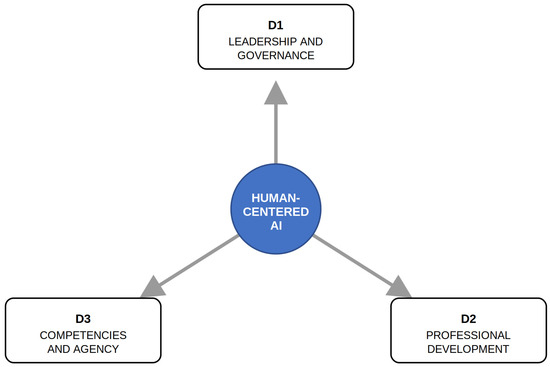
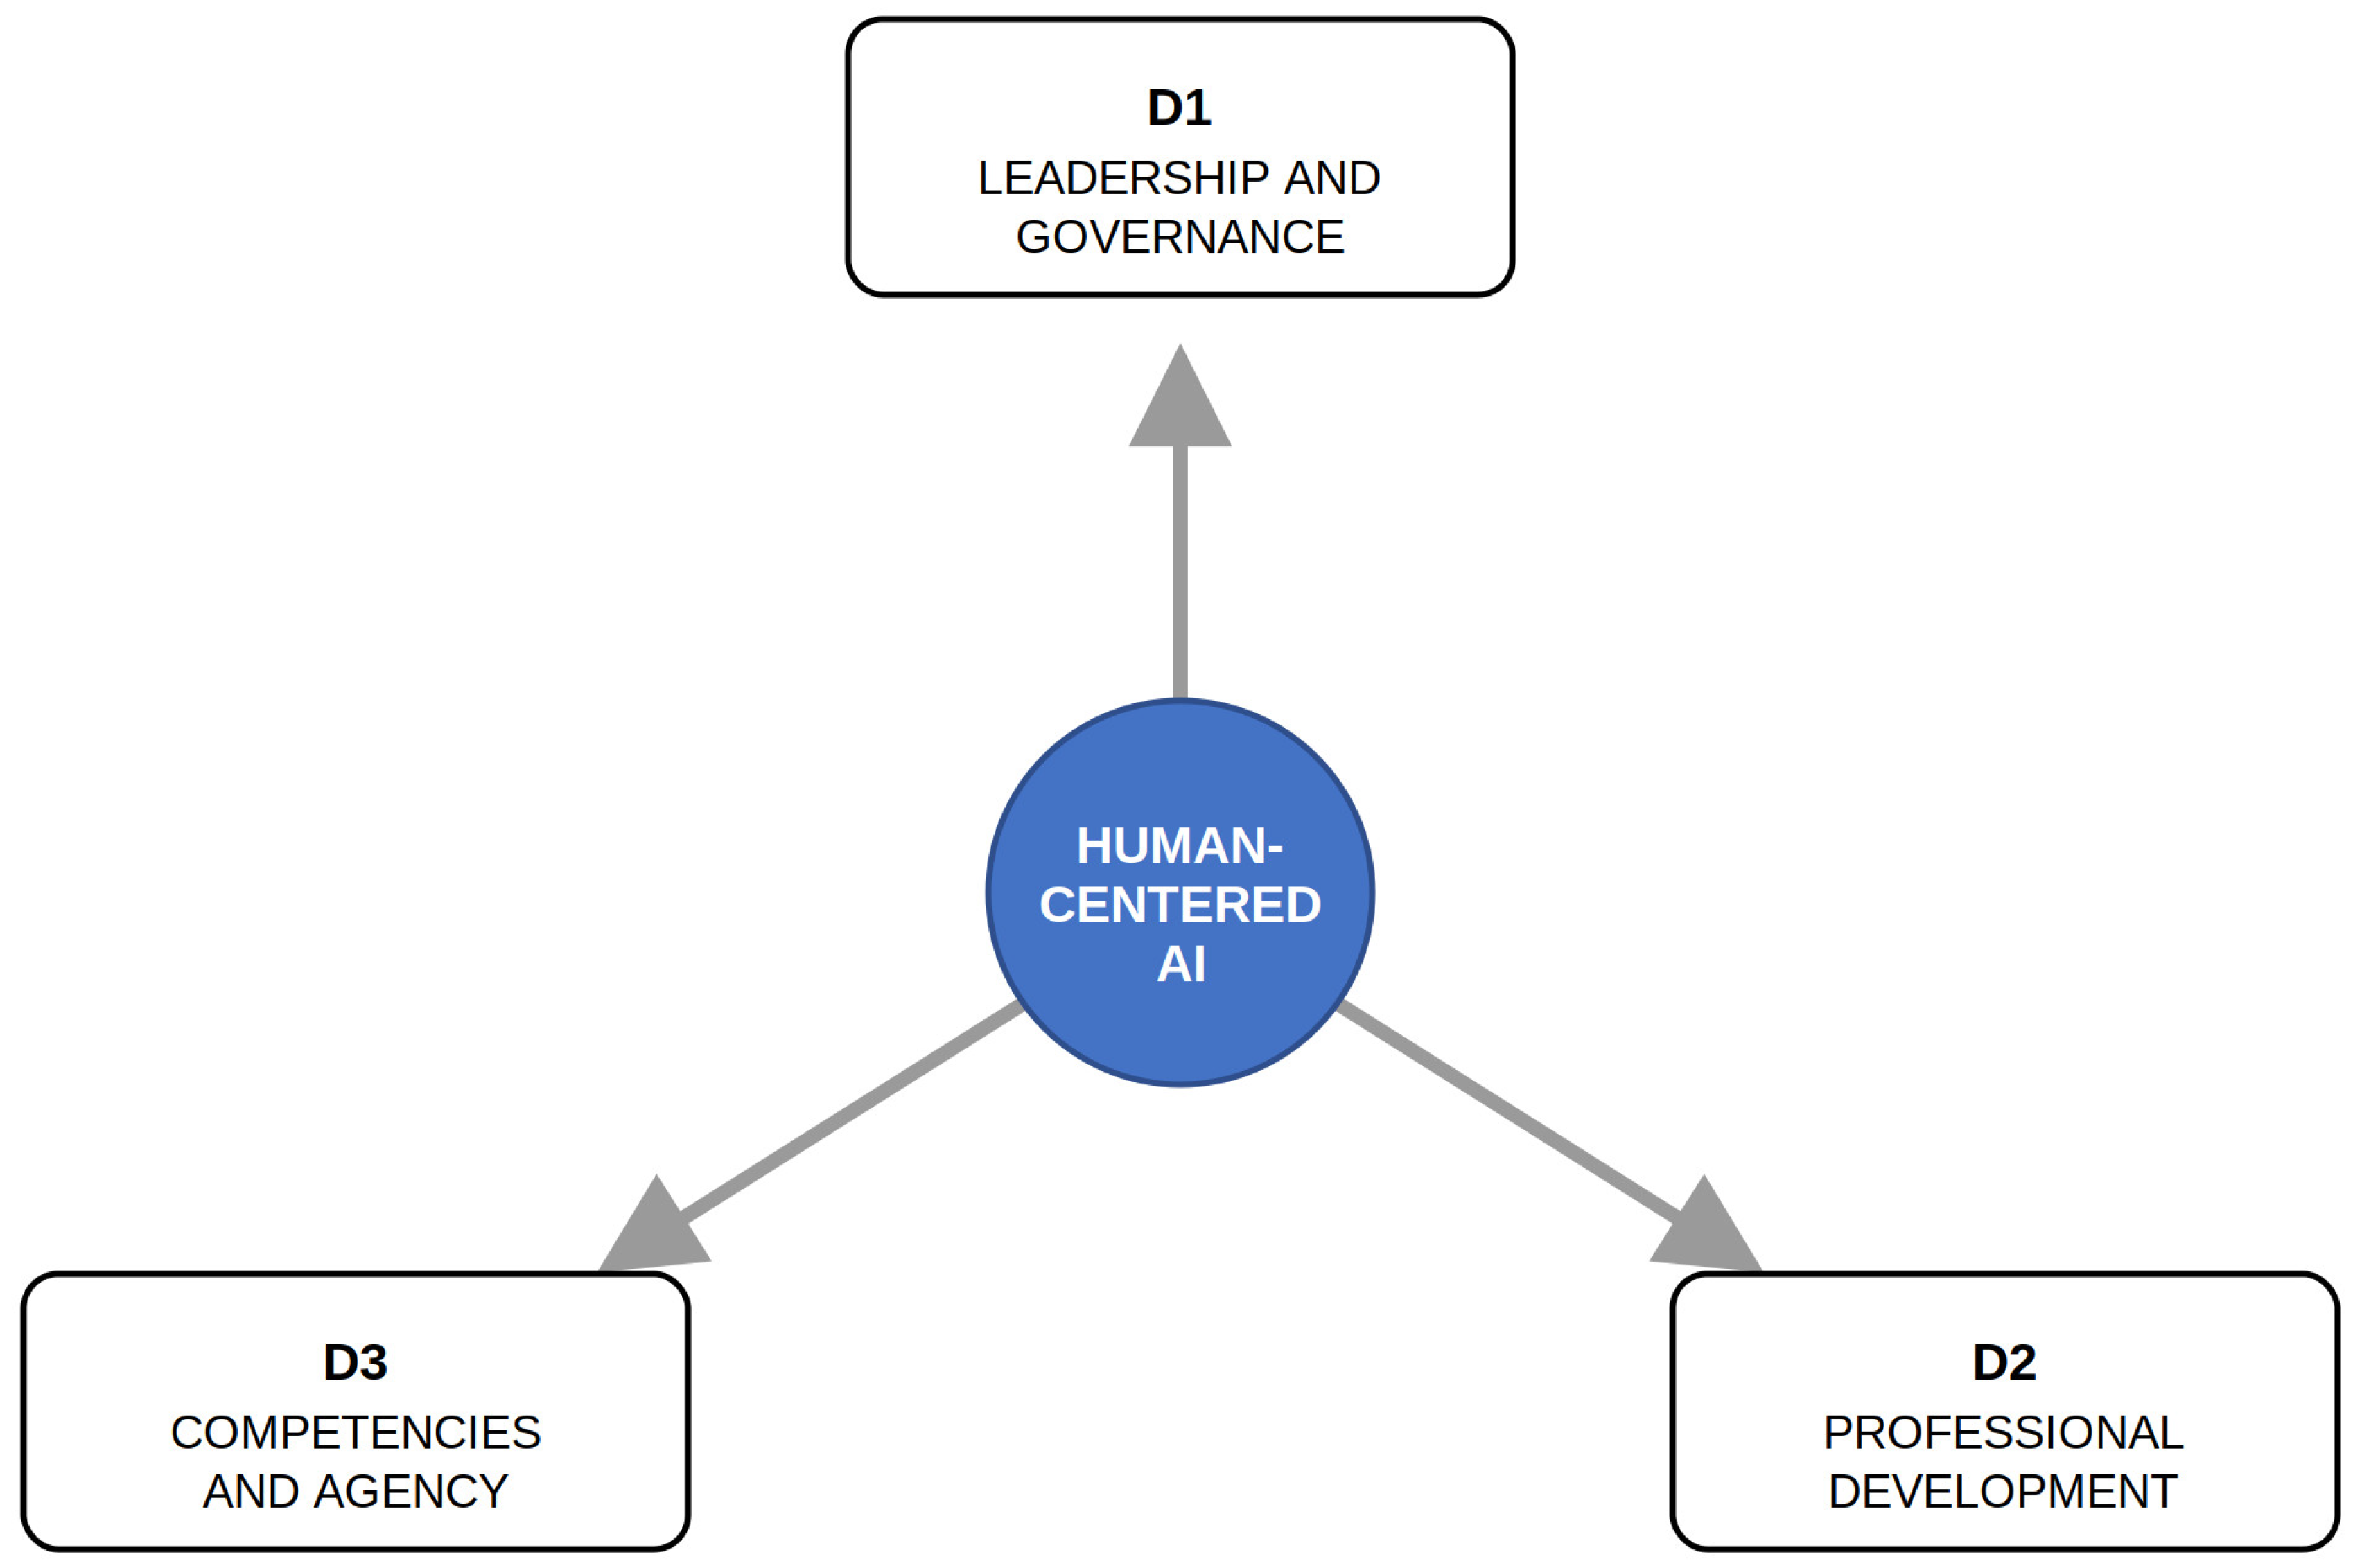
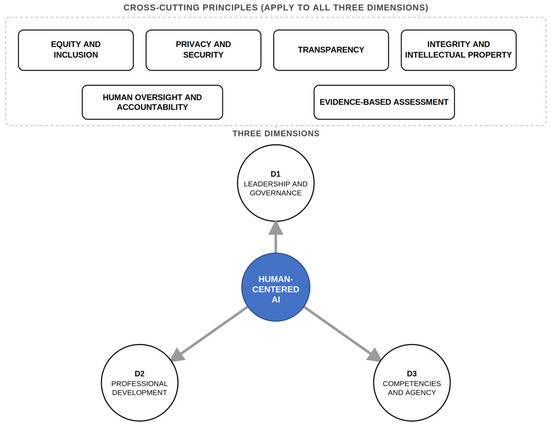
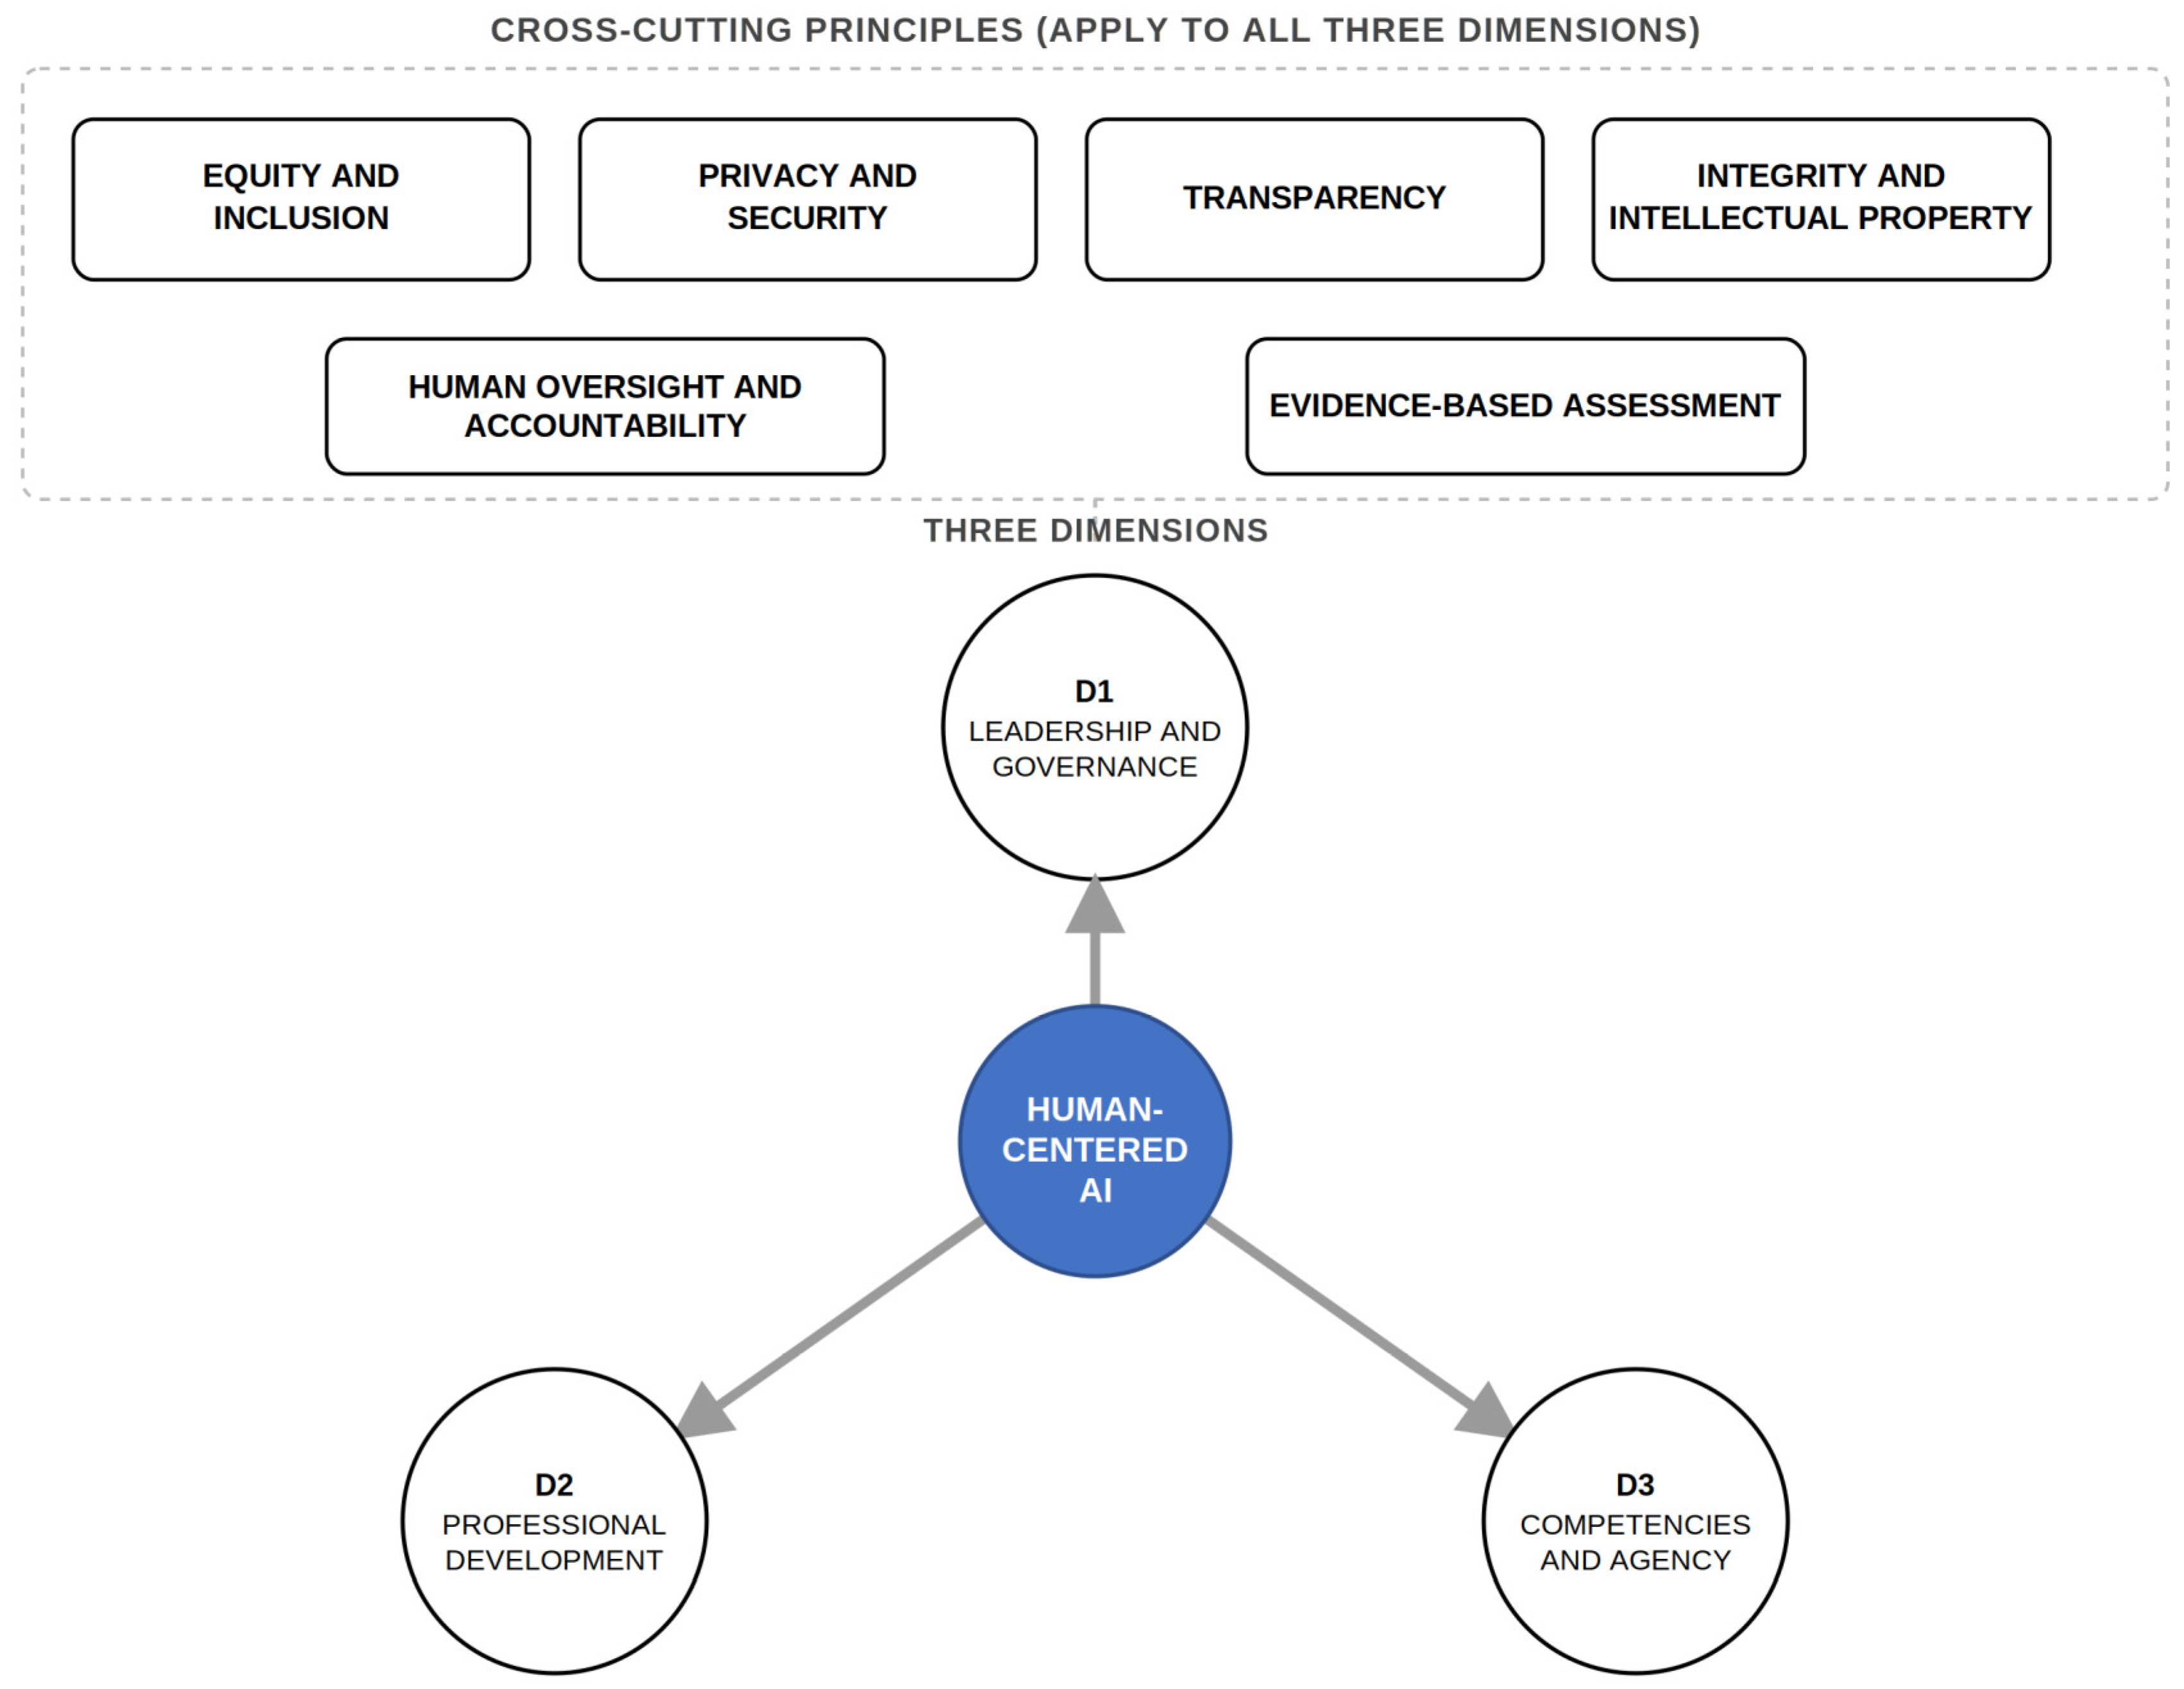

Disclaimer/Publisher’s Note: The statements, opinions and data contained in all publications are solely those of the individual author(s) and contributor(s) and not of MDPI and/or the editor(s). MDPI and/or the editor(s) disclaim responsibility for any injury to people or property resulting from any ideas, methods, instructions or products referred to in the content. |
© 2026 by the authors. Licensee MDPI, Basel, Switzerland. This article is an open access article distributed under the terms and conditions of the Creative Commons Attribution (CC BY) license.