


Abstract
This study presents an age-based gravity-model framework that applies the conventional gravity model under different age-group population scenarios to examine trip distribution patterns (spatial interaction patterns) in a high-density urban environment. Gaza Governorate was selected as the study area due to its high population density, constrained spatial structure, and intensive daily mobility demands. Data were collected in 2023 through a household survey involving 600 households, direct observation of passenger movements, and travel impedance data consisting of travel distance and travel time between study areas. Age-group populations were classified into three categories (0–14 years, 15–64 years, and 65 years and above) and incorporated as demographic mass variables within separate gravity-model scenarios. Model performance was evaluated using Pearson correlation (R), coefficient of determination (R2), Root Mean Square Error (RMSE), Mean Absolute Error (MAE), and Mean Absolute Percentage Error (MAPE). The validation results demonstrated acceptable to strong agreement between the survey-derived and observed OD matrices across all age groups. Following calibration, the gravity model successfully reproduced the general spatial concentration of observed trip distribution patterns between origin–destination (OD) zones within the study area. The conventional model and the 15–64 and 0–14 age-group scenarios exhibited moderate explanatory capability. Among the evaluated scenarios, the 15–64 age group achieved the highest coefficient of determination (R2 = 0.518), followed by the 0–14 group (R2 = 0.485), while the 65+ group achieved the lowest value (R2 = 0.339). The results indicate that age composition is associated with variations in the strength and predictability of aggregated transportation interaction patterns, although the overall spatial interaction structure remained broadly consistent across all age groups. The findings suggest that applying the conventional gravity model under age-group population scenarios provides a useful exploratory framework for analysing transportation interactions in data-constrained, high-density urban environments. The proposed framework contributes to the growing literature on age-related mobility by demonstrating how age-group population structures can be incorporated into a conventional OD-based gravity-model framework for comparative trip distribution analysis and may support evidence-based and sustainable trip distribution modelling for transportation planning in data-constrained urban environments. The proposed framework provides an interpretable and data-efficient approach for supporting sustainable urban transportation planning by improving the understanding of age-specific trip distribution patterns in data-constrained high-density urban environments.
1. Introduction
Densely populated urban areas place considerable pressure on transportation systems due to concentrated travel demand, limited infrastructure capacity, and complex mobility patterns. Understanding how transportation interactions are distributed between origins and destinations is therefore essential for supporting efficient and sustainable transportation planning. Spatial interaction models provide a useful analytical framework for examining the relationship between population distribution, travel impedance, and movement patterns within urban systems.
In transportation planning, the gravity model is most commonly applied within the trip distribution stage of the conventional four-step travel demand modelling framework, where it is used to estimate the spatial distribution of trips between origin and destination zones. In the present study, the model is applied within this context while examining age-group population structure as an alternative demographic input to the trip distribution process.
Among these models, the gravity model has been widely applied in transportation, geography, and urban planning to represent interactions between locations as a function of population size and travel resistance. Previous studies have primarily focused on spatial variables such as distance, travel time, accessibility, and network characteristics. While these approaches have improved the understanding of transportation flows, comparatively limited attention has been given to the role of demographic structure in shaping aggregated spatial interaction patterns, particularly in high-density urban environments.
Age composition represents a fundamental demographic characteristic that may influence the distribution and intensity of transportation interactions. Different age groups are associated with different activity requirements, service needs, and mobility opportunities [1,2]. However, most gravity-model applications continue to rely on total population measures, providing limited insight into how age-group population structures are associated with transportation interaction patterns under a consistent modelling framework. This represents an important research gap, particularly in data-constrained urban contexts where detailed behavioural information is often unavailable. While previous studies have primarily examined age-related travel behaviour, trip frequency, and mode choice [1,2,3], comparatively limited attention has been given to incorporating age-group population structure into OD-based gravity-model frameworks.
Accordingly, this study presents an age-based gravity-model framework that applies the conventional gravity model under different age-group population scenarios to comparatively evaluate the explanatory capabilities of different age-group population structures in reproducing aggregated transportation interaction patterns in Gaza Governorate, a high-density urban area characterized by constrained spatial development and intensive daily mobility demands. Unlike conventional gravity-model applications that employ total population as the demographic mass component, the proposed framework incorporates age-group populations as alternative demographic representations and evaluates their associations with observed transportation interaction patterns.
The analysis focuses on three age groups (0–14 years, 15–64 years, and 65 years and above). Separate model scenarios are developed, calibrated, and validated using observed origin–destination (OD) passenger-flow data. The study contributes to the spatial interaction literature by providing a calibrated age-based gravity-model framework and by examining how variations in age composition are associated with differences in aggregated transportation interaction patterns. It also extends the growing body of age-related mobility research by incorporating age-group population structure into an OD-based gravity-model framework. The findings may support evidence-based and sustainable transportation planning in high-density urban environments.
2. Literature Review
2.1. Mobility and Spatial Interaction Patterns
Passenger mobility patterns are influenced by spatial and temporal factors, including station location, travel time, and route configuration [4,5,6], which shape interactions within transportation networks and broader urban mobility structures. While these studies provide valuable insights into operational and travel-related mobility dynamics, they primarily focus on spatial and temporal travel variables, with limited consideration of broader population characteristics in regional interaction patterns.
Recent studies have identified several determinants of travel behaviour, including residential location, workplace, and income, all of which influence travel frequency and public transport use [7]. However, these studies primarily examine individual mobility behaviour rather than aggregated population structures in high-density urban environments.
Despite these contributions, previous studies provide valuable insights into mobility patterns and spatial interaction structures. However, most rely primarily on travel-related and operational data, with limited consideration of aggregated population composition. Consequently, the relationship between population composition and aggregated spatial mobility patterns remains insufficiently explored in the existing literature.
Table 1 summarizes previous studies that examined travel patterns and passenger movements using aggregated mobility data, providing insights into spatial interaction structures in urban transportation systems. Table 2 further compares the analytical approaches used to extract travel attributes and interaction patterns, highlighting their methodological strengths and limitations.
Table 1.
Summary of previous studies on travel patterns and mobility analysis, including data sources, key findings, and relevance to population-based spatial interaction analysis.
Table 2.
Advantages and limitations of data analysis approaches used to examine travel attributes and spatial interaction patterns.
Age-Based Mobility
Age has long been recognized as an important factor influencing travel demand and mobility patterns. Previous studies consistently demonstrate that age influences mobility levels, trip frequency, and transportation mode choice across different urban contexts [1,2,3]. For example, analysis of Taiwanese travel data from 2008 and 2018 showed significant differences in mobility levels across age cohorts, with younger generations generally exhibiting higher travel activity than older populations [2]. Similarly, studies conducted in the Tokyo metropolitan area and the United States reported significant associations between age, trip frequency, and transportation mode choice [1,3]. Collectively, these findings highlight the importance of considering demographic transitions and age composition in transportation research.
Research has also shown that travel mobility is associated with life-course characteristics, generational differences, and broader demographic transitions, highlighting the importance of demographic composition in transportation studies [14,15,16,17,18]. Similarly, previous studies have shown that car-use patterns vary across population groups according to demographic characteristics such as age and life-cycle stage [3,19]. In addition, population ageing has been shown to exert an increasing influence on aggregate travel trends, further highlighting the importance of age composition in transportation analysis [20].
2.2. Gravity Model and Origin–Destination Representation
Origin–Destination (OD) matrices are commonly employed in transportation studies to characterize spatial interactions between geographic locations. By aggregating travel movements between origins and destinations, they enable the assessment of commuting patterns, interaction intensity, and the spatial distribution of travel demand across urban areas [8]. Consequently, OD matrices offer a practical framework for investigating regional mobility patterns beyond individual trip behavior.
Accordingly, OD data serve as an empirical foundation for spatial interaction models that explain travel flows through the relationships between origins, destinations, and travel impedance. Nevertheless, the explanatory capability of OD matrices alone may be constrained by data availability and aggregation effects [9,10].
The gravity model is one of the most widely used approaches for analyzing spatial interactions. It assumes that interaction intensity increases with the size of origin and destination populations and decreases with travel impedance, such as distance or travel time. Owing to its simplicity and effectiveness, the model has been extensively applied to investigate urban mobility patterns [21]. More recent studies have further extended the conventional gravity-model framework by incorporating spatial and temporal structures, spatial heterogeneity, and multi-source datasets, thereby improving its ability to represent complex urban mobility patterns [22,23,24,25].
Table 3 and Table 4 summarize previous studies on origin–destination representation and travel attribute extraction from mobility data, highlighting key methodological approaches, strengths, and limitations relevant to spatial interaction modelling.
Table 3.
Summary of origin–destination and gravity-based studies, including their treatment of population characteristics in spatial interaction analysis.
Table 4.
Advantages and limitations of analytical approaches used in mobility and spatial interaction studies.
A review of the studies presented in Table 3 reveals a consistent emphasis on spatial interaction structures, travel behavior, and mobility dynamics. However, population characteristics are generally treated as contextual variables rather than analytical components within spatial interaction modelling. This observation highlights an important gap in the literature and provides a rationale for examining age composition within an OD-based gravity-model framework.
2.3. High-Density Urban Environments and the Gaza Context
Urban areas accommodate a substantial proportion of the global population and concentrate diverse economic and social activities. Such concentrations play an important role in shaping travel demand, mobility directions, forms of interaction, and participation in social and recreational activities [30,31,32,33,34]. Furthermore, population movements within and between urban areas generate extensive social and economic connections and contribute to the exchange of knowledge, ideas, and innovation across locations [35,36,37,38].
Accordingly, numerous studies have examined mobility patterns in high-density urban environments to better understand the factors shaping transportation interactions. Studies conducted in several high-density Chinese cities, including Beijing, Shenzhen, and Shanghai, consistently demonstrate that dense urban environments provide valuable settings for analysing mobility patterns and transportation interactions [4,39,40,41]. These studies also show that travel distance, travel time, service capacity, and environmental conditions influence mobility patterns, although demographic composition has received comparatively limited attention [12,29].
Collectively, these studies highlight the importance of high-density urban environments for analysing transportation interactions. However, they continue to emphasize spatial and operational factors, while comparatively limited attention has been given to demographic composition within aggregated spatial interaction analysis.
2.4. Research Gap and Conceptual Positioning
Despite extensive research on urban mobility, several gaps remain in the literature. Many studies focus on individual travel behavior using smart-card and trajectory datasets [12,26]. While these approaches provide valuable insights, they often offer limited understanding of aggregated spatial interaction patterns at the system level, particularly in high-density urban environments.
Although OD matrices are widely used to represent travel flows, their application is frequently limited to descriptive analyses and may be constrained by data availability and scalability challenges [8,9]. Similarly, gravity models have been extensively applied in spatial interaction research; however, existing applications primarily emphasize travel-related and spatial variables, with comparatively limited attention given to population characteristics within aggregated transportation interaction analysis, particularly in high-density urban environments.
To address these gaps, this study applies an age-based gravity-model framework to examine public transportation interactions within a high-density urban setting. By incorporating age composition into OD-based spatial interaction analysis, the study contributes to a better understanding of transportation interaction patterns and the influence of age-group composition under data-constrained conditions.
3. Methodology
This methodological approach addresses the research gap identified in the literature review regarding the limited integration of age composition into spatial interaction modelling. By combining OD-based gravity modelling with age-group population structures, the framework provides a more comprehensive representation of transportation interaction patterns in high-density and data-constrained urban environments. Furthermore, the age-based scenario analysis enables a systematic comparison of spatial interaction patterns among different age groups under consistent travel conditions. Figure 1 illustrates the methodological framework of the study, outlining the main stages from data collection and data processing to gravity-model analysis and spatial interaction visualization.
Figure 1.
Methodological framework of the study.
3.1. Study Area
The study was conducted in Gaza Governorate, located in the northern Gaza Strip, Palestine. The governorate is characterized by exceptionally high population density, limited land availability, and substantial daily mobility demands, creating considerable pressure on transportation infrastructure and urban mobility systems. These characteristics make Gaza Governorate a suitable environment for examining transportation interaction patterns within a constrained urban setting.
Five study areas were selected: Gaza City, Al-Shati Camp, Al-Zahra City, Al-Mughraqa, and Juhor Al-Deek. The selection of these areas was guided by three primary criteria: (1) spatial connectivity within the study region, (2) variation in population concentration and urban characteristics, and (3) differences in age composition. These areas contain concentrated residential, commercial, educational, and service activities that generate substantial daily travel demand within a constrained urban transportation network. Figure 2 shows the location of Gaza Governorate within the Gaza Strip, while Figure 3 illustrates the spatial distribution of the selected study areas.
Figure 2.
Location of Gaza Governorate within the Gaza Strip, Palestine. Source: Adapted from UN OCHA Gaza Strip Reference Map.
Figure 3.
Spatial distribution of the five study areas within Gaza Governorate: Gaza City, Al-Shati Camp, Al-Zahra City, Al-Mughraqa, and Juhor Al-Deek. Source: Author’s illustration.
The analysis was conducted at the zonal level, where each study area was treated as both an origin and a destination zone within the spatial interaction framework. This zonal structure enabled the construction of origin–destination (OD) matrices and facilitated the examination of transportation interaction patterns among areas with different demographic characteristics.
The selected areas exhibit distinct age compositions, providing an appropriate setting for investigating age-based transportation interaction patterns using a gravity-model framework under consistent travel and spatial conditions.
3.2. Data Sources and Collection Procedures
The analysis was based on three primary data sources collected for the selected study areas in Gaza Governorate. These sources provided the demographic, transportation, and travel-impedance information required for the development and empirical evaluation of the proposed age-based gravity-model framework. The first data source consisted of a household survey conducted in 2023 across the five study areas: Gaza City, Al-Shati Camp, Al-Zahra City, Al-Mughraqa, and Juhor Al-Deek. A total of 600 households were surveyed through direct field-based data collection using a door-to-door approach across different residential locations within each study area. The sample was distributed across the five study areas according to their relative population sizes, as detailed in Table 5. The survey provided age-distribution data subsequently classified into three groups: 0–14 years, 15–64 years, and 65 years and above, which served as the primary demographic input variables within the gravity-model scenarios. It should be noted that formal weighting procedures and non-response bias assessment were not implemented due to field and data constraints within the study area. Accordingly, the findings should be interpreted within this limitation.
Table 5.
Distribution of Surveyed Households and Surveyed Population by Age Group and Study Area.
The second data source consisted of observed passenger-flow data collected through structured field observations at the main public transportation garage in each study area. Observations were conducted over five working days, with one study area covered per day during the morning peak period between 08:00 and 10:00.
Passenger movements were recorded according to their origins, destinations, and age-group classifications and were subsequently aggregated into age-specific origin–destination (OD) matrices, providing an empirical representation of actual transportation interactions within the study area. These observed OD matrices were subsequently used for model calibration and validation.
The morning peak period (08:00–10:00) was intentionally selected because it corresponds to the principal commuting period in Gaza Governorate, during which travel demand associated with government institutions, private-sector workplaces, and UNRWA schools is concentrated. This period provides a consistent basis for calibrating and comparing aggregated transportation interaction patterns. Consequently, the observed OD matrices should be interpreted as representing morning peak travel conditions rather than full-day travel behaviour.
The third data source consisted of travel-distance and travel-time information obtained from Google Maps [42]. Travel distance and travel time for each origin–destination (OD) pair were calculated using the road-network route between the main public transportation garages serving the origin and destination study areas. The extracted values were subsequently verified through structured interviews with public transport drivers operating on routes between the selected study areas to ensure consistency with local travel conditions. The resulting distance and travel-time matrices were used as travel-impedance variables within the gravity-model framework.
Together, these three data sources provided a comprehensive empirical foundation for examining age-based trip distribution patterns between the selected study areas and evaluating the performance of the proposed gravity-model framework through calibration, validation, and comparative age-group analysis.
3.3. Data Processing
Following data collection, the datasets were processed and organized to support the age-based spatial interaction analysis. The processing procedure focused on preparing age-group population data, observed origin–destination (OD) trip data, and travel-impedance matrices for subsequent gravity-model implementation, calibration, and validation.
Household records were first aggregated at the study-area level. Age information was classified into three groups: 0–14 years, 15–64 years, and 65 years and above. For each study area, the total number of individuals belonging to each age group was calculated and organized into separate age-group population datasets for subsequent model implementation.
Observed passenger-flow records were aggregated into age-specific origin–destination (OD) matrices representing travel movements among the five study areas. In addition, survey-derived OD matrices were constructed for each age group to support the subsequent validation procedure. These matrices provided a structured representation of observed and survey-based spatial interaction patterns within the study area.
Travel-distance and travel-time information obtained from Google Maps and field-based driver reports were reviewed and organized into corresponding distance and travel-time matrices. A comparative consistency assessment was conducted to evaluate the level of agreement between the two data sources. The results indicated a high degree of consistency between the reported and mapped values. Consequently, Google Maps data were adopted as the primary source for constructing the travel-impedance matrices used in the gravity-model analysis.
Following these processing steps, the age-group population datasets, survey-derived OD matrices, observed OD matrices, distance matrices, and travel-time matrices were integrated into a unified analytical framework for model implementation, calibration, validation, and comparative age-group analysis. All data processing, matrix calculations, calibration, and validation procedures were performed using Python (version 3.11).
3.4. Age Group Classification
Age was selected as the primary analytical variable in this study because it represents one of the most fundamental demographic characteristics influencing travel demand and spatial interaction patterns. Age provides a direct and measurable representation of population structure within each study area.
The household age data were classified into three groups: 0–14 years, 15–64 years, and 65 years and above, following a widely adopted demographic classification used in population, development, and transportation studies. This tripartite structure distinguishes between dependent children, the economically active population, and older adults, each of whom is commonly associated with distinct mobility requirements and travel characteristics. The classification provides a consistent and comparable framework for examining how variations in age composition may influence aggregated transportation interaction patterns across the selected study areas.
For each study area, age-group totals were calculated from the household dataset and subsequently incorporated into separate gravity-model scenarios for comparative analysis.
It should be noted that the objective of this classification was not to infer individual travel behavior, but rather to examine age-related differences in aggregated spatial interaction patterns at the study-area level. Accordingly, the analysis should be interpreted as a comparative and exploratory assessment rather than a behavioral prediction framework.
Although the 15–64 age group encompasses individuals with diverse travel purposes and mobility characteristics, the present classification follows the widely adopted demographic convention used in official population statistics and transportation planning, distinguishing dependent children (0–14 years), the working-age population (15–64 years), and older adults (65 years and above). This standardized classification was adopted to ensure consistency with the household survey data and to enable direct comparison across age-group scenarios within a common modelling framework.
3.5. Gravity Model Framework
The conventional gravity model was adopted as the analytical framework for examining age-based spatial interaction patterns between the selected study areas. Gravity models have been widely applied in transportation, geography, and urban planning studies to represent the interaction between locations as a function of population size and travel impedance. Their widespread use, theoretical grounding, and straightforward interpretation make them suitable for comparative assessments of spatial interaction patterns under different demographic scenarios. Within the conventional four-step travel demand modelling framework, the gravity model is commonly applied during the trip distribution stage to estimate the spatial distribution of trips between origin and destination (OD) zones. The present study follows this established transportation-planning application by comparing trip distribution patterns under different age-group population scenarios while maintaining the conventional gravity-model formulation.
The mathematical formulation of the conventional gravity model was retained without modification. The proposed framework differs only in the representation of the demographic mass variables by replacing total population with age-group populations in separate analytical scenarios.
Unlike conventional gravity-model applications that utilize total population as a single demographic mass component, this study employed age-group populations as alternative demographic mass variables. Separate model scenarios were developed for the three age groups (0–14 years, 15–64 years, and 65 years and above), with age-group population totals serving as the demographic input variables at both origin and destination areas. By maintaining an identical gravity-model formulation, identical travel impedance conditions, and identical calibration procedures across all scenarios, the proposed framework enables a direct comparison of age-specific spatial interaction patterns. This design helps isolate the influence of demographic composition while keeping the model structure unchanged, allowing differences in interaction intensity and model performance to be interpreted primarily in relation to age-group population structure rather than differences in model formulation.
Travel impedance was represented by both travel distance and travel time, reflecting complementary dimensions of travel resistance. Distance captures the physical separation between origin and destination areas, whereas travel time reflects the operational effort associated with movement between locations. The combined use of both variables provides a more comprehensive representation of travel impedance than either variable alone and is particularly relevant in urban transportation contexts where travel conditions may vary despite similar physical distances. A product-based impedance formulation was adopted to allow the simultaneous and independent influence of both distance and travel time on interaction intensity, consistent with established gravity-model practice in urban transportation research. Equation (1) expresses the gravity-model formulation used in this study to estimate aggregated age-based trip distribution between origin and destination areas as a function of age-group populations and travel impedance.
where represents the estimated interaction between origin area and destination area ; and represent the age-group populations at the origin and destination areas, respectively; denotes travel distance; denotes travel time; is a scaling coefficient; and and are impedance parameters estimated through calibration.
The scaling coefficient () and the impedance parameters ( and ) were estimated through the calibration procedure described in Section 3.7 using the observed passenger-flow dataset. Multiple parameter combinations were evaluated to identify the values that provided the closest agreement between the observed and model-generated interaction patterns.
The model was applied separately to each age group to generate age-specific interaction matrices, which were subsequently compared with the observed age-specific OD matrices during the calibration and validation procedures described in Section 3.7.
It should be emphasized that the model was not intended to predict individual travel behaviour, but rather to serve as a comparative and exploratory analytical framework for examining aggregated age-based trip distribution patterns under consistent spatial and travel conditions.
Accordingly, the proposed framework represents an application and evaluation of the conventional gravity model using age-group population structures rather than the development of a new gravity-model formulation.
3.6. Consistency and Reliability Assessment
Prior to model implementation, a two-stage consistency assessment was conducted to verify the reliability of the input datasets used within the gravity-model framework.
In the first stage, the agreement between travel-impedance data obtained from Google Maps and field-based driver reports was examined using Pearson correlation analysis for both travel-distance and travel-time measurements. Pearson correlation coefficients of 0.986 for travel distance and 0.978 for travel time indicated a very high level of agreement between the two data sources. Consequently, Google Maps data were adopted as the primary source for constructing the travel-distance and travel-time matrices used in the subsequent gravity-model analysis.
In the second stage, the consistency between the survey-derived age-specific OD matrices and the observed passenger-flow OD matrices was assessed. This comparison was performed to verify that the household survey provided a reliable representation of actual spatial interaction patterns within the study area. Pearson correlation coefficients, RMSE, MAE, and MAPE were calculated separately for each age-group scenario. The results of this assessment are presented in Section 4.2 and confirmed that the survey-derived matrices were sufficiently reliable to support the gravity-model calibration and validation procedures.
Although consistency between datasets does not completely eliminate potential uncertainties associated with local travel conditions or temporal variation, the combined assessment provides evidence that the adopted travel-impedance inputs and survey-derived OD matrices are sufficiently reliable for comparative spatial interaction modelling within the study area.
3.7. Model Calibration and Validation
The proposed age-based gravity-model framework was calibrated and validated using the observed passenger-flow dataset collected at the public transportation garages within the study area. The observed OD matrices provided an empirical reference for evaluating the ability of the model to reproduce aggregated spatial interaction patterns between the selected study areas.
Model calibration was performed by systematically testing multiple combinations of the impedance parameters β and γ while recalculating the scaling coefficient k for each iteration. Parameter values were varied across a predefined range, and model performance was evaluated at each combination using the coefficient of determination (R2), Root Mean Square Error (RMSE), Mean Absolute Error (MAE), and Mean Absolute Percentage Error (MAPE). The mathematical formulations of these performance evaluation metrics are presented in Equations (2)–(5).
where and denote the observed and predicted interaction values, respectively; Ō is the mean of the observed interaction values; and n is the total number of OD observations. Lower values of RMSE, MAE, and MAPE indicate better model performance, whereas higher R2 values indicate stronger explanatory capability.
The optimal parameter set was selected as the combination that provided the highest coefficient of determination (R2) and the lowest error values relative to the observed interaction matrices. For each age-group scenario, twenty β–γ parameter combinations were systematically evaluated, while recalculating the scaling coefficient (k) at each iteration.
A sensitivity analysis was also conducted to evaluate the influence of alternative β and γ combinations on model performance and to assess the robustness of the selected parameter values. The results of this analysis are presented in Section 4.4.
Model validation was subsequently performed by comparing the calibrated model outputs against the observed age-specific OD matrices to assess the agreement between estimated and observed spatial interaction patterns. Performance was evaluated using the same indicators applied during calibration, enabling a direct and consistent comparison between calibration and validation results.
Calibration and validation procedures were conducted separately for each age-group scenario: 0–14 years, 15–64 years, and 65 years and above. This approach enabled a comparative evaluation of the extent to which different age-group population structures were capable of reproducing observed transportation interaction patterns within the study area.
It should be emphasized that the objective of calibration and validation was not to predict individual travel behavior, but rather to assess the ability of the proposed framework to reproduce observed area-level spatial interaction patterns under different age-group demographic scenarios. Accordingly, the calibrated parameters should be interpreted as representative of morning peak travel conditions only and should not be generalized to other periods of the day, weekends, or seasonal travel conditions without additional empirical observations.
This calibration and validation framework provides a reproducible procedure for evaluating gravity-model performance under different demographic scenarios and supports the application of the proposed methodology in comparable high-density urban environments.
To enhance the transparency of the calibration procedure, the conventional gravity model was calibrated using the same dataset, calibration workflow, and performance evaluation criteria as the proposed age-based models. This consistent calibration framework enables direct benchmarking between the conventional and age-based approaches while ensuring that differences in model performance are attributable to demographic representation rather than differences in calibration methodology.
4. Results
4.1. Characteristics of the Observed Passenger Flow Data
The observed OD dataset consisted of 1364 passenger trips recorded across the five study areas during the five-day morning peak observation period. The observed flow matrix revealed a highly uneven spatial interaction structure, with passenger movements strongly concentrated toward Gaza City. The highest observed interaction was recorded between Al-Shati Camp and Gaza City (380 trips), while substantially lower interaction levels were observed among peripheral area pairs.
The observed age-based OD matrices demonstrated considerable differences in interaction magnitude across the three age groups. The 15–64 age group accounted for the vast majority of observed passenger movements (1108 trips; 81.2%), whereas the 0–14 and 65+ groups recorded considerably lower interaction levels (148 trips; 10.9% and 108 trips; 7.9%, respectively). Despite these differences in magnitude, all age groups exhibited a similar spatial interaction structure characterized by a strong concentration of passenger movements toward Gaza City.
As a whole, the observed passenger-flow patterns indicate a highly centralized transportation structure within the study area, with Gaza City functioning as the principal attraction hub and dominant destination. The observed age-specific OD matrices provide the empirical basis for the subsequent consistency assessment of the survey-derived OD matrices and for the calibration and validation of the proposed gravity-model framework.
4.2. Consistency Assessment of Survey-Based OD Matrices
The consistency assessment results for the survey-derived age-specific OD matrices are presented in Table 6. The comparison between the survey-based and observed passenger-flow OD matrices was performed using the evaluation indicators described in Section 3.6 and Section 3.7.
Table 6.
Agreement Metrics between Survey-Derived and Observed Age-Specific OD Matrices.
The consistency assessment results indicate a moderate-to-strong level of agreement between the household-survey OD matrices and the observed passenger-flow data across all age groups. The strongest agreement was obtained for the 15–64 age group, which achieved the highest correlation coefficient (R = 0.841) and coefficient of determination (R2 = 0.707). The 65+ age group demonstrated a comparable level of agreement (R = 0.839; R2 = 0.704), while the 0–14 age group exhibited slightly lower correspondence with the observed interaction patterns (R = 0.781; R2 = 0.610).
The error-based indicators further support the overall validity of the survey-derived OD matrices. The lowest RMSE and MAE values were obtained for the 65+ age group, whereas larger error values were observed for the 15–64 age group because of the substantially higher interaction volumes associated with this category. Although the 0–14 age group exhibited a relatively high MAPE value (121.26%), this result is largely attributable to the presence of several OD pairs with relatively small observed trip counts, which increase the sensitivity of percentage-based error measures.
Taken together, the validation results suggest that the household-survey OD matrices provide a reasonable representation of the observed spatial interaction structure within the study area. The observed levels of agreement support the use of the household-survey data within the subsequent calibration and validation of the proposed age-based gravity-model framework.
4.3. Gravity Model Calibration Results
The gravity model was calibrated separately for the three age groups using the observed passenger-flow dataset collected during the morning peak period. Calibration was performed by systematically testing multiple combinations of the impedance parameters β and γ while recalculating the scaling coefficient k for each iteration. Model performance was evaluated using the coefficient of determination (R2), Root Mean Square Error (RMSE), Mean Absolute Error (MAE), and Mean Absolute Percentage Error (MAPE).
As an initial step, a baseline calibration was conducted using β = 1 and γ = 1. The results indicated that applying the scaling coefficient k alone was insufficient to adequately reproduce the observed OD interaction patterns. Although the scaling coefficient aligned the aggregate magnitude of the estimated flows with the observed flows, the relatively low R2 values and high prediction errors suggested that additional calibration of the impedance parameters was required. The baseline calibration results are presented in Table 7. Consequently, a systematic parameter search was undertaken to identify the β and γ values that provided the closest agreement between the observed and estimated interaction patterns.
Table 7.
Baseline Calibration Results (β = 1, γ = 1).
Subsequently, multiple calibration iterations were performed by varying β and γ values and evaluating the resulting model performance. For each age group, the optimal parameter combination was selected based on the highest coefficient of determination (R2) and the lowest prediction errors. The final calibrated parameter values and performance indicators are presented in Table 8.
Table 8.
Final Calibrated Gravity Model Parameters and Performance Indicators.
Comparison of Table 7 and Table 8 demonstrates that the calibration procedure improved model performance across all age groups. For the 0–14 age group, R2 increased from 0.343 to 0.485, accompanied by reductions in RMSE, MAE, and MAPE. Similar improvements were observed for the 15–64 and 65+ age groups, indicating that calibration enhanced the agreement between observed and estimated interaction patterns. Figure 1 further illustrates the variation in model performance across the tested β–γ combinations and supports the relative stability of the selected parameter combination within the tested range.
The consistently low optimal values of β = 0.25 and γ = 0.25 across all age groups suggest that travel distance and travel time exerted a relatively weak influence on interaction intensity within the study area, which is consistent with the high-density urban characteristics of Gaza Governorate, where major activity centers remain in close spatial proximity. The results further suggest that spatial interaction patterns were strongly associated with the concentration of population and activities within the main urban centres, particularly Gaza City.
The calibration results indicate that adjustment of the impedance parameters improved the model’s ability to approximate the observed spatial interaction structure. Nevertheless, the obtained R2 values indicate moderate explanatory capability, suggesting that the proposed framework is more suitable for exploratory and comparative analysis than high-precision prediction. The calibrated parameter set was subsequently adopted for the sensitivity analysis presented in Section 4.4 and for the comparative assessment of age-group interaction patterns presented in Section 4.5.
Calibration Results of the Conventional Gravity Model
To provide a direct benchmark for evaluating the proposed age-based gravity model, a conventional gravity model was calibrated using the total population of each study area as the demographic mass variable. The same origin–destination (OD) dataset, travel-distance matrix, travel-time matrix, calibration procedure, and evaluation criteria (R2, RMSE, MAE, and MAPE) were applied to ensure a fair comparison between the conventional and age-based modelling approaches. A total of twenty calibration iterations, representing different combinations of the impedance parameters (β and γ), were systematically evaluated. The four best-performing parameter combinations were β = 0.25 and γ = 0.25 (R2 = 0.503), β = 0.25 and γ = 0.50 (R2 = 0.497), β = 0.50 and γ = 0.25 (R2 = 0.490), and β = 0.50 and γ = 0.50 (R2 = 0.482). These results indicate that lower impedance parameter values provided a better representation of the observed transportation interactions in the study area, whereas higher parameter values resulted in a gradual decline in model performance. Among these, the combination of β = 0.25 and γ = 0.25 achieved the highest coefficient of determination and was therefore selected as the optimal calibration for the conventional gravity model. This calibrated model was subsequently used as the benchmark for comparison with the proposed age-based gravity model.
4.4. Sensitivity Analysis
A sensitivity analysis was conducted to evaluate the influence of the impedance parameters β and γ on gravity-model performance. Multiple parameter combinations were systematically tested, and the resulting changes in model performance were assessed using the coefficient of determination (R2).
Figure 4 presents the variation of R2 across the tested β–γ combinations for the three age groups. The results indicate that model performance was sensitive to changes in both impedance parameters. For all age groups, the highest R2 values were consistently obtained at β = 0.25 and γ = 0.25, confirming the suitability of the calibrated parameter set identified in Section 4.3.
Figure 4.
Variation in R2 across Tested β–γ Parameter Combinations for the Three Age Groups.
As the values of β and γ increased, a gradual decline in model performance was observed across all age groups. This trend indicates that assigning stronger distance and travel-time penalties reduced the ability of the model to reproduce the observed OD interaction patterns. Conversely, lower impedance values resulted in closer agreement between the estimated and observed OD matrices.
Although the maximum R2 values differed among age groups (0–14: 0.485; 15–64: 0.518; 65+: 0.339), the overall response pattern to changes in impedance parameters remained similar across all scenarios. This consistent response suggests similar sensitivity to the impedance parameters across the three age-group scenarios.
Taken together, the sensitivity analysis demonstrates that gravity-model performance is strongly influenced by the choice of impedance parameters and highlights the importance of calibration when applying gravity-based interaction models in high-density urban environments.
The calibration procedure was performed independently for each age-group scenario as well as for the conventional gravity model using the same calibration framework. For each model, twenty β–γ parameter combinations were systematically evaluated, and the optimal parameter values were selected according to the calibration criteria described in Section 3.7. Although these calibration experiments were conducted independently, all models consistently identified β = 0.25 and γ = 0.25 as the optimal parameter combination. This outcome indicates that, within the examined parameter range and study area, travel distance and travel time exerted a comparable influence on aggregated transportation interactions across the evaluated scenarios. Therefore, the observed differences in model performance are more likely attributable to differences in demographic composition and interaction volumes than to differences in impedance sensitivity.
4.5. Comparative Assessment of Age-Group Trip Distribution Patterns
The results obtained from the calibration and sensitivity analyses reveal differences in interaction magnitude and model fit among the three age-group scenarios, while the general spatial interaction structure remained broadly similar. Although all age groups exhibited a similar spatial interaction pattern characterized by a strong concentration of movements toward Gaza City, differences were observed in the ability of the gravity model to reproduce the corresponding interaction patterns.
The calibrated conventional gravity model was compared with the proposed age-based gravity models to evaluate the influence of age-group population structure on trip distribution modelling. The conventional gravity model, calibrated using the total population of each study area, achieved an R2 of 0.503. Among the age-based models, the working-age group (15–64 years) achieved the highest explanatory performance among the examined scenarios (R2 = 0.518), followed by the younger age group (0–14 years; R2 = 0.485), whereas the older age group (65 years and above) achieved the lowest model performance (R2 = 0.339). These findings indicate that incorporating age-group population structure does not uniformly improve predictive accuracy across all age groups; however, it provides a more detailed representation of transportation interaction patterns by revealing differences in interaction magnitude and model fit among age-group scenarios that are not captured by the conventional population-based gravity model.
The slightly higher R2 obtained for the 15–64 age-group scenario may partly reflect the dominant contribution of the working-age population to aggregated transportation demand within the study area. This may partly reflect the greater participation of the working-age population in routine daily activities. However, trip purpose was not directly measured in the present study. In addition, the substantially larger number of observed trips in this age group provided a larger empirical basis for model fitting and potentially reduced the influence of sparse OD cells. Consequently, the age-based gravity model slightly outperformed the conventional gravity model (R2 = 0.518 versus 0.503), indicating a marginal improvement in model fit for the 15–64 scenario within the present dataset while providing a more demographic-specific representation of transportation interaction patterns. The difference of 0.015 should not be interpreted as a substantial predictive improvement. Instead, the principal value of the 15–64 scenario lies in demonstrating how age-specific population structure provides a more demographic-specific representation of transportation interaction patterns than the conventional gravity model.
The 0–14 age-group scenario exhibited moderate exploratory capability, with an of 0.485. The model captured part of the general spatial concentration toward Gaza City, but a substantial proportion of the variation in observed flows remained unexplained. The lower model fit may partly reflect the limited number of observed trips for this group (148 trips; 10.9%) and the dependence of many children’s trips on household and accompanying-adult travel arrangements.
The 65+ age-group scenario exhibited limited explanatory capability, with an of 0.339. Although the estimated flows retained the general concentration toward Gaza City, most of the variation in the observed OD flows was not explained by the model. This limited fit may be associated with the relatively small number of observed trips (108 trips; 7.9%), greater variability across OD pairs, and the possible influence of unmodelled factors such as health-related travel, accessibility constraints, trip purpose, and dependence on accompanying household members.
Overall, the comparison does not demonstrate a uniform predictive advantage of the age-group scenarios over the conventional gravity model. Its principal value lies instead in providing an exploratory and disaggregated assessment of how model fit and interaction magnitude vary among age groups. These results should therefore be interpreted as supplementary evidence for demographic-sensitive transportation analysis rather than as confirmation of strong predictive performance. The spatial interaction patterns across different age groups are summarized in Table 9.
Table 9.
Summary of Age-Based Spatial Interaction Patterns.
Figure 5, Figure 6, Figure 7, Figure 8, Figure 9 and Figure 10 illustrate the estimated spatial interaction patterns for the three age-group scenarios. The heat maps and spatial flow maps reveal a consistent spatial structure dominated by movements toward Gaza City across all scenarios. However, noticeable differences in interaction intensity were observed among the age groups.
Figure 5.
Heat map of estimated transportation interaction intensity for the 0–14 age-group scenario derived from the calibrated gravity model.
Figure 6.
Spatial interaction flow map for the 0–14 age-group scenario derived from the calibrated gravity model.
Figure 7.
Heat map of estimated transportation interaction intensity for the 15–64 age-group scenario derived from the calibrated gravity model.
Figure 8.
Spatial interaction flow map for the 15–64 age-group scenario derived from the calibrated gravity model.
Figure 9.
Heat map of estimated transportation interaction intensity for the 65+ age-group scenario derived from the calibrated gravity model.
Figure 10.
Spatial interaction flow map for the 65+ age-group scenario derived from the calibrated gravity model.
The 15–64 age-group scenario generated the highest interaction intensity and achieved the highest, although still moderate, explanatory capability, consistent with the substantially larger interaction volumes observed within the corresponding OD matrix. In contrast, the 0–14 and 65+ scenarios displayed lower interaction intensity compared with the 15–64 age-group scenario. These differences are reflected in both the heat maps and the spatial flow maps.
Taken together, the visual outputs support the calibration and sensitivity-analysis results by confirming that age-group scenarios differ primarily in interaction magnitude, while the general spatial interaction structure remains broadly consistent across the study area.
5. Discussion
5.1. Interpretation of the Results
The results indicate that age-group scenarios influence the ability of the gravity model to reproduce transportation interaction patterns within the study area. Although all age groups exhibited a broadly similar spatial interaction structure characterized by strong connections with Gaza City, differences were observed in model performance among the three age-group scenarios.
The calibrated gravity model achieved its highest explanatory performance for the 15–64 age group (R2 = 0.518), followed by the 0–14 age group (R2 = 0.485), while the 65+ age group produced the lowest explanatory performance (R2 = 0.339). These findings indicate that transportation interaction patterns associated with different age-group scenarios are not represented equally within the gravity-model framework. However, these differences should be interpreted primarily as reflecting variations in demographic mass inputs and interaction volumes rather than direct evidence of individual travel behaviour.
The 0–14 age group demonstrated intermediate model performance (R2 = 0.485). The lower agreement levels observed for this group are associated with the relatively small interaction volumes recorded in the observed OD dataset (148 trips; 10.9%), which increase model sensitivity to flow variability. The 65+ age-group scenario exhibited the lowest explanatory performance (R2 = 0.339). This result is likely associated with the relatively small number of observed interactions recorded for this age group (108 trips; 7.9% of total observed flows), which increases the influence of variability across OD pairs and provides a less stable empirical basis for calibration and validation. Although the model reproduced the general concentration of interactions toward Gaza City, it explained a smaller proportion of the variation in observed flows than the other age-group scenarios.
In contrast, the 15–64 age-group scenario achieved the highest model performance. This outcome is likely related to the substantially larger interaction volumes observed in the corresponding OD matrix (1108 trips; 81.2% of total observed flows), which provide a more stable empirical basis for calibration and validation. This finding should not be interpreted as evidence of homogeneous travel behaviour within the working-age population, as the 15–64 category includes individuals with diverse mobility characteristics and travel purposes. Rather, the results reflect the aggregate behaviour of this demographic group within the study area.
The calibration process substantially improved model performance across all age groups compared with the baseline scenario. The increase in explanatory power and the reduction in prediction errors demonstrate the importance of calibrating impedance parameters rather than relying solely on default gravity-model assumptions. These findings highlight the sensitivity of spatial interaction estimates to parameter selection and emphasize the importance of calibration when applying gravity models in high-density urban environments.
The calibration results further indicated that relatively low impedance parameter values (β = 0.25 and γ = 0.25) provided the best representation of observed interactions across all age groups. These results indicate a relatively weak impedance effect within the study area, suggesting that spatial interactions remain strongly associated with demographic concentration despite variations in travel distance and travel time. This finding is consistent with the compact urban structure and high-density characteristics of Gaza Governorate, where major activity centres remain relatively accessible despite differences in travel impedance. Although the highest coefficient of determination (R2 = 0.518) indicates only moderate predictive performance, the objective of this study was not to maximize prediction accuracy, but to evaluate whether age-group population structure provides additional explanatory insight beyond the conventional gravity model. The comparative analysis demonstrates that this objective was achieved. Accordingly, the proposed framework should be interpreted primarily as an exploratory and comparative analytical tool for examining age-group transportation interaction patterns rather than as a predictive model intended for highly accurate flow estimation.
The estimated interaction heatmaps further support these findings. Across all three age groups, the Gaza City–Al-Shati Camp corridor consistently generated the highest interaction intensity, while peripheral areas such as Al-Mughraqa and Juhor Al-Deek exhibited the lowest estimated interaction values. This pattern confirms the highly centralized nature of the transportation interaction structure within the study area and highlights the dominant role of demographic concentration in shaping area-level spatial interaction patterns.
An important contribution of this study is the incorporation of age-specific demographic variables into the gravity-model framework. Unlike conventional gravity-model applications that employ total population as the demographic mass variable, the present study developed separate scenarios for three age groups. The findings suggest that age-specific demographic structures provide additional insight into transportation interaction patterns and reveal differences that may not be evident when aggregate population measures are used alone.
The findings should be interpreted as an area-level assessment of spatial interaction patterns rather than as evidence of individual travel behaviour. The analysis focuses on aggregated transportation interactions between study areas and therefore provides a comparative assessment of age-based spatial interaction patterns under different demographic scenarios.
The comparatively lower model performance for the population aged 65 years and above (R2 = 0.339) may be associated with several factors. First, this age group represented the smallest population segment in the household survey, which may have limited the stability of the estimated interaction patterns. Second, older adults often exhibit more heterogeneous travel behaviour than the working-age population, with travel decisions being influenced by individual health conditions, family support, and occasional service-related trips. In addition, older adults generally have more restricted activity spaces and lower travel frequencies than younger age groups. These characteristics may reduce the ability of an aggregate gravity model based solely on demographic population and travel impedance to fully capture their observed interaction patterns.
From a transportation planning perspective, the proposed framework may support more evidence-based planning by identifying age-group differences in spatial interaction patterns. Such information can assist planners in prioritizing public transport services, improving accessibility to essential destinations, and supporting more equitable allocation of transportation resources for different population groups. However, the present study was not designed to develop or evaluate optimization strategies or infrastructure intervention scenarios. These aspects represent an important direction for future research.
5.2. Sustainability and Transportation Planning Implications
The findings of this study have several implications for sustainable transportation planning in high-density urban environments. The results indicate that age-specific demographic structures provide additional information for interpreting spatial interaction patterns beyond what aggregate population measures alone can reveal.
The dominance of the 15–64 age-group scenario in both observed and estimated interaction flows highlights its importance within the overall transportation demand structure of the study area. However, transportation planning should consider the accessibility requirements of all age groups to support inclusiveness, equity, and sustainable service provision. Such an approach can help ensure that transportation investments respond to the needs of diverse population groups rather than focusing exclusively on the largest travel-demand segment.
The analysis also highlights the importance of considering younger and older populations in transportation planning processes. Although these groups generated lower interaction volumes within the study area, they often depend more heavily on accessible and reliable transportation services. Incorporating age-sensitive planning perspectives may therefore contribute to improved accessibility, social inclusion, and transportation equity.
The generated heatmaps provide a practical analytical tool for identifying high-demand zones and dominant movement corridors. The Gaza City–Al-Shati Camp corridor emerged as the principal interaction axis across all age groups, suggesting that service prioritization and capacity allocation along this corridor may provide substantial benefits in terms of accessibility and network efficiency. The heatmaps also assist in identifying peripheral areas, such as Al-Mughraqa and Juhor Al-Deek, where targeted transportation improvements may enhance spatial connectivity and service equity.
From a sustainability perspective, age-based interaction analysis can support more efficient service allocation; improve access to employment, education, healthcare, and public services; and contribute to the development of more equitable and resilient transportation systems. These outcomes are consistent with sustainable urban mobility objectives and support SDG 11 through more inclusive, accessible, and evidence-based transportation planning.
5.3. Methodological Contributions
This study contributes to the spatial interaction and transportation modelling literature through the development and evaluation of an age-based gravity-model framework within a high-density urban environment. Unlike conventional gravity-model applications that rely on total population as the demographic mass variable, the proposed framework employs age-specific population groups to generate and compare alternative transportation interaction scenarios.
A second contribution is the implementation of a calibration and validation framework based on household-survey data, observed passenger-flow data, travel-distance data, and travel-time information. The use of consistent calibration procedures across all age-group scenarios enabled a systematic comparison of model performance and identified a common optimal parameter set (β = 0.25; γ = 0.25). This integrated approach may be particularly useful in data-constrained urban environments where large-scale mobility datasets are unavailable.
The comparative analysis indicates that the primary contribution of the proposed framework is not solely the modest improvement in predictive performance, but also its ability to reveal differences in transportation interaction patterns among demographic groups that cannot be identified using a conventional population-based gravity model, While the conventional model represents the overall transportation demand, the age-based framework provides additional insight into the mobility characteristics of specific population groups. These additional demographic insights may support more targeted transportation planning, demand management, and sustainable mobility strategies in high-density urban environments.
5.4. Limitations
Several limitations should be considered when interpreting the findings of this study. First, the analysis was conducted using data collected from five selected areas within Gaza Governorate. Although these areas represent different demographic and spatial characteristics, the findings should not be generalized to the entire Gaza Strip or to urban environments with substantially different transportation structures.
Second, the observed passenger-flow data were collected only during the morning peak period (08:00–10:00) over five working days. The morning peak was intentionally selected because it corresponds to the principal commuting period in Gaza Governorate and provides a consistent basis for model calibration. Nevertheless, the calibrated OD interaction patterns primarily represent morning peak travel conditions and may not capture variations associated with off-peak periods, evening peak hours, weekends, or seasonal changes. Therefore, the findings should not be generalized to complete daily or annual travel behaviour. Future research should extend passenger-flow observations to different times of day, weekends, and multiple seasons to evaluate the temporal robustness and generalizability of the proposed framework.
Third, the analysis was conducted at an aggregated area level using OD matrices rather than individual travel records. Consequently, the findings should be interpreted as area-level spatial interaction patterns rather than representations of individual travel behaviour.
Fourth, the gravity-model formulation incorporates travel distance and travel time as impedance variables but does not explicitly account for other factors that may influence transportation interactions, including transportation cost, service quality, land-use characteristics, and socio-economic conditions.
Finally, although the household survey was designed to provide broad spatial and demographic coverage across the study area, formal weighting procedures and non-response bias assessments were not implemented because of field constraints. Therefore, some population segments may be underrepresented within the survey dataset.
Furthermore, the study did not include individual-level behavioural variables such as health status, trip purpose, or mobility constraints, which may have contributed to the lower explanatory performance observed for the oldest age group.
The sensitivity analysis conducted in this study focused on the gravity-model impedance parameters (β and γ), as these represent the primary calibration parameters of the adopted model. Other sources of uncertainty, such as alternative zoning systems or variations in sample size, were not investigated in the present study. Evaluating these factors represents an important direction for future research to further examine the robustness of the proposed framework under alternative modelling assumptions. In addition, the present study did not include a formal uncertainty analysis of the survey data or calibrated model parameters. Consequently, the propagation of uncertainty from the input datasets to the estimated OD interaction patterns was not explicitly quantified. Incorporating uncertainty propagation techniques represents an important direction for future research to further evaluate the robustness of the proposed framework.
Another limitation concerns the adopted age classification. Although the three-group classification follows a widely accepted demographic standard, the broad 15–64 category inevitably contains heterogeneous mobility characteristics. Future studies could investigate alternative age stratifications or finer demographic segmentation to evaluate the sensitivity of gravity-model performance to different age-group definitions.
5.5. Future Research Directions
Future research may extend the present study in several directions. First, the proposed framework could be applied to a larger number of study areas and different urban contexts to evaluate the generalizability of the findings under varying demographic and transportation conditions.
Second, future studies may incorporate additional demographic and socio-economic variables, including gender, employment status, household structure, and income level, to examine their influence on transportation interaction patterns.
Third, more advanced gravity-model formulations, including doubly constrained gravity models and alternative spatial interaction approaches, may be explored to improve model representation of transportation dynamics.
Fourth, future studies may utilize larger mobility datasets, including smart-card records, mobile-phone data, GPS trajectories, and automated passenger-counting systems, to provide a stronger empirical basis for calibration and validation.
Finally, the integration of age-based interaction analysis with land-use and accessibility frameworks represents a promising direction for supporting more inclusive, evidence-based, and sustainability-oriented transportation planning. Future research should extend the proposed framework by incorporating additional demographic variables, different temporal conditions, and other urban contexts.
6. Conclusions
This study developed and evaluated an age-based gravity-model framework that applies the conventional gravity model under alternative age-group population scenarios to examine trip distribution patterns among origin–destination (OD) zones within a high-density urban environment. Using household-survey data, observed passenger-flow data, and travel-impedance information collected from five interconnected areas in Gaza Governorate, the study investigated the extent to which age-group population structures influence modelled spatial interaction patterns.
The results revealed a highly centralized transportation interaction structure, with Gaza City functioning as the principal attraction hub across all age-group scenarios. Although the overall spatial interaction structure remained broadly similar among age groups, differences were observed in interaction intensity and model performance across the three age-based scenarios.
The validation analysis demonstrated a moderate-to-strong level of agreement between the survey-derived OD matrices and the observed passenger-flow data. The calibration process further improved model performance and identified β = 0.25 and γ = 0.25 as the optimal impedance parameters across all age groups. The sensitivity analysis confirmed the robustness of these parameter values and highlighted the importance of parameter calibration when applying gravity models in high-density urban environments.
Among the examined age-group scenarios, the 15–64 category achieved the highest agreement between observed and estimated interaction patterns. This outcome is likely associated with the substantially larger interaction volumes represented within the corresponding OD matrix, which provided a more stable empirical basis for model calibration and validation.
The findings further demonstrate that applying the conventional gravity model with age-group population structures provides additional insight into transportation interaction patterns beyond that obtained using aggregate population measures alone. The results therefore support the use of age-based demographic variables as complementary inputs for comparative trip distribution analysis.
From a sustainability perspective, the study highlights the value of incorporating demographic heterogeneity into transportation planning and analysis. Age-sensitive approaches may support more inclusive accessibility assessments, improved resource allocation, and more evidence-based transportation planning in high-density urban environments.
Taken together, the proposed framework demonstrates that the conventional gravity model can be effectively applied under alternative age-group population scenarios as a practical exploratory framework for examining aggregated spatial interaction patterns under different demographic conditions. Rather than proposing a new gravity-model formulation, the framework illustrates how demographic heterogeneity can be incorporated into a conventional gravity-model application to support comparative spatial interaction analysis and evidence-based transportation planning in high-density urban environments.
Author Contributions
A.S.I.A.: Conceptualization, Methodology, Investigation, Data curation, Formal analysis, Validation, Visualization, Writing—original draft preparation. G.T.: review and editing, Supervision. All authors have read and agreed to the published version of the manuscript.
Funding
This research received no external funding.
Data Availability Statement
The data presented in this study are available from the corresponding author upon reasonable request. The data are not publicly available due to privacy and confidentiality considerations related to the household survey.
Conflicts of Interest
The authors declare no conflict of interest.
References
- Abe, R.; Ikarashi, T.; Takada, S.; Fukuda, D. Impact of working from home on travel behavior of rail and car commuters: A case study in the Tokyo metropolitan area. Case Stud. Transp. Policy 2023, 11, 100938. [Google Scholar] [CrossRef] [Scilit]
- Huang, W.-H.; Jou, R.-C. Age-period-cohort effects on travel mobility: Evidence from Taiwan. Humanit. Soc. Sci. Commun. 2026, 13, 350. [Google Scholar] [CrossRef] [Scilit]
- Wang, X.; Renne, J.L. Socioeconomics of urban travel in the U.S.: Evidence from the 2017 NHTS. Transp. Res. Part D Transp. Environ. 2023, 116, 103622. [Google Scholar] [CrossRef] [Scilit]
- Ma, X.; Wu, Y.-J.; Wang, Y.; Chen, F.; Liu, J. Mining smart card data for transit riders’ travel patterns. Transp. Res. Part C Emerg. Technol. 2013, 36, 1–12. [Google Scholar] [CrossRef] [Scilit]
- Liu, C.; Zhang, K.; Xiong, H.; Jiang, G.; Yang, Q. Temporal skeletonization on sequential data: Patterns, categorization, and visualization. In Proceedings of the 20th ACM SIGKDD International Conference on Knowledge Discovery and Data Mining (KDD ‘14), New York, NY, USA, 24–27 August 2014; pp. 1336–1345. [Google Scholar] [CrossRef] [Scilit]
- Liu, Y.; Liu, C.; Yuan, N.J.; Duan, L.; Fu, Y.; Xiong, H.; Xu, S.; Wu, J. Intelligent bus routing with heterogeneous human mobility patterns. Knowl. Inf. Syst. 2017, 50, 383–415. [Google Scholar] [CrossRef] [Scilit]
- Yang, Y.; Gao, T.; Xu, Z.; Zhang, Y.; Liu, C.; Shang, F.; Li, R. Quantifying the relationship between mobility patterns and socioeconomic status of dockless bike-sharing users. Int. J. Mod. Phys. C 2024, 35, 2450108. [Google Scholar] [CrossRef] [Scilit]
- Cerqueira, S.; Arsenio, E.; Henriques, R. Inference of dynamic origin–destination matrices with trip and transfer status from individual smart card data. Eur. Transp. Res. Rev. 2022, 14, 42. [Google Scholar] [CrossRef] [Scilit]
- Munizaga, M.A.; Palma, C. Estimation of a disaggregate multimodal public transport Origin–Destination matrix from passive smartcard data from Santiago, Chile. Transp. Res. Part C Emerg. Technol. 2012, 24, 9–18. [Google Scholar] [CrossRef] [Scilit]
- Hu, Z.; Jingen, L.; Bing, H. Analysis of passenger travel behavior based on public transportation OD data. In Proceedings of the 6th International Conference on Information and Education Technology (ICIET 2018), Osaka, Japan, 6–8 January 2018; pp. 275–280. [Google Scholar] [CrossRef] [Scilit]
- Li, Z.; Tang, J.; Feng, T.; Liu, B.; Cao, J.; Yu, T.; Ji, Y. Investigating urban mobility through multi-source public transportation data: A multiplex network perspective. Appl. Geogr. 2024, 169, 103337. [Google Scholar] [CrossRef] [Scilit]
- Ma, X.; Tian, X.; Jin, Z.; Cui, H.; Ji, Y.; Cheng, L. Evaluation and determinants of metro users’ regularity: Insights from transit one-card data. J. Transp. Geogr. 2024, 118, 103933. [Google Scholar] [CrossRef] [Scilit]
- Sticher, S.; Blättler, K. Public-Transportation Credits: The potential of three-part tariffs in public transportation. Transp. Res. Part A Policy Pract. 2024, 182, 104022. [Google Scholar] [CrossRef] [Scilit]
- Zhao, P.; Zhang, Y. Travel behaviour and life course: Examining changes in car use after residential relocation in Beijing. J. Transp. Geogr. 2018, 73, 41–53. [Google Scholar] [CrossRef] [Scilit]
- Delbosc, A.; Naznin, F. Future life course and mobility: A latent class analysis of young adults in Victoria, Australia. Transp. Policy 2019, 77, 104–116. [Google Scholar] [CrossRef] [Scilit]
- Zhou, M.; Wang, D. Generational differences in attitudes towards car, car ownership and car use in Beijing. Transp. Res. Part D Transp. Environ. 2019, 72, 256–278. [Google Scholar] [CrossRef] [Scilit]
- Tilley, S.; Houston, D. The gender turnaround: Young women now travelling more than young men. J. Transp. Geogr. 2016, 54, 309–318. [Google Scholar] [CrossRef] [Scilit]
- Bussière, Y.D.; Madre, J.L.; Tapia-Villarreal, I. Will peak car observed in the North occur in the South? A demographic approach with case studies of Montreal, Lille, Juarez and Puebla. Econ. Anal. Policy 2019, 61, 39–54. [Google Scholar] [CrossRef] [Scilit]
- Focas, C.; Christidis, P. Peak Car in Europe? Transp. Res. Procedia 2017, 25, 531–550. [Google Scholar] [CrossRef] [Scilit]
- Kuhnimhof, T.; Zumkeller, D.; Chlond, B. Who Made Peak Car, and How? A Breakdown of Trends over Four Decades in Four Countries. Transp. Rev. 2013, 33, 325–342. [Google Scholar] [CrossRef] [Scilit]
- Wang, Y.X. Evolution of Correlation Effects and Influencing Factors of Provincial Transport Carbon Emissions in China Based on Social Network Analysis. Master’s Thesis, Chang’an University, Xi’an, China, 2020. [Google Scholar]
- Zhang, Z.; Yang, M.; Zhao, L.; Li, Z.C. Predicting urban mobility patterns with a LightGBM-enhanced gravity model: Insights from the Wuhan metropolitan area. Travel Behav. Soc. 2025, 41, 101070. [Google Scholar] [CrossRef] [Scilit]
- Zheng, Y.Y.; Shida, Y.; Takayasu, H.; Takayasu, M. Enhancing the gravity model for commuters: Time-and-spatial-structure-based improvements in Japan’s metropolitan areas. PLoS ONE 2025, 20, e0329603. [Google Scholar] [CrossRef] [Scilit] [PubMed]
- Li, J.; Ma, Y.; Li, L.; Hou, Y. Study on the Correlation Between Transportation Development and Urban Expansion in China from the Perspective of Spatio-Temporal Heterogeneity. Land 2025, 14, 2326. [Google Scholar] [CrossRef] [Scilit]
- Liu, J.; Zhu, G.; Yang, L.; Shen, Y. Suitability Assessment and Route Network Planning for Low-Altitude Transportation Agglomerations Using Multi-Source Data. Aerospace 2025, 12, 777. [Google Scholar] [CrossRef] [Scilit]
- Pelletier, M.-P.; Trépanier, M.; Morency, C. Smart card data use in public transit: A literature review. Transp. Res. Part C Emerg. Technol. 2011, 19, 557–568. [Google Scholar] [CrossRef] [Scilit]
- Hu, S.; Liang, Q.; Qian, H.; Weng, J.; Zhou, W.; Lin, P. Frequent-pattern growth algorithm based association rule mining method of public transport travel stability. Int. J. Sustain. Transp. 2021, 15, 879–892. [Google Scholar] [CrossRef] [Scilit]
- Yap, M.; Wong, H.; Cats, O. Passenger valuation of interchanges in urban public transport. J. Public Transp. 2024, 26, 100089. [Google Scholar] [CrossRef] [Scilit]
- Li, S.; Zhuang, C.; Tan, Z.; Gao, F.; Lai, Z.; Wu, Z. Inferring the trip purposes and uncovering spatio. J. Transp. Geogr. 2021, 91, 102974. [Google Scholar] [CrossRef] [Scilit]
- Bettencourt, L.M.A.; Lobo, J.; Helbing, D.; Kühnert, C.; West, G.B. Growth, Innovation, Scaling, and the Pace of Life in Cities. Proc. Natl. Acad. Sci. USA 2007, 104, 7301–7306. [Google Scholar] [CrossRef] [Scilit] [PubMed]
- Byrne, D. Class and Ethnicity in Complex Cities—The Cases of Leicester and Bradford. Environ. Plan. A 1998, 30, 703–720. [Google Scholar] [CrossRef] [Scilit]
- Sîrbu, A.; Andrienko, G.; Andrienko, N.; Boldrini, C.; Conti, M.; Giannotti, F.; Guidotti, R.; Bertoli, S.; Kim, J.; Muntean, C.I.; et al. Human Migration: The Big Data Perspective. Int. J. Data Sci. Anal. 2021, 11, 341–360. [Google Scholar] [CrossRef] [Scilit]
- Huang, S.; Gan, Y.; Chen, N.; Wang, C.; Zhang, X.; Li, C.; Horton, D.E. Urbanization Enhances Channel and Surface Runoff: A Quantitative Analysis Using Both Physical and Empirical Models over the Yangtze River Basin. J. Hydrol. 2024, 635, 131194. [Google Scholar] [CrossRef] [Scilit]
- Ji, R.; Wang, C.; Cui, A.; Jia, M.; Liao, S.; Wang, W.; Chen, N. Assessing Terrestrial Water Storage Dynamics and Multiple Factors Driving Forces in China from 2005 to 2020. J. Environ. Manag. 2024, 370, 122464. [Google Scholar] [CrossRef] [Scilit] [PubMed]
- Chen, Z.; Gong, Z.; Yang, S.; Ma, Q.; Kan, C. Impact of Extreme Weather Events on Urban Human Flow: A Perspective from Location-Based Service Data. Comput. Environ. Urban Syst. 2020, 83, 101520. [Google Scholar] [CrossRef] [Scilit] [PubMed]
- Lissoni, F. International Migration and Innovation Diffusion: An Eclectic Survey. Reg. Stud. 2018, 52, 702–714. [Google Scholar] [CrossRef] [Scilit]
- Huang, S.; Gan, Y.; Zhang, X.; Chen, N.; Wang, C.; Gu, X.; Ma, J.; Niyogi, D. Urbanization Amplified Asymmetrical Changes of Rainfall and Exacerbated Drought: Analysis Over Five Urban Agglomerations in the Yangtze River Basin, China. Earths Future 2023, 11, e2022EF003117. [Google Scholar] [CrossRef] [Scilit]
- Ma, L.; Xiang, L.; Wang, C.; Chen, N.; Wang, W. Spatiotemporal Evolution of Urban Carbon Balance and Its Response to New-Type Urbanization: A Case of the Middle Reaches of the Yangtze River Urban Agglomerations, China. J. Clean. Prod. 2022, 380, 135122. [Google Scholar] [CrossRef] [Scilit]
- Wen, H.; Liu, Y.; Du, H.; Chun, C.; Dong, H. Annual Transport Operation Report in the Year 2015 of Beijing; Transportation Institute: Beijing, China, 2015. [Google Scholar]
- Xue, G.; Gong, D.; Zhang, J.; Zhang, P.; Tai, Q. Passenger travel patterns and behavior analysis of long-term staying in subway system by massive smart card data. Energies 2020, 13, 2670. [Google Scholar] [CrossRef] [Scilit]
- City Population. Shanghai, China. 2025. Available online: https://www.citypopulation.de/en/china/shanghai/admin/ (accessed on 31 May 2025).
- Google LLC. Google Maps. Available online: https://maps.google.com (accessed on 27 March 2023).
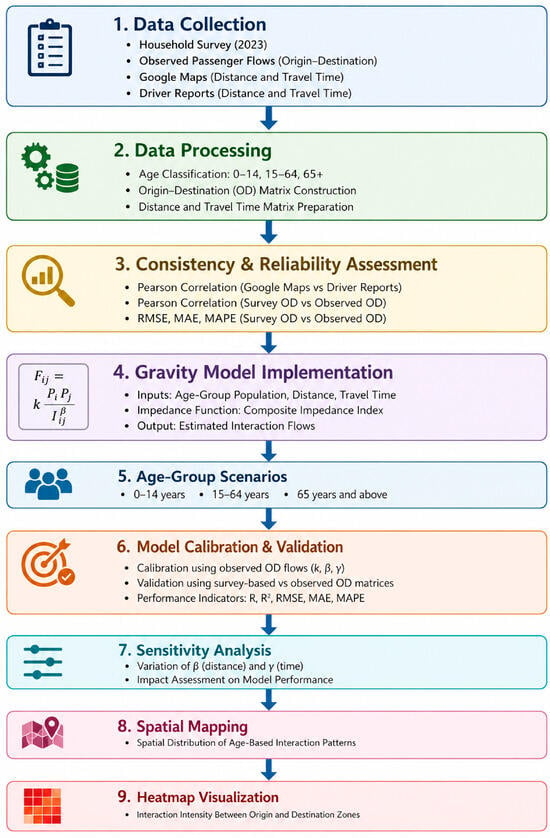
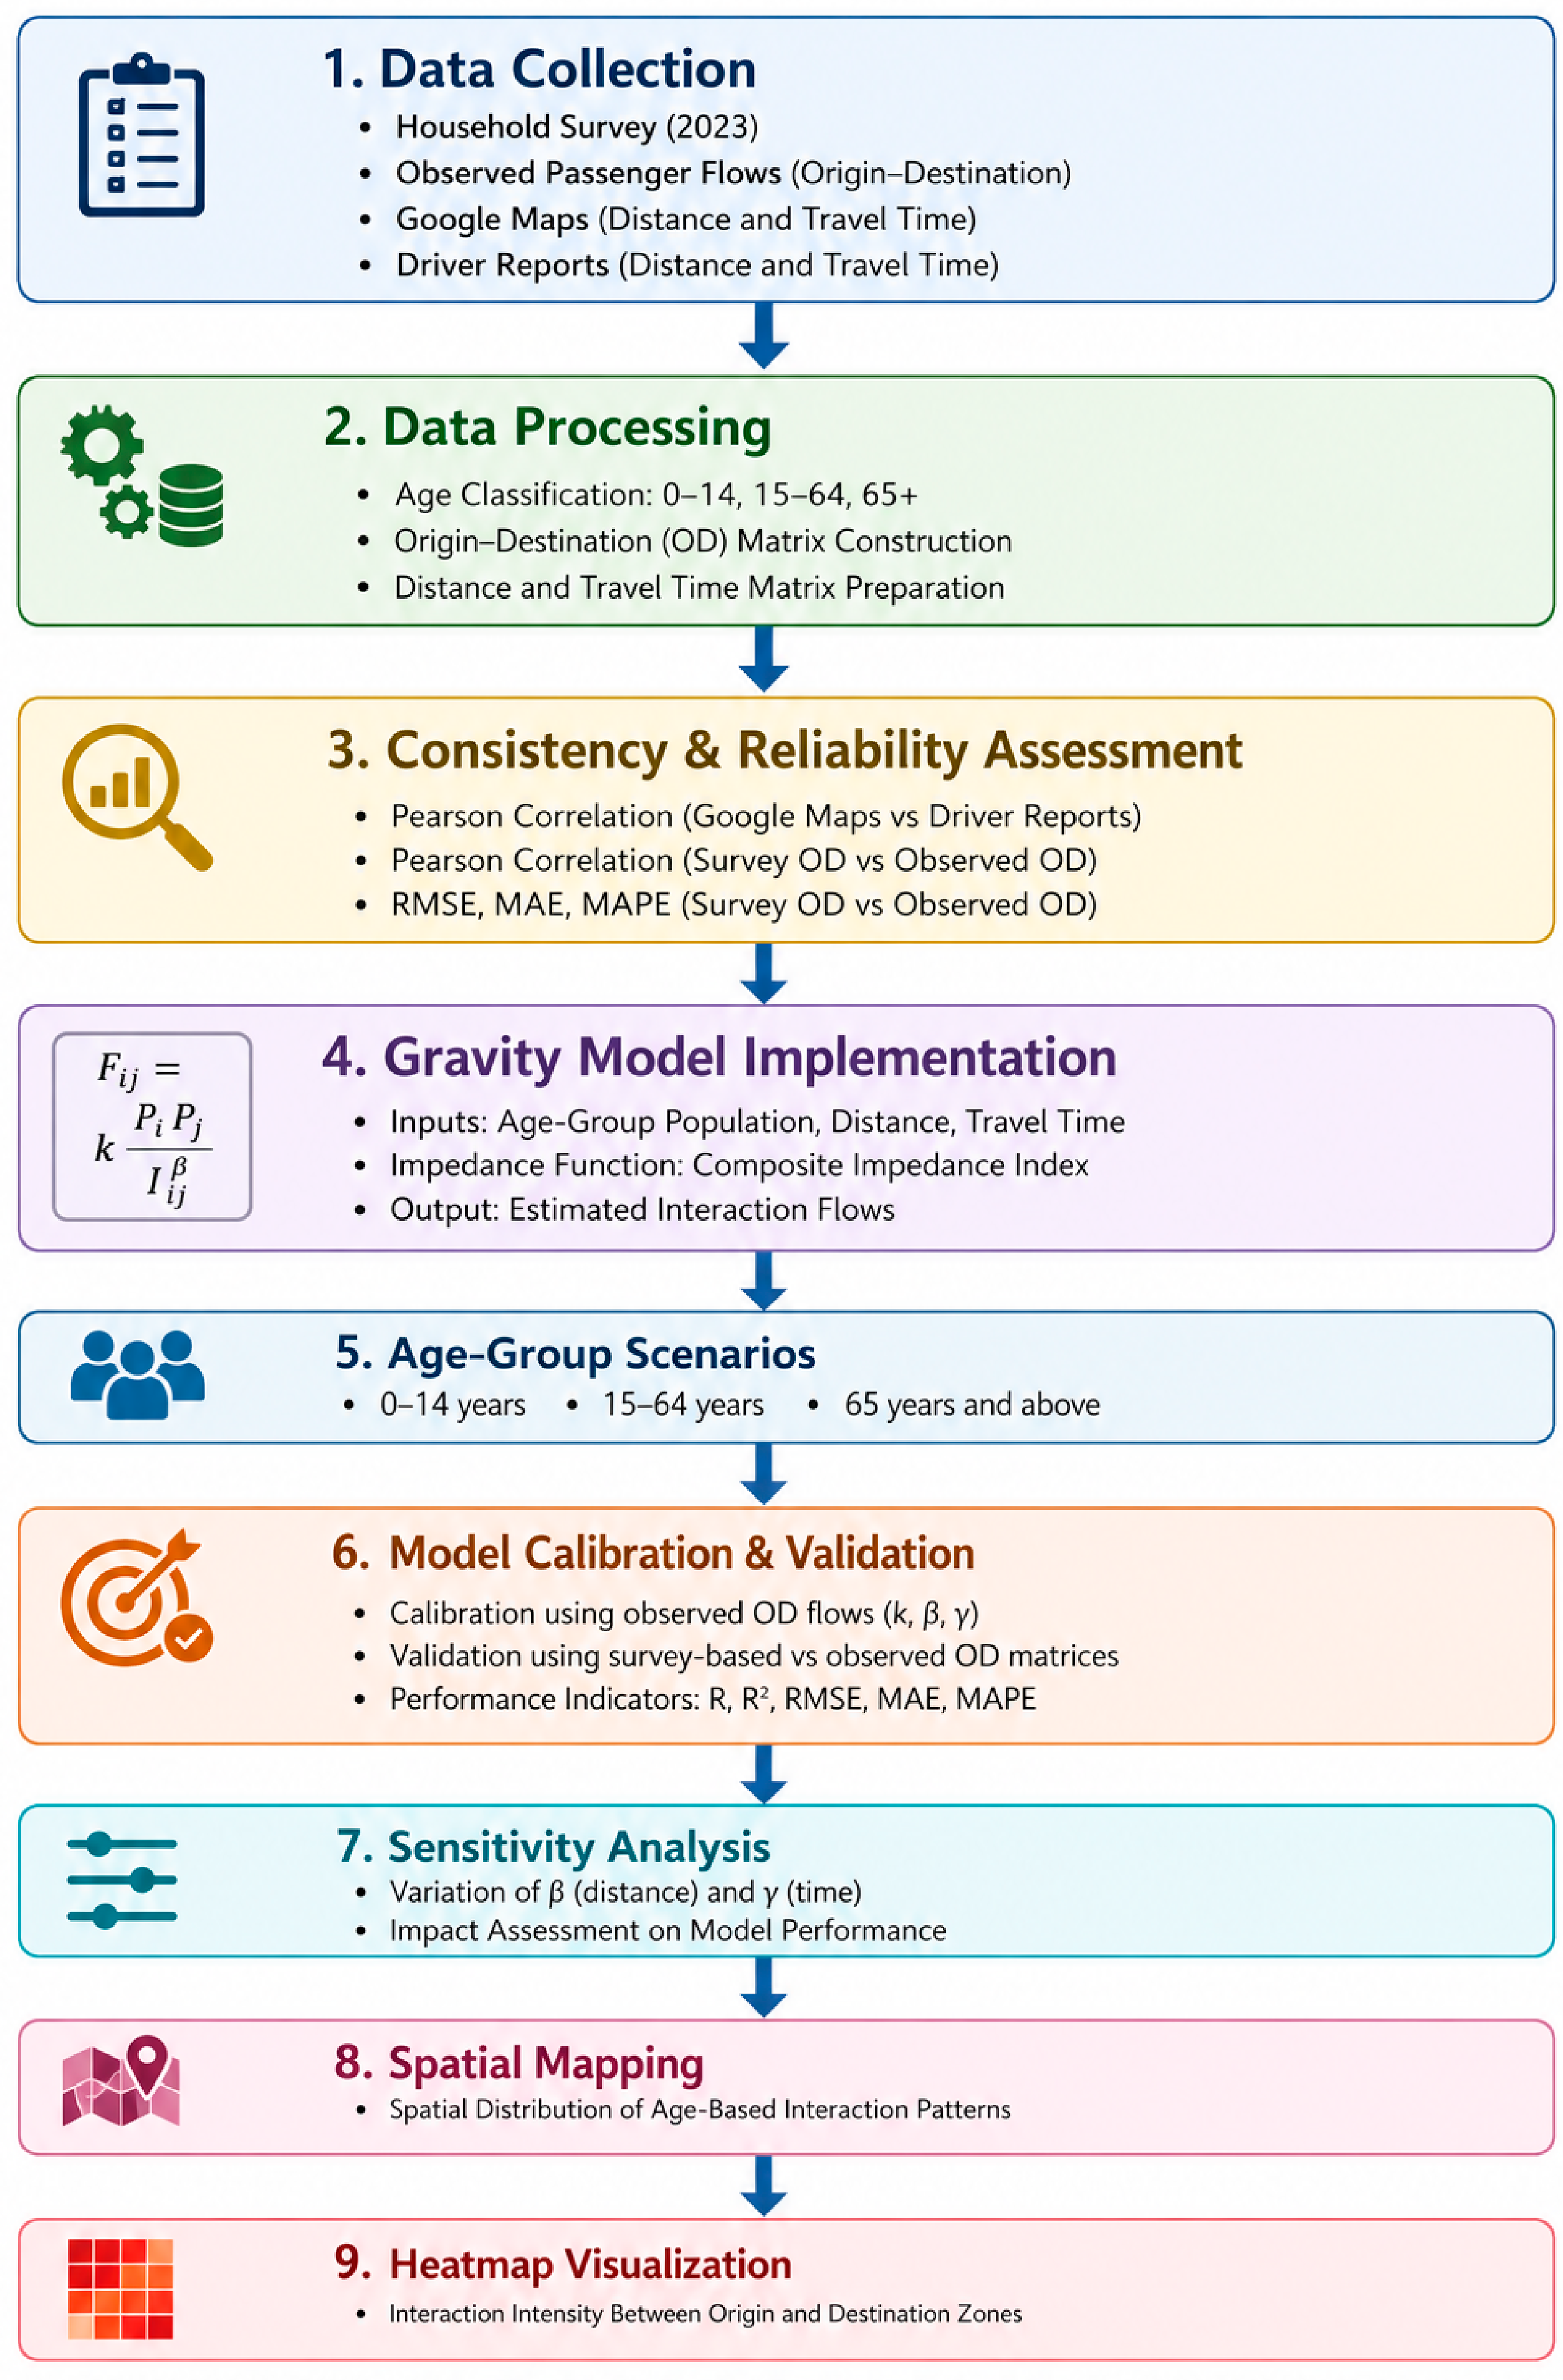
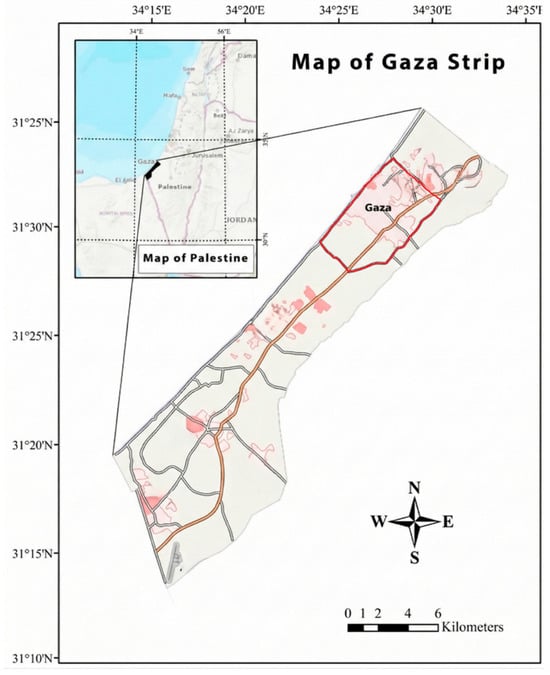
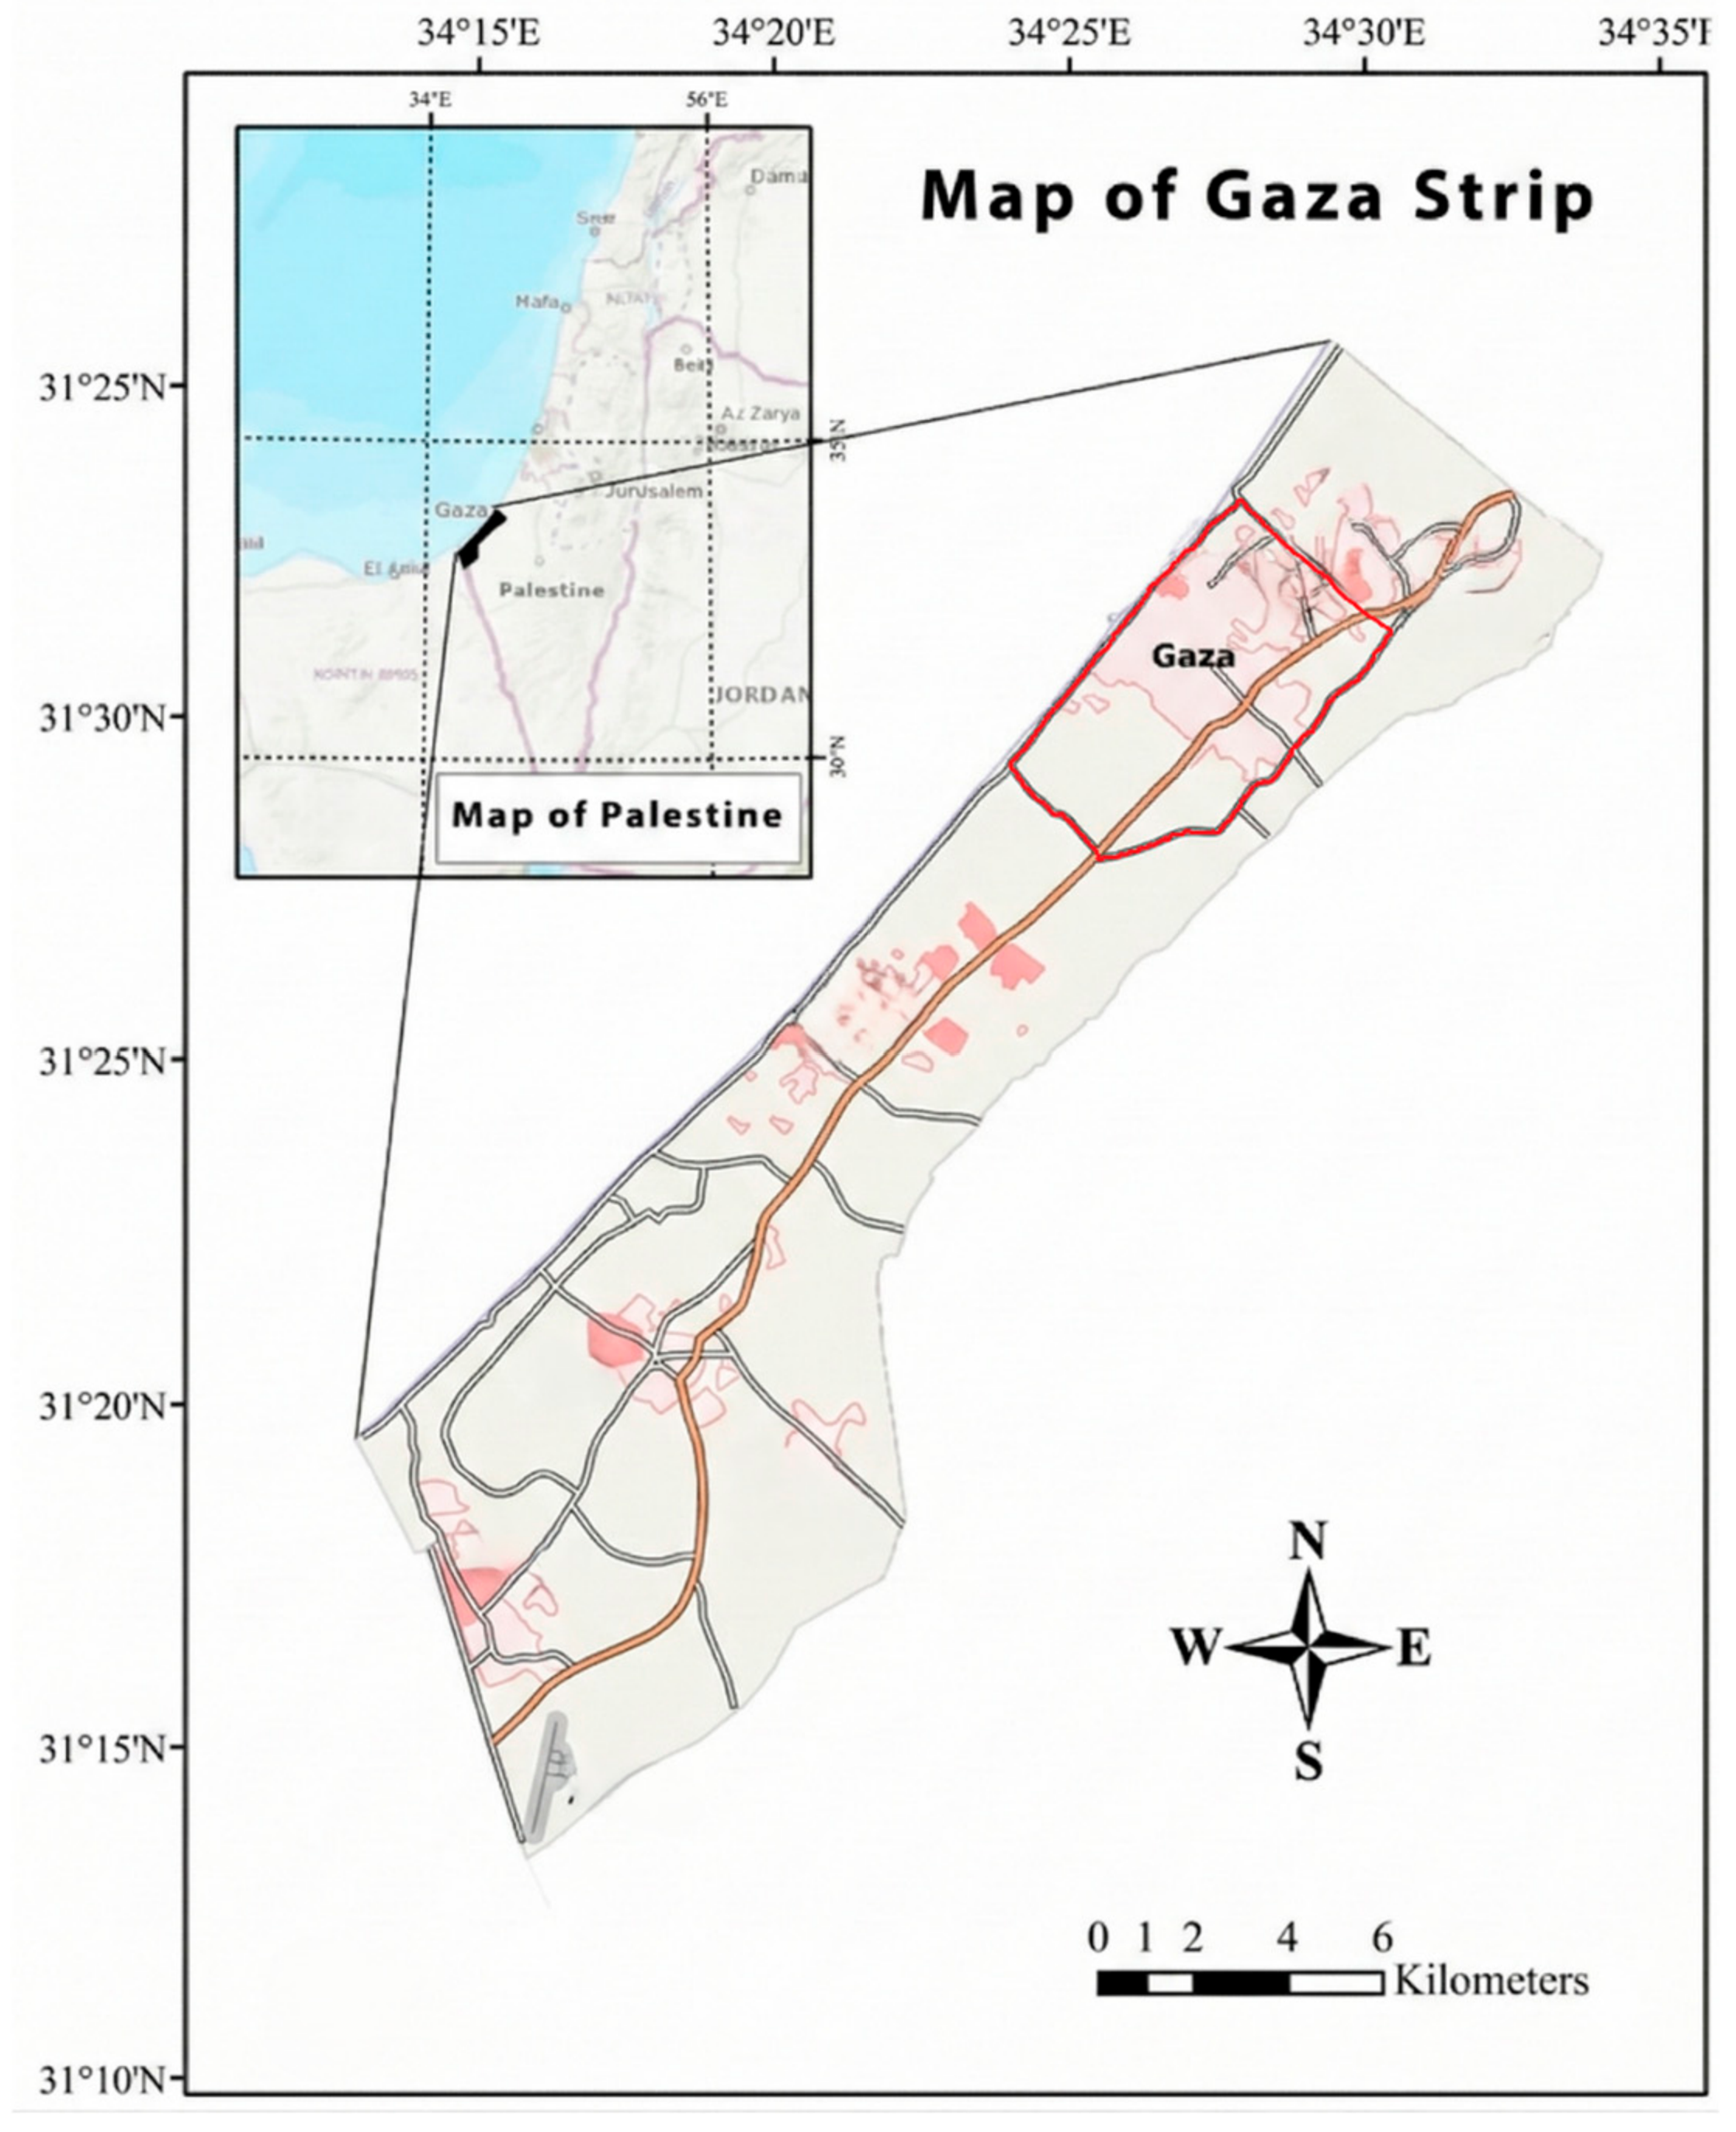
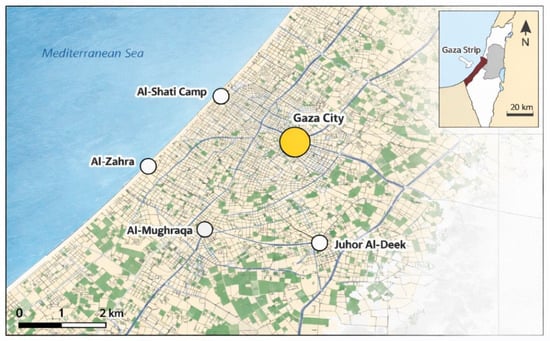
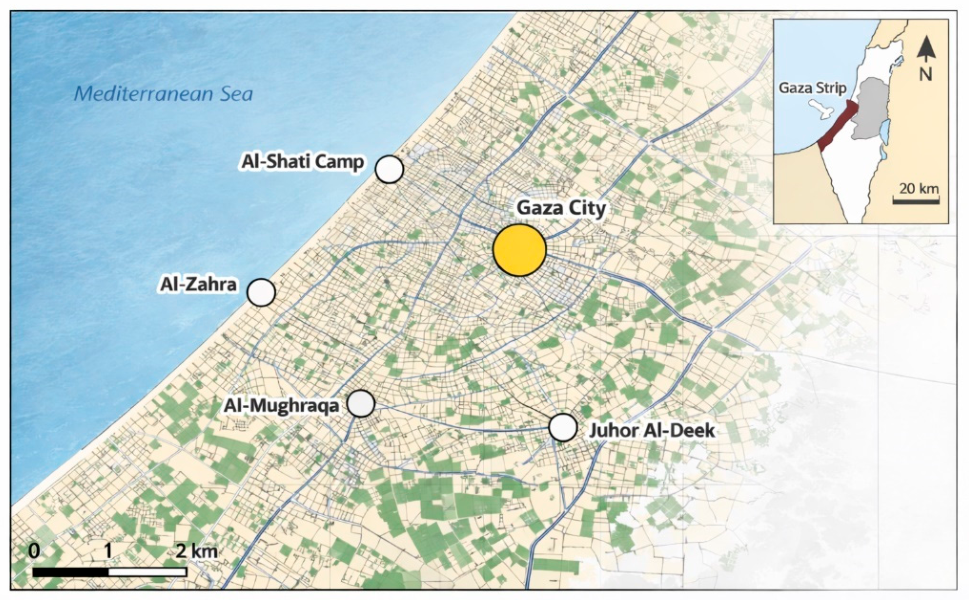
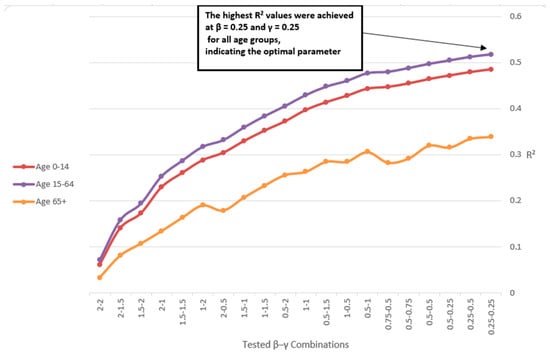
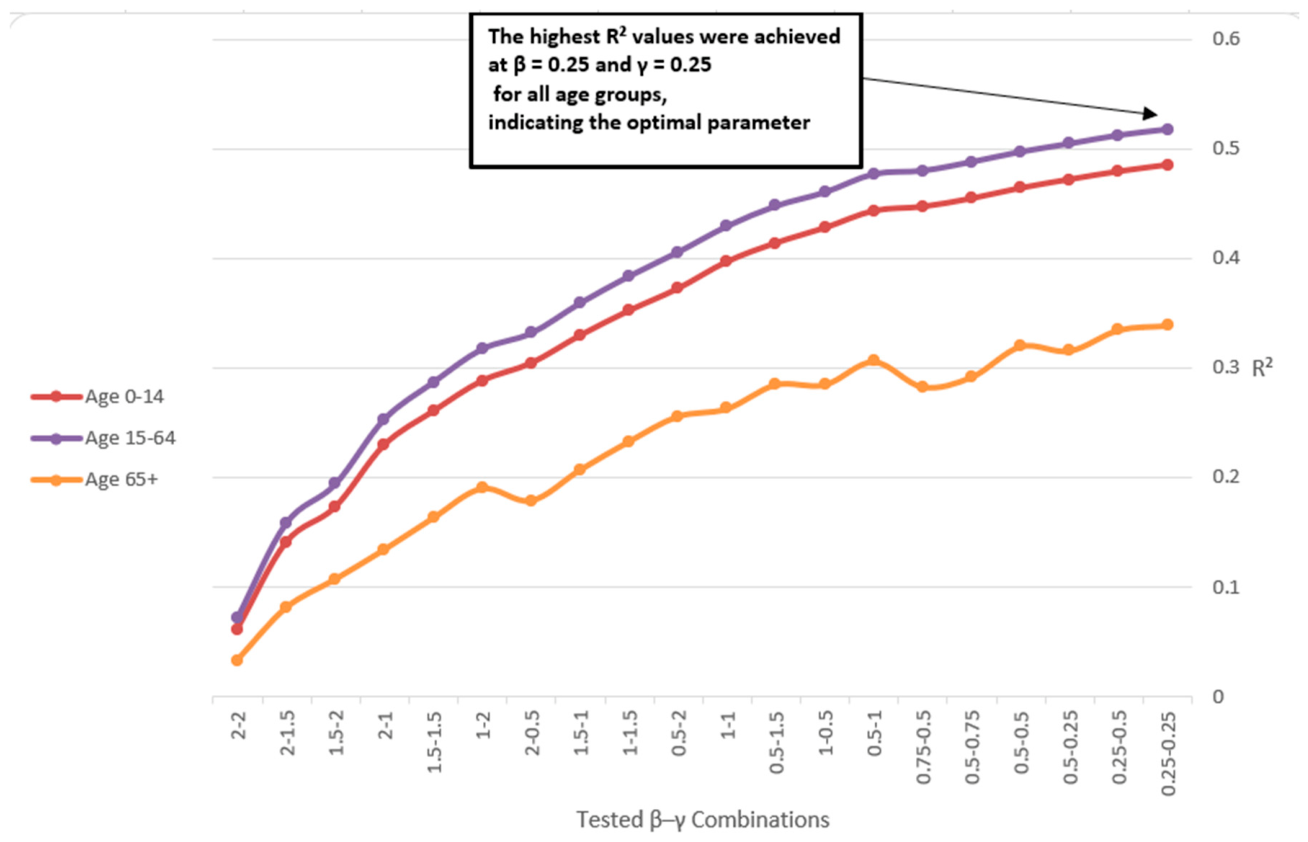
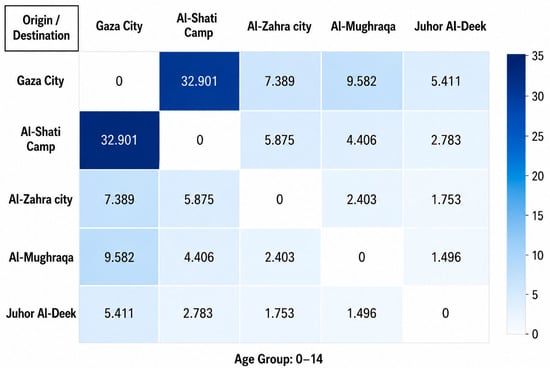
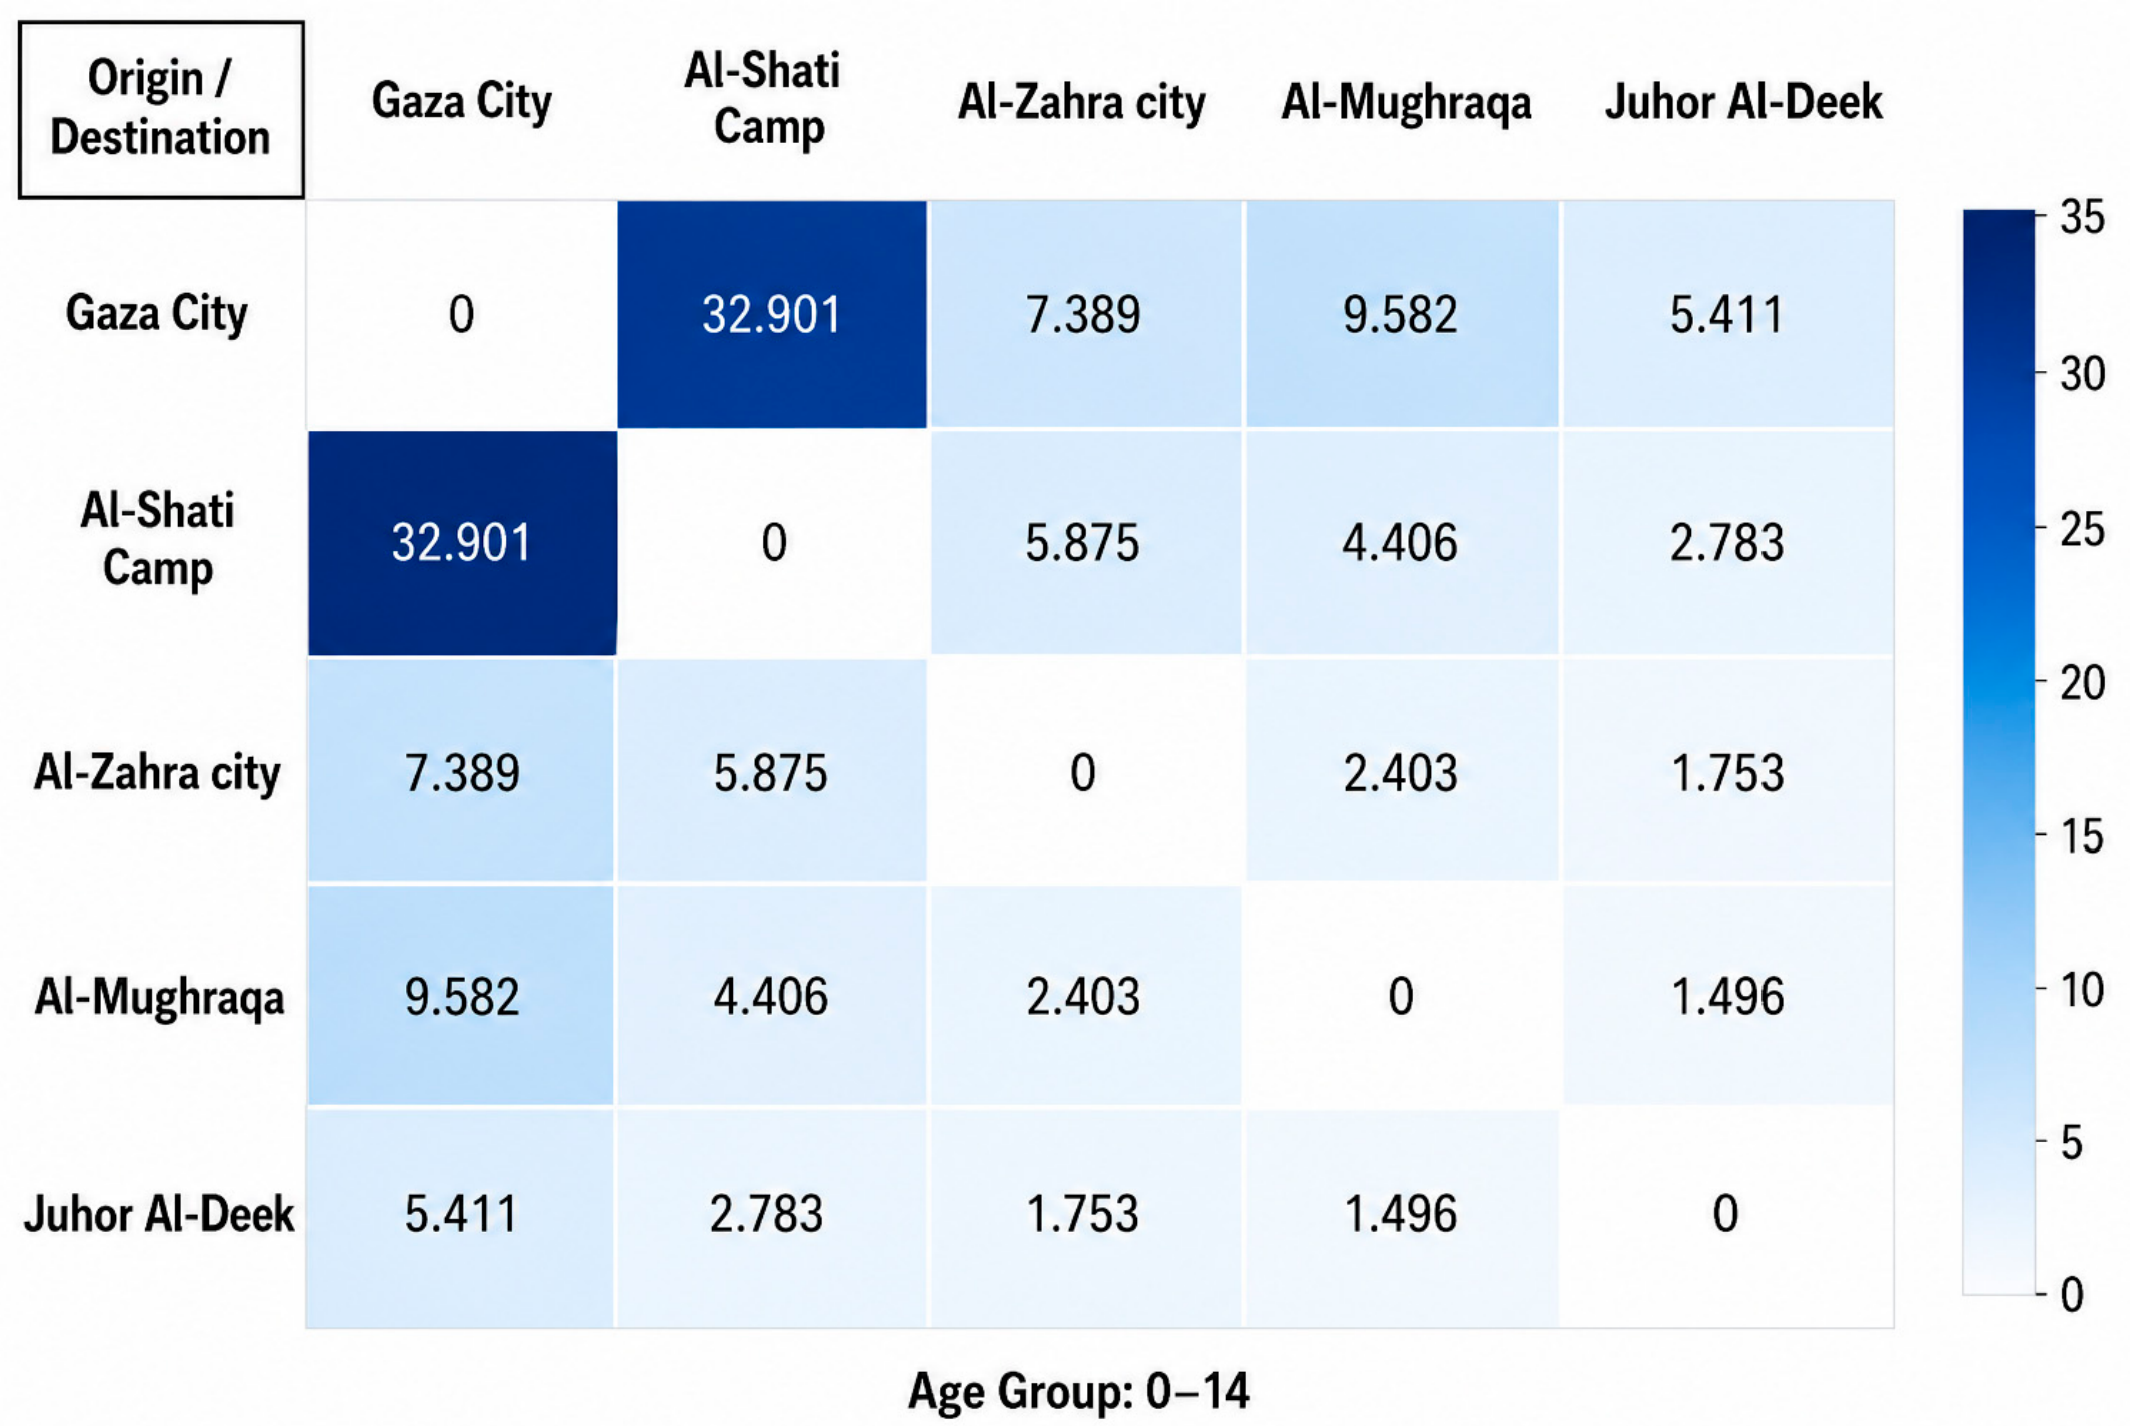
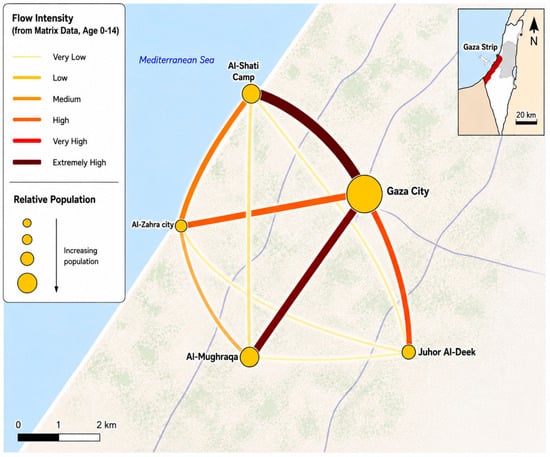
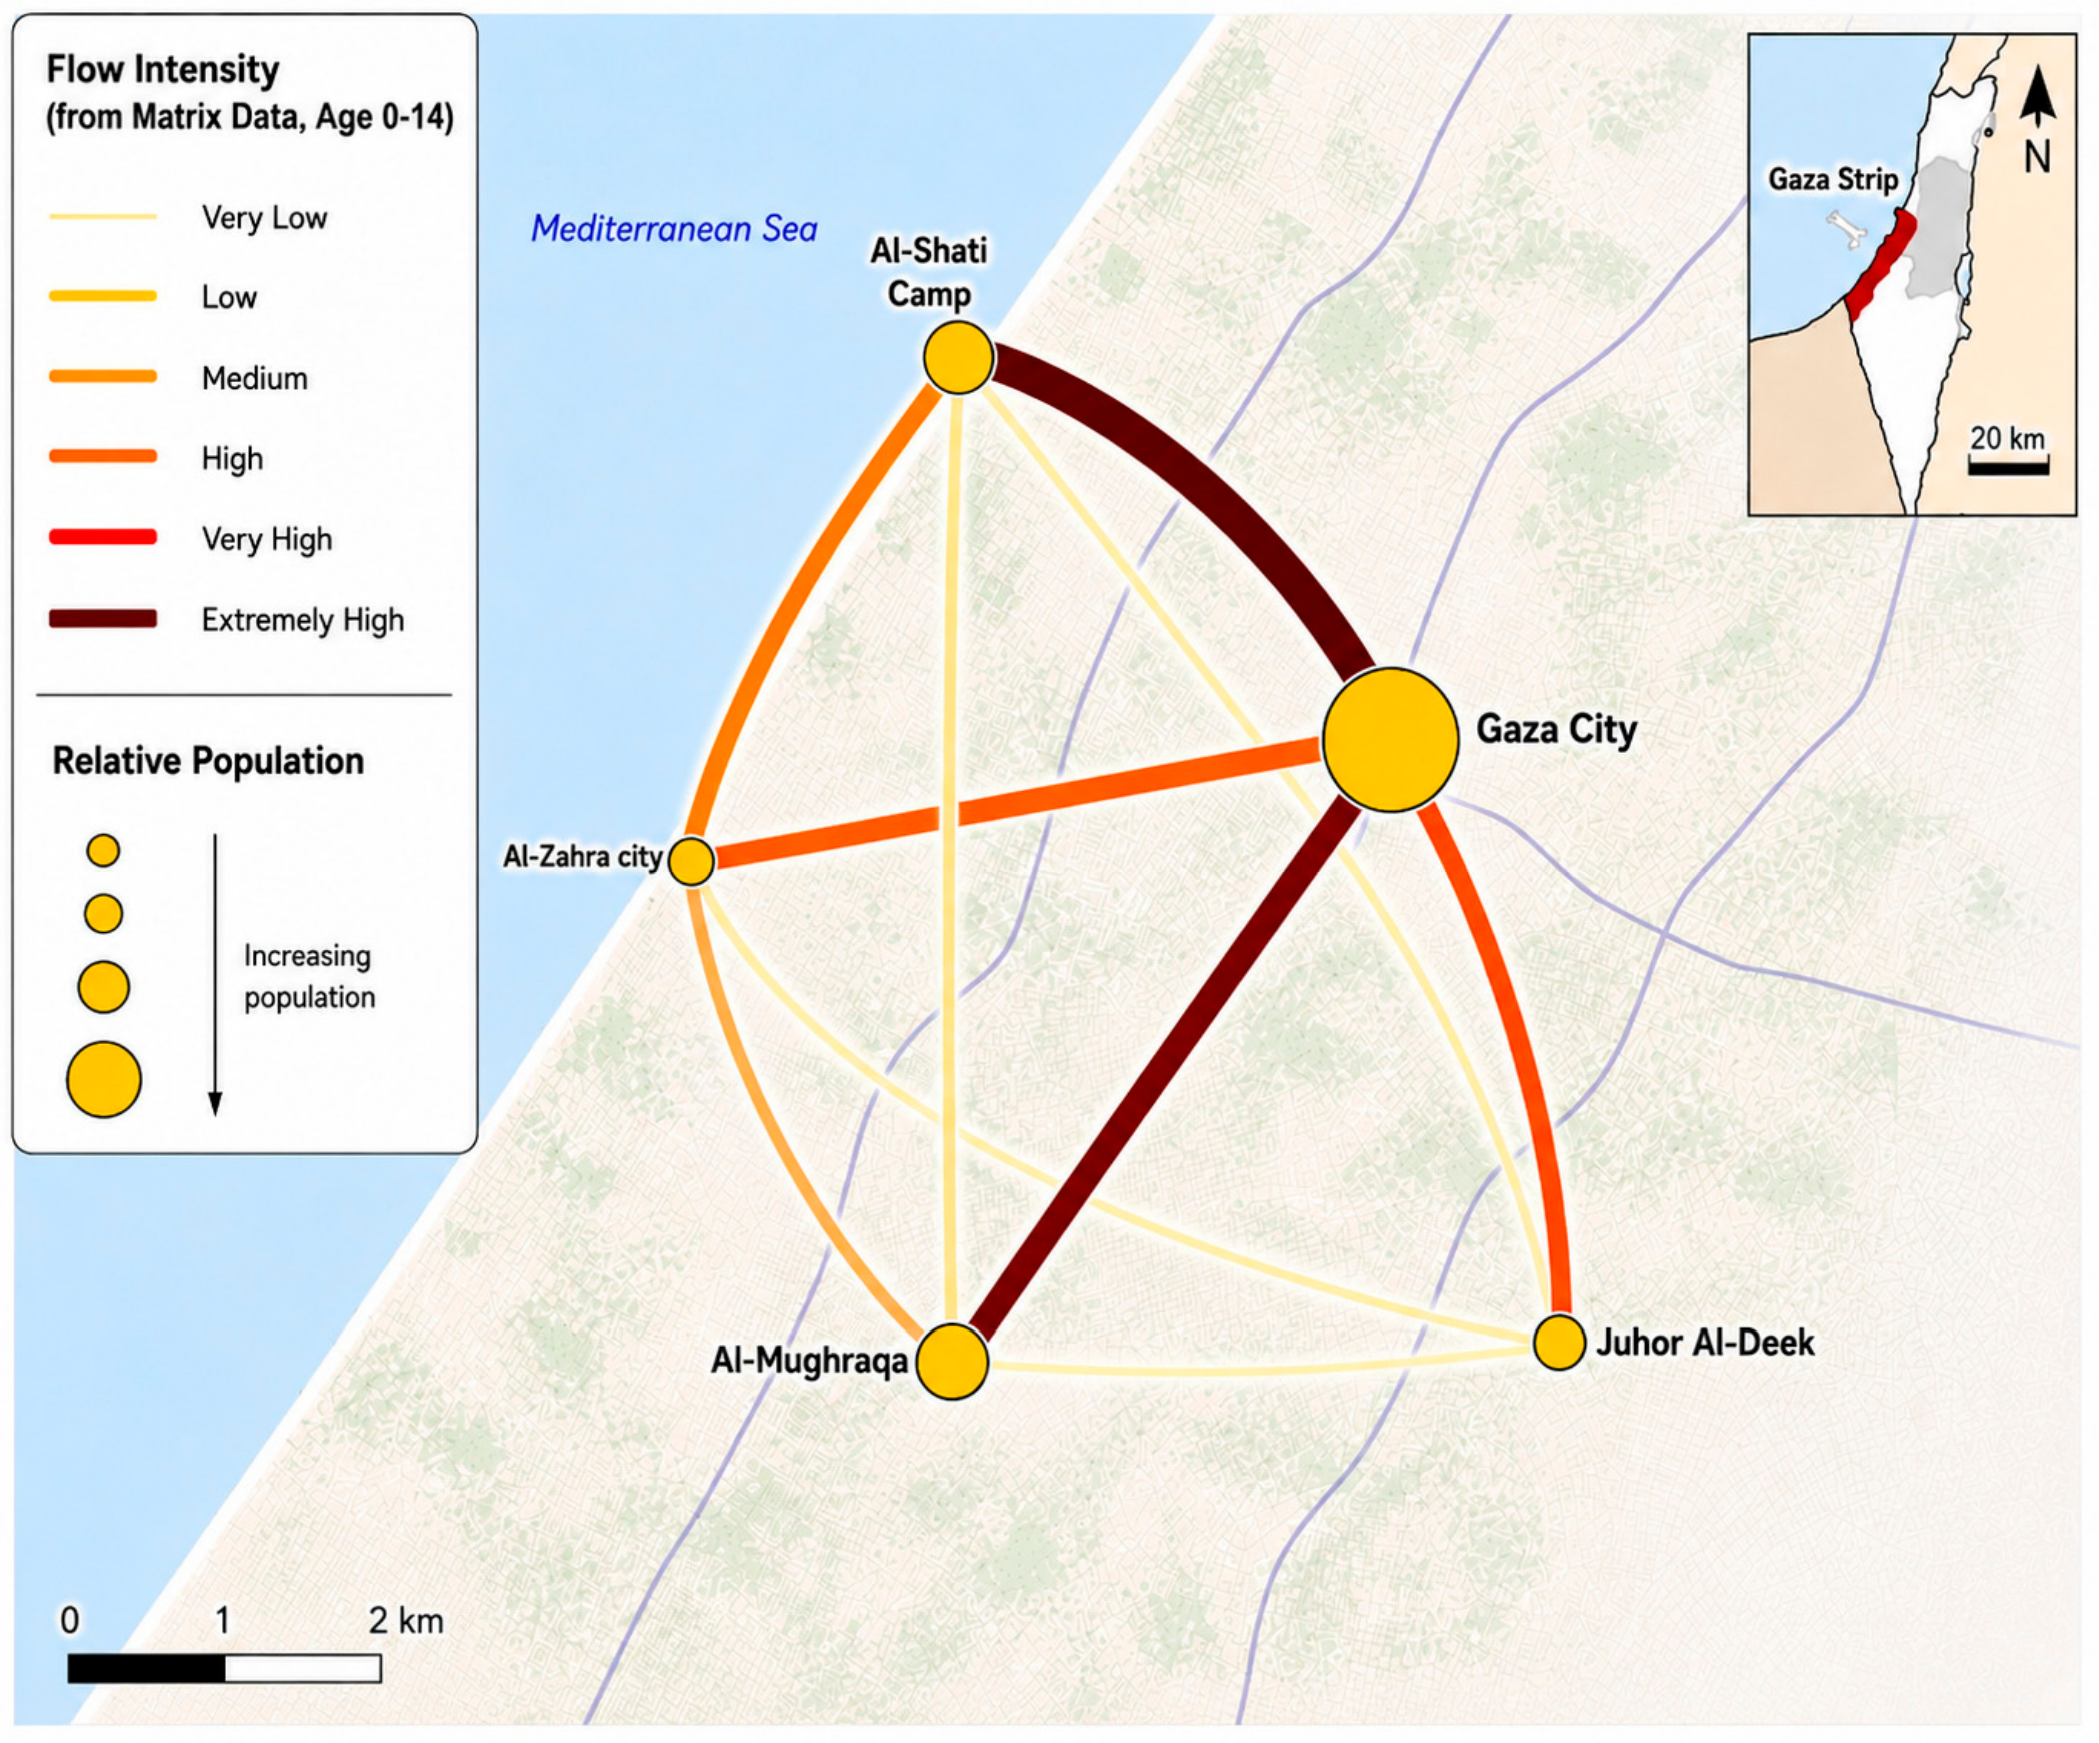
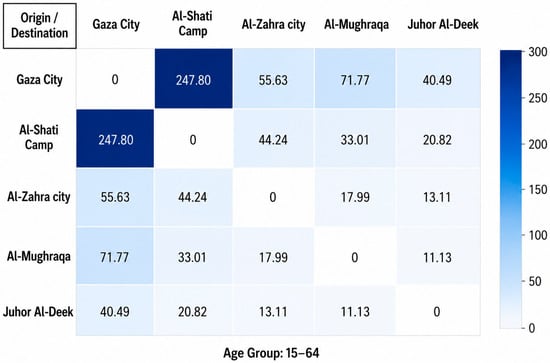
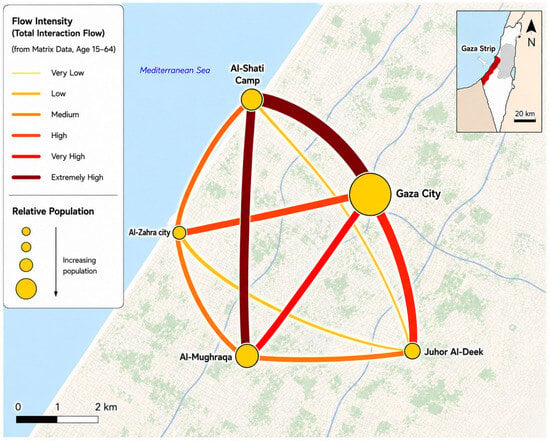
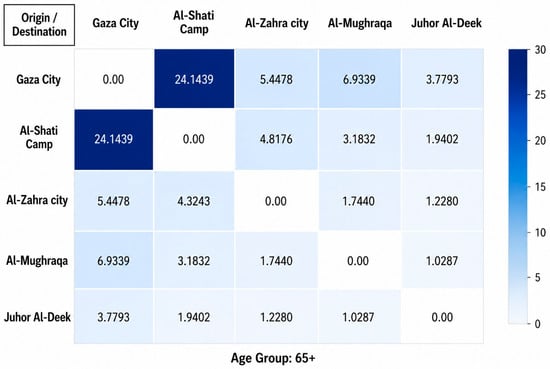
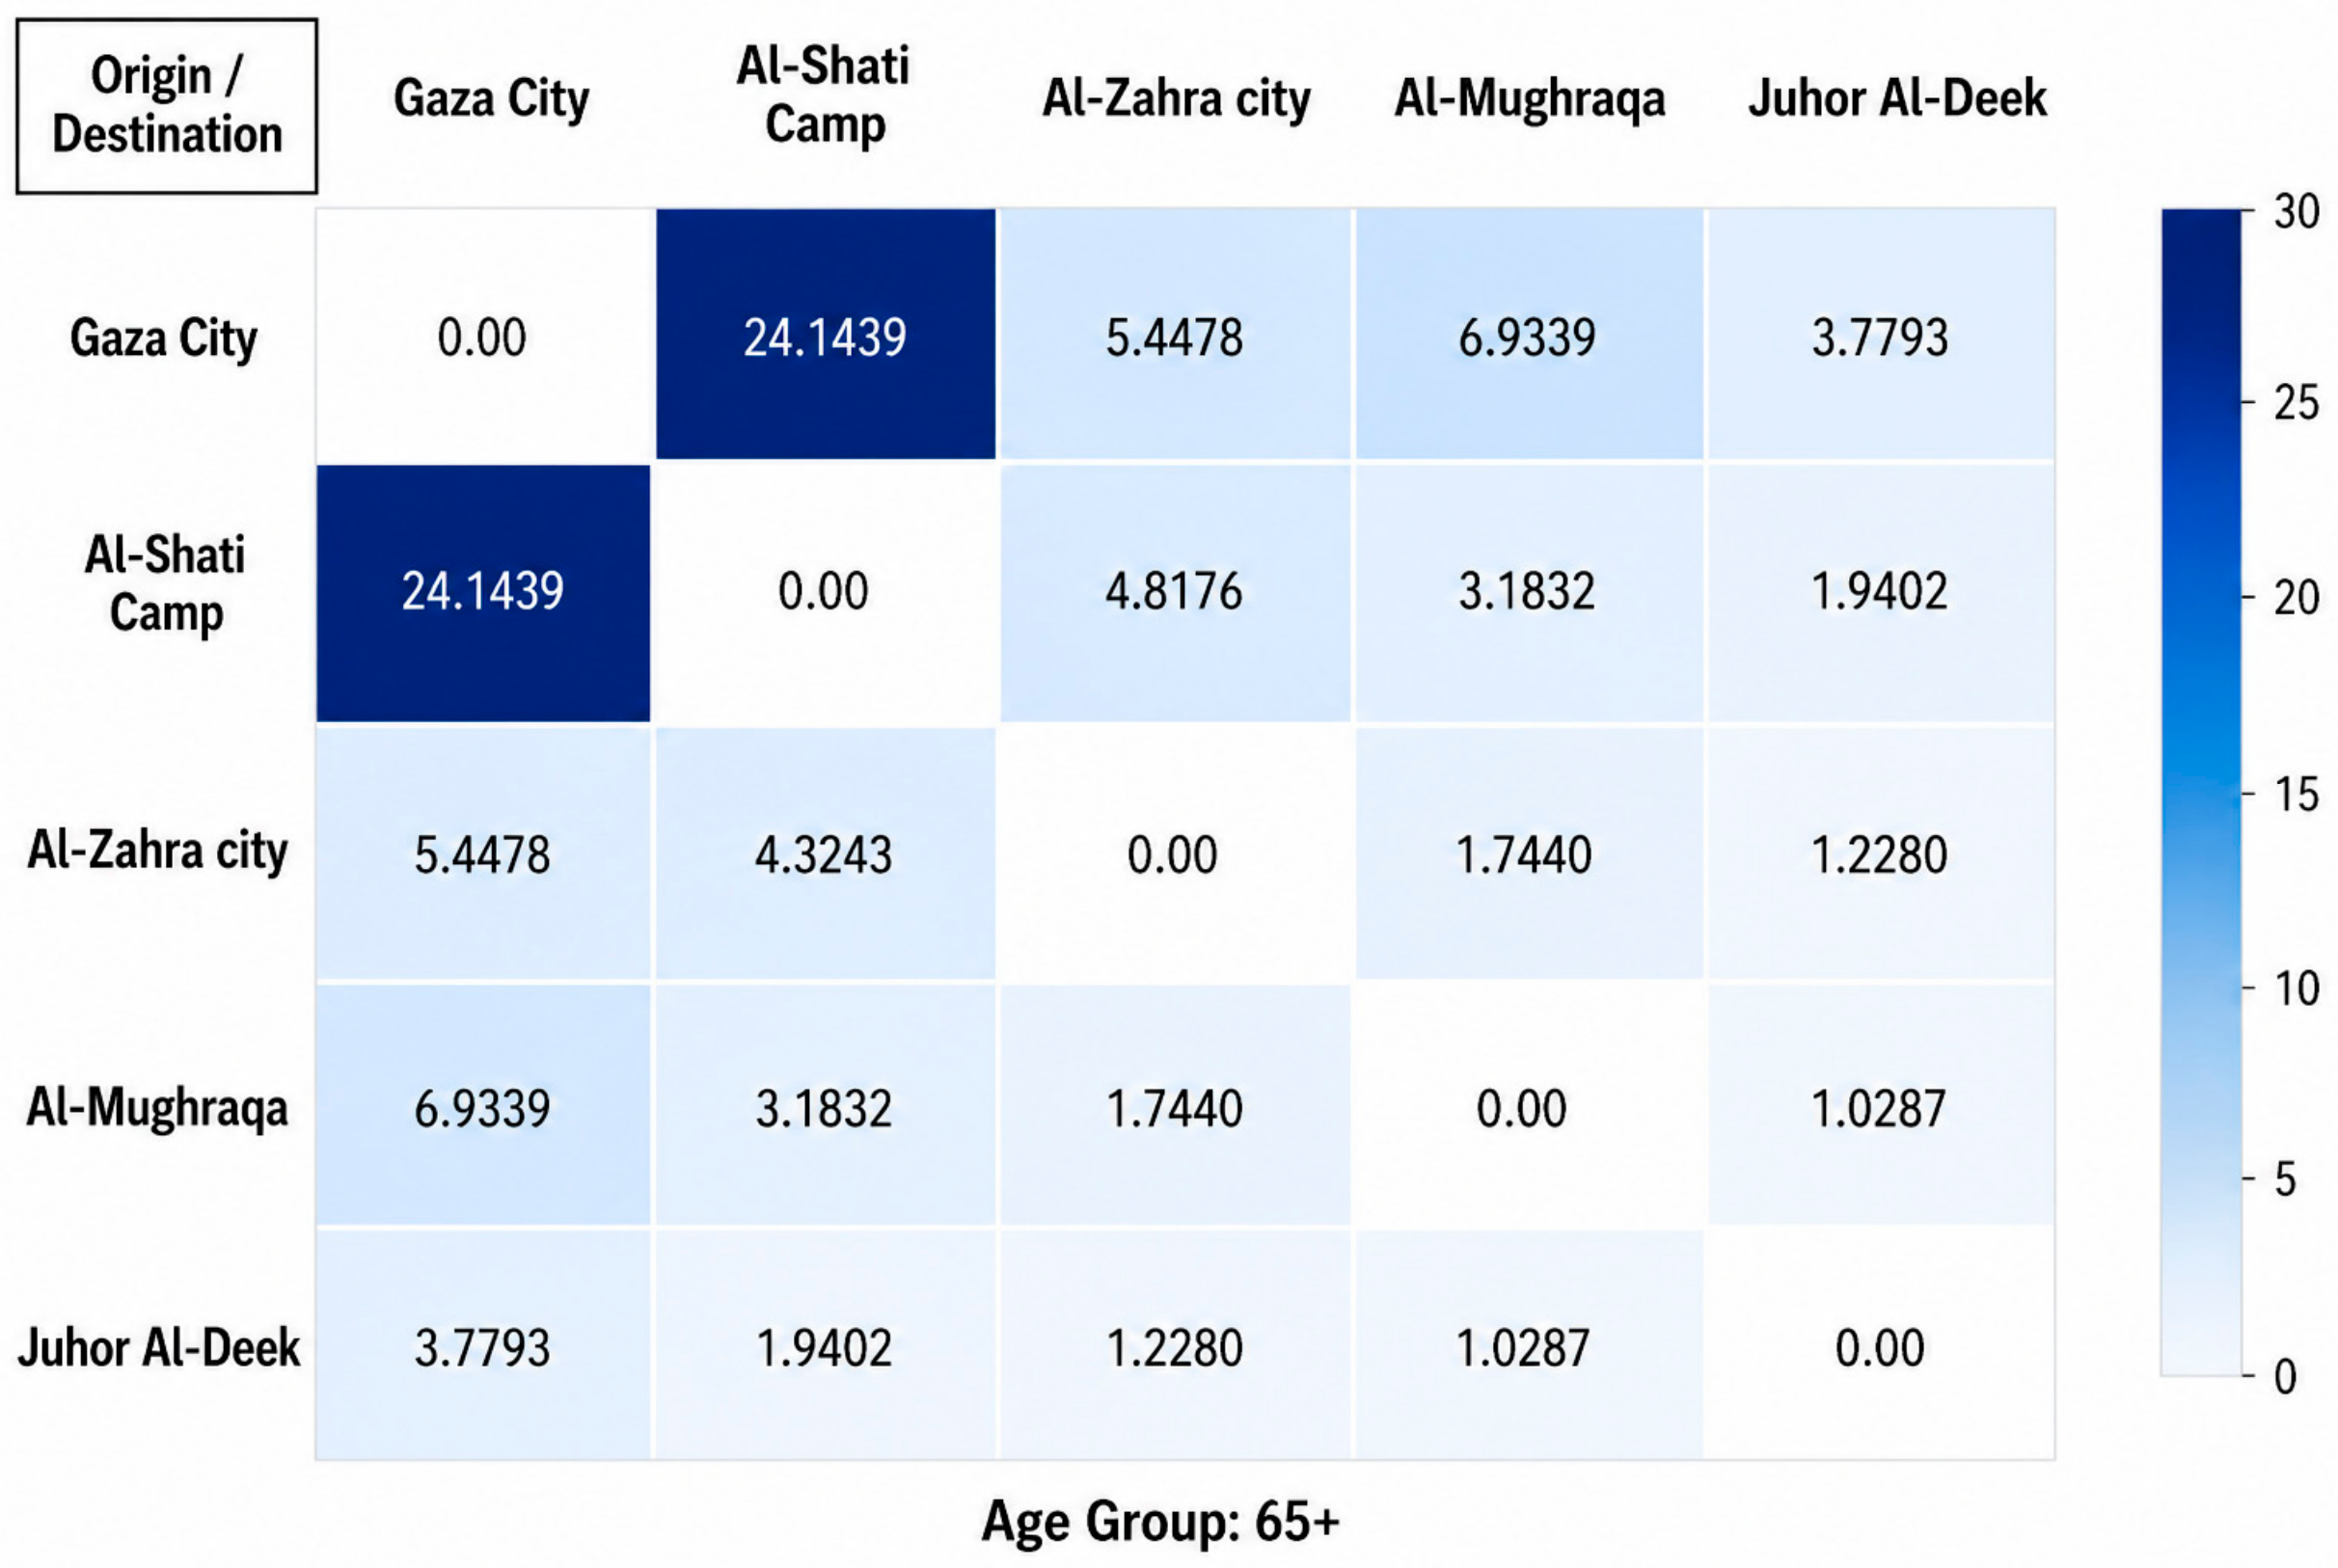
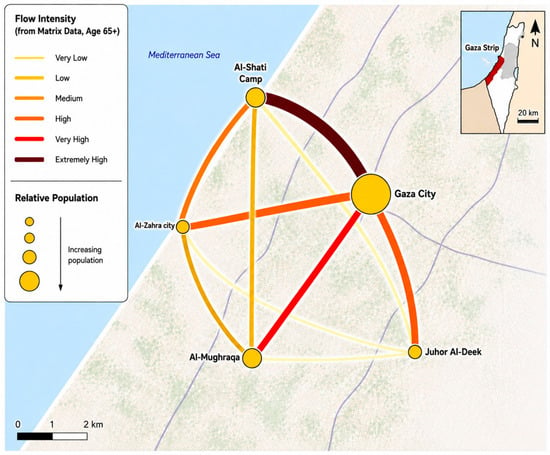
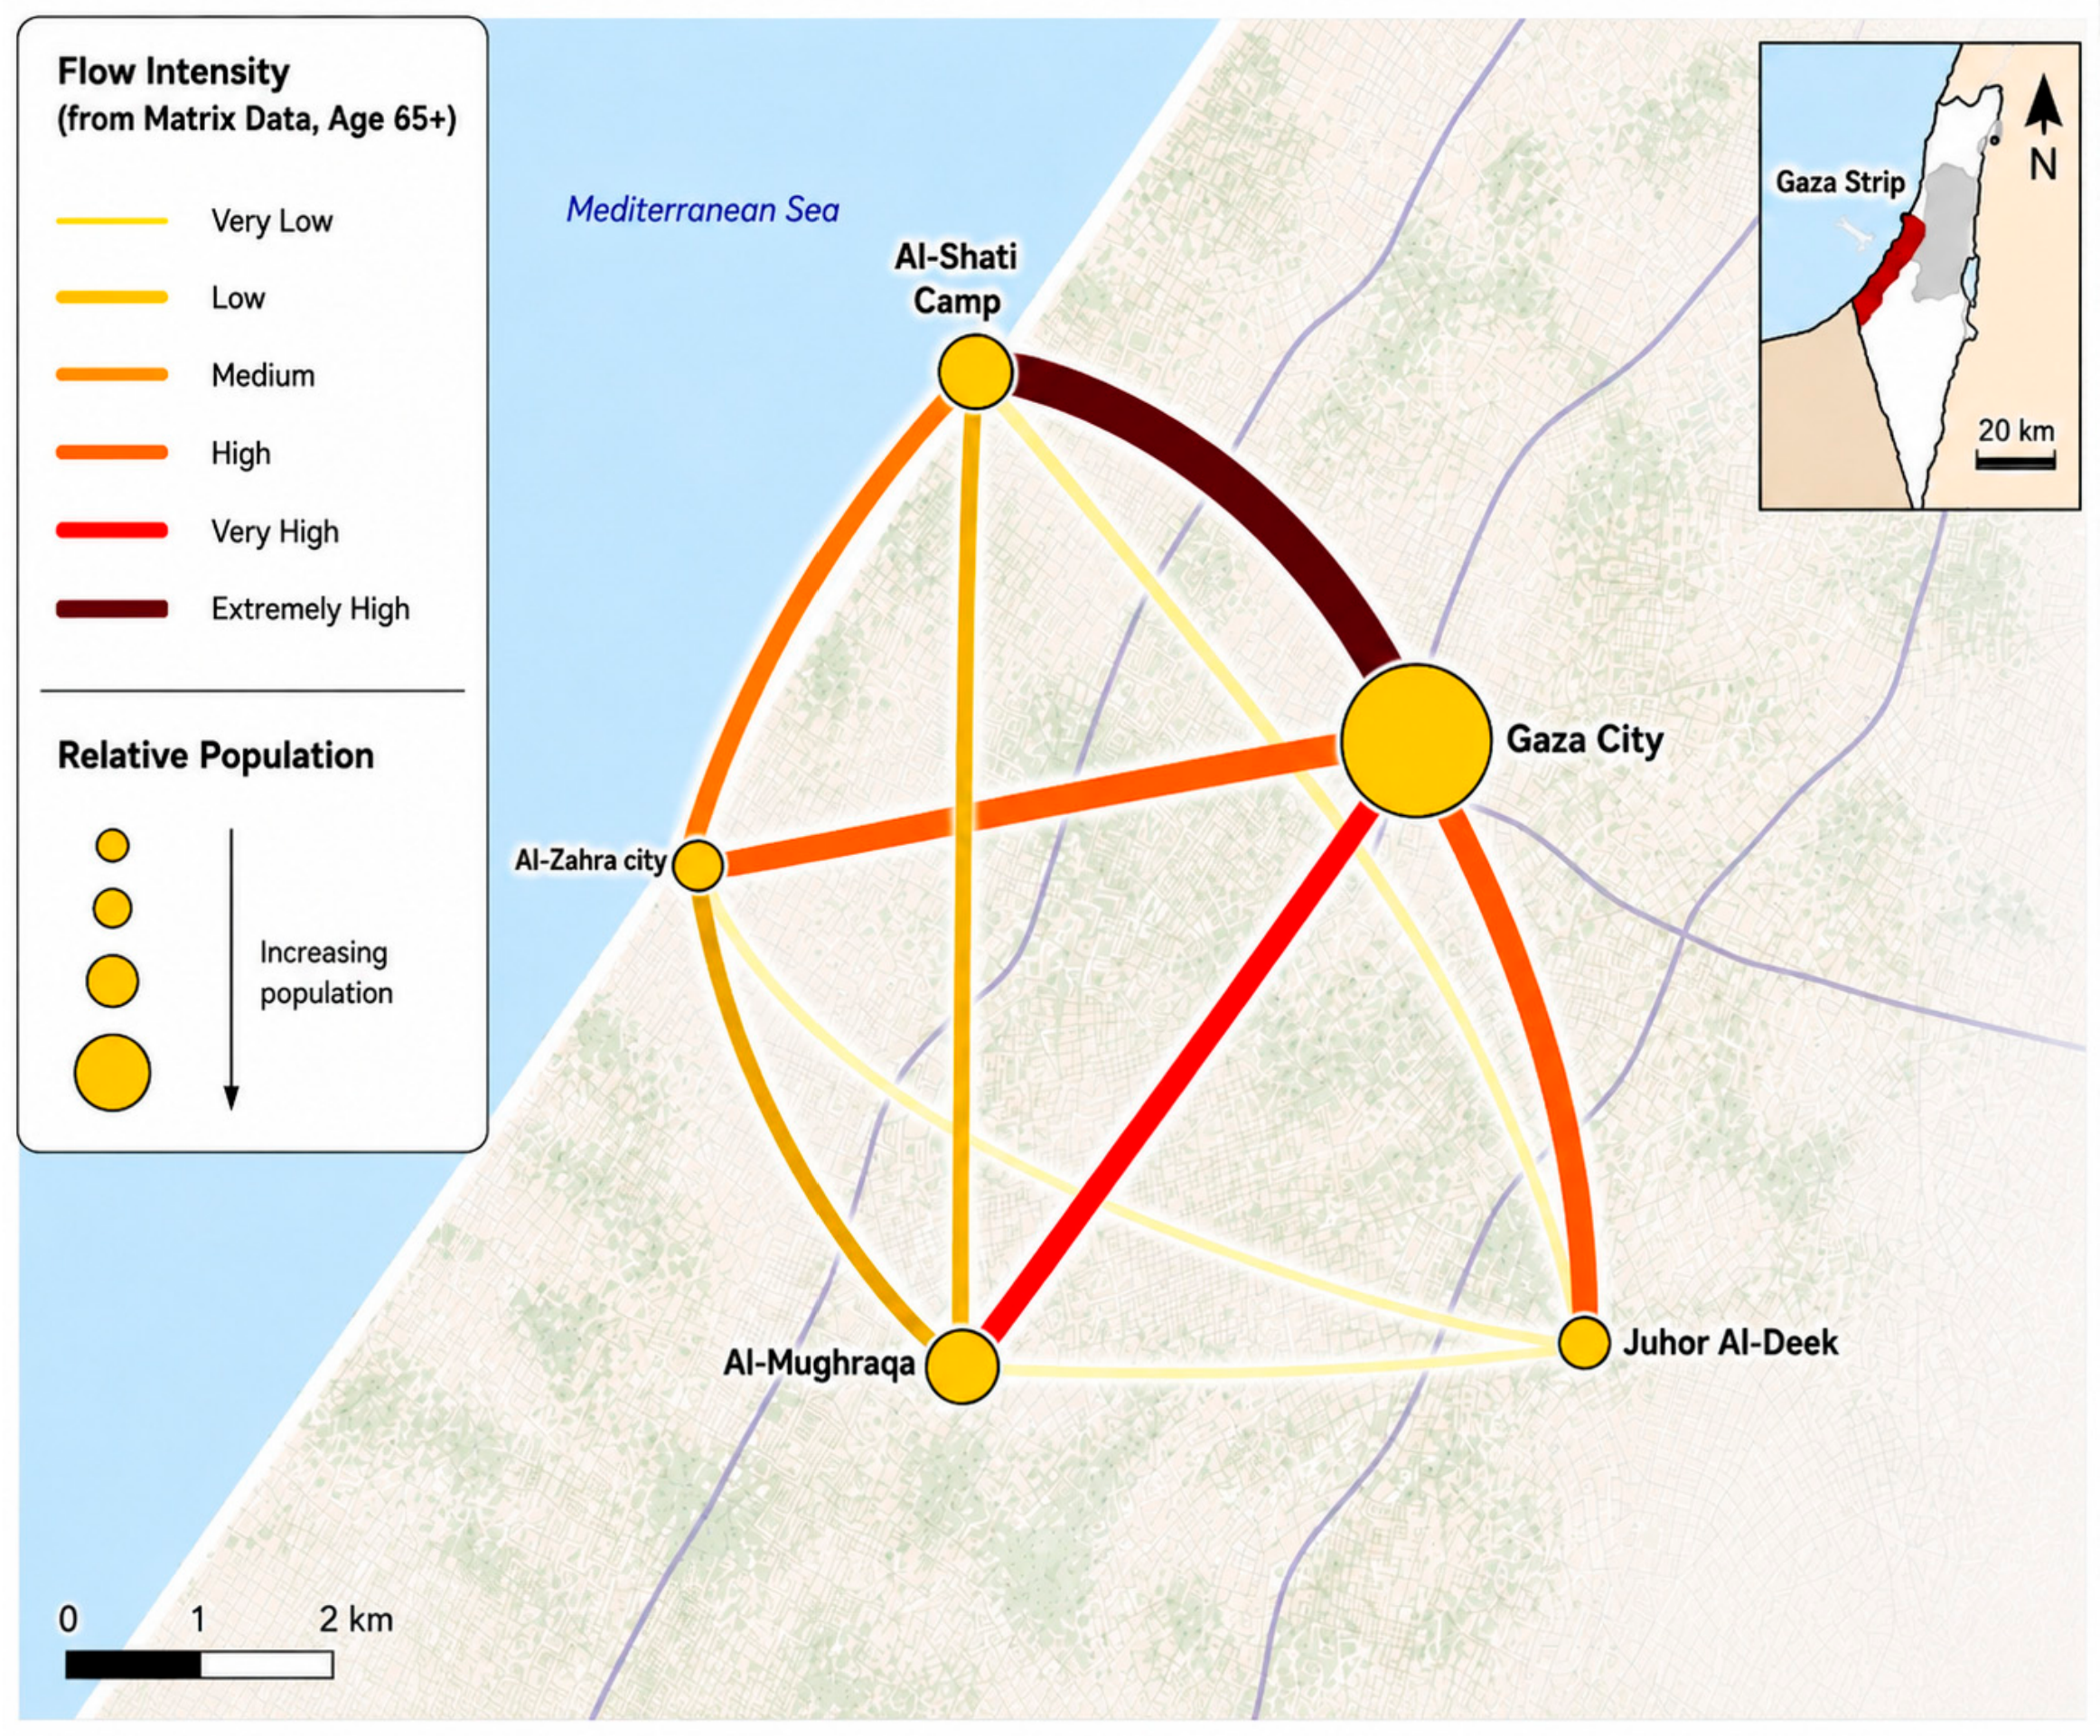

Disclaimer/Publisher’s Note: The statements, opinions and data contained in all publications are solely those of the individual author(s) and contributor(s) and not of MDPI and/or the editor(s). MDPI and/or the editor(s) disclaim responsibility for any injury to people or property resulting from any ideas, methods, instructions or products referred to in the content. |
© 2026 by the authors. Licensee MDPI, Basel, Switzerland. This article is an open access article distributed under the terms and conditions of the Creative Commons Attribution (CC BY) license.