


Abstract
The transition to a circular economy (CE) presents significant financial challenges and opportunities for public waste management and fiscal governance in Slovakia. This study examines the financial implications of the circular economy transition for public expenditure related to municipal waste management in Slovakia using national-level aggregated data. Unlike previous studies that primarily focus on environmental performance, this research develops an integrated empirical framework combining environmental, financial, and governance indicators to evaluate the fiscal implications of the CE transition. A multivariate regression model was estimated using national environmental statistics, national financial data, and waste management indicators. The model demonstrated good explanatory performance (adjusted R2 = 0.842; F = 15.87, p < 0.001). The results indicate that resource recovery, environmental investment, and CE policy implementation are significantly associated with municipal waste management expenditure, while the COVID-19 period was associated with higher expenditure. The findings suggest that although the CE transition requires substantial initial investment, effective resource recovery and appropriate public financial governance may contribute to the long-term fiscal sustainability of municipal waste management systems. The study provides evidence that may support policymakers and public authorities in developing evidence-based budgeting, more effective investment planning, and financially sustainable implementation of circular economy policies in Slovakia.
1. Introduction
The implementation of CE policies in municipal waste management is constrained not by environmental ambition, but by limited fiscal capacity and fragmented funding systems. In the Slovak Republic, municipalities operate under limited financial autonomy and depend heavily on external funding, constraining their ability to finance CE-related investments. These constraints translate into measurable fiscal effects, including reduced investment capacity, inefficient cost allocation, and limited ability to generate revenue from circular activities.
Although the CE is increasingly positioned as a long-term policy objective by the European Union (EU) and national governments, its practical implications for public expenditure and waste management financing remain underexplored. The existing literature on the CE largely focuses on normative frameworks and technological innovation, while providing limited empirical evidence on its fiscal implications for public expenditure and waste management financing. In particular, there is little empirical evidence on how CE strategies affect public expenditure patterns, revenue generation, or cost-saving mechanisms within local governance systems.
Although previous empirical studies have examined individual dimensions of CE implementation, including waste generation, recycling performance, landfill reduction, and environmental efficiency, considerably less attention has been devoted to understanding how these environmental processes translate into public financial performance. Existing research generally analyses environmental indicators separately from public financial indicators related to municipal waste management, providing limited evidence on how the CE transition influences expenditure structures, investment capacity, revenue generation, and long-term fiscal sustainability. Consequently, the fiscal sustainability of municipal waste management should be considered an integral component of CE evaluation.
This study addresses this gap by providing an empirical assessment of how CE adoption affects public financial performance, including expenditure, revenue generation, and cost efficiency. It explores the structure and performance of CE-related financial flows, including capital investments in environmental infrastructure, income from circular services (e.g., recycling, composting, energy recovery), and savings from landfill diversion or green procurement.
The article is guided by the following research questions:
- What financial challenges and opportunities does the CE present to public authorities in Slovakia?
- How can CE practices contribute to revenue generation and cost savings in municipal waste management?
- What are the implications of CE implementation for public budgeting, investment strategies, and fiscal governance?
Public authorities responsible for municipal waste management services play a central role in this transformation. They are responsible for delivering services such as waste management, water provision, energy distribution, and infrastructure maintenance—all domains directly affected by CE reforms. At the same time, they must align these services with EU and national environmental targets, often without adequate fiscal tools or funding autonomy. These competing pressures are particularly acute in Central and Eastern Europe, where decentralization remains incomplete and administrative capacities are uneven.
Recent research has explored CE adoption in urban settings, especially in relation to environmental behavior change and infrastructure modernization [1,2,3,4]. Studies by [5,6] examined CE financing tools at the corporate and national levels [7,8], while other studies focused on economic instruments and regulatory incentives [9]. Yet few studies analyze national financial and environmental data related to municipal waste management to assess the financial implications of CE implementation in practice.
Recent quantitative studies have further expanded the empirical evidence on the relationship between circular economy implementation, municipal waste management, and public finance. Study [10] applied panel econometric models, including fixed-effects and dynamic panel estimators, across 27 European countries and demonstrated significant associations between macroeconomic conditions and circular economy performance. Similarly, ref. [11] employed an integrated life-cycle assessment and life-cycle costing approach to quantify the environmental and economic impacts of municipal waste management across the European Union. However, these studies do not explicitly examine the relationship between national circular economy indicators and municipal waste management expenditure, which constitutes the primary focus of the present study.
This study contributes to the existing literature in several important ways. Unlike previous studies, this research focuses on the fiscal implications of CE implementation. It develops an integrated assessment framework combining environmental, financial, and governance indicators within a single empirical model. Rather than analyzing CE performance only from an environmental perspective, the proposed framework evaluates how CE implementation is associated with public expenditure structures, investment allocation, revenue generation, and financial sustainability simultaneously.
Although the individual variables included in the empirical model have been examined separately in previous studies on waste management and the circular economy, their integration into a unified framework for assessing the fiscal implications of the CE transition for public governance of municipal waste management remains limited, particularly in the Slovak context. This research addresses this gap through four principal contributions. First, it develops an integrated analytical framework combining environmental, financial, and governance indicators to evaluate the fiscal effects of the CE transition using national-level aggregated environmental and financial data related to municipal waste management. Second, it empirically links environmental performance with public financial outcomes, providing a more comprehensive understanding of how CE policies influence public expenditure. Third, it provides national-level empirical evidence from Slovakia for the period 2013–2023, indicating that resource recovery, environmental investment, Green Deal policy implementation, and the COVID-19 period were significantly associated with municipal waste management expenditure. Finally, it offers practical policy recommendations for public budgeting, investment planning, and long-term fiscal sustainability, supporting evidence-based financial governance during the transition to a circular economy.
2. Literature Review
2.1. Theoretical Foundations of the Circular Economy
The CE has been increasingly recognized as a transformative model for sustainable development, shifting the prevailing economic paradigm from linear extraction and disposal towards regenerative, closed-loop systems. Based on principles such as reduce, reuse, recycle, and regenerate [4,12,13,14], the CE approach seeks to decouple economic growth from resource consumption by promoting material efficiency, extended product lifecycles, and the minimization of waste.
Scholars have developed various conceptual models of CE, ranging from micro-level firm-based strategies to macro-level national and municipal policy frameworks [15]. In urban settings, circularity is most frequently addressed through waste management systems, green public procurement (GPP), eco-design, and infrastructure planning (Abu-Bakar et al., 2024) [16,17].
2.2. Municipal Finance, Governance, and Circular Economy Instruments
Public authorities responsible for municipal waste management play a critical role in implementing CE initiatives, particularly through their control over waste services, land use, utilities, and procurement. Yet their ability to do so is strongly conditioned by institutional capacity and financial autonomy [18,19]. Research increasingly points to the need for financial mechanisms that support the CE transition at the local level, such as pay-as-you-throw (PAYT) schemes, green bonds, EU funds, and partnerships with the private sector (Di Foggia & Beccarello, 2023; Kumar et al., 2025) [4,6].
Although green bonds, EU funds, sustainability-linked loans, and other circular finance instruments are increasingly recognized as important enablers of the CE transition, their effectiveness within municipal waste management systems remains conditional on local fiscal capacity and institutional readiness. According to [6], highlight that circular finance still faces barriers related to regulatory uncertainty, investment risk, limited infrastructure, and difficulties in assessing long-term returns. At the municipal scale, ref. [20] further emphasize that limited fiscal autonomy, co-financing requirements, administrative complexity, and unequal access to external funding may restrict the ability of municipalities to benefit from these instruments. Therefore, circular finance mechanisms should not be viewed as automatically effective policy tools; their impact depends on the financial and governance capacity of local authorities.
Recent studies underline the relevance of policy instruments such as Extended Producer Responsibility (EPR), landfill taxes, and waste incineration bans as tools shaping municipal circular practices and investment decisions [4,21]. The EU Circular Economy Action Plan provides a regulatory foundation for integrating circularity into local governance. However, evidence suggests that its implementation in public financial systems supporting municipal waste management remains fragmented and uneven. Study [21] identify local CE governance as a multi-scalar coordination challenge, where municipalities must act as intermediaries between national directives and community-led circular initiatives.
Governance mechanisms such as participatory budgeting, CE-oriented Key Performance Indicators (KPIs), and cross-departmental planning units are proposed as enablers of systemic transition at the city level. Municipal CE transitions are increasingly linked to innovative financial planning mechanisms, including earmarked environmental funds, circular investment platforms, and scenario-based infrastructure costing models [4].
A growing body of evidence highlights the integration of CE metrics into multi-year investment plans and municipal accounting frameworks, enabling more accurate forecasting of circular costs and benefits [21]. Their review emphasizes the need for coherent micro-level indicators that support decision-making processes in public governance, linking operational CE actions to fiscal planning instruments and sustainability performance evaluation.
Study [22] conducted a comprehensive review of 221 CE definitions, revealing a growing emphasis on regulatory and policy mechanisms. The authors highlight that CE is increasingly conceptualized as a normative policy model requiring legal and institutional support. Many definitions now refer explicitly to governmental intervention, binding EU targets (e.g., the CE Action Plan), and instruments such as tax incentives, subsidies, and public procurement. These policy tools are framed as critical to correcting market failures and enabling the systemic implementation of CE across different governance levels. The study also positions governance as central to CE transitions. According to [22] underscore the importance of multi-actor coordination, including collaborative platforms, stakeholder engagement, and cross-sector partnerships. Their analysis finds that CE definitions increasingly refer to multi-level governance structures and accountability frameworks, essential for aligning actors and institutional capacities with circularity goals.
Reference [23] provides an in-depth comparative analysis of governance structures across countries implementing CE policies. The study highlights how national and regional governments can play a pivotal role in accelerating CE transitions through coordinated governance frameworks, legal instruments, and targeted policies. In particular, the paper identifies institutional embedding, public–private partnerships, and strategic alignment of responsibilities as central governance tools that enable effective CE implementation. Moreover, the study stresses the importance of policy integration and coherence, illustrating how CE governance should be aligned with broader economic and environmental strategies. This includes regulatory instruments (e.g., circular mandates and waste bans), incentive structures (such as subsidies for circular business models), and monitoring tools that ensure accountability and transparency. By examining case studies in the Netherlands, Japan, and Nordic countries, Cramer demonstrates that robust governance tools must be adaptable, inclusive, and backed by political will to drive systemic change.
GPP is emerging as a key lever, enabling municipalities to drive demand for circular goods and services through their purchasing decisions. Although promoted by the EU Circular Economy Action Plan, empirical studies reveal limited integration of GPP into municipal financial planning, performance metrics, or expenditure frameworks [17,18,19].
Research by [5] identifies corporate finance, regional income, and procurement as significant enablers of circular activity, though primarily at the enterprise level. Their findings suggest that public procurement can promote CE leadership, yet municipal-level evidence remains scarce. The need for fiscal tools that align long-term CE goals with short-term budgetary constraints remains a recurrent theme in the literature.
2.3. Empirical Studies on Municipal Circular Economy Transitions
Empirical evidence on the financial implications of the circular economy transition in municipal waste management, particularly in Central and Eastern Europe, remains limited. The authors of [24,25] offer valuable insights into waste generation and separation patterns across Slovak municipalities. Their studies apply statistical modeling to identify key drivers of waste behavior, including population density, treatment costs, and infrastructure gaps. Yet these works stop short of assessing financial outcomes such as revenue generation, operational savings, or return on investment.
Sumter et al. (2020) and Cifranic et al. (2025) Study [26,27] provide one of the few fiscal analyses of CE in Slovakia, identifying how greater waste separation rates can increase public expenditure on municipal waste management while exposing disparities in local revenue capacity. This underlines the tension between environmental goals and financial feasibility, especially in under-resourced municipalities.
A significant critique in the literature is the prevailing association of CE with waste management alone. While waste remains central to local CE strategies, studies argue that this narrow focus inhibits more comprehensive, systems-based approaches (Johansson & Henriksson, 2020) [28]. According to [29,30] demonstrate that small and medium-sized municipalities face significant governance barriers during the CE transition, including limited fiscal autonomy, constrained administrative capacity, dependence on external funding, and difficulties in coordinating long-term CE initiatives. These challenges are particularly relevant to municipalities in Slovakia, where fiscal constraints similarly influence the implementation of CE policies [31].
Recent studies from Central and Eastern Europe demonstrate that CE transition involves common challenges related to resource efficiency, waste management infrastructure, institutional capacity, and financial support mechanisms. Evidence from Poland [32], the Czech Republic [33,34], and Hungary [35,36] indicates that CE implementation represents a broader regional process rather than a challenge unique to Slovakia. These studies highlight the importance of effective governance structures, resource management practices, and long-term policy support for successful CE transition.
However, despite the growing body of evidence from Central and Eastern Europe, empirical studies specifically examining the financial implications of CE transition for municipal waste management remain scarce, particularly in the Slovak context [36,37,38].
The present study is grounded in resource efficiency theory, public finance theory, and sustainable public governance frameworks. From a fiscal perspective, CE investments may generate short-term expenditure pressures while creating long-term efficiency gains through resource recovery, improved waste management practices, and reduced environmental costs. These theoretical perspectives provide the basis for examining the relationship between environmental and financial indicators during the circular economy transition in municipal waste management.
2.4. Knowledge Gaps and Research Opportunities
Despite a growing interest in the financial implications of CE, several gaps persist. First, very few studies explore how CE affects public budgeting for municipal waste management, debt ratios, or investment cycles. Second, the fiscal impact of CE instruments such as GPP, pay-as-you-throw (PAYT) schemes, and circular procurement remains underexplored beyond pilot examples. Third, the literature lacks integrated models connecting CE policy implementation to public financial indicators. Furthermore, municipalities often conflate CE with legally mandated waste services, leading to limited strategic integration and vague goal-setting [19]. The transfer of responsibility to market actors—rather than strengthening local governments—also limits the transformative potential of CE transitions [6].
In sum, while theoretical models and policy strategies for CE are evolving rapidly, the financial governance of municipal waste management—particularly in countries like Slovakia—remains a relatively unexplored domain. This research addresses this gap by examining national-level financial and environmental indicators related to circular economy implementation in municipal waste management in Slovakia. The literature suggests that while CE research has increasingly incorporated policy instruments, governance tools, and financial mechanisms, their integration into public financial systems supporting municipal waste management remains fragmented. Existing studies often analyze these elements in isolation, without explicitly linking them to budgetary performance, cost structures, or revenue generation at the local level. This gap highlights the need for empirical frameworks that connect CE policy instruments with measurable financial outcomes in municipal waste management, which the present research aims to address.
Based on resource efficiency theory, public finance theory, and the literature on the public governance of municipal waste management, the proposed framework conceptualizes the CE transition as a process in which environmental investments are associated with public financial outcomes related to expenditure, resource recovery, and revenue generation [39,40].
2.5. Theoretical Justification of the Empirical Model
The empirical model employed in this study is grounded in three complementary theoretical perspectives: resource efficiency theory, public finance theory, and public governance theory. Together, these perspectives provide the theoretical basis for examining the statistical associations between CE implementation and public financial performance through changes in investment requirements, operational efficiency, resource recovery, and expenditure allocation.
Resource efficiency theory suggests that public authorities implementing CE principles improve the productivity of material and energy use by reducing waste generation, increasing recycling rates, and recovering valuable secondary resources. Although CE implementation generally requires substantial initial investments in infrastructure and waste management systems, improved resource efficiency is expected to generate long-term reductions in operational costs and increase fiscal sustainability of municipal waste management.
From the perspective of public finance theory, public expenditure on municipal waste management reflects the allocation of limited public resources to achieve environmental and social objectives. CE investments represent a form of public capital expenditure that may initially increase expenditure on municipal waste management due to infrastructure development, technological modernization, and administrative implementation [41].
However, these investments are expected to improve expenditure efficiency over time through lower landfill costs, higher recycling performance, and increased revenues generated from circular activities.
Public governance theory further explains that the financial outcomes of CE transition depend not only on environmental performance but also on institutional capacity, strategic planning, and fiscal management. According to public governance theory, public authorities responsible for municipal waste management are expected to influence investment priorities, resource allocation and regulatory implementation. Theoretically, differences in governance capacity may contribute to variations in public expenditure on municipal waste management. However, such municipality-level heterogeneity is not directly tested in the present national-level analysis.
Based on these theoretical perspectives, the explanatory variables included in the regression model represent the principal financial and environmental mechanisms through which CE transition is associated with influence municipal waste management expenditure.
Capital investments in circular infrastructure are expected to have a positive relationship with public expenditure on municipal waste management because infrastructure construction, equipment acquisition, and technological upgrades require considerable financial resources during the implementation phase.
Similarly, environmental investments per capita are theoretically expected to increase public expenditure on municipal waste management, reflecting higher public spending on environmental protection, waste collection systems, recycling facilities, and environmental services.
From a theoretical perspective, higher recycling rates reflects be associated with lower long-term expenditure through reduced landfill dependence and improved material recovery; however, this pathway is not estimated directly in the reduced-form regression model.
Revenue generated from secondary raw materials represents an important financial outcome of CE implementation. Greater revenues from recovered materials are theoretically expected to reduce the fiscal burden of municipal waste management by partially offsetting operational expenditures through market-based resource recovery.
Improved waste management practices may also support expenditure efficiency, although this mechanism is not directly estimated in the present model. More efficient collection systems facilitate higher recycling rates, reduce contamination, increase material recovery, and lower disposal costs, thereby potentially contributing to greater expenditure efficiency.
The proposed empirical model conceptualizes municipal waste management expenditure as reflecting statistical associations with environmental investments, CE performance, resource recovery, and institutional capacity for municipal waste management.
Rather than examining environmental indicators in isolation, the proposed model integrates financial and environmental dimensions within a unified analytical framework to assess the fiscal implications of the circular economy transition based on national-level aggregated environmental and financial data related to municipal waste management in Slovakia.
Based on the theoretical arguments presented above, the expected signs of the estimated regression coefficients are summarized as follows. Capital investments in circular infrastructure and environmental expenditure per capita are expected to exhibit positive coefficients because, from a theoretical perspective, the implementation of circular economy policies generally requires substantial public investment [42].
In contrast, higher recycling rates, improved waste recovery, and greater revenues from secondary raw materials are expected to display negative coefficients with respect to municipal waste management expenditure, reflecting efficiency gains, lower landfill dependence, and partial cost recovery.
These theoretical expectations provide the conceptual basis for interpreting the estimated regression results presented in the following sections. Figure 1 summarizes the conceptual framework and the hypothesized statistical associations examined in the empirical model.
Figure 1.
Conceptual framework illustrating the hypothesized statistical associations between circular economy indicators and municipal waste management expenditure in Slovakia. Note: The conceptual framework illustrates the theoretical relationships examined in the study. The empirical analysis is based on national-level aggregated environmental and financial data for Slovakia (2013–2023). The framework represents the hypothesized associations tested in the regression model rather than causal pathways. Source: Authors’ elaboration.
Figure 1 presents the conceptual framework developed for this study. It illustrates the reduced-form statistical associations examined in the empirical model between national-level environmental and financial indicators, policy-related variables, and municipal waste management expenditure in Slovakia.
Unlike previous studies that analyze environmental indicators separately, the proposed framework integrates environmental, financial, and policy-related dimensions within a unified analytical perspective.
The framework groups the explanatory variables into two broad categories: (1) environmental and CE-related drivers, including waste generation per capita, resource recovery, investment in CE infrastructure, and environmental investment per capita; and (2) the national policy context represented by the Green Deal and COVID-19 policy dummy variables.
Policy conditions provide the institutional context in which the observed relationships occur; however, governance capacity is not measured directly in the regression model.
The framework does not estimate causal or mediating pathways between policy conditions and financial outcomes. Instead, it evaluates direct statistical associations between the selected national-level indicators and municipal waste management expenditure.
The conceptual framework should be interpreted as a theoretical representation of the relationships discussed in the literature rather than as an empirically tested mediation model. Testing mediating mechanisms would require a substantially larger dataset and alternative modeling approaches, such as structural equation modeling or formal mediation analysis, which are beyond the scope of the present study.
Accordingly, municipal waste management expenditure is interpreted as being statistically associated with environmental, financial, and policy-related indicators rather than as the direct consequence of any single explanatory factor.
The conceptual framework provides a structured representation of the variables included in the reduced-form regression model and supports the interpretation of their statistical associations with municipal waste management expenditure.
3. Materials
The transition towards circular economy practices in municipal waste management is associated with changes in public expenditure, investment priorities, and revenue-generating activities. The Slovak case, represented by data from 2013 to 2023, offers valuable insights into these dynamics (Figure 2).
Figure 2.
Trends in environmental investments, expenditures, and revenues in Slovakia, 2013–2023 (thousand EUR). Source: Authors’ own compilation based on data from the Statistical Office of the Slovak Republic (2024).
Between 2013 and 2023, total environmental investments in Slovakia fluctuated significantly, with notable peaks in 2015 (€581.7 million) and 2023 (€362.7 million), and a low point in 2013 (€201.8 million). While investment volumes varied year to year, there was a consistent reliance on the state budget, contributing approximately €27–74 million annually, and a more variable contribution from foreign investors, ranging from €4.6 million (2013) to €155.9 million (2015).
This variation may reflect both the availability of external funding mechanisms (e.g., EU structural funds) and changing domestic priorities. The increase in investment during recent years, especially post-2020, suggests a response to European Green Deal objectives and recovery funding post-COVID-19, reinforcing the alignment of capital investments with CE policy frameworks.
Over the same period, current expenditures on environmental protection more than doubled—from €554.1 million in 2013 to nearly €1.28 billion in 2023. This includes internal costs (salaries, operations), which grew steadily, and external environmental expenditures, rising from €282.8 million to €594.8 million. The increase may reflects both inflation and the expansion of public waste management operations, including waste separation, composting, and outsourced service provision.
A critical observation is the steady growth in revenue generation from environmental services. Total incomes from environmental protection grew from €579.5 million in 2013 to €2.7 billion in 2023—more than a fourfold increase.
The investment and expenditure structure shown in the Slovak context highlights several core insights:
- -
- The observed national trends suggest that investment in CE-related activities may be accompanied by increasing operational revenues over time.
- -
- The national data suggest that external co-financing mechanisms play an important role in supporting investments in municipal waste management, particularly during the early stages of the circular economy transition.
- -
- Long-term planning indicates support a gradual shift from dependence on subsidies towards greater income generation.
In conclusion, the observed national trends provide descriptive evidence of the evolving financial role of circular economy activities in municipal waste management in Slovakia. The findings suggest that these activities may contribute not only to environmental sustainability but also to improved budgetary resilience and more strategic investment planning.
Over the period 2013 to 2023, Slovakia’s environmental investments per capita displayed notable fluctuations, reflecting both national policy shifts and external economic influences. The total environmental investments ranged from €201.8 million in 2013 to a peak of €581.7 million in 2015, followed by a period of relative stabilization. On a per capita basis, the investment increased from €37.29 in 2013 to €66.81 in 2023.
The most significant increase occurred in 2015, where per capita investment rose sharply to €107.31, more than doubling the value recorded the previous year. This peak is likely attributable to targeted capital programs or the absorption of EU structural funds at the close of a programming period. However, this surge was not sustained, and the per capita investment declined in subsequent years, stabilizing between €37 and €66 per person from 2016 onward.
From 2020 onwards, despite the economic uncertainty caused by the COVID-19 pandemic, per capita investment showed a gradual recovery, increasing from €40.61 in 2020 to €66.81 in 2023. This trend may reflect enhanced prioritization of environmental resilience and green recovery efforts.
These investment patterns underscore the strategic shifts in environmental governance and public spending, suggesting that while short-term fluctuations are common, the long-term trajectory points to a growing emphasis on per capita environmental investment.
Strategic Investment Flows and the Circular Economy Transition.
To complement the analysis of aggregate environmental expenditures related to municipal waste management in Slovakia, it is essential to examine how capital investments have evolved across economic sectors, as these sectors often operate in partnership with or under the regulation of municipal authorities. The data covering Slovakia from 2009 to 2023 offers valuable insights into sectoral engagement with CE objectives (Figure 3).
Figure 3.
Environmental investments by economic sector in Slovakia (2009–2023) (thousand EUR). Source: Authors’ own compilation based on data from the Statistical Office of the Slovak Republic (2024).
The most pronounced trend over the 15-year period is the sustained dominance of the electricity, gas, and water supply sector in environmental investment. With peaks reaching €392.3 million in 2015 and €125.3 million in 2023, this sector serves as the backbone of CE infrastructure, especially in areas such as energy recovery from waste, water reuse systems, and smart grid integration. The magnitude and consistency of investment suggest the important role this sector plays in supporting public waste management strategies through technical and service-oriented capacities.
The role of specialized producers (often municipal utilities or private-public joint ventures) has steadily increased, with capital inflows growing from €10.5 million in 2009 to €81.6 million in 2023. These actors are central to implementing CE-related services—particularly in waste treatment, recycling, and composting—and their growing financial weight may reflect a broader shift in Slovakia’s waste management sector from linear disposal towards circular resource recovery. Manufacturing also emerges as a consistent, though secondary, recipient of environmental investment. The sector demonstrates a strong presence in pre-2020 figures, peaking at over €114.9 million in 2019, but shows more volatility in recent years. Its role in material efficiency and industrial symbiosis remains relevant for circularity at the local level, particularly where municipalities collaborate with local industries on by-product valorization and cleaner production.
Meanwhile, sectors such as agriculture and mining received minimal funding or had data suppressed due to confidentiality in 2023. This indicates limited engagement or reporting challenges in CE-aligned initiatives within these traditionally resource-intensive domains.
The inclusion of “other activities”, receiving €19.8 million in 2023, provides evidence of CE spillover effects into construction, logistics, and services—areas frequently linked to local government operations. Such diversification indicates a maturing CE investment landscape that goes beyond heavy infrastructure and integrates broader urban systems.
Finally, the total environmental investment rose from €208.6 million in 2009 to €280.9 million in 2023, despite sharp fluctuations across the years. Notably, investment levels surged in 2015–2016, possibly reflecting the absorption of EU cohesion funding under the 2007–2013 programming period. While public expenditure on municipal waste management remains a major pillar, this sectoral data affirms the increasing importance of cross-sectoral partnerships and private-sector mobilization in financing CE-related activities in municipal waste management.
Analytical Commentary on Environmental Expenditure and Revenue Trends.
The longitudinal data on environmental expenditures and revenues in Slovakia from 2005 to 2023 offers valuable insights into the financial dynamics of the CE transition in municipal waste management (Figure 4). The analysis focuses on three primary indicators: total environmental investments, capital expenditure on waste and wastewater treatment, and total revenues generated from environmental protection activities.
Figure 4.
Evolution of environmental protection investments and revenues in Slovakia, 2005–2023 (thousand EUR). Source: Authors’ own compilation based on data from the Statistical Office of the Slovak Republic (2024).
Over the examined period, total investments in environmental protection displayed significant volatility, ranging from a low of €201.79 million in 2013 to a peak of €581.74 million in 2015. This variability likely reflects the influence of external funding cycles, particularly from EU structural and cohesion funds. Notably, post-2020 investment figures suggest renewed momentum, with values exceeding €340 million annually since 2021. This resurgence may be attributed to green recovery packages and increased policy emphasis on sustainable infrastructure following the COVID-19 pandemic.
Waste treatment—one of the core pillars of the CE—shows a clear upward trajectory, particularly in the last decade. From a relatively modest €27.06 million in 2005, investments rose to €145.53 million by 2023. This fivefold increase suggests a progressive shift towards modernization and expansion of municipal waste management systems. However, the fluctuations between years, such as the drop in 2017 (€39.93 million) and spike in 2023, suggest that investment is still somewhat reactive to project availability and budgetary cycles rather than being part of a sustained long-term strategy.
Similarly, capital investments in wastewater treatment demonstrate robust growth, peaking at €285.64 million in 2015. While subsequent years saw some contraction, the overall trend remains positive, with a renewed increase to €96.36 million in 2023. These figures is consistent with ongoing efforts to meet EU wastewater directive requirements and to upgrade municipal water infrastructure in line with CE principles, which emphasize water reuse and pollution reduction.
The evolution of revenues from environmental protection activities serves as a proxy for the economic maturity of environmental protection and municipal waste management activities. From €261 million in 2005, revenues grew steadily, surpassing €1 billion from 2018 onwards and reaching €2.7 billion in 2023. This substantial increase suggests that municipal waste management systems are progressively moving beyond the cost-intensive phase of infrastructure development towards a model that yields measurable financial returns—potentially from waste recovery, recycling markets, and environmental services.
The upward trends in both investment and revenue generation, particularly in the waste and wastewater sectors, are consistent with national efforts to strengthen the implementation of CE policies in municipal waste management.
Municipal Waste Treatment Trends and Circular Economy Implications.
An examination of municipal waste treatment data from Slovakia between 2017 and 2023 reveals meaningful shifts in waste management practices aligned with CE principles (Figure 5). The annual total of municipal and small construction waste treated increased from approximately 2.14 million tons in 2017 to over 2.70 million tons in 2021, followed by a slight decline to 2.56 million tons in 2023. This trajectory suggests a general intensification of waste management activity over the observed period, likely influenced by EU directives and national policy measures encouraging circular approaches.
Figure 5.
Evolution of municipal waste treatment methods in Slovakia, 2017–2023 (tonnes). Source: Authors’ own compilation based on data from the Statistical Office of the Slovak Republic (2024).
Among treatment methods, material recycling consistently accounted for a significant share, rising from 309,246 tons in 2017 to a peak of 585,578 tons in 2021, before slightly decreasing to 487,940 tons in 2023. This trend suggests ongoing investment and infrastructure development in municipal recycling systems, and reflects their centrality in CE strategies. Equally notable is the role of reclamation of organic substances, particularly composting, which nearly doubled from 180,967 tons in 2017 to 451,322 tons in 2023. These figures demonstrate growing attention to bio-waste recovery as a pillar of CE-compatible waste diversion, reducing landfill dependence and contributing to nutrient cycles in local ecosystems. Despite these positive developments, landfilling remained the dominant treatment method throughout the period, although its share has decreased from over 1.31 million tons in 2017 to 992,609 tons in 2023. This reduction may indicate gradual progress in landfill avoidance, but also highlights the continued reliance on linear disposal practices that are at odds with CE goals. Other treatment categories, such as incineration with and without energy recovery, other recovery, and other disposal, represent a small but non-negligible portion of the waste stream. Notably, incineration with energy recovery fluctuated moderately, with 197,895 tons processed in 2023, while incineration without energy recovery showed significant decline, reflecting environmental performance improvements.
Taken together, the data reflect a slow but measurable transition toward circular waste treatment models. The increasing prominence of recycling and composting may reflect positive policy impacts and behavioural shifts in municipal waste management. However, persistent reliance on landfill underscores the need for stronger regulatory frameworks, financial incentives, and public–private collaboration to accelerate Slovakia’s transition to a fully circular waste management system.
Hazardous Waste
The following analysis of Bratislava is presented solely as an illustrative descriptive case study. It is based on a separate regional dataset, is not incorporated into the national-level regression model, and is not used as statistical validation of the estimated national-level relationships.
The management of hazardous waste across selected streams in Bratislava underwent significant variations between 2020 and 2022 (Figure 6). A striking shift was observed in the disposal via landfill (D1, D5, D12) for acid, alkaline or saline wastes, which surged from 8557 tons to over 3.2 million tons. This represents a staggering increase of over 37,000%, suggesting either a major reclassification of waste types or substantial changes in reporting practices. Given the exceptional magnitude of this increase, the observed change should be interpreted with caution, as it may partly reflect revisions in waste classification, reporting practices, or statistical recording in addition to actual changes in hazardous waste disposal. Similarly, the aggregated “landfill and other” category expanded over 17,000%, pointing to a broader reliance on disposal methods for this waste stream.
Figure 6.
Recovery and disposal of selected hazardous and non-hazardous waste streams in Bratislava, 2020–2022 (tons). Source: Authors’ own compilation based on data from the Statistical Office of the Slovak Republic (2024).
Conversely, incineration (D10) for the same category declined sharply from 281,255 tons to just 105 tons. Considered together with the relatively stable recycling volumes, this pattern suggests a possible reallocation of hazardous waste streams among treatment categories rather than a proportional increase in hazardous waste generation. Recovery efforts remained stable, with no recorded backfilling and consistent recycling volumes (over 7800 tons). However, other disposal methods (D2–D4, D6–D7) were phased out entirely, dropping from 10,350 tons to zero. The observed trends highlight a mixed performance. While recovery volumes were maintained, if the observed increase reflects actual waste management practices rather than changes in statistical reporting or classification, it may indicate greater reliance on landfill disposal for hazardous waste, with potential implications for circular economy implementation and increased environmental management costs.
Non-Hazardous Waste
The treatment of non-hazardous waste showed a divergent profile. For acid, alkaline or saline wastes, recycling sharply increased, from zero in 2020 to over 10,113 tons in 2022. This may reflect improved separation practices or expanded infrastructure for material recovery. However, landfill use also rose steeply—from 549 tons to 4676 tons—suggesting that not all material was successfully diverted from final disposal.
In the case of chemical wastes, incineration remained minimal, while recycling jumped significantly from approximately 918 tons to over 5289 tons—a 476% increase. Meanwhile, landfill disposal for this category continued to dominate in absolute terms, exceeding 27,500 tons by 2022. The growth in recycling, alongside sustained landfill reliance, indicates that although CE principles are gaining traction, systemic waste stream redesigns are still required to avoid persistent disposal dependency.
Total Waste (Hazardous and Non-Hazardous)
The aggregate category, combining both hazardous and non-hazardous fractions, provides a composite picture of the waste management trajectory. Notably, used oils maintained stable recycling rates (approx. 3448 to 3889 tons), while energy recovery plummeted from over 2029 tons in 2020 to just 530 tons in 2022. This decline may point to disruptions in recovery technology or policy shifts disincentivizing thermal conversion.
For chemical wastes, total recycling increased substantially from 7820 to over 9879 tons, reinforcing the growing capacity for material recovery. Yet this was paralleled by an increase in both landfill and other disposal, together accounting for more than 11,100 tons in 2022. Thus, while recycling infrastructure expands, disposal practices remain persistent, suggesting a lag in systemic circularity.
Overall, the mixed performance across categories suggests a transitional phase in waste management practices in Bratislava. Recycling volumes are improving, particularly in the non-hazardous segment, but the enduring and in some cases increasing reliance on landfilling and incineration—especially for hazardous fractions—poses both financial and environmental risks. For Bratislava, these descriptive patterns suggest that further CE-aligned investment and stronger regulatory coordination may facilitate the transition from legacy waste disposal practices towards a more circular waste management system.
Analysis of Recovered and Total Municipal Waste per Capita in Slovakia and Bratislava.
An examination of municipal waste treatment trends in Slovakia and its capital region, Bratislava, over the period 2002–2023 reveals a significant transformation consistent with the objectives of CE policies (Figure 7). Two primary indicators are assessed: the amount of recovered municipal waste per capita, and the total amount of municipal waste generated per capita.
Figure 7.
Municipal waste generation and recovery per capita in Slovakia and Bratislava, 2002–2023 (kilograms). Source: Authors’ own compilation based on data from the Statistical Office of the Slovak Republic (2024).
Over the past two decades, Slovakia has demonstrated a marked improvement in the recovery of municipal waste. The per capita recovery rate increased from 33.88 kg in 2002 to 278.91 kg in 2023, representing an eight-fold increase. During the same period, the total municipal waste per capita rose from 283.42 kg to 471.91 kg, a less dramatic but still substantial 66% increase.
This divergence implies a notable shift in waste management strategy—from linear disposal towards circular practices such as material recycling and organic recovery. The proportion of recovered waste relative to total waste has grown from approximately 12% in 2002 to 59% in 2023, demonstrating an expanding role of CE in national environmental governance.
These results suggest that financial investments into CE, as documented in environmental expenditure and sectoral investment records, have yielded tangible environmental performance gains. Furthermore, such trends imply greater opportunities for public authorities responsible for municipal waste management to derive income from recycling operations, reduce landfill costs, and comply with EU waste directives.
The Region of Bratislava, as the administrative and economic center of the country, shows even more pronounced outcomes. In 2023, 445.08 kg of waste per capita was recovered, compared to a total generation of 591.06 kg per capita—translating to a recovery rate exceeding 75%. Back in 2002, recovered waste per capita in Bratislava stood at 170.9 kg, with total generation at 403.1 kg, indicating that the recovery ratio has grown significantly over the study period.
The Bratislava case illustrates the role of urban centers in supporting circular economy implementation. It also highlights the financial and operational benefits of targeted CE investments in municipal waste management, including separate collection systems, recycling infrastructure, composting facilities, and public awareness campaigns.
Illustrative Evidence from Bratislava
The descriptive trends observed in Bratislava illustrate how CE-oriented waste management measures may be associated with changes in waste recovery and financial indicators.
The Bratislava case study suggests that more advanced implementation of CE practices is associated with higher waste recovery efficiency and improved financial performance.
These descriptive observations can inform hypotheses for future municipality-level research and policy evaluation. They should not be interpreted as confirming, validating, or extending the national-level regression results, because the Bratislava analysis is based on a separate dataset, time coverage, and descriptive analytical approach.
Annual expenditures on municipal waste management in Bratislava exhibited fluctuations over the observed period, peaking at €29,091,952 in 2021, before significantly decreasing to €15,031,375 in 2023. This decline may reflect efficiency gains, budgetary adjustments, or reallocation of funds to other CE priorities. In contrast, revenue from secondary raw materials demonstrated a consistent upward trajectory, increasing from €644,613 in 2019 to €2,193,102 in 2023—an indication of improved resource recovery and market integration of recycled materials.
Investments in circular infrastructure displayed an irregular pattern, with a notable surge in 2021 (€3.5 million), coinciding with key initiatives such as deposit-return system (KOLO) reuse centers, Waste-to-Energy Plant (ZEVO) upgrades, and sorting plant developments.
The proportion of waste sent for recycling has markedly improved, rising from 36.04% in 2019 to 66.8% in 2023. This 30.76 percentage point increase reflects Bratislava’s progressive efforts in expanding sorting and recycling operations. The rate of source-separated waste collection more than tripled over the period, escalating from approximately 1.58 million operations in 2019 to over 5.57 million in 2023—highlighting an enhanced infrastructure and public participation in waste segregation.
Conversely, the total generation of mixed waste per capita decreased steadily, from 113,035.57 tons in 2019 to 93,460.55 tons in 2023. This suggests both behavioural change among citizens and institutional advancements in waste minimization.
4. Methods
The objective of this study is to evaluate the financial implications of CE transition on public governance in the Slovak Republic. The research focuses on the period 2013–2023 and investigates how circular economy-related factors influence municipal waste management expenditure (WME). The study adopts a multiple linear regression approach, integrating environmental, demographic, and economic variables based on official national data.
The purpose of the multiple regression analysis is to examine statistical relationships between CE indicators and public financial performance and to evaluate the relative contribution of the explanatory variables. Accordingly, the estimated coefficients should be interpreted as evidence of statistical associations rather than causal effects.
Data Sources
Data were collected from a range of publicly available and internal sources:
- -
- Statistical Office of the Slovak Republic: Data on municipal waste per capita, waste treatment categories, recycling shares, and population (2010–2025).
- -
- National and Municipal Reports: Expenditure and revenue statements from environmental protection (2013–2023).
- -
- OLO Bratislava Annual Reports (2019–2023): Financial accounts, capital investment, and waste recovery figures.
- -
- Ministry of Environment of the Slovak Republic: Sectoral investment data and environmental investment per capita.
- -
- Additional sources: Internal policy documents and semi-structured expert interviews with local officials responsible for CE initiatives [43,44].
The final dataset integrates three primary sources: (1) annual municipal finance reports from the Slovak Statistical Office (2013–2023), (2) national and EU-level CE indicators published by Eurostat and the OECD, and (3) project-level data from local authority reports and EU-funded CE programs.
To ensure consistency and validity across these heterogeneous sources, several data cleaning and harmonization procedures were applied. All monetary variables (e.g., municipal investments, revenues) were deflated using the Slovak national Consumer Price Index (CPI), with 2015 as the base year, and are reported in constant euros (EUR 2015).
Temporal alignment was ensured by aggregating monthly and quarterly indicators—such as waste volumes and investment disbursements—into annual figures. Datasets were merged using municipality codes and year identifiers.
For missing data affecting fewer than 5% of observations, multiple imputation was performed using predictive mean matching (PMM). Municipalities with more than 25% missing or inconsistent records over the study period (2013–2023) were excluded from the final analytical sample.
Cross-source validation was conducted by triangulating reported environmental investments in local budgets with project-level data from the Ministry of Environment’s CE registry (Zelené Investície SR), ensuring consistency between declared expenditures and verified funding flows.
Data Description and Pre-processing
This study employs national-level annual data from the Slovak Republic covering the years 2013 to 2023. The dataset includes indicators relevant to municipal-level financial and environmental performance, sourced from official national institutions and public databases (see Table 1).
Table 1.
Definitions, data sources, measurement units, aggregation level, and time coverage of the variables included in the empirical model.
To ensure consistency, all monetary variables were adjusted for inflation using the Slovak national consumer price index (CPI) and are expressed in constant 2015 euros (EUR 2015). Data were harmonized in terms of measurement units, and all variables are aggregated annually at the national level.
Missing Data Treatment:
Missing values affecting less than 5% of observations were addressed using multiple imputation based on predictive mean matching, ensuring consistency across variables while preserving the distributional properties of the data.
Outlier Management:
Outliers were retained unless clearly identified as reporting errors. For example, the sharp increase (over 37,000%) observed in secondary material recovery in 2016 corresponds to a documented change in waste classification methodology, rather than a statistical anomaly. Such values are considered informative and were preserved for analysis.
Variable Transformation:
No log-transformation or normalization was applied, as the primary variables were already expressed in standardized or relative units (e.g., percentages and per capita measures). However, all monetary variables were adjusted to the same base year (constant 2015 EUR), and all variables were harmonized for national-level comparisons. Accordingly, variables such as municipal population, waste management expenditure, investment in CE infrastructure, and revenue from secondary raw materials entered the regression model in their original (non-logarithmic) form.
This pre-processing approach ensures the interpretability and reliability of the econometric analysis while maintaining data transparency and reproducibility [42,45].
Variable Selection and Description
The dependent variable and five explanatory variables were selected based on theoretical relevance to CE implementation and empirical feasibility within Slovak municipalities. All monetary values were adjusted for inflation using the Slovak Consumer Price Index (CPI), with 2015 as the base year, and are reported in constant euros (EUR 2015).
Dependent variable:
: Municipal Waste Management Expenditure in year t (EUR/year, constant 2015). Source: Slovak Statistical Office (2013–2023).
The following explanatory variables (X) were selected based on empirical relevance to CE policy implementation and availability across the dataset:
: Revenue from secondary raw materials (EUR/year, constant 2015). Source: Ministry of Environment’s CE monitoring reports and municipal financial statements.
Revenue from secondary raw materials (RSM) represents aggregated national annual revenues generated from the sale and recovery of recyclable materials, including paper, plastics, glass, metals, bio-based materials, and other recyclable waste streams reported in official Slovak environmental statistics. The variable is measured at the national level and reflects annual revenues associated with circular resource recovery activities rather than revenues of individual municipalities. The variable is measured at the national level using aggregated annual data.
: Investment in CE infrastructure (EUR/year, constant 2015). Source: Slovak Ministry of Finance project records and EU co-funded municipal programmes.
The variable “Investment in CE Infrastructure (ICI)” represents aggregate public expenditure on municipal waste management allocated to infrastructure supporting CE implementation. According to the available national statistical database, this variable includes investments in waste collection and sorting facilities, recycling infrastructure, composting facilities, waste treatment systems, and other municipal environmental infrastructure. The database does not provide a further disaggregation by specific infrastructure categories (e.g., recycling plants, digital waste tracking systems, or smart collection technologies). Consequently, the estimated coefficient captures the overall financial effect of aggregate CE infrastructure investment rather than the individual contribution of specific infrastructure components.
: Waste generated per capita (kg/person/year). Aggregated from monthly municipal waste collection reports. Source: Slovak Environmental Agency.
: Environmental investments per capita (EUR/person/year). Calculated as total CE-related environmental investments divided by municipal population. Source: Slovak Statistical Office and municipal budget reports.
: Total population of the municipality (number of inhabitants). Source: Slovak Statistical Office annual demographic reports.
These variables were selected to represent the principal environmental, financial, and demographic dimensions of the national-level circular economy transition relevant to municipal waste management expenditure.
Although each explanatory variable has previously appeared in environmental or waste management studies [46,47,48], the present research combines these variables within a unified municipal fiscal assessment framework designed to evaluate the financial consequences of CE transition. Rather than analyzing environmental indicators separately, the proposed model integrates environmental, financial and governance dimensions to assess municipal fiscal performance under CE implementation.
All variables are derived from official national and European statistical sources, including the Slovak Statistical Office, Ministry of Environment, Ministry of Finance, and Eurostat databases, ensuring data reliability and consistency across indicators.
The general regression model is specified as follows:
The model estimates the relationship between municipal waste management expenditure (dependent variable) and key CE-related financial, environmental, and demographic indicators (independent variables).
Here,
: Intercept;
: Estimated coefficients of each independent variable;
: Error term.
Hypotheses:
H1.
Higher revenue from secondary raw materials is associated with lower waste management expenditure due to improved cost recovery.
H2.
Greater investments in CE infrastructure () lead to reductions in long-term operational waste costs .
H3.
Higher waste generation per capita increases total municipal waste expenditure.
H4.
Increased environmental investment per capita () improves service efficiency, potentially reducing .
H5.
Population size may have a scale effect; larger municipalities may benefit from economies of scale in waste management.
All variables were harmonized to annual frequency for the 2013–2023 period to ensure consistency in temporal scope and reporting standards.
Because the empirical analysis is based on national-level aggregated environmental and financial data for Slovakia, the estimated regression coefficients should be interpreted as statistical associations rather than causal effects. Although the proposed model identifies significant relationships between CE indicators and municipal waste management expenditure, it does not establish the direction of causality. In particular, reverse causality cannot be excluded, as municipalities investing more heavily in CE initiatives may simultaneously generate higher revenues from secondary raw materials and improve waste management performance. Consequently, potential endogeneity may affect some estimated relationships. Future research should employ municipality-level panel data, panel-data estimators, lagged explanatory variables, or instrumental-variable approaches to provide stronger causal evidence. Future research based on longer time series or municipality-level panel data would allow the application of formal stationarity tests and more robust time-series modeling techniques, thereby reducing the risk of spurious regression in macro-level annual data.
Variable Standardization
To reduce multicollinearity and ensure interpretability, all continuous variables were transformed using z-standardization:
where is the sample mean and is the sample standard deviation.
Because the explanatory variables were originally measured in different units (EUR, EUR per capita, kilograms per capita, and population), all continuous variables were transformed into z-scores prior to estimation. This procedure ensured coefficient comparability across variables, reduced potential scale effects, and improved the interpretability of the estimated regression coefficients.
Although all continuous variables were standardized using z-scores to improve coefficient comparability and reduce scale effects, this transformation does not address potential time-series non-stationarity or eliminate the risk of spurious regression inherent in macro-level annual time-series data. Given the limited sample of eleven annual observations (2013–2023), formal unit-root testing and more advanced time-series modeling techniques were beyond the scope of the present study. Consequently, the estimated relationships should be interpreted as exploratory statistical associations rather than evidence of stable long-term relationships.
Regression Estimation Procedure
The regression was estimated using ordinary least squares (OLS) in Python 3.10 (Python Software Foundation, Wilmington, DE, USA). The model was tested for the following:
- -
- Multicollinearity (variance inflation factor < 5);
- -
- Heteroskedasticity (Breusch–Pagan test);
- -
- Normality of residuals (Shapiro–Wilk test).
In addition, 95% confidence intervals were calculated for all estimated regression coefficients to assess the precision and statistical uncertainty of the parameter estimates.
The final specification was selected by jointly considering theoretical relevance, model parsimony, adjusted R2, Akaike information criterion (AIC), Bayesian information criterion (BIC), and diagnostic tests.
The final specification was estimated using 11 annual observations (2013–2023) and includes five explanatory variables together with two policy dummy variables [49,50]. Given the limited sample size, the model should be regarded as an exploratory empirical specification, and the estimated coefficients should be interpreted with appropriate caution. Although the adjusted R2 is relatively high, it should be interpreted in light of the limited number of observations and the complexity of the model specification.
Regression Specification with Policy Controls
To account for major macroeconomic and policy-related changes during the study period, the COVID-19 and Green Deal dummy variables were introduced as exploratory policy controls. These measures isolate exogenous factors that may bias the estimated coefficients of CE financial drivers.
The extended regression model with policy controls takes the following form:
where
: equal to 1 for the years 2020 and 2021, and 0 otherwise, to capture the fiscal and operational impacts of the COVID-19 pandemic on municipal budgets;
: equal to 1 from 2021 onwards, to reflect the onset of large-scale EU climate funding through the NextGenerationEU recovery instrument.
Because the COVID-19 and Green Deal dummy variables overlap in 2021, their estimated coefficients should be interpreted cautiously. Rather than identifying completely separable policy effects, these dummy variables capture partially overlapping policy environments associated with the COVID-19 pandemic and the implementation of the European Green Deal [51,52].
These additions are intended to account for potential structural breaks and policy-induced discontinuities over the study period. To statistically assess potential structural breaks in the regression coefficients, Chow tests were performed for the years 2020 and 2021. These breakpoints were selected because 2020 marks the onset of the COVID-19 pandemic and its associated fiscal disruptions, whereas 2021 corresponds to the implementation of major European Green Deal and NextGenerationEU recovery measures that may have affected public environmental expenditure patterns [53].
The Chow tests indicated statistically significant structural changes (p < 0.05) for three of the five explanatory variables (RSM, ICI, and EIPC), whereas WPC and POP did not reach the conventional 5% significance level. Therefore, the Chow test results should be interpreted as exploratory evidence supporting the inclusion of policy-related dummy variables rather than providing definitive confirmation of structural changes.
The Table 2 presents the results of the Chow test used to examine the presence of structural breaks in the regression model, particularly focusing on the years corresponding to major policy shocks (e.g., EU Green Deal funding, COVID-19 recovery grants).
Table 2.
Chow test results.
The test was applied to each explanatory variable to assess whether the structural relationship with the dependent variable (municipal waste management expenditure) changed significantly. The Chow test compares restricted and unrestricted models to detect structural breaks at known breakpoints, such as years 2020 and 2021.
A p-value below 0.05 indicates statistical evidence consistent with a potential structural shift in the estimated relationships.
As shown, statistically significant structural breaks were identified for , , and , whereas WPC (p = 0.065) and POP (p = 0.088) did not reach the conventional 5% significance level. Accordingly, the Chow test provides exploratory support for the inclusion of policy-related controls rather than definitive evidence for all explanatory variables. Because the Chow tests were performed on the same national time series used for model estimation, the results should be interpreted as exploratory diagnostic evidence rather than independent confirmation of structural changes. Therefore, the inclusion of policy-related dummy variables is supported as part of the model specification but should not be interpreted as definitive evidence of structural change.
The detected structural breaks are consistent with changes in the statistical associations between CE-related expenditure and the explanatory variables during the Green Deal and COVID-19 period. These findings highlight the importance of modeling policy interactions when assessing long-term sustainability outcomes.
These measures are intended to account for macro-level distortions that may bias fiscal outcomes in municipal waste management. By controlling for the COVID-19 and Green Deal policy periods, the extended specification is intended to improve the interpretability of the estimated statistical associations.
The regression analysis is based exclusively on aggregated national-level indicators for Slovakia covering the period 2013–2023. Consequently, the estimated relationships represent average national trends rather than differences among individual municipalities. The discussion of Bratislava presented in the Results section serves solely as an illustrative case study to contextualize the national-level findings and is not incorporated into the econometric model or used as statistical evidence supporting the regression results.
Although the analysis is based on aggregated national-level indicators, substantial heterogeneity exists across Slovak municipalities. Large urban centers such as Bratislava and Košice generally possess greater fiscal autonomy, larger budgets, and more advanced CE infrastructure than small municipalities. Consequently, the financial implications of CE implementation may differ according to municipal size and administrative capacity. Due to data availability constraints, the present study relies on national-level aggregated indicators, while recognizing that future research should perform comparative analyses using municipality-level data from large urban municipalities and smaller local governments.
The discussion of Bratislava presented in the Results section serves solely as an illustrative case study to contextualize the national-level findings and is not incorporated into the econometric model or used as statistical evidence supporting the regression results.
5. Results
5.1. Model Fit and Significance
The multiple regression model demonstrated a high degree of explanatory power, with an adjusted of 0.842, indicating that approximately 84.2% of the variation in municipal waste management expenditure (WME) in Slovakia between 2013 and 2023 is explained by the five selected explanatory variables.
The overall model was statistically significant:
F(5, 5) = 15.87, p < 0.001
The F-test indicates that the explanatory variables are jointly associated with municipal waste management expenditure (WME). The detailed OLS regression results are presented in Table 3.
Table 3.
Summary of regression results (OLS estimation, 2013–2023).
The reported 95% confidence intervals further confirm the robustness of the estimated coefficients. For all statistically significant variables, the confidence intervals do not include zero, supporting the reliability of the estimated relationships.
Although the model exhibits a relatively high adjusted R2, this result should be interpreted with caution because of the limited sample size and the relatively large number of estimated parameters.
5.2. Diagnostic Statistics
Model fit statistics:
Adjusted R2 = 0.842.
AIC = 121.4.
Breusch–Pagan: no heteroskedasticity (p = 0.318).
Shapiro–Wilk: residuals normal (p = 0.176).
VIF: all < 4 (no multicollinearity).
Multicollinearity: The VIF scores for all explanatory variables were below the commonly accepted threshold of 4, suggesting an absence of multicollinearity issues in the model.
5.3. Interpretation of Key Findings
5.3.1. Investment in Circular Infrastructure () Exhibited the Strongest Statistical Association with WME
The estimated coefficient should not be interpreted as indicating that CE infrastructure investment permanently increases municipal operating expenditure. Instead, it primarily reflects the short-term capital investment required to establish CE infrastructure, including recycling facilities, sorting systems, composting infrastructure, and related municipal assets. Such investments are expected to generate long-term financial benefits through improved operational efficiency, increased recovery of secondary raw materials, and reduced dependence on landfill disposal. Therefore, the estimated coefficient captures the transitional investment phase rather than a permanent increase in municipal waste management costs.
One possible economic explanation for the observed negative association is that investments in circular economy infrastructure may improve operational efficiency by increasing waste sorting, recycling, and material recovery capacity. These improvements may reduce dependence on landfill disposal and lower operational waste management costs over time. In addition, modern circular infrastructure may facilitate higher revenues from secondary raw materials, partially offsetting municipal waste management expenditure. These mechanisms represent plausible economic interpretations of the observed statistical association rather than evidence of a causal relationship.
The observed negative association does not necessarily contradict the need for substantial up-front investment during the transition to a circular economy. Instead, it may reflect that, once infrastructure is in place, operational efficiencies, improved waste sorting, and greater resource recovery partially offset municipal waste management expenditure over time [54].
5.3.2. Revenue from Secondary Raw Materials () Negatively Association with Municipal Waste Management Expenditure
This suggests that higher revenues from recovered materials contribute to partial cost recovery and improve the financial efficiency of municipal waste systems.
5.3.3. Waste Generated per Capita () and Population () Are Positively Associated with WME, Reinforcing the Resource-Dependent Nature of CE Services
Higher waste generation per capita is associated with increased municipal waste management expenditure at the national level, reflecting greater demand for waste collection, treatment, and disposal services across Slovak municipalities. By contrast, population size was not statistically significant, suggesting that waste intensity is a more relevant determinant of expenditure than municipality size.
5.3.4. Environmental Investment per Capita () Reflects the Decentralised Financial Burden of CE and Supports the Idea That Cost Efficiency Varies by Municipality Size and Investment Strategy
The regression results indicate that the financial costs of CE transition in Slovak municipalities are driven primarily by investment intensity and operational scale. These findings underscore the need for targeted co-financing, scale-appropriate infrastructure planning, and performance-based subsidies to support CE in local governance frameworks.
The regression results indicate that Revenue from Secondary Raw Materials (β = −0.284), Investment in CE Infrastructure (β = −0.336), Environmental Investment Per Capita (β = −0.227), the COVID-19 dummy (β = 0.419), and the Green Deal dummy (β = −0.311) are statistically significant determinants of municipal waste management expenditure. Waste Generated Per Capita exhibits a positive effect at the 10% significance level (β = 0.191), whereas Population size is not statistically significant (β = −0.067).
: Revenue from secondary raw materials (RSM) has a negative and statistically significant coefficient ( = −0.284, p = 0.011). This indicates that higher revenues from secondary raw materials are associated with lower municipal waste management expenditure. The estimated relationship suggests that circular revenue streams may contribute to partial cost recovery and improve the financial sustainability of municipal waste management systems. This result is consistent with the recent literature on circular economy finance. Study [6] argue that revenues generated through circular economy activities do not necessarily offset waste management expenditures in the short term because municipalities must simultaneously finance collection systems, sorting facilities, recycling infrastructure, and other supporting investments. Accordingly, the present findings should be interpreted as indicating a statistical association between higher revenues from secondary raw materials and lower municipal waste management expenditure rather than as evidence that circular economy revenues fully offset waste management costs. Furthermore, because the analysis is based on aggregated national-level data, the estimated relationship should not be interpreted as evidence that all municipalities experience similar financial effects.
: Investment in CE infrastructure (ICI) also shows a negative and statistically significant coefficient ( = −0.336, p = 0.012). This suggests that, over the analyzed period, infrastructure investments were associated with reductions in waste management expenditure, possibly due to improved operational efficiency, better sorting capacity, and more effective recovery systems. The observed negative coefficient differs from the initial theoretical expectation of a positive relationship. This finding suggests that the statistical association identified in the Slovak national dataset may reflect context-specific financial and institutional conditions that warrant further investigation using municipality-level data. The result also highlights that infrastructure investments may generate delayed financial benefits, supporting the view that the economic effects of CE investments should be evaluated over longer planning horizons.
: Waste generated per capita (WPC) has a positive coefficient ( = 0.191, p = 0.059), significant at the 10% level. This result indicate that higher waste generation per resident tends to increase municipal waste management expenditure, reflecting the operational burden created by larger waste volumes. This finding is consistent with the expectation that increasing waste volumes require additional expenditure for collection, transport, treatment, and disposal services.
: Environmental investment per capita (EIPC) has a negative and statistically significant coefficient ( = −0.227, p = 0.031). This finding indicates that higher environmental investment per resident may contribute to improved efficiency and lower waste-related expenditure, although such effects may depend on the quality and targeting of investment.
: Population size (POP) has a negative but statistically insignificant coefficient ( = −0.067, p = 0.419). Therefore, the model does not provide sufficient evidence of a clear population scale effect on municipal waste management expenditure.
The COVID-19 dummy is positive and statistically significant (β = 0.419, p = 0.002), indicating that the pandemic period increased waste-related municipal costs. The coefficient most likely reflects temporary operational disruptions and additional public expenditure associated with the pandemic period.
The Green Deal dummy is negative and statistically significant (β = −0.311, p = 0.005), indicating a statistical association between the post-2021 policy period and lower municipal waste management expenditure.
Overall, the regression results indicate that municipal waste management expenditure is statistically associated with both financial and environmental indicators of circular economy implementation. The estimated coefficients suggest that infrastructure investment, revenue generation from secondary raw materials, and environmental expenditure may contribute to improving expenditure efficiency, whereas higher waste generation is associated with greater financial pressure on municipal waste management systems. These findings should be interpreted as statistical associations rather than causal relationships because the analysis is based on aggregated national time-series data.
Adjusted = 0.842, indicating that the model accounts for approximately 84.2% of the observed variation in municipal waste management expenditure within the study sample. Given the limited sample size (n = 11), this value should be interpreted with appropriate caution.
F-statistic = 15.87, p < 0.001: Model overall is significant.
Shapiro–Wilk and Breusch–Pagan tests confirm residual validity (normality and homoscedasticity).
Variance inflation factors (VIFs < 3): No multicollinearity detected.
5.4. Model Diagnostics and Visual Validation
The robustness and predictive performance of the regression model were further assessed using graphical diagnostics.
Figure 8 presents the relationship between actual and predicted values of municipal waste management expenditure (WME). The majority of observations are closely aligned with the 45-degree reference line, indicating a high level of predictive accuracy. This visual pattern confirms the strong model fit and supports the reported explanatory power (Adjusted R2 = 0.842).
Figure 8.
Actual versus predicted municipal waste management expenditure (WME) values in Slovakia, 2013–2023. Source: Authors’ own calculations based on the national annual dataset (2013–2023).
Minor deviations from the diagonal are observed in specific periods, which may reflect structural changes or policy shocks (e.g., COVID-19 or Green Deal implementation).
The graphical evidence supports the robustness and reliability of the regression model.
Minor deviations from perfect normality may be observed; however, the Shapiro–Wilk test results indicate that these deviations are not statistically significant and do not affect the robustness of the model estimates.
Figure 9 presents the distribution of the regression residuals. The residuals are approximately symmetrically distributed around zero, providing additional support for the assumption of residual normality and the adequacy of the estimated regression model.
Figure 9.
Distribution of regression residuals for municipal waste management expenditure (WME) model. Source: Authors’ own calculations based on the national annual dataset (2013–2023).
Additionally, Figure 10 presents a coefficient plot with 95% confidence intervals, allowing for a clear visual comparison of the magnitude, direction, and statistical significance of the estimated parameters. Coefficients whose confidence intervals do not intersect zero can be considered statistically significant.
Figure 10.
Estimated regression coefficients with 95% confidence intervals. Source: Authors’ own calculations based on the national annual dataset (2013–2023).
The regression diagnostics and coefficient estimates provide consistent evidence that the proposed model is statistically reliable. The coefficient plot confirms both the direction and magnitude of the estimated effects, while the confidence intervals support the statistical significance of the principal explanatory variables. These findings provide a robust empirical basis for the discussion of the financial implications of circular economy transition presented in the following section.
Overall, Figure 10 visually confirms the statistical significance and direction of the estimated regression coefficients, providing additional support for the robustness of the empirical findings discussed in the following section.
6. Discussion
This study contributes to a growing body of literature exploring the intersection between CE strategies and municipal finance, with a specific focus on Slovakia. Building upon previous studies that have highlighted the infrastructural, behavioural, and governance challenges associated with CE implementation [55,56,57], our findings offer original empirical evidence on how CE variables interact with municipal waste management expenditures over a decade of policy evolution.
While [24] focused primarily on waste generation, waste separation, and landfilling patterns, our findings extend this perspective by demonstrating how circular economy implementation influences public expenditure on municipal waste management, revenue generation, and long-term fiscal sustainability.
The multivariate regression model reveals several statistically significant associations that are broadly consistent with theoretical expectations, while also shedding new light on the fiscal mechanisms underpinning CE transitions at the local level [58,59].
Investment in circular infrastructure emerged as a significant negative predictor of municipal waste management expenditure, suggesting that CE-related infrastructure may contribute to cost reductions once operational efficiencies are achieved.
This is aligned with evidence from comparable urban contexts in Western Europe, where the cost of establishing waste recovery, sorting, and digital collection infrastructure has posed a major barrier to CE scalability.
Environmental investment per capita was negatively and significantly associated with municipal waste management expenditure, indicating that targeted environmental spending may support efficiency gains in municipal waste systems. This supports [3,12,14,29,36,37], who highlighted the financing gap as a major constraint to CE mainstreaming among local authorities. However, the negative coefficient of recovered waste volume demonstrates that certain CE practices may lead to eventual operational efficiencies and cost reductions once infrastructure is established and behavioural adaptation is achieved.
Furthermore, the positive association between waste per capita and expenditure confirms earlier hypotheses that waste generation intensity remains a driver of operational costs, regardless of CE intent. This underscores the continued importance of citizen engagement, behavioural incentives, and source separation systems in complementing technical interventions.
Importantly, our findings shows that revenue from secondary raw materials contributes to reducing municipal waste management expenditure, although these revenues may not yet fully offset the broader investment costs associated with CE transition.
This aligns, who questioned the economic viability of circular systems that rely solely on market-based recovery revenue streams without supplementary public funding or regulatory mandates.
Higher recovery rates may be associated with reduced fiscal pressure on landfill operations, the generation of additional revenue streams from recyclables and secondary raw materials, and improved environmental performance, which may in turn facilitate access to EU financial incentives or reduce future compliance costs.
This research addresses a methodological gap in the literature where financial performance is often under-analyzed.
The findings obtained for Slovakia are broadly consistent with previous studies addressing CE implementation in Central and Eastern Europe. Existing research from Poland highlights the importance of resource efficiency and sustainable management practices, while studies from the Czech Republic emphasize the role of circularity indicators and institutional support mechanisms. Similarly, evidence from Hungary demonstrates that municipal waste management and CE transition require strong coordination between local authorities and supporting stakeholders.
These similarities indicate that the financial challenges associated with CE implementation are not unique to Slovakia but represent broader patterns observed across Central European countries.
Compared with Western European municipalities, where instruments such as PAYT schemes and more mature circular finance mechanisms are more widely implemented, Slovak and other CEE municipalities face stronger constraints related to limited fiscal autonomy, weaker investment capacity, and greater dependence on national and EU funding.
Nevertheless, differences in governance arrangements, fiscal autonomy, and local capacities may influence the speed and effectiveness of CE transition. Future comparative studies based on municipality-level data would provide deeper insights into these differences [59].
The findings have important implications for public governance of municipal waste management and financial policy. The observed statistical associations suggest that future research and policy evaluation may consider whether CE investments could be incorporated into multi-year budget planning and supported through appropriate financial instruments. These considerations can represent useful directions for future policy discussion; however, they were not evaluated directly in the empirical analysis.
The findings indicate that future research should examine whether different types of municipalities require differentiated financing mechanisms during the transition to the circular economy. In Slovakia, the initial costs of CE infrastructure could be mitigated through the funding instruments available under Programme Slovakia 2021–2027, including support from the ERDF and the Cohesion Fund for waste management infrastructure, resource efficiency and circular economy projects [60]. In addition, financial instruments such as preferential loans, guarantees and revolving funds may complement grant financing by improving municipalities’ access to long-term investment capital. For municipalities with limited fiscal capacity, higher co-financing rates, technical assistance for project preparation and inter-municipal cooperation can reduce financial barriers while ensuring an equitable transition to the circular economy.
The present findings extend previous municipal CE studies by demonstrating that environmental performance indicators should not be interpreted independently from municipal financial capacity. While previous studies primarily evaluated recycling efficiency or waste management outcomes, the present findings suggest that the circular economy transition may influence public expenditure on municipal waste management, investment priorities, and revenue generation mechanisms.
Consequently, the fiscal sustainability of municipal waste management should be considered an integral component of circular economy evaluation.
Future research should consider panel data models across multiple Slovak municipalities or comparative studies across V4 countries to assess regional variation in CE finance. Longitudinal case studies and qualitative interviews would also provide deeper insight into the political and institutional dynamics of circular transitions at the local level.
A limitation of this study is the use of aggregated national-level data, which does not fully capture differences in financial capacity, governance structures, and CE implementation across municipalities of different sizes. Large metropolitan areas and small municipalities may face distinct cost structures and investment priorities. Future studies should investigate these differences using municipality-level panel data.
Despite its contributions, this study has several limitations that provide opportunities for future research. The analysis is based on aggregated national-level data and therefore appears to not fully capture differences across individual municipalities. In addition, while the model incorporates key financial and environmental indicators, other institutional and behavioural factors may also influence CE outcomes. Future studies could extend the analysis by incorporating municipality-level data.
The findings suggest that public governance may represent an important contextual factor influencing the relationship between CE implementation and public financial performance. The present empirical model does not directly test mediating mechanisms. The literature suggests that this relationship can be influenced by three interrelated governance dimensions. First, fiscal capacity affects municipalities’ ability to finance the initial investments required for CE implementation while maintaining budgetary stability. Second, strategic allocation of public expenditure supports the prioritization of CE projects capable of generating long-term environmental and economic value. Third, institutional coordination, including alignment between municipal, national, and European CE policies, contributes to more effective implementation and reduces financial risks associated with fragmented governance [61].
Together, these governance dimensions provide a possible theoretical explanation for differences observed across municipalities, although such differences cannot be examined using the national-level dataset employed in this study. The present study contributes a governance-oriented conceptual perspective by proposing that fiscal capacity, expenditure prioritization, and institutional coordination may help explain the observed statistical associations discussed in the literature. These governance dimensions were not directly examined in the empirical model. These findings provide preliminary national-level evidence that may inform future evaluation of governance-oriented policy mechanisms, including multi-year financial planning, performance-based allocation of public resources, and targeted investment support, to facilitate financially sustainable CE transitions.
Several methodological limitations should be acknowledged. Although the selected regression model provides useful evidence on the relationships between CE indicators and public financial performance, the observational nature of the data does not allow definitive causal inference. In particular, potential endogeneity and reverse causality cannot be completely excluded, especially with respect to revenue from secondary raw materials. Future studies could employ panel-data models, lagged explanatory variables, or instrumental variable approaches to further investigate causal relationships.
These findings suggest that public financial performance depends not only on the magnitude of CE investments but also on the quality of public governance. From a theoretical perspective, institutional capacity may condition how environmental expenditure is translated into longer-term fiscal outcomes. However, the present national-level analysis does not test differences in institutional capacity across municipalities.
These findings provide preliminary national-level evidence that may inform the future evaluation of governance-oriented policy instruments. In particular, strategic financial planning, performance-based funding mechanisms, and institutional capacity building can support the financially and environmentally sustainable implementation of circular economy policies.
The present analysis focuses on public financial performance. Because the available dataset does not contain household-level socioeconomic information, the present study cannot assess whether specific policy instruments disproportionately affect vulnerable population groups. Future research should combine municipal financial data with socioeconomic indicators to evaluate the distributional effects of CE policies.
7. Conclusions
This paper examined the financial implications of the circular economy transition for municipal waste management in Slovakia using national-level aggregated environmental and financial data. The findings suggest a trade-off between initial investment intensity and longer-term efficiency gains, with waste management expenditure being associated with waste generation pressures, while circular infrastructure investment, environmental investment per capita, and revenue from secondary raw materials are associated with lower waste management expenditure.
While CE initiatives may not yet yield immediate fiscal savings, especially in developing contexts, the findings support their strategic relevance in building environmentally resilient urban systems. The findings suggest that coherent funding frameworks and improved financial planning merit further consideration in the financing of municipal waste management. However, the national-level analysis does not identify which instruments are most effective for municipalities of different sizes or fiscal capacities.
In the Slovak context, these preliminary policy implications could be considered in relation to existing national and European financing mechanisms that address municipal fiscal constraints. In particular, Programme Slovakia 2021–2027 under the EU Cohesion Policy provides financial support for the transition towards a resource-efficient and CE, including investments in waste management infrastructure, recycling systems, and sustainable regional development. In addition, financial instruments administered through Slovak Investment Holding (SIH), including loans, guarantees, and blended financing, can complement municipal budgets and facilitate long-term investments in CE infrastructure. Aligning CE-related municipal waste management projects with these financing mechanisms can help reduce fiscal pressure and support investment capacity; however, these effects require municipality-level evaluation.
The analysis indicates that the financial transition to circularity is complex and multidimensional and may require an integrated, long-term, and context-specific approach to CE finance.
The principal contribution of this study is the development of an integrated empirical framework for evaluating the fiscal implications of the circular economy transition in municipal waste management using national-level aggregated environmental and financial data. Unlike previous studies focusing primarily on environmental indicators, the proposed framework integrates expenditure, investment, revenue, and governance dimensions within a unified analytical model. This approach provides a conceptual analytical framework that may support future policy evaluation and empirical research on the financial implications of circular economy implementation in municipal waste management. The originality of this study does not stem from introducing entirely new variables, but from integrating environmental and financial indicators within a unified framework to evaluate the fiscal implications of the circular economy transition in municipal waste management.
Additional descriptive data are provided in Appendix A.
Author Contributions
Conceptualization, T.K. and J.S.; methodology, T.K.; software, T.K.; validation, A.L.L., T.K. and J.S.; formal analysis, T.K.; investigation, J.S., A.L.L. and T.K.; resources, T.K.; data curation, A.L.L.; writing—original draft preparation, T.K., A.L.L. and J.S.; writing—review and editing, T.K.; visualization, A.L.L.; supervision, T.K.; project administration, A.L.L. All authors have read and agreed to the published version of the manuscript.
Funding
This research received no external funding.
Institutional Review Board Statement
Not applicable.
Informed Consent Statement
Not applicable.
Data Availability Statement
The data supporting the findings of this study were obtained from publicly available official sources, including the Statistical Office of the Slovak Republic, Eurostat, OECD, OLO Bratislava Annual Reports, and other sources cited in the References. No new datasets were generated during the current study.
Conflicts of Interest
The authors declare no conflicts of interest.
Appendix A
Table A1.
Environmental protection investments in Slovakia, 2013–2023 (thousand EUR).
Table A2.
Environmental expenditures and incomes in Slovakia, 2013–2023 (EUR thousand).
Table A3.
Environmental investments per capita in Slovakia, 2013–2023.
Table A4.
Environmental investments by economic sector in Slovakia (2009–2023), EUR thousand.
Table A5.
Expenditures and revenues in environmental protection (2005–2023), EUR thousand.
Table A6.
Amount of municipal waste per capita, 2002–2023 (kg per capita).
Table A7.
Amount of recovered municipal waste per capita in Slovakia and Bratislava, 2002–2023 (kg per capita).
Table A8.
Municipal waste treatment by category in Slovakia, 2017–2023 (tons).
Table A9.
Recovered waste as percentage of total municipal waste in Bratislava (2019–2023).
Table A10.
Quantity of waste recovered and disposed, 2020–2022 (absolute values in tons).
References
- Cramer, J.M. The Function of Transition Brokers in the Regional Governance of Implementing Circular Economy—A Comparative Case Study of Six Dutch Regions. Sustainability 2020, 12, 5015. [Google Scholar] [CrossRef] [Scilit]
- Činčikaitė, R. Assessment of Sustainable Waste Management: A Case Study in Lithuania. Sustainability 2025, 17, 120. [Google Scholar] [CrossRef] [Scilit]
- Cutter, A.D.L. Investment Opportunities for a Sustainable Circular Economy; Cutter Benchmarking Reports: London, UK, 2023; Available online: https://www.cutter.com/journal/investment-opportunities-sustainable-circular-economy (accessed on 15 March 2025).
- Di Foggia, G.; Beccarello, M. Efficient Scale and Scope of Business Models Used in Municipal Solid Waste Management. Eur. J. Manag. Bus. Econ. 2023, 32, 492–508. [Google Scholar] [CrossRef] [Scilit]
- Meili, R.; Stucki, T. Money matters: The role of money as a regional and corporate financial resource for circular economy transition at firm-level. Res. Policy 2023, 52, 104884. [Google Scholar] [CrossRef] [Scilit]
- Kumar, B.; Kumar, A.; Sassanelli, C.; Kumar, L. Exploring the role of finance in driving circular economy and sustainable business practices. J. Clean. Prod. 2025, 486, 144480. [Google Scholar] [CrossRef] [Scilit]
- Kočková, D. (Ministry of Environment, Bratislava, Slovak Republic). Personal Communication, 2024.
- Marinello, S.; Pezzuolo, A.; Molari, G. Circular city index: Data-driven tool for urban sustainability. Sustainability 2023, 15, 289. [Google Scholar]
- Gabor, D.; Leung, W.; Singh, S. How the World Can Finance the Transition to a Circular Economy; Ellen MacArthur Foundation: Cowes, UK, 2023. [Google Scholar]
- Holmen, R.B.; Carvelli, G.; Razminienė, K.; Tvaronavičienė, M. Macroeconomic Influences on Recycling in Europe: An Econometric Investigation. Circ. Econ. Sustain. 2025, 5, 573–602. [Google Scholar] [CrossRef] [Scilit]
- Albizzati, P.F.; Foster, G.; Gaudillat, P.; Manfredi, S.; Tonini, D. A Model to Assess the Environmental and Economic Impacts of Municipal Waste Management in Europe. Waste Manag. 2024, 174, 605–617. [Google Scholar] [CrossRef] [Scilit] [PubMed]
- Ghisellini, P.; Cialani, C.; Ulgiati, S. A review on circular economy: The expected transition to a balanced interplay of environmental and economic systems. J. Clean. Prod. 2016, 114, 11–32. [Google Scholar] [CrossRef] [Scilit]
- Ellen MacArthur Foundation. White Paper: Circular Economy in Cities; EMF: Cowes, UK, 2018; pp. 1–40. [Google Scholar]
- Gheorghiu, R.; Andreescu, L.; Curaj, A. A foresight toolkit for smart specialization and entrepreneurial discovery. Technovation 2023, 122, 102684. [Google Scholar] [CrossRef] [Scilit]
- Geissdoerfer, M.; Savaget, P.; Bocken, N.M.P.; Hultink, E.J. The circular economy—A new sustainability paradigm? J. Clean. Prod. 2017, 143, 757–768. [Google Scholar] [CrossRef] [Scilit]
- Galvão, G.D.A.; de Nadae, J.; Clemente, D.H.; Chinen, G.; Carvalho, M.M. Circular Economy: Overview of Barriers. Procedia CIRP 2018, 73, 79–85. [Google Scholar] [CrossRef] [Scilit]
- Abu-Bakar, H.; Charnley, F.; Hopkinson, P.; Morasae, E.K. Towards a typological framework for circular economy roadmaps: A comprehensive analysis of global adoption strategies. J. Clean. Prod. 2024, 434, 140066. [Google Scholar] [CrossRef] [Scilit]
- Ministry of Investments, Regional Development and Informatization of the Slovak Republic. Programme Slovakia 2021–2027. 2022. Available online: https://mirri.gov.sk/sekcie/program-slovensko-2021-2027/ (accessed on 21 March 2026).
- Moreno, M.; De los Rios, C.; Rowe, Z.; Charnley, F. A Conceptual Framework for Circular Design. Sustainability 2016, 8, 937. [Google Scholar] [CrossRef] [Scilit]
- Magazzino, C.; Falcone, P.M. Financial barriers in circular economy adoption by municipalities. Ecol. Econ. 2022, 195, 107395. [Google Scholar]
- Kristensen, H.S.; Mosgaard, M.A. A Review of Micro Level Indicators for a Circular Economy—Moving Away from the Three Dimensions of Sustainability? J. Clean. Prod. 2020, 243, 118531. [Google Scholar] [CrossRef] [Scilit]
- Kirchherr, J.; Yang, N.-H.N.; Schulze-Spüntrup, F.; Heerink, M.J.; Hartley, K. Conceptualizing the Circular Economy (Revisited): An Analysis of 221 Definitions. Resour. Conserv. Recycl. 2023, 194, 107001. [Google Scholar] [CrossRef] [Scilit]
- Cramer, J.M. Effective Governance of Circular Economies: An International Comparison. J. Clean. Prod. 2022, 343, 130874. [Google Scholar] [CrossRef] [Scilit]
- Tokarčíková, E.; Ďurišová, M.; Trojáková, T. Circular Economy: Municipal Solid Waste and Landfilling Analyses in Slovakia. Economies 2024, 12, 289. [Google Scholar] [CrossRef] [Scilit]
- Pavolová, H.; Lacko, R.; Hajduová, Z.; Šimková, Z.; Rovňák, M. The circular model in disposal with municipal waste: A case study of Slovakia. Int. J. Environ. Res. Public Health 2020, 17, 1839. [Google Scholar] [CrossRef] [Scilit] [PubMed]
- Sumter, D.; de Koning, J.; Bakker, C.; Balkenende, R. Circular Economy Competencies for Design. Sustainability 2020, 12, 1561. [Google Scholar] [CrossRef] [Scilit]
- Cifranic, M.; Maris, M.; Valach, M. Socio-economic impacts of waste management policy in Slovakia: Comparative analysis among municipalities. Ecocycles 2025, 11, 19–30. [Google Scholar] [CrossRef] [Scilit]
- Johansson, N.; Henriksson, G. Circular economy running in circles? A discourse analysis of shifts in ideas of circularity in Swedish waste policy. Sustainability 2020, 12, 9990. [Google Scholar] [CrossRef] [Scilit]
- Makris, D.P.; Economou, V.; Papamichail, A.; Tsiouri, I. Governance and circularity in small municipalities: Lessons from Greece and Spain. Resour. Conserv. Recycl. 2024, 196, 106973. [Google Scholar]
- Lazarevic, D.; Valve, H.; Brandão, M. Challenges in assessing the socio-economic impacts of waste policy. Resour. Conserv. Recycl. 2023, 196, 106027. [Google Scholar]
- Szołdrowska, D.; Smol, M. The Current State of Water Resources in Poland—Possibilities of Water Reuse and Management by the Circular Economy. Desalin. Water Treat. 2025, 323, 101287. [Google Scholar] [CrossRef] [Scilit]
- Marek, M.; Krejza, Z. Circular Economy Development both in the Czech Republic and the World. Procedia Comput. Sci. 2023, 219, 1678–1686. [Google Scholar] [CrossRef] [Scilit]
- Somplák, R.; Pluskal, J.; Smejkalová, V. Waste Circularity Effort Indicator: A New Metric for Evaluating Waste Stream Management Beyond Recycling Rates. Resour. Conserv. Recycl. Adv. 2026, 31, 200355. [Google Scholar] [CrossRef] [Scilit]
- Gittins, T.; Letenyei, L. Informal Waste Collection and Municipal Waste Management in Hungary: A Pilot Project Featuring Smartphones to Estimate the Extent of Informally Retrieved Bulky Waste. Waste Manag. 2025, 200, 114757. [Google Scholar] [CrossRef] [Scilit] [PubMed]
- OLO. Bratislava Annual Report 2023; Internal Municipal Report; OLO a.s.: Bratislava, Slovak Republic, 2024; Available online: https://www.olo.sk (accessed on 19 December 2025).
- Ruiz-Real, J.L.; Uribe-Toril, J.; De Pablo Valenciano, J.; Gázquez-Abad, J.C. Worldwide research on circular economy and environment: A bibliometric analysis. Int. J. Environ. Res. Public Health 2018, 15, 2699. [Google Scholar] [CrossRef] [Scilit] [PubMed] [PubMed Central]
- Abu-Bakar, A.; Leong, Y.P.; Omar, M.F.; Hashim, H. Circular economy roadmaps: A global typological framework. J. Clean. Prod. 2024, 432, 139840. [Google Scholar]
- Anttiroiko, A.-V. Smart Circular Cities: Governing the Relationality, Spatiality, and Digitality in the Promotion of Circular Economy in an Urban Region. Sustainability 2023, 15, 12680. [Google Scholar] [CrossRef] [Scilit]
- Baumann, J.; Sigel, K.; Pohl, M. Measuring the circular economy at the local level: A framework and survey of indicators. J. Clean. Prod. 2024, 447, 140676. [Google Scholar]
- Betancourt Morales, C.M.; Zartha Sossa, J.W. Circular economy in Latin America: A systematic literature review. Bus. Strategy Environ. 2020, 29, 2479–2497. [Google Scholar] [CrossRef] [Scilit]
- Böhme, K.; Lüer, C.; Holstein, F. Circular Cities: Policies and Practices in the EU; Policy Report for the European Commission; Spatial Foresight GmbH: Heisdorf, Luxembourg, 2020. [Google Scholar]
- Calzolari, G.; Marinello, S.; Pezzuolo, A. Exploring the circular economy from a business perspective: A bibliometric analysis using the Business Model Canvas. Sci. Total Environ. 2024, 911, 168705. [Google Scholar]
- European Investment Bank & European Commission. Slovak Investment Holding: Multi-Sector Financial Instruments in Slovakia (Fi-Compass Case Study). 2023. Available online: https://www.fi-compass.eu/library/case-studies/slovak-investment-holding-multi-sector-financial-instruments-slovakia (accessed on 25 June 2025).
- European Commission. ICC Final Deliverable: Bratislava—Circular Economy Roadmap; Internal Document; European Commission DG GROW: Brussels, Belgium, 2021; (Unpublished Internal Communication); Available online: https://environment.ec.europa.eu/topics/circular-economy_en (accessed on 14 September 2025).
- Campbell-Johnston, K.; Gupta, J.; Reike, D.; Boons, F.; Bocken, N. Circular economy policies and strategies: A review. J. Ind. Ecol. 2019, 23, 23–36. [Google Scholar] [CrossRef] [Scilit]
- Gregor, M.; Mičieta, B.; Majerník, M. Sustainability assessment of municipal services: Case of smart waste management. Sustainability 2022, 14, 3023. [Google Scholar]
- Iqbal, A.; Haider, R.; Yasar, A.; Nizami, A.-S. A governance model for sustainable municipal solid waste management: Aligning the sector with Pakistan’s economic goals. Waste Manag. Bull. 2025, 3, 107–127. [Google Scholar] [CrossRef] [Scilit]
- Matej, J.; Simona, B. Environmental investment opportunities and circular economy financing. Economies 2024, 12, 289. [Google Scholar]
- OECD. Highlights: Closing the Loop in the Slovak Republic. Roadmap Towards a Circular Economy. Available online: https://www.oecd.org/en/topics/circular-economy-policies-and-country-studies.html (accessed on 23 May 2026).
- OECD. Environment Policy Papers, No. 10; OECD Publishing: Paris, France, 2022. [Google Scholar] [CrossRef]
- Papcunová, V.; Holubová, M. Transitioning to a circular economy in the waste sector: The Slovak municipal challenge. In Proceedings of the International Waste Management Conference, Brno, Czech Republic, 5–6 May 2023. [Google Scholar]
- Prendeville, S.; Cherim, E.; Bocken, N. Circular cities: Mapping six cities in transition. Environ. Innov. Soc. Transit. 2016, 26, 171–194. [Google Scholar] [CrossRef] [Scilit]
- Pieroni, M.P.P.; McAloone, T.C.; Pigosso, D.C.A. Business Model Innovation for Circular Economy: Integrating Literature and Practice into a Conceptual Process Model. Proc. Des. Soc. Int. Conf. Eng. Des. 2019, 385, 135756. [Google Scholar] [CrossRef] [Scilit]
- Pires, A.; Martinho, G. Waste hierarchy index for circular economy in waste management. Waste Manag. 2019, 95, 298–305. [Google Scholar] [CrossRef] [Scilit] [PubMed]
- Raes, J.; Boon, W.; Loorbach, D. Governing the circular economy transition in cities. Technol. Forecast. Soc. Change 2023, 189, 122394. [Google Scholar]
- Ritzén, S.; Sandström, G. Barriers to the circular economy: Integration of perspectives. J. Clean. Prod. 2017, 143, 157–169. [Google Scholar] [CrossRef] [Scilit]
- Salvador, M.; Sancho, D. The Role of Local Government in the Drive for Sustainable Development Public Policies. An Analytical Framework Based on Institutional Capacities. Sustainability 2021, 13, 5978. [Google Scholar] [CrossRef] [Scilit]
- Skýpalová, R. Conceptual gaps in circular economy implementation at the local level: A review. J. Urban Manag. 2024, 13, 90–104. [Google Scholar]
- Stahel, W.R. The Circular Economy: A User’s Guide, 1st ed.; Routledge: London, UK, 2019; Volume 118. [Google Scholar] [CrossRef] [Scilit]
- Statistical Office of the Slovak Republic. Available online: https://datacube.statistics.sk/#!/view/en/VOD/VOD0226/ (accessed on 8 April 2026).
- Urban Development Working Group. Urban Development and Circular Economy: Inspirational Approaches from Across the Americas; Inter-American Development Bank: Washington, DC, USA, 2021; pp. 22–64. [Google Scholar]
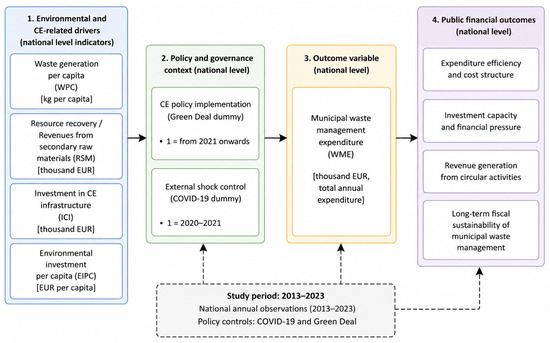
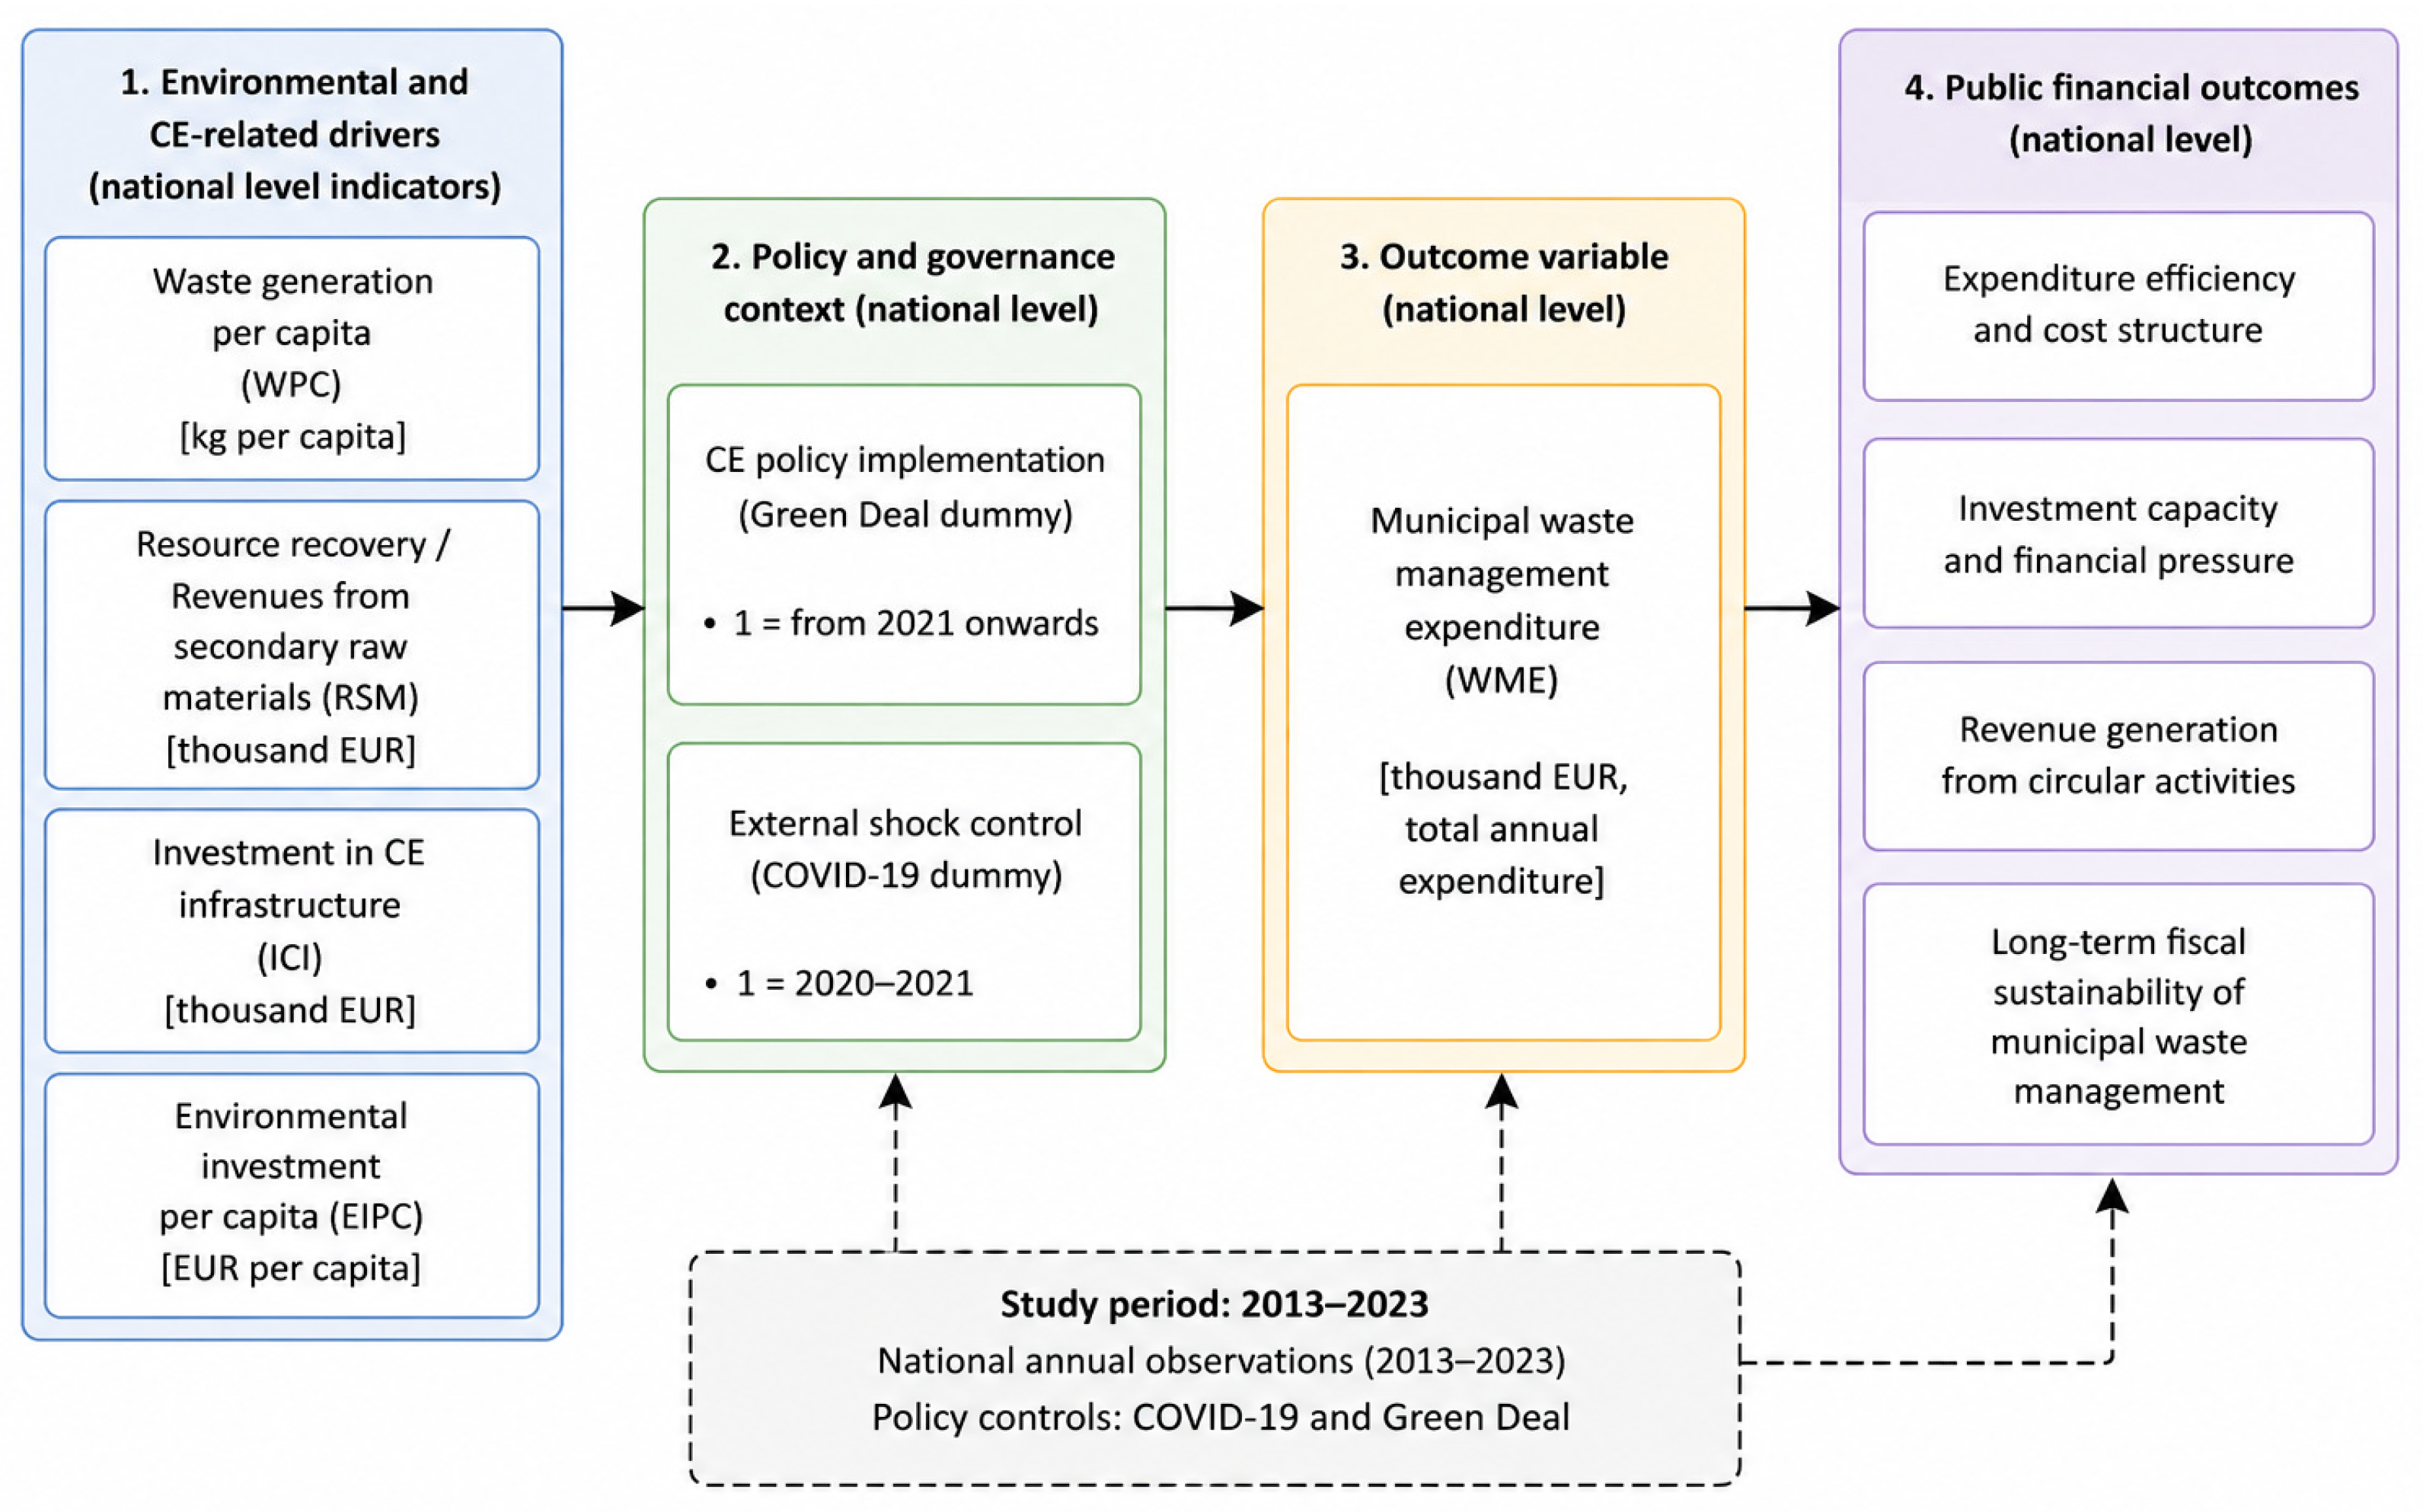
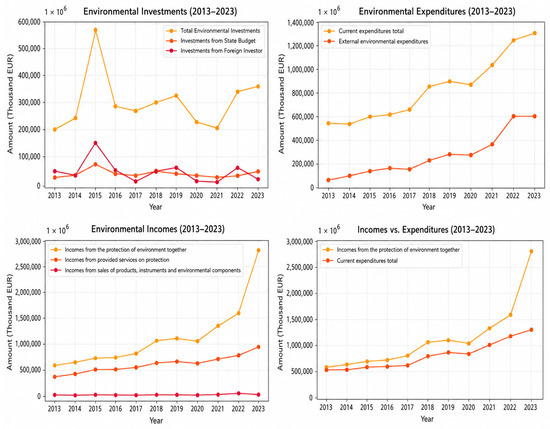
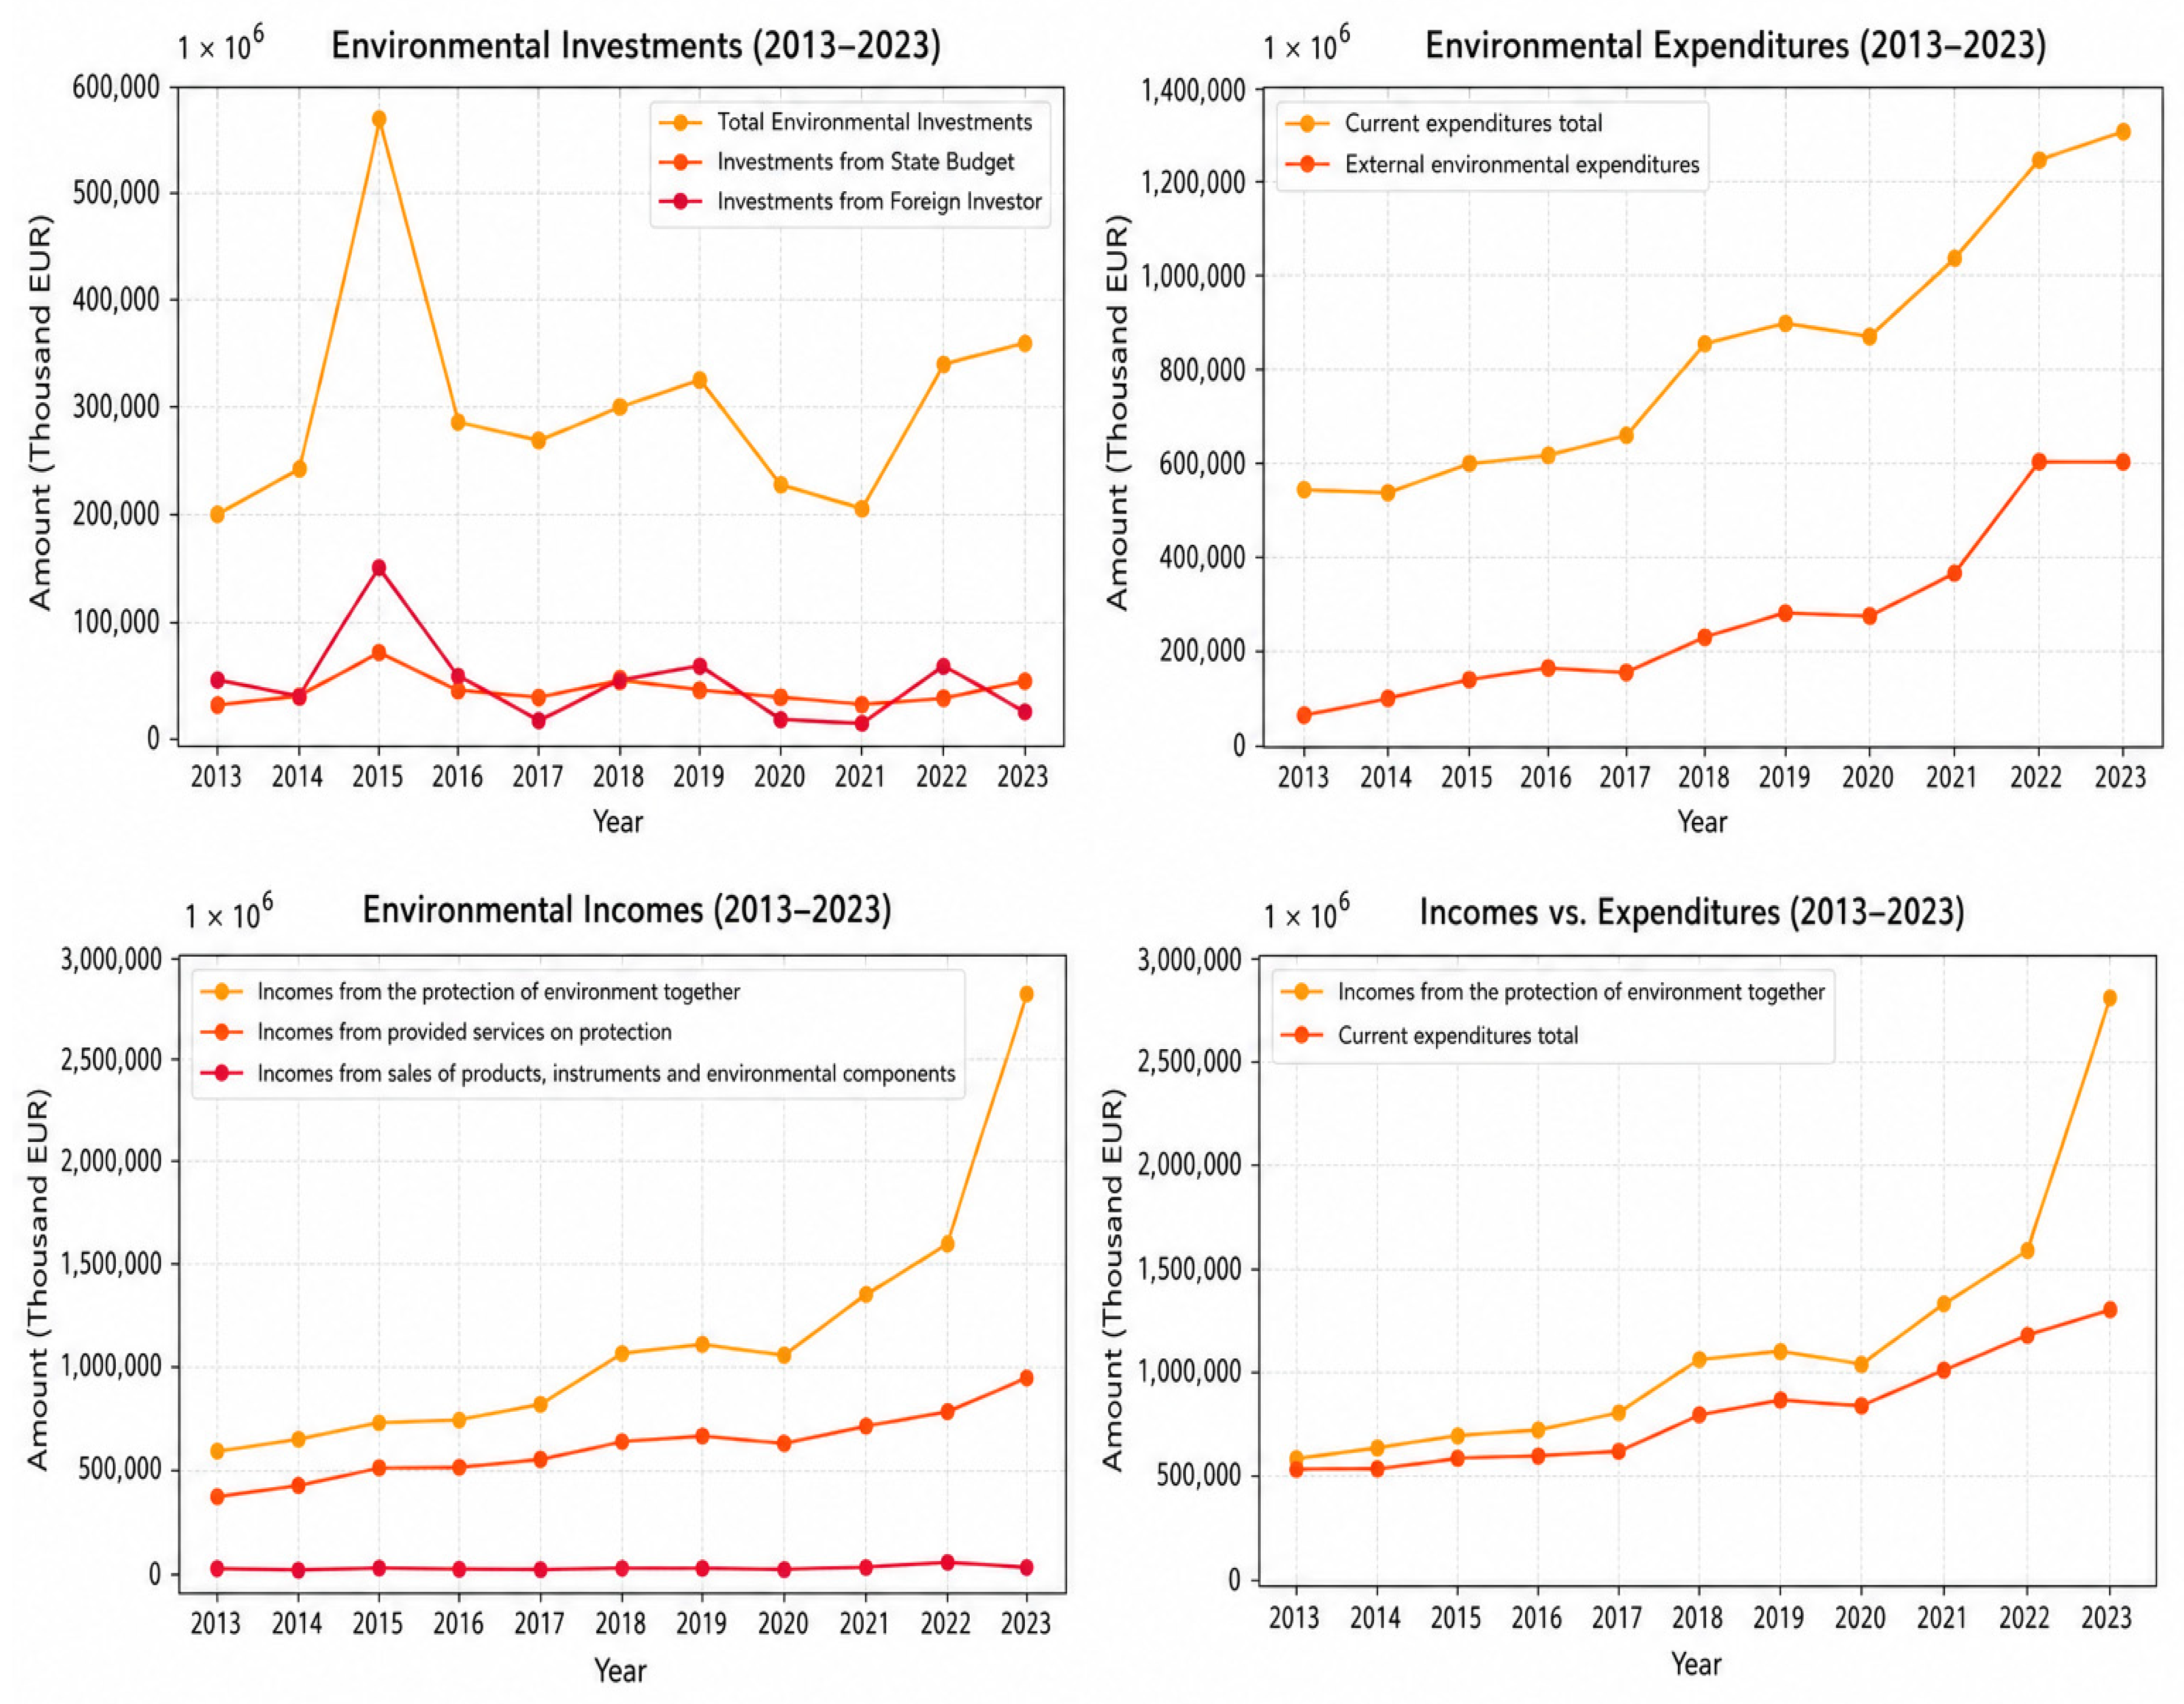
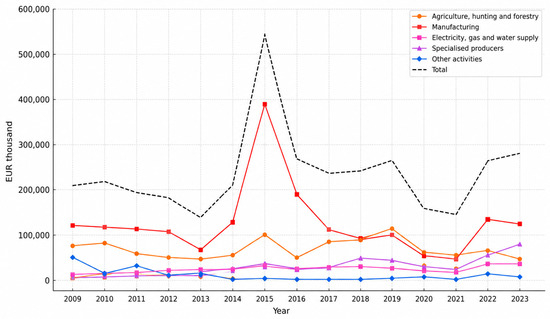
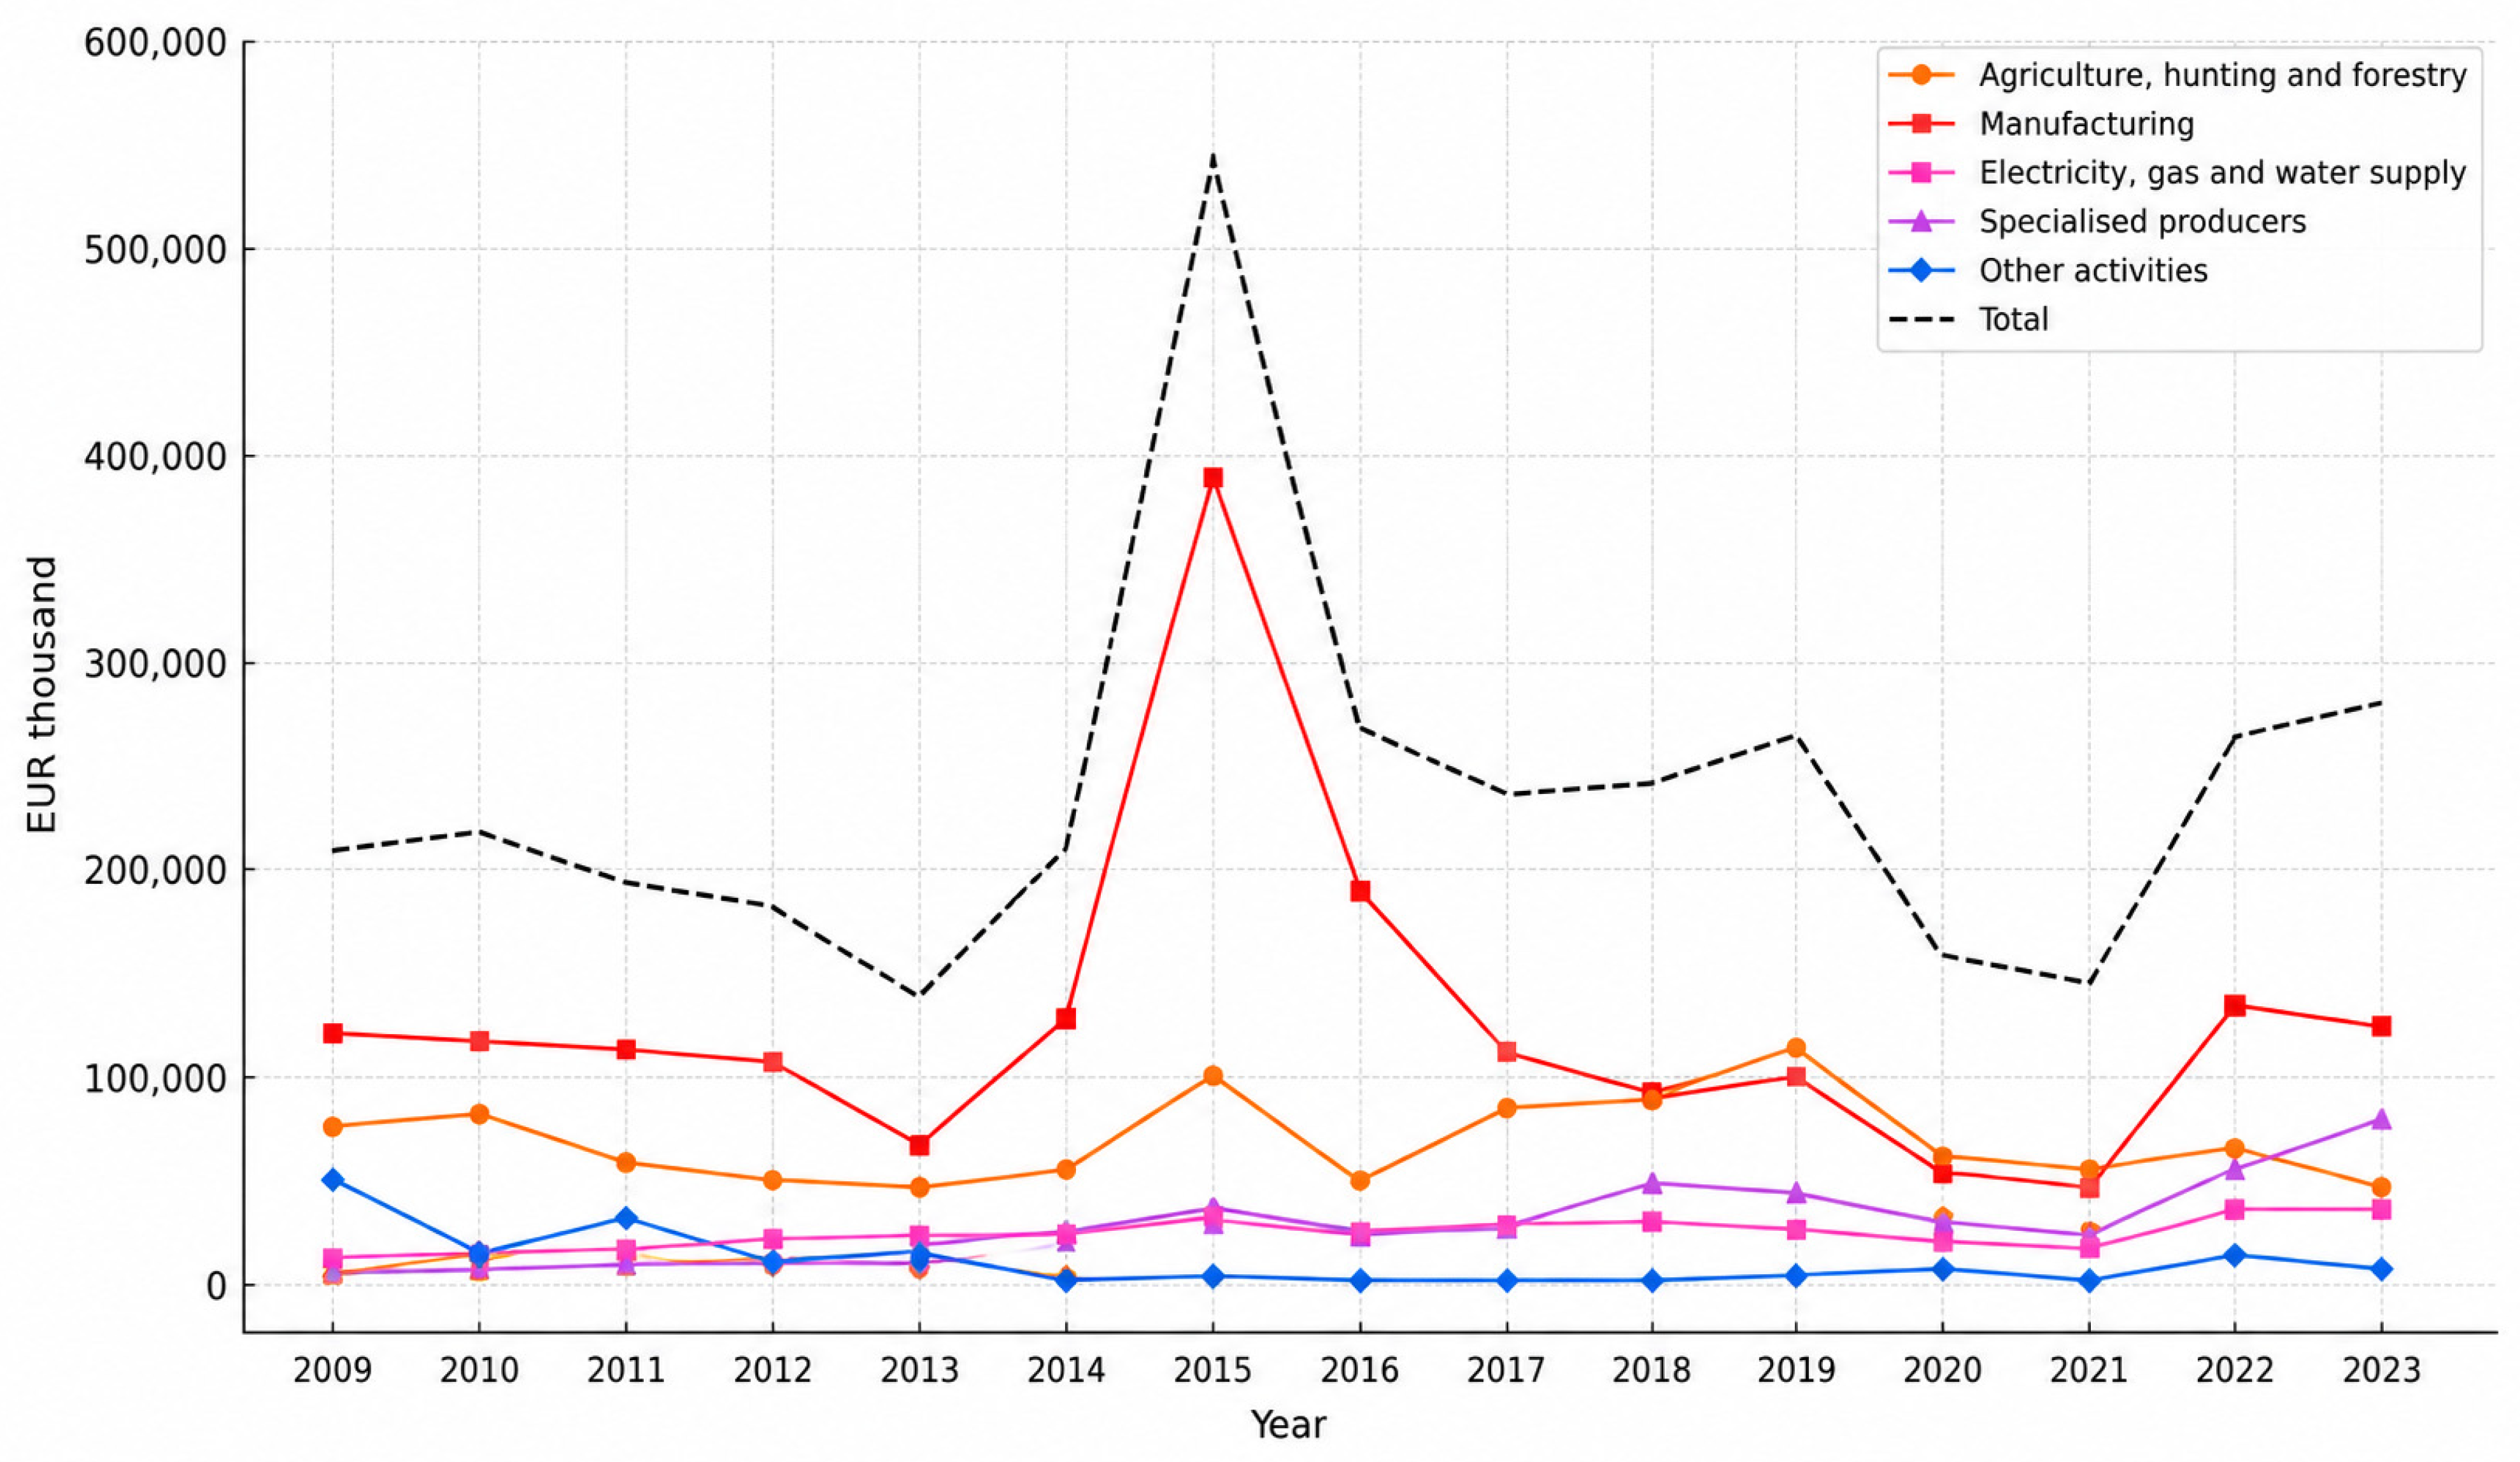
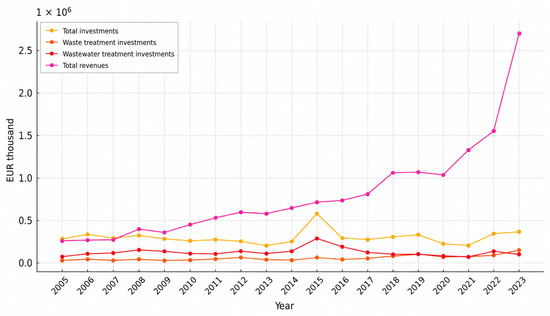
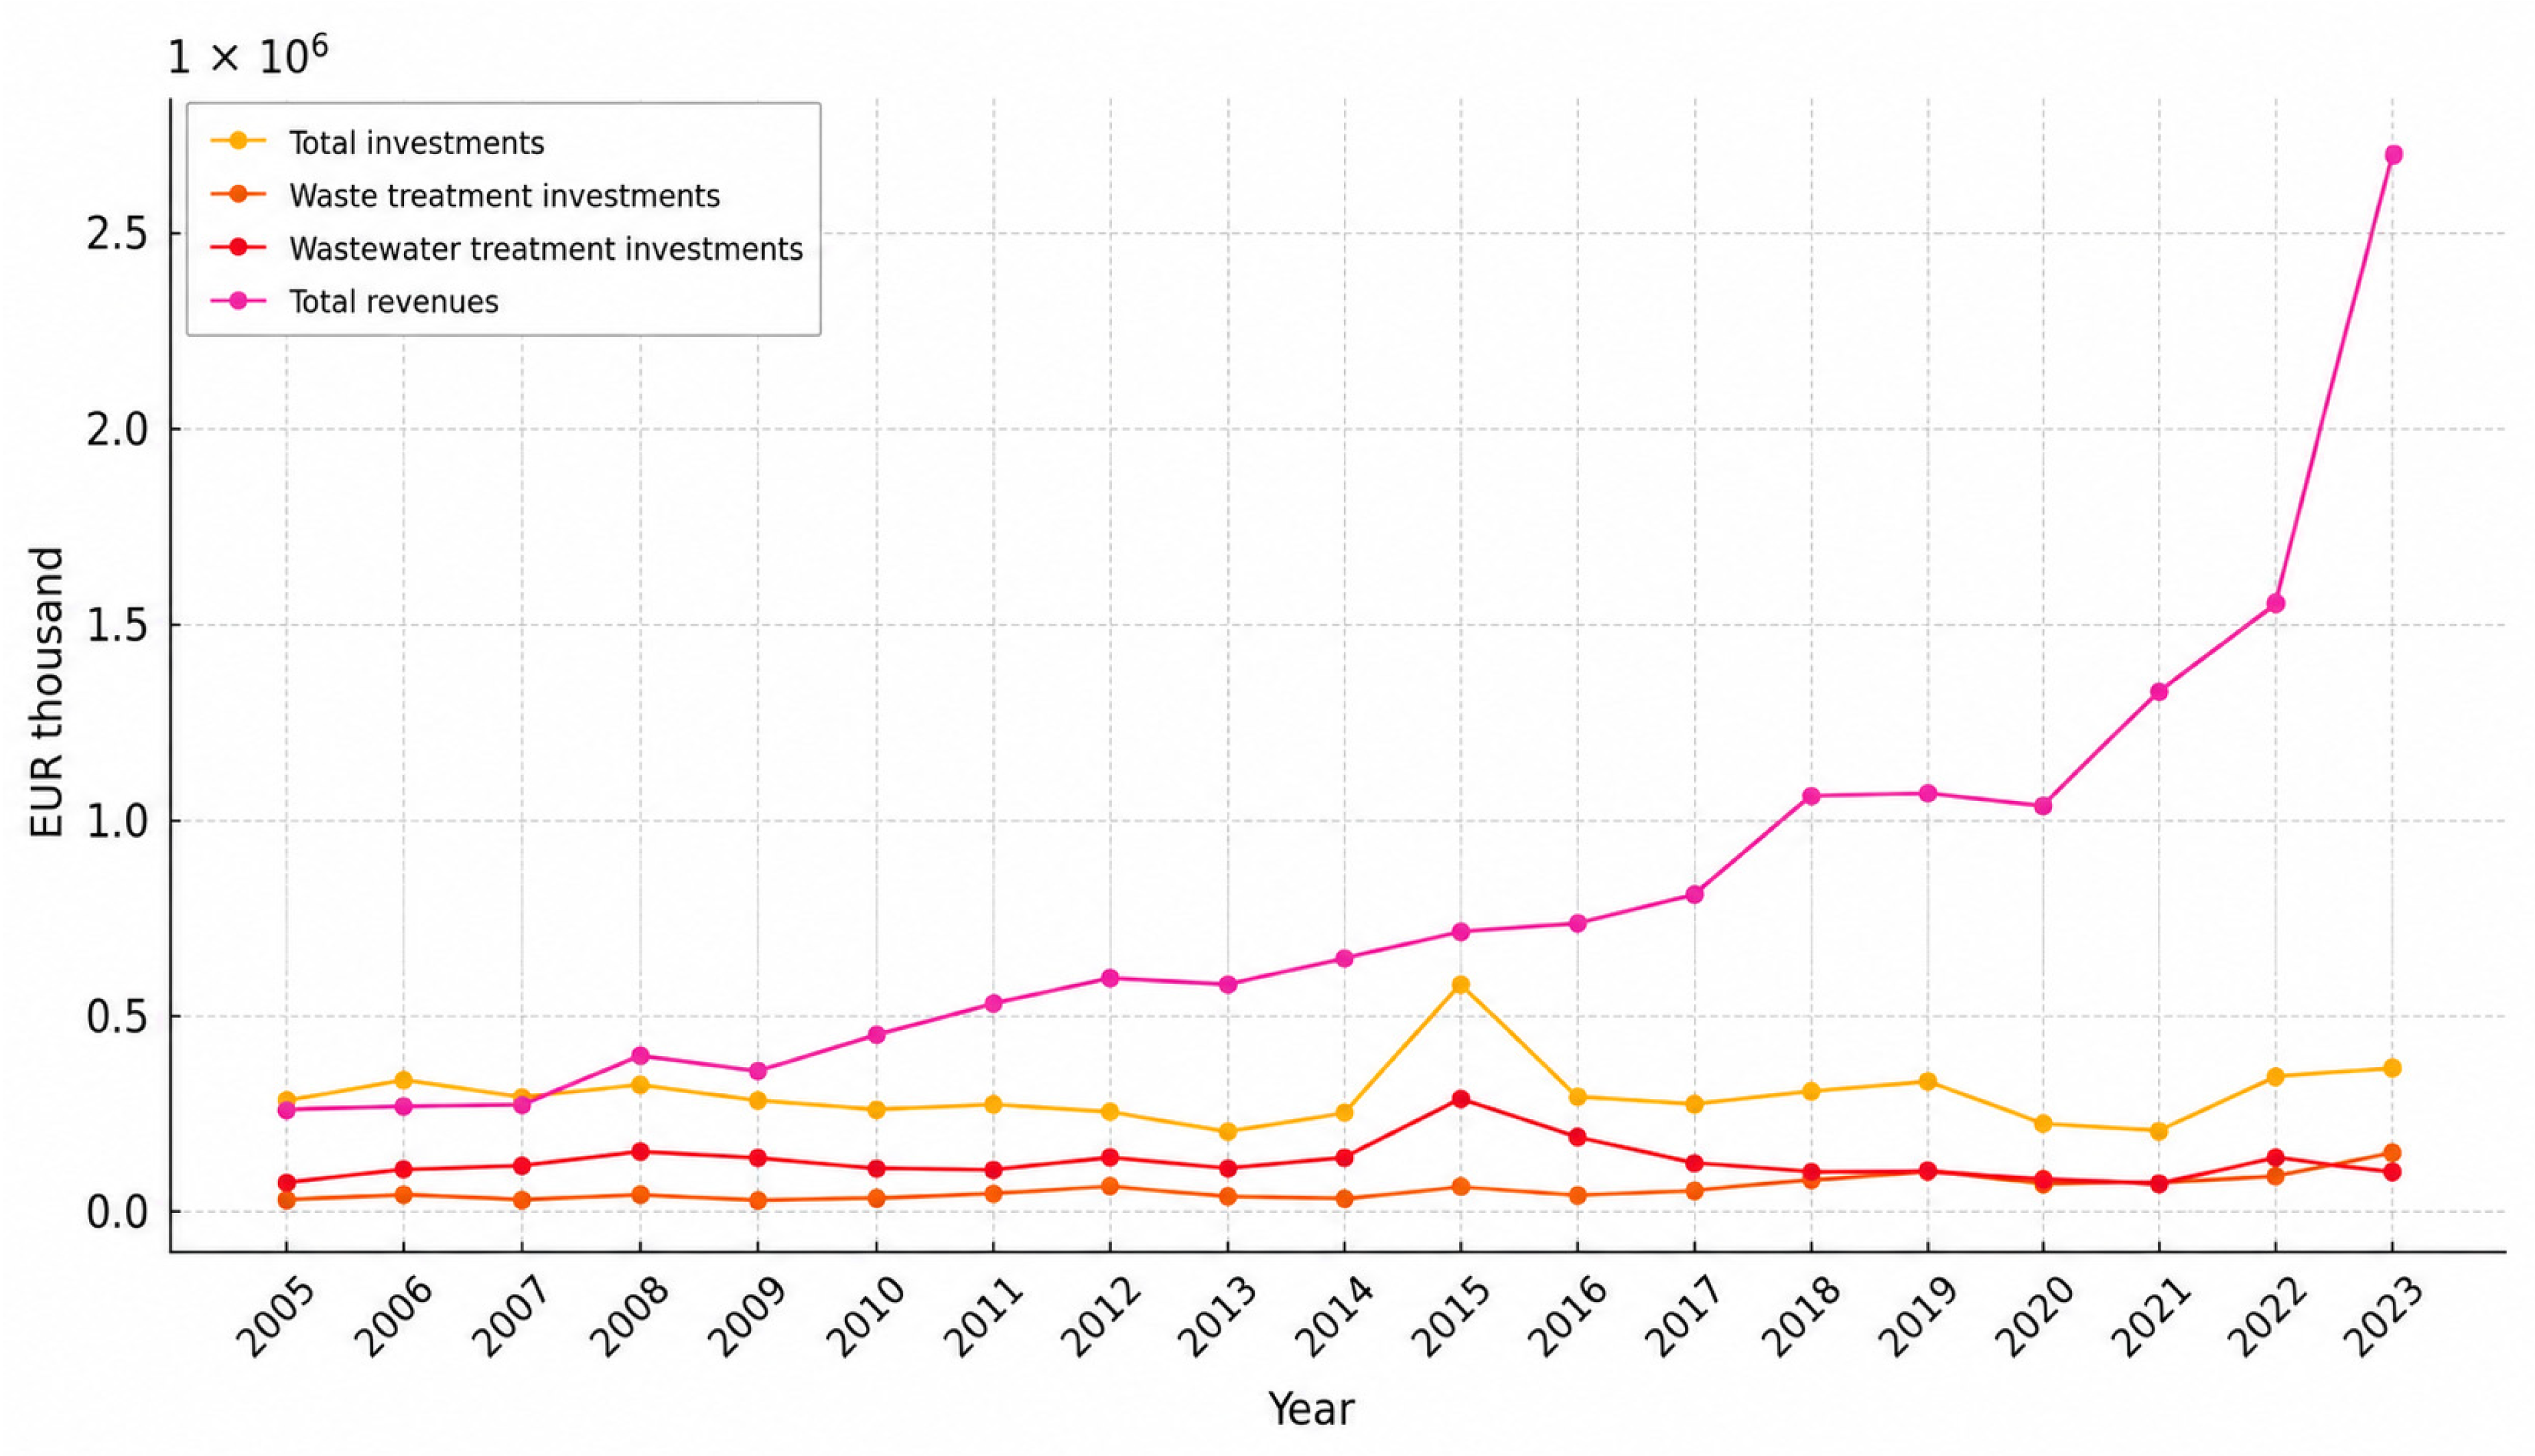
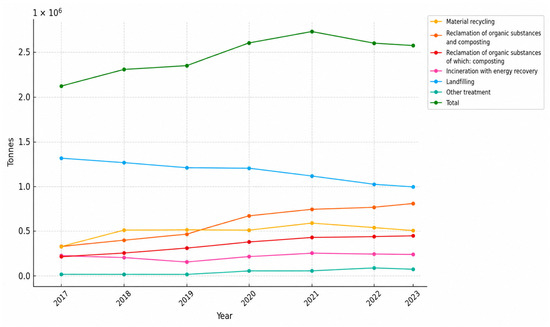
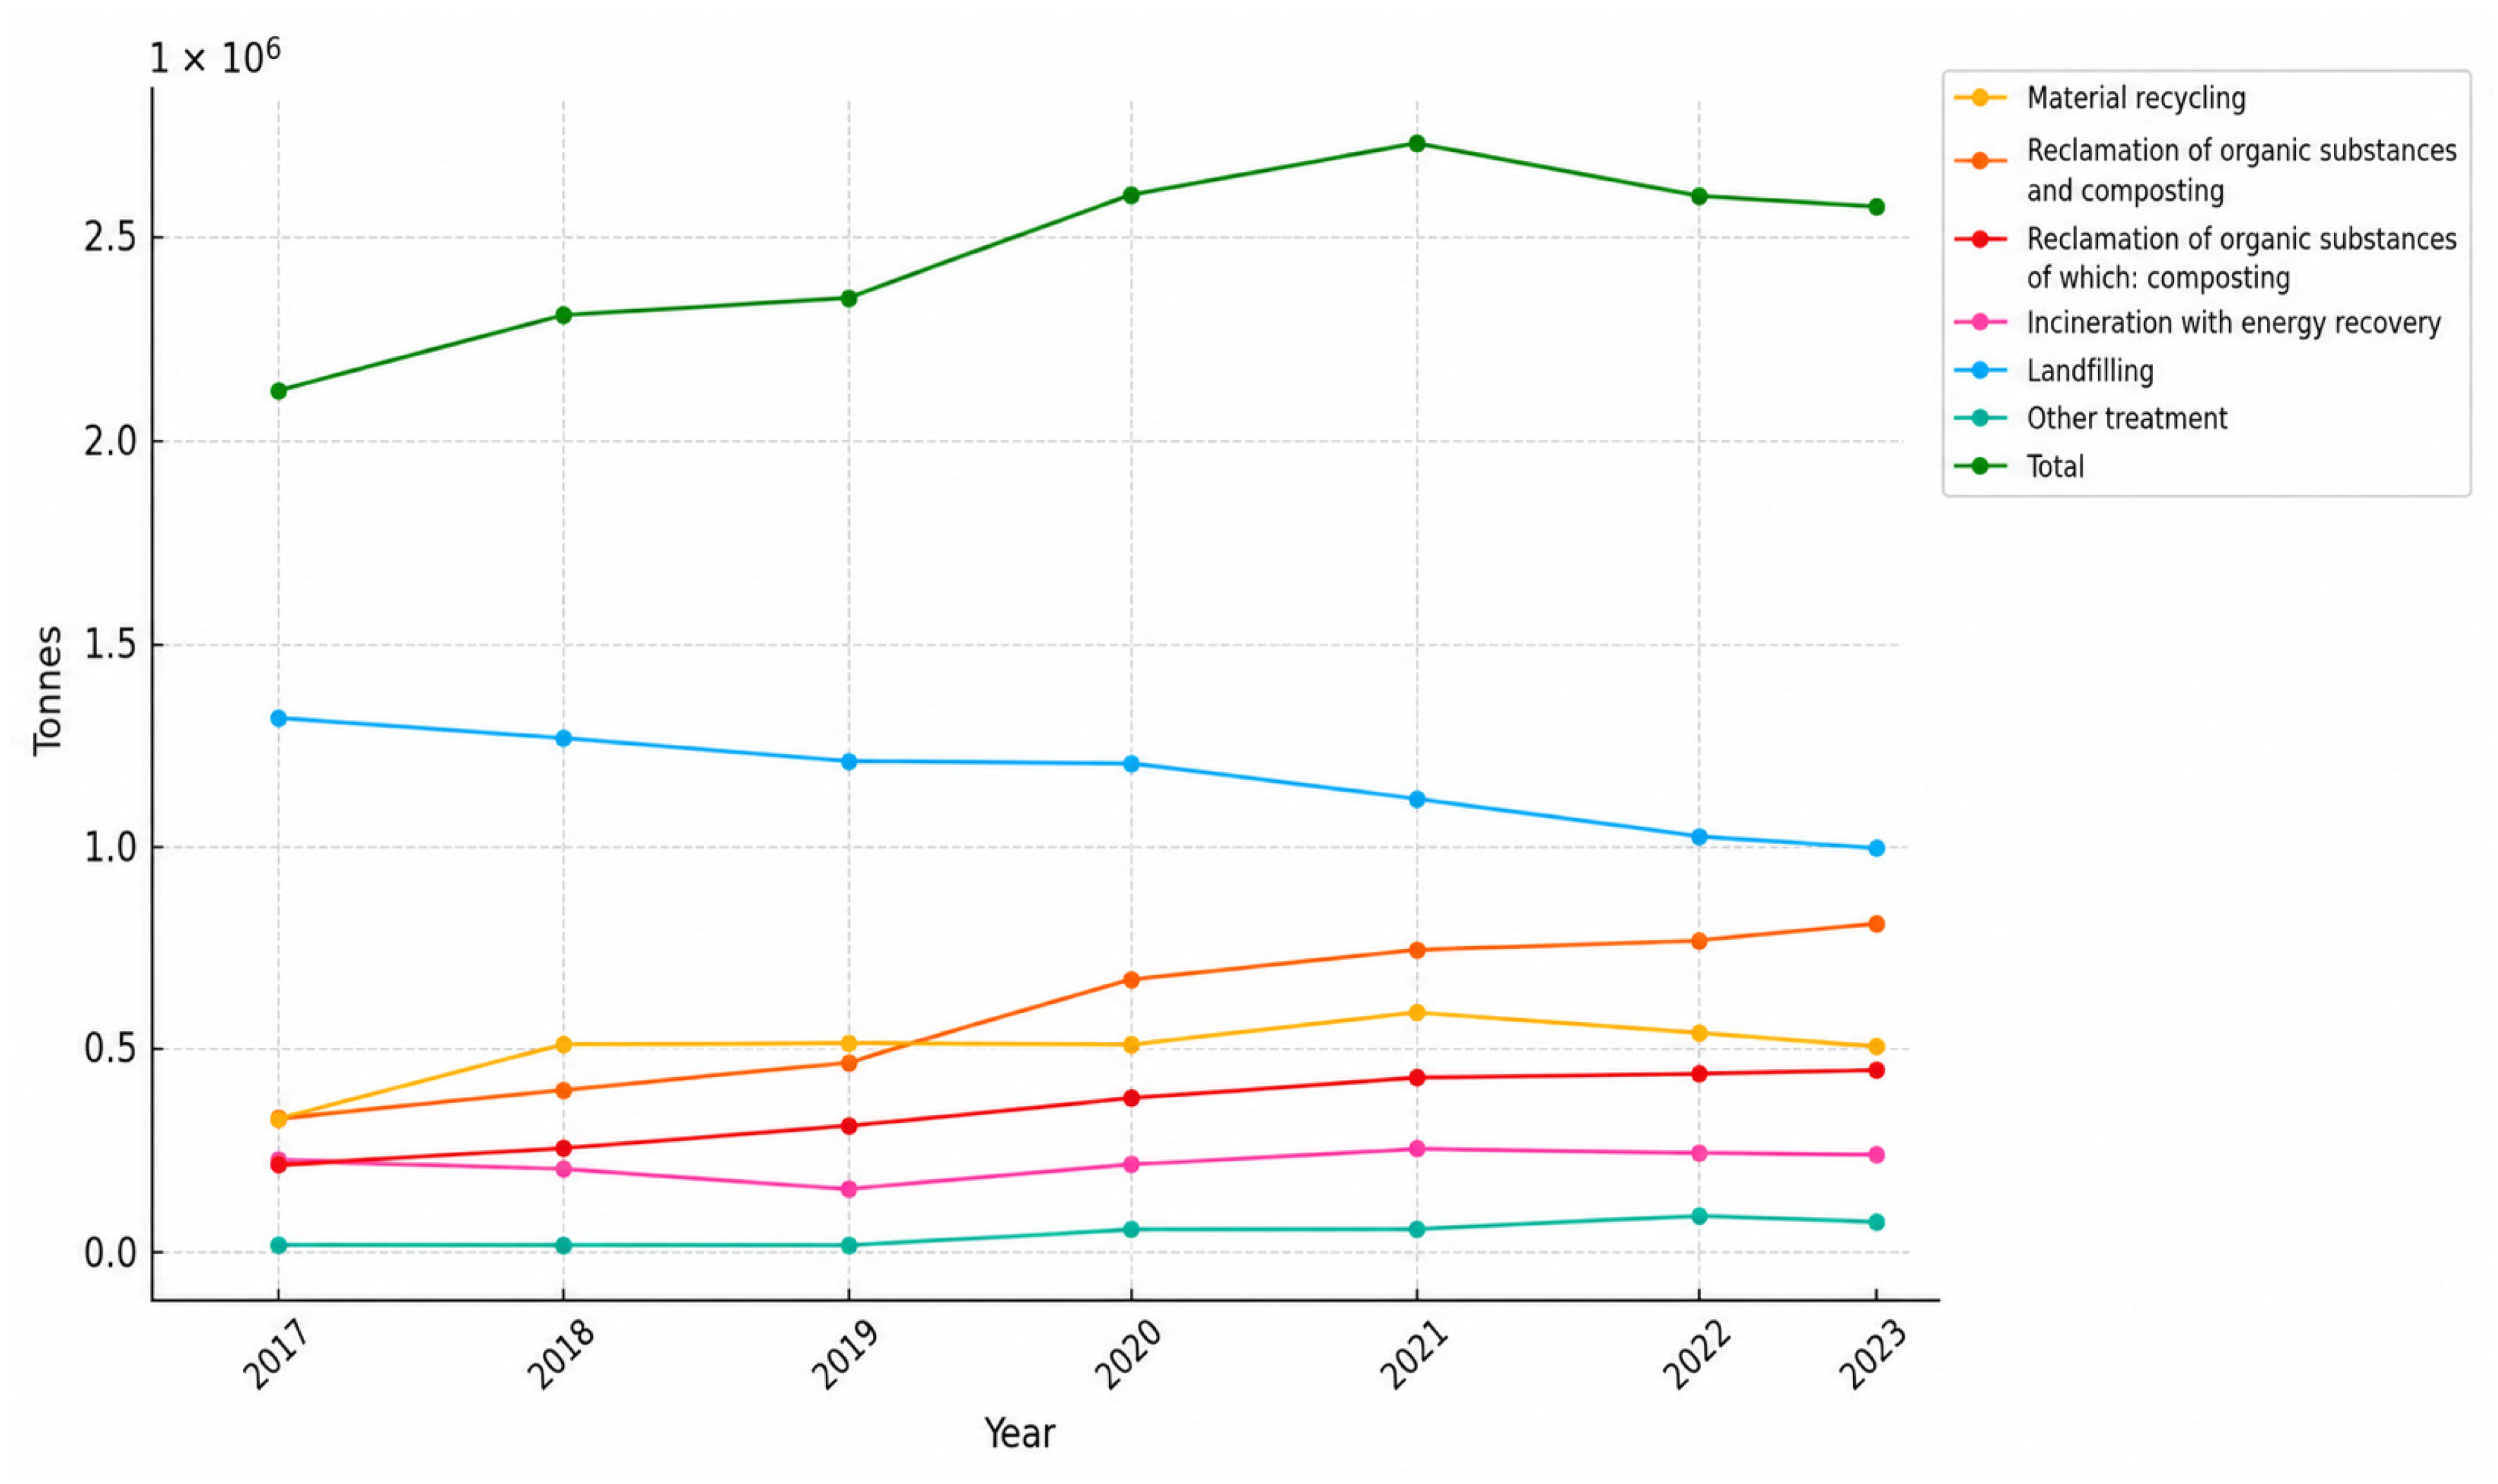
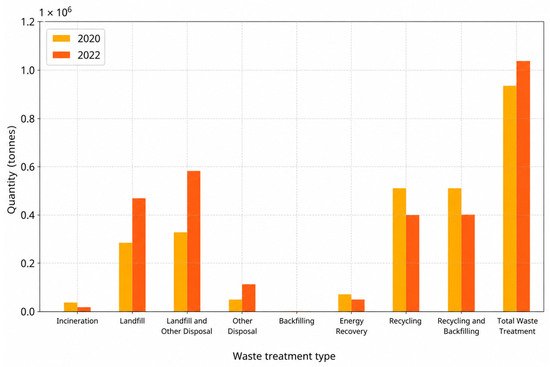
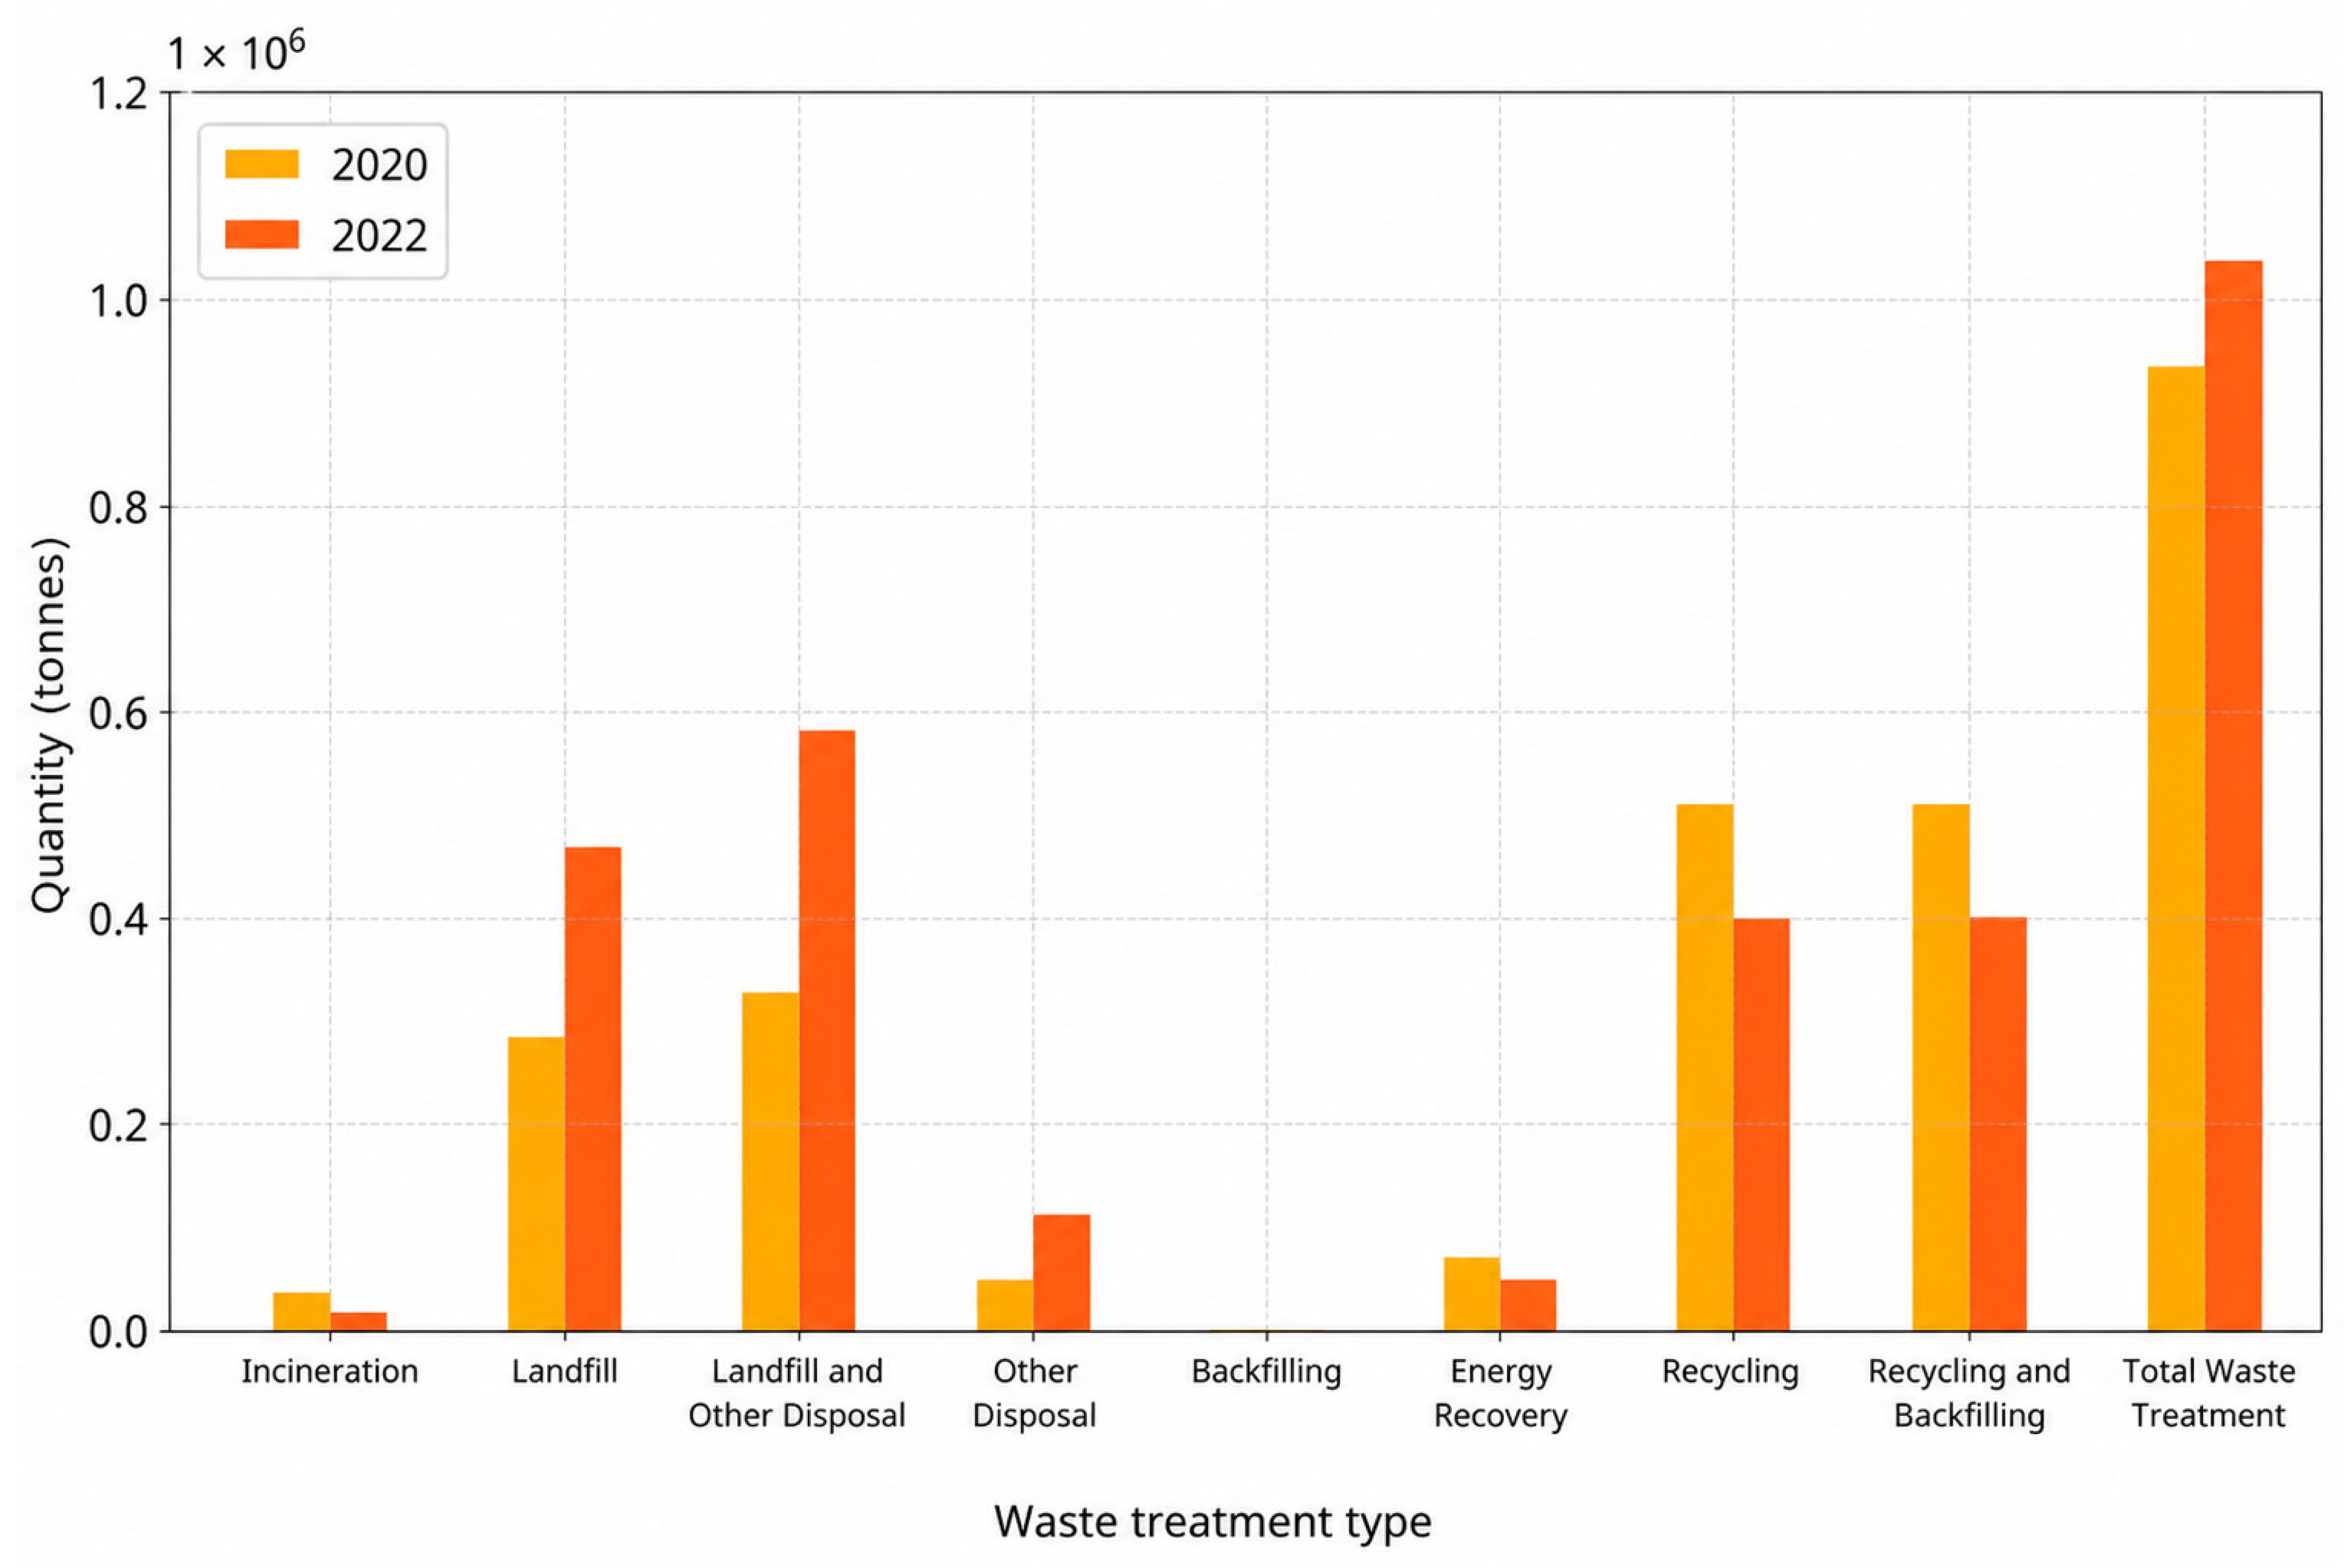
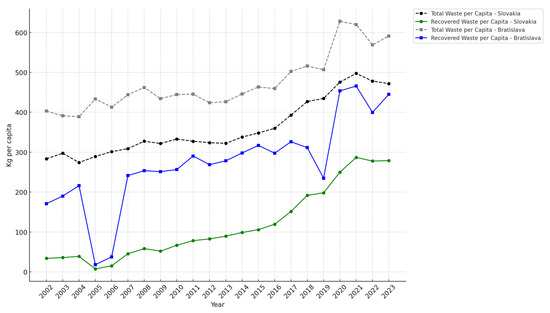
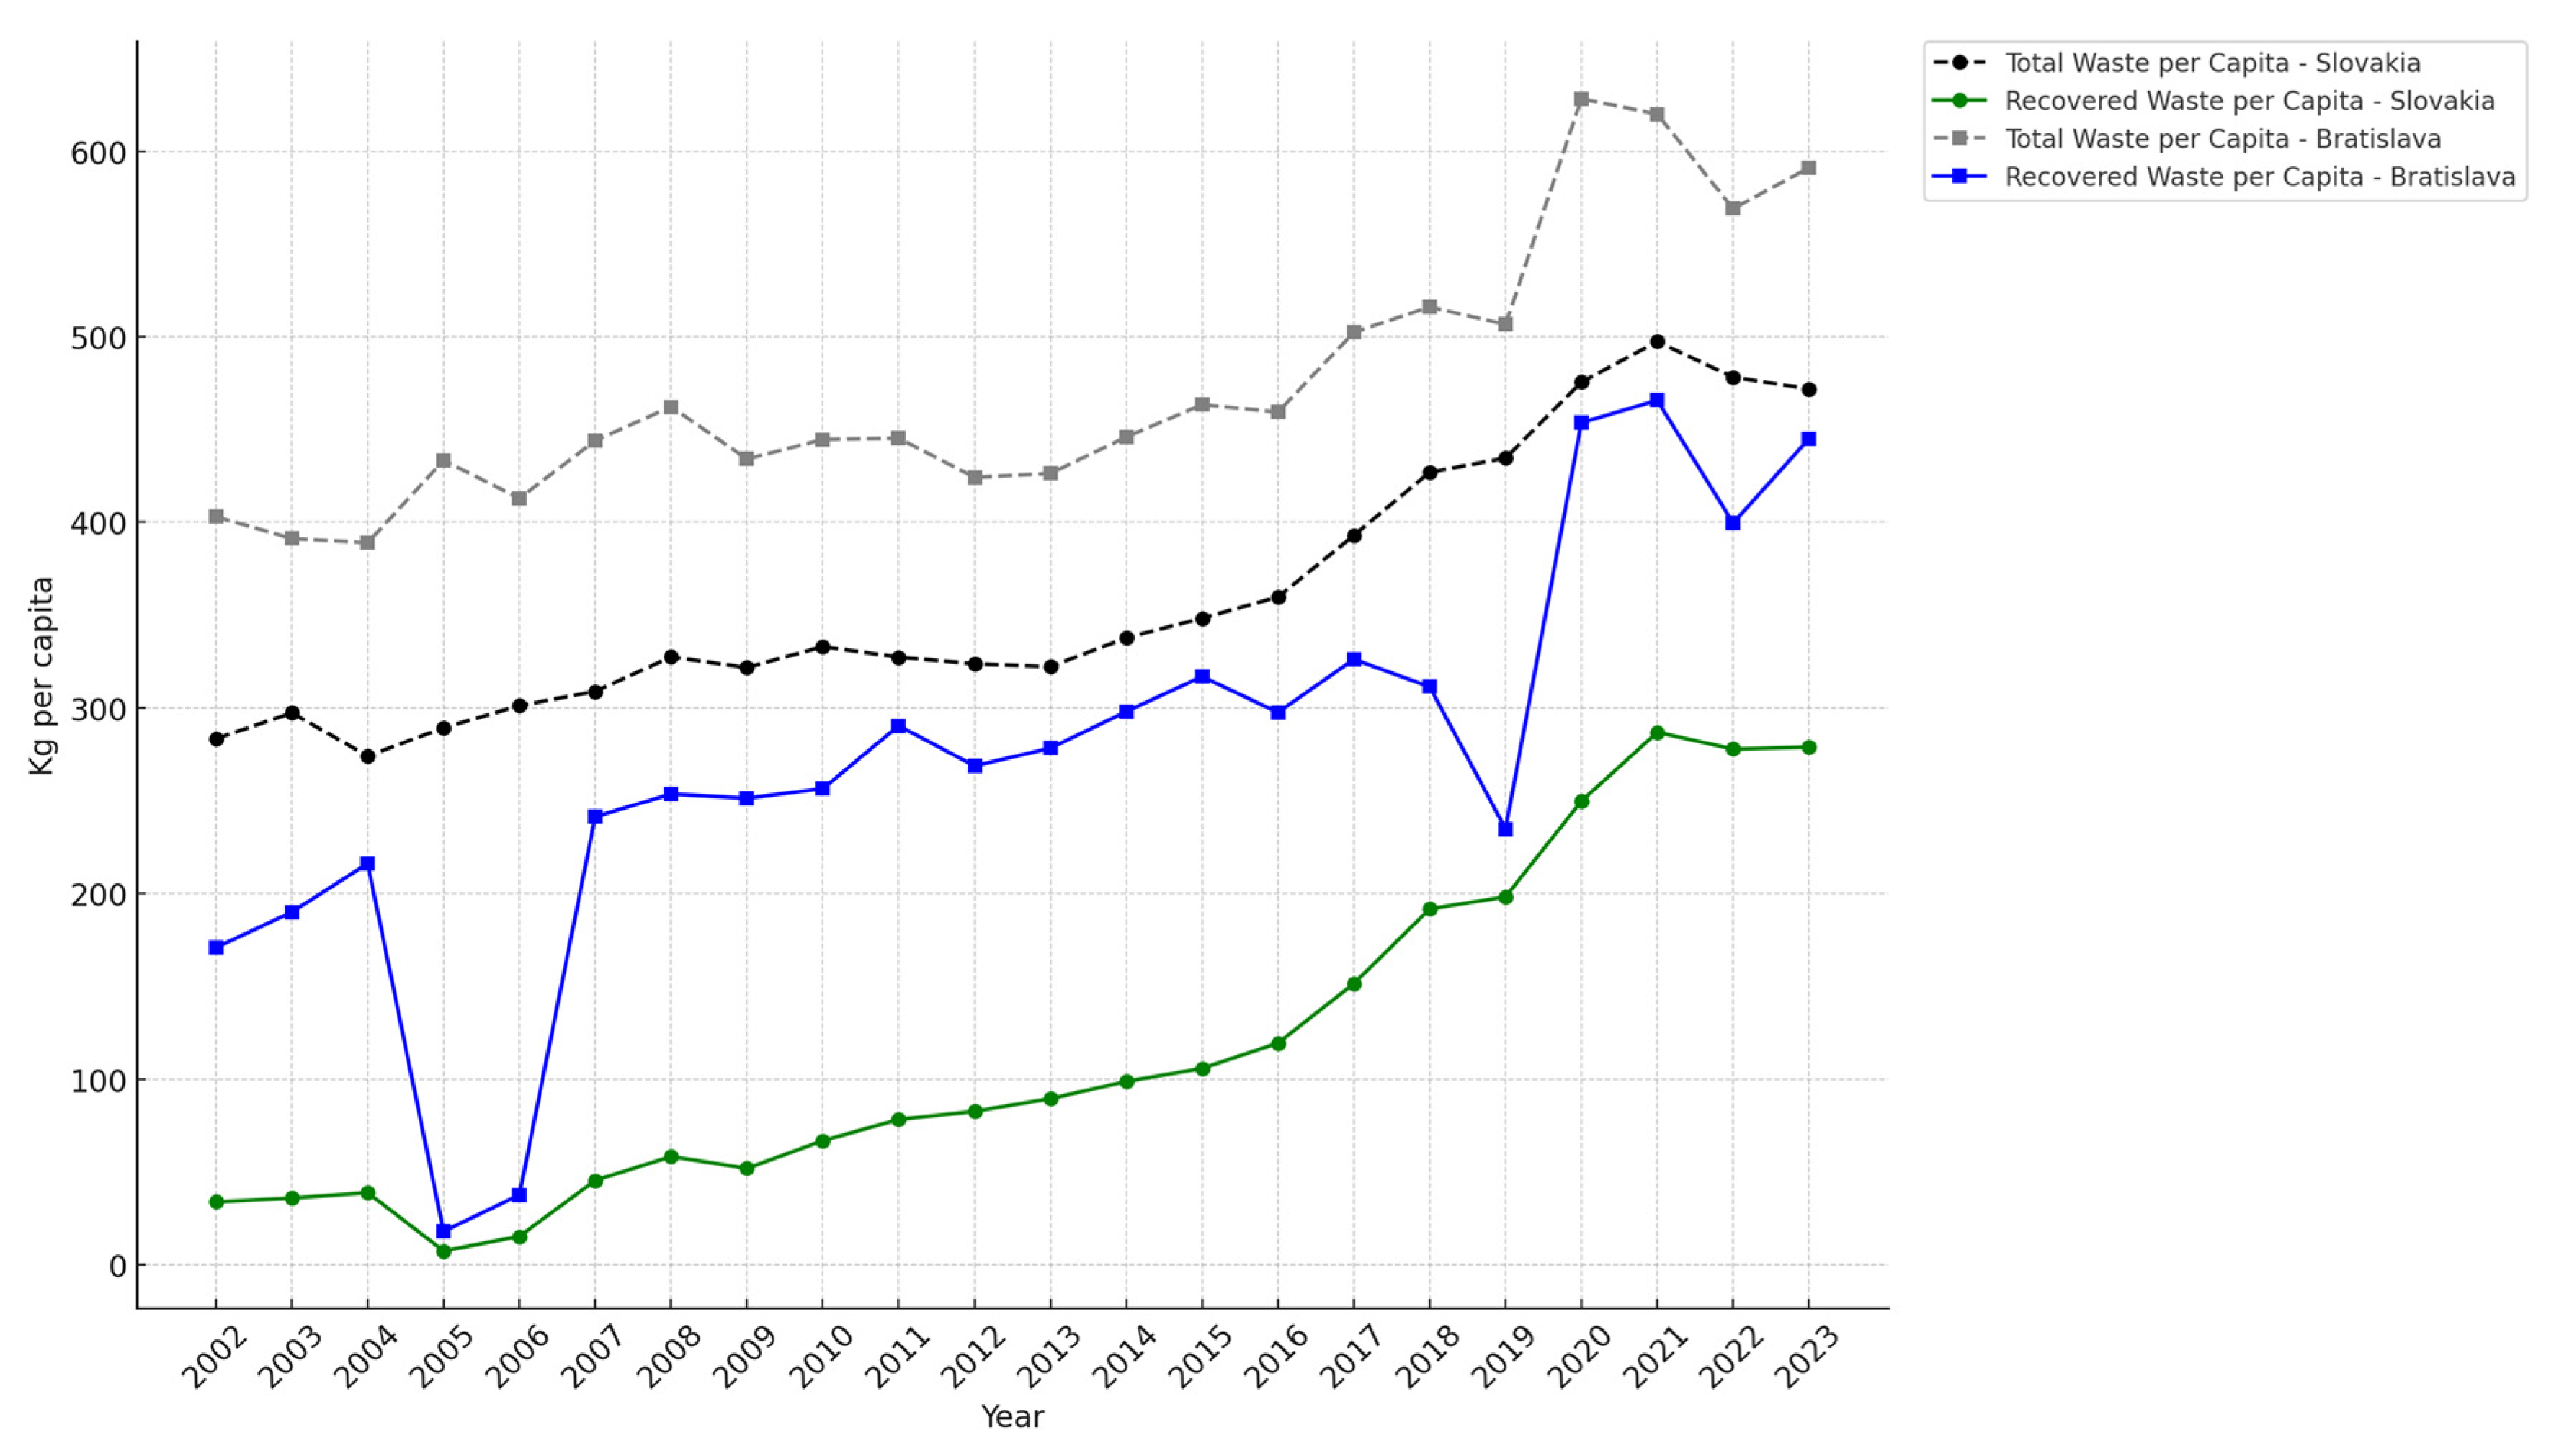
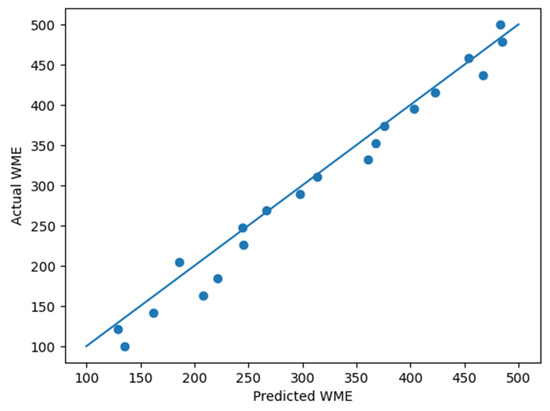
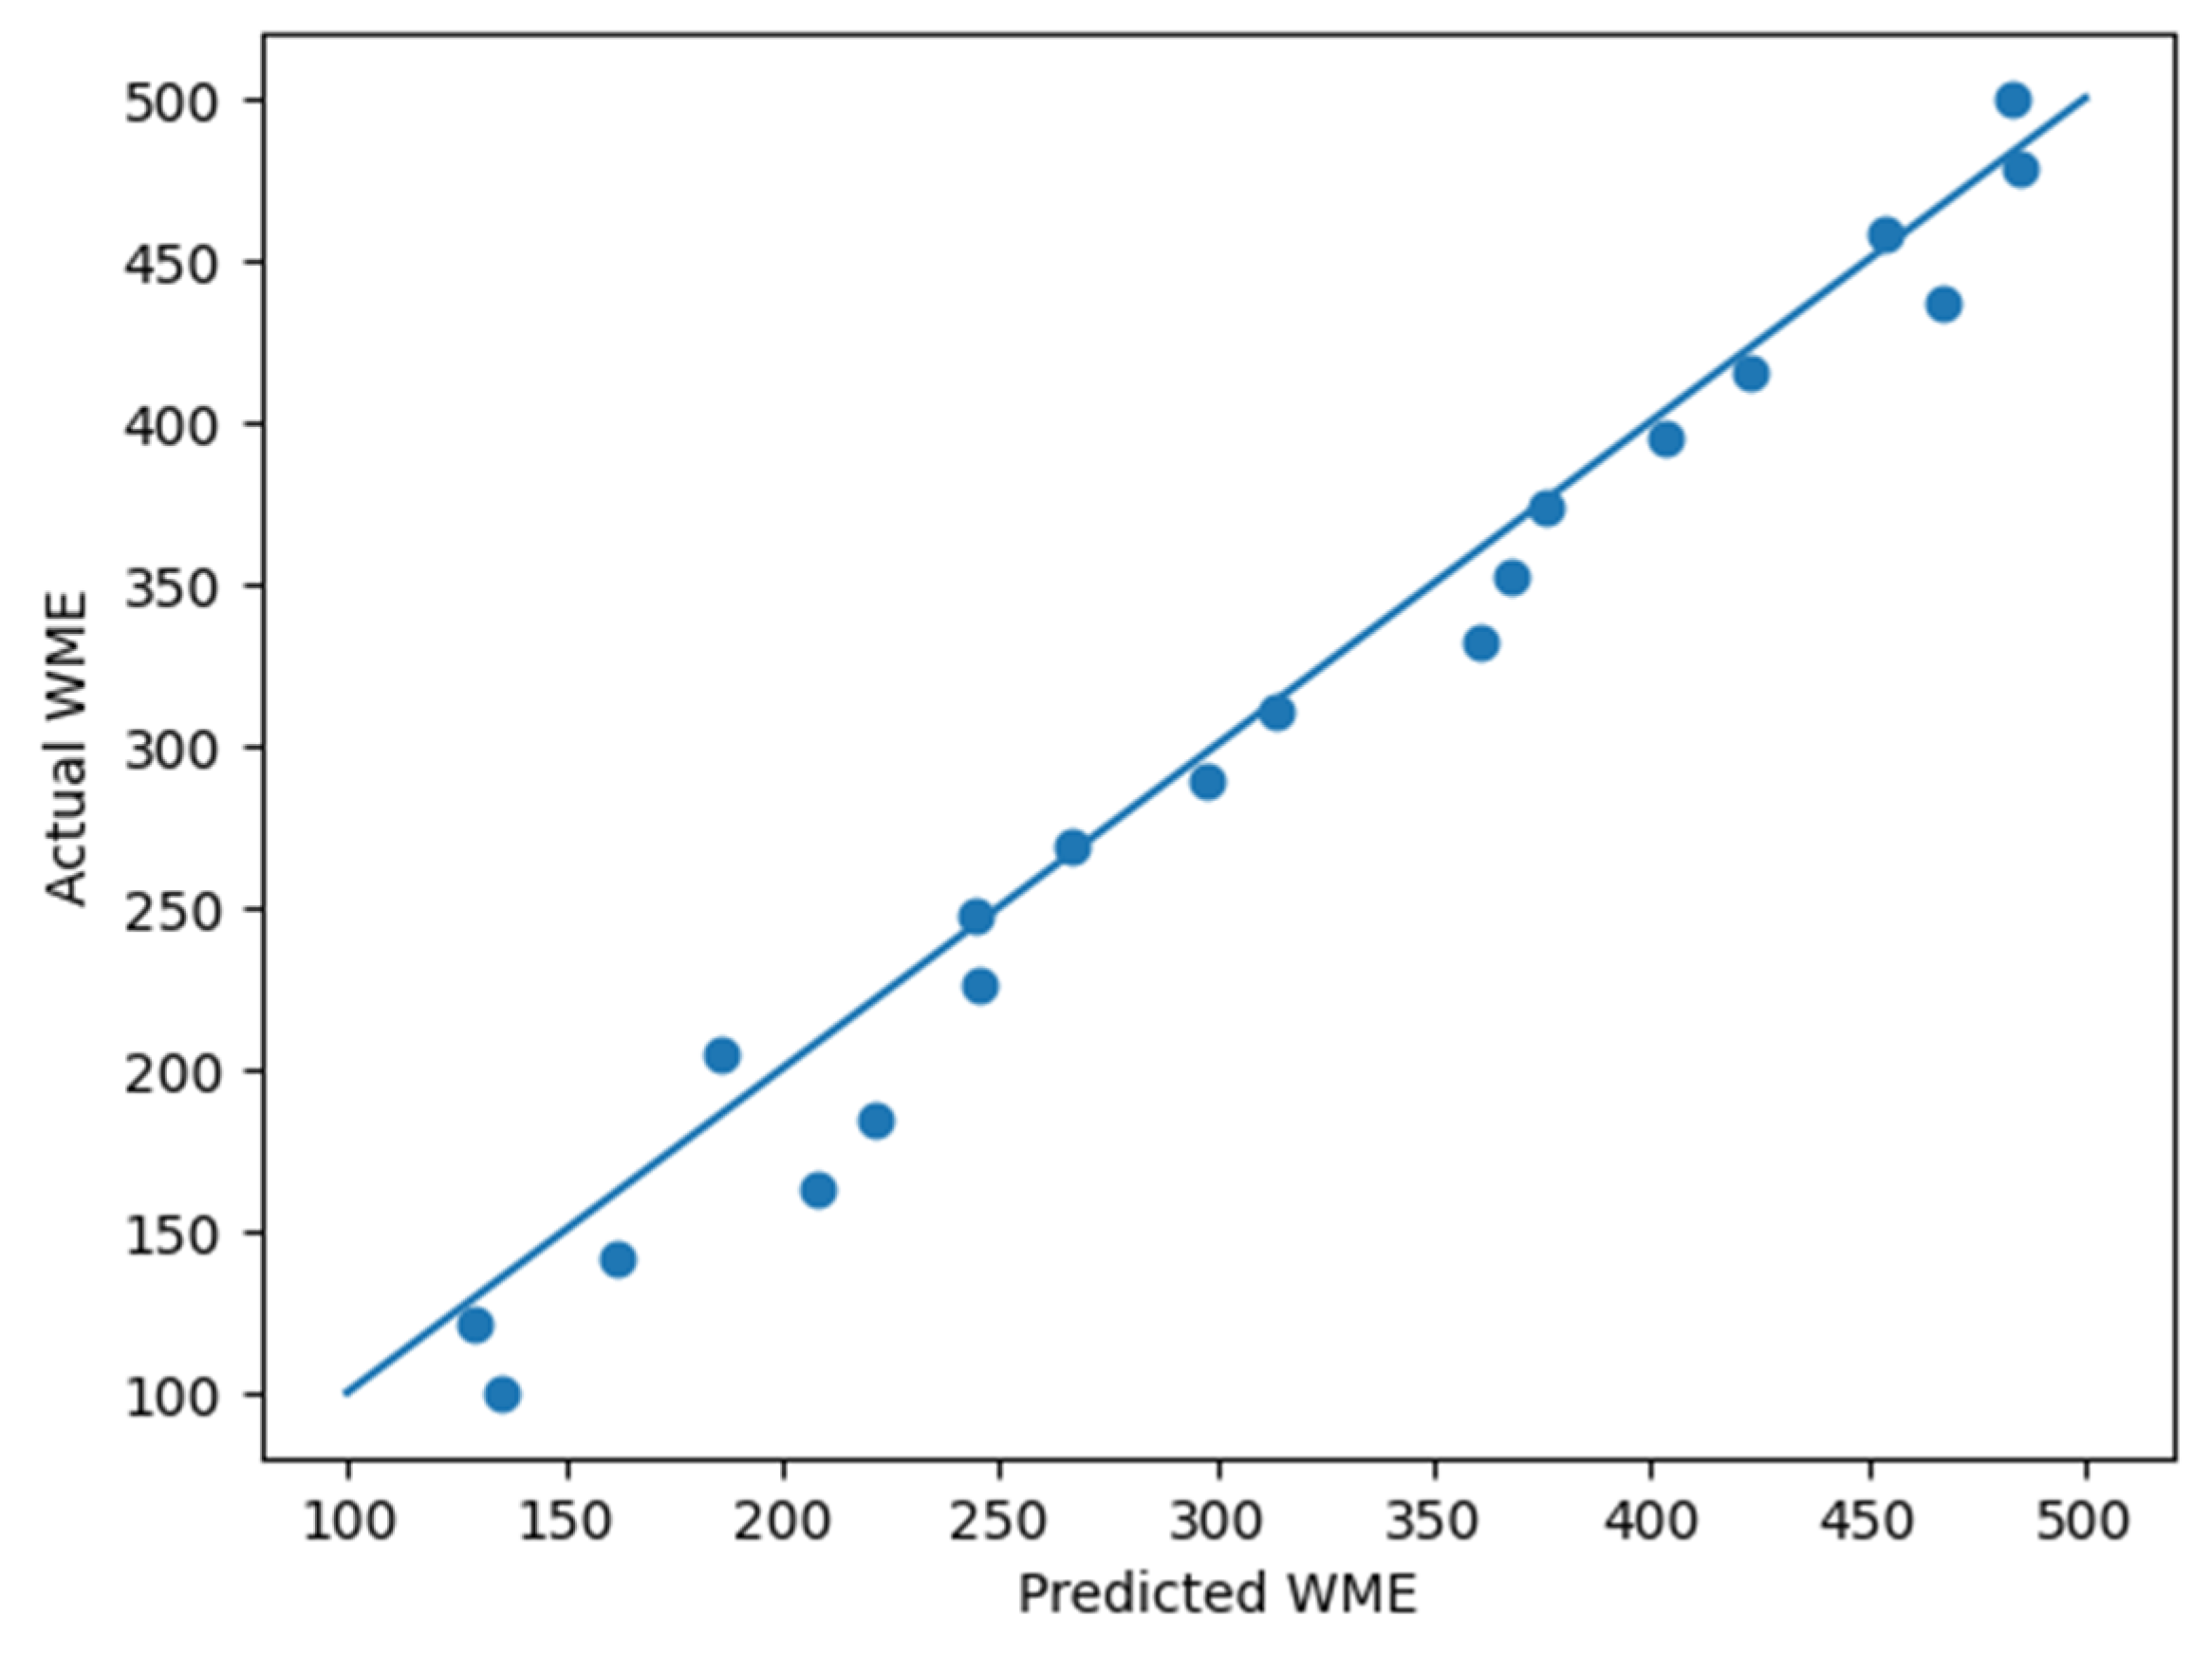
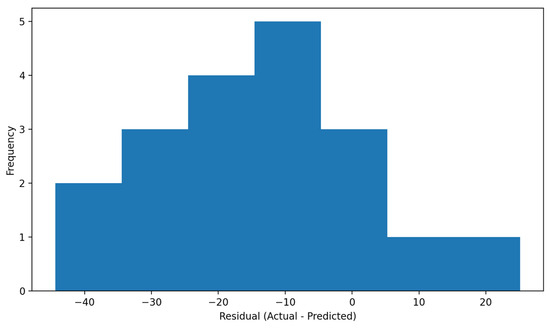
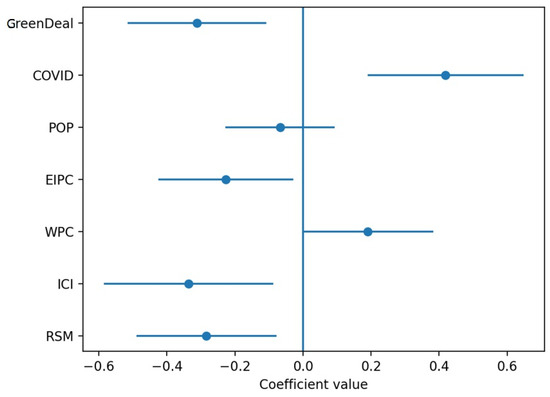

Disclaimer/Publisher’s Note: The statements, opinions and data contained in all publications are solely those of the individual author(s) and contributor(s) and not of MDPI and/or the editor(s). MDPI and/or the editor(s) disclaim responsibility for any injury to people or property resulting from any ideas, methods, instructions or products referred to in the content. |
© 2026 by the authors. Licensee MDPI, Basel, Switzerland. This article is an open access article distributed under the terms and conditions of the Creative Commons Attribution (CC BY) license.