


Abstract
This paper evaluates whether hydrogen-based marine fuels were financially feasible in the European maritime sector in mid-2026 without subsidies, grants, contracts for difference, preferential carbon-price treatment, or other public subventions. A techno-economic model compares pure hydrogen fuel cells, hydrogen internal combustion, ammonia combustion and fossil marine fuels for general cargo ships, container ships and passenger liners. The model combines 2026 bunker quotations, fuel-energy properties, EU ETS exposure, FuelEU Maritime requirements, ammonia cost evidence and scenario assumptions for delivered renewable hydrogen. Results show that fossil-fuel-equivalent useful propulsion costs remain substantially lower than hydrogen and ammonia alternatives under a no-support baseline. Current EU policy narrows the gap but does not close it. The hypothesis is confirmed: in mid-2026, hydrogen-based propulsion is not commercially feasible without public support, except for exceptional pilots and premium fixed-route niches. Under the paper’s central scenarios, unsubsidised parity is unlikely before 2032–2035 for short routes and 2035–2040 for larger vessels. Green methanol is treated as a complementary hydrogen-derived pathway whose easier storage and handling may favour selected services, although its lifecycle benefit depends on renewable hydrogen and a sustainable carbon source.
1. Introduction
Maritime transport is now directly integrated into the European Union climate-policy architecture. The European Commission reports that shipping accounts for approximately 3–4% of total EU CO2 emissions and that, from January 2024, ships of 5000 gross tonnage and above are subject to the EU Emissions Trading System for voyages and port calls within the scope of the regulation [1]. FuelEU Maritime complements this carbon-pricing instrument by imposing a well-to-wake greenhouse gas intensity reduction trajectory on the energy used by ships calling at EU ports, beginning with a 2% reduction in 2025 and rising to 80% by 2050 [2]. At the international level, the 2023 IMO Greenhouse-gas Strategy sets a comparable trajectory toward net-zero shipping emissions by or around 2050, reinforcing the same regulatory direction [3]. These measures create a policy environment in which hydrogen-based fuels, particularly renewable hydrogen and renewable ammonia, are frequently presented as possible long-term solutions for hard-to-electrify maritime segments.
The core research question of this paper is: Is hydrogen-based propulsion financially sustainable and commercially feasible in the European maritime sector in mid-2026 without EU subsidies, grants, contracts for difference, carbon price support, or other public subventions? The research results have shown that, in mid-2026, hydrogen-based fuel technologies in European maritime transport are not financially feasible without public support, except possibly in narrow pilot, short-sea, publicly supported or premium-service niches.
The research problem is not whether hydrogen and ammonia can be technically demonstrated onboard a vessel. Demonstrations and prototype engines already show that pure hydrogen, hydrogen fuel cells and ammonia engines can operate under controlled conditions. The more restrictive question is whether such technologies constitute an unsubsidised commercial alternative to conventional fuels in mid-2026. This distinction is essential because technical feasibility, operational feasibility and financial feasibility are different concepts. A technically feasible vessel may still lose payload, range or schedule flexibility; an operationally feasible route may still require dedicated bunkering, public procurement, guaranteed offtake or grants; and a financially feasible investment must compete with conventional fuels after accounting for fuel price, efficiency, capital expenditure, safety systems, infrastructure, carbon costs and revenue effects.
The contribution of this paper is threefold. First, it provides a segment-specific economic assessment for general cargo vessels, container ships and line passenger ships rather than treating shipping as one homogeneous market. Then, it compares pure hydrogen, hydrogen internal combustion and ammonia as a hydrogen carrier against VLSFO, MGO, HFO/IFO380 and LNG under transparent assumptions. Finally, it estimates break-even hydrogen prices, ammonia prices and carbon-price levels, thereby translating qualitative policy debates into testable economic thresholds.
2. Theoretical and Regulatory Background
2.1. Maritime Decarbonisation and Alternative-Fuel Economics
The shipping decarbonisation literature consistently distinguishes between operational efficiency, fuel switching and systemic changes in trade, logistics and port infrastructure. Energy-efficiency measures reduce fuel consumption but do not remove the carbon intensity of residual fuel oils. Alternative fuels can reduce tank-to-wake or well-to-wake emissions but usually involve higher fuel costs, lower volumetric energy density, immature bunkering chains and new safety requirements. Earlier reviews of greenhouse-gas-reduction options in shipping concluded that no single technology can decarbonise all vessel classes and that the economic attractiveness of fuels depends on voyage pattern, speed, cargo value, regulation and infrastructure availability [4,5].
Hydrogen is attractive because its tank-to-wake CO2 emissions are zero and because proton-exchange-membrane fuel cells can provide high conversion efficiency, low vibration and local air-quality benefits. However, hydrogen is difficult to store. On a mass basis, its lower heating value is high, approximately 120 MJ/kg, but even liquid hydrogen has only about 8.5 MJ/litre, far below conventional marine fuels [6]. Compressed hydrogen is still more volume-intensive. Thus, pure hydrogen is penalised by tanks, cryogenic systems or pressure vessels, safety distances, ventilation, boil-off management, bunkering complexity and the opportunity cost of lost cargo or passenger space.
Ammonia is often considered a more credible hydrogen carrier for larger maritime segments. It contains no carbon, can be liquefied at moderate pressure or low temperature and has more favourable volumetric storage characteristics than pure hydrogen. Nevertheless, ammonia is toxic, corrosive and has lower energy density than marine gas oil. DNV reports that ammonia requires nearly triple the storage volume of marine gas oil for the same energy and that ammonia-fuelled newbuilds may cost 15–20% more than conventional ships, with retrofit costs potentially much higher [7]. These characteristics matter differently across vessel types. A short, fixed ferry route can tolerate frequent bunkering; a deep-sea container ship cannot.
From an economic perspective, the central variable is not only the commodity fuel price but the cost per unit of useful propulsion energy and, ultimately, cost per tonne-nautical mile, TEU-nautical mile or passenger-nautical mile. This paper, therefore, evaluates the delivered fuel price, fuel energy content, propulsion efficiency, carbon cost, capital premium and operational penalty jointly.
2.2. EU Policy and Subsidy Framework
The EU regulatory framework is both a constraint and a source of support for hydrogen-based fuels. The EU ETS applies to maritime emissions on a phased basis: 40% of 2024 emissions surrendered in 2025, 70% of 2025 emissions surrendered in 2026 and 100% from 2027 onward [1]. The regulation covers 100% of emissions from voyages between EU ports and at berth, and 50% of emissions from voyages into or out of the EU [1]. In mid-2026 this creates a real carbon-price signal, but the signal remains substantially below the carbon prices required to make most renewable hydrogen or ammonia pathways cost-competitive.
FuelEU Maritime is technology-neutral but fuel-pathway-sensitive: it regulates annual average well-to-wake greenhouse-gas intensity rather than mandating one particular fuel. Its reduction factors are 2% in 2025, 6% in 2030, 14.5% in 2035, 31% in 2040, 62% in 2045 and 80% in 2050 [2]. The same policy architecture also links passenger and container ships to zero-emission-at-berth requirements, especially shore-side electricity, from 2030 in ports covered by AFIR and from 2035 in EU ports where shore power is available [2]. AFIR, in turn, establishes targets for shore-side electricity in core maritime ports and for alternative-fuel infrastructure, including hydrogen infrastructure primarily in the road TEN-T network [8]. EU ETS can be directly included in the calculations, since it provides a carbon-price proxy in EUR/tCO2 that can be added to the cost of conventional fuels. On the other hand, FuelEU Maritime is not quantitatively introduced in this research but is assessed qualitatively, as it primarily serves as a regulatory driver and does not directly influence the final fuel price. Its economic effect depends on several vessel-specific and market-related factors, which would require a separate compliance-cost model.
RED III affects the supply side and demand-pull side of renewable hydrogen. The revised Renewable Energy Directive sets a binding EU target of at least 42.5% renewable energy by 2030 and introduces renewable fuels of non-biological origin in hard-to-electrify sectors [9]. The Innovation Fund and the European Hydrogen Bank are explicit subsidy mechanisms [10]. The Commission describes competitive bidding as a way to allocate fixed-premium subsidies to renewable-hydrogen producers, potentially for up to ten years, precisely because there is no liquid renewable-hydrogen market and the existing carbon price and regulatory framework do not close the cost gap in many applications [11].
These instruments are not neutral background variables. They are part of the feasibility question. If a project becomes viable only because a hydrogen auction, an Innovation Fund grant, state aid scheme, green-corridor grant or contract for difference reduces the fuel or capital cost, it is not financially feasible under the strict no-support definition adopted in this paper.
2.3. Prior Cost Evidence
The International Energy Agency (IEA) observes that hydrogen demand remains dominated by traditional industrial uses and that low-emissions hydrogen is still a very small share of total production. In the 2026 Global Hydrogen Review, the IEA emphasises that cost premiums, incomplete infrastructure and limited offtake remain central barriers, and that policy support is required to close cost gaps in many early markets [12]. This finding is directly relevant to maritime fuels because shipping is not usually the first and least-cost destination for scarce renewable hydrogen; refineries, fertiliser, steel and chemical industries may outbid shipping for early low-emissions hydrogen volumes.
DNV reports that green ammonia in Europe trades at roughly USD 2900 per tonne of marine gas oil equivalent, around five times the MGO reference price, and that green-ammonia forecasts still leave a cost gap even in long-term scenarios [7]. This is important because ammonia is often argued to be the more scalable maritime hydrogen carrier. If the more scalable carrier remains expensive, pure hydrogen is unlikely to be an unsubsidised solution for larger vessels in 2026.
IRENA has identified a plausible pathway for green-hydrogen cost reduction through larger electrolysers, manufacturing learning rates, lower renewable-electricity costs and improved system design [13]. Cost reduction is therefore a credible future scenario, not a guaranteed present result. This paper treats technology learning as a forward scenario rather than as current evidence of commercial feasibility.
2.4. Previous Research
The recent literature broadly supports a portfolio rather than universal-fuel interpretation. Balcombe et al. [5] and Bouman et al. [4] show that fuel choice is jointly conditioned by vessel design, operating profile, infrastructure and regulation. For large international ships, McKinlay et al. modelled voyage energy demand and the mass and tank-volume implications of hydrogen, ammonia and methanol; their engineering comparison demonstrates that direct hydrogen’s high gravimetric energy content does not remove the severe volumetric and containment penalty, particularly for long-range service [14]. Schlehuber et al. [15] likewise find European hydrogen cargo-shipping outcomes to be route- and system-dependent rather than universally favourable. These studies are consistent with this paper’s differentiation between short ferries, regional cargo and deep-sea container vessels.
The barriers interact. Renewable hydrogen requires large quantities of low-carbon electricity; electrolysis, compression or liquefaction, storage and bunkering reduce system efficiency and raise delivered cost. Liquid hydrogen requires cryogenic temperatures, while compressed hydrogen requires high-pressure vessels; both enlarge tank and safety spaces, reduce payload or revenue capacity and entail ventilation, leak detection and emergency-response measures. Sparse bunkering coverage compounds these penalties because a vessel designed for one carrier must have reliable supply across its trading pattern. Dave et al. assessed hydrogen-derived maritime supply chains from production through storage, transport and bunkering and reported overall efficiencies of 42.17–50.02%, with hydrogen production accounting for 75–82% of total supply-chain energy use in the studied routes [16]. Ammonia and methanol add synthesis losses and retain pathway-specific safety or carbon constraints, but their higher volumetric density and established chemical logistics can outweigh direct-hydrogen disadvantages for some long-distance services. Competition from industrial hydrogen demand and from hydrogen-derived fuels therefore limits the volume and price at which pure hydrogen may reach shipping [12].
Wang and Iris [17] address fuel coexistence with a two-stage stochastic fleet-transition model that selects among diesel, bio-LNG, bio-methanol and natural-gas-derived ammonia and allows vessels to be purchased, chartered, retrofitted or removed while minimising expected net cost under uncertainty, including emissions, investment and operating costs and revenues. Their result is not that one alternative is always superior: bio-methanol is favoured when well-to-wake emissions are charged, whereas natural-gas-derived ammonia becomes more prominent under a tank-to-wake boundary; high emission costs also change the relative use of chartering and retrofitting by ship size. Their fuel set, fleet decisions and emissions boundary differ from the fuel-only 2026 screening model used here, so the numerical outputs are not directly comparable. Nevertheless, their conclusion that a single fuel does not dominate is directly compatible with this study’s segment-specific result.
Against VLSFO, this study estimates 2026 useful propulsion cost at EUR 354/MWh for hydrogen fuel cells and EUR 487/MWh for hydrogen internal combustion, compared with EUR 99/MWh before carbon pricing, and break-even delivered hydrogen at EUR 1.81/kg without carbon support or EUR 2.66/kg at the current carbon-price proxy. These thresholds reinforce the earlier literature’s barriers but add a mid-2026 European price benchmark and vessel-segment interpretation. They do not imply identical adoption paths: direct hydrogen may remain credible for short, fixed routes where frequent bunkering and local environmental benefits offset storage penalties; hydrogen-derived carriers and methanol may be more credible for larger ships; and other segments may prefer batteries, biofuels or fuel-flexible solutions.
2.5. Green Methanol in a Multi-Fuel Transition
Green methanol is an umbrella term rather than a single production route. E-methanol is commonly synthesised by hydrogenating captured CO2 with renewable H2 (CO2 + 3H2 → CH3OH + H2O), while bio-methanol can be produced from biomass- or waste-derived syngas. Biogas provides another route: dry reforming converts CH4 and CO2 to syngas (CH4 + CO2 → 2CO + 2H2), followed by methanol synthesis (CO + 2H2 → CH3OH). Zhang et al. modelled an anaerobic-digestion pathway that combines biogas reforming and recovery of H2 from ammonia-rich digestate, illustrating how waste streams may be valorised at local scale [18]. However, the designation “green” is justified only where renewable energy and sustainably sourced biogenic or atmospheric carbon are used. Conventional methanol produced from unabated natural gas or coal remains fossil-derived, and capturing fossil CO2 for e-methanol delays rather than necessarily eliminates its release.
These pathways face material resource and efficiency constraints. Electrolysis, CO2 capture and conditioning, synthesis and distribution impose conversion losses and great renewable-electricity demand, while sustainable biomass and biogenic CO2 are finite and contested feedstocks [19]. Relative to compressed or liquid hydrogen, however, methanol is a liquid at ambient conditions, has materially higher volumetric energy density and can use much of the established liquid-fuel storage and distribution architecture. Dual-fuel engines and retrofit options can therefore reduce onboard tank, cargo-space and bunkering penalties, although methanol still requires more tank volume than oil fuels. It is also toxic and flammable, and its low flash point requires controlled tank location, double-walled piping where applicable, ventilation, leak detection, fire protection and crew procedures under IMO safety guidance [20]. Methanol combustion releases CO2 at the ship, so climate performance must be assessed on a well-to-wake basis rather than inferred from the fuel label.
Maritime uptake is moving beyond demonstrations but remains supply-constrained. On 1 April 2024, the 16,000-TEU Ane Maersk completed its first European bunkering at the Port of Antwerp-Bruges, receiving 4300 t of green methanol and 1375 t of B100 biodiesel; the authoritative port record therefore does not support a 30,000 t methanol-bunkering claim [21]. The vessel was the first of 18 large methanol-enabled vessels then scheduled for delivery to Maersk in 2024–2025. This operational milestone shows the storage and bunkering advantages of a liquid fuel, but not market-wide cost parity or universal suitability. Green methanol is consequently best understood as one component of a multi-fuel transition: it may be attractive where liquid-fuel compatibility and range are decisive, while hydrogen, ammonia, batteries and biofuels may be preferred in other vessel and route segments. The present model does not quantify methanol as a separate pathway, so its role is discussed comparatively rather than presented as a modelled result.
3. Methodology and Data Sources
3.1. Definition of Financial Feasibility
Financial feasibility is defined as the ability of a vessel using a hydrogen-based fuel to deliver transport services at a normalised cost not exceeding the relevant conventional-fuel comparator, without grants, production subsidies, fuel contracts for difference, preferential public procurement, tax exemptions, capital grants or carbon-price support. Carbon-price support is treated separately because the research question explicitly asks for a no-support baseline. The current-policy scenario then shows how EU ETS and FuelEU change the result.
The primary quantitative metric is fuel-only useful propulsion cost in EUR/MWh of useful shaft or electric propulsion energy. This is not a complete levelised cost of transport, but a fuel-only screening indicator, and it is the most transparent common denominator across vessel classes. It is then interpreted together with sector-specific capital expenditure, payload loss and route constraints. The basic Equation (1) is
where P_i is fuel price, E_i is lower-heating-value energy content, EF_i is the tank-to-wake CO2 emission factor, eta_i is propulsion efficiency and p_CO2 is the applicable carbon price. For hydrogen and ammonia in tank-to-wake terms, EF_i is zero, although well-to-wake emissions depend on the production pathway. This paper evaluates renewable hydrogen and renewable ammonia when discussing decarbonisation, and uses grey hydrogen only as a comparator where prior studies do so.
C_useful,i = [(P_i/E_i) + p_CO2 × (EF_i/E_i)]/eta_i
3.2. Data and Assumptions
The 2026 fossil-fuel price proxies are Rotterdam bunker quotations accessed on 21 June 2026 from Ship & Bunker: IFO380 at USD 499.50/t, VLSFO at USD 611.50/t and MGO at USD 892.00/t. The same source reported an EUA proxy of EUR 80.03/tCO2 and USD 91.85/tCO2, which is used to convert dollars to euros and to represent the current-policy carbon-price case [22]. Energy contents and fossil CO2 factors are taken from Engineering ToolBox fuel-property tables [6,23].
The central delivered renewable-hydrogen price is set at EUR 6.50/kg, with a sensitivity range of EUR 5–8/kg. This is a scenario assumption rather than a claim of one uniform European spot price. It is consistent with the IEA assessment that low-emissions hydrogen remains costly and with the absence of a liquid renewable-hydrogen market in 2026 [11,12]. The ammonia price is derived from DNV’s reported green-ammonia cost of about USD 2900 per tonne of MGO-equivalent in Europe. Converted using the EUA-linked exchange rate and transformed to physical ammonia using the ratio between ammonia and MGO lower heating values, this corresponds to approximately EUR 1100–1200/t physical ammonia. The central value used in the model is EUR 1150/t [7].
The EUR 5–8/kg sensitivity range (central value EUR 6.50/kg) is also the mechanism through which the screening model represents differences in hydrogen production cost. It does not disaggregate natural-gas reforming, electrolysis, biomass-derived or other feedstock and production pathways, and it should not be interpreted as a complete feedstock or lifecycle sustainability assessment. Sustainability and the “green” characteristics of hydrogen production are therefore not directly assessed.
Propulsion efficiencies are conservative: 0.48 for modern diesel engines using VLSFO/MGO, 0.46 for LNG dual-fuel operation, 0.55 for hydrogen fuel cells, 0.40 for hydrogen internal combustion and 0.42 for ammonia internal combustion. These parameters are varied qualitatively in the sensitivity discussion. Capital expenditure premiums are not inserted as hard point estimates into the main fuel-only chart because public, vessel-specific data are sparse; however, DNV’s 15–20% ammonia newbuild premium and high retrofit-cost warning are used in the sectoral feasibility analysis [7].
Four scenarios are defined and presented in the Table 1. The no-subsidy baseline excludes all carbon price and public support. The current-policy scenario adds an EUR 80.03/tCO2 carbon price to fossil-fuel comparators. The high-carbon-price scenario raises carbon prices to EUR 150/tCO2 by 2030, EUR 250/tCO2 by 2035 and EUR 350/tCO2 by 2040. The technology-learning scenario assumes delivered renewable-hydrogen price declines from EUR 6.50/kg in 2026 to EUR 4.50/kg in 2030, EUR 3.00/kg in 2035 and EUR 2.20/kg in 2040, with a broad uncertainty band.
Table 1.
Central 2026 model assumptions and data sources.
3.3. Vessel Archetypes
The analysis uses four sectoral archetypes rather than one representative ship and those are presented in the Table 2. The general cargo archetype is a 3000–8000 DWT short-sea or regional vessel with relatively low power demand, moderate cargo value and variable port calls. The container sector is divided into feeder/regional ships, which operate fixed schedules and can use green corridors, and deep-sea container ships, which have high energy demand and long range. The line passenger segment includes small ferries, large ferries and RoPax vessels operating scheduled routes with frequent port calls and high public-service visibility.
Table 2.
Vessel archetypes used in the sectoral feasibility assessment.
These archetypes are deliberately qualitative on CAPEX because precise newbuild and retrofit quotations are commercially confidential and vary by yard, class society, flag, route, tank arrangement and safety philosophy. The numerical analysis therefore identifies fuel and carbon thresholds, while the sectoral sections interpret how range, cargo loss, tank volume, bunkering regularity and willingness to pay affect the threshold.
4. Techno-Economic Analysis
4.1. Fuel Cost, Energy Density and Regulatory Comparison
Table 3 compares the principal fuel pathways. The result is immediately visible: conventional fuels remain much cheaper per useful MWh in 2026, particularly before carbon pricing. Hydrogen fuel cells reduce the penalty relative to hydrogen internal combustion because of higher efficiency, but the delivered hydrogen price still dominates the result. Ammonia has better storage characteristics than hydrogen, yet the modelled green-ammonia fuel-only useful cost is higher than the hydrogen-fuel-cell cost under the central assumptions because the DNV MGO-equivalent ammonia price is still very high.
Table 3.
Comparison of marine fuel options by cost, energy density, emissions, infrastructure maturity and regulatory status.
Table 3 should not be read as a claim that LNG or biofuels are final or definitive solutions. LNG has methane-slip and lifecycle concerns, while sustainable biofuel availability is limited and competing sectors may absorb supply. Their inclusion is comparative: they represent near-term fuels that can be purchased, bunkered and used more easily than renewable-hydrogen-based fuels in most 2026 European maritime operations. Methanol (bio- and e-methanol) is not listed in Table 3 because the delivered prices for the two pathways differ too widely for a single representative figure, as bio-methanol is feedstock-constrained and e-methanol tracks the renewable-hydrogen cost analysed here. E-methanol is thus partly captured by the hydrogen analysis, and a full methanol assessment is left for future research.
In Table 3, tank-to-wake emissions and the associated EU ETS carbon costs are used in the calculation in order to compare the carbon-cost component across fuels. However, FuelEU Maritime assesses fuels on a well-to-wake basis, meaning that renewable H2 and NH3 may have additional compliance value compared with the other fuels listed in the table, which is not captured in this cost comparison.
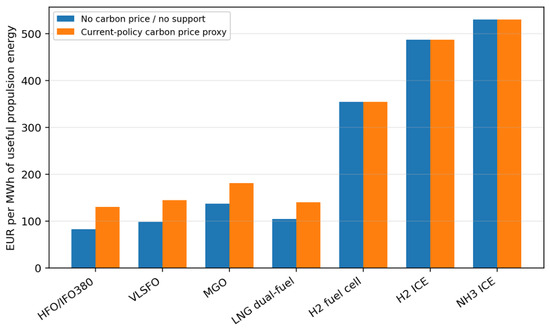
Tank-to-wake (TtW) accounts for greenhouse gases released during onboard fuel use, whereas well-to-wake (WtW) adds well-to-tank emissions from feedstock extraction or cultivation, conversion, electricity use, processing, transport and bunkering. The IMO LCA Guidelines cover CO2, CH4 and N2O across both stages [24], and FuelEU Maritime evaluates energy on a WtW-intensity basis [25]. Consequently, zero onboard CO2 from hydrogen or ammonia does not by itself establish low climate impact: renewable-electricity origin, fossil-gas methane leakage, carbon-capture performance and synthesis energy can materially change their WtW intensity. Methanol emits CO2 onboard, but its net performance differs sharply between fossil methanol, bio-methanol and e-methanol made from renewable H2 and biogenic or atmospheric CO2; methane slip similarly affects LNG. These pathway differences alter the effective burden or credit under carbon-pricing and fuel-intensity regimes. The present model applies a TtW carbon-price proxy to fossil fuels for transparent 2026 screening and does not claim to constitute a complete WtW carbon-pricing model. A comparison of the fuel-only useful propulsion costs under the central 2026 assumptions is presented in Figure 1.
Figure 1.
Fuel-only useful propulsion cost under central 2026 assumptions. Source: author’s calculations based on Table 1 and [6,7,22,23].
4.2. Break-Even Calculations
The VLSFO reference cost is EUR 98.7/MWh of useful propulsion energy in the no-support baseline and EUR 144.8/MWh under the current-policy carbon-price proxy. Against this reference, hydrogen fuel cells reach parity only if delivered hydrogen is approximately EUR 1.81/kg without carbon support, or approximately EUR 2.66/kg at an EUR 80/tCO2 carbon price. Hydrogen internal combustion has a lower break-even fuel price because the engine pathway is assumed less efficient: approximately EUR 1.32/kg without support and EUR 1.93/kg under the current-policy carbon price.
The ammonia break-even threshold is even more restrictive under the central ammonia-engine assumption. Physical green ammonia would need to fall to approximately EUR 214/t without carbon support or EUR 314/t under the EUR 80/tCO2 carbon-price proxy. These values are far below the central 2026 green-ammonia proxy derived from DNV. Equivalently, if hydrogen remains at EUR 6.50/kg, the VLSFO comparator would require a carbon price of approximately EUR 444/tCO2 for fuel-cell parity. If green ammonia is EUR 1150/t physical ammonia, the carbon price needed for parity with VLSFO is approximately EUR 749/tCO2. These are not forecasts; they are break-even thresholds presented in Table 4.
Table 4.
Break-even fuel-price and carbon-price thresholds against VLSFO.
The break-even values represent parity between fuels in EUR/MWh of useful propulsion energy. Therefore, EUR/kg values should not be used as direct comparisons between different fuels, since fuels differ in energy content, propulsion efficiency and, for fossil fuels, carbon-cost components.
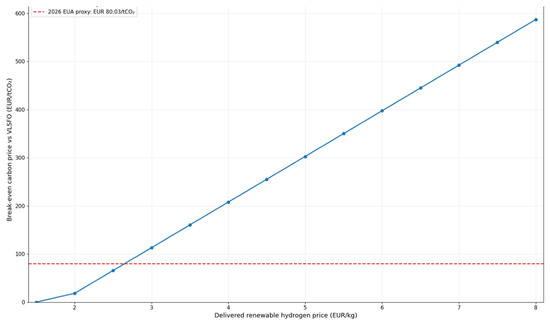
Figure 2 is derived by setting the hydrogen-fuel-cell and VLSFO values from Equation (1) equal and solving for pCO2 at each delivered hydrogen price: pCO2 = {[(P_H2/E_H2)/η_H2] × η_VLSFO × E_VLSFO − P_VLSFO}/EF_VLSFO. Source [6] supplies the lower-heating-value inputs—0.0333 MWh/kg H2, rounded to 0.033 in the tables, and 11.25 MWh/t VLSFO—[22] supplies the 21 June 2026 Rotterdam VLSFO quotation (USD 611.50/t), the implied 0.871 EUR/USD conversion (EUR 533/t) and the EUR 80.03/tCO2 EUA proxy, and [23] supplies the 3.11 tCO2/t VLSFO emission factor. The authors assume η_H2 = 0.55 for the fuel-cell-electric pathway and η_VLSFO = 0.48. Delivered H2 is varied from EUR 1.50 to EUR 8.00/kg in EUR 0.50/kg increments; any negative carbon-price result below the no-carbon parity point is displayed as zero. Values are expressed on the 2026 EUR cost basis and represent fuel-only parity, excluding CAPEX, storage, infrastructure and payload effects. Figure 2 illustrates the carbon-price support required for renewable-hydrogen fuel cells to reach parity with VLSFO at different delivered hydrogen prices, with the blue line representing the required carbon-price level.
Figure 2.
Carbon-price support required for renewable-hydrogen-fuel-cell parity with VLSFO. Source: author’s calculations based on [6,22,23].
4.3. Sensitivity Analysis
The result is most sensitive to the delivered hydrogen price, the delivered ammonia price, the fossil-fuel reference price, the carbon price and the efficiency differential. A higher fossil-fuel price or carbon price narrows the gap; lower renewable-electricity prices, lower electrolyser capital expenditure and higher electrolyser utilisation reduce the hydrogen price; and higher fuel-cell efficiency improves hydrogen competitiveness. However, the central conclusion is robust because the 2026 fuel-price gap is large enough that normal parameter variation does not make hydrogen-based fuels fully competitive without support.
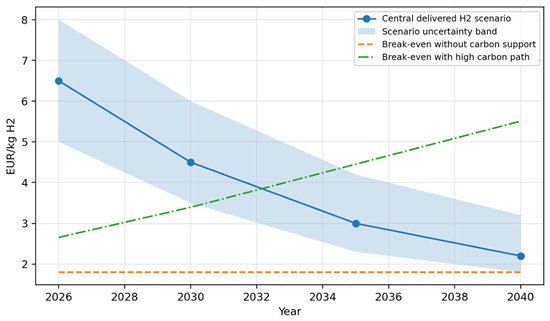
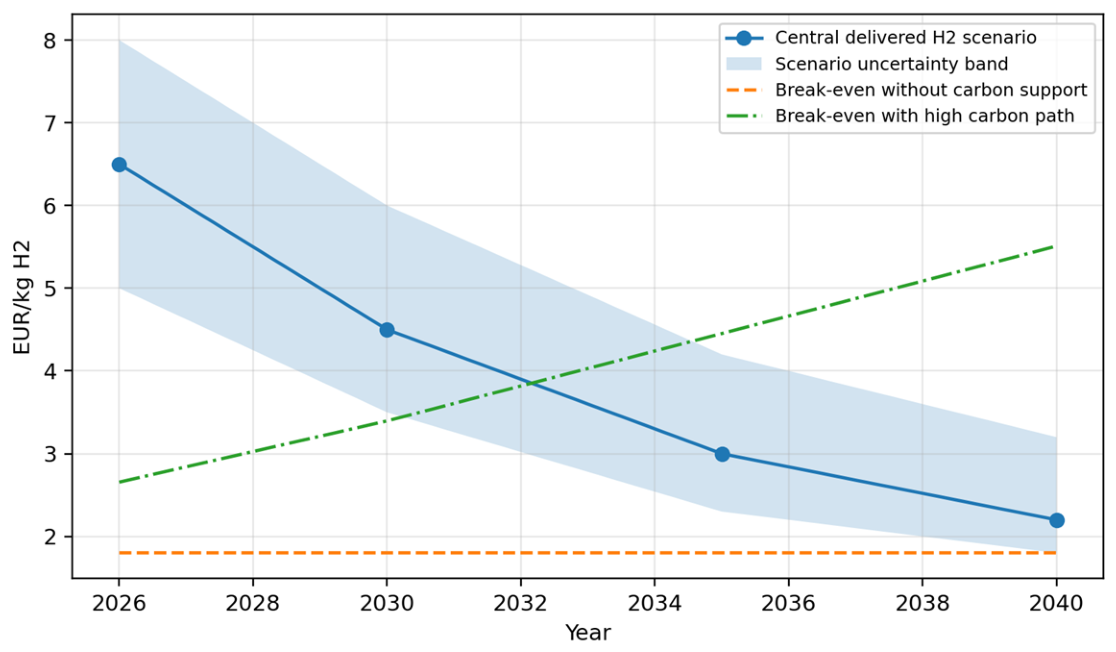
The learning scenario in Figure 3 is deliberately optimistic but not promotional. It assumes delivered renewable hydrogen falls from EUR 6.50/kg in 2026 to EUR 3.00/kg in 2035 and EUR 2.20/kg in 2040. IRENA identifies electrolyser learning, scale and renewable-electricity cost decline as plausible drivers of green-hydrogen cost reduction [13]. However, the IEA emphasises that actual low-emissions-hydrogen deployment and offtake remain insufficient for automatic scale-up [12]. The forecast is therefore conditional: the dates are plausible only if renewable electricity, electrolyser manufacturing, port infrastructure and firm maritime offtake grow together.
Figure 3.
Scenario forecast of delivered renewable-hydrogen cost and break-even thresholds. Source: author’s scenario model based on [6,12,13,22,23].
Figure 3 uses the same [6,22,23] base-year inputs and parity transformation. The central delivered-renewable-H2 series is an authors’ scenario: EUR 6.50/kg (2026), EUR 4.50/kg (2030), EUR 3.00/kg (2035) and EUR 2.20/kg (2040); the plotted uncertainty envelopes are, respectively, EUR 5.0–8.0, EUR 3.5–6.0, EUR 2.3–4.0 and EUR 1.8–3.2/kg. Sources [12,13] motivate the direction of cost learning but do not supply these four point estimates. The no-carbon break-even remains EUR 1.81/kg. The high-carbon break-even line is recalculated from the same equation using EUR 80.03, EUR 150, EUR 250 and EUR 350/tCO2 for 2026, 2030, 2035 and 2040. Straight lines connect scenario years for visualisation only; no intervening market observations, regression, discounting or CAPEX cash-flow model is implied. All values use the same 2026 EUR cost basis.
5. Sectoral Analysis
5.1. General Cargo Vessels
Short-sea general cargo vessels have some favourable characteristics for early hydrogen-based adoption: power demand is lower than for large container ships, voyages may be regional, and repeated port calls can support paired bunkering infrastructure. These same vessels, however, often operate in price-sensitive markets with variable cargoes and lower freight margins. If a vessel trades among multiple ports rather than on a closed corridor, the operational value of a single hydrogen bunker point declines sharply.
Pure hydrogen fuel cells are technically feasible only for short, fixed or semi-fixed operations where compressed or liquid hydrogen storage does not remove too much cargo volume. Hydrogen internal combustion is less attractive economically because it loses the efficiency advantage of fuel cells and still carries storage penalties. Ammonia is more plausible for somewhat larger short-sea vessels because it is easier to store than pure hydrogen, but ammonia safety requirements, crew training, port acceptance and engine maturity make 2026 commercial deployment limited.
The financial conclusion is negative under a no-support baseline. General cargo freight markets are unlikely to absorb a fuel-only useful-energy cost that is several times higher than VLSFO. With current EU policy, ETS and FuelEU create a compliance incentive but do not eliminate the gap. The most plausible 2026 pathway is therefore a subsidised green corridor, publicly supported pilot, or niche ship operating under a long-term cargo contract with an explicit green premium. Unsubsidised feasibility is more defensibly placed around 2035–2040, contingent on delivered hydrogen below about EUR 3/kg or ammonia prices far below 2026 levels.
5.2. Container Shipping
Container shipping must be separated into feeder/regional and deep-sea segments. Feeder and regional container ships operate on fixed schedules, serve more predictable port pairs and typically carry higher-value-density, time-sensitive containerised goods than tramp vessels, which predominantly transport low-value bulk commodities. These characteristics make them natural candidates for EU green corridors and liner-led alternative-fuel procurement. However, they also require schedule reliability and rapid bunkering, and cargo-space loss is commercially relevant because container capacity is monetised directly.
For feeder vessels, ammonia or methanol-like liquid fuels are generally more plausible than pure hydrogen because of storage density and bunkering logistics. Pure hydrogen could be considered for small feeders on very short routes but is not a general container solution. Under the no-support baseline, neither hydrogen nor ammonia is financially feasible in mid-2026. Under current policy, a feeder on a fixed EU route might justify a pilot if the operator can combine ETS savings, FuelEU pooling value, a green premium from cargo owners and infrastructure support. This is not equivalent to unsubsidised market parity.
Deep-sea container shipping is less favourable for pure hydrogen. The combination of high installed power, long range, global bunkering requirements and the opportunity cost of storage volume makes compressed or liquid hydrogen commercially implausible in 2026. Ammonia is more credible for long routes because it reduces the storage penalty compared with hydrogen and because large ships can amortise engine and tank systems over high utilisation. Yet DNV’s cost and safety evidence indicates that ammonia remains in a transition from demonstration to early deployment, not true commercial parity [7]. Deep-sea container viability without support is therefore a post-2040 proposition under central assumptions, with ammonia more plausible than pure hydrogen.
5.3. Line Passenger Ships, Ferries and RoPax Vessels
Line passenger ships are the best early operational fit for hydrogen fuel cells, especially on short fixed routes. Ferries have predictable duty cycles, known port pairs, public-service obligations, potential access to local renewable electricity and frequent opportunities for bunkering or charging. Passenger and municipal operators may also value local air-quality and noise reductions more highly than bulk cargo markets. These features explain why hydrogen ferry projects are often discussed before hydrogen bulk carriers or deep-sea container ships.
Nevertheless, passenger service does not remove the financial gap—it just changes who might pay it. Public authorities can incorporate environmental criteria in concession contracts, ports can subsidise infrastructure, and passengers may tolerate small fare increases on certain premium routes. These mechanisms are forms of public support or green-premium transfer. In a strict no-support baseline, hydrogen fuel cells are feasible in 2026 only as a very narrow niche: a very short, high-frequency route with local low-cost hydrogen, limited onboard storage, high utilisation and a willingness to pay for zero local emissions. Large RoPax vessels face higher energy demand and space constraints, so unsubsidised feasibility is later.
Ammonia is less attractive for passenger vessels because toxicity and public-acceptance risks are more acute when passengers and crew are close to fuel systems. The likely pathway for passenger segments is therefore batteries where route length permits, shore power at berth, hybrids and, for selected longer routes, hydrogen fuel cells or hydrogen-derived e-fuels after 2030. Unsubsidised feasibility is most plausible around 2032–2035 for short ferries under favourable conditions and around 2035–2040 for larger RoPax routes. The sector-specific feasibility assessment for hydrogen-based maritime fuels in mid-2026 is summarised in Table 5.
Table 5.
Sector-by-sector feasibility matrix for hydrogen-based maritime fuels in mid-2026.
6. Scenario-Based Quantitative Forecast
A formal econometric time-series regression is not appropriate for mid-2026 maritime hydrogen feasibility because the dependent variable—delivered renewable hydrogen or ammonia bunker price in European ports—is not yet an observable liquid market series. The IEA explicitly notes that renewable-hydrogen market formation and offtake remain immature [12], and the Commission created Hydrogen Bank auctions partly because price discovery is weak [11]. A regression using sparse project announcements would create false precision. The appropriate quantitative method is therefore a transparent scenario forecast and break-even calculation. Additionally, it is important to note that these results should not be interpreted as deterministic forecasts, but rather as conditional scenario-based outcomes, given the absence of liquid European maritime hydrogen and ammonia bunker-price series.
The forecast uses three linked variables: delivered hydrogen price, carbon price and segment-specific operational tolerance. For the central technology-learning case, hydrogen price declines to EUR 4.50/kg by 2030, EUR 3.00/kg by 2035 and EUR 2.20/kg by 2040. The high-carbon case raises the carbon price to EUR 150/tCO2 by 2030, EUR 250/tCO2 by 2035 and EUR 350/tCO2 by 2040. Under these assumptions, the break-even threshold for hydrogen fuel cells against VLSFO rises from EUR 2.66/kg in 2026 to approximately EUR 5.5/kg by 2040. This does not mean all vessels are feasible at EUR 5.5/kg because CAPEX, tanks and infrastructure must still be paid; it means the fuel-only parity threshold becomes reachable before complete commercial parity.
For ammonia, the same logic yields a later commercial timeline. The central 2026 physical green-ammonia proxy, around EUR 1150/t, is far above the fuel-only break-even of EUR 314/t under the EUR 80/tCO2 current-policy proxy. Even at EUR 350/tCO2, break-even ammonia remains much lower than central 2026 green-ammonia costs. However, ammonia may still be adopted earlier than pure hydrogen in larger vessels because it solves part of the range problem. This is a classic case in which operational feasibility may precede financial feasibility. The break-even assumptions and forecasted feasibility year for each technology and vessel segment are summarised in Table 6.
Table 6.
Break-even assumptions and forecasted feasibility year by technology and vessel segment.
7. Results and Discussion
The results are unambiguous for the no-support baseline. VLSFO costs approximately EUR 99/MWh of useful propulsion energy before carbon pricing, compared with approximately EUR 354/MWh for hydrogen fuel cells, EUR 487/MWh for hydrogen internal combustion and EUR 530/MWh for ammonia internal combustion—a result that runs counter to the common framing of ammonia as the more scalable and therefore more economical carrier. The fossil-fuel comparator remains lower even when the EUR 80/tCO2 current-policy proxy is added, because VLSFO rises to approximately EUR 145/MWh useful, still far below the hydrogen-based options. MGO and LNG show higher fossil-fuel useful costs than VLSFO but remain below hydrogen and ammonia in the central 2026 assumptions.
The 2026 subsidy or price gap can be expressed in three equivalent ways. First, delivered renewable hydrogen would need to fall from the central EUR 6.50/kg to about EUR 1.81/kg without carbon support or EUR 2.66/kg with the current carbon-price proxy. Second, if hydrogen stays at EUR 6.50/kg, the carbon price needed for parity with VLSFO is approximately EUR 444/tCO2 before including capital premiums. Third, physical green ammonia would need to fall to about EUR 214–314/t depending on the carbon-price case; if it remains around EUR 1150/t, parity requires a carbon price of roughly EUR 749/tCO2. These figures are sufficiently distant from mid-2026 market conditions to reject broad commercial feasibility.
The sectoral matrix strengthens rather than weakens this conclusion. The passenger/ferry segment is the most favourable because of route regularity, public-service contracting and local environmental benefits. General cargo and feeder containers are possible candidates for supported corridors but not unsubsidised markets. Deep-sea container shipping has the weakest case for pure hydrogen and only a long-run strategic case for ammonia. Thus, the hypothesis is accepted in the strict financial sense.
The policy implication is that EU regulatory pressure alone is unlikely to create mass hydrogen-based maritime adoption in the near future. EU ETS and FuelEU Maritime improve the relative position of zero-carbon fuels, but the gap remains too large for most shipowners without direct support, green premiums or compliance-credit value. This does not mean that subsidies are wasteful. It means that their role should be explicit: they are needed to finance learning, infrastructure, safety experience and early offtake, not to support an already competitive technology.
For shipowners, the findings support a staged strategy. In the near term, energy efficiency, voyage optimisation, shore power, batteries for short services, sustainable biofuel blends where available, LNG/methanol strategies where lifecycle performance is acceptable, and fuel-flexible newbuilds may offer lower-risk compliance pathways. Hydrogen readiness should be tied to route-specific supply, credible fuel contracts and support instruments. A vessel advertised as hydrogen-ready is not automatically financially resilient if fuel supply does not materialise at competitive prices.
For ports, hydrogen and ammonia infrastructure create coordination risks. A port can build supply before demand and strand assets, or wait for demand and slow ship adoption. The most rational early model is a corridor or cluster in which vessel operator, port, fuel supplier, public authority and cargo/passenger customer commit together. This is consistent with the IEA view that early hydrogen opportunities may arise where production, infrastructure and demand are co-located [12].
Delivered fuel prices and adoption rates also depend on the scale and timing of bunkering investment. Terminal and storage CAPEX, utilisation, fuel throughput, port coverage, financing and safety systems determine unit delivery cost; premature capacity can strand assets, while delayed capacity can suppress vessel orders. This creates a coordination problem among shipowners, charterers, ports, fuel producers, suppliers, financiers and regulators. The infrastructure entries in Table 3, Table 4 and Table 5 should therefore be read as qualitative constraints rather than outputs of an endogenous fuel-market model [12,16]. A full multi-stakeholder fuel-market-development model is beyond the defined scope of this study.
Commercial incentives also depend on whether a vessel is owned, leased or chartered. A shipowner may bear newbuild, retrofit and residual-value risk while a charterer pays for fuel and controls routing; short contract durations, fuel-cost pass-through and split incentives can therefore delay investment even when a pathway improves whole-life performance. Wang and Iris explicitly allow purchasing, chartering and retrofitting decisions [17], whereas the present screening model does not. Ownership, leasing, charter duration and cost allocation are treated here as elements of the wider pricing and investment environment, not as modelled variables.
Safety and regulation are not peripheral issues. Ammonia toxicity, nitrogen-oxide and nitrous-oxide management, crew training, emergency response and port acceptance affect both OPEX and public acceptability. DNV notes that interim guidelines exist, but binding IGF Code amendments for ammonia may not be fully in place until the 2030s [7]. For passenger ships, the safety and perception burden weighs against ammonia and favours batteries, shore power and hydrogen fuel cells where suitable.
The most important conceptual implication is the distinction between demonstration and viability. A demonstration vessel can prove that a fuel cell works at sea, or that ammonia can be bunkered safely under controlled conditions. It does not prove that competing shipowners can earn normal returns without support. Real-life evidence indicates that in mid-2026 it remains primarily in a demonstration and corridor-formation stage.
8. Conclusions
The research question can be answered directly: hydrogen-based propulsion was not financially sustainable or commercially feasible in the European maritime sector in mid-2026 without significant public support, carbon-price support or green-premium revenue, except for exceptional short-route niches that do not represent broad market feasibility. The hypothesis is therefore proven. The conclusion is supported by fuel-only useful-cost comparisons, break-even hydrogen and ammonia prices, sectoral operational analysis and the absence of mature European maritime hydrogen-bunkering markets.
For general cargo vessels, the most likely hydrogen-based pathway is either hydrogen fuel cells on small fixed short-sea craft or ammonia on somewhat larger regional vessels. Neither is financially feasible without support in 2026. Feasibility is more plausible around 2035–2040 under a combination of lower delivered green-fuel cost, higher carbon price, reliable bunkering and long-term cargo contracts.
For container ships, the conclusion differs by scale. Feeder and regional container ships may become early supported adopters through green corridors because liner schedules, port pairing and cargo-owner green premiums can be coordinated. Deep-sea container ships are not suitable for pure hydrogen in the near future because of range, storage and global bunkering constraints. Ammonia is the more plausible hydrogen carrier for large container vessels, but broad unsubsidised viability is unlikely before 2040 under central assumptions.
For liner passenger ships, short ferries are the earliest plausible hydrogen-fuel-cell market because fixed routes, frequent calls and public-service objectives fit hydrogen infrastructure. Even here, current projects generally require public procurement, infrastructure support or green premiums. Unsubsidised feasibility may appear around 2032–2035 on favourable short routes if delivered renewable hydrogen falls toward EUR 3/kg or less and if high utilisation reduces fixed costs. Larger RoPax vessels are more likely to approach viability after 2035.
The outlook through 2030, 2035 and 2040 is therefore staged. The estimated feasibility dates are conditional scenario windows rather than deterministic forecasts, and full commercial feasibility would require inclusion of capital expenditure, infrastructure availability, safety compliance, operational reliability and limited payload or revenue penalties. Through 2030, hydrogen-based maritime fuels are expected to remain demonstration-led and subsidy-dependent. By 2035, selected short ferry, short-sea cargo and feeder-container corridors may become commercially close to parity under favourable carbon-price and technology-learning conditions. By 2040, ammonia could become a realistic option for larger ships if safety rules, fuel supply and cost decline mature together. Pure hydrogen is likely to remain primarily a short-route and specialist-vessel solution rather than a universal maritime fuel. A complete commercial-feasibility assessment should therefore be developed in future work by comparing vessel-conversion and newbuild CAPEX, onboard storage and fuel-system CAPEX, maintenance and operating expenditure, fuel costs, bunkering-infrastructure costs, financing conditions, asset life, utilisation and carbon-compliance costs across candidate fuels.
9. Limitations and Future Research
The study has four main limitations. First, delivered renewable hydrogen and ammonia bunker prices are not liquid European market series in 2026. The model therefore uses transparent scenario assumptions rather than econometric market estimates. Second, vessel CAPEX and retrofit premiums are commercially heterogeneous and are not inserted as precise point estimates except where public sources provide ranges. Third, the analysis uses tank-to-wake fossil CO2 factors for fuel-cost comparison but recognises that FuelEU Maritime is well-to-wake and that lifecycle methane, nitrous oxide and upstream hydrogen emissions can materially affect compliance. Fourth, the vessel archetypes are representative rather than design-specific.
Further limitations arise from variables kept outside the screening model. The model does not distinguish individual hydrogen feedstocks or production pathways and does not directly assess the sustainability or “green” characteristics of production; future research should examine these pathways separately. Ownership, chartering, leasing, split incentives and contractual allocation of fuel and investment costs are not modelled. Nor are bunkering-infrastructure investment and multi-stakeholder fuel-market development treated endogenously. A complete WtW carbon-pricing module is also outside the present scope.
Future research should combine AIS-derived duty cycles, real ship fuel-consumption data, port-specific hydrogen and ammonia supply costs, and tender-based CAPEX quotations. A Monte Carlo simulation model would be appropriate once enough price observations exist. Empirical research should also examine green-corridor contracts, FuelEU pooling markets and passenger willingness to pay for zero-emission services. Finally, safety-cost quantification for ammonia and comparative modelling of methanol, synthetic methane and sustainable biofuels should be integrated with the hydrogen analysis. Future extensions should disaggregate hydrogen feedstocks and production routes, compare owner-operated, leased and chartered business models, and model port coverage, bunkering-investment timing and coordination among market participants. A lifecycle module could connect pathway-specific WtW intensity to alternative carbon-pricing and fuel-standard designs.
Author Contributions
Conceptualization, S.A. and E.T.; methodology, S.A.; validation, E.T. and A.P.H.; formal analysis, S.A.; investigation, S.A., E.T., A.P.H. and G.M.; data curation, S.A. and E.T.; writing—original draft preparation, S.A.; writing—review and editing, E.T., A.P.H. and G.M.; visualisation, S.A. and G.M.; supervision, S.A. and E.T.; project administration, S.A. All authors have read and agreed to the published version of the manuscript.
Funding
This research received no external funding.
Institutional Review Board Statement
Not applicable.
Informed Consent Statement
Not applicable.
Data Availability Statement
The raw data supporting the conclusions of this article will be made available by the authors on request.
Acknowledgments
This research was conducted under the project line 581 NPOO of the University of Rijeka, for the project uniri-iz-25-13. Artificial intelligence tools were used in a limited assistive capacity; literature review support and source identification were performed using OpenAI’s API and ScholarGPT, while data visualisation support and language/spell checking were performed using Anthropic’s model Opus 4.8; all outputs were critically reviewed, verified, and approved by the authors, who remain fully responsible for the content of the manuscript.
Conflicts of Interest
The authors declare no conflicts of interest.
Abbreviations
The following abbreviations are used in this manuscript:
| AFIR | Alternative Fuels Infrastructure Regulation |
| AIS | Automatic Identification System |
| API | Application Programming Interface |
| CAPEX | Capital Expenditure |
| CO2 | Carbon Dioxide |
| DNV | Independent Assurance and Risk Management Organisation (formerly Det Norske Veritas) |
| DWT | Deadweight Tonnage |
| ECA | Emission Control Area |
| ETS | Emissions Trading System |
| EU | European Union |
| EUA | European Union Allowance |
| EUR | Euro |
| FC | Fuel Cell |
| GHG | Greenhouse Gas |
| H2 | Hydrogen |
| HFO | Heavy Fuel Oil |
| ICE | Internal Combustion Engine |
| IEA | International Energy Agency |
| IFO380 | Intermediate Fuel Oil 380 |
| IGF Code | International Code of Safety for Ships Using Gases or Other Low-flashpoint Fuels |
| IMO | International Maritime Organization |
| IRENA | International Renewable Energy Agency |
| LHV | Lower Heating Value |
| LH2 | Liquid Hydrogen |
| LNG | Liquefied Natural Gas |
| MEPC | Marine Environment Protection Committee |
| MGO | Marine Gas Oil |
| MGOe | Marine Gas Oil Equivalent |
| N2O | Nitrous Oxide |
| NH3 | Ammonia |
| NOx | Nitrogen Oxides |
| NPOO | National Recovery and Resilience Plan |
| OPEX | Operating Expenditure |
| RED III | Renewable Energy Directive III |
| RoPax | Roll-on/Roll-off Passenger Vessel |
| TEN-T | Trans-European Transport Network |
| TEU | Twenty-foot-equivalent Unit |
| USD | United States Dollar |
| VLSFO | Very Low Sulphur Fuel Oil |
References
- European Commission. Reducing Emissions from the Shipping Sector, Climate Action. 2026. Available online: https://climate.ec.europa.eu/eu-action/transport-decarbonisation/reducing-emissions-shipping-sector_en (accessed on 21 June 2026).
- European Commission. Decarbonising Maritime Transport—FuelEU Maritime, Mobility and Transport. 2026. Available online: https://transport.ec.europa.eu/transport-modes/maritime/decarbonising-maritime-transport-fueleu-maritime_en (accessed on 21 June 2026).
- International Maritime Organization. 2023 IMO Strategy on Reduction of GHG Emissions from Ships; Resolution MEPC.377(80); IMO: London, UK, 2023. [Google Scholar]
- Bouman, T.; Lindstad, E.; Rialland, A.I.; Stromman, A.H. State-of-the-art technologies, measures, and potential for reducing GHG emissions from shipping—A review. Transp. Res. Part D Transp. Environ. 2017, 52, 408–421. [Google Scholar] [CrossRef] [Scilit]
- Balcombe, P.; Brierley, J.; Lewis, C.; Skatvedt, L.; Speirs, J.; Hawkes, A.; Staffell, I. How to decarbonise international shipping: Options for fuels, technologies and policies. Energy Convers. Manag. 2019, 182, 72–88. [Google Scholar] [CrossRef] [Scilit]
- The Engineering ToolBox. Fossil vs. Alternative Fuels—Energy Content. 2008. Available online: https://www.engineeringtoolbox.com/fossil-fuels-energy-content-d_1298.html (accessed on 21 June 2026).
- DNV. Ammonia as a Marine Fuel: Prospects and Challenges, Maritime Impact. 2025. Available online: https://www.dnv.com/expert-story/maritime-impact/ammonia-as-a-marine-fuel-prospects-and-challenges/ (accessed on 21 June 2026).
- European Commission. Alternative Fuels Infrastructure, Mobility and Transport. 2026. Available online: https://transport.ec.europa.eu/transport-themes/clean-transport/alternative-fuels-sustainable-mobility-europe/alternative-fuels-infrastructure_en (accessed on 21 June 2026).
- European Commission. Renewable Energy Directive, Energy. 2026. Available online: https://energy.ec.europa.eu/topics/renewable-energy/renewable-energy-directive-targets-and-rules/renewable-energy-directive_en (accessed on 21 June 2026).
- European Commission. EU Hydrogen Bank, Climate Action. 2026. Available online: https://climate.ec.europa.eu/eu-action/eu-funding-climate-action/innovation-fund/european-hydrogen-bank_en (accessed on 21 June 2026).
- European Commission. Competitive Bidding Under the Innovation Fund, Climate Action. 2026. Available online: https://climate.ec.europa.eu/eu-action/eu-funding-climate-action/innovation-fund/competitive-bidding_en (accessed on 21 June 2026).
- International Energy Agency. Global Hydrogen Review 2026; IEA: Paris, France, 2026; Available online: https://www.iea.org/reports/global-hydrogen-review-2026 (accessed on 21 June 2026).
- International Renewable Energy Agency. Green Hydrogen Cost Reduction: Scaling Up Electrolysers to Meet the 1.5 °C Climate Goal; IRENA: Abu Dhabi, United Arab Emirates, 2020; Available online: https://www.irena.org/publications/2020/Dec/Green-hydrogen-cost-reduction (accessed on 21 June 2026).
- McKinlay, C.J.; Turnock, S.R.; Hudson, D.A. Route to zero emission shipping: Hydrogen, ammonia or methanol? Int. J. Hydrogen Energy 2021, 46, 28282–28297. [Google Scholar] [CrossRef] [Scilit]
- Schlehuber, S.; Gutsch, M.; Kronemeyer, N.; Frieden, F.; von Delft, S. Assessment of environmental impacts and costs for hydrogen-powered cargo shipping in Europe. Commun. Eng. 2025, 4, 50. [Google Scholar] [CrossRef] [Scilit] [PubMed]
- Dave, Y.; Torres, J.S.M.; Esfeh, S.K.; Baetcke, L.; Ehlers, S. Energy efficiency of future hydrogen-based fuel supply chain routes for Germany’s maritime demand. Front. Energy Res. 2025, 13, 1600803. [Google Scholar] [CrossRef] [Scilit]
- Wang, Y.; Iris, Ç. Transition to near-zero emission shipping fleet powered by alternative fuels under uncertainty. Transp. Res. Part D Transp. Environ. 2025, 142, 104689. [Google Scholar] [CrossRef] [Scilit]
- Zhang, H.; Kou, Y.; Yang, M.; Elst, M.V.; Baeyens, J.; Deng, Y. Producing ‘green’ methanol from syngas, derived from anaerobic digestion biogas. Front. Chem. Sci. Eng. 2025, 19, 92. [Google Scholar] [CrossRef] [Scilit]
- International Renewable Energy Agency; Methanol Institute. Innovation Outlook: Renewable Methanol; IRENA: Abu Dhabi, United Arab Emirates, 2021; Available online: https://www.irena.org/Publications/2021/Jan/Innovation-Outlook-Renewable-Methanol (accessed on 21 July 2026).
- International Maritime Organization. Interim Guidelines for the Safety of Ships Using Methyl/Ethyl Alcohol as Fuel; MSC.1/Circ.1621; IMO: London, UK, 2020. [Google Scholar]
- Port of Antwerp-Bruges. First Methanol Bunkering with Deep-Sea Vessel Ane Maersk at Port of Antwerp-Bruges. 2024. Available online: https://newsroom.portofantwerpbruges.com/en/press-releases/first-methanol-bunkering-with-deepsea-vessel-ane-maersk-at-port-of-antwerp-bruges (accessed on 21 July 2026).
- Ship & Bunker. World Bunker Prices. 2026. Available online: https://shipandbunker.com/prices (accessed on 21 June 2026).
- The Engineering ToolBox. Combustion of Fuels—Carbon Dioxide Emission. 2009. Available online: https://www.engineeringtoolbox.com/co2-emission-fuels-d_1085.html (accessed on 21 June 2026).
- International Maritime Organization. 2024 Guidelines on Life Cycle GHG Intensity of Marine Fuels; Resolution MEPC.391(81); IMO: London, UK, 2024. [Google Scholar]
- European Parliament and Council. Regulation (EU) 2023/1805 of 13 September 2023 on the use of renewable and low-carbon fuels in maritime transport and amending Directive 2009/16/EC. Off. J. Eur. Union 2023, L 234, 48–100. Available online: https://eur-lex.europa.eu/eli/reg/2023/1805/oj/eng (accessed on 21 July 2026).

Disclaimer/Publisher’s Note: The statements, opinions and data contained in all publications are solely those of the individual author(s) and contributor(s) and not of MDPI and/or the editor(s). MDPI and/or the editor(s) disclaim responsibility for any injury to people or property resulting from any ideas, methods, instructions or products referred to in the content. |
© 2026 by the authors. Licensee MDPI, Basel, Switzerland. This article is an open access article distributed under the terms and conditions of the Creative Commons Attribution (CC BY) license.