


Abstract
Using daily rainfall observations from 1961 to 2022 (62 years) across 15 typical sub-regions within the water-receiving area of the Zhejiang East Water Diversion Project, this study systematically examines the spatiotemporal distribution, long-term trends, multi-scale variability, and inter-regional correlations of rainfall. An integrated framework was employed, including the Mann–Kendall (MK) trend test, Sen’s slope estimator, Hurst exponent analysis, and multi-scale sliding window analysis. Spatially, the multi-year average daily rainfall ranges from 3.47 mm to 5.68 mm, following a distinct “high in the center, low in the west” pattern, with the Yuyao Plain Mazhu Midstream Area identified as the regional rainfall maximum. In the raw Mann–Kendall test all 15 sub-regions exhibit increasing trends, of which 14 remain statistically significant (p < 0.05) after trend-free pre-whitening; Sen’s slopes follow a “coastal > riverine > hilly” gradient. Hurst exponents greater than 0.5 suggest persistent behavior in the rainfall series, although attribution to external forcing or separation from low-frequency climate variability requires additional analysis. Multi-scale sliding window analysis reveals strong scale dependence: the amplitude of trend fluctuations decreases by approximately 90% from ±16 mm at the 3-month scale to ±1.7 mm at the 12-month scale, while inter-regional correlation coefficients increase from 0.83 to 0.87. Notably, the Yuyao Plain Mazhu Midstream Area displays a unique “increase-then-decrease” correlation pattern, reflecting its distinctive hydro-geographic conditions. These findings provide a scientific basis for climate-adaptive scheduling of water diversion projects, supporting water security, urban resilience, and climate action.
1. Introduction
The Eastern Zhejiang region, situated on the highly developed eastern coast of Zhejiang Province, China, is a critical economic engine of the Yangtze River Delta. The area experiences a typical subtropical monsoon climate, strongly influenced by both the Meiyu front and typhoon systems. In late spring and early summer, the strengthening Pacific Subtropical High meets cold air masses from the north, forming a quasi-stationary front that brings persistent, overcast rainy weather—the Meiyu flood season. In summer and autumn, the region is dominated by the Pacific Subtropical High and is frequently impacted by tropical cyclones, leading to heavy rainstorms during the typhoon flood season [1,2]. Although mean annual precipitation exceeds 1400 mm, its spatiotemporal distribution is highly uneven: more than 60% of the annual rainfall is concentrated in these two flood seasons, resulting in a sharp alternation between summer floods and winter-spring droughts. Spatially, water availability decreases from the mountainous southwest toward the coastal northeast, a gradient that contrasts sharply with the region’s economic and demographic centers, which are concentrated along the coast [3,4].
The water-receiving area of the Zhejiang East Water Diversion Project—the largest cross-basin water transfer infrastructure in Zhejiang Province—covers approximately 15,614 km2 (14.8% of the province’s area) and supports a beneficiary population of about 17.5 million people (26.7% of the provincial total); within this larger receiving area, the present study analyzes a representative subset of approximately 5941 km2 that contains the 15 sub-regions examined here (see Section 2.1). Economically, the region contributed approximately 2.14 trillion CNY (36.6% of Zhejiang’s GDP) in 2021. Since the project became fully operational in June 2014, it has delivered an average of 890 million m3/year to 19 counties across Hangzhou, Shaoxing, Ningbo, and Zhoushan, effectively alleviating water pressure in these four major cities. However, under accelerating global climate change, hydro-meteorological observations indicate that precipitation patterns in this region have become non-stationary. The frequency and intensity of extreme events—ranging from prolonged droughts to localized torrential rains—have increased markedly [5,6,7]. These shifts pose unprecedented challenges to the project’s operational logic: water source stability is threatened by shifting seasonal baselines, while conveyance channel safety is jeopardized by flash floods. Therefore, a systematic, multi-scale analysis of rainfall trends and variability specifically within the project’s receiving areas is urgently needed for adaptive management.
On a global scale, the Sixth Assessment Report of the Intergovernmental Panel on Climate Change (IPCC AR6) unequivocally confirms that human influence has intensified the global water cycle [8]. Since the 1950s, precipitation variability over mid-latitude land areas has increased, a phenomenon consistent with the thermodynamic Clausius–Clapeyron relationship, which predicts a ~7% increase in atmospheric water-holding capacity per degree Celsius of warming [9]. Recent high-impact studies have further solidified the “wet-gets-wetter” paradigm. Madakumbura et al. (2021) provided robust evidence using machine learning methods that anthropogenic climate change drives intensification of extreme precipitation events globally, particularly in monsoon regions [10]. Kotz et al. (2022) demonstrated that precipitation variability is increasing at a rate faster than mean precipitation itself, leading to more volatile hydro-climatic regimes that challenge traditional water resource management assumptions [11].
In China, the response to global warming exhibits significant regional heterogeneity. Early foundational work by Zhai et al. (1999) documented long-term changes in climate extremes across China, establishing that while mean precipitation shows complex spatial patterns, the frequency and intensity of extreme events have shown more consistent upward trends in eastern regions [12]. For the Yangtze River Basin and the southeast coastal zone, recent studies have identified a “dual-intensification” pattern: both the frequency of extreme heavy rainfall and the duration of dry spells are increasing [13,14,15]. This pattern is driven by the northward shift in the East Asian summer monsoon, rising sea surface temperatures in the East China Sea, and urbanization-induced “rain island” effects in the Yangtze River Delta megalopolis [16,17,18]. At the provincial scale, Fan et al. (2021) examined spatial correlations of daily precipitation over mainland China, providing insights into the scales at which precipitation events are synchronized [19]. Wang et al. (2022) developed an improved daily Standardized Precipitation Index (SPI) dataset for mainland China, enabling better detection of flash droughts and extreme wet periods [20].
Methodologically, the Mann–Kendall (MK) test [21,22] and Sen’s slope estimator [23] remain the gold standards for trend detection due to their non-parametric nature and robustness against outliers. Recent methodological advances emphasize the need for integrated frameworks. The Hurst exponent [24] has seen renewed application in evaluating the long-term memory or persistence of detected trends, offering a predictive dimension often missing in traditional trend analysis [25]. Moreover, the recognition of scale dependence has driven the adoption of multi-scale approaches. Wavelet analysis and sliding window techniques are increasingly used to decompose hydrological time series, revealing how statistical characteristics (e.g., variance and correlation) evolve from short-term weather noise (days to months) to long-term climate signals (years to decades) [26]. For water diversion projects specifically, studies on China’s South-to-North Water Diversion have highlighted the vulnerability of inter-basin transfer systems to simultaneous droughts in source and receiving areas. However, most existing studies operate at provincial or basin scales, leaving a “granularity gap” for the 15 specific sub-regional receiving areas of the Zhejiang East Water Diversion Project. Furthermore, few studies systematically combine trend significance, magnitude, and persistence into a unified framework, and the scale dependence of rainfall variability and inter-regional correlations in this coastal transition zone remains under-investigated—a granularity gap that directly limits sustainable, climate-adaptive water management at the operational scale.
To address these gaps, the present study uses a continuous, quality-controlled 62-year daily rainfall dataset (1961–2022) from a 24-gauge observation network, resolved into 15 hydrologically delineated sub-region areal-rainfall series, in the water-receiving area of the Zhejiang East Water Diversion Project. The specific objectives are fourfold: (i) to quantify the spatial pattern of multi-year average daily rainfall and identify high-, medium-, and low-value clusters; (ii) to assess trend significance, magnitude, and persistence using an integrated MK–Sen–Hurst framework; (iii) to characterize multi-scale variability and the evolution of inter-regional correlations at 3-, 6-, and 12-month scales; and (iv) to identify region-specific rainfall behavior that can inform climate-adaptive water diversion management.
2. Materials and Methods
2.1. Study Area
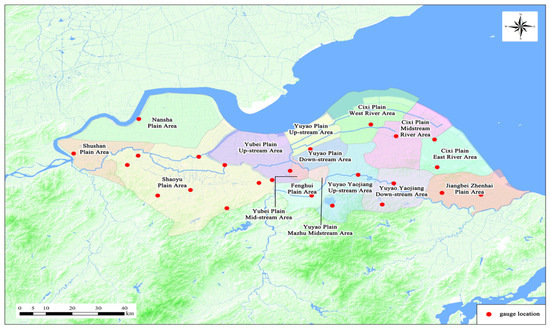
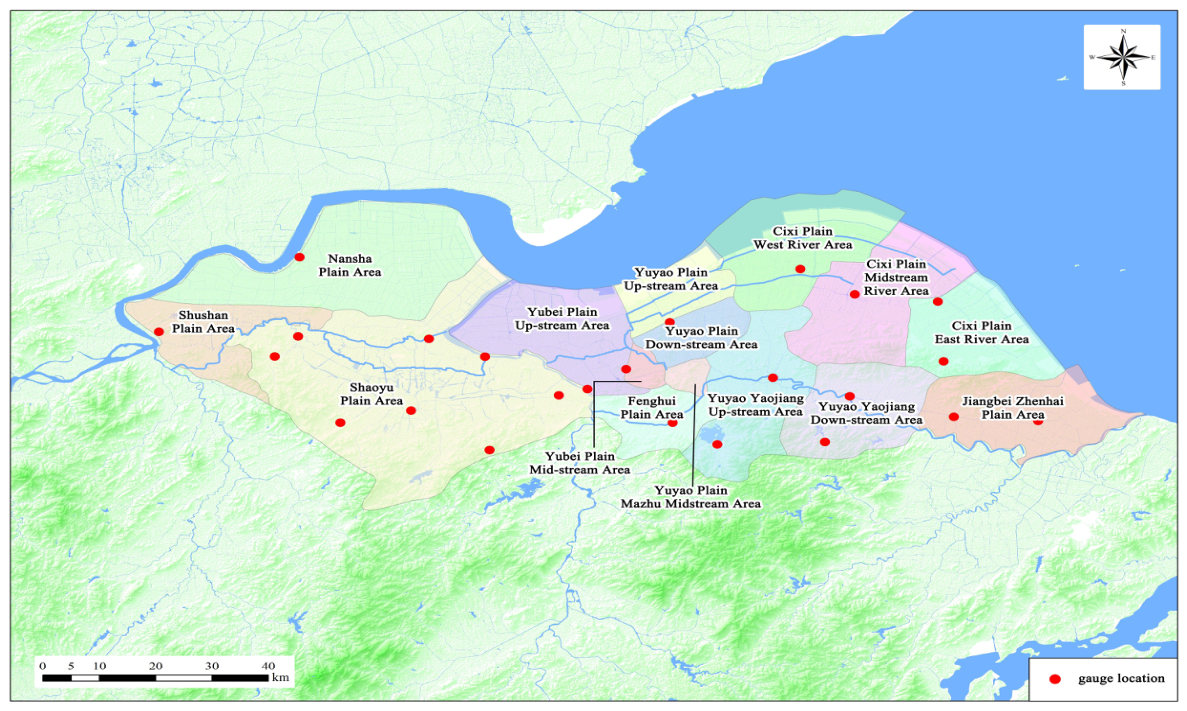
The study area analyzed here (approximately 5941 km2) is located in eastern Zhejiang Province, China, which is a representative subset of the project’s larger 15,614 km2 water-receiving area, selected to encompass the 15 hydrologically delineated sub-regions. The 5941 km2 analytical domain was selected because continuous quality-controlled daily rainfall series were available for these 15 hydrologically delineated sub-regions. The excluded Yinfeng-related districts were not included because comparable long-term areal rainfall series were unavailable. Therefore, the findings should be interpreted as representative of the Xiaoshao–Yaojiang portion of the receiving area, not the entire 15,614 km2 project receiving area. It covers 15 typical sub-regions distributed across five administrative zones: Xiaoshan, Shaoyu, Yuyao, Cixi, and Ningbo (Figure 1). The topography exhibits a complex transition from flat coastal plains in the east (elevation < 10 m) to river valley plains in the central Yao River basin (10–200 m) and transitional hills in the west (200–500 m). The regional hydrology is primarily defined by three major river basins: the Qiantang River, the Cao’e River, and the Yong River. These natural river systems are interconnected through the 294 km main diversion channel of the Zhejiang East Water Diversion Project. The climate is subtropical monsoon, with multi-year average annual precipitation across the sub-regions ranging from 1273.5 mm to 1454.8 mm. Rainfall is highly concentrated in the Meiyu season (June–July) and the typhoon season (August–September), which together account for more than 60% of the annual total.
Figure 1.
Location of the study area and distribution of the 15 sub-regions.
2.2. Data Sources
The observational basis is a network of 24 rain gauges distributed across the water-receiving area, with a mean density of approximately one gauge per 250 km2. The gauge elevations range from 3 to 77 m and therefore mainly represent lowland and foothill conditions; rainfall over the higher western terrain (transitional hills reaching 200–500 m) may consequently be underrepresented. Thiessen polygons were generated using the 24 rain-gauge coordinates and clipped to the boundaries of each hydrologically delineated sub-region. The areal rainfall for each sub-region was calculated as the weighted sum of gauge rainfall, where weights correspond to the fraction of the sub-region area covered by each polygon. Gauge weights were held constant over the study period. Each resulting series spans 22,630 daily values (1961–2022), capturing multiple decadal climate cycles and providing a robust foundation for long-term trend analysis.
2.3. Data Quality Control
A rigorous four-stage quality control procedure was applied to ensure the reliability of the daily precipitation dataset. First, continuity assessment systematically identified time series gaps, with missing data accounting for less than 2% for any station. Second, outlier detection using the 3σ criterion (Pauta criterion) flagged statistical anomalies, which were then cross-checked against adjacent station records and synoptic weather logs to distinguish measurement errors from genuine extreme events. Third, small gaps were filled via linear regression using the most highly correlated neighboring station, and the interpolated values were validated against seasonal climatological norms. Fourth, homogeneity testing was performed using the Standard Normal Homogeneity Test (SNHT) and a sliding t-test to detect and correct breakpoints caused by station relocations or instrument changes. The final quality-controlled dataset exceeds 98% completeness and has been verified for temporal homogeneity.
2.4. Mann–Kendall Trend Test
The Mann–Kendall (MK) test [21,22,27,28] is a rank-based non-parametric method widely used to detect monotonic trends in hydro-climatic time series. Its primary advantages are its robustness against outliers and its ability to handle non-normally distributed data. To remove the influence of serial correlation on significance testing, a trend-free pre-whitening procedure was additionally applied to each annual rainfall series. For a time series {}, the test statistic is calculated as:
where is the sign function defined as follows,
For sample sizes , the statistic is approximately normally distributed with mean and its variance defined as follows,
where is the number of tied groups and is the number of observations in the -th tied group. The standardized test statistic is computed to assess significance,
A positive indicates an upward trend, while a negative indicates a downward trend. The null hypothesis of no trend is rejected at the significance level if . In this study, significance levels of () and () are used.
2.5. Change-Point Detection
The Pettitt test [29]—a rank-based non-parametric method—was used to detect the presence and timing of a single abrupt shift in the mean of each annual rainfall series. For a series of length , the statistic is computed from the Mann–Whitney form, and the change point is located at the t that maximizes ; its significance is assessed against the associated -value. Detected change points are subsequently linked to the trend analysis (Section 3.2) by comparing pre- and post-change means.
2.6. Sen’s Slope Estimation
Sen’s slope estimator [23] is used to quantify the true magnitude of a linear trend. Unlike ordinary least squares regression, it is insensitive to outliers. For all data pairs with , the slope is calculated as,
The Sen’s slope is defined as the median of all calculated slopes. A positive signifies an increasing trend (mm/year). The 95% confidence interval for the slope is estimated using a non-parametric procedure based on the normal distribution of the rank statistic. Confidence intervals for Sen’s slope were computed following Gilbert (1987) [27]. In the expressions above, and denote the rainfall values at times and (with ), is the corresponding pairwise slope, is the series length, and is the median of all pairwise slopes.
2.7. Sliding Window Analysis
To capture scale-dependent behavior, sliding windows of 3 months (90 days), 6 months (180 days), and 12 months (365 days) were applied (Table 1). In addition, a Morlet continuous wavelet transform was applied to the monthly rainfall anomalies to identify dominant periodicities, with significance assessed against an AR(1) red-noise background [26]. For a window of size , four statistical moments are calculated at each time step . The arithmetic mean is computed as,
Table 1.
Sliding window configurations.
The standard deviation providing a normalized measure of variability is calculated as follows,
The coefficient of variation is derived as,
The trend slope within the window represents the instantaneous rate of change within the window. In these expressions, is the window length in days, indexes the window start, are the daily rainfall values, and are the within-window mean and standard deviation, is the coefficient of variation, and is the ordinary-least-squares slope fitted within each window. This approach reveals how rainfall variability, trends, and patterns evolve across different temporal aggregation levels.
2.8. Hurst Exponent Analysis
The Hurst exponent [24] quantifies the long-term memory or persistence of a time series and was estimated via rescaled range () analysis. The procedure involves three steps: (i) dividing the series into sub-series of length ; (ii) calculating the range of cumulative deviations and the standard deviation for each sub-series; and (iii) fitting the power-law relationship . The value of H ranges from 0 to 1 with the following interpretations: indicates persistence (long-term memory, i.e., past increments tend to be followed by increments of the same sign); indicates a random walk (uncorrelated series, Brownian motion); and indicates anti-persistence (mean reversion tendency).
2.9. Inter-Regional Correlation Analysis
To assess spatial coherence, Pearson correlation coefficients () were calculated between all pairs of the 15 sub-regions. Correlation matrices were computed for data aggregated at 3-month, 6-month, and 12-month scales. This scale-dependent correlation analysis reveals how spatial synchronization evolves from local weather scales to regional climate scales.
3. Results
3.1. Spatial Distribution of Rainfall
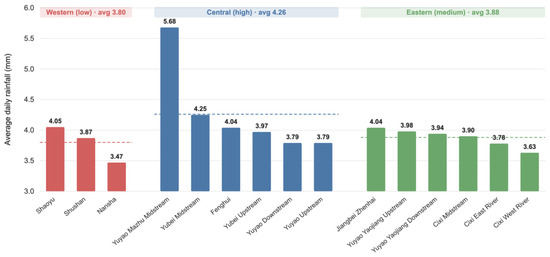
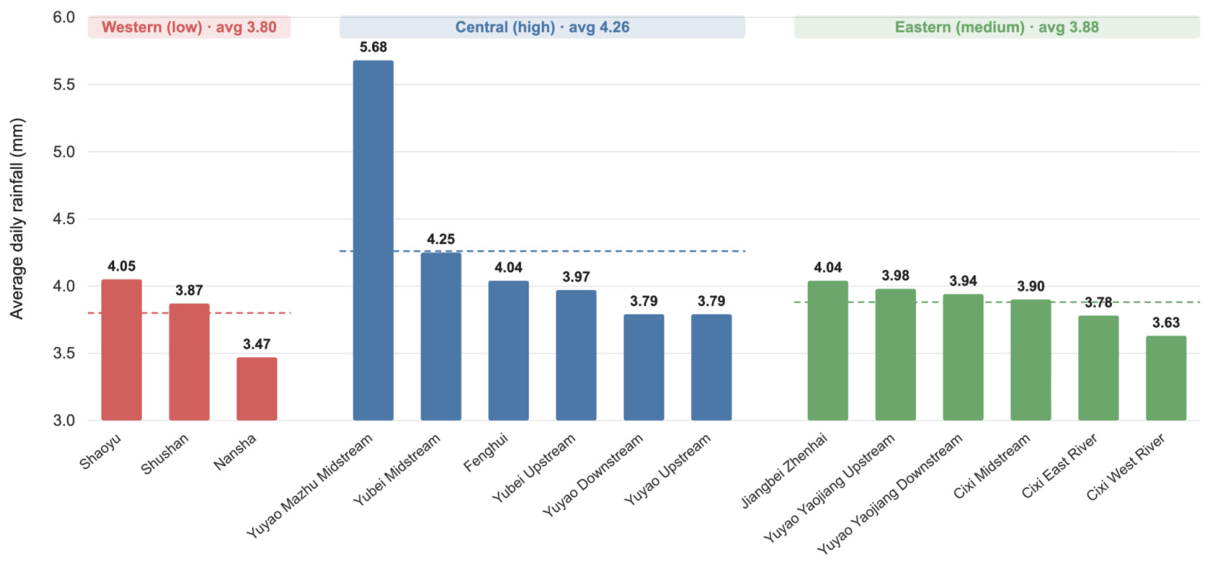
The 62-year daily rainfall records reveal a pronounced spatial heterogeneity across the 15 sub-regions, characterized by a “high-in-center, low-in-west, medium-in-east” pattern. Figure 2 illustrates this distribution, where the multi-year average daily rainfall ranges from 3.47 mm to 5.68 mm, with an overall regional mean of 3.98 mm. The western zone, comprising the Nansha, Shushan, and Shaoyu plains, exhibits the lowest values, with a zonal mean of 3.80 mm. The Nansha Plain Area is the driest, recording only 3.47 mm per day. In contrast, the central zone, which includes six sub-regions around the Yao River confluence, shows a markedly higher mean of 4.26 mm—12% above the western average. Within this central belt, the Yuyao Plain Mazhu Midstream Area stands out as the regional rainfall maximum, reaching 5.68 mm daily. Remarkably, this is 64% higher than the value observed in the Nansha Plain Area, despite a distance of only about 30 km between the two locations. The eastern coastal zone, comprising the remaining six sub-regions, has an intermediate mean of 3.88 mm. Although directly exposed to moisture from the East China Sea, the flat coastal terrain provides limited orographic lift, and the stable marine boundary layer suppresses convective development; as a result, the eastern zone does not receive the highest rainfall although it is the most ocean-exposed zone. Within the Cixi Plain series, a westward decreasing gradient is evident, from 3.90 mm in the midstream area to 3.63 mm in the West River Area.
Figure 2.
Spatial distribution of daily average rainfall (mm) across the 15 sub-regions in Eastern Zhejiang (1961–2022). (The dashed lines stand for the average value).
Table 2 summarizes the spatial statistics by zone. The higher coefficient of variation ( = 0.172) in the central zone reflects the exceptional status of the Mazhu Midstream Area, while the low (0.042) in the eastern zone indicates more homogeneous conditions among coastal sub-regions.
Table 2.
Daily average rainfall statistics by zone.
3.2. Long-Term Trends
3.2.1. Overall Trend Significance and Decadal Variability
The raw Mann–Kendall test applied to the annual rainfall series of all 15 sub-regions demonstrates that, before pre-whitening, every sub-region exhibits a statistically significant upward trend over the 1961–2022 period (). As shown in Table 3, the Z-values range from 2.27 (Shaoyu Plain Area) to 4.27 (Nansha Plain Area). The strongest trends () are concentrated in the western Nansha area and the central-eastern coastal plains, including the Yubei Midstream Area and the Cixi East and Midstream areas. In contrast, the hilly terrain areas such as Shaoyu and the highly variable Mazhu Midstream Area exhibit weaker but still significant signals (). This spatial differentiation indicates that coastal and western plain regions are responding more strongly to climatic changes than inland hilly areas.
Table 3.
Mann–Kendall test results for annual rainfall (1961–2022).
Superimposed on these long-term upward trends, the region exhibits pronounced decadal-scale oscillations. Low-rainfall periods occurred in 1967, 1978–1979, and 2003, years often associated with La Niña conditions and prolonged droughts. High-rainfall periods were recorded in 1973, 1989, 2012, 2015, and the consecutive years 2019–2021, corresponding to monsoon peaks and El Niño influences. Notably, a marked post-2010 intensification is evident across all sub-regions, characterized by increased frequency and amplitude of inter-annual fluctuations. The most extreme example is the Yuyao Plain Mazhu Midstream Area, which reached a record annualized daily average of approximately 9 mm (equivalent to ~3250 mm annual total) in 2021. This shift toward a more volatile hydro-climatic regime is a key signature of ongoing climate change in the region. To verify that the detected trends are not artefacts of serial correlation, a trend-free pre-whitening (TFPW) analysis was applied. Lag-1 autocorrelation was significant in 8 of the 15 sub-regions; after pre-whitening, 14 of the 15 sub-regions retained statistically significant increasing trends, with only the Jiangbei–Zhenhai Plain Area becoming marginal (). This confirms that the wetting signal is genuine rather than an autocorrelation artefact.
3.2.2. Detailed Sub-Regional Trend Characteristics
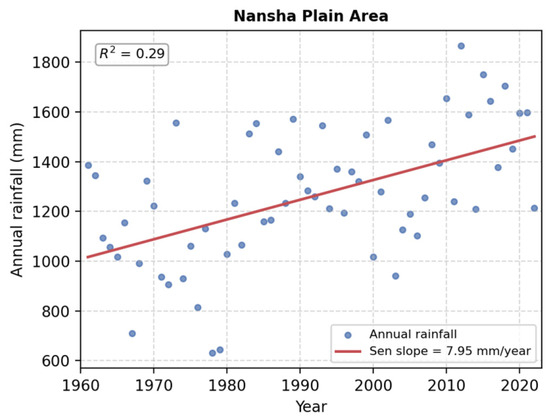
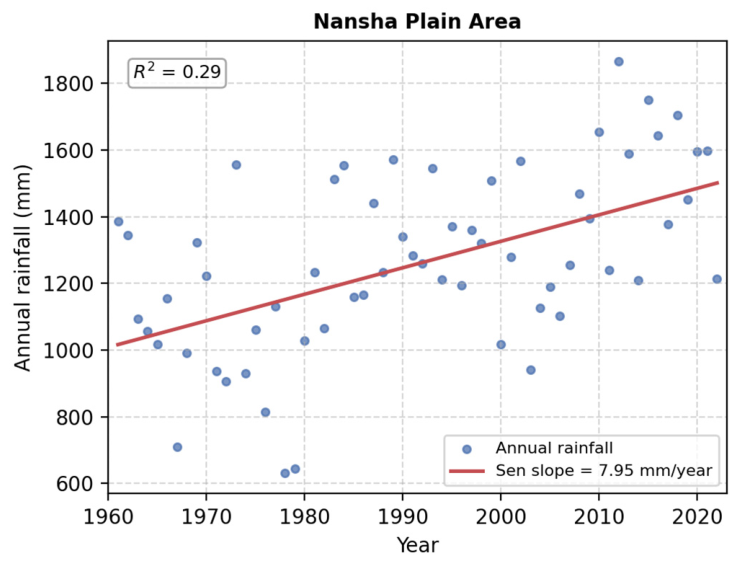
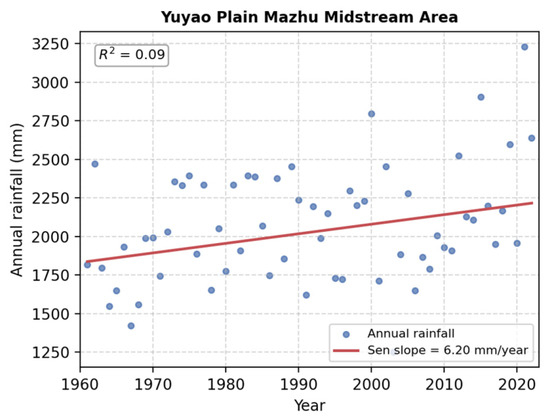
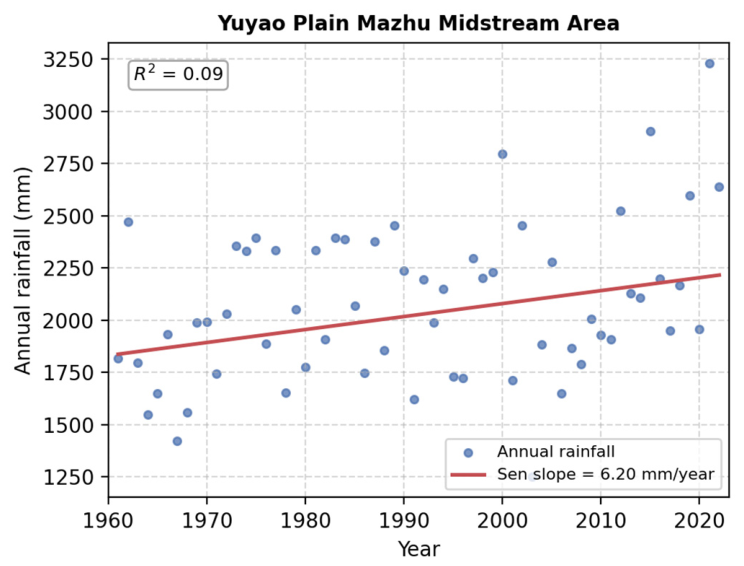
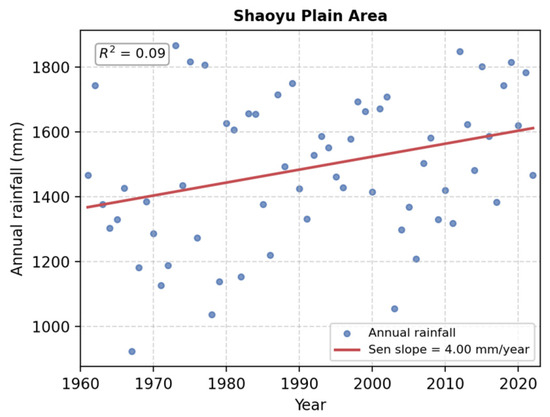
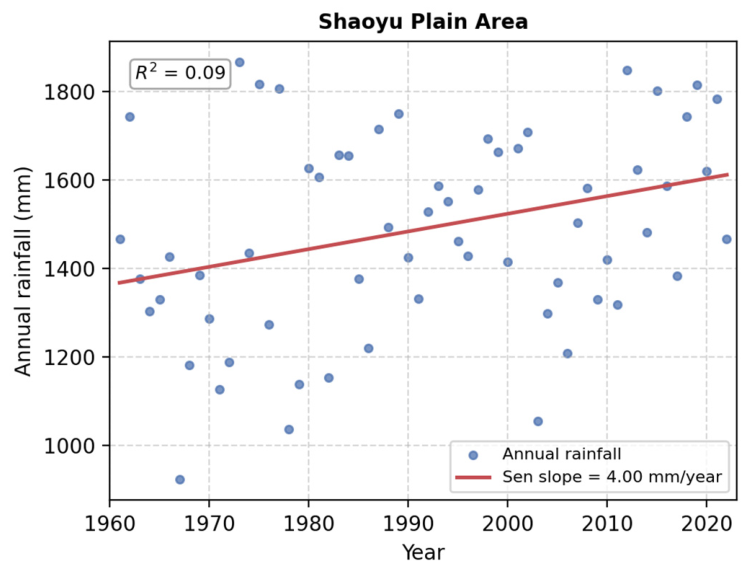
To provide a granular view of how rainfall has changed in each part of the water-receiving area, the annual time series, Sen’s slope trend lines, and 95% confidence intervals were computed for all 15 sub-regions. Three representative sub-regions are shown in the main text—the driest (Nansha Plain Area, Figure 3), the wettest (Yuyao Plain Mazhu Midstream Area, Figure 4), and a representative hilly western area (Shaoyu Plain Area, Figure 5). Collectively, these figures illustrate a clear spatial gradient from coastal high-change regions to hilly low-change regions.
Figure 3.
Trend analysis in the Nansha Plain Area (driest sub-region).
Figure 4.
Trend analysis in the Yuyao Plain Mazhu Midstream Area (wettest sub-region).
Figure 5.
Trend analysis in the Shaoyu Plain Area (hilly western sub-region).
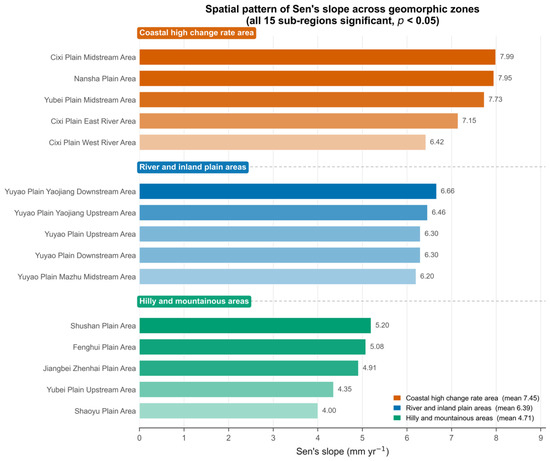
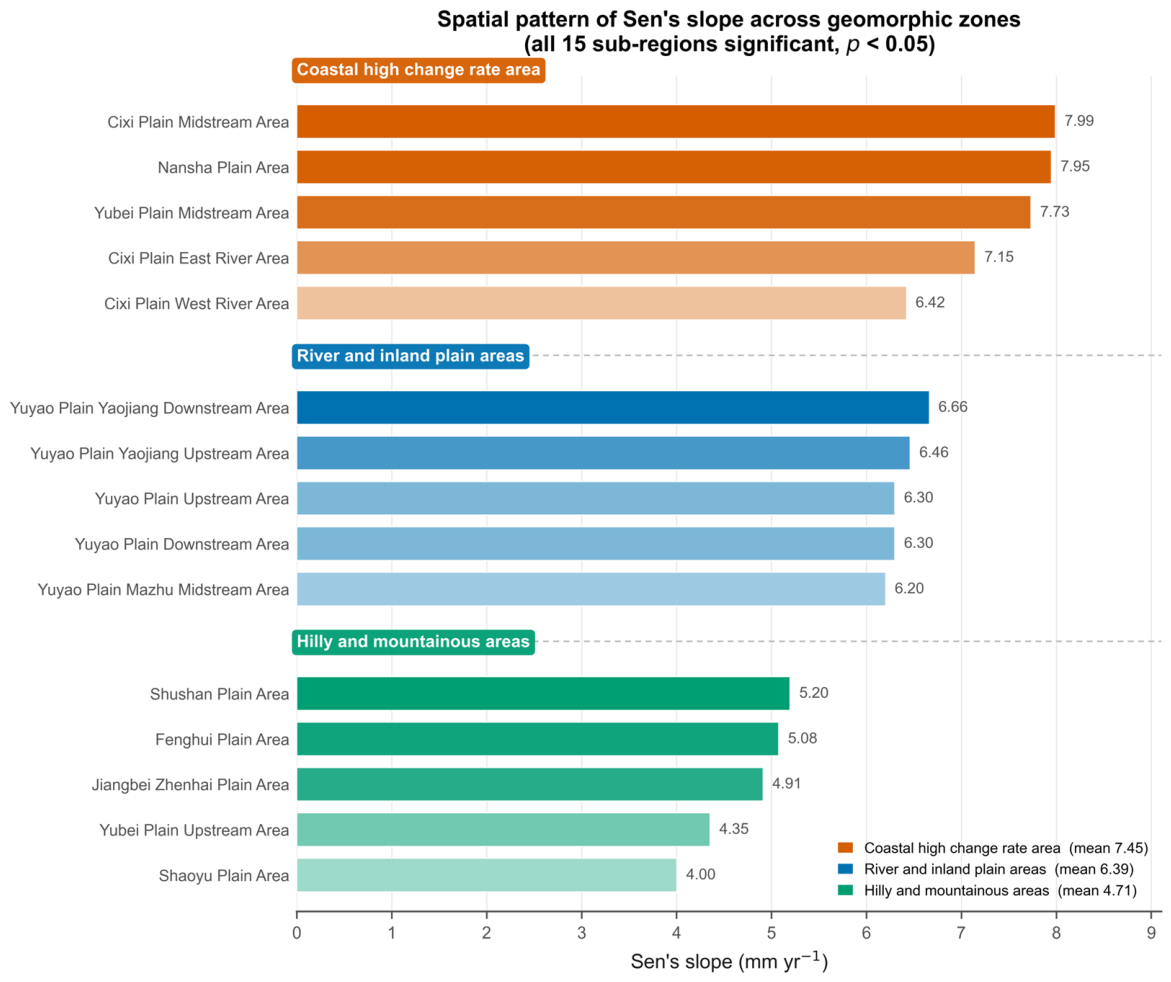
Among the coastal sub-regions, the Cixi Plain Midstream Area exhibits the highest trend in the entire study area, with a Sen’s slope of 7.99 mm/year. Its time series shows a consistent upward trajectory from approximately 800 mm in the late 1960s to over 2000 mm in the 2020s, and strong positive anomalies are frequent after 2010. The Nansha Plain Area (Figure 3), despite being the driest region with the lowest baseline rainfall (3.47 mm/day), has the second-highest trend magnitude (7.95 mm/year), meaning that its rainfall has increased by roughly 50% over the 62-year period. A major cluster of positive anomalies is evident from 2010 to 2022, indicating a rapid wetting trend in this historically drier western zone. The Cixi Plain East River Area shows a trend of 7.15 mm/year, with a clear acceleration after 2000, while the Cixi Plain West River Area records a lower trend of 6.42 mm/year, suggesting a westward decrease in trend intensity within the Cixi system—likely due to increasing distance from the East China Sea moisture source.
In the river and inland plain regions, the Yuyao Plain Yaojiang Downstream Area has a Sen’s slope of 6.66 mm/year, accompanied by large variability (800–2300 mm) and strong post-2010 increases. Its upstream counterpart exhibits a nearly identical trend (6.46 mm/year), reflecting strong hydrological connectivity along the Yaojiang system. The Yuyao Plain Upstream and Downstream areas both show trends of 6.30 mm/year, indicating synchronized behavior and common climate forcing across the inland plains. The Mazhu Midstream Area (Figure 4) is unique: it has the largest inter-annual variability (annual totals range from 1250 to 3250 mm) and the highest baseline rainfall in the region. Its Sen’s slope is a moderate 6.20 mm/year, but the extreme fluctuations partially mask the linear trend, resulting in a relatively low Z-value (2.28) despite substantial absolute gains (record high ~3250 mm in 2021). The Yubei Plain Midstream Area shows a consistent upward trend of 7.73 mm/year with a high Z-value (4.20), indicating a steady and significant increase. The Fenghui Plain Area has a below-average trend of 5.08 mm/year and relatively stable inter-annual variability.
The hilly and transitional regions exhibit the lowest trend magnitudes. The Shushan Plain Area has a trend of 5.20 mm/year, but its variability is higher than that of coastal zones, reflecting its transitional geographic position. The Yubei Plain Upstream Area, influenced by hilly terrain, shows a trend of 4.35 mm/year. The Jiangbei–Zhenhai Plain Area is an interesting case: despite its coastal location, its trend is only 4.91 mm/year—lower than other coastal regions—suggesting different synoptic influences or local microclimatic effects. The lowest trend in the entire study area is found in the Shaoyu Plain Area (Figure 5), with only 4.00 mm/year. The surrounding hilly terrain likely creates a stable microclimate and terrain blocking effects that buffer the large-scale warming signal, limiting moisture advection.
3.2.3. Spatial Pattern of Trend Magnitude and Its Uncertainty
The spatial synthesis of Sen’s slope estimates is presented in Figure 6, which clearly reveals a “coastal > river basin > hilly” gradient. Coastal areas average 7.45 mm/year, river basins average 6.38 mm/year, and hilly areas average only 4.91 mm/year. This means that coastal zones exhibit approximately 50% larger trend magnitudes than hilly areas, which may indicate a stronger local response to climate change and could be associated with marine warming.
Figure 6.
Spatial pattern of Sen’s slope estimates (mm/year) across the 15 sub-regions.
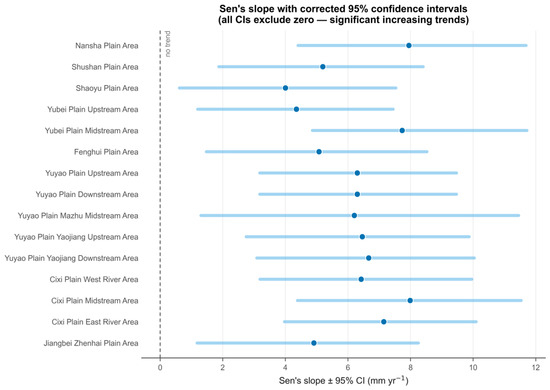
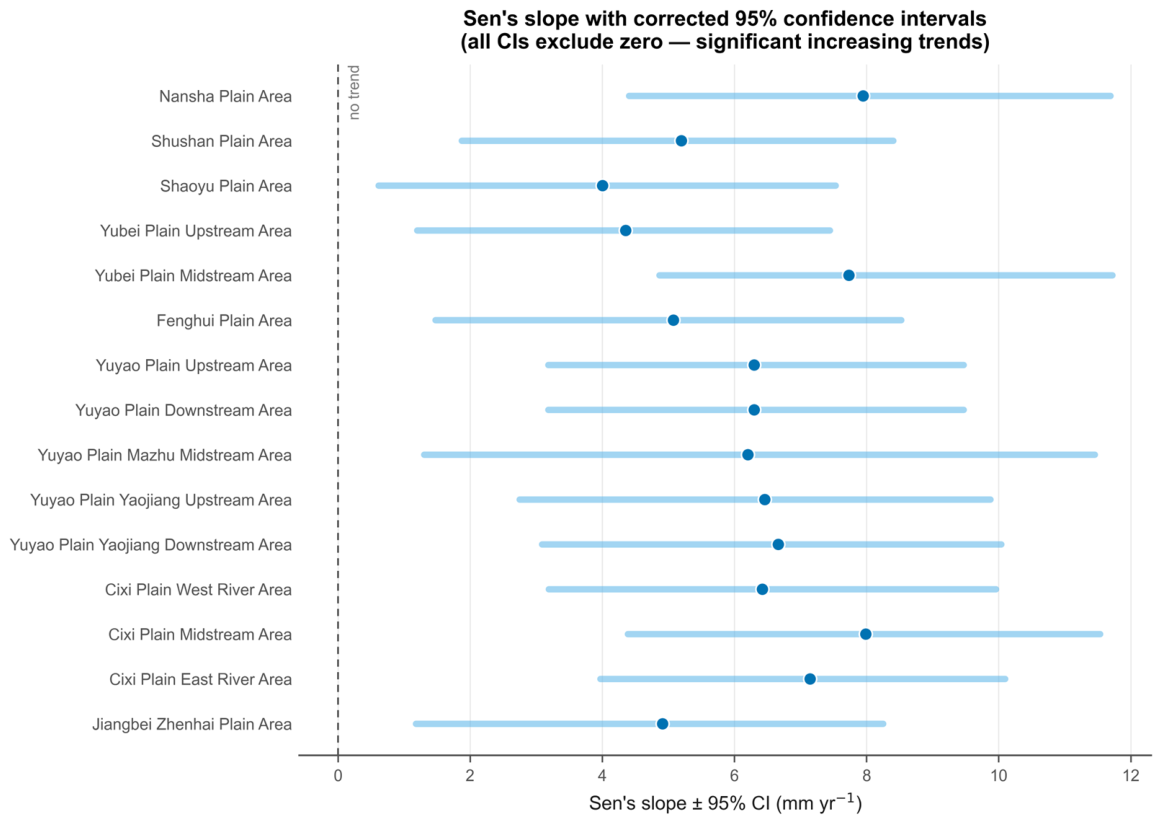
However, the trend magnitudes are subject to considerable uncertainty. Figure 7 shows the 95% confidence intervals for Sen’s slope estimates. Notably, the confidence intervals for all 15 sub-regions exclude zero (lower bounds ranging from 0.61 to 4.86 mm/year), which is fully consistent with the MK test and confirms that the increasing trends are not only directionally significant but also statistically robust in magnitude. The interval widths nonetheless vary markedly with each region’s inter-annual variability: The Mazhu Midstream Area displays the widest confidence interval (spanning roughly 400 mm/year), consistent with its extreme fluctuations.
Figure 7.
Rainfall variation trends and 95% confidence intervals for Sen’s slope estimates.
3.2.4. Trend Persistence
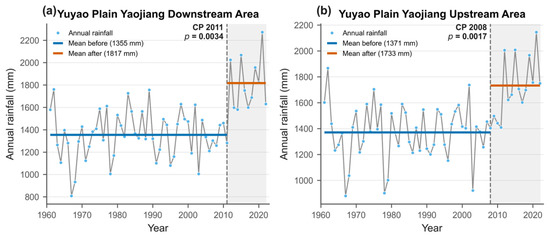
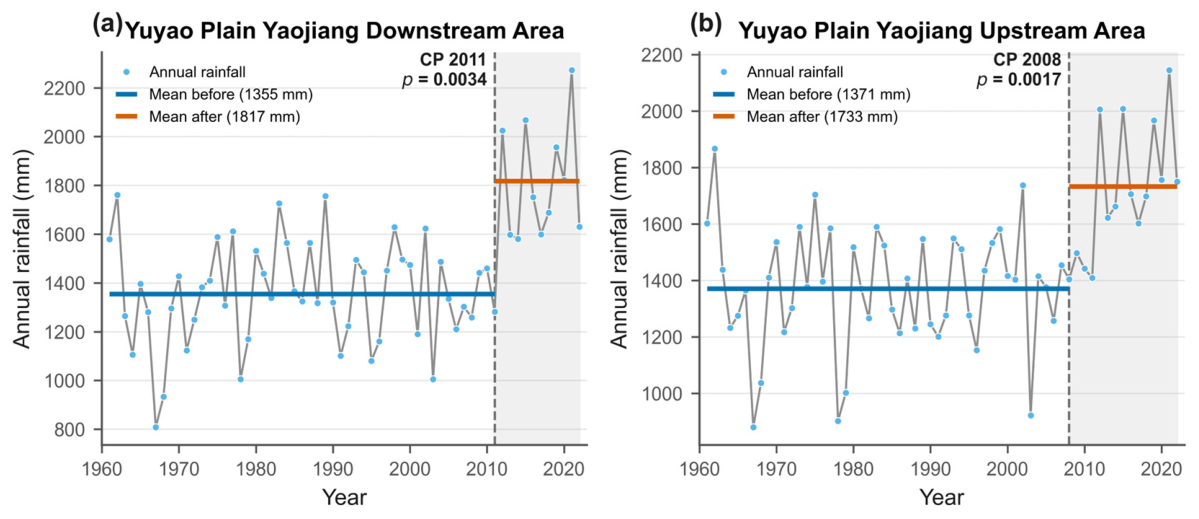
To evaluate whether the observed upward trends are likely to continue or merely represent temporary fluctuations, we computed the Hurst exponent for each sub-region. As shown in Table 4, all values exceed 0.5, ranging from 0.5595 (Mazhu Midstream Area) to 0.6257 (Nansha Plain Area). The Nansha area has the highest persistence, aligning with its strong and relatively stable trend. In contrast, the Mazhu area has the lowest persistence, where high variability reduces the long-memory signal. The Hurst exponents suggest weak-to-moderate persistence in the historical rainfall series. However, Hurst analysis does not provide a deterministic forecast, and future rainfall evolution should be evaluated using climate model projections and physical attribution analysis. To statistically anchor the qualitatively described post-2010 intensification, a Pettitt change-point test was applied to each annual series. Significant change points () were detected in 11 of the 15 sub-regions; 8 of these cluster in the 2006–2011 window, while the remaining three occur earlier (1982, 1992, and 1996). In every region the post-change mean exceeds the pre-change mean (e.g., the Yuyao Yaojiang Downstream Area shifts from 1355 to 1817 mm), confirming a coherent regional transition toward a wetter regime (Figure 8). Because the annual series were homogenized with the Standard Normal Homogeneity Test and a sliding t-test, these change points reflect a coordinated regional climate regime shift around 2006–2011. This timing coincides with the post-2010 intensification of the trends reported above, indicating that the change-point and trend analyses describe the same wetting transition.
Table 4.
Hurst exponent values for annual rainfall (1961–2022).
Figure 8.
Pettitt change-point detection: significant abrupt shifts in the annual rainfall mean for the 15 sub-regions, with most change points clustered in the 2006–2011 window and post-change means exceeding pre-change means.
3.3. Multi-Scale Variability
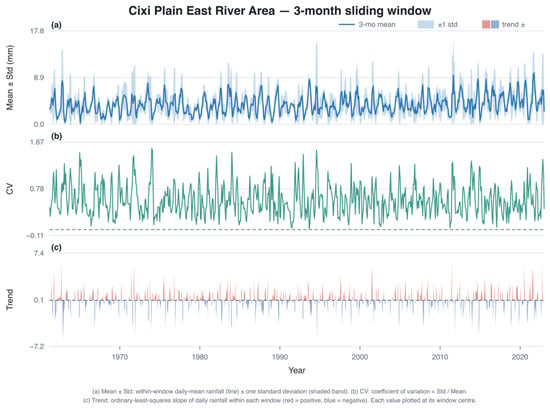
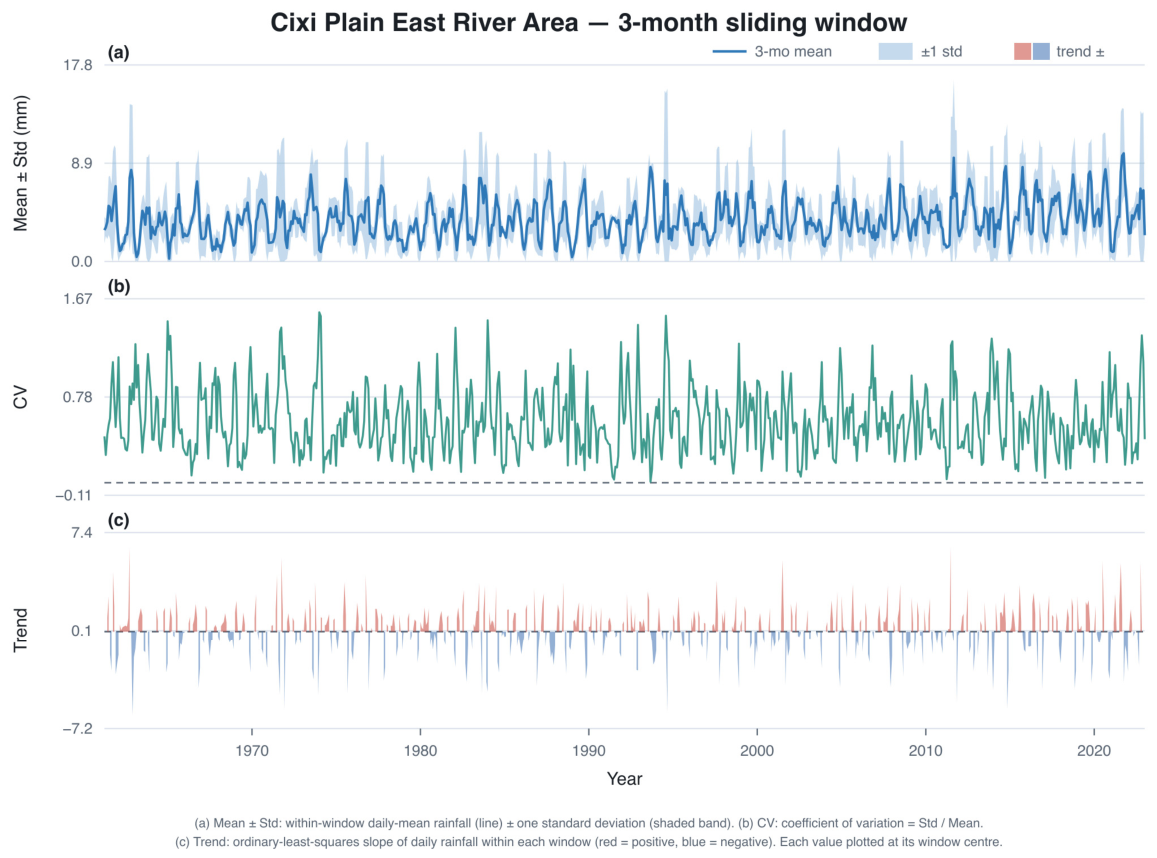
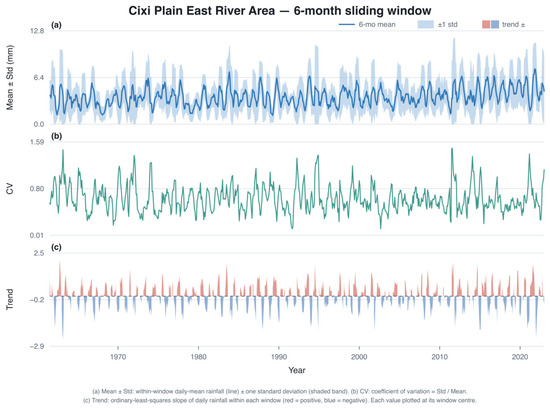
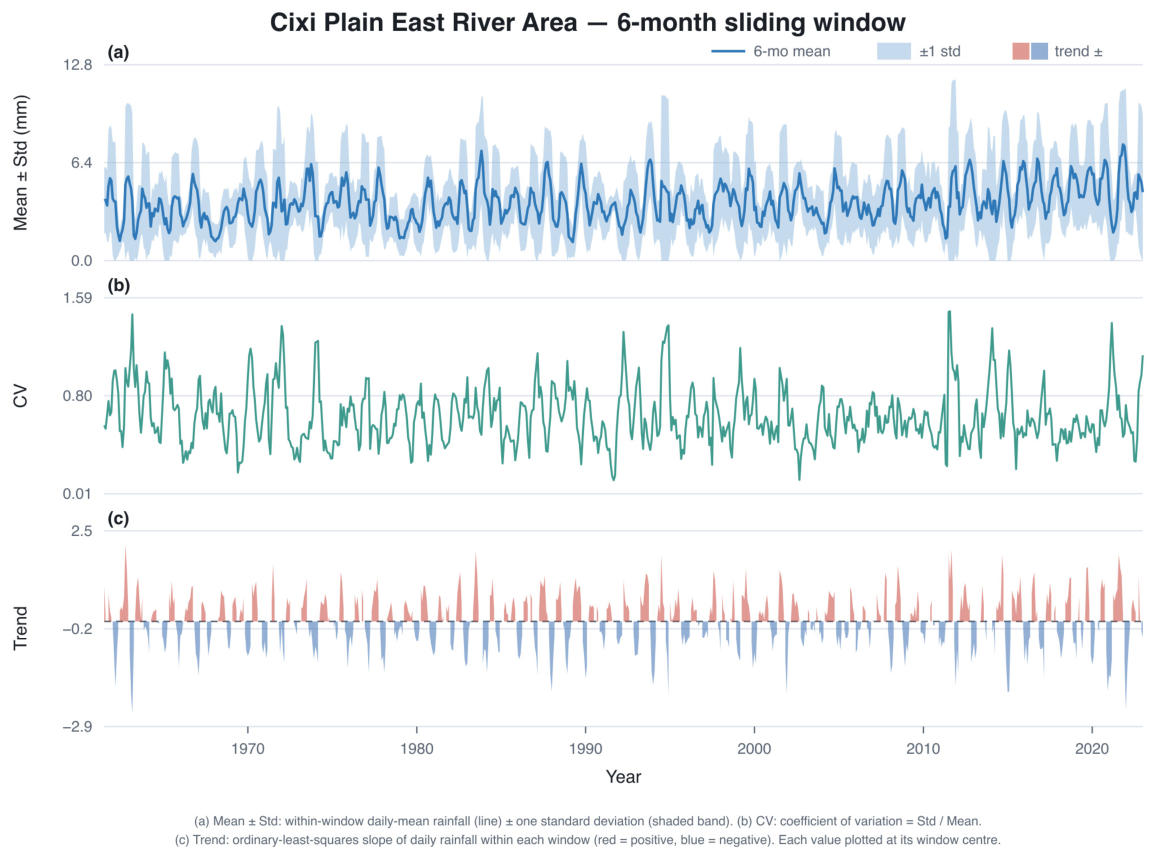
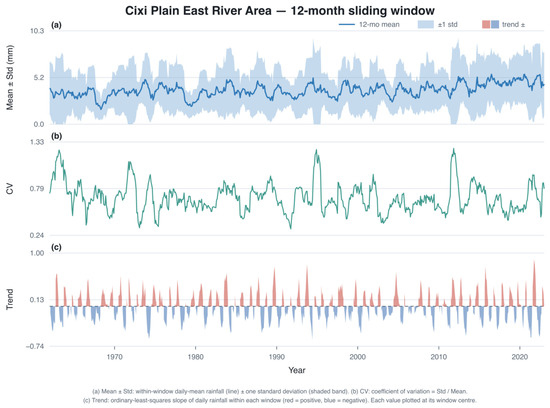
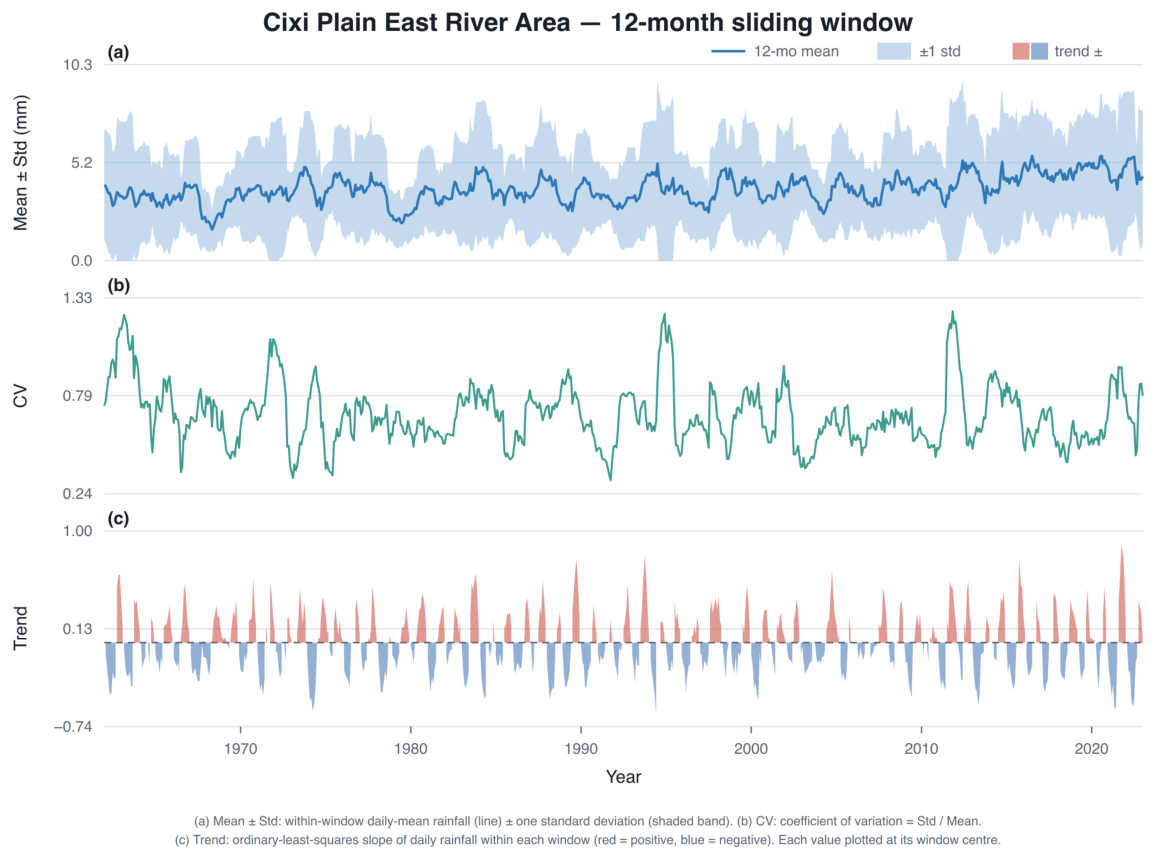
The temporal scale at which rainfall is analyzed profoundly affects its apparent variability and trend behavior. Using a sliding window approach, we examined rainfall statistics at 3-month, 6-month, and 12-month aggregation levels, with the Cixi Plain East River Area as a representative case (Figure 9, Figure 10 and Figure 11).
Figure 9.
Three-month sliding window analysis for the Cixi Plain East River Area (daily average rainfall, standard deviation, coefficient of variation, and trend slope).
Figure 10.
Six-month sliding window analysis for the Cixi Plain East River Area.
Figure 11.
Twelve-month sliding window analysis for the Cixi Plain East River Area.
At the 3-month scale (Figure 9), rainfall exhibits rapid, high-amplitude oscillations. Daily averages range from 0 to 10 mm, closely tracking the seasonal cycle (summer maxima, winter minima). The standard deviation varies between 0 and 8 mm, and the coefficient of variation () frequently exceeds 1.0, indicating extreme relative variability where the standard deviation often surpasses the mean. Because daily rainfall is highly intermittent (about 60% of days are dry), a above unity at this short scale chiefly reflects this intermittency rather than statistical instability; windows with a near-zero mean, for which the would be numerically unstable, are rare (only about 0.3% of all 3-month windows have a mean below 0.5 mm day−1). The trend slope within each 3-month window shows chaotic oscillations with sign reversals within a range of ±5 mm; at this short scale, what appears as a “trend” is actually dominated by weather noise and has little persistence. Across all 15 sub-regions, the 3-month scale is characterized by a trend fluctuation range of ±16 mm and a minimum inter-regional correlation of only 0.578.
At the 6-month scale (Figure 10), the signal begins to stabilize. Daily average fluctuations smooth to a range of 2.5–7.5 mm, and the peak standard deviation is reduced by about 30% (now 1.5–5.5 mm). The stabilizes around 0.7–0.8, with fewer events exceeding 1.0. Trend slope fluctuations narrow to ±2 mm, and the slopes show longer wavelengths and fewer reversals, indicating emerging persistence. Regionally, the trend fluctuation range narrows to ±5 mm (a 70% reduction from the 3-month scale), and the minimum correlation improves to 0.623.
At the 12-month (annual) scale (Figure 11), the behavior becomes distinctly climate-dominated. Daily average rainfall shows smooth, quasi-sinusoidal oscillations within a narrow range of 2–5 mm, and long-term decadal variations—such as the early-1990s peak and the mid-2010s rise—become the dominant features. The drops to a stable range of 0.4–1.0. Trend slope fluctuations are drastically reduced to ±0.5 mm, and annual-scale trends exhibit high persistence, reversing only with major climate shifts. Regionally, the trend fluctuation range narrows to ±1.7 mm—approximately 90% smaller than at the 3-month scale—and the minimum correlation reaches 0.640, the highest among all scales. This pattern suggests that short-term rainfall variability is more locally heterogeneous, while longer aggregation scales are more spatially coherent and may reflect broader climate influences.
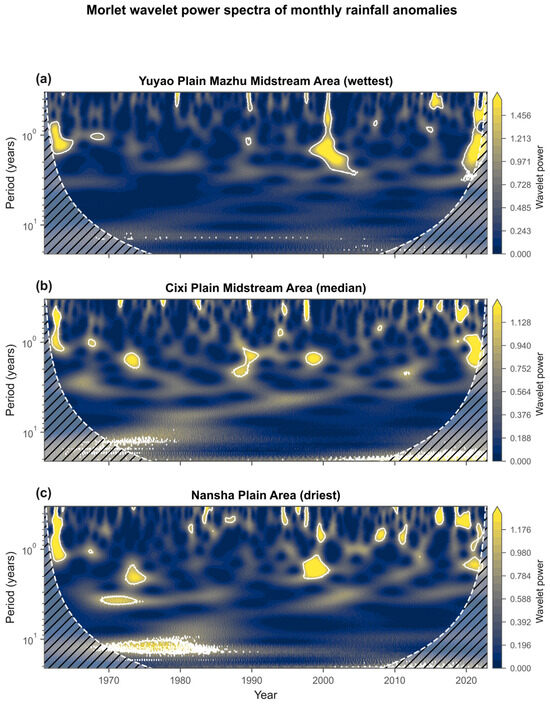
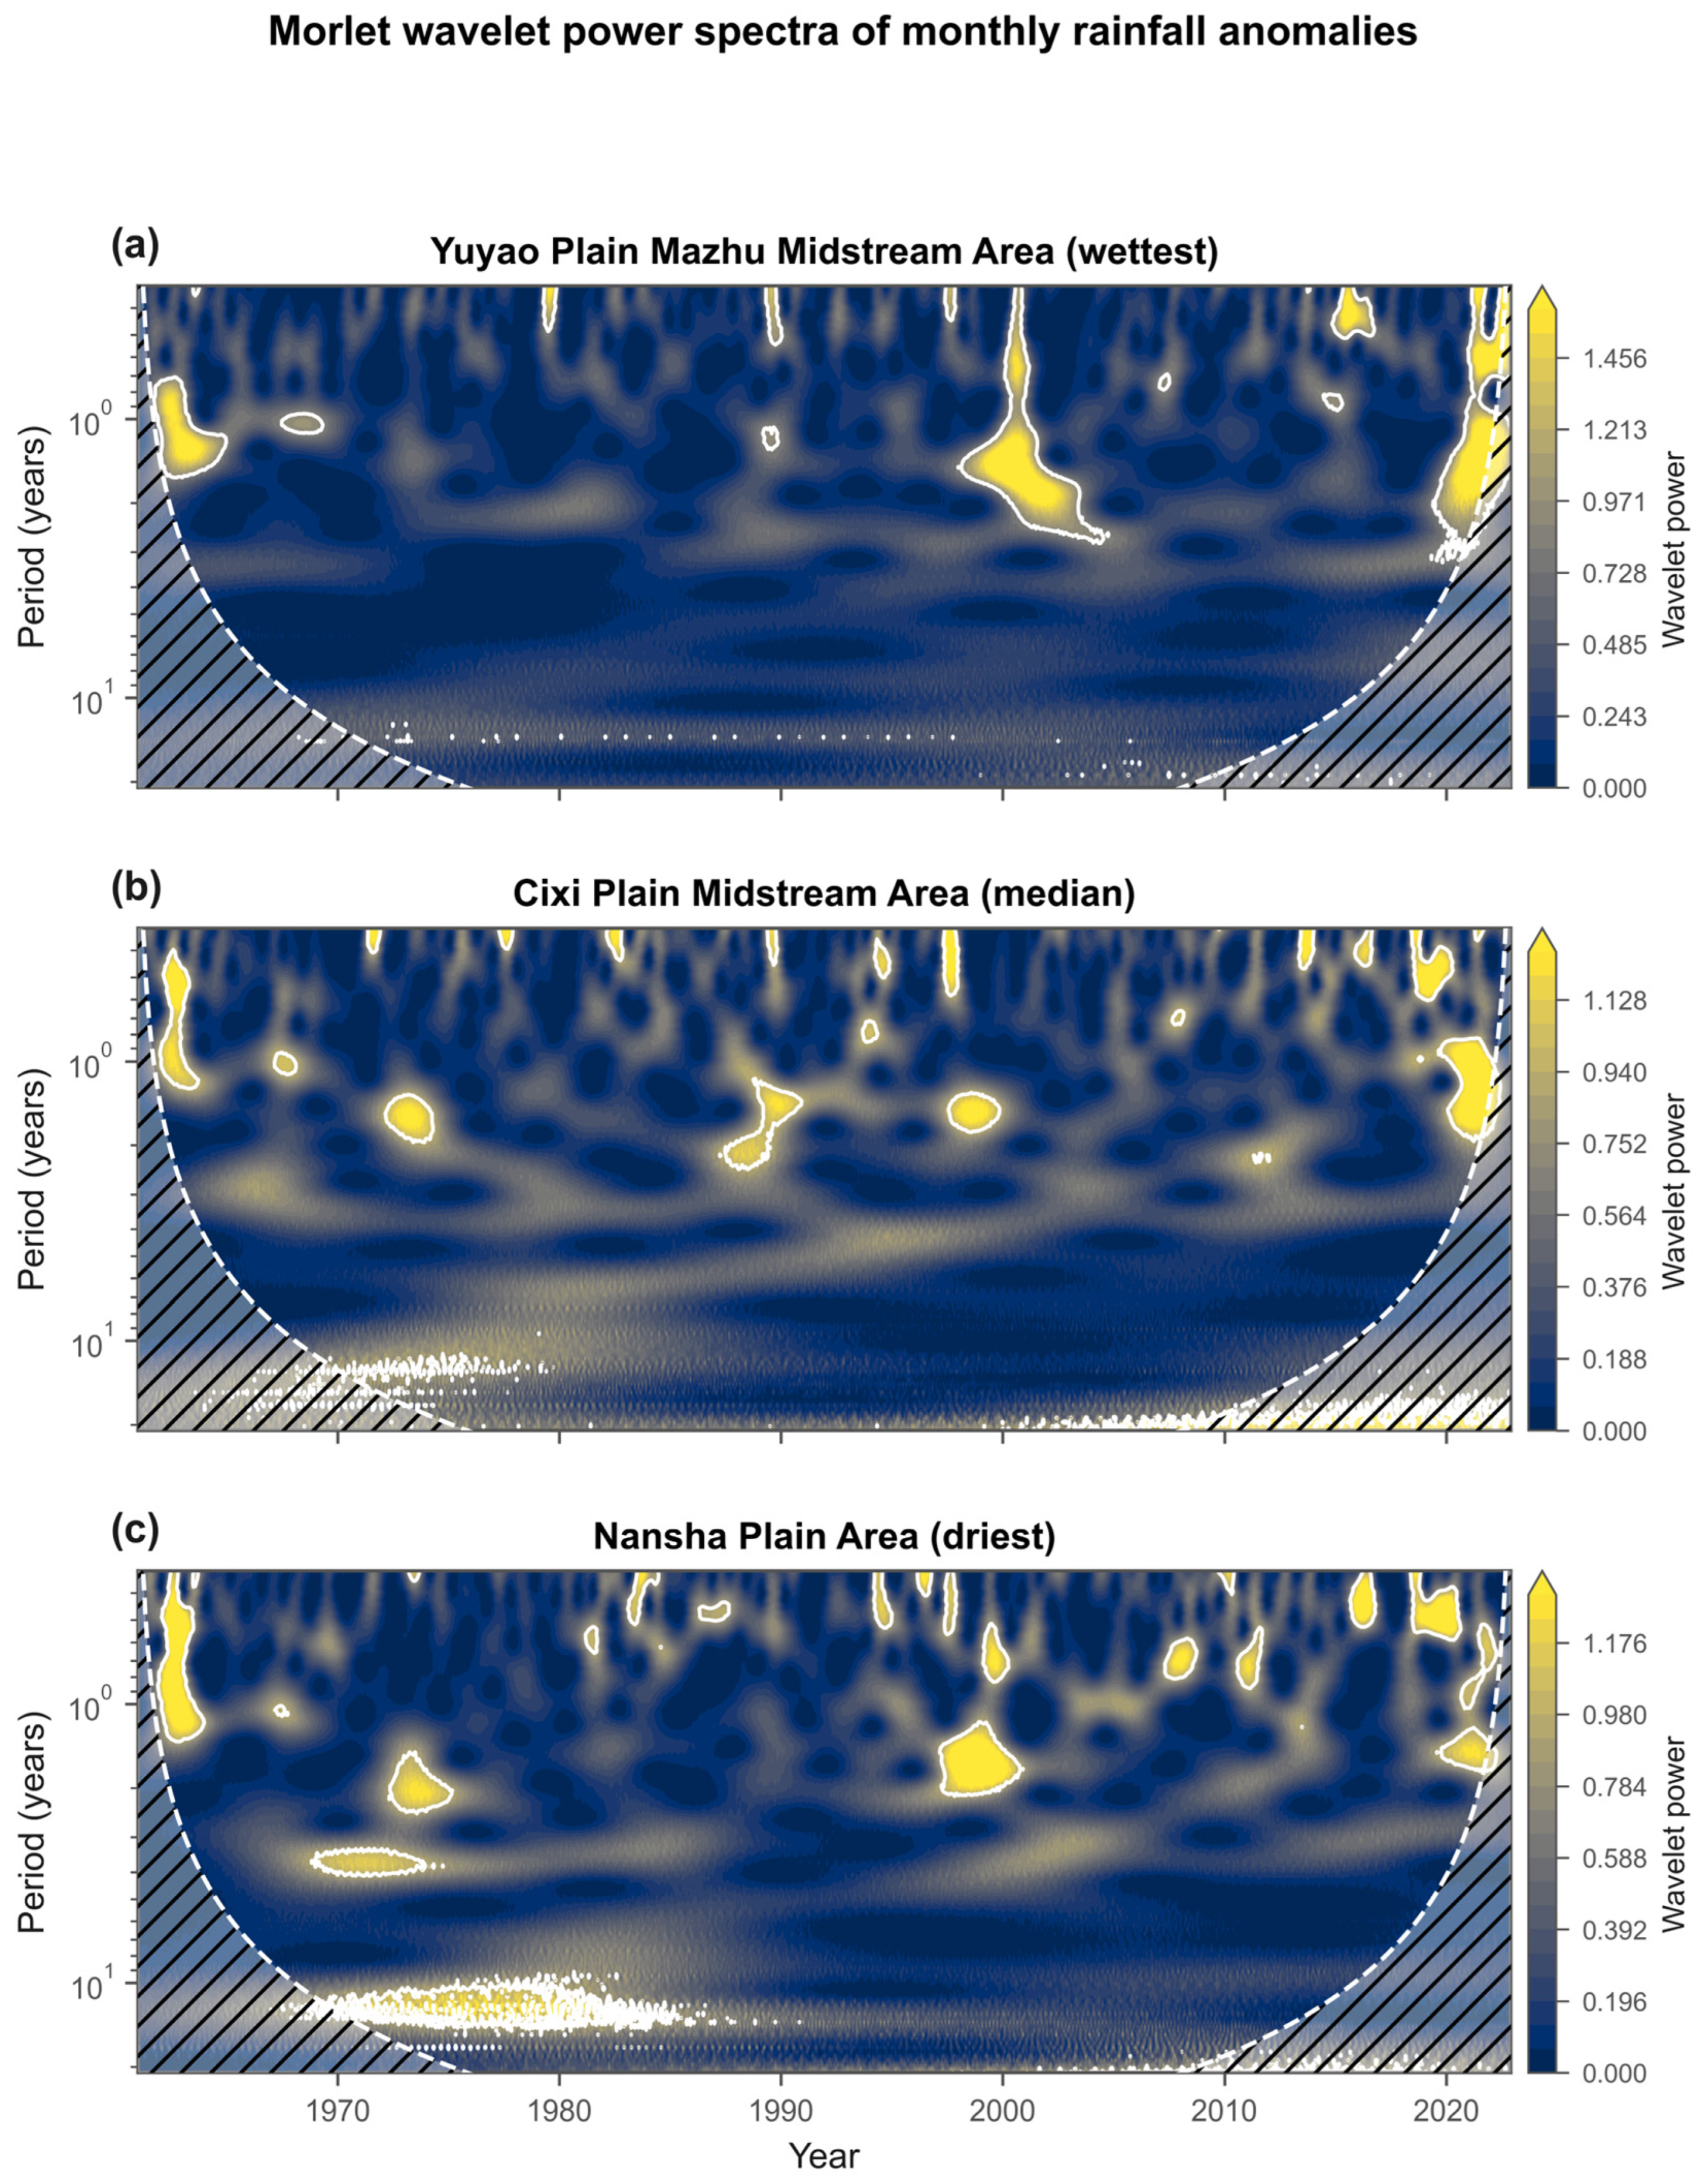
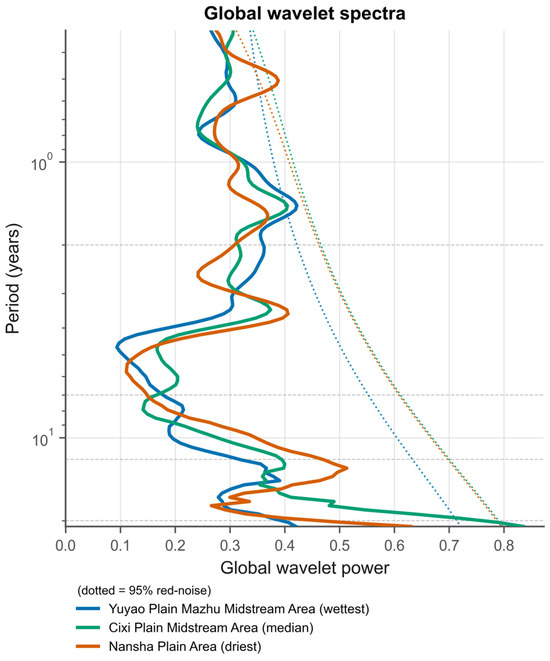
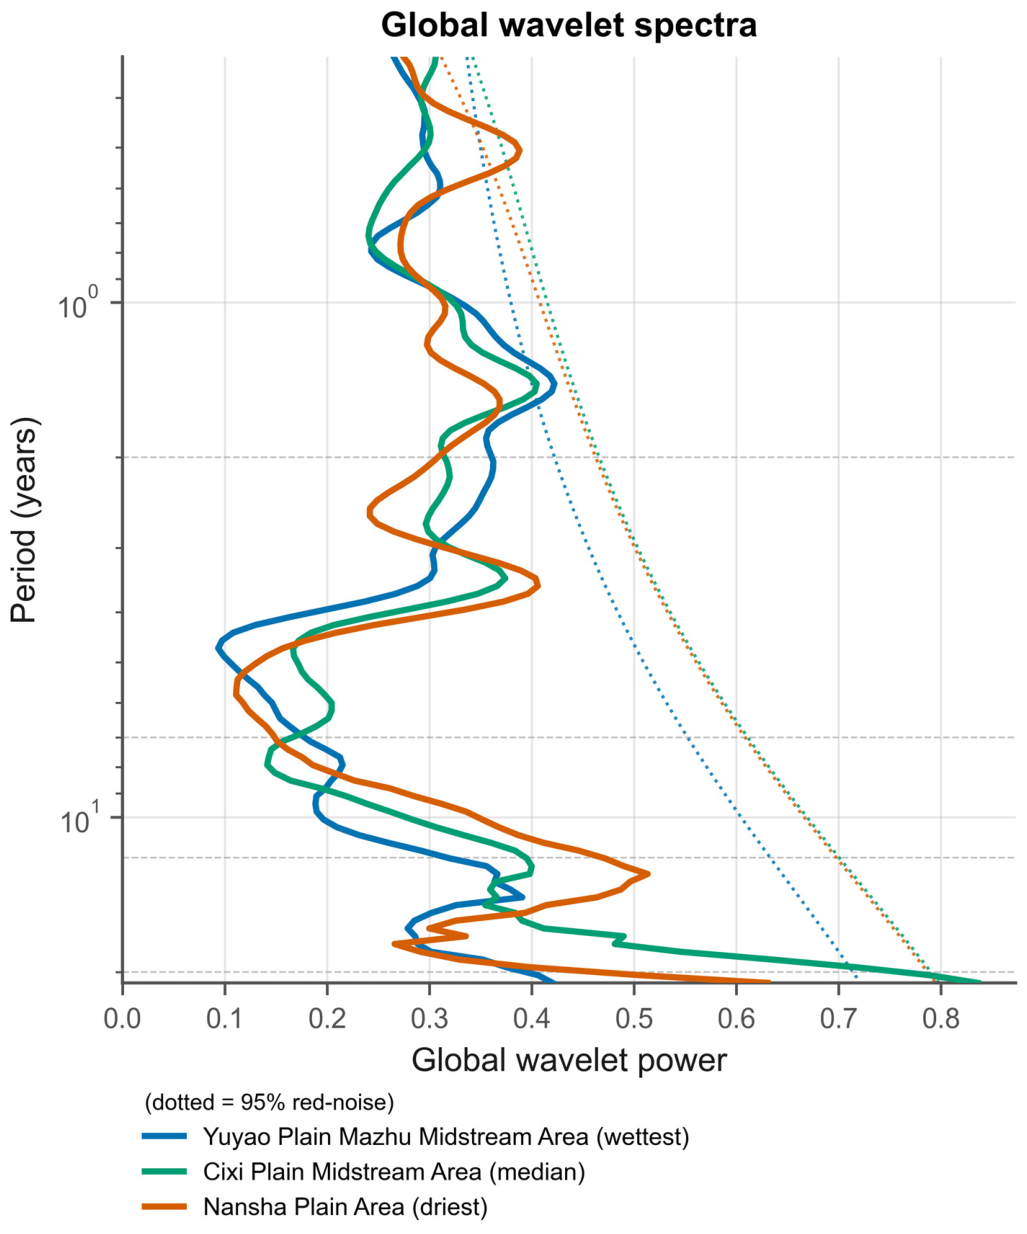
To resolve the dominant oscillation scales underlying this hierarchy, a Morlet continuous wavelet transform (CWT) was applied to the monthly rainfall anomalies of three sub-regions selected to span the rainfall range—the wettest (Yuyao Plain Mazhu Midstream Area), the median (Cixi Plain Midstream Area) and the driest (Nansha Plain Area); the corresponding spectra are shown in Figure 12 and Figure 13. The power spectra consistently reveal inter-decadal peaks at ~13–14 years, accompanied by a ~17-year peak in the median-rainfall Cixi Plain Midstream Area, alongside intermittent inter-annual modes at ~1.4–3.5 years. The spatial recurrence of the inter-decadal band points to a regionally shared low-frequency forcing. Because the 62-year record contains only four to five cycles of a 14-year oscillation, these inter-decadal peaks dominate the power spectrum but do not exceed the formal 95% red-noise confidence level; the significant power is instead concentrated in the inter-annual band (e.g., the 1.44-year mode in the wettest Mazhu area and the 0.51-year mode in the driest Nansha area).
Figure 12.
Morlet continuous wavelet power spectra of monthly rainfall anomalies for three representative sub-regions, showing inter-decadal (~13–14 yr) and inter-annual oscillation bands against the 95% red-noise level.
Figure 13.
Global (time-averaged) wavelet spectra for the three representative sub-regions, with the 95% red-noise confidence level; significant power concentrates in the inter-annual band.
3.4. Scale Dependence of Regional Correlations
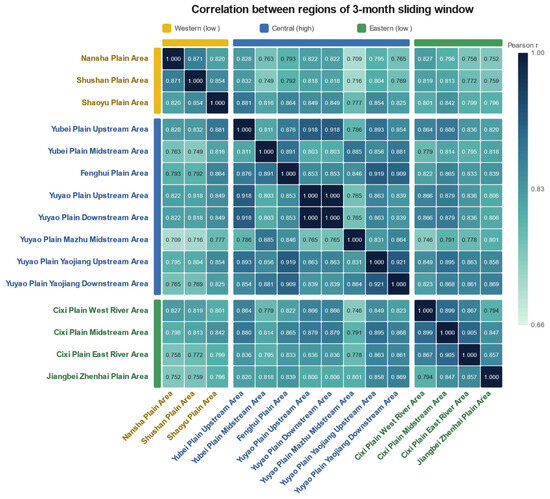
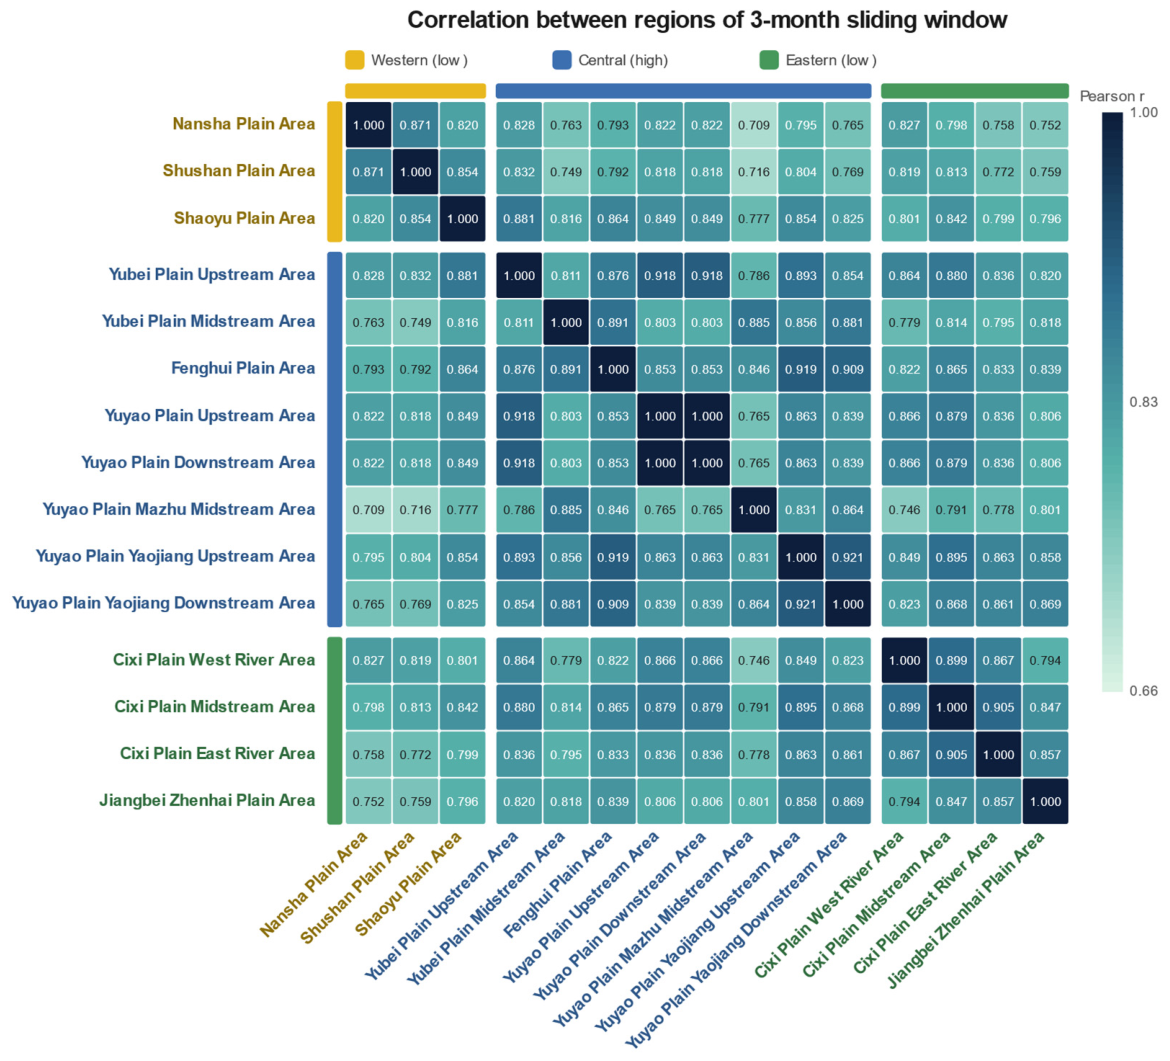
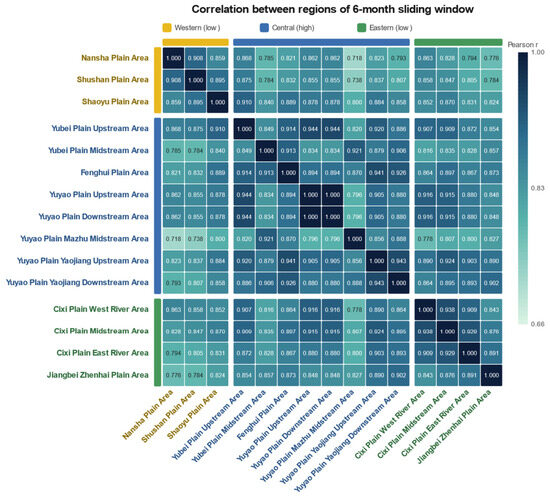
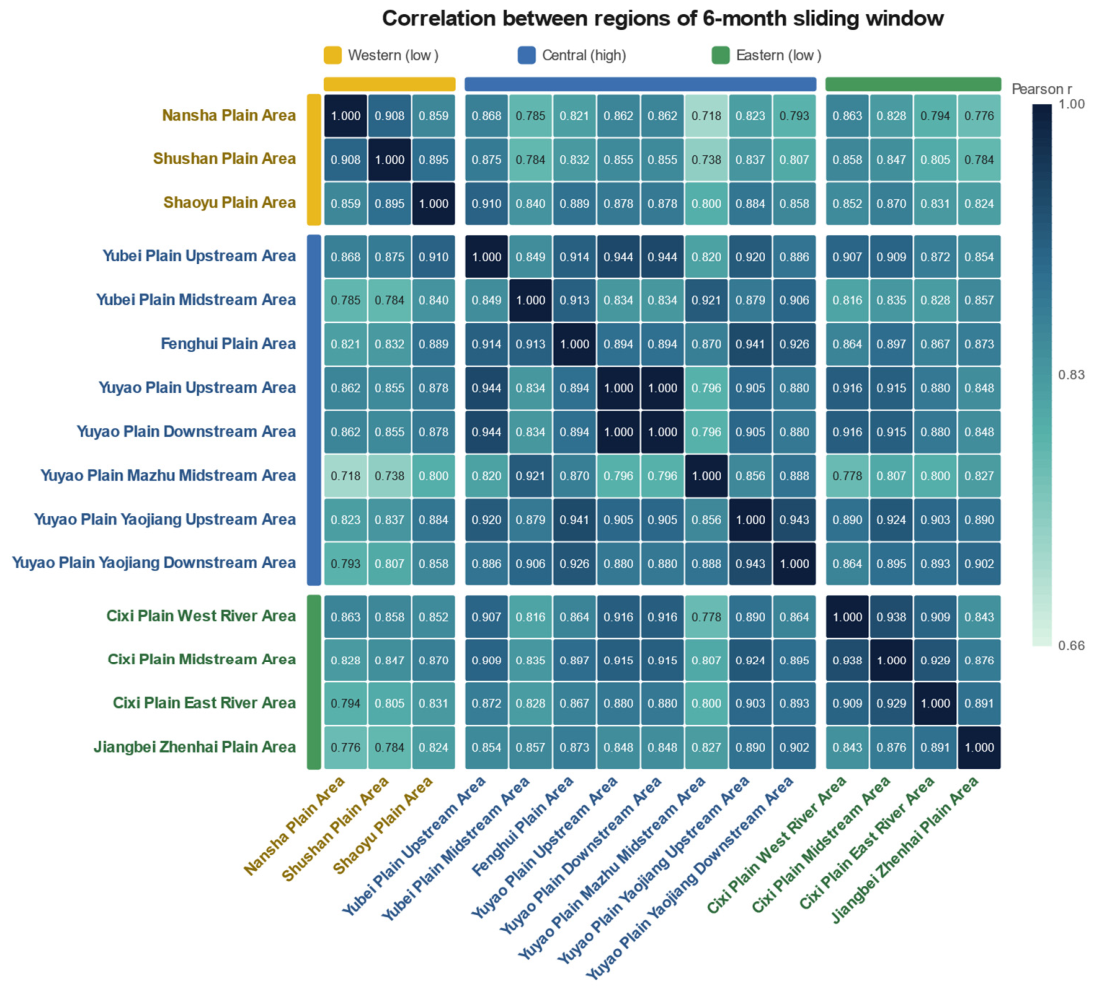
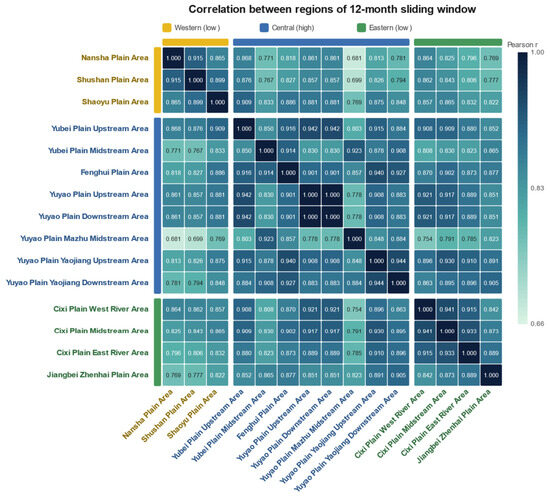
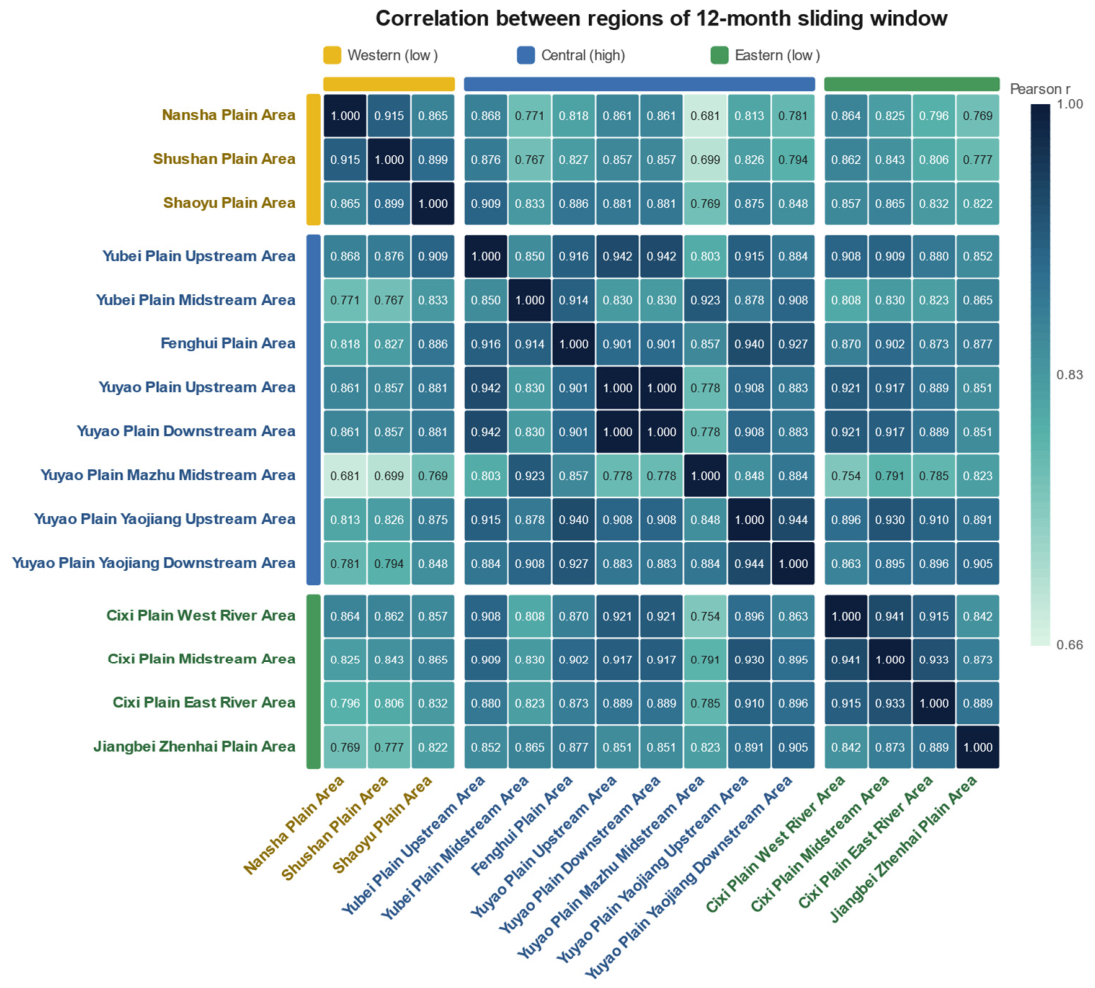
The degree to which different sub-regions experience synchronized rainfall events also depends strongly on the temporal scale, as shown by the correlation matrices in Figure 14, Figure 15 and Figure 16.
Figure 14.
Inter-regional Pearson correlation matrix of sub-region areal rainfall aggregated at the 3-month scale (1961–2022); cells are dimensionless correlation coefficients r (range 0–1).
Figure 15.
Inter-regional Pearson correlation matrix of sub-region areal rainfall aggregated at the 6-month scale (1961–2022); cells are dimensionless correlation coefficients r (range 0–1).
Figure 16.
Inter-regional Pearson correlation matrix of sub-region areal rainfall aggregated at the 12-month (annual) scale (1961–2022); cells are dimensionless correlation coefficients r (range 0–1).
At the 3-month scale (Figure 14), the average inter-regional correlation coefficient is 0.83, with values spanning from a minimum of 0.709 (between the Yuyao Plain Mazhu Midstream Area and the Nansha Plain Area) to exactly 1.000 (between the Yuyao Plain Upstream and Downstream areas, which share the same set of contributing rain gauges and Thiessen weights). Even at this short scale, distinct clusters emerge: the coastal cluster (Cixi sub-regions) already shows high internal coherence (e.g., between Cixi East River and Cixi Midstream), and the river basin cluster is tightly coupled. However, the Mazhu Midstream Area stands out as an anomaly, consistently showing lower correlations with most other regions. This decoupling likely reflects its unique hydro-geographic conditions and high local variability, which are more pronounced at seasonal scales.
When the aggregation period extends to 6 months (Figure 15), the average correlation rises slightly to 0.85, and the minimum correlation improves to 0.718. The coastal cluster, in particular, becomes significantly more coherent: for instance, the correlation between Cixi Midstream and Cixi West River increases from 0.899 to 0.938. This enhancement indicates that semi-annual aggregation effectively filters out high-frequency weather noise, revealing stronger underlying oceanic climate signals.
At the 12-month scale (Figure 16), the highest level of spatial synchronization is achieved. The average correlation reaches 0.87 (an increase of 0.04 from the 3-month scale), and the matrix ranges from 0.681 to 1.000. The coastal cluster reaches an average correlation of about 0.93, driven by common large-scale marine climate forcing. The hilly cluster shows the smallest increase, indicating that terrain-induced heterogeneity persists even at annual scales. A particularly noteworthy feature is the “increase-then-decrease” pattern observed for the Mazhu Midstream Area. Taking its correlation with the Nansha Plain Area as an example, the value first increases from 0.709 at 3 months to 0.718 at 6 months, but then unexpectedly decreases to 0.681 at 12 months. This anomaly suggests that while seasonal aggregation initially improves coherence, the annual total rainfall in the Mazhu area is decoupled from regional patterns. The most likely explanation is intense local hydrological cycling—moisture recycling from its dense network of rivers, wetlands, and paddy fields—which operates on timescales that differ from those of the large-scale climate drivers affecting the rest of the region.
Table 5 summarizes the evolution of correlation statistics across the three scales, highlighting the transition from locally dominated to regionally coherent behavior. Notably, the minimum inter-regional correlation is non-monotonic (0.709 at 3 months, rising to 0.718 at 6 months, then easing to 0.681 at 12 months), whereas the mean correlation increases monotonically from 0.83 to 0.87; this contrast indicates that semi-annual aggregation most improves coherence for the weakly coupled sub-regions (e.g., Mazhu–Nansha), while annual aggregation maximizes average coherence by further tightening the already strongly coupled coastal cluster.
Table 5.
Correlation statistics across time scales.
4. Discussion
The distinct “high-in-center, low-in-west” rainfall pattern is intimately linked to the region’s complex interaction between topography and atmospheric dynamics. The exceptional rainfall in the Mazhu Midstream Area (5.68 mm/day) acts as a hydrological hotspot. This phenomenon is primarily driven by the confluence zone enhancement effect: as the geographic convergence point for multiple tributaries of the Yao River system, this area naturally channels airflow, forcing low-level convergence and subsequent uplift that triggers precipitation. This physical mechanism is further amplified by land surface characteristics. The dense network of rivers, wetlands, and paddy fields significantly enhances local evapotranspiration, creating a moisture recycling feedback loop whereby locally generated water vapor supplements moisture advected from the ocean, sustaining high precipitation levels even during periods of weaker large-scale forcing. In sharp contrast, the Nansha Plain Area in the west records the lowest daily rainfall (3.47 mm/day). This deficit can be attributed to a combination of lee-side subsidence and terrain blocking effects. Located in the lee of the regional hill systems relative to the prevailing moisture-bearing southeasterlies, the area experiences descending air masses that suppress convective development. Furthermore, the transitional hills to the east act as a physical barrier, intercepting a portion of the low-level moisture transport from the East China Sea before it can reach the western plains. This distinct spatial gradient—where the central confluence zone receives nearly 64% more rainfall than the western rain shadow area—highlights the critical role of sub-regional geography in modulating the broader monsoon climate.
The analysis confirms that the Eastern Zhejiang region is undergoing a universal wetting process that remains statistically significant in 14 of the 15 sub-regions after pre-whitening. The universal upward trends in rainfall (Sen’s slopes from 4.00 to 7.99 mm/year across all 15 sub-regions, as detailed in the per-sub-region trend panels (Figure 3, Figure 4 and Figure 5) and summarized in Figure 6 and Figure 7) align strongly with the global “wet-gets-wetter” paradigm documented in the IPCC AR6 [8]. This local intensification mirrors the thermodynamic Clausius–Clapeyron relationship, where a warmer atmosphere holds and precipitates more moisture [9]. Specifically, our finding of a distinct “coastal enhancement” pattern—coastal areas show an average trend of 7.45 mm/year compared to 4.91 mm/year in hilly areas—is consistent with recent studies in the Yangtze River Delta and broader Zhejiang Province. These studies associate enhanced coastal precipitation with rising sea surface temperatures in the East China Sea, which may intensify the land–sea thermal contrast and the associated moisture flux convergence along the coast [16,17,18]. This coastal-enhanced wetting is broadly consistent with regional evidence that intensified anthropogenic activity and large-scale inter-basin water transfer are reshaping the hydrological and hydro-chemical regimes of eastern China’s diversion systems [30], and with findings that hydrological forcing strongly structures aquatic responses in major regulated basins [31]. Relative to such basin-scale and delta-scale studies, the present analysis contributes operational-scale (sub-region) granularity, resolving within-receiving-area gradients that province-wide assessments cannot capture.
Significantly, the temporal evolution of these trends reveals a non-linear trajectory, characterized by a marked post-2010 intensification of rainfall variability. The occurrence of record-breaking high rainfall events—such as the ~3250 mm annual total observed in Mazhu in 2021 (Figure 4)—signals a shift towards a more volatile hydro-climatic regime. This observation aligns with findings by Su et al. (2006) regarding increased extremes in the Yangtze Basin [14] and by Liu et al. (2020) on increasing destructive potential of landfalling tropical cyclones over China [7]. It suggests that the region is transitioning from a period of steady increase to one of high-amplitude oscillation.
Crucially, the Hurst exponent analysis provides a predictive dimension to these observations. The Hurst exponents suggest weak-to-moderate persistence in the historical rainfall series. However, Hurst analysis does not provide a deterministic forecast, and future rainfall evolution should be evaluated using climate model projections and physical attribution analysis. The 95% confidence intervals for Sen’s slopes exclude zero for all regions (Figure 7), reinforcing rather than qualifying the trend signal; their varying widths reflect the high inter-annual variability inherent to monsoon climates, which underscores the importance of using multiple complementary methods (MK for significance, Sen for magnitude, Hurst for persistence) to obtain a complete picture of hydrological change.
The findings have direct and profound implications for the Eastern Zhejiang Water Diversion Project. A notable source-receiver mismatch exists: the primary water source area—encompassing the Mazhu and Yao River Basin—has the highest rainfall but also the highest variability (see Figure 4, annual range 1250–3250 mm). Conversely, key recipient areas such as Nansha and Shaoyu have the lowest baseline rainfall but are experiencing the fastest increasing trends (Sen’s slopes of 7.95 and 4.00 mm/year, respectively; Figure 3 and Figure 5). This dynamic fundamentally challenges traditional operational criteria that assume stationarity. For instance, the post-2010 intensification of rainfall extremes suggests that static thresholds for “stop diversion” orders—currently based on a 24 h forecast of 25–50 mm of rain—may act as a rigid constraint that does not fully account for the increasing frequency of compound events (e.g., a local rainstorm coinciding with an upstream flood peak). Similarly, the high increasing trend observed in the coastal Cixi area (7.99 mm/year) implies a greater need for frequent pre-discharge operations at drainage nodes like the Sanxing Sluice to maintain safety margins. Taken together, the differentiated trends and the three-cluster structure argue for cluster-specific operation rules. The high-trend coastal core (e.g., Cixi at 7.99 mm/year) warrants trend-adjusted stop-diversion thresholds and tighter flood pre-release; the drier but steadily rising western Shaoxing river-valley group warrants priority dry-season allocation; and the Mazhu–Yubei outlier cluster, decoupled from the regional signal, warrants independent monitoring. The Pettitt change points clustered in 2006–2011 further argue for recalibrating operating rule curves on the post-shift sample rather than the full-period climatology. This region-specific, scale-aware operating logic operationalizes SDG 6, 11, and 13 at the project scale.
The scale-dependent characteristics of rainfall provide a blueprint for intelligent management. The observation that spatial correlation increases from 0.83 at the 3-month scale to 0.87 at the 12-month scale (Figure 14, Figure 15 and Figure 16 and Table 5) suggests that strategic planning should be coordinated regionally based on annual climate coherence, while short-term operations must account for local variability at seasonal scales. The moderate-to-strong Hurst exponents (Table 4) justify the inclusion of trend persistence as a dynamic weight factor in early warning models, enabling a transition from reactive to proactive, risk-based management. The anomalous behavior of the Mazhu Midstream Area—with its “increase-then-decrease” correlation pattern (Figure 14, Figure 15 and Figure 16)—marks it as a critical risk point in the water network, requiring independent monitoring separate from the regional average.
Several limitations should be acknowledged. First, although the 95% confidence intervals for Sen’s slopes exclude zero for all regions (Figure 7), confirming the robustness of the trend direction, the relatively wide intervals in the most variable sub-regions indicate that the precise rate of change still carries appreciable uncertainty. This highlights the value of longer observational records and ensemble projections from climate models to further constrain the magnitude estimates. Second, this study focuses on rainfall amount and variability; future work should incorporate other hydro-climatic variables such as evapotranspiration, soil moisture, and runoff to provide a more complete water balance assessment. Third, the physical mechanisms linking large-scale climate drivers (ENSO, PDO, East Asian monsoon intensity) to the observed trends warrant further investigation using causal detection methods. Finally, the engineering implications discussed here are qualitative; quantitative optimization models that integrate the scale-dependent correlation structures and Hurst persistence into reservoir operation rules would be a valuable extension. In addition, although the 24-gauge Thiessen-weighted design makes the sub-region series far more representative than single-gauge sampling, gauge spacing in the western transitional hills remains sparser than on the coastal plain, so sub-grid orographic rainfall in the Yao-River headwaters may be partly smoothed. These sampling-network limitations may affect the estimated spatial gradients and local trend magnitudes, especially in hilly areas. However, the broad regional upward tendency is less likely to be fully explained by sampling limitations. Rainfall over the higher western terrain will be discussed in the future work.
5. Conclusions
Based on the systematic analysis of 62 years of daily rainfall data (1961–2022) from a 24-gauge network (resolved into 15 sub-region areal series) in the water-receiving area of the Eastern Zhejiang Water Diversion Project, we draw the following five conclusions:
Spatial pattern: The region exhibits a distinct “high-in-center, low-in-west” distribution structure. The central zone, exemplified by the Yuyao Plain Mazhu Midstream Area, serves as a “rainfall chimney,” receiving 64% more daily rainfall (5.68 mm) than the western zone’s Nansha Plain Area (3.47 mm). This heterogeneity appears to be shaped largely by the confluence zone effect of the Yao River system and local topographic lifting.
Universal wetting trend: All 15 sub-regions show increasing rainfall trends, of which 14 remain statistically significant () after trend-free pre-whitening (only the Jiangbei–Zhenhai Plain Area becomes marginal, ); the intensity of this change is spatially differentiated. A clear gradient of “coastal (average 7.45 mm/year) > riverine (6.38 mm/year) > hilly (4.91 mm/year)” has been identified (Figure 6). This suggests that coastal zones may be more responsive to climate change, exhibiting approximately 50% larger trend magnitudes than inland hilly areas, a contrast that marine warming.
Trend persistence: The Hurst exponent analysis confirms the robustness of these changes. With values consistently ranging between 0.56 and 0.63, the study verifies that the observed wetting trends possess “long-term memory.” This finding is consistent with a persistent upward tendency in rainfall that may continue in the near term; attribution to specific external forcing, and discrimination from low-frequency oscillations, are beyond the scope of this study.
Scale dependence: Rainfall characteristics are strictly scale-dependent. As the analysis window widens from 3 to 12 months, the amplitude of trend fluctuations collapses by approximately 90% (from ±16 mm to ±1.7 mm), while inter-regional spatial correlation strengthens from 0.83 to 0.87. This pattern suggests that short-term rainfall variability is more locally heterogeneous, while longer aggregation scales are more spatially coherent and may reflect broader climate influences.
Regional anomaly: The Yuyao Plain Mazhu Midstream Area is identified as a unique hydro-geographic entity. Its “increase-then-decrease” correlation pattern—correlation with other regions first increases from 3 to 6 months, then decreases at 12 months—reveals a decoupling behavior: while it synchronizes with the region seasonally, its annual total rainfall often diverges due to its intense local hydrological cycling (enhanced evapotranspiration and moisture recycling from its dense water network). This anomaly marks it as a critical risk point in the water network, requiring independent monitoring and adaptive management strategies separate from the regional average.
In summary, this study provides a comprehensive, multi-scale, and multi-method assessment of rainfall dynamics in a climate-sensitive coastal water-receiving area. The findings offer actionable scientific insights for climate-adaptive scheduling of water diversion projects and highlight the necessity of moving beyond one-size-fits-all approaches toward region-specific, scale-aware management strategies in support of clean water, resilient cities, and climate action.
Author Contributions
Conceptualization, Y.Y. and D.H.; methodology, Y.Y. and D.H.; software, T.Z. and X.Z.; validation, Y.Y. and D.H.; formal analysis, F.Z. and X.Z.; investigation, T.Z. and F.Z.; resources, Y.Y. and D.H.; data curation, T.Z. and X.Z.; writing—original draft preparation, Y.Y. and D.H.; writing—review and editing, Y.Y. and D.H.; visualization, F.Z. and X.Z.; supervision, Y.Y. and D.H.; project administration, Y.Y. All authors have read and agreed to the published version of the manuscript.
Funding
This work is supported by the Water Conservancy Science and Technology Program of Zhejiang Province (RC2413, RC2433), the Postdoctoral Fellowship of CPSF (GZC20251267, 2025M781799) and Zhejiang Province (ZJ2025075), the Zhejiang Provincial Natural Science Foundation (LMS26E090004), and the Open Research Foundation of Key Laboratory of Port, Waterway & Sedimentation Engineering (Yk225001-C2) and Key Laboratory of Sediment Science and Northern River Training (IWHR-SEDI-2025-02).
Institutional Review Board Statement
Not applicable.
Informed Consent Statement
Not applicable.
Data Availability Statement
The data that support the findings of this study are available from the corresponding authors upon reasonable request.
Conflicts of Interest
Authors Yu Yang, Tianli Zeng, Xiongwei Zheng and Fen Zhou were employed by the company Zhejiang Design Institute of Water Conservancy and Hydroelectric Power. The remaining authors declare that the research was conducted in the absence of any commercial or financial relationships that could be construed as a potential conflict of interest.
Abbreviations
The following abbreviations are used in this manuscript:
| CV | Coefficient of variation |
| ENSO | El Niño–Southern Oscillation |
| IPCC | Intergovernmental Panel on Climate Change |
| MK | Mann–Kendall |
| PDO | Pacific Decadal Oscillation |
| SNHT | Standard Normal Homogeneity Test |
References
- Zhai, P.; Zhang, X.; Wan, H.; Pan, X. Trends in total precipitation and frequency of daily precipitation extremes over China. J. Clim. 2005, 18, 1096–1108. [Google Scholar] [CrossRef] [Scilit]
- Ding, Y.; Chan, J.C.L. The East Asian summer monsoon: An overview. Meteorol. Atmos. Phys. 2005, 89, 117–142. [Google Scholar] [CrossRef] [Scilit]
- Wang, B.; Wu, R.; Fu, X. Pacific–East Asian teleconnection: How does ENSO affect East Asian climate? J. Clim. 2000, 13, 1517–1536. [Google Scholar] [CrossRef] [Scilit]
- Piao, S.; Ciais, P.; Huang, Y.; Shen, Z.; Peng, S.; Li, J.; Zhou, L.; Liu, H.; Ma, Y.; Ding, Y.; et al. The impacts of climate change on water resources and agriculture in China. Nature 2010, 467, 43–51. [Google Scholar] [CrossRef] [Scilit] [PubMed]
- Liu, L.; Wang, Y. Trends in landfalling tropical cyclone–induced precipitation over China. J. Clim. 2020, 33, 2223–2235. [Google Scholar] [CrossRef] [Scilit]
- Mei, W.; Xie, S.P. Intensification of landfalling typhoons over the northwest Pacific since the late 1970s. Nat. Geosci. 2016, 9, 753–757. [Google Scholar] [CrossRef] [Scilit]
- Liu, L.; Wang, Y.; Zhan, R.; Xu, J.; Duan, Y. Increasing destructive potential of landfalling tropical cyclones over China. J. Clim. 2020, 33, 3731–3743. [Google Scholar] [CrossRef] [Scilit]
- IPCC. Climate Change 2021: The Physical Science Basis. In Contribution of Working Group I to the Sixth Assessment Report of the Intergovernmental Panel on Climate Change; Cambridge University Press: Cambridge, UK, 2021. [Google Scholar]
- Seneviratne, S.I.; Nicholls, N.; Easterling, D.; Goodess, C.M.; Kanae, S.; Kossin, J.; Luo, Y.; Marengo, J.; McInnes, K.; Rahimi, M.; et al. Changes in climate extremes and their impacts on the natural physical environment. In Managing the Risks of Extreme Events and Disasters to Advance Climate Change Adaptation; Field, C.B., Barros, V., Stocker, T.F., Qin, D., Dokken, D.J., Ebi, K.L., Mastrandrea, M.D., Mach, K.J., Plattner, G.-K., Allen, S.K., et al., Eds.; Cambridge University Press: Cambridge, UK, 2012; pp. 109–230. [Google Scholar]
- Madakumbura, G.D.; Thackeray, C.W.; Norris, J.; Goldenson, N.; Hall, A. Anthropogenic influence on extreme precipitation over global land areas seen in multiple observational datasets. Nat. Commun. 2021, 12, 3944. [Google Scholar] [CrossRef] [Scilit] [PubMed]
- Kotz, M.; Levermann, A.; Wenz, L. The effect of rainfall changes on economic production. Nature 2022, 601, 223–227. [Google Scholar] [CrossRef] [Scilit] [PubMed]
- Zhai, P.; Sun, A.; Ren, F.; Liu, X.; Gao, B.; Zhang, Q. Changes of climate extremes in China. Clim. Change 1999, 42, 203–218. [Google Scholar] [CrossRef] [Scilit]
- Long, D.; Yang, W.; Scanlon, B.R.; Hong, Y.; Chen, X. South-to-North Water Diversion stabilizing Beijing’s groundwater levels. Nat. Commun. 2020, 11, 3665. [Google Scholar] [CrossRef] [Scilit] [PubMed]
- Su, B.D.; Jiang, T.; Jin, W.B. Recent trends in observed temperature and precipitation extremes in the Yangtze River basin, China. Theor. Appl. Climatol. 2006, 83, 139–151. [Google Scholar] [CrossRef] [Scilit]
- Li, H.; Chen, H.; Wang, H. Effects of anthropogenic activity emerging as intensified extreme precipitation over China. J. Geophys. Res. Atmos. 2017, 122, 6899–6914. [Google Scholar] [CrossRef] [Scilit]
- Zhou, T.; Gong, D.; Li, J.; Li, B. Detecting and understanding the multi-decadal variability of the East Asian summer monsoon—Recent progress and state of affairs. Meteorol. Z. 2009, 18, 455–467. [Google Scholar] [CrossRef] [Scilit]
- Jiang, X.; Luo, Y.; Zhang, D.-L.; Wu, M. Urbanization enhanced summertime extreme hourly precipitation over the Yangtze River Delta. J. Clim. 2020, 33, 5809–5826. [Google Scholar] [CrossRef] [Scilit]
- Labat, D. Recent advances in wavelet analyses: Part 1. A review of concepts. J. Hydrol. 2005, 314, 275–288. [Google Scholar] [CrossRef] [Scilit]
- Fan, C.; Yin, S.; Chen, D. Spatial correlations of daily precipitation over mainland China. Int. J. Climatol. 2021, 41, 6350–6365. [Google Scholar] [CrossRef] [Scilit]
- Wang, Q.; Zhang, R.; Qi, J.; Zeng, Z.; Liu, J.; Zhang, Y. An improved daily standardized precipitation index dataset for mainland China from 1961 to 2018. Sci. Data 2022, 9, 124. [Google Scholar] [CrossRef] [Scilit] [PubMed]
- Mann, H.B. Nonparametric tests against trend. Econometrica 1945, 13, 245–259. [Google Scholar] [CrossRef] [Scilit]
- Kendall, M.G. Rank Correlation Methods, 4th ed.; Charles Griffin: London, UK, 1975. [Google Scholar]
- Sen, P.K. Estimates of the regression coefficient based on Kendall’s tau. J. Am. Stat. Assoc. 1968, 63, 1379–1389. [Google Scholar] [CrossRef]
- Hurst, H.E. Long-term storage capacity of reservoirs. Trans. Am. Soc. Civ. Eng. 1951, 116, 770–799. [Google Scholar] [CrossRef] [Scilit]
- Tyralis, H.; Koutsoyiannis, D. On the prediction of persistent processes using the output of deterministic models. Hydrol. Sci. J. 2017, 62, 2083–2102. [Google Scholar] [CrossRef] [Scilit]
- Torrence, C.; Compo, G.P. A practical guide to wavelet analysis. Bull. Am. Meteorol. Soc. 1998, 79, 61–78. [Google Scholar] [CrossRef] [Scilit]
- Gilbert, R.O. Statistical Methods for Environmental Pollution Monitoring; Van Nostrand Reinhold: New York, NY, USA, 1987. [Google Scholar]
- Yue, S.; Wang, C.Y. Applicability of prewhitening to eliminate the influence of serial correlation on the Mann–Kendall test. Water Resour. Res. 2002, 38, 1068. [Google Scholar] [CrossRef] [Scilit]
- Pettitt, A.N. A non-parametric approach to the change-point problem. J. R. Stat. Soc. Ser. C Appl. Stat. 1979, 28, 126–135. [Google Scholar] [CrossRef] [Scilit] [PubMed]
- Wang, Y. Climatic Changes and Anthropogenic Activities Driving the Increase in Nitrogen: Evidence from the South-to-North Water Diversion Project. Water 2021, 13, 2517. [Google Scholar] [CrossRef] [Scilit]
- Fang, L.; Mi, W.; Li, Y.; Ai, X.; Bi, Y. Water level fluctuations shape phytoplankton community in the Xiangxi Bay from Three Gorges Reservoir. J. Environ. Sci.-China 2025, 157, 111–122. [Google Scholar] [CrossRef] [Scilit] [PubMed]

Disclaimer/Publisher’s Note: The statements, opinions and data contained in all publications are solely those of the individual author(s) and contributor(s) and not of MDPI and/or the editor(s). MDPI and/or the editor(s) disclaim responsibility for any injury to people or property resulting from any ideas, methods, instructions or products referred to in the content. |
© 2026 by the authors. Licensee MDPI, Basel, Switzerland. This article is an open access article distributed under the terms and conditions of the Creative Commons Attribution (CC BY) license.