


Abstract
As a mechanism for ensuring the normal and safe operation of the transportation system, transportation infrastructure plays an important role in improving residents’ consumption environment. This study is grounded in the panel data of 288 prefecture-level cities in China spanning the period from 2015 to 2023. Leveraging Stata 18.0 software, ordinary least squares (OLS) regression is employed to perform baseline estimations. Subsequently, a mediation effect model is utilized to empirically test the transmission mechanism underlying the efficiency of commercial and trade circulation. To probe into the characteristics of spatial spillover, the Spatial Durbin Model (SDM) is applied for further analysis. Finally, subgroup regression analysis is conducted to examine the heterogeneous effects across different groups. Through this systematic analytical framework, this study aims to explore the intricate relationships between transportation infrastructure, the efficiency of commercial and trade circulation, and the upgrading of residents’ consumption structure. The results show the following: (1) There is a significant positive correlation between transportation infrastructure improvement and the upgrading of residents’ consumption structure. This positive association remains robust after a series of robustness checks, and spatial effect tests further reveal a positive spatial spillover effect between the two. (2) The results of the mechanism test show that the efficiency of commercial and trade circulation plays a mediating role between transportation infrastructure and the upgrading of residents’ consumption structure. (3) The correlation between transportation infrastructure and the upgrading of residents’ consumption structure varies significantly depending on the development level of the city where the residents live, the degree of spatial connection, the presence of national logistics hubs, and whether it is currently located along a strategic transportation route. This study provides a new perspective for the relevant field: the positive correlation between transportation infrastructure and the upgrading of residents’ consumption structure should not merely be regarded as a tool for stimulating domestic demand, but rather should be seen as an important institutional environment and governance arrangement that promotes the transformation of residents’ consumption patterns towards higher quality and lower carbon emissions, and thereby supports regional sustainable development.
1. Introduction and Literature Review
With China’s economy entering the stage of high-quality development, consumption, as the key fulcrum of smooth domestic economic circulation, is replacing the domestic investment and foreign trade sectors and becoming the core driving force for promoting China’s economic growth. The 15th Five-Year Plan for National Economic and Social Development of the People’s Republic of China, which was approved by the National Two Sessions in 2026, has placed the vigorous promotion of consumption at the core position of expanding domestic demand, stabilizing growth and benefiting people’s livelihood [1]. However, it should be noted that when the economic operation faces external shocks or insufficient internal kinetic energy, although incremental measures to promote consumption will help to quickly restore market confidence and smooth production and circulation, the pull of incremental consumption policy on demand is often limited to the window period of policy implementation, so it is difficult to form lasting endogenous consumption kinetic energy. Frequent incremental consumption stimulus policies may also have a significant crowding-out effect [2]. Therefore, the current consumption promotion policy in China tends to optimize the consumption structure. From the perspective of residents, under the guidance of national policies and guidelines, they strive to upgrade their consumption structure and aspire for a better life, which is their inherent pursuit. Moreover, from a long-term perspective, the upgrading of residents’ consumption structure can also drive the transformation and upgrading of the supply side, promoting the industrial structure to move towards higher-end, intelligent and green directions. However, the expansion of residents’ consumption expenditure and the alteration of their consumption structure are influenced by numerous factors. How to promote the upgrading of residents’ consumption structure has become a practical issue that cannot be ignored in the current battle to boost consumption.
Transportation infrastructure is built to ensure the normal and safe operation of the transportation system. In order to build a more perfect transportation network and support the development of various fields of the country, China has continuously increased investment and construction in the field of transportation infrastructure, and remarkable results have been achieved in recent years. By 2024, the total mileage of the national comprehensive three-dimensional transportation network will exceed 6 million kilometers, and the main skeleton of the national comprehensive three-dimensional transportation network “6 axes, 7 corridors and 8 channels” has been completed with a mileage of more than 260,000 km, with a completion rate of about 90%. With the continuous improvement of transportation infrastructure, China’s overall commercial circulation system has been further enhanced. Therefore, in the process of accelerating the construction of a unified national market, the efficiency of trade circulation in various regions has been improved to varying degrees, and lower-cost and higher-efficiency services have been provided for the connection between regional production and consumption. In other words, assuming other conditions remain unchanged, whether residents in a region are willing to increase the proportion of leisure consumption and development consumption in their own consumption expenditure still needs to be answered clearly from the theoretical and empirical perspectives: can the improvement of transportation infrastructure in a region enhance the efficiency of regional trade circulation and further promote the upgrading of regional residents’ consumption structure?
There are two main bodies of literature related to this study: one is the study of the economic effects of transportation infrastructure. Overall, scholars generally agree that the construction of transportation infrastructure can bring positive impetus to regional economic development. On the one hand, the improvement of the transportation network can not only improve the local welfare level [3,4], but can also promote local and neighboring residents’ consumption expenditure through spatial spillover effects [5], promoting factor flow to enhance the economic resilience of adjacent areas [6], and this spillover effect presents inverted-U-shaped attenuation characteristics with distance [7]. On the other hand, as the hardware foundation of the circulation system, the improvement of transportation infrastructure can improve the efficiency of commercial circulation [8] and promote high-quality economic development [9]. In addition, transportation infrastructure can also form a synergistic effect with the digital economy, boosting the construction of a unified national market [10] and urban–rural integration [11]. However, scholars have found that the economic impact of transportation infrastructure is not one-way but exhibits nonlinear characteristics and complex heterogeneity. Jia et al. [12] discovered a significant inverted-U-shaped relationship between transportation infrastructure construction and regional economic disparities. Ren et al. [13] found that the agglomeration effect caused by the opening of high-speed rail in core cities may temporarily widen regional disparities. Wu et al. [14] found that the impact of transportation infrastructure construction on regional income growth and convergence varies significantly among regions with different economic structures. Gutman and Marashenko [15] conducted a study based on data from the Russian region and also found that there are significant variations in the economic effects of transportation infrastructure and regional differences. It is true that income is a key variable of residents’ consumption expenditure; perhaps transportation infrastructure will also have a certain impact on the upgrading of residents’ consumption structure. According to the consumption function theory, income is the most crucial variable determining the consumption structure and level of residents [16,17]. Moreover, the existing literature has confirmed that transportation infrastructure has a significant positive impact on residents’ income, and it should also have an important influence on the consumption structure of residents. Regrettably, although the economic effects of transportation infrastructure have received considerable attention, few studies have integrated it into a unified framework with the resident consumption structure for examination. Moreover, no response has been provided from the perspective of regional sustainable development regarding whether the aforementioned transmission path exists and how it functions.
The second is the study of the influencing factors of upgrading residents’ consumption structure. At the microlevel, scholars have discussed the factors affecting the upgrading of the consumption structure of rural residents, urban households, and urban and rural households, which involve residents’ income [17,18], social protection [19], habit formation or consumption preference [20,21], financial knowledge [22], Internet finance [23,24], urban–rural digital divide [25], credit acquisition [26], payment technology [27], etc. At the macrolevel, scholars are concerned about the factors affecting the upgrading of residents’ consumption structure in a region. From the dimension of sample selection, the existing literature can be divided into two categories: one is to explore housing prices with province-level data as samples [28,29]; regional circulation efficiency [30], Internet popularization [31], digital consumption environment [32,33], market accessibility [34], environmental regulation [35], starter economy [36], and other macro variables have an impact on the upgrading of residents’ consumption structure. The second is to study the impact of urbanization and population density [37], digital consumption [38], digital economy [39] and industrial wage changes [40] on the upgrading of residents’ consumption structure by taking prefecture-level data as samples.
Generally speaking, previous studies have revealed that the upgrading of residents’ consumption structure is affected by many factors, but they pay less attention to how transportation infrastructure promotes the upgrading of residents’ consumption structure, and there is little empirical analysis on the relationship between transportation infrastructure, commercial circulation efficiency and the upgrading of residents’ consumption structure. Based on the city-level panel data, this study will construct an econometric regression model to empirically analyze the impact of transportation infrastructure on the upgrading of residents’ consumption structure and its mechanism.
The possible marginal contributions lie in: firstly, theoretically explaining the inherent logic of improving transportation infrastructure, which can help improve the efficiency of commercial circulation, and then promote the upgrading of residents’ consumption structure in the dimensions of time and space; secondly, the empirical results based on city-level data provide new strong support for the decision-making of relevant departments. Considering that China’s economy has entered a new stage and avoiding different statistical standards of data, the panel data of 288 prefecture-level cities in China from 2015 to 2023 since China’s economic growth entered the new normal state are used to empirically test the above mechanism, and a three-dimensional econometric model is constructed to verify the spatial spillover effect of transportation infrastructure improvement on the upgrading of residents’ consumption structure. Discussing the heterogeneity of cities along different development levels, different economic locations, different hub functions, and current strategic corridors can enrich and expand the study of the economic effects of transportation infrastructure and provide a decision-making basis for decision-making departments.
2. Theoretical Analysis
2.1. Direct Effect of Transportation Infrastructure on Residents’ Consumption Structure Upgrade
Transportation infrastructure is built to ensure the normal and safe operation of the transportation system. In modern society, a complete system of facilities that can support the safe and smooth operation of an integrated transportation network generally includes highways, tracks, tunnels, waterways, airports, elevated roads, stations, port terminals, ventilation booths, electromechanical equipment, power supply systems, communication signals and road markings. In essence, the improvement of transportation infrastructure has brought about a significant space–time compression effect, that is, shortening the psychological and physical distance between residents and consumption destinations, and expanding residents’ “activity radius” and “consumption choice set”. Modern consumption theory holds that consumers, as rational decision-makers, will plan their consumption decisions based on their lifetime expected income and the long-term costs of obtaining goods and services [41,42]. According to this theory, when improvements in transportation infrastructure reduce the time and monetary costs for residents to travel, it is equivalent to permanently lowering the overall cost for residents to obtain goods and services from other places, thereby releasing the actual purchasing power of households. This effect can have a direct impact on the upgrading of residents’ consumption structure from the following two aspects: First, the construction of transportation infrastructure is accelerating the formation of a modern transportation network, which can reduce residents’ travel costs and enable households to reallocate expenditures to development and enjoyment consumption on the premise of maintaining basic living expenses unchanged, thus promoting the upgrading of residents’ consumption structure [43]. Secondly, with the connectivity of transportation infrastructure, residents have more frequent cross-regional exchanges, which gives residents the opportunity to access diversified and high-quality goods and services in different regions, thus bringing about cross-regional blending of consumption culture, forming new consumption concepts and lifestyles of residents, and accelerating the transformation of local residents’ consumption patterns from traditional “frugal” consumption to “quality” consumption. In China’s practice, the aforementioned impacts have indeed occurred. With the rapid expansion of the high-speed rail network, the fastest travel time from Beijing Chaoyang to Shenyang and then to Changbaishan has been shortened to 4 h and 33 min and 1 h and 53 min, respectively. The journey of “traveling across thousands of miles” in one day has become a reality. “Weekend trips” and “cross-provincial tours” have transformed from being “luxurious” to becoming a common occurrence. The shift of residents’ travel mode from private cars to high-speed rail is itself a low-carbon choice. Moreover, the savings in travel costs that residents obtain can be used for tourism, training, cultural experiences and other consumption, which also reflects the transformation from material consumption to service consumption in terms of consumption content. This is in line with the inherent consistency of the quality-oriented and low-carbon direction contained in the upgrading of residents’ consumption structure.
Based on this, this study proposes the following hypothesis.
Hypothesis H1:
Improvement of transportation infrastructure can promote upgrading of residents’ consumption structure.
2.2. The Effect of Transportation Infrastructure on Upgrading of Residents’ Consumption Structure Through Commercial Circulation Efficiency
Generally speaking, the improvement of transportation infrastructure has a significant correlation with the improvement of regional trade circulation efficiency. In existing studies, Ding et al. [8] found that transportation infrastructure significantly promoted the circulation efficiency of wholesale and retail industries, and Bu et al. [30] found that the improvement of trade circulation efficiency could have an impact on the upgrading of residents’ consumption structure. Such improvement of transportation infrastructure can promote the upgrading of residents’ consumption structure by improving the efficiency of regional trade circulation. The internal logic of this mechanism is as follows:
First of all, the construction and improvement of transportation infrastructure can improve the efficiency of trade circulation in a region in the two dimensions of time and space. From the perspective of the time dimension, the length of transportation logistics usually varies greatly due to the smooth flow of traffic facilities. The continuous construction of transportation infrastructure can provide better guarantee for the safety and smoothness of the transportation system, thus bringing more convenience to the circulation of goods related to consumer goods in the commerce industry, thus greatly shortening the transit time of goods transportation, reducing the loss and storage cost on the way, improving the transportation efficiency of logistics enterprises, and significantly reducing the logistic cost per unit commodity [44]. In the spatial dimension, transportation infrastructure is the physical guarantee of commercial circulation activities. On this basis, the comprehensive three-dimensional transportation network can enable commercial circulation enterprises to open up markets and strengthen industrial exchanges at a lower cost. For example, the opening of high-speed railways in China can significantly improve the accessibility and transportation convenience of cities, enable relevant circulation enterprises to quickly transport commodities in cities along the route, make business exchanges among circulation enterprises more convenient, and promote the perfection of urban wholesale and retail systems [45]. In recent years, China’s modern comprehensive transportation infrastructure network system has gradually taken shape, and the density of the road network has been continuously increased, which has promoted the construction of a unified national large market, expanded the scale of commercial circulation, and improved the efficiency of regional commercial circulation [46]. On the whole, the improvement of transportation infrastructure can reduce various costs of circulation links, such as transportation costs and loading and unloading costs. At the same time, by optimizing circulation paths, improving circulation speed, and reducing commodity loss, it further reduces the comprehensive cost of commercial circulation, improving profitability and operation efficiency of commercial circulation enterprises, and promoting overall improvement of efficiency in the commercial circulation industry.
Secondly, the improvement of trade circulation efficiency can effectively link production and consumption, thus promoting the upgrading of residents’ consumption structure from the supply side and the demand side, respectively. On the supply side, an efficient trade circulation system can, in a timely manner, transmit the information of residents’ consumption demand to manufacturers and channel merchants, guide enterprises to adjust product structure according to consumption demand, reduce ineffective supply, increase effective supply, realize accurate matching between supply and consumption demand, and further promote the upgrading of residents’ consumption structure [47]. On the demand side, the improvement of trade circulation efficiency can reduce circulation links, reduce circulation costs, and then reduce the price of terminal consumer goods, so that residents can obtain high-quality consumer products at lower prices, especially for high-end consumer goods and imported consumer goods. Efficient trade circulation can reduce intermediate links, reduce prices, improve residents’ consumption willingness and consumption ability, and promote residents’ consumption structure to upgrade to being high-end [48]. In addition, areas with high efficiency of trade and circulation can expand the scope of commodity trading, guide the upgrading of surrounding industries, promote an increase in surrounding consumer demand, and drive the upgrading of the consumption structure of surrounding residents [49].
Based on this, this study proposes the following hypotheses.
Hypothesis H2:
Improvement of transportation infrastructure contributes to the improvement of trade circulation efficiency.
Hypothesis H3:
Improvement of transportation infrastructure can promote the upgrading of residents’ consumption structure by improving trade circulation efficiency.
2.3. Spatial Spillover Effects of Transportation Infrastructure on Residents’ Consumption Structure Upgrade
As a typical regional public product, transportation infrastructure not only affects the local area, but also produces a spatial spillover effect on the upgrading of residents’ consumption structure in neighboring areas by promoting income promotion, consumption demonstration and market integration of surrounding residents. First, as far as the spatial spillover effect increasing residents’ income is concerned, existing studies show that the improvement of transportation infrastructure in the region can not only attract industrial agglomeration and promote regional economic development [7], but also drive employment and income increase in neighboring regions through backward and forward linkages of industrial chains [50]. Since income is the key determinant of consumer spending [17], according to Engel’s Law, income growth will further push residents in neighboring areas to spend more on developmental and enjoyment products. Second, in terms of the consumption demonstration effect, the improvement of transportation infrastructure accelerates population flow and information dissemination, enabling consumption concepts, consumption patterns and emerging formats in developed areas to spread to neighboring areas more rapidly [51]. Residents in neighboring areas learn and imitate higher-level consumption patterns through travel, social interaction or media contact, thus promoting the transformation of consumption concepts and optimization of residents’ consumption structure. Finally, regarding the market integration effect, a perfect transportation network can break regional market segmentation, reduce cross-regional commodity circulation costs, and make it easier for local commodities to enter neighboring markets [52]. This market integration effect can not only expand the market scope of local enterprises, but also enrich the commodity choices of consumers in neighboring regions, thus promoting the upgrading of the consumption structure of residents in neighboring regions.
Based on this, this study proposes the following hypothesis.
Hypothesis H4:
The improvement of transportation infrastructure has a significant spatial spillover effect on the upgrading of residents’ consumption structure.
The study framework diagram for this study is shown in Figure 1.
Figure 1.
Research framework.
3. Data and Methodology
3.1. Definition of the Variables
The dependent variable in this study is the upgrading of residents’ consumption structure(Upg). The National Bureau of Statistics divides residents’ consumption expenditure into eight categories, mainly including food, tobacco and alcohol, clothing, housing, daily necessities and services, transportation and communications, education, culture and entertainment, medical care, and other goods and services, and divides them into subsistence consumption, enjoyment consumption and development consumption. Among these categories, subsistence consumption includes three types of expenditures—food, tobacco and alcohol, and clothing and housing; development consumption includes four types of expenditures—transportation and communication, education, culture and entertainment, and medical care; and enjoyment consumption includes two types of expenditures—daily necessities and services and other articles and services. This study measures the upgrading of residents’ consumption structure by the ratio of enjoyment consumption and development consumption to survival consumption. In addition, drawing from Yao et al. [39], the Engel coefficient, that is, the proportion of food consumption expenditure to total consumption expenditure, is used to represent the upgrading of household consumption structure for the subsequent robustness test.
The core explanatory variable of this study is transportation infrastructure (LnTran), which is measured by the logarithmic highway mileage value according to He et al. [7].
The intermediary variable of this study is the efficiency of trade circulation (Eff). At present, the DEA method is mostly used to measure trade circulation efficiency in academic circles. Referring to the research of Li et al. [53], wholesale and retail trade, accommodation and catering trade, and transportation, warehousing and postal trade are divisions of the trade circulation industry, and the trade circulation efficiency index is measured in terms of input and output. The index system is shown in Table 1. Specifically, this paper selects the total investment in fixed assets of the commercial and trade industry and the number of employees in the commercial and trade industry as input indicators, and selects the total retail sales of consumer goods and the added value of the commercial and trade industry as output indicators. The total investment in fixed assets reflects the scale of capital investment, the number of employees reflects the scale of labor input, the total retail sales of consumer goods reflects the market output efficiency of the commercial and trade sector, and the added value of the commercial and trade industry reflects the final results created by the industry. These indicators can comprehensively depict the input–output conversion efficiency of the commercial and trade sector in each city.
Table 1.
Input–output index system of commercial circulation industry.
In terms of the calculation method, this paper uses the output-oriented BCC-DEA model to calculate the commercial circulation efficiency of the commercial circulation industry in each city from 2015 to 2023. Considering the significant differences in the scale of the circulation industry between different cities, the traditional CCR model, which is based on the assumption of constant returns to scale, is unable to accurately depict the actual characteristics of the industry. The BCC model relaxes the assumption of constant returns to scale by introducing weights and imposing a constraint of 1, and is able to decompose the comprehensive technical efficiency into pure technical efficiency and scale efficiency. This helps to identify the specific sources of efficiency losses. Due to the strong rigidity of labor and capital input in the short term, the adjustment space is limited. Therefore, this paper sets the model as output-oriented, that is, maximizing output under the given input level, to reflect the ability of each city to increase circulation output under the existing factor conditions. The pure technical efficiency values obtained through model calculation range from 0 to 1. The closer the value is to 1, the higher the commercial circulation efficiency of the city.
Referring to the existing literature, the following factors that may affect the upgrading of residents’ consumption structure are selected as control variables: economic development level (Pgdp), government intervention economic activity level (Gov), human capital level (Hum) and opening level (Open). The level of human capital is measured by the ratio of the number of students in colleges and universities to the population of the region; the level of opening to the outside world is measured by the ratio of the total import and export volume of the bearing area to GDP; and the level of financial development is measured by the ratio of the balance of deposits and loans of financial institutions in each region to GDP.
Variable definitions and calculation methods are shown in Table 2.
Table 2.
Main variable summary.
3.2. Model Specification
3.2.1. Benchmark Model Construction
In order to test the direct impact of transportation infrastructure on the upgrading of residents’ consumption structure, the following benchmark model is constructed with reference to Jiao et al. [54].
where represents city, and represents year. represents upgrading of household consumption structure. represents transportation infrastructure. represents relevant control variable set. represents individual fixed effect that controls household consumption structure but does not change with time. represents time fixed effect. represents random error value.
3.2.2. Mediation Effect Model
As mentioned above, the improvement of transportation infrastructure can indirectly affect the upgrading of residents’ consumption structure by improving the efficiency of commercial circulation. In order to further explore the indirect transmission mechanism of transportation infrastructure to the upgrading of residents’ consumption structure, this study constructs the following mechanism effect model.
where represents the intermediary variable trade flow efficiency, and the other variables are consistent with the baseline model.
3.2.3. Spatial Econometric Model
This study adopts the Spatial Dubin Model (SDM) to examine the spatial spillover effect of transportation infrastructure on the upgrading of residents’ consumption structure. The specific models are as follows.
where represents the spatially lagged explained variable; represents the spatially lagged explanatory variable; represents the spatially lagged control variable; represents the individual fixed effect; represents the temporal fixed effect; represents the geographic distance matrix; and represents the distance between cities and .
3.3. Sample and Data Source
To deeply explore the potential impact of transportation infrastructure on the upgrading of residents’ consumption structure, this study selected 288 prefecture-level-and-above cities in China from 2015 to 2023 as the research sample and constructed a panel data model. This selection not only reflects the heterogeneity of prefecture-level cities in terms of the upgrading of residents’ consumption structure, but also enables the observation of changes in the same prefecture-level city over time. During the data processing stage, to ensure the accuracy and robustness of the research results, we excluded cities with severe missing data, including Sansha City, Qamdo City, Guigang City, Danzhou City, Nyingchi City, Shannan City, Nagqu City, Turpan City, and Xigaze City. All continuous variables were winsorized at 1% and 99% to effectively minimize potential biases arising from extreme outliers. This procedure alleviates confounding effects from other determinants of consumption structure upgrading, thereby enhancing the stability of the model predictions. The initial sample data were manually compiled from provincial statistical yearbooks, prefecture-level city statistical yearbooks, prefecture-level city statistical bulletins, the CSMAR database, the EPS database, and the China Economy Information Network (CEINET) database. For the small number of missing values in some variables of individual years and individual cities, the linear interpolation method was used for filling. For cases where the linear interpolation is not applicable, the average value of adjacent years was used for filling. The missing proportion is 5%, and the missing scale is small, which does not have a substantive impact on the robustness of the regression results.
4. Empirical Analysis
4.1. Descriptive Analysis
Before empirical regression, descriptive statistical analysis of variables was performed in this study.
Figure 2 shows the time-series change trend of transportation infrastructure, trade circulation efficiency, and the upgrading of residents’ consumption structure from 2015 to 2023. From this, we can observe the following: (1) The upgrading index of resident consumption structure fluctuates and rises as a whole, indicating that China’s resident consumption is gradually changing from the survival type to the development–enjoyment type. This trend is in line with the theoretical expectations of this article, which is that the improvement of transportation infrastructure creates conditions for the upgrading of residents’ consumption structure by reducing transaction costs and expanding market accessibility. (2) The transportation infrastructure has been steadily improved during the study period, and the average annual growth rate has remained stable, reflecting the continuous promotion of China’s transportation network construction. The upward trend of transportation infrastructure slightly precedes the rising inflection point of commercial circulation efficiency and the upgrading of residents’ consumption structure. This temporal sequence relationship initially suggests that the improvement of transportation infrastructure may, through enhancing commercial circulation efficiency, promote the upgrading of consumption structure, which is consistent with the theoretical expectation of the subsequent mediation effect analysis. (3) The efficiency of commercial circulation also shows the characteristics of increasing year by year, and the fluctuation trend of upgrading consumption structure keeps the same direction in most years, which shows that there is a close internal relationship between the three.
Figure 2.
Temporal trend of upgrading of transportation infrastructure, commercial circulation efficiency and household consumption structure.
It is worth noting that in 2020, the upgrading of residents’ consumption structure and the efficiency of trade circulation both experienced phased corrections, while the transportation infrastructure continued to rise during the same period. This abnormal fluctuation may be attributable to the physical isolation, logistics disruptions, and restricted-consumption scenarios caused by the COVID-19 pandemic, which, on the one hand, directly suppressed the operational efficiency of commercial circulation, and on the other hand, imposed an exogenous shock to residents’ service consumption. This is also the reason for the necessity of excluding the 2020 sample in the subsequent robustness test of this study to eliminate the potential interference of external shocks on the estimation results.
Furthermore, to visually reveal the spatial distribution characteristics and evolutionary dynamics of commercial circulation efficiency, this study plots the spatial distribution maps of commercial circulation efficiency for Chinese prefecture-level cities in 2015 and 2023 (Figure 3). By comparing the distribution patterns of the two periods, the following can be observed: (1) From the perspective of regional differences, in 2015, the high-efficiency regions were mainly concentrated in the economically developed areas along the eastern coast, while the western regions generally remained at a lower level, presenting a gradient distribution pattern of “high in the east and low in the west”. (2) From the perspective of temporal evolution, by 2023, the efficiency of some core cities in the central and western regions (such as Chengdu, Wuhan, Xi’an, etc.) had significantly improved, and the spatial distribution had shown a “diffusion” trend from the eastern coastal areas to the inland regions, indicating that the regional gap in commercial circulation efficiency had narrowed. (3) From an overall perspective, the dark areas in 2023 had significantly expanded compared to 2015, indicating that the overall efficiency of commercial circulation improved during the study period. The evolution of this spatial pattern reflects that the improvement in commercial circulation efficiency gradually spread spatially, providing useful reference experiences for promoting regional coordinated development and sustainable economic growth. At the same time, the spatial distribution characteristics further validate the significant regional heterogeneity of commercial circulation efficiency and its dynamic evolution characteristics, which provide an intuitive basis for subsequent adoption of spatial econometric models or empirical strategies considering regional differences.
Figure 3.
Spatial distribution of commercial circulation efficiency in 2015 and 2023. (Note: This map was produced based on the standard map (Map Review No.: GS (2024) 0650) downloaded from the Standard Map Service website of the Ministry of Natural Resources of the People’s Republic of China. The base map has not been modified. The non-study areas include Hong Kong, Macao, and Taiwan, which are inalienable parts of China).
Table 3 shows the descriptive statistical results of 2592 observed values. By observing the mean, standard deviation, and minimum and maximum values of each variable, it can be found that the variation degree of the three core variables of transportation infrastructure, consumption structure upgrading and trade circulation efficiency is moderate, and the data distribution is reasonable, which conforms to the typical characteristics of macro panel data. Meanwhile, the wide range of variation in the control variables reflects the significant differences among various cities in China in terms of their degree of openness to the outside world, etc. This provides abundant sample information for the empirical analysis and also highlights the necessity of controlling these factors in the regression. The statistical characteristics of the control variables are also within reasonable intervals, indicating that the variable system selected in this study has a good data base and is suitable for further empirical testing.
Table 3.
Descriptive statistics of variables.
4.2. Baseline Regression Results
The baseline regression results are shown in Table 4. Column (1) has a regression coefficient of 3.864 for transportation infrastructure without control variables and is significant at the 1% level. Column (2) has a regression coefficient of 3.370 for transportation infrastructure with control variables and is significant at the 1% level. Column (3) is the estimation result of controlling for individual fixed effects. The regression coefficient of transportation infrastructure is 5.675 and significant at the 1% statistical level. Column (4) is the regression result of controlling for the fixed effect of time, and the regression coefficient of transportation infrastructure is 2.165 and significant at the 5% statistical level. Column (5) is the regression result of the time individual double fixed effect, and the regression coefficient of transportation infrastructure is 4.218 and significant at the 5% statistical level. Overall, in the regression results of all models, the coefficient of transportation infrastructure was significantly positive. This indicates a significant positive correlation between the improvement of transportation infrastructure and the upgrading of residents’ consumption structure, thereby verifying Hypothesis H1. Taking example (3) as an illustration, for every unit increase in the level of transportation infrastructure, the index of the upgrading of residents’ consumption structure increases by approximately 5.675 percentage points. This indicates that the positive correlation effect between the improvement of transportation infrastructure and the upgrading of residents’ consumption structure is not only statistically significant but also has relatively prominent economic significance.
Table 4.
Baseline regression results.
According to the regression results above, this study chooses individual fixed effects as the baseline interpretation model, mainly based on the following considerations:
First, by comparing column (2) with column (3), after adding individual fixed effects, the coefficient of transportation infrastructure increased from 3.370 to 5.675. This indicates that if the inherent characteristics of each province that do not change over time are not controlled, the marginal effect of transportation infrastructure will be systematically underestimated. The introduction of individual fixed effects effectively mitigates the omitted variable bias.
Secondly, when only controlling for the fixed effect of time, the coefficient in column (4) is only 2.165, which is much lower than that in column (3). This indicates that the promoting effect of transportation infrastructure on the upgrading of residents’ consumption structure is mainly identified through the cross-sectional differences among provinces, rather than relying solely on the macro time trend at the national level.
Thirdly, the estimation results of the two-way fixed effects in column (5) are highly consistent with those in column (3) in terms of direction and significance, confirming the robustness of the conclusion. However, considering that the inclusion of year dummy variables would lead to sample loss and might absorb some common fluctuations unrelated to transportation infrastructure, this should be taken into account.
Fourth, the impact of improvements in transportation infrastructure on the upgrading of consumption structure is long-term and gradual. The individual fixed-effects model can better capture this long-term effect that gradually emerges over time, thereby providing a more reliable basis for evaluating the sustained impact of transportation investment.
Furthermore, the Hausman test result (p = 0.000) also strongly rejected the random effects model and supported the applicability of the fixed-effects model. Therefore, the individual fixed-effects model is the optimal setting for this study.
4.3. Robustness Test
Robustness testing was conducted in this study by six methods: lag stage of explanatory variable, replacement of explanatory variable, replacement of explained variable, elimination of municipality, elimination of specific year and Bootstrap test.
4.3.1. One-Period Lagged Explanatory Variable
The baseline regression may face endogenous bias caused by reverse causality. This study uses the transportation infrastructure of the lag period as the explanatory variable to test the estimation bias caused by endogenesis [55]. The results of the endogenous test are shown in column (1) of Table 5. The estimation coefficient of transportation infrastructure of the lag period is positive and significant at the 1% statistical level, which is consistent with the results of the previous baseline regression.
Table 5.
Robustness test results (One-period lagged explanatory variable).
4.3.2. Replace Explanatory Variables
Considering that the selection of core explanatory variables may be unreasonable, in order to avoid the influence of chance of traffic infrastructure measurement mode affecting the conclusion—refer to the research of Zhao et al. [56] and Chen et al. [6]—we calculated the traffic density by comparing the sum of highway and railway mileage of each prefecture-level city with the area of each prefecture-level city. The greater the density, the higher the traffic infrastructure level in this area. Tran1 is used to represent the traffic density for the robustness tests below. As shown in Table 6, the regression coefficient was 4.426 and significant at the 1% statistical level, consistent with the regression results described above. This indicates that the results are not dependent on the specific measurement method of the core explanatory variable.
Table 6.
Robustness test results (Replace explanatory variables).
4.3.3. Replace the Explained Variable
The Engel coefficient is an important index for measuring the consumption structure of residents. A decrease in the Engel coefficient means the upgrading of residents’ consumption level. In this study, the Engel coefficient is used to measure the upgrading of residents’ consumption structure. The results are shown in Table 7. The regression coefficient is −2.115 and is statistically significant at the 1% level. This indicates that improvement in transportation infrastructure can reduce the Engel coefficient. That is to say, there is still a positive correlation between the improvement of transportation infrastructure and the upgrading of residents’ consumption structure. This further supports the conclusion of the baseline regression.
Table 7.
Robustness test results (Replace the explained variable).
4.3.4. Excluding Municipalities
Because Beijing, Shanghai, Tianjin and Chongqing are special in terms of administrative level, policy resource allocation and economic development level, they may have an extreme influence on the regression results. Therefore, this study excludes municipalities directly under the central government and re-estimates them. The results are shown in Table 8. The regression coefficient is 5.632 and significant at the statistical level of 1%, indicating that for other cities, there is still a positive correlation between the improvement of transportation infrastructure and the upgrading of residents’ consumption structure.
Table 8.
Robustness test results (Excluding municipalities).
4.3.5. Excluding Specific Years
Since the outbreak of COVID-19 in 2020 had an impact on residents’ consumption behavior, which may interfere with the estimation results, this study re-estimates after excluding the samples from 2020. The results are shown in Table 9. The regression coefficient is 7.298 and significant at the statistical level of 1%. This indicates that after excluding the impact of the epidemic, there is still a positive correlation between the improvement of transportation infrastructure and the upgrading of residents’ consumption structure.
Table 9.
Robustness test results (Excluding specific years).
4.3.6. Bootstrap Test
The benchmark regression employs heteroscedastic robust standard errors for statistical inference. This method relies on the assumption of a large-sample asymptotic distribution. To test whether the core conclusion is restricted by this assumption, this paper further conducts a robustness test using the Bootstrap method [57]. Taking into account the intra-group correlation structure of the panel data, this paper chose to conduct cluster repeated sampling at the city level, that is, to conduct sampling with replacement using cities as the sampling units, and retain all the annual observations of the sampled cities. The number of repeated samples was set at 1000. After each resampling, the main regression model was re-estimated and the coefficient estimates of the core explanatory variables were recorded. The regression results are shown in Table 10. The regression coefficient is 5.675 and is statistically significant at the 1% level, and the results remain robust.
Table 10.
Robustness test results (Bootstrap test).
4.4. Analysis of Mechanism of Action
This study has found that the improvement of transportation infrastructure can significantly promote the upgrading of residents’ consumption structure through benchmark regression analysis. Based on the mediation effect model mentioned above, this study has empirically analyzed the mechanism of transportation infrastructure improvement on the upgrading of residents’ consumption structure through trade circulation efficiency. It should be pointed out that this study focuses on the core transmission path of trade circulation efficiency, and does not deny the existence of other mechanisms. The test results are shown in Table 11. The estimation coefficient of transportation infrastructure on trade flow efficiency is 0.083 and significant at the 1% statistical level, indicating that transportation infrastructure improvement can significantly improve trade flow efficiency, thus verifying the hypothesis H2 mentioned above. After adding trade circulation efficiency into the benchmark regression, the estimated coefficient of transportation infrastructure is 5.547 and significant at the 1% level, and the estimated coefficient of trade circulation efficiency is 1.541 and significant at the 10% statistical level, indicating that the improvement of transportation infrastructure can improve the efficiency of trade circulation and further promote the upgrading of residents’ consumption structure, thus verifying hypothesis H3. It should be noted that the above mediation effect analysis is based on observed panel data. Although fixed effects and related influencing factors have been controlled, the results should still be understood as statistical correlations between variables, rather than strict causal inferences.
Table 11.
Mechanism test results (three-step verification method).
To further verify the statistical significance of the mediating effect, this paper employs the Sobel–Goodman test and supplements it with the Bootstrap method (repeated sampling 1000 times) for a formal test (Table 12). The Sobel test result shows that the indirect effect estimate is 0.089 (z = 2.524, p = 0.012), and the 95% confidence interval of the Bootstrap is [0.0194, 0.1585], which does not include 0, indicating that the mediating effect is significant. The proportion of the mediating effect in the total effect is 13.7%. The above results indicate that the efficiency of commercial circulation played a mediating role in the process where the improvement of transportation infrastructure promoted the upgrading of residents’ consumption structure, thereby verifying Hypothesis H3 again.
Table 12.
Mechanism test results (Sobel–Goodman test and Bootstrap test).
4.5. Spatial Spillover Effect Test
4.5.1. Spatial Autocorrelation Test
Considering that the 288 prefecture-level cities used in this paper are samples after excluding those with severely missing data, they do not possess the characteristic of spatial continuity. Therefore, the adjacency weight matrix cannot be adopted. The geographical distance weight matrix only relies on the longitude and latitude coordinates of cities and is not restricted by the continuity of the sample spatial distribution. Moreover, the geographical distance attenuation effect is the basic law of spatial interaction. Therefore, this paper adopts the geographical distance weight matrix for spatial econometric analysis. The construction method of this matrix is as follows: The geographical distances between each pair of cities are calculated based on their latitude and longitude coordinates. The reciprocals of these geographical distances are obtained to form the initial geographical distance matrix. Then, the row normalization process is applied to this matrix, so that the sum of each row’s elements is 1. Before spatial panel regression, the global Moran’s I index was used to test the spatial autocorrelation between the upgrading of transportation infrastructure and residents’ consumption structure in each year from 2015 to 2023. The results are shown in Table 13. In order to visually show the change trend of Moran’s I index in each year, a broken line chart is further drawn, as shown in Figure 4. Generally speaking, the upgrading of residents’ consumption structure and transportation infrastructure have significant spatial dependence. Moran’s I index of the upgrading of residents’ consumption structure reaches 0.095. Moran’s I index of transportation infrastructure reaches 0.059, and it is significant at the 1% statistical level. Moran’s I index coefficient of the upgrading of residents’ consumption structure and transportation infrastructure is significantly positive at the 1% statistical level in all years, which means that Moran’s I index does have a very significant spatial autocorrelation between the upgrading of residents’ consumption structure and transportation infrastructure. They are not randomly distributed, but have some spatial dependence.
Table 13.
Moran’s I index of transportation infrastructure and upgrading of residents’ consumption structure by year.
Figure 4.
Global Moran’s I trend diagram of transportation infrastructure and residents’ consumption structure upgrade.
The global Moran’s I index can only assess the overall spatial dependence but fails to capture the local spatial agglomeration characteristics of individual prefecture-level cities. To further identify spatial outliers and local spatial association patterns, this study selects three key time points—2015, 2019, and 2023—to plot LISA cluster maps for both residents’ consumption structure upgrading and transportation infrastructure (Figure 5).
Figure 5.
LISA cluster map of the upgrading of residents’ consumption structure and transportation infrastructure. (Note: This map is produced based on the standard map (Map Review No.: GS (2024) 0650) downloaded from the Standard Map Service website of the Ministry of Natural Resources of the People’s Republic of China. The base map has not been modified. The non-study areas include Hong Kong, Macao, and Taiwan, which are inalienable parts of China).
From the perspective of the spatial evolution pattern of residents‘ consumption structure upgrading, a significant north–south differentiation is observed over the sample period. In 2015, the Beijing–Tianjin–Hebei region and the adjacent northern border areas formed distinct high–high (HH) agglomerations, while South China and Southwest China were predominantly characterized by low–low (LL) clusters, indicating a generally low level of consumption upgrading. The areas surrounding the Beijing–Tianjin–Hebei region were predominantly characterized by low–high (LH) outliers, reflecting the resource siphon effect of the core cities in the early stage and indicating insufficient regional synergy. In 2019, the high–high (HH) agglomeration in the northern region continued to expand, raising the overall spatial autocorrelation level, while provincial capital cities in Southwest China exhibited a high–low (HL) outlier pattern characterized by isolated development, which made it difficult to drive coordinated upgrading in surrounding cities. By 2023, the regional pattern had continued to improve, with the low–high (LH) anomalies around the Beijing–Tianjin–Hebei region being significantly alleviated, and the positive radiation spillover effects of core cities gradually emerging. Meanwhile, the extent of low–low (LL) agglomerations nationwide shrank considerably, and the level of regional coordinated development in residents’ consumption upgrading steadily improved.
In terms of the agglomeration characteristics of transportation infrastructure, its spatial pattern has remained generally stable, with pronounced regional disparities. Central China’s hub provinces—such as Henan, Hubei, Hunan, and eastern Sichuan—have long maintained extensive high–high (HH) agglomerations, reflecting a relatively high level of road network connectivity and integration. These areas serve as the core region of positive spatial association for transportation infrastructure nationwide. In Northwest China, a persistent polarization pattern characterized by high–low (HL) outliers has been observed, where provincial capital cities enjoy prominent infrastructure advantages yet exhibit weak spillover effects, reflecting pronounced intra-provincial developmental imbalances. In 2023, the northeast region formed contiguous low–low (LL) agglomerations, falling into a low-level equilibrium trap in terms of transportation infrastructure. This further widened the development gap with the central and eastern regions, highlighting the prominent spatial heterogeneity across the country.
Overall, both variables are predominantly characterized by high–high (HH) and low–low (LL) agglomerations as their primary spatial association patterns. This finding is consistent with the positive global Moran’s I index, indicating the presence of stable spatial interaction effects across cities and providing visual support for the identification of spatial spillover characteristics. The central core area with high–high clustering of transportation infrastructure is highly coupled with the area where the advantages of the upgrading of residents’ consumption structure are concentrated. This indicates that a well-developed transportation network releases benefits through the flow of elements, is conducive to improving the local consumption structure, and radiates to drive the neighboring areas to achieve the upgrading of residents’ consumption structure.
4.5.2. Model Suitability Test
Referring to Elhorst’s spatial test theory, the LM test, Hausman test and LR test were performed in this study in turn. The results are shown in Table 14. The LM test and robust LM test for spatial error and spatial lag were both significant at the 1% statistical level, indicating that spatial error effects and spatial lag effects existed simultaneously, and the Spatial Durbin Model (SDM) should be selected as the base model. The Hausman test was significant at the 1% statistical level, indicating that the fixed-effects model was superior to the random-effects model. The LR test results rejected the null hypothesis that SDM could be reduced to SAR or SEM, further confirming that SDM was a better model setting. Therefore, this study uses a two-way fixed-effects Spatial Dobbin Model for estimation.
Table 14.
LM, Hausman, LR test result.
4.5.3. Analysis of Spatial Metrology Model
Based on the above test results, the two-way fixed-effects Spatial Dobbin Model is used for estimation. The benchmark regression results are shown in Table 15. The estimation coefficient of transportation infrastructure is 2.331 and significant at the 5% statistical level, indicating that the improvement of local transportation infrastructure can significantly promote the upgrading of local residents’ consumption structure. The spatial lag coefficient of transportation infrastructure 14 is 13.758 and significant at 10% statistical level, indicating that the spatial effect of transportation infrastructure is significant, and the improvement of transportation infrastructure in this area has positive spillover effect on the upgrading of residents’ consumption structure in other areas, which preliminarily confirms the existence of spatial spillover.
Table 15.
Spatial Durbin Model regression (including main effects and spatial lag terms).
Although the Spatial Dobbin Model explained the spatial correlation between regions, its parameter estimation results could not truly reflect the direct effect and spatial spillover effect. In this study, the influence coefficients of each explanatory variable were further decomposed into spatial direct effect, spatial indirect effect, and spatial total effect, and the results are shown in Table 16. The direct effect of transportation infrastructure coefficient is 2.441 and significantly positive at the 5% statistical level, the indirect effect coefficient is 27.478 and significantly positive at the 10% statistical level, and the total effect coefficient is 29.920 and significantly positive at the 5% level, indicating that the improvement of local transportation infrastructure has significant spatial spillover effect while promoting the upgrading of local residents’ consumption structure, thus verifying hypothesis H4.
Table 16.
Spatial effect decomposition results.
4.6. Heterogeneity Analysis
The impact of improvements in transportation infrastructure on the upgrading of residents’ consumption structure may vary depending on the type of city. Group regression can reflect the significance and direction of the core explanatory variables within each sub-sample, which is helpful in identifying the differentiated characteristics of effects among different city types. To further reveal the heterogeneity of this effect, this study believes that the following heterogeneity of residents’ locations is worthy of particular attention.
First, consider the development level of the city where the residents live. In China, first-tier and second-tier cities usually have a higher economic level, a more perfect market system and a more mature consumption environment, but they also face problems such as saturated urban transportation infrastructure, limited marginal improvement space for urban transportation facilities, and easy traffic congestion for residents. Although the economic development level of non-first- and -second-tier cities is relatively backward, they can vigorously promote the improvement of transportation infrastructure and create a better investment and consumption environment, which is conducive to population flow and even agglomeration, and may affect the change in local residents’ consumption structure. In order to investigate the similarities and differences between these two types of cities, according to the list of “City Commercial Charm Ranking List” for the past five years, this study divides the sample into first-tier and second-tier cities and non-first-tier cities for grouping regression estimation. Table 17 reports the results of grouping regression. The results show that the promotion effect of transportation infrastructure on the upgrading of residents’ consumption structure is 2.868 in first-tier and second-tier cities, which is not significant; the estimation coefficient is 5.445 in non-first-tier and -second-tier cities, which is significant at the statistical level of 1%. This result shows that the marginal effect of transportation infrastructure improvement on the upgrading of residents’ consumption structure has a decreasing law, that is, with the context that the transportation network of the first- and second-tier cities has been relatively perfect, the pulling effect of continuing to increase transportation investment on the upgrading of residents’ consumption structure tends to be saturated; in non-first- and -second-tier cities, the improvement of transportation infrastructure can effectively release consumption potential and promote the upgrading of residents’ consumption structure, which also confirms the strategic significance of the state’s continuous promotion of transportation infrastructure extension to small and medium-sized cities.
Table 17.
Heterogeneity test results (Is it a first-tier or second-tier city).
The second is to consider the difference between whether the city where the residents live is located in the national metropolitan area, in terms of of the spatial spillover effect. A metropolitan area is an urbanized spatial form with the core city as the center and the 1 h commuter circle as the basic scope within the urban agglomeration. It has economic, social and living functions. It is the product of the evolution of the city into an economic functional area and an important spatial carrier for the coordinated development of the regional economy. Cities in national metropolitan areas have first-mover advantages in policy planning in terms of transportation network interconnection, commuting integration construction and deep market integration, which is theoretically conducive to promoting two-way flow and functional complementarity of elements through cross-city transportation connection. Although non-national metropolitan areas have been actively promoting the process of transportation integration in recent years, they lack a mature cross-city commuting network and market integration mechanism on the whole. The impact of transportation infrastructure improvement on consumption structure may depend more on local travel facilitation, and it is difficult to obtain consumption linkage dividends brought by spatial spillover. In order to investigate the similarities and differences between these two types of cities, according to the classification of national metropolitan area cities by the National Development and Reform Commission, this study divides the sample into national metropolitan area cities and non-national metropolitan area cities for group regression estimation. Table 18 reports the group regression results, and the results show that the regression coefficient of metropolitan area cities is 5.751 and significant at the 10% statistical level; the regression coefficient of non-metropolitan cities is 5.577 and significant at the 1% statistical level. The two groups of coefficients are significantly positive, but the estimation coefficient of metropolitan cities is larger, indicating that the improvement of transportation infrastructure has a stronger impact on the upgrading of residents’ consumption structure in national metropolitan cities.
Table 18.
Heterogeneity test results (whether it is a national metropolitan area city).
Third, consider whether the city where the residents live has a national logistics hub. A national logistics hub is a key node in the logistics network, undertaking core functions such as cargo distribution, transshipment, and distribution. The cities that host logistics hubs usually have higher logistics efficiency, lower circulation costs, and richer commodity supply capabilities. The improvement of transportation infrastructure in cities that host logistics hubs not only facilitates residents’ travel, but also promotes the upgrading of residents’ consumption structure by reducing logistics costs. Although non-state logistics hub cities are also increasing investment in logistics construction in recent years, the overall circulation efficiency and network coverage are still relatively lagging behind. In order to investigate the similarities and differences between these two types of cities, according to the annual construction list of national logistics hubs led by the National Development and Reform Commission since 2019–2023, this study divides the samples into two groups, national logistics hub-bearing cities and non-national logistics hub-bearing cities, and performs group regression estimation. Table 19 reports the results of group regression, which shows that the estimation coefficient of the city hosted by the national logistics hub is 10.826, which is significant at the 1% statistical level; the estimation coefficient of the city hosted by the non-national logistics hub is 3.407, which is also significant at the 1% statistical level. The two groups of coefficients are highly significant, but the estimation coefficient of the city carried by the national logistics hub is larger, indicating that the impact of the urban transportation infrastructure level carried by the national logistics hub on the upgrading of residents’ consumption structure is stronger.
Table 19.
Heterogeneity test results (whether it is a national logistics hub city).
Fourth, consider the heterogeneity effect brought by the construction of strategic channels. The New Western Land–Sea Corridor is an important strategic deployment for the country to promote the development. The cities along the corridor enjoy significant advantages in transportation infrastructure construction, policy resource allocation and coordinated industrial development. The improvement of transportation infrastructure can not only strengthen internal accessibility, but also broaden the consumption choice space of residents by improving logistics efficiency, thus promoting the upgrading of residents’ consumption structure. Non-line cities lack policies and resources at the national strategic level, and their traffic improvement may have a relatively limited role in promoting the upgrading of residents’ consumption structure. In order to investigate the similarities and differences between these two types of cities, this study divides the sample into two groups according to the Overall Plan for the New Western Land–Sea Corridor, namely, cities along the New Western Land–Sea Corridor and cities not along the corridor, and makes regression estimation respectively. Table 20 reports the grouped regression results, which show that the estimated coefficient of transportation infrastructure in cities along the New Western Land–Sea Corridor is 7.369, which is significant at the statistical level of 1%, while the estimated coefficient of transportation infrastructure in cities not along the corridor is 1.676, which fails the significance test. This indicates that the urban transportation infrastructure level along the New Western Land–Sea Corridor has a stronger impact on the upgrading of residents’ consumption structure.
Table 20.
Heterogeneity test results, (Is it a city along the New Western Land–Sea Corridor?).
5. Conclusions and Recommendations
Based on the theoretical clarification of the relationship between transportation infrastructure, commercial circulation efficiency and the upgrading of residents’ consumption structure, this study selects panel data of 288 prefecture-level cities in China from 2015 to 2023 to further conducted an empirical analysis of the statistical correlation and transmission path among these three factors, and draws the following conclusions:
(1) There is a significant positive correlation between the improvement of transportation infrastructure and the upgrading of residents’ consumption structure. This conclusion remains valid even after a series of robustness tests.
(2) The results of the mechanism test show that the efficiency of commercial and trade circulation plays a mediating role between transportation infrastructure and the upgrading of residents’ consumption structure.
(3) The results of the spatial spillover effect test show that there is a positive correlation between the improvement of local transportation infrastructure and the upgrading of the consumption structure of local residents. Moreover, it has a significant spatial spillover effect and can exert a positive radiation and driving influence on the upgrading of the consumption structure of residents in neighboring areas.
(4) The heterogeneity test results show that in the cities along the New Western Land–Sea Corridor and non-first- and -second-tier cities, there is a positive correlation between the improvement of transportation infrastructure and the upgrading of residents’ consumption structure. Compared with residents of non-national-level metropolitan areas, the transportation infrastructure of national-level metropolitan areas has a stronger correlation with the upgrading of residents’ consumption structure; the correlation between the transportation infrastructure of cities with national logistics hubs and the upgrading of residents’ consumption structure is greater than that of cities without national logistics hub status.
It is necessary to point out that this study also has certain limitations. Firstly, the research sample is limited to the prefecture-level cities in China. Whether the conclusions are applicable to other levels or regions at different development stages still needs further verification. Secondly, due to the limited availability of relevant data at the prefecture-level city level, the empirical analysis based on observed data is difficult to completely rule out potential confounding variables and reverse causality. Again, this paper mainly examines the mediating path of commercial circulation efficiency. The impact channel of transportation infrastructure improvement on the upgrading of residents’ consumption structure may be more diverse, and further research is needed to explore this further. Future research can, under the condition of available data, combine more detailed micro-data or use quasi-natural experiment methods to conduct more in-depth discussions on the above issues.
According to the conclusions of this study, the following recommendations are proposed:
First, continuously improve the transportation infrastructure network. Transportation infrastructure serves as the “physical channel” connecting production and consumption, and its scale and quality directly affect the efficiency of the circulation of goods and factors. Therefore, the construction of a comprehensive and multi-modal transportation network should be continuously advanced. The Ministry of Transport should take the lead, in collaboration with the National Development and Reform Commission, to jointly plan the overall scheme. Each provincial government should be responsible for the implementation of transportation projects within its respective region, with a focus on addressing the transportation shortcomings in the central and western regions as well as remote areas, and enhancing the density and accessibility of the road network. At the same time, we should pay attention to the effective connection between transportation infrastructure and consumption centers and logistics hubs, increase their radiation driving ability to the consumption market, and provide more solid physical support for the upgrading of residents’ consumption structure.
Second, enhance the intermediary transmission effect of commercial and trade circulation efficiency. The efficiency of commercial circulation serves as an important transmission channel in the positive correlation between transportation infrastructure and the upgrading of residents’ consumption structure. On the one hand, we should speed up the cultivation of modern logistics enterprises, promote the large-scale and intensive development of the logistics industry, and reduce the cost of unit commodity circulation; on the other hand, we should vigorously develop emerging circulation formats such as smart logistics, cold chain logistics, and instant distribution, so as to improve the timeliness and quality assurance capability of commodity circulation. In addition, we should promote the construction of commercial circulation platforms; encourage the deep integration of e-commerce platforms, supply chain service platforms and transportation hubs; and build an efficient, convenient and low-cost commodity circulation network. This can be led by the Ministry of Commerce and the National Development and Reform Commission, with local commerce authorities responsible for implementation. Logistics industry associations will promote the formulation and promotion of industry standards. By improving the efficiency of commercial circulation, the dividends of improved transportation infrastructure can be truly transformed into the accessibility and availability of residents’ consumption, and the consumption structure of residents can be upgraded to the development and enjoyment type.
Third, strengthen the coordinated development of regional traffic. There is a significant positive spatial synergy between transportation infrastructure and the consumption structure of residents. We should actively promote the interconnection of cross-regional transportation infrastructure, strengthen the integration of transportation in urban clusters and metropolitan areas, build an efficient and convenient regional transportation network, and promote the orderly and free flow of consumption factors. At the same time, we should give full play to the radiation function of core cities to drive the upgrading and coordinated development of consumption in surrounding areas.. At the same time, the National Development and Reform Commission and the Ministry of Transport should coordinate cross-regional transportation planning, and the relevant municipal governments should jointly participate in the construction of regional transportation integration. A regional transportation co-construction and sharing mechanism should be established to coordinate the planning of cross-regional transportation projects, avoid redundant construction, and maximize the spatial spillover benefits of transportation infrastructure.
Fourth, implement differentiated development strategies. The correlation between transportation infrastructure and the upgrading of residents’ consumption structure varies depending on the type of city. For non-first- and -second-tier cities, we should seize the opportunities brought about by the improvement of transportation costs and market accessibility, build supporting commercial outlets and digital consumption infrastructure. For cities in national metropolitan areas, we should continue to give full play to the advantages of transportation infrastructure directly serving commuting and consumption markets. For cities bearing national logistics hubs, we should give full play to their core functions of goods distribution, transit and distribution, promote the coordinated development of hub economy and consumption economy, and encourage hub cities to take the lead in laying out new consumption formats such as initial economy and experience economy; For cities along the New Western Land–Sea Corridor, it is necessary to promote the deep integration of transportation, logistics, industry and consumption in combination with the construction of the corridor, build regional consumption centers. The National Development and Reform Commission will take the lead in formulating differentiated support policies. Each local government will, based on its own actual situation, formulate specific implementation rules. The commerce department will cooperate to promote the construction of supporting commercial outlets and consumption patterns.
Fifth, promote the coordinated development of transportation and consumption policies. The connection between transportation infrastructure and the upgrading of residents’ consumption structure is intertwined with factors such as regional economic development, market openness, and digital empowerment. Therefore, the coordination of transportation, commerce, finance, industry and other policies should be strengthened. In the layout of transportation projects, consumer market cultivation, commercial network supporting, digital consumption infrastructure construction, and other factors should be simultaneously considered to form a policy synergy. In the planning of transportation projects, factors such as the cultivation of the consumer market, the establishment of commercial outlets, and the construction of digital consumption infrastructure should be taken into consideration simultaneously. The local government’s departments of development and reform, transportation, commerce, and finance should establish a joint meeting system to regularly coordinate and solve the bottlenecks and difficulties in the implementation of policies, thereby forming a policy synergy. At the same time, local governments are encouraged, based on the characteristics of local consumption structure, to explore a linkage model between transportation improvement and consumption promotion to further amplify the consumption-driven effect of transportation infrastructure.
Author Contributions
Conceptualization, W.H. and Z.M.; Methodology, W.H.; Software, Z.M.; Validation, Z.M.; Formal analysis, Z.M.; Investigation, Z.M.; Resources, W.H.; Data Curation, Z.M.; Writing—original draft, Z.M.; Writing—review & editing, W.H. and Z.M.; Visualization, Z.M.; Supervision, W.H.; Project administration, W.H.; Funding acquisition, W.H. All authors have read and agreed to the published version of the manuscript.
Funding
This research was funded by the National Social Science Fund of China (NSSFC), grant number 25XGL019. The APC was funded by the National Social Science Fund of China (NSSFC), grant number 25XGL019.
Institutional Review Board Statement
Not applicable.
Informed Consent Statement
Not applicable.
Data Availability Statement
The original contributions presented in this study are included in the article. Further inquiries can be directed to the corresponding author.
Conflicts of Interest
The authors declare no conflict of interest.
References
- Ma, J. Building a Strong Strategic Support for the Domestic Market by Vigorously Boosting Consumption (Striving for the 15th Five-Year Plan). CPPCC Daily, 1 April 2026; (In Chinese). [CrossRef] [Scilit]
- Yang, Z. The Logic and Path of Promoting Consumption through Reform. Guangming Daily, 24 June 2025; (In Chinese). [CrossRef] [Scilit]
- Yang, R.; Li, L. Research on the Spatial Spillover Effect of Transportation Infrastructure Construction on County-Level Welfare Economic Growth. Financ. Theory Pract. 2024. (In Chinese) [Google Scholar] [CrossRef]
- Njoya, E.T.; Tchoffo, R.N.; Ngo, M.C.; Zirar, A. The economic and welfare impact of investment in transport infrastructure in Africa: A dynamic computable general equilibrium model analysis. Transp. Plan. Technol. 2026, 49, 589–623. [Google Scholar]
- Wang, X. Transportation Infrastructure, Financial Development and Household Consumption Expenditure: Based on Spatial Panel Data of 281 Prefecture-Level Cities. Consum. Econ. 2017, 33, 31–37. (In Chinese) [Google Scholar]
- Chen, W.; Wang, Y.; Yu, M.; Jin, C. The Impact of Transportation Infrastructure on the Economic Resilience of Interprovincial Adjacent Areas. J. Nanjing Norm. Univ. (Nat. Sci. Ed.) 2026, 49, 24–34. (In Chinese) [Google Scholar]
- He, S.; Zheng, J. Research on the Spatial Spillover Effect of Transportation Infrastructure along the New Western Land-Sea Corridor on the Economic Development of Bordering Areas. Railw. Transp. Econ. 2026, 48, 204–217. (In Chinese) [Google Scholar]
- Ding, H.; Ding, N. Research on the Impact of Transportation Infrastructure on the Efficiency of Commercial Circulation. J. Bus. Econ. 2023, 28–39. (In Chinese) [Google Scholar] [CrossRef]
- Zhang, H. Research on the Impact of Transportation Infrastructure on the Economic Development of the Pearl River Delta Urban Agglomeration in China. Dev. Financ. Res. 2026, 44–56. (In Chinese) [Google Scholar] [CrossRef]
- Ni, K.; Zhang, R.; Liu, X.; Yu, X. Transportation Infrastructure and Digital Economy Jointly Shape a Unified National Market. Syst. Eng.-Theory Pract. 2026, 46, 2265–2292. (In Chinese) [Google Scholar]
- Zhang, Y.; Zhou, Z.; Xiang, B. The Impact of Transportation Infrastructure Construction on Urban-Rural Integration Development in the Yangtze River Delta Counties. Urban Probl. 2025, 94–103. (In Chinese) [Google Scholar] [CrossRef]
- Jia, R.; Wang, D.; Mou, X. Impact of Transport Infrastructure on Regional Economic Synergy: Evidence from Chinese Cities. Sustainability 2026, 18, 3855. [Google Scholar] [CrossRef] [Scilit]
- Ren, B.; Jing, W.; Hu, Z. Transportation Infrastructure and Regional Economic Disparity: A Market Differentiation Allocation Perspective Based on High-Speed Rail Opening. Econ. Probl. 2025, 110–119. (In Chinese) [Google Scholar] [CrossRef]
- Wu, J.; Jiang, Y.; Zhang, J. Research on the Convergence of Regional Income through Transportation Infrastructure Construction under the Goal of Common Prosperity. China Popul. Resour. Environ. 2025, 35, 185–196. (In Chinese) [Google Scholar]
- Gutman, S.; Malashenko, M. The Impact of Transport Infrastructure on Sustainable Economic Development of Russian Regions. Sustainability 2025, 17, 3776. [Google Scholar] [CrossRef] [Scilit]
- Keynes, J.M. The General Theory of Employment, Interest and Money; Macmillan: London, UK, 1936. [Google Scholar]
- Zeldes, S.P. Consumption and liquidity constraints: An empirical investigation. J. Political Econ. 1989, 97, 305–346. [Google Scholar] [CrossRef] [Scilit]
- Zhou, J.; Liang, Y.; Jin, Y. Does Transfer Income Promote the Upgrading of Rural Residents’ Consumption Structure? J. Huazhong Agric. Univ. (Soc. Sci. Ed.) 2024, 73–85. (In Chinese) [Google Scholar] [CrossRef]
- Lu, Q.; Guo, H. The Internal Mechanism and Effects of Social Security’s Influence on Residents’ Consumption. Chongqing Soc. Sci. 2010, 84–89. (In Chinese) [Google Scholar] [CrossRef]
- O’Donoghue, T.; Rabin, M. Present Bias: Lessons Learned and to Be Learned. Am. Econ. Rev. 2015, 105, 273–279. [Google Scholar] [CrossRef] [Scilit]
- Chen, H.; Zang, X. Habit Formation and the Upgrading of Urban Residents’ Consumption Structure in China: An Analysis Based on Income Class Heterogeneity. J. Xiangtan Univ. (Philos. Soc. Sci.) 2019, 43, 69–74. (In Chinese) [Google Scholar]
- Luo, J. Can Financial Knowledge Promote the Upgrading of Residents’ Consumption Structure? Evidence from China Household Finance Survey Data. Consum. Econ. 2020, 36, 63–73. (In Chinese) [Google Scholar]
- Qi, H.; Ma, Y. The Impact of Internet Finance on the Upgrading of Urban Household Consumption Structure. J. Xi’an Jiaotong Univ. (Soc. Sci.) 2021, 41, 56–67. (In Chinese) [Google Scholar]
- Fan, S.; Zhang, L.; Wang, Q.; Kong, Y.; Yang, H. Digital financial inclusion and household consumption structure upgrading. Sci. Rep. 2026, 16, 13776. [Google Scholar] [CrossRef] [Scilit] [PubMed]
- Huang, M.; Dou, X. Will the Urban-Rural Digital Divide Hinder the Upgrading of Rural Residents’ Consumption Structure? An Analysis Based on Data from the China Family Panel Studies (CFPS). Inq. Into Econ. Issues 2022, 43, 47–64. (In Chinese) [Google Scholar]
- Liu, G.; Han, Z.; Li, J. Research on the Micro-Effects of Credit Access on the Upgrading of Rural Household Consumption Structure: An Empirical Analysis Based on CFPS. Comp. Econ. Soc. Syst. 2024, 78–90. (In Chinese) [Google Scholar]
- Tang, S.; Zou, X. Research on the Heterogeneous Impact of Payment Technology on the Consumption Structure of Urban and Rural Households. J. Commer. Econ. 2025, 57–60. (In Chinese) [Google Scholar]
- Li, D.; Jiang, M.; Dai, L. An Empirical Study on the Effect of Rising Housing Prices on the Upgrading of Residents’ Consumption Structure. J. Commer. Econ. 2019, 34–39. (In Chinese) [Google Scholar]
- Guo, X.; Yu, H. Research on the Impact of Housing Prices on the Upgrading of Residents’ Consumption Structure. Price Theory Pract. 2022, 82–85+205. (In Chinese) [Google Scholar] [CrossRef]
- Bu, S.; Yu, G. Analysis of the Influence Mechanism and Econometrics of Regional Circulation Efficiency on the Upgrading of Residents’ Consumption Structure. J. Commer. Econ. 2021, 46–49. (In Chinese) [Google Scholar]
- Gu, Y.; Cai, Y. Can Internet Popularization Promote the Upgrading of Residents’ Consumption Structure? An Empirical Analysis Based on the Extended LA/AIDS Model. Guizhou Soc. Sci. 2022, 135–142. (In Chinese) [Google Scholar] [CrossRef]
- Guo, D.; Li, L.; Qiao, L.; Qi, F. Digital economy and consumption upgrading: Scale effect or structure effect? Econ. Change Restruct. 2023, 56, 4713–4744. [Google Scholar] [CrossRef] [Scilit]
- Mei, H.; Wei, J.; He, P. The Effect of Digital Consumption Environment on the Upgrading of Rural Residents’ Consumption Structure. J. Commer. Econ. 2024, 95–99. (In Chinese) [Google Scholar]
- Zuo, S. Analysis of the Spatial Effect of Improving Market Accessibility on the Upgrading of Residents’ Consumption Structure. J. Commer. Econ. 2024, 85–88. (In Chinese) [Google Scholar]
- Zhang, M.; Ma, X.; Liu, J.; Zhang, J. Research on the Impact of Environmental Regulations on the Upgrading of Residents’ Consumption Structure: Evidence from the Pilot Policy of Low-Carbon Provinces. J. Tech. Econ. Manag. 2024, 77–85. (In Chinese) [Google Scholar]
- Zhang, H.; Tian, Z.; Qiu, R. How Can the Debut Economy Empower the Upgrading of Consumption Structure? Consum. Econ. 2025, 41, 30–43. (In Chinese) [Google Scholar]
- Zheng, D.; Li, L. Urbanization, Population Density and Household Consumption Rate. J. Cap. Univ. Econ. Bus. 2020, 22, 13–24. (In Chinese) [Google Scholar]
- Yan, J.; Chen, J. The Impact of Digital Consumption on the Upgrading of Residents’ Consumption Structure: A Quasi-Natural Experiment Based on the National Information Consumption Pilot. J. Commer. Econ. 2024, 55–58. (In Chinese) [Google Scholar]
- Yao, J.; Zhou, B.; Zang, X. How Does the Digital Economy Affect Residents’ Consumption Upgrading? Empirical Evidence from Chinese Prefecture-Level Cities. Nankai Econ. Stud. 2024, 91–110. (In Chinese) [Google Scholar] [CrossRef]
- Shi, L.; Zhang, C.; Liu, N. How Can the Digital Economy Promote the Upgrading of Residents’ Consumption Structure? New Evidence Based on Changes in Industry Wages. Reform Econ. Syst. 2026, 95–105. (In Chinese) [Google Scholar] [CrossRef]
- Modigliani, F.; Brumberg, R. Utility Analysis and the Consumption Function: An Interpretation of Cross-Section Data. In Post-Keynesian Economics; Kurihara, K.K., Ed.; Rutgers University Press: New Brunswick, NJ, USA, 1954. [Google Scholar]
- Friedman, M. A Theory of the Consumption Function; Princeton University Press: Princeton, NJ, USA, 1957. [Google Scholar]
- Xu, Y.; Ou, G. A Study on the Impact of High-Speed Rail on the Consumption Structure of Urban and Rural Residents in China. PLoS ONE 2024, 19, e0307947. [Google Scholar] [CrossRef] [Scilit] [PubMed]
- Li, J. An Empirical Analysis of the Impact of E-Commerce Platform Development and Transportation Infrastructure on the Efficiency of Agricultural Product Circulation. J. Commer. Econ. 2023, 119–123. (In Chinese) [Google Scholar]
- Zhang, H. Analysis of the Impact of High-Speed Rail Opening on Urban Circulation Efficiency: Based on the Intermediary Mechanism of Business Environment. J. Commer. Econ. 2025, 109–112. (In Chinese) [Google Scholar]
- Li, X. Analysis of the Effect of Road Network Density on the Efficiency of Commercial Circulation. J. Commer. Econ. 2024, 33–36. (In Chinese) [Google Scholar]
- Wang, L. Analysis of the Relationship among E-Commerce, Commodity Circulation Efficiency and the Upgrading of Residents’ Consumption Structure. J. Commer. Econ. 2024, 72–75. (In Chinese) [Google Scholar]
- Yang, Y.; Gong, Z. Analysis of the Impact of Circulation Efficiency on the Scale and Structure of Residents’ Consumption in China. J. Commer. Econ. 2024, 36–40. (In Chinese) [Google Scholar]
- Yang, L. Exploring the Relationship among Digital Transactions, Commercial Circulation Efficiency, and Consumption Structure Upgrading. J. Commer. Econ. 2023, 10–13. (In Chinese) [Google Scholar]
- Chanieabate, M.; He, H.; Guo, C.; Abrahamgeremew, B.; Huang, Y. Examining the Relationship between Transportation Infrastructure, Urbanization Level and Rural-Urban Income Gap in Chin. Sustainability 2023, 15, 8410. [Google Scholar] [CrossRef] [Scilit]
- Wang, C.; Zhang, D. Research on the Direct Effects and Spatial Spillover Effects of High-Speed Rail Networks on Residents’ Consumption Levels. J. Commer. Econ. 2024, 63–66. (In Chinese) [Google Scholar]
- Chen, T.; Qi, Y.; Du, L. Transportation Network Density, Domestic Market Integration and Excess Sensitivity of Household Consumption. Financ. Trade Econ. 2023, 44, 99–119. (In Chinese) [Google Scholar]
- Li, Y.; Yin, T. Digital Economy, Commercial Circulation Efficiency and Agricultural and Rural Modernization. J. Commer. Econ. 2025, 103–107. (In Chinese) [Google Scholar]
- Jiao, J.; Li, C. The Impact of Digital Inclusive Finance on the Consumption Structure of Urban and Rural Residents: Theoretical Mechanisms, Empirical Analysis and Policy Recommendations. J. Commer. Econ. 2024, 184–188. (In Chinese) [Google Scholar]
- Ding, Y.Y.; Bi, C.F.; Sun, P.P. Low carbon constraints, innovation driven and carbon neutral technological innovation: Empirical evidence based on multiple policy combinations. Sci. Rep. 2025, 15, 22912. [Google Scholar] [CrossRef] [Scilit] [PubMed]
- Zhao, Y.; Hu, Q.; Ji, X.; Song, J. Research on the Impact of Transportation Infrastructure Construction on Regional Marketization. China Soft Sci. 2024, 98–109. (In Chinese) [Google Scholar]
- Efron, B.; Tibshirani, R. An Introduction to the Bootstrap; CRC Press: Boca Raton, FL, USA, 1994. [Google Scholar]
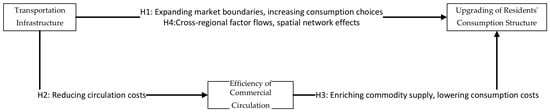
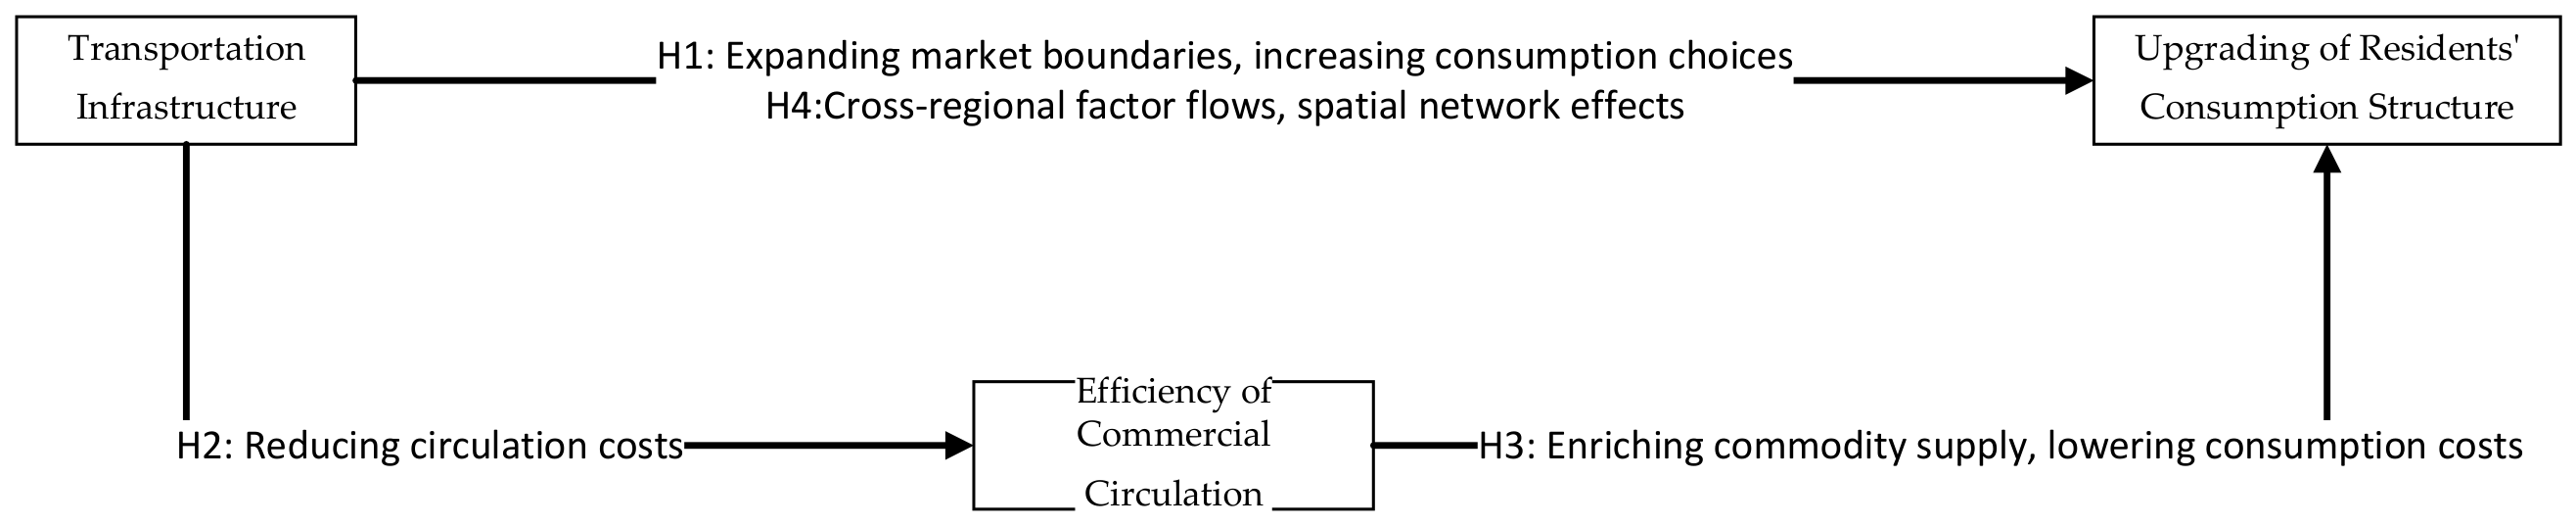
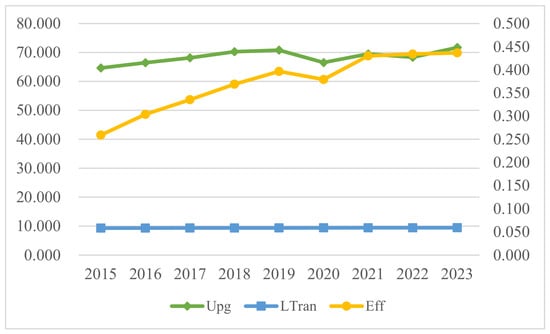
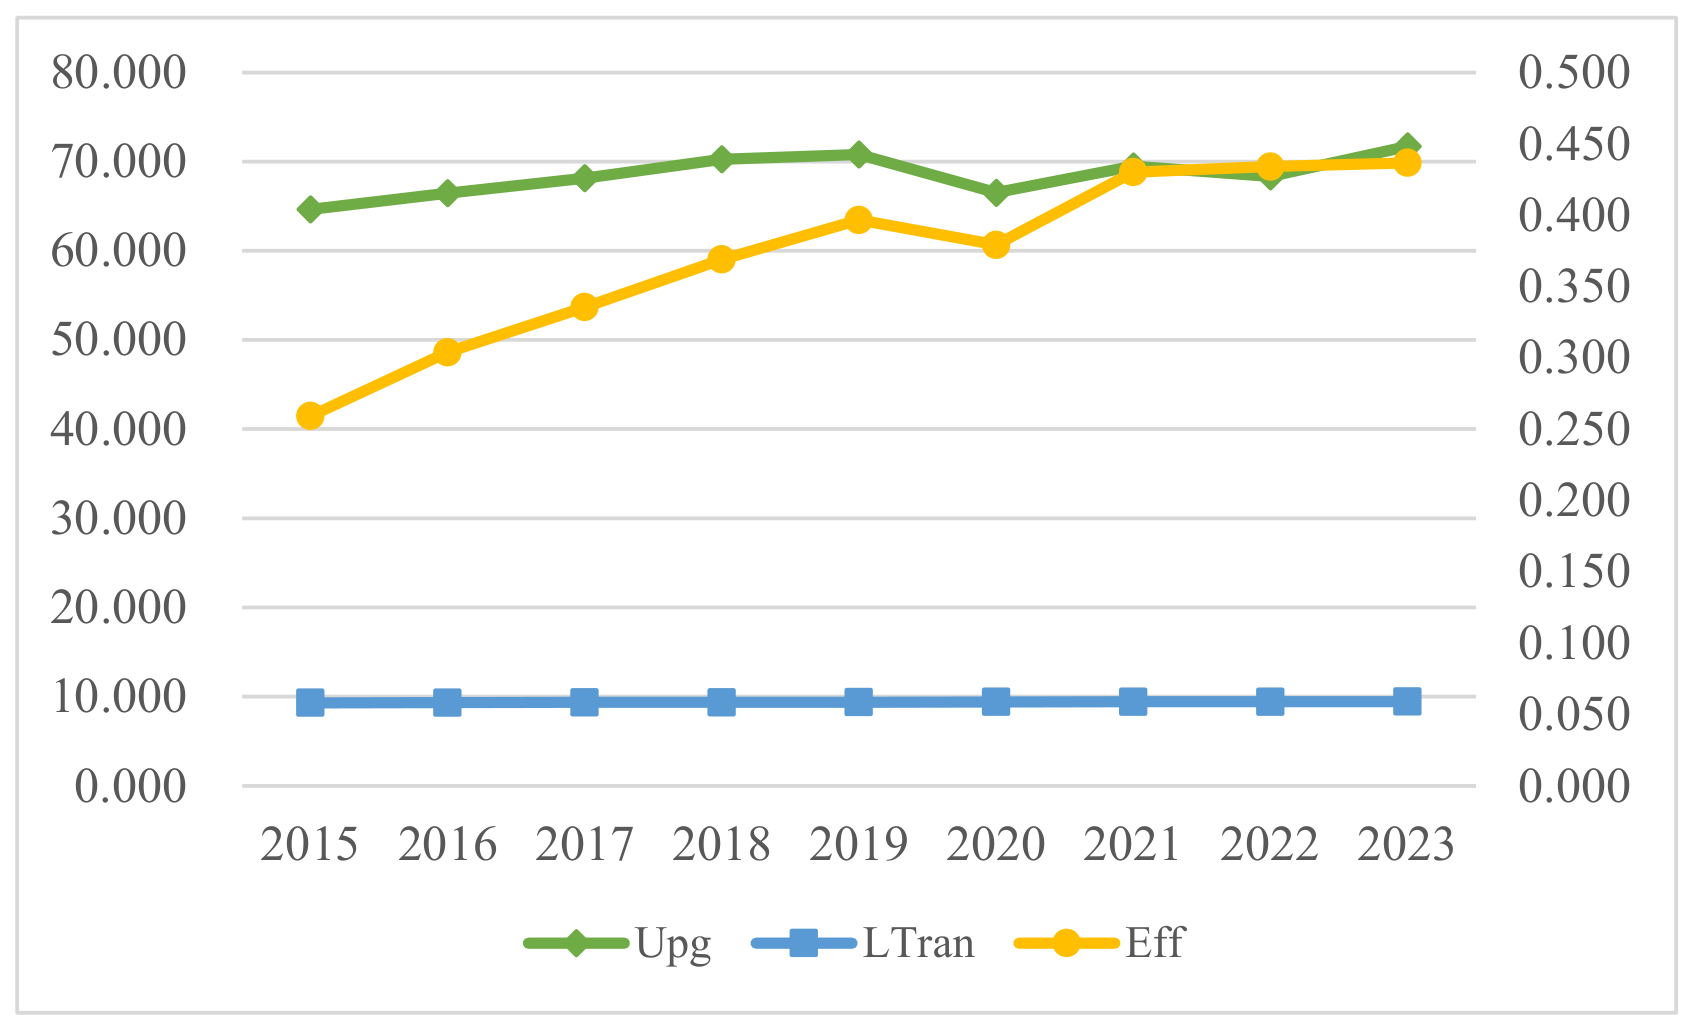
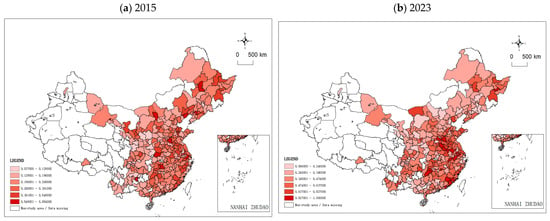
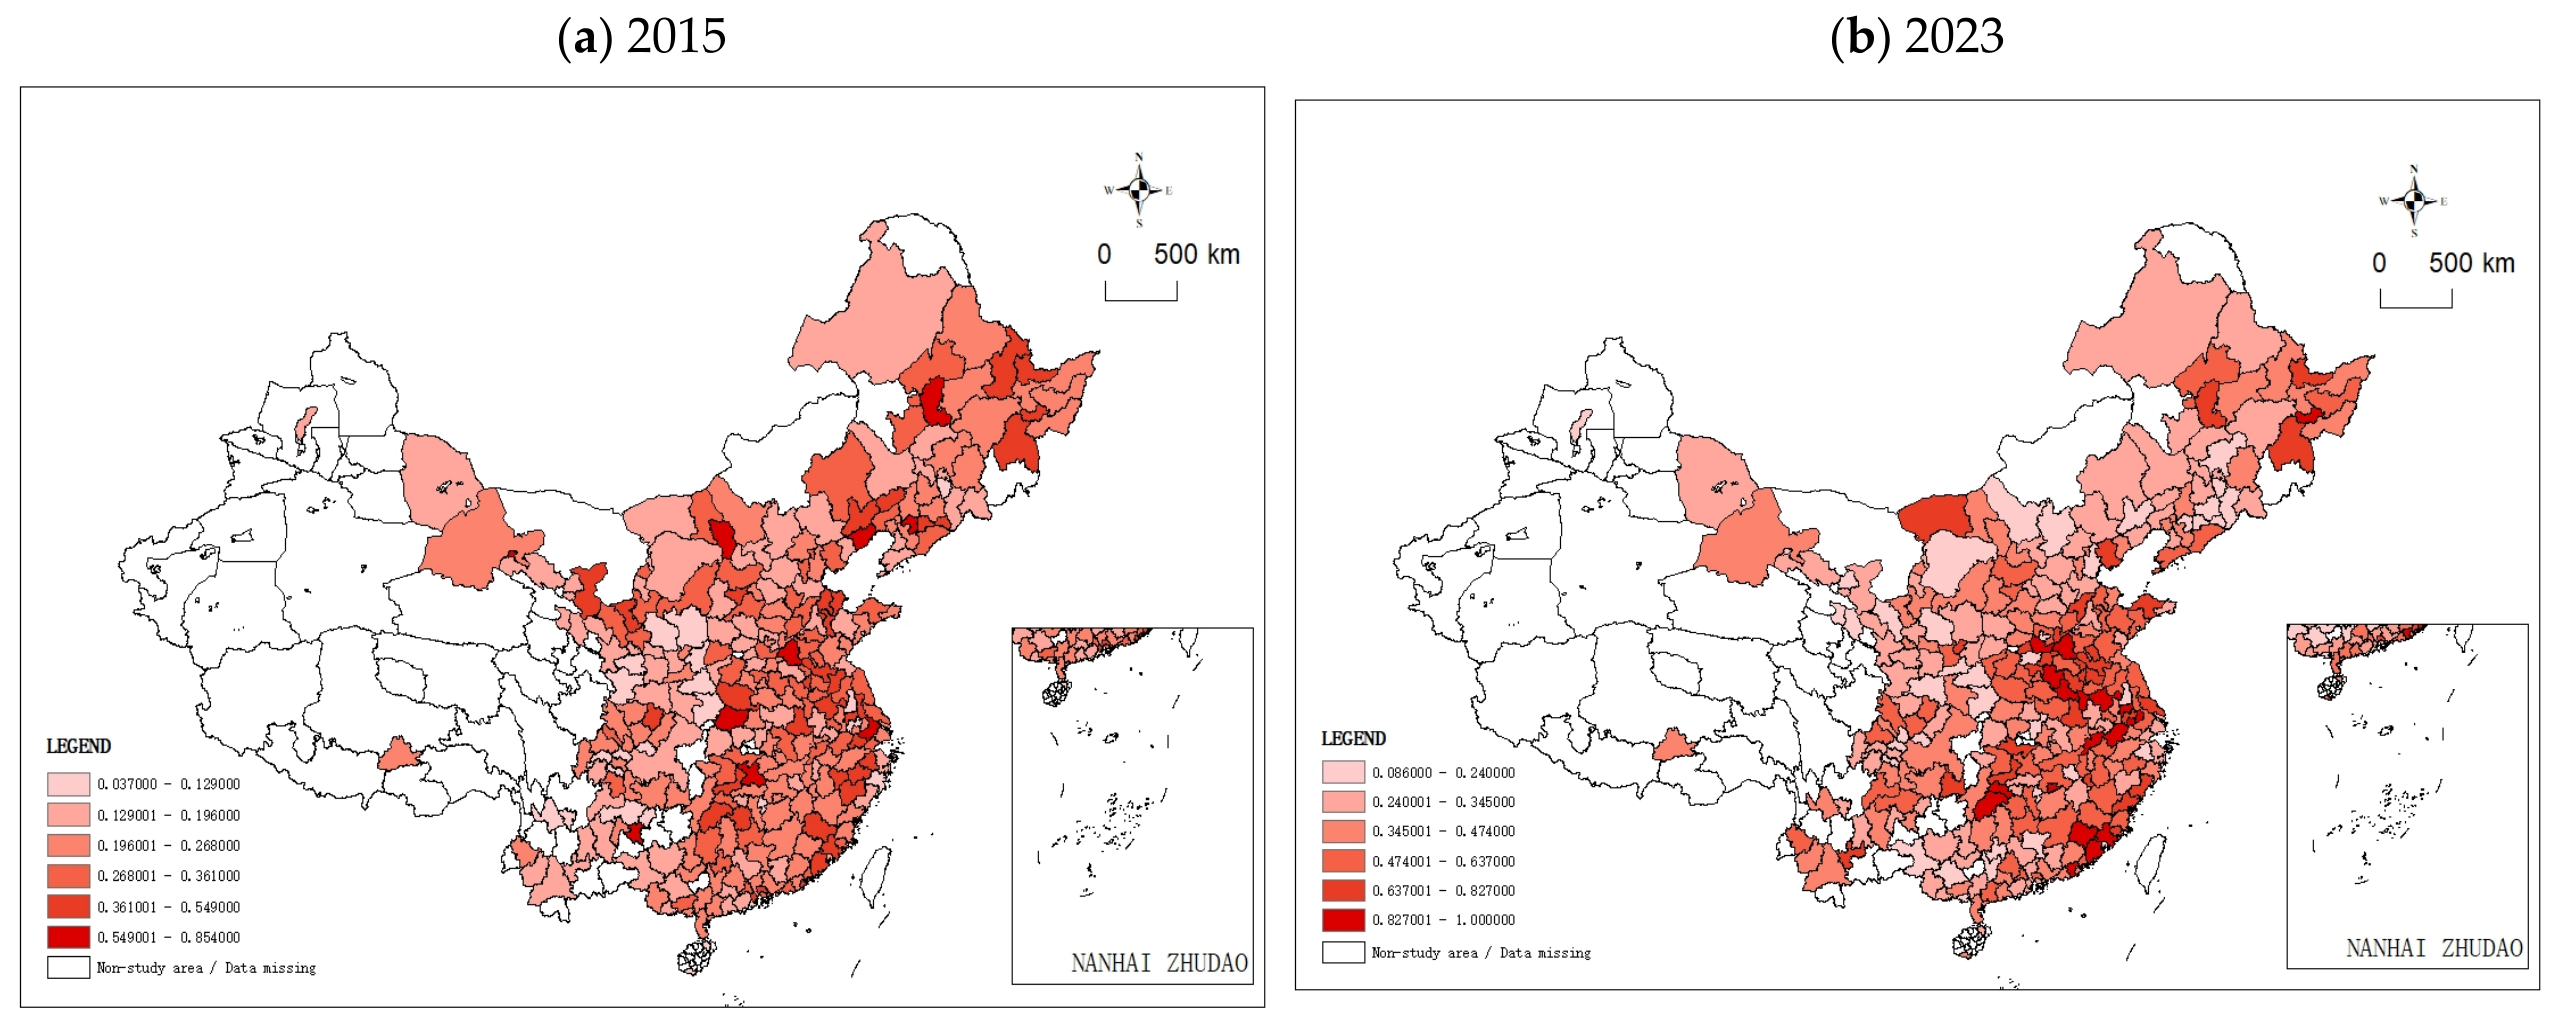
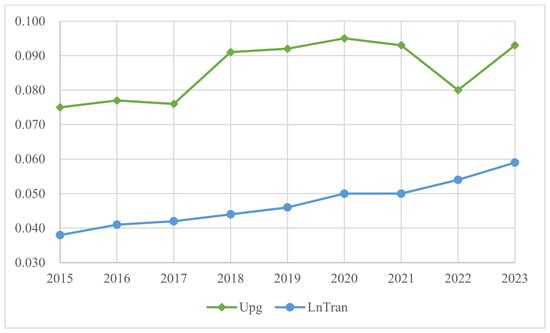
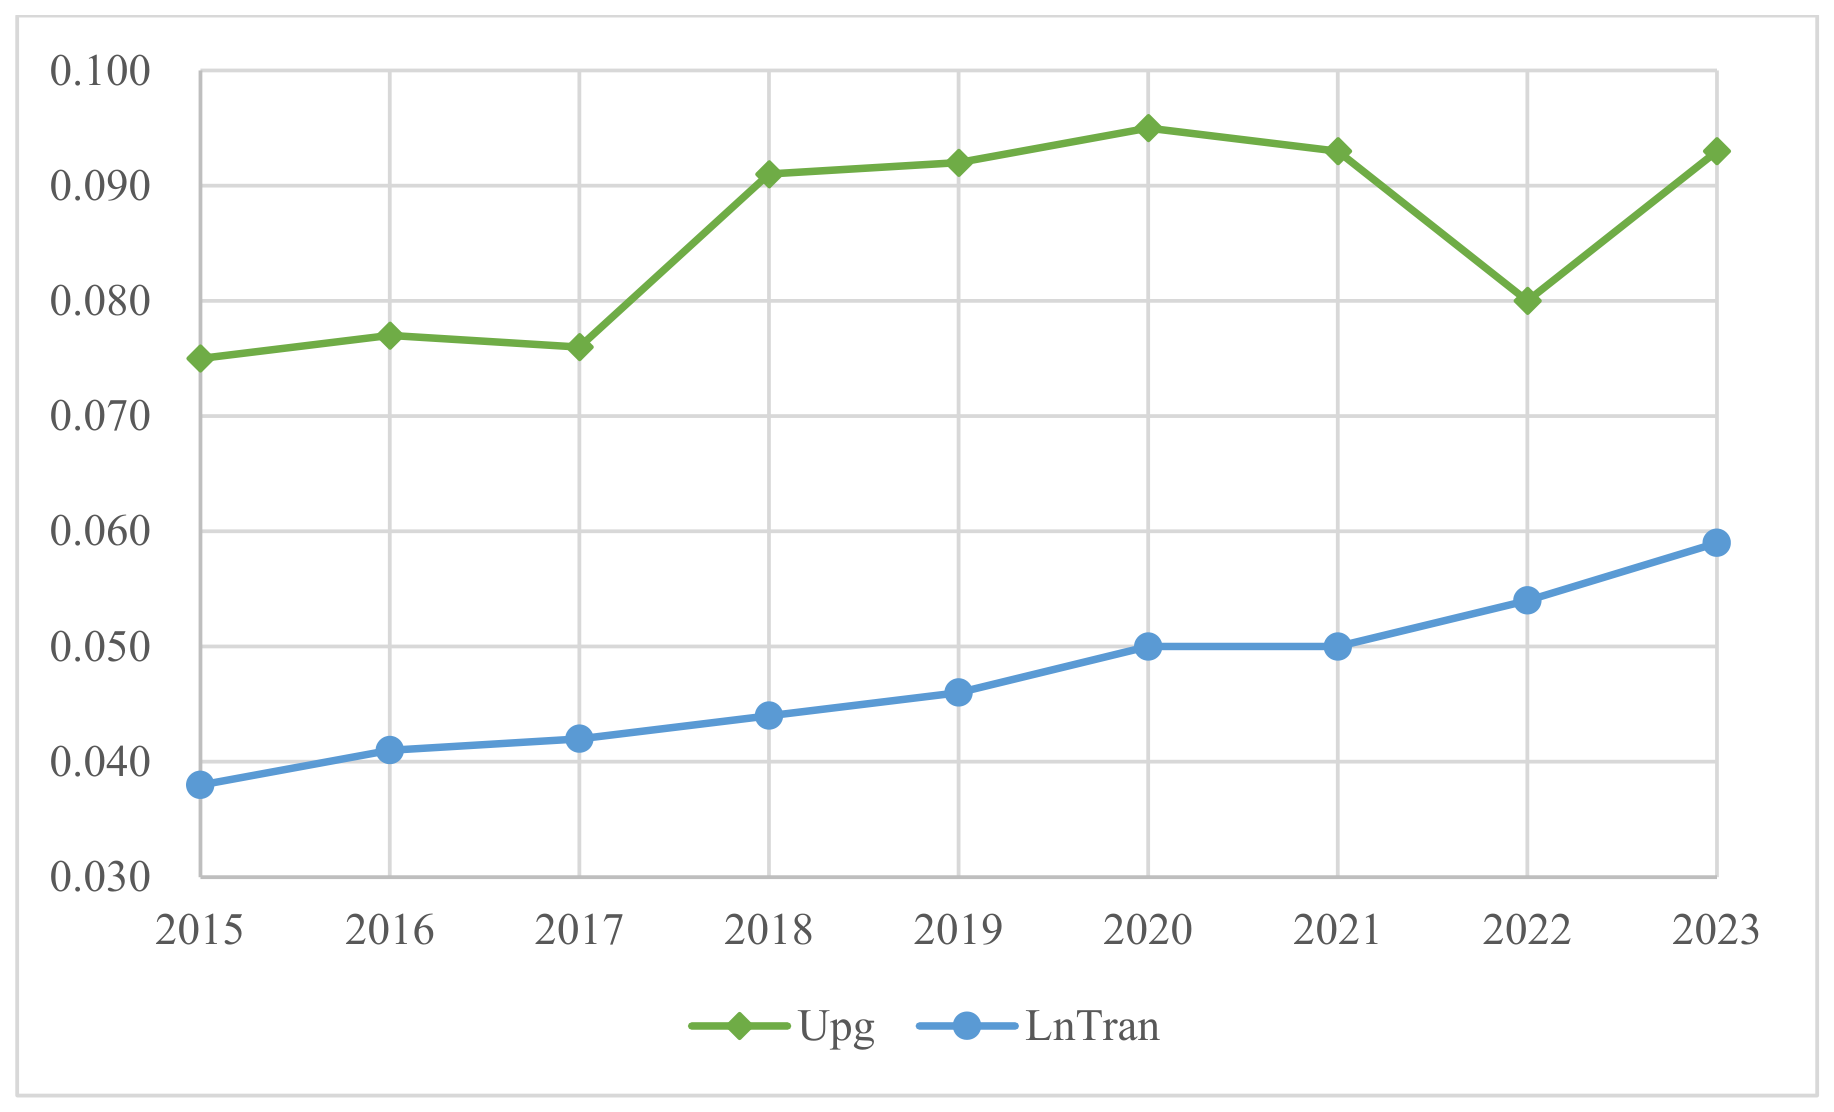
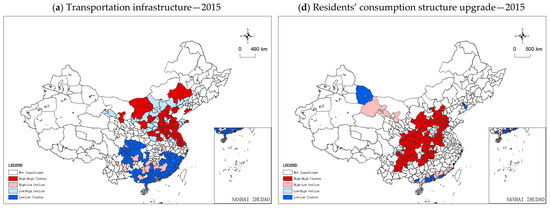
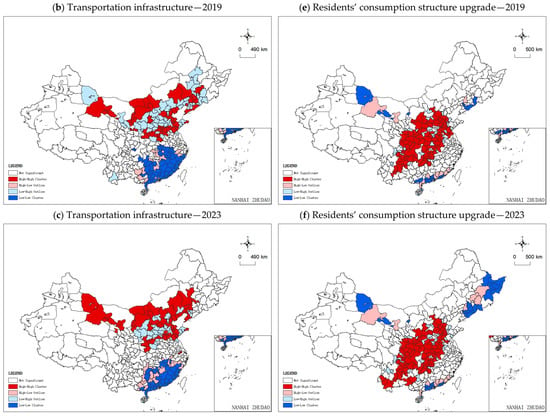
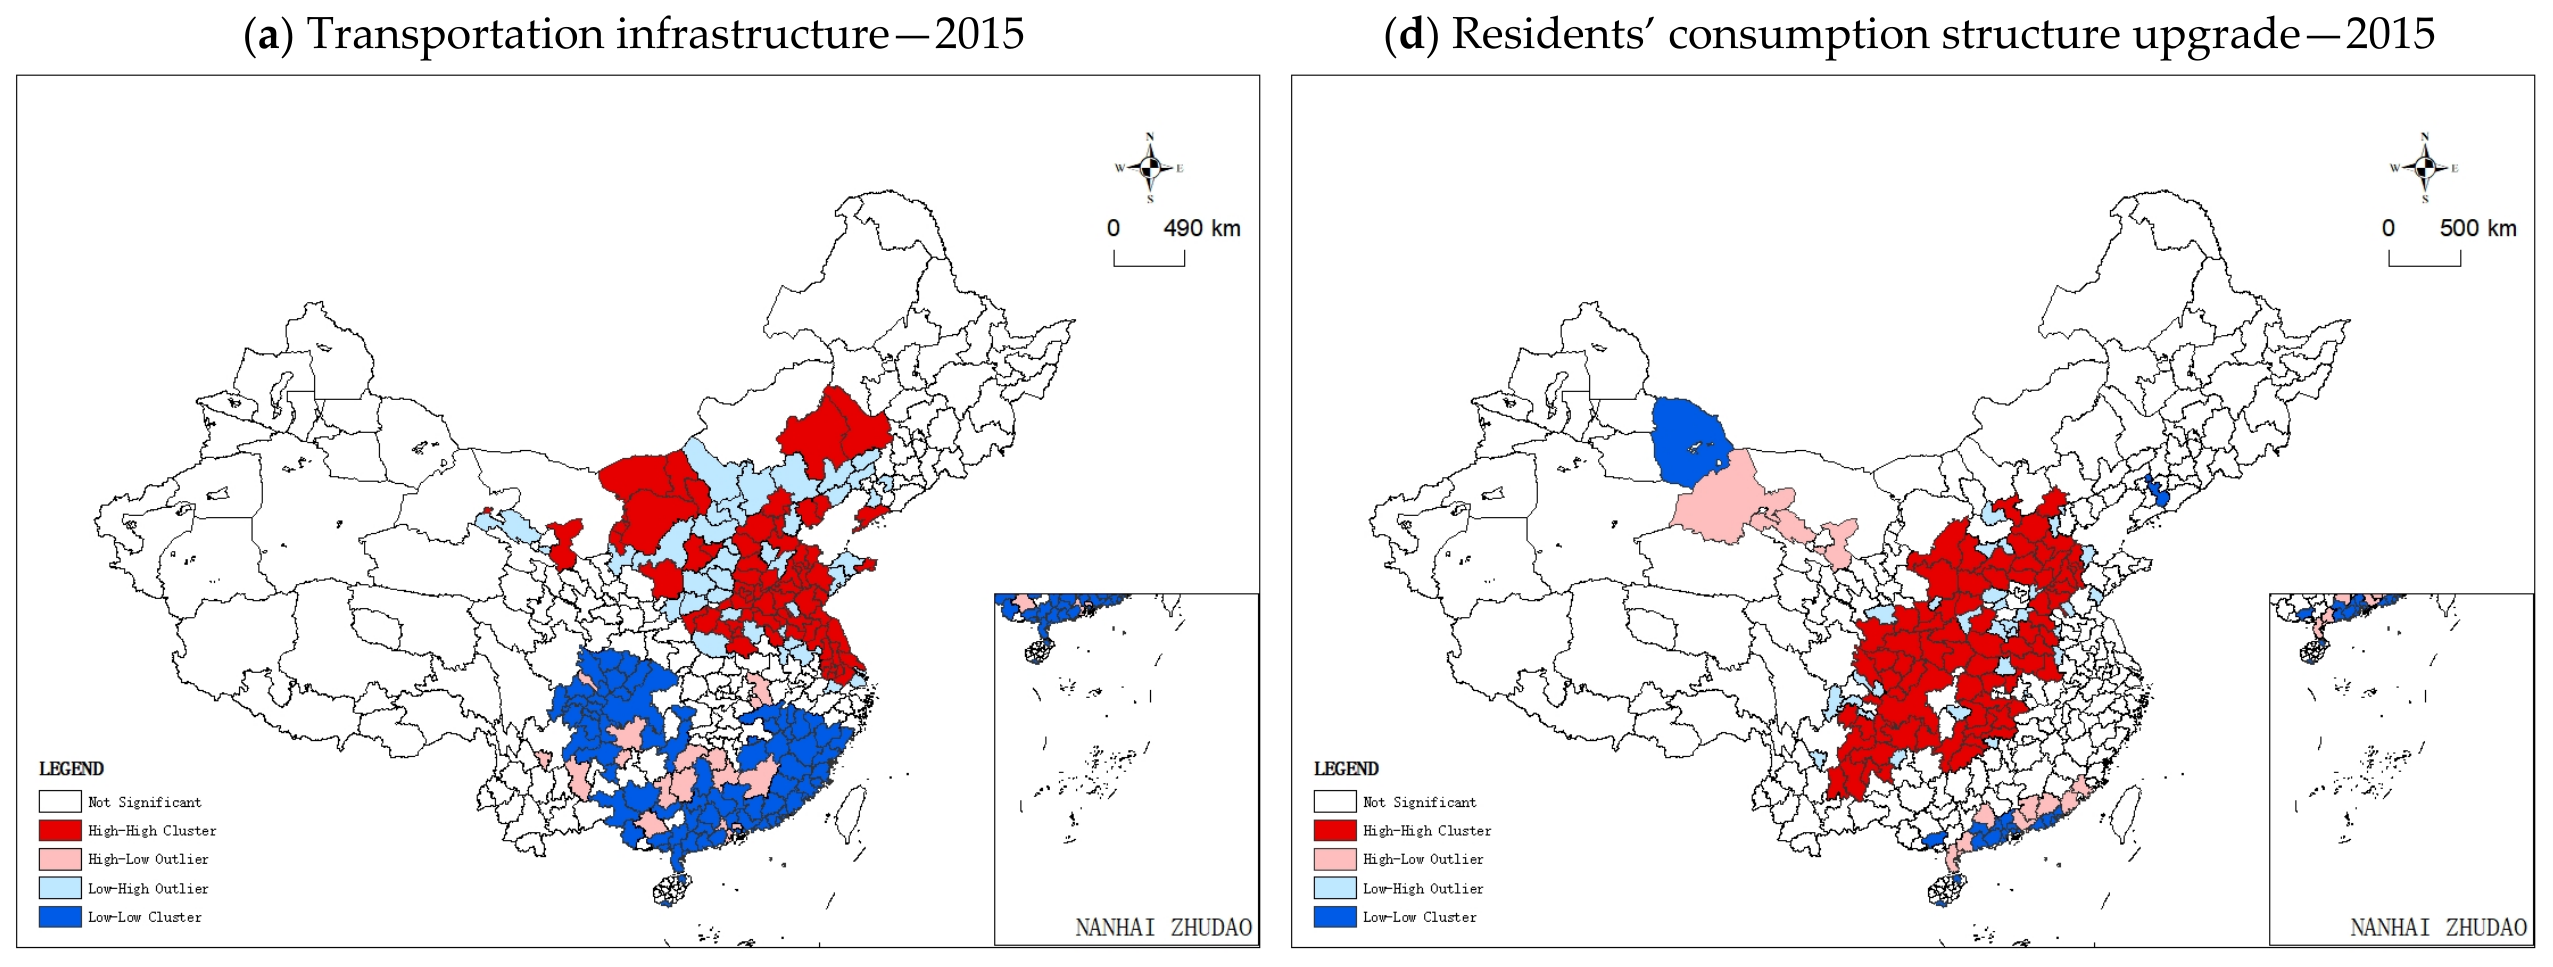
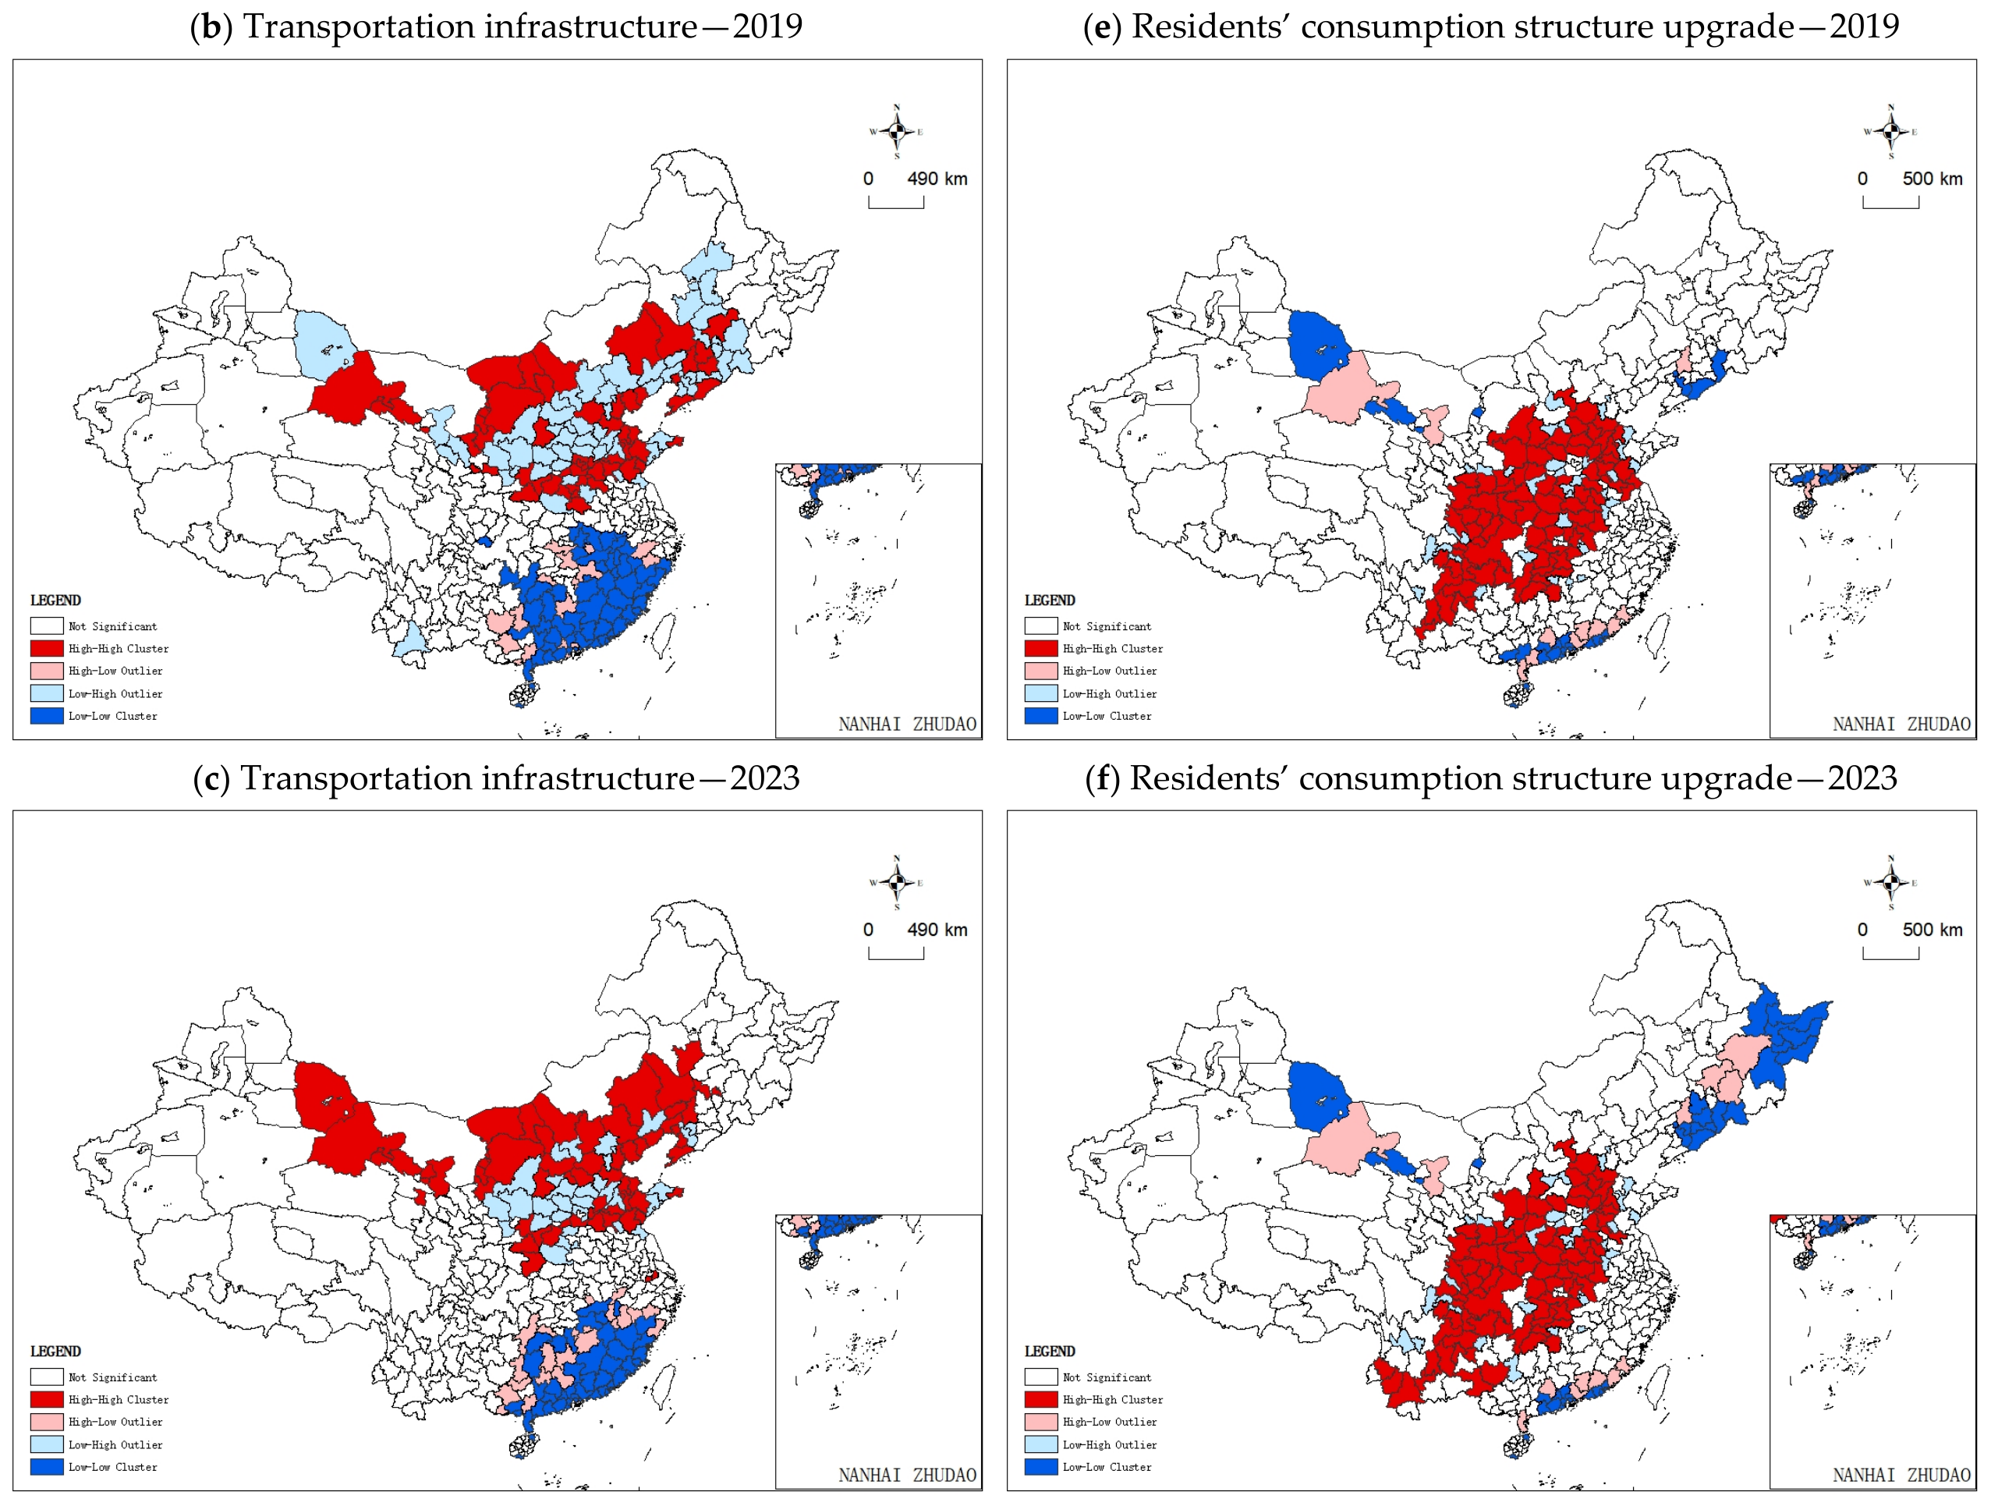

Disclaimer/Publisher’s Note: The statements, opinions and data contained in all publications are solely those of the individual author(s) and contributor(s) and not of MDPI and/or the editor(s). MDPI and/or the editor(s) disclaim responsibility for any injury to people or property resulting from any ideas, methods, instructions or products referred to in the content. |
© 2026 by the authors. Licensee MDPI, Basel, Switzerland. This article is an open access article distributed under the terms and conditions of the Creative Commons Attribution (CC BY) license.