


Abstract
With the continuing advancement of global environmental change and rapid urbanization, rural human settlements are facing multiple pressures, including ecological degradation, spatial decline, population outflow, and functional weakening. Based on the vulnerability analysis framework, studies on rural vulnerability provide an important perspective for assessing villages’ risk exposure, disturbance response, and functional degradation when coping with internal and external disturbances. However, existing studies often rely on single-dimensional or linearly weighted evaluations, making it difficult to comprehensively reveal the coupling relationships among multiple discriminative variables and the spatial differentiation patterns of vulnerability. Taking rural areas in Hancheng City, Shaanxi Province, as the research object, this study selects 12 indicators from three dimensions—natural ecological constraints, settlement spatial organization, and public service support—to provide proxy representations of conditions related to potential rural vulnerability. K-means clustering was used to identify potential vulnerability configuration types under multidimensional indicator combinations. A Python-based XGBoost model was then employed as an interpretable surrogate model to assist in characterizing the clustering boundaries, while SHAP analysis was used to explain the key discriminative variables associated with type membership. The results show that the potential rural vulnerability configurations in Hancheng City present a significant west–central–east spatial differentiation pattern. Elevation, village core density, topographic wetness index, distance to town centers, accessibility of daily service facilities, distance to major roads, and normalized difference vegetation index are the main discriminative variables distinguishing different potential vulnerability configuration types. Among them, village core density shows a particularly strong explanatory role. Different key discriminative variables also exhibit evident nonlinear response characteristics across different potential types. Under the indicator system and the = 4 clustering scheme adopted in this study, the potential rural vulnerability configurations in Hancheng City can be summarized into four types: service-concentrated settlement type, complex terrain-constrained type, human–land coupling transitional type, and natural ecological isolation type. The findings reveal the spatial differentiation characteristics, variable combination relationships, and typological discriminative features of potential rural vulnerability configurations in Hancheng City. They can provide a case-based reference for identifying potential vulnerability, conducting spatial zoning diagnosis, and supporting classified governance in similar county-level rural areas within the loess hilly and gully region. In practical terms, this framework can serve as a diagnostic tool for local governments and planners in classified rural governance. It can be used to identify priority areas for public service and infrastructure investment, review key risk-control areas in complex terrain zones, delineate low-intensity use and protection boundaries in ecologically isolated areas, and guide differentiated resource allocation for different types of villages.
1. Introduction
The combined effects of global environmental change and rapid urbanization are profoundly reshaping the sustainable development of rural areas. Rural settlements commonly face multiple challenges, including settlement decline, population outflow, ecological degradation, and the weakening of sociocultural functions [1,2,3,4]. This trend is particularly evident in China, one of the fastest urbanizing developing countries. While rapid urbanization has promoted economic development, it has also intensified human–land conflicts in rural areas, leading to the compression of ecological space, the disruption of cultural inheritance, and the disintegration of social structures in many villages [5]. Affected by microtopography, locational conditions, and local hydrology, these stress factors exhibit significant spatial differentiation across different locations. Villages in different sections are exposed to varying intensities and types of pressure, resulting in clear spatial differentiation in vulnerability [6,7,8]. Hancheng City, located on the southeastern margin of the Loess Plateau, combines the terrain–ecological constraints of the loess hilly and gully region, traditional village resources, and pressures from urbanization-driven transformation, making it a representative area for examining the spatial differentiation of potential rural vulnerability and the demand for classified governance [9,10,11,12,13]. Current studies on rural areas of the Loess Plateau have mainly focused on macro-level risk assessment or micro-level architectural analysis [9,12,14]. At the rural scale of Hancheng City, there is still a lack of an assessment framework that can finely characterize the spatial patterns of environmental stress and systematically link them with multidimensional vulnerability. Meanwhile, existing studies remain relatively insufficient in discussing what differentiated interventions should be adopted for different types of villages under environmental constraints, urbanization pressures, and uneven public service provision, as well as how these interventions can be connected with local governance tools. From the policy perspective, both comprehensive rural revitalization and the territorial spatial planning system emphasize classified rural development, the improvement of rural infrastructure and public services, and the optimization of ecological–agricultural–urban spatial patterns. These policy priorities provide a practical interface for translating the identification of potential rural vulnerability into local governance tools.
The vulnerability analysis framework provides an important perspective for studying potential rural vulnerability in Hancheng City, with its core focus on identifying risk exposure, disturbance responses, vulnerable links, and directions for classified regulation under external disturbances and multiple pressures [15]. Considering the compound-system characteristics of potential rural vulnerability, this study constructs a vulnerability analysis framework from three dimensions: natural ecological constraints, settlement spatial organization, and public service support. Existing studies have laid an important foundation for assessing potential rural vulnerability in Hancheng City, but further refinement is still needed in terms of integrated research perspectives and discriminative methods. From the perspective of research scope, existing studies have mostly focused on a single dimension, such as natural ecological constraints, settlement spatial organization, or public service support, while lacking a systematic examination of the coupling relationships among the three dimensions [6,8,16,17,18]. Specifically, studies on natural ecological constraints have mainly focused on environmental discriminative variables such as elevation, topographic wetness index, and vegetation coverage; studies on settlement spatial organization have mainly examined morphological characteristics such as distance to town centers and road network structure; and studies on public service support have emphasized facility coverage and accessibility evaluation. However, the associative effects and synergistic interactions among these dimensions have not yet been sufficiently revealed. From the methodological perspective, commonly used linear weighting models, such as the analytic hierarchy process and entropy weight method, rely heavily on preset weights in indicator weighting and comprehensive evaluation, making it difficult to effectively identify complex nonlinear relationships and interaction effects among multiple discriminative variables [17,19,20]. This methodological limitation is particularly evident in the loess hilly and gully region, a special geographical unit characterized by fragmented terrain and significant locational differentiation. In this region, ecological conditions, settlement space, and public service allocation often show stronger coupling and spatial heterogeneity, while the influence pathways of different discriminative variables on potential rural vulnerability are also more complex [12,13,21]. Based on this, the present study attempts to combine the three-dimensional analytical framework of “natural ecological constraints–settlement spatial organization–public service support” with established methods, including KMeans, XGBoost, and SHAP, for the empirical identification of potential rural vulnerability in Hancheng City. The research objective is not only to identify the main discriminative variables, potential types, and spatial differentiation characteristics of potential rural vulnerability in this region, but also to reveal the nonlinear response relationships of key discriminative variables and, on this basis, propose classified governance guidelines linked to service facility optimization, terrain risk control, district-level service sharing, and ecological conservation management [22,23,24,25,26].
The purpose of this study is not to validate an existing vulnerability typology, nor to provide a definitive explanation of actual vulnerability levels or causal formation mechanisms. Rather, it aims to conduct exploratory type identification based on multi-source proxy indicators and further translate the identified results into intervention clues for local planning investigation and classified governance. Specifically, this study first integrates three dimensions—natural ecological constraints, settlement spatial organization, and public service support—to construct an indicator system for evaluating potential vulnerability in the rural case of Hancheng City, and uses KMeans to identify potential vulnerability configuration types under different combinations of indicators. Second, XGBoost is employed as a surrogate model to characterize the reproducibility of clustering labels within the original feature space, while SHAP is used to interpret the main discriminative variables, contribution directions, and nonlinear response characteristics associated with different type memberships. Finally, based on the dominant discriminative variables and spatial distribution characteristics of each type, this study proposes differentiated verification directions and implementation pathway recommendations for local governance. Therefore, the results of this study should be understood as an exploratory typological construction and interpretive analysis, rather than as confirmatory conclusions regarding actual rural vulnerability levels or causal mechanisms (Figure 1). This study focuses on the following four questions:
Figure 1.
Technical workflow diagram.
- (1)
- How can an assessment framework for potential rural vulnerability in Hancheng City be constructed from the three dimensions of natural ecological constraints, settlement spatial organization, and public service support, and how can the key discriminative variables of vulnerability be identified?
- (2)
- Based on combinations of multidimensional proxy indicators, what types of potential vulnerability configurations can be identified in rural Hancheng City, and how is their west–central–east spatial differentiation pattern manifested?
- (3)
- What are the contribution directions and nonlinear response characteristics of the key discriminative variables in determining membership in different potential vulnerability configuration types?
- (4)
- How can the identified potential vulnerability configuration types and their dominant discriminative variables be translated into differentiated intervention priorities, policy coordination directions, and implementation pathways for local decision-makers?
2. Framework
This study first clarifies the basic connotation of potential rural vulnerability at the theoretical level and defines its core analytical dimensions. Second, by reviewing existing evaluation frameworks for potential rural vulnerability, it summarizes their limitations in terms of dimensional integration, nonlinear relationship identification, and governance translation. Finally, in light of the regional environmental characteristics of rural Hancheng City, this study integrates the three-dimensional analytical framework of “natural ecological constraints–settlement spatial organization–public service support,” thereby providing a theoretical basis for subsequent indicator selection, type identification, variable interpretation, and the translation of results into zonal governance strategies.
2.1. Conceptual Definition of Potential Rural Vulnerability
Vulnerability generally refers to the tendency or condition of a system to be adversely affected under external disturbances and sustained pressures. Its analysis commonly focuses on risk exposure, sensitive responses, and insufficient support capacity [27,28]. With the development of social–ecological systems research, vulnerability is no longer understood simply as disaster loss or a single risk outcome, but rather as a relatively fragile condition shaped by the combined effects of external pressures, structural system conditions, and support capacity [28,29,30]. For rural areas, potential vulnerability is not only reflected in disaster risk or ecological degradation, but is also closely related to factors such as settlement location, transport connections, public services, population activities, and infrastructure support. Therefore, this study does not directly measure disaster losses, declines in residents’ living standards, or externally validated actual vulnerability levels. Instead, it understands potential rural vulnerability as a latent unfavorable configuration formed by the combined effects of multiple spatial conditions.
Based on the IPCC’s understanding of vulnerability, this study further decomposes potential rural vulnerability into three theoretical dimensions: exposure, sensitivity, and adaptive capacity [30]. Exposure mainly refers to the external pressure background faced by rural units, including natural terrain, hydrological environment, geological disturbances, and locational conditions. Sensitivity mainly refers to the degree to which rural settlements are susceptible to disturbances under differences in natural constraints, ecological background, population activities, and spatial organization. Adaptive capacity mainly refers to the supporting capacity of road connections, public services, daily services, and basic guarantee conditions in maintaining the daily operation of rural systems and responding to disturbances. The three-dimensional framework of “natural ecological constraints–settlement spatial organization–public service support” in this study is an operational translation of the above IPCC vulnerability components in the rural context of Hancheng City, rather than a redefinition of the concept of vulnerability. The dimension of natural ecological constraints is mainly used to characterize differences in ecological background, such as terrain relief, hydrological accumulation, vegetation coverage, gully development, and geological disturbances, and serves as the spatial expression of exposure and ecological sensitivity [12,31,32,33]. The dimension of settlement spatial organization mainly characterizes village location, transport connections, settlement agglomeration, and spatial organization, reflecting differences in the spatial responses of rural systems when facing external pressures [8,9,11,21]. The dimension of public service support mainly characterizes public service coverage, accessibility of daily services, and the intensity of population activities, and represents the supporting conditions for rural systems to maintain daily operation and cope with disturbances [27,34,35,36]. Together, these three dimensions constitute the analytical basis for subsequent indicator selection, potential type identification, and model interpretation, rather than a direct determination of actual vulnerability levels.
2.2. Limitations of Existing Evaluation Frameworks for Potential Rural Vulnerability
Existing studies have explored rural vulnerability and its spatial differences from the perspectives of natural ecology, settlement space, public services, and human settlement quality, providing an important foundation for identifying risk exposure, spatial differentiation, and governance shortcomings in rural systems [6,7,8,16,37]. However, for the specific regional case of rural Hancheng City, which combines the loess hilly and gully landform, spatial differentiation of traditional settlements, and uneven public service allocation, existing studies still have three main limitations. First, in terms of research perspective, most studies focus on a single dimension, such as natural ecology, settlement space, or public services, while paying insufficient attention to the combined relationships and spatial heterogeneity among these dimensions. Second, in terms of research methods, linear evaluation methods such as the analytic hierarchy process and entropy weight method rely heavily on preset weights, making it difficult to characterize nonlinear relationships among multiple discriminative variables and differences in type membership. Third, in terms of application transformation, existing studies mostly remain at the level of vulnerability identification or grade evaluation, with insufficient discussion of how the identified results can be translated into differentiated intervention priorities and implementation pathways in local governance [17,20].
Rapid urbanization and economic development pressures usually affect the state of potential rural vulnerability through processes such as land-use change, population mobility, and spatial restructuring, and may further intensify ecological risks and insufficient social support [1,3,35,38]. Existing studies have begun to employ methods such as MGWR, PLS-SEM, and Geodetector to analyze influencing factors and spatial heterogeneity, providing important insights into the multi-factor effects shaping rural vulnerability [17,20]. However, for rural Hancheng City, simply identifying “which areas are more vulnerable” is still insufficient to support classified governance. It is also necessary to further identify potential configuration types under different combinations of indicators and explain the contribution directions and nonlinear response characteristics of the main discriminative variables in determining different type memberships. Therefore, this study combines the three-dimensional analytical framework of “natural ecological constraints–settlement spatial organization–public service support” with established methods such as KMeans, XGBoost, and SHAP to identify the potential vulnerability configuration types, core discriminative variables, and spatial differentiation characteristics of rural Hancheng City, thereby providing empirical support for subsequent differentiated governance and planning verification [22,23,24,25,39].
2.3. Construction of the Evaluation Framework for Potential Rural Vulnerability in Hancheng City
Based on the above conceptual definition and research limitations, this study integrates a three-dimensional evaluation framework consisting of natural ecological constraints, settlement spatial organization, and public service support. Grounded in the regional environmental characteristics of rural Hancheng City, this framework translates these three dimensions into a quantifiable indicator system, which is used to characterize the multidimensional combinations and spatial differences in conditions related to potential rural vulnerability.
The dimension of natural ecological constraints is used to characterize the terrain, hydrological, ecological background, and geological disturbance conditions of rural units. It includes five indicators: elevation, topographic wetness index (TWI), normalized difference vegetation index (NDVI), gully density, and landslide trace density. Elevation reflects terrain relief and constraints on construction suitability. In the context of the loess hilly and gully region, higher elevation is usually associated with more complex terrain conditions, greater engineering implementation difficulty, and stronger limitations on spatial expansion, which may increase potential rural vulnerability [12,32,33,37]. The topographic wetness index reflects surface runoff accumulation and soil moisture conditions. A higher TWI often indicates more pronounced runoff concentration and stronger hydrological vulnerability; in the loess hilly and gully region, this hydrological vulnerability may be accompanied by higher risks of erosion, flooding, or geological hazards [12,31,32]. The normalized difference vegetation index reflects vegetation coverage and ecological regulation capacity. A lower NDVI generally indicates poorer vegetation coverage, weaker soil and water conservation capacity, and reduced ecosystem stability, thereby weakening the ability of villages to cope with environmental disturbances [40]. Gully density characterizes the degree of surface dissection and geomorphological fragmentation in the loess hilly and gully region, while landslide trace density reflects the background of historical geological disturbances and potential hazard risks. Together, these indicators are used to describe the natural ecological constraint conditions within potential rural vulnerability configurations.
The dimension of settlement spatial organization is used to characterize the locational accessibility, transport connections, and spatial agglomeration of rural units. It includes four indicators: distance to town centers, road network density, distance to major roads, and village core density [8,9,11,21]. Distance to town centers reflects the spatial proximity between evaluation units and urban service nodes; road network density reflects the development level of the internal transport network within the region; distance to major roads reflects the convenience of connection between evaluation units and major transport corridors; and village core density reflects the spatial concentration of village points and the potential for inter-village connections. Together, these indicators are used to describe the spatial organization and locational connectivity characteristics within potential rural vulnerability configurations.
The dimension of public service support is used to characterize the basic public services, daily living services, and population activity support conditions of rural units. It includes three indicators: public service facility coverage, accessibility of daily service facilities, and permanent population density [8,35,38]. Public service facility coverage reflects the coverage of basic public service facilities such as education, healthcare, and cultural facilities [27,34,35]. Accessibility of daily service facilities reflects the convenience with which residents can access daily living services [36,38]. Permanent population density reflects the intensity of population activity and the demand basis for public services [35,41,42]. Together, these indicators are used to describe the social support conditions within potential rural vulnerability configurations.
3. Materials and Methods
3.1. Study Area
Hancheng City is located in eastern Shaanxi Province, on the western bank of the Yellow River and in the northeastern part of the Guanzhong Plain. Its geographical coordinates are approximately between 110°07′–110°37′ E and 35°18′–35°52′ N. It borders Yichuan County of Yan’an City to the north, Huanglong County to the west, Heyang County of Weinan City to the south, and faces Hejin City, Xiangning County, Wanrong County, and other counties and cities in Shanxi Province across the Yellow River to the east (Figure 2), with a total area of approximately 1621 km2. According to the List of Traditional Villages in Shaanxi Province and the List of Famous Historical and Cultural Villages, several national-level traditional villages are distributed within Hancheng City, represented by historical and cultural settlements such as Dangjia Village, forming a rural settlement pattern with a certain degree of spatial concentration. Hancheng City is characterized by strong terrain dissection and relatively prominent geological hazard risks. A landslide trace database for Hancheng was constructed based on high-resolution remote sensing imagery, identifying 6785 landslide traces within an area of 1621 km2, with a total area of approximately 95.38 km2, accounting for 5.88% of the study area. These landslide traces are more concentrated in the central region, indicating obvious spatial differences in ecological constraints and terrain-related risks [12,43,44,45]. From the perspective of social development, Hancheng City also faces multiple governance tasks, including the protection of historical and cultural heritage, urban–rural transformation, and the improvement of public services. The Hancheng municipal government work report and annual development plan both emphasize the implementation of the Territorial Spatial Master Plan (2021–2035), the integration of township-level infrastructure, and the equalization of basic public services. Studies on Dangjia Village also show that local traditional settlements have long faced multiple pressures related to society, economy, environment, and governance during the process of protection and development. Therefore, rural areas in Hancheng City show a strong need for vulnerability identification across the three dimensions of natural ecological constraints, settlement spatial organization, and public service support, making Hancheng a representative area for studying potential rural vulnerability [9,12].
Figure 2.
Location Map of the Study Area. (a) Location map of China; (b) Location map of Weinan City; (c) Location map of Hancheng City.
3.2. Data Sources and Preprocessing
To systematically assess potential rural vulnerability in Hancheng City, this study integrates multi-source spatial data and constructs an indicator database around three dimensions: natural ecological constraints, settlement spatial organization, and public service support. The data sources of each indicator are detailed in Table 1.
Table 1.
Evaluation Indicators and Data Sources for Potential Rural Vulnerability in Hancheng City.
To enhance the reproducibility of the data processing procedure, this study further records the year, spatial resolution, and processing method of each type of data. Except for the normalized difference vegetation index, which was calculated using Landsat 8/9 OLI imagery from 2024, permanent population density was derived from 2025 population data, while the remaining datasets, including DEM, road networks, POIs, village points, town centers, gully networks, and landslide traces, were obtained or compiled from 2025 data versions. Given the differences among data sources in acquisition time, data structure, and spatial accuracy, the results of this study are positioned as a near-time cross-sectional identification based on the 2025 baseline and the vegetation-cover background of 2024, rather than as a long-term dynamic change analysis in the strict sense.
Considering the scale characteristics of the study area, spatial heterogeneity, compatibility of multi-source data, and computational feasibility of the models, this study selects a 100 m × 100 m grid as the basic evaluation unit. First, rural settlements, road networks, service facilities, and gully landforms in Hancheng City all exhibit strong local spatial variation. Overly coarse spatial units may obscure differences in microtopography, transport accessibility, and service facility distribution around villages, whereas a 100 m grid can better retain spatial heterogeneity at the municipal rural scale. Second, this study integrates multi-source data, including remote sensing raster data, DEM, population raster data, POIs, road networks, and village points, which differ considerably in their original spatial accuracy. A 100 m grid is compatible with remote sensing data of approximately 30 m resolution and relatively high-precision DEM data, while also reducing the excessive influence of positional errors in vector data such as POIs, roads, and village points on individual pixels. Third, compared with administrative village or township units, regular grids facilitate the calculation of indicators such as distance, density, coverage, and accessibility, and can, to some extent, reduce the influence of differences in administrative unit area on spatial statistical results. Finally, considering the area of the study region, sample size, and the computational requirements of the subsequent KMeans, XGBoost, and SHAP models, the 100 m grid provides a relatively good balance between spatial detail and computational efficiency. It should be noted that the 100 m grid cannot completely eliminate scale sensitivity or the modifiable areal unit problem, and different grid scales may lead to changes in type boundaries and local clustering results. Therefore, this study treats the 100 m grid as a compromise analytical unit suitable for the municipal rural scale and further discusses scale effects in the research limitations.
During spatial preprocessing, all datasets were converted to the same projected coordinate system and clipped according to the administrative boundary of Hancheng City. Raster data were resampled and spatially aligned with the 100 m × 100 m grid, and values were assigned using grid mean or grid statistical methods. Vector point, line, and polygon data were converted into grid-scale indicators using methods such as nearest-neighbor distance, unit-area density, kernel density estimation, service-area coverage, and distance-decay accessibility. Through these procedures, data from different sources, formats, and spatial resolutions were uniformly transformed into 12 proxy indicators of potential vulnerability under the same evaluation unit.
3.3. Data Processing of Evaluation Indicators
Based on the grid-processed multi-source data, this study further conducts quantitative modeling of the 12 proxy indicators of potential vulnerability. Raster-based indicators are mainly assigned using grid mean values or statistical values; distance-based indicators are calculated using the nearest-neighbor distance method; density-based indicators are calculated using unit-area density or kernel density estimation; and coverage and accessibility indicators are calculated using service-area coverage ratios and distance-decay methods, respectively. The specific calculation formulas, variable meanings, and indicator explanations are presented in Table 2.
Table 2.
Construction of Indicators for Potential Rural Vulnerability in Hancheng City.
After constructing the 12 indicators at the grid scale, this study applies Z-score standardization to all continuous indicators in order to eliminate the effects of differences in measurement units, value ranges, and spatial distributions on KMeans distance calculation and XGBoost surrogate model training. The formula is as follows:
where denotes the original value of evaluation unit for indicator , and denote the mean and standard deviation of indicator , respectively. represents the standardized indicator value. After standardization, each indicator has a mean of 0 and a standard deviation of 1, thereby ensuring the comparability of indicators with different units in the clustering analysis and surrogate model training. It should be noted that this study does not uniformly convert all indicators into positive or negative vulnerability scores. Instead, their original spatial meanings are retained, and unsupervised clustering is used to identify potential vulnerability configuration types under different combinations of indicators. After the above processing, a standardized indicator matrix is formed for subsequent KMeans clustering, XGBoost surrogate modeling, and SHAP-based interpretive analysis.
3.4. Clustering Analysis
To identify the configuration types of conditions related to potential rural vulnerability in Hancheng City, this study applied the KMeans algorithm to conduct unsupervised clustering analysis on the standardized evaluation units [46,47,48]. A total of 284,380 valid evaluation units are included in the clustering analysis, covering 12 indicators across the three dimensions: natural ecological constraints, settlement spatial organization, and public service support. KMeans is a distance-based partitioning clustering method that can automatically divide evaluation units with similar attribute characteristics into several categories according to their similarity in a multidimensional feature space. It is therefore suitable for regional type identification and spatial feature analysis. Let the standardized sample set be denoted as , where n = 284,380 represents the number of evaluation units, and denotes the feature vector of the i-th sample across p indicators. KMeans iteratively updates the cluster centroids, divides the samples into K clusters, and aims to minimize the within-cluster sum of squares. Its objective function can be expressed as follows:
where denotes the -th cluster, represents the centroid of the -th cluster, and is the squared Euclidean distance between sample and its corresponding cluster centroid.
Because the indicators differ in measurement units and numerical ranges, continuous variables were standardized using Z-score normalization before clustering to avoid the excessive influence of variables with larger numerical values on Euclidean distance calculation. During clustering, the number of clusters was set to = 4. Random initialization (init = ‘random’) was adopted, and the algorithm was repeated 20 times (n_init = 20) to improve the stability of the clustering results.
The determination of the number of clusters was not based on a single statistical indicator alone, but on a comprehensive consideration of clustering validity indicators, spatial type distinguishability, theoretical interpretation of potential rural vulnerability, and the needs of classified governance. Specifically, this study first used the silhouette coefficient and the elbow method to compare clustering performance under different values, in order to evaluate within-cluster compactness and between-cluster separation. Second, the spatial results of = 3 and = 4 were compared to examine whether different numbers of clusters could produce typological structures with clear spatial continuity and practical interpretive meaning. Finally, considering the compound differences in natural ecological constraints, settlement spatial organization, and public service support among rural areas in Hancheng City, this study assessed whether different clustering schemes could effectively distinguish the main vulnerability-related contexts. Based on these considerations, this study adopts = 4 as an interpretable and operational classification scheme under the adopted indicator system. This choice does not imply that = 4 is the objectively optimal solution across all statistical indicators. Rather, it represents a practical compromise among acceptable statistical performance, spatial pattern distinguishability, and typological interpretability.
3.5. XGBoost Surrogate Model and Interpretation of Clustering Labels
It should be noted that the KMeans clustering results in this study are not derived from external observations, expert judgments, or independent vulnerability levels, but are unsupervised typological labels generated from the same set of evaluation indicators. Therefore, XGBoost does not serve to independently predict or externally validate the potential rural vulnerability configuration types in this study, and its classification accuracy cannot be interpreted as direct evidence of the validity of the typological system. The purpose of using XGBoost is to construct an interpretable surrogate model that can approximately reproduce the KMeans clustering boundaries, thereby describing the separability, reproducibility, and main discriminative variables of the clustering types within the original feature space. In other words, the role of XGBoost-SHAP is to explain “how the model reproduces the clustering labels based on the original indicators,” rather than to prove that “these clustering labels represent validated real-world vulnerability types.” Based on the unsupervised clustering results, this study employs XGBoost to construct a surrogate model, using the 12 proxy indicators of potential vulnerability as input variables and the KMeans clustering results as output labels, in order to fit the classification boundaries of the clustering labels within the original feature space [22,49,50]. The purpose of this step is not to test whether real vulnerability types are valid, but to provide an interpretable supervised learning structure for subsequent SHAP analysis, so that the variable contributions and nonlinear response characteristics of different clustering labels can be further characterized.
XGBoost is developed from the Gradient Boosting Decision Tree (GBDT) framework. Its core idea is to iteratively add multiple decision trees and continuously fit the residuals of the previous model, thereby gradually improving overall classification performance. For a given sample , the model prediction can be expressed as
where is the predicted value of sample , denotes the output of the t-th tree for sample , and T is the number of decision trees. Compared with traditional gradient boosting models, XGBoost introduces a regularization term into the objective function to control model complexity and reduce the risk of overfitting. The objective function can be expressed as
where s the loss function, and is the regularization term used to constrain the complexity of the tree structure. By introducing regularization, XGBoost can improve classification accuracy while maintaining good generalization performance.
During model implementation, the four potential types generated by KMeans were used as the class labels of the surrogate model, and the samples were randomly divided into training and testing sets at a ratio of 7:3. Since the evaluation units in this study are 100 m × 100 m grids, adjacent grid samples may exhibit spatial autocorrelation in indicators such as terrain, transportation, service facilities, and population. A random split may therefore allow spatially neighboring samples to enter both the training and testing sets, which could lead to an overestimation of model accuracy. Therefore, in the training of the XGBoost surrogate model, this study did not conduct grid search or cross-validation-based hyperparameter tuning, but instead adopted fixed parameter settings for model training. The parameter settings mainly served stable model fitting, avoidance of excessive model complexity, and subsequent SHAP interpretation, rather than the pursuit of optimal predictive performance for external ground-truth labels. Specifically, the model was set as a multi-class classification task, with the number of classes corresponding to the four potential vulnerability configurations obtained from KMeans clustering; the 12 standardized proxy indicators of potential vulnerability were used as input variables, and the KMeans clustering labels were used as output labels. Key parameters, including the number of trees, maximum tree depth, learning rate, subsample ratio, feature sampling ratio, and regularization parameters, were all set according to the default settings of XGBoost. It should be noted that the purpose of using XGBoost in this study is to construct an interpretable surrogate model to reproduce the KMeans clustering labels and provide a model basis for SHAP interpretation, rather than to establish an optimal prediction model for externally validated real vulnerability levels. Therefore, the model parameters were mainly used to ensure the stable fitting and interpretive consistency of the surrogate model [23,24,48,51,52].
4. Results
4.1. Spatial Quantification Results of Discriminative Variables Related to Potential Vulnerability
Figure 3 presents the spatial quantification results of the 12 discriminative variables related to potential rural vulnerability in Hancheng City. These discriminative variables exhibit significant spatial heterogeneity, with different dimensions showing distinct distribution characteristics. The dimension of natural ecological constraints is mainly characterized by terrain differentiation; the dimension of settlement spatial organization presents a center–periphery and transport-corridor differentiation pattern; and the dimension of public service support shows a pattern of localized agglomeration but generally low overall levels.
Figure 3.
Spatial Quantification Maps of Discriminative Variables Related to Potential Rural Vulnerability. (a) Digital Elevation Model; (b) Topographic Wetness Index; (c) Normalized Difference Vegetation Index; (d) Gully Density; (e) Landslide Scar Density; (f) Distance to Town Centers; (g) Road Network Density; (h) Distance to Major Roads; (i) Village Core Density; (j) Public Service Facility Coverage; (k) Accessibility of Daily Service Facilities; (l) Resident Population Density.
In Figure 3a, the elevation shows a clear west-high and east-low pattern. High-value areas are mainly distributed in the western and northwestern parts, while low-value areas are concentrated in the eastern and southeastern parts. This indicates significant terrain relief in the study area, suggesting that geomorphological conditions impose a fundamental constraint on the configuration pattern of potential rural vulnerability; high-elevation areas are associated with stronger construction limitations and higher ecological vulnerability. In Figure 3b, the topographic wetness index is generally dominated by medium and low values, while higher-value areas are mainly distributed in belt-like patterns along the eastern, southeastern, and local gully areas. This indicates that water accumulation conditions in the study area are strongly controlled by terrain and gully morphology, with gullies and low-lying areas more likely to form higher-moisture environments. In Figure 3c, the normalized difference vegetation index shows clear regional differences. High-value areas are mainly distributed in the eastern and southeastern parts, while low-value areas are concentrated in the western and northwestern parts. This suggests significant spatial differentiation in vegetation coverage, with a better ecological background in the eastern and southeastern areas and relatively lower vegetation coverage in the western and northwestern areas. In Figure 3d, gully density generally presents linear and network-like distribution patterns, with widely developed gullies and medium-to-high values continuously distributed along major gullies, reflecting obvious surface dissection characteristics in the study area. This indicates that loess gully landforms are an important natural constraint affecting the spatial organization of rural settlements and the configuration pattern of potential rural vulnerability in Hancheng City. In Figure 3e, landslide trace density is generally at a low level, with only scattered high values in some local units. In Figure 3f, high values of distance to town centers are mainly distributed in the western, northwestern, and peripheral areas, while low values are concentrated in the central-eastern and southeastern parts. This indicates that villages in the central-eastern and southeastern areas are more closely connected to town nodes, whereas peripheral areas such as the western and northwestern parts have relatively marginal locational conditions. In Figure 3g, road network density generally presents a linear network distribution pattern along the road system, with relatively higher values in the central-eastern and southeastern areas and lower values in the western and northwestern areas. This suggests that the road network is more developed in areas with more favorable terrain conditions and relatively concentrated settlements, while transport support capacity remains relatively weak in peripheral mountainous areas. In Figure 3h, high values of distance to major roads are mainly distributed in the western, northwestern, and some peripheral areas, while low values are concentrated near transport corridors in the central-eastern and southeastern parts. In Figure 3i, high values of village core density are mainly concentrated in a belt-like area extending from the central-eastern to the southeastern parts, forming a relatively distinct village agglomeration belt, whereas the western, northwestern, and peripheral areas generally remain at low levels. In Figure 3j, public service facility coverage is generally dominated by low values, with relatively high values appearing only in some local units, indicating that public service provision in the study area is generally limited and spatially uneven. In Figure 3k, accessibility of daily service facilities also shows localized high values against a generally low-value background, and its spatial distribution is somewhat consistent with settlement agglomeration and transport conditions. In Figure 3l, permanent population density is generally low, with high-value clusters appearing only in a few local areas, indicating that the rural population distribution in Hancheng City is generally sparse and that the intensity of population activity is strongly localized in space.
4.2. Clustering Analysis Results
It should be noted that the following clustering results reflect the combination patterns of the 12 indicators across spatial units. In this study, these results are interpreted as potential vulnerability configuration types, rather than directly measured vulnerability levels.
To determine the number of clusters, this study used the silhouette coefficient and the elbow method to compare clustering performance under different values. The results show that the silhouette coefficient reaches its highest value when = 3 [Figure 4a], indicating that = 3 performs well in terms of within-cluster compactness and between-cluster separation. The elbow method results [Figure 4b] show that the decline in the within-cluster sum of squares begins to slow down in the = 3–4 range, suggesting that both = 3 and = 4 are within the range of reasonable consideration. Since the silhouette coefficient mainly reflects clustering compactness in a mathematical sense and cannot fully capture the spatial continuity, practical interpretability, and governance distinguishability of potential rural vulnerability configuration types, this study further compares the spatial classification results of = 3 and = 4. Compared with = 3, = 4 can further distinguish service-concentrated settlement areas, complex terrain-constrained areas, human–land coupling transitional areas, and natural ecological isolation areas while maintaining the overall west–central–east spatial differentiation pattern. This avoids merging units with substantially different spatial attributes and governance implications into the same type. Therefore, this study ultimately selects K = 4 as the clustering scheme. This selection does not mean that = 4 outperforms = 3 across all statistical indicators; rather, it represents a compromise reached after comprehensively considering clustering metrics, spatial pattern distinguishability, and completeness of typological interpretation. The detailed comparison of the schemes is presented in Table 3.
Figure 4.
Evaluation of Candidate Cluster Numbers for KMeans Clustering. (a) Silhouette Coefficient for K-means Clustering; (b) Elbow Plot for K-means Clustering.
Table 3.
Comparison of Candidate Clustering Schemes under Different Values.
After determining the = 4 clustering scheme, this study further compares the relative characteristics of the four cluster centers across the 12 standardized indicators, and preliminarily names the four potential configurations accordingly. Type I shows relatively high values in indicators such as accessibility of daily service facilities, permanent population density, and public service facility coverage, and can therefore be preliminarily summarized as the service-concentrated settlement type. Type II is strongly associated with terrain–settlement combined variables such as elevation, topographic wetness index, and village core density, and can be summarized as the complex terrain-constrained type. Type III exhibits transitional characteristics in which natural conditions, settlement agglomeration, and service support are intertwined, and can be summarized as the human–land coupling transitional type. Type IV mainly corresponds to spatial units with relatively high values of distance to major roads, distance to town centers, elevation, and normalized difference vegetation index, but relatively low village core density, and can therefore be summarized as the natural ecological isolation type. The subsequent SHAP analysis further explains the main discriminative variables on which these type names are based and their model response characteristics.
From the spatial distribution of the clustering results (Figure 5), the four potential types of rural vulnerability configurations in Hancheng City show relatively clear regional differentiation. Type IV is mainly distributed in the western, northwestern, and some southwestern peripheral areas, generally forming a contiguous agglomeration pattern. Type III is mainly concentrated in the eastern, southeastern, and southern areas, showing strong spatial continuity. Type II is distributed in the central, northeastern, and parts of the southwestern areas, generally located between the two dominant regions in the west and east, and thus exhibits certain transitional characteristics. Type I has the smallest distribution range and is mainly clustered in the form of point-like and scattered patches in the south-central-eastern area, showing evident local agglomeration. Overall, the clustering types are not randomly interspersed, but form a relatively clear west–central–east spatial differentiation pattern.
Figure 5.
KMeans Clustering Spatial Distribution Map of Potential Rural Vulnerability in Hancheng City.
To further assist in assessing the distribution relationships of the clustering types in the feature space, this study applies principal component analysis (PCA) to the 12 standardized indicators for dimensionality-reduction visualization (Figure 6). The results show that PC1 explains 34.24% of the sample variance, while PC2 explains 12.58%, with a cumulative explained variance of 46.82%. Statistically, PC1 represents the primary comprehensive direction with the greatest sample variation in the original high-dimensional indicator space, while PC2 represents the second comprehensive direction that explains the remaining variation under the condition of being orthogonal to PC1. Therefore, PC1 and PC2 do not correspond to any single indicator, but are compressed representations of differences among multidimensional indicator combinations. As shown in the projection results in Figure 6, the four types of samples exhibit a certain degree of differentiation in the PC1–PC2 space. Cluster 1 is mainly distributed in the area where both PC1 and PC2 are relatively high, and extends clearly along the positive direction of PC1, indicating that this type has strong distinguishability along the main comprehensive difference axis. Cluster 4 is mainly located in the negative direction of PC1, with PC2 close to 0, and shows relatively strong overall agglomeration, indicating a clear distinction from Cluster 1 along the main comprehensive difference direction. Cluster 3 is mainly located in the area with medium-to-high PC1 values and relatively low PC2 values, showing partial adjacency and transition with Cluster 1. Cluster 2 is mainly distributed near PC1 values close to 0 and relatively low PC2 values, presenting a relatively concentrated intermediate-type distribution. These results indicate that the PCA visualization presents a structural feature of “dominant type separation–local type transition” in the two-dimensional reduced space, which corresponds to some extent with the type differentiation obtained from KMeans clustering. Since this study does not further analyze the variable loadings of PC1 and PC2 in the main text, the PCA results are mainly used to visualize the relative positions, separation degree, and transitional relationships of different clustering types along the main comprehensive difference axes, rather than as an independent external validation of the rationality of the clustering classification. Meanwhile, the cumulative explained variance of the first two principal components is 46.82%, indicating that the two-dimensional principal component space can only summarize part of the information in the original high-dimensional indicator space and cannot fully replace the original feature space composed of the 12 indicators. Therefore, this study treats PCA as an auxiliary explanatory tool to support the observation that the clustering results have a certain degree of separability along the main feature gradients, rather than as evidence proving the authenticity or uniqueness of the potential vulnerability types.
Figure 6.
PCA Dimensionality-Reduction Visualization of KMeans Clustering Results.
The PCA dimensionality-reduction results are mainly used to assist in illustrating the relative positions, degree of separation, and transitional relationships of different clustering types within the feature space, and do not constitute an independent external validation of the rationality of the clustering classification. Overall, potential rural vulnerability in Hancheng City presents a compound structure characterized by relatively prominent dominant types, evident local transitions, and a certain degree of ambiguity in type boundaries.
4.3. Reproduction Results of Clustering Labels by the XGBoost Surrogate Model
Based on the KMeans clustering results, this study further employs XGBoost to construct a surrogate model in order to examine whether the type labels generated by unsupervised clustering can be stably reproduced by the original proxy indicators. It should be noted that, under the random split condition, XGBoost can reproduce the KMeans labels relatively well. However, because the evaluation units in this study are 100 m × 100 m grids, spatial autocorrelation may exist among adjacent grid samples, and the accuracy of the random test set may therefore be overestimated. Accordingly, this result only indicates the model’s internal fitting ability for homogeneous clustering labels; it does not demonstrate the model’s spatial extrapolation ability, nor does it validate the effectiveness of real-world vulnerability types.
The results show that the XGBoost surrogate model can effectively reproduce the clustering labels generated by KMeans. The Accuracy, Precision, Recall, and F1-score of the training set reached 0.9997, 0.9998, 0.9998, and 0.9998, respectively, while those of the testing set were 0.9932, 0.9940, 0.9914, and 0.9927, respectively. This indicates that the label structure formed by KMeans clustering can be stably learned and reproduced by the original proxy indicators, providing a model basis for subsequent SHAP interpretation. However, because the clustering labels themselves were generated from the same set of indicators, the high classification accuracy should be understood as evidence of separability within the feature space, rather than as validation of real-world vulnerability types.
From the testing-set confusion matrix (Figure 7) and ROC curves (Figure 8), the categories generally show a high degree of separability. A small number of misclassifications mainly occur among Class 2, Class 3, and Class 4, indicating that these types have certain similarities and transitional characteristics in terms of local indicator combinations. This result further suggests that the role of XGBoost is to characterize clustering boundaries and transitional relationships among types, rather than to prove that different types have definite, discrete, and externally validated vulnerability boundaries in the real world.
Figure 7.
Confusion Matrix of the XGBoost Surrogate Model for Reproducing KMeans Clustering Labels.
Figure 8.
ROC Curves of the XGBoost Surrogate Model for Reproducing KMeans Clustering Labels.
4.4. Overall SHAP Feature Analysis
Based on the XGBoost surrogate model, this study further employs the SHAP method to explain the contribution characteristics of different indicators to cluster type membership. It should be noted that the SHAP results in this section explain the discriminative logic of the XGBoost surrogate model for the KMeans clustering labels. They reflect the relative contribution, contribution direction, and class-specific differences in each indicator when the model distinguishes among different potential types, rather than providing a direct causal explanation of the formation mechanisms of rural vulnerability types.
To identify the contribution strength of each discriminative variable in the surrogate model’s reproduction of the clustering labels, this study uses the SHAP interpretation method to generate an overall feature importance plot for the discriminative variables of different categories (Figure 9). The results show that elevation, village core density, topographic wetness index, distance to town centers, distance to major roads, and accessibility of daily service facilities rank among the most important variables, indicating that natural terrain, settlement agglomeration, locational accessibility, and service support conditions are the main discriminative variables used by the surrogate model to distinguish different clustering labels. Permanent population density and public service facility coverage also show certain contributions, suggesting that population activity and public service conditions play auxiliary roles in category discrimination. By contrast, gully density and landslide trace density have relatively low overall contributions, indicating that their discriminative roles in the current surrogate model are relatively limited. From a geographical perspective, the variables with high SHAP contributions mainly correspond to three types of spatial differences. First, the terrain–hydrological background, represented by elevation and the topographic wetness index, reflects the natural condition differences between the western hilly and gully areas of Hancheng City and the lower-relief areas in the southeast. Second, differences in settlement agglomeration and locational accessibility, represented by village core density, distance to town centers, and distance to major roads, reflect the spatial transition of rural units from areas with stronger urban connections to more peripheral areas. Third, differences in service support and population activity, represented by accessibility of daily service facilities, public service facility coverage, and permanent population density, reflect the unevenness among villages in terms of human settlement service foundations and daily activity intensity. Therefore, the overall SHAP importance results not only identify the model’s discriminative variables but also indicate that potential rural vulnerability configurations in Hancheng City are mainly distinguished by the combined effects of natural terrain background, settlement spatial organization, and service support conditions.
Figure 9.
Overall SHAP Feature Importance Plot.
To further identify model response differences among different potential types in terms of key discriminative variables, the overall SHAP feature analysis indicates that different potential vulnerability configuration types show clear differences in their main discriminative variables and contribution directions. As shown in Figure 10a, the variables with larger contributions for Type I are mainly accessibility of daily service facilities, permanent population density, and public service facility coverage. High values of these variables generally show positive contributions, whereas high values of elevation and distance to major roads mostly show negative contributions. This suggests that, in the model’s discrimination logic, this type is more likely to correspond to areas with relatively complete service provision, a relatively concentrated population, and convenient transport connections. As shown in Figure 10b, the variables with larger contributions for Type II are mainly the topographic wetness index, elevation, and village core density. High values of the topographic wetness index generally show negative contributions, while elevation has a significant but nonlinear influence on the result. Distance to major roads and distance to town centers also have certain explanatory roles. This indicates that the model’s discrimination of this type is closely related to combinations of variables such as topographic wetness, elevation, village core density, and locational accessibility, but it should not be directly interpreted as a causal constraint imposed by complex terrain conditions on the formation of this type. As shown in Figure 10c, the variables with larger contributions for Type III are mainly village core density, topographic wetness index, and elevation. High values of village core density and topographic wetness index mostly show positive contributions, whereas high values of elevation generally show negative contributions. Meanwhile, high values of accessibility of daily service facilities and permanent population density mostly show negative contributions, indicating that this type does not correspond to typical high-population and high-facility areas, but rather represents a transitional configuration in which natural conditions, settlement agglomeration, and service support conditions are intertwined. As shown in Figure 10d, the variables with larger contributions for Type IV are mainly distance to major roads and distance to town centers, followed by normalized difference vegetation index and elevation. High values of distance to major roads, distance to town centers, normalized difference vegetation index, and elevation all show relatively clear positive contributions, whereas high values of village core density mostly show negative contributions.
Figure 10.
Overall SHAP Feature Analysis Plot of Potential Rural Vulnerability in Hancheng City. (a) Service-Concentrated Settlement Type; (b) Complex Terrain-Constrained Type; (c) Human–Land Coupling Transitional Type; (d) Natural Ecological Isolation Type.
The SHAP results further support the type naming derived from the cluster-center characteristics in Section 4.2. Type I is mainly associated with variables related to service provision and population agglomeration; Type II is mainly associated with variables related to terrain–hydrological conditions and settlement agglomeration; Type III represents a transitional configuration in which natural conditions, settlement organization, and service support conditions are intertwined; and Type IV is mainly associated with variables related to spatial isolation and natural ecology. These names are used primarily to summarize the discriminative features of different potential vulnerability configurations, rather than to directly validate the formation mechanisms of the types.
4.5. SHAP Dependence Feature Analysis
To further explain the discriminative features of different clustering types, this study plots SHAP dependence plots for the main variables to analyze the relationship between changes in key indicator values and the probability of membership in different types (Figure 11). It should be noted that SHAP dependence plots reflect the internal variable contribution relationships of the XGBoost surrogate model. They are mainly used to identify key discriminative variables, contribution directions, and nonlinear response characteristics, and should not be equated with causal effects or independent mechanism validation. Therefore, the following analysis focuses on extracting the threshold ranges, turning-point characteristics, and planning implications of the main variables, rather than explaining every variable curve one by one.
Figure 11.
SHAP Dependence Plots of Key Discriminative Variables for Different Potential Vulnerability Types. (a) Type I: Accessibility to Daily-Life Service Facilities. (b) Type I: Resident Population Density. (c) Type I: Public Service Facility Coverage. (d) Type I: Digital Elevation Model. (e) Type I: Topographic Wetness Index. (f) Type I: Road Network Density. (g) Type II: Topographic Wetness Index. (h) Type II: Kernel Density of Villages. (i) Type II: Digital Elevation Model. (j) Type II: Distance to Major Roads. (k) Type II: Distance to Township Center. (l) Type II: Normalized Difference Vegetation Index. (m) Type III: Kernel Density of Villages. (n) Type III: Topographic Wetness Index. (o) Type III: Digital Elevation Model. (p) Type III: Accessibility to Daily-Life Service Facilities. (q) Type III: Distance to Township Center. (r) Type III: Resident Population Density. (s) Type IV: Distance to Major Roads. (t) Type IV: Distance to Township Center. (u) Type IV: Digital Elevation Model. (v) Type IV: Normalized Difference Vegetation Index. (w) Type IV: Kernel Density of Villages. (x) Type IV: Topographic Wetness Index.
The service-concentrated settlement type (Type I) is mainly discriminated by accessibility of daily service facilities, permanent population density, and public service facility coverage. The dependence plots [Figure 11a–f] show that accessibility of daily service facilities and public service facility coverage make positive contributions even in the low-to-medium value ranges, but their marginal contributions tend to slow down as the values continue to increase. This indicates that service facilities play a clear supporting role in determining membership in this type, but the relationship is not simply “the more, the better.” Permanent population density, by contrast, shows an overall positive increasing relationship, indicating that the intensity of population activity is an important condition for identifying this type. In terms of planning, Type I areas should not continue to take the expansion of facility quantity as the sole objective. Instead, greater attention should be paid to facility carrying efficiency, the quality of public spaces, and environmental pressures associated with population agglomeration.
The complex terrain-constrained type (Type II) is mainly discriminated by the topographic wetness index, elevation, and village core density. The dependence plots [Figure 11g–l] show that both elevation and village core density exhibit relatively clear nonlinear relationships. Medium elevation and moderate village agglomeration contribute more strongly to Type II membership, whereas excessively low or high values, as well as excessive agglomeration, weaken the discriminative features of this type. The topographic wetness index shows a negative contribution, indicating that this type does not simply correspond to high-moisture gully areas, but is more closely associated with complex terrain units shaped by the combined effects of terrain, hydrology, and settlement organization. In terms of planning, Type II areas should prioritize the verification of construction suitability, slope safety, and terrain adaptability, rather than adopting engineering remediation measures of uniform intensity.
The human–land coupling transitional type (Type III) is jointly discriminated by village core density, topographic wetness index, elevation, and accessibility of daily service facilities. The dependence plots [Figure 11m–r] show that increases in village core density and topographic wetness index raise the probability of Type III membership, whereas accessibility of daily service facilities and excessively high population density show negative contributions. This indicates that this type is closer to a transitional area with a certain settlement foundation but insufficient service support. In terms of planning, the focus for Type III areas should not be single-point development or simple conservation, but rather the suitability assessment of village connectivity, shared services, and infrastructure deficiency improvement.
The natural ecological isolation type (Type IV) is mainly discriminated by distance to major roads, distance to town centers, elevation, NDVI, and village core density. The dependence plots [Figure 11s–x] show that the probability of Type IV membership increases markedly as distance to major roads and distance to town centers increase. Elevation and NDVI show strong positive contributions in the medium-to-high value ranges, whereas an increase in village core density reduces the probability of Type IV membership. The key turning characteristics of this type are mainly reflected in the combined conditions of “being far from roads–being far from towns–having a strong ecological background–having low settlement agglomeration.” In terms of planning, Type IV areas are more suitable as key verification objects for ecological conservation, low-intensity use, and construction boundary control, rather than being directly oriented toward high-intensity development or scenic-area-oriented utilization.
Overall, the SHAP dependence analysis indicates that different types are not linearly determined by a single variable, but instead exhibit evident threshold, turning-point, and saturation characteristics. Type I reflects the supporting effects of service facilities and population agglomeration, as well as their marginal diminishing characteristics. Type II reflects the combined discrimination of medium elevation, moderate village agglomeration, and complex terrain conditions. Type III reflects the transitional relationship between settlement agglomeration and insufficient service support. Type IV reflects ecological isolation under the combined effects of spatial distance, elevation, vegetation coverage, and low village density. It should be emphasized that these thresholds and turning-point relationships are mainly used to identify discriminative intervals and planning verification priorities for different potential vulnerability configurations. They should not be understood as strict causal thresholds or policy control lines.
5. Discussion
5.1. Integrated Application Path for Identifying Potential Rural Vulnerability in Hancheng City
The research value of this study is mainly reflected in three aspects. First, based on the compound-system characteristics of potential rural vulnerability in Hancheng City, this study integrates a three-dimensional vulnerability assessment framework consisting of natural ecological constraints, settlement spatial organization, and public service support. By incorporating these dimensions into a unified analytical system, the study addresses the limitation of existing research that often focuses on a single dimension and has difficulty revealing the joint effects of multidimensional discriminative variables. Compared with traditional vulnerability assessment approaches that mainly rely on comprehensive scoring and linear superposition, this study places greater emphasis on the configuration characteristics of potential rural vulnerability under the combined effects of multiple discriminative variables, rather than merely ranking vulnerability levels. Second, at the methodological level, this study employs established machine learning tools to form a continuous analytical workflow. KMeans is first used to identify potential vulnerability configuration types in rural Hancheng City; XGBoost is then adopted as a surrogate model to fit the KMeans clustering labels and assess the reproducibility of different types within the feature space; and SHAP is further used to interpret key discriminative variables and their nonlinear response characteristics from the perspectives of overall importance, class-specific differences, and dependence relationships. This workflow strengthens the analytical connection among type identification, surrogate model reproduction, and variable contribution interpretation. Third, at the application level, this study identifies potential rural vulnerability configurations under different combinations of dominant discriminative variables and reveals their spatial differentiation characteristics, thereby providing typological clues and governance implications for local planning. The findings respond to the practical need for vulnerability identification in Hancheng City across the dimensions of natural ecological constraints, settlement spatial organization, and public service support, and provide a case-based reference for extending potential rural vulnerability research in the loess hilly and gully region from multidimensional assessment toward classified governance and differentiated protection.
5.2. Multidimensional Interpretation of Potential Rural Vulnerability Configurations in Hancheng City
The four types identified in this study are not directly measured vulnerability levels, but potential vulnerability configurations inferred from combinations of indicators related to natural ecological constraints, settlement spatial organization, and public service support. The differences among these types mainly reflect the combined characteristics of evaluation units in terms of ecological constraints, spatial accessibility, settlement agglomeration, and service support conditions. Therefore, the following discussion focuses on interpreting the multidimensional discriminative features of different potential vulnerability configurations, rather than treating them as externally validated mechanisms underlying the formation of vulnerability.
From the dimension of natural ecological constraints, potential rural vulnerability configurations in Hancheng City are closely related to the terrain and geomorphological conditions of the loess hilly and gully region. Indicators such as elevation, topographic wetness index, normalized difference vegetation index, gully density, and landslide trace density jointly characterize the degree of surface dissection, hydrological accumulation conditions, and differences in ecological background. Areas with high elevation, strong terrain dissection, and pronounced geological disturbance usually face greater constraints in terms of construction suitability, infrastructure maintenance, and ecological stability. In the indicator combinations, these characteristics are expressed as potential vulnerability configurations with stronger natural ecological constraints. Therefore, the natural ecological dimension mainly provides interpretive clues related to terrain, hydrology, and ecological background for identifying potential rural vulnerability types in Hancheng City.
From the dimension of settlement spatial organization, potential rural vulnerability configurations are clearly associated with village location, transport connections, and spatial agglomeration. Indicators such as distance to town centers, distance to major roads, road network density, and village core density reflect differences in external connectivity, internal organization, and spatial clustering among rural units. Evaluation units with weak transport accessibility, greater distance from town nodes, and insufficient spatial connections usually show weaker locational and resource-linkage conditions, whereas units with more favorable locations, stronger transport connections, and more stable settlement organization generally exhibit stronger spatial accessibility and resource connectivity. Therefore, the dimension of settlement spatial organization does not directly explain how vulnerability is “transmitted” or “amplified,” but provides an important interpretive dimension for understanding the differences among potential vulnerability types in terms of locational conditions, transport connections, and spatial agglomeration.
From the dimension of public service support, potential rural vulnerability configurations are also closely related to the level of service provision and its accessibility. Public service facility coverage, accessibility of daily service facilities, and permanent population density jointly characterize basic support conditions, convenience of access to daily services, and the intensity of population activity in rural areas. When an evaluation unit shows insufficient public service provision, low accessibility to daily services, or weak population agglomeration, its indicator combination usually suggests relative shortcomings in social support and daily living convenience. Conversely, areas with more complete service support and a certain population scale tend to exhibit stronger basic support capacity and better accessibility to daily services in their indicator combinations. Therefore, the dimension of public service support is mainly used to explain differences among potential vulnerability types in terms of social support conditions and service accessibility, and should not be directly understood as causal evidence of the evolution process of vulnerability.
Overall, the potential rural vulnerability types in Hancheng City are not determined by a single dimension, but are jointly characterized by multiple indicators related to natural ecological constraints, settlement spatial organization, and public service support. The above interpretation helps to understand the typological differentiation of potential rural vulnerability in rural Hancheng City. However, it should still be regarded as an associative understanding derived from proxy indicators and model interpretation, rather than as direct causal validation of the formation mechanisms of vulnerability.
5.3. Planning Verification Directions and Local Governance References Based on Dominant Discriminative Variables
Based on the = 4 classification scheme adopted in this study and the XGBoost–SHAP interpretation results, the potential rural vulnerability configurations in Hancheng City can be summarized into four types: service-concentrated settlement type, complex terrain-constrained type, human–land coupling transitional type, and natural ecological isolation type. These four types should not be regarded as formal governance zones or final intervention units. Instead, they provide preliminary diagnostic clues for rural revitalization, territorial spatial planning, and classified village governance, and may help local planners identify issues that require further verification, such as service deficiencies, terrain-related risks, inter-village coordination, and ecological conservation priorities.
The service-concentrated settlement type (Type I) is mainly distinguished by variables such as accessibility of daily service facilities, permanent population density, and public service facility coverage. This type corresponds to spatial units where population and service elements are relatively concentrated. Its governance focus should not be understood simply as the continued increase in the number of facilities, but should instead shift toward improving service carrying capacity, public space quality, and the efficiency of environmental facilities. In local governance, Type I areas can be tentatively linked with policy tools such as equalization of public services, infrastructure deficiency improvement, and rural human settlement environment remediation. planning verification items may include assessing service facility capacity, identifying shortcomings in environmental facilities, and implementing micro-renewal of public spaces, so as to improve the service carrying capacity and daily living quality of population-concentrated areas. Possible discussion items include supplementing decentralized sewage treatment facilities, optimizing waste collection and transfer points, reorganizing internal village pedestrian routes, upgrading public activity spaces through micro-renewal, and reviewing the capacity of frequently used service facilities. Contents such as cultural exhibition, activation of idle spaces, or rural education cannot be directly supported as necessary by the model results of this study, but may be considered as supplementary issues in local investigations.
The complex terrain-constrained type (Type II) is mainly distinguished by variables such as elevation, topographic wetness index, and village core density, and is strongly associated with complex terrain, terrain–hydrological conditions, and the spatial organization of villages. The governance focus for this type should shift from general environmental improvement toward construction suitability, geological safety, and terrain-adaptive maintenance. In local governance, Type II areas can be tentatively linked with policy tools such as geological hazard prevention and control, soil and water conservation, village construction suitability assessment, and ecological restoration. More detailed geological hazard surveys, village construction condition assessments, and field investigations should be combined to further determine the applicable scope of ecological restoration, low-intervention improvement, and terrain-adaptive construction. Specific engineering measures should not be determined solely based on the model results. Possible measures may include identifying restricted zones for slope construction, maintaining gully drainage systems, reviewing slope stability, implementing vegetation-based slope protection, restoring terraces or tablelands, and strengthening construction control to avoid large-scale slope cutting and gully filling.
The human–land coupling transitional type (Type III) represents a transitional configuration in which natural conditions, village agglomeration, and service support conditions are intertwined. Its dominant discriminative variables suggest that this type has a certain foundation for settlement connectivity, but may also face problems such as insufficient service support or imbalanced spatial organization. In local governance, Type III areas can be tentatively linked with policy tools such as urban–rural infrastructure integration, public service sharing, and classified village guidance. Priority should be given to verifying road connections, service radiation ranges, and cross-village coordination conditions, so as to promote the shift in infrastructure and public service provision from single-village allocation toward district-level sharing. Possible discussion items include establishing cross-village shared service points, improving inter-village roads and emergency access routes, deploying mobile medical and elderly-care services, and sharing public activity facilities among villages. The direction of local cultural and tourism development should be discussed only after further confirming the distribution of cultural resources, transport conditions, village development intentions, and local planning objectives.
The natural ecological isolation type (Type IV) is mainly distinguished by variables such as distance to major roads, distance to town centers, elevation, normalized difference vegetation index, and village core density. This type usually corresponds to spatial units that are far from town nodes and transport corridors, have relatively good vegetation coverage, and show a low degree of settlement agglomeration. Its governance focus may be considered as key issues for further verification of ecological conservation, construction boundary control, and the bottom-line guarantee of basic public services. In local governance, Type IV areas can be tentatively linked with policy tools such as ecological protection redlines, territorial spatial use control, ecological restoration, and the bottom-line provision of basic public services. Priority should be given to clarifying construction boundaries, the scope of low-intensity use, and bottom-line service provision methods, while avoiding the replacement of ecological conservation with high-intensity development. Possible discussion items include controlling ecologically sensitive areas, restoring vegetation, conserving soil and water, restricting new construction, establishing mobile public service or regular medical outreach mechanisms, and exploring ecological stewardship compensation and resident-participatory ecological restoration. If field investigations confirm the presence of cultural landscape resources such as traditional courtyards, ancient trees, temples, or agricultural heritage remains, daily maintenance approaches may be discussed under the premise of ecological conservation. However, such contents do not constitute the core planning direction directly supported by the model results.
Overall, the four potential vulnerability configurations are not equivalent to formal governance zones, but provide problem-identification clues for subsequent local investigation and policy coordination. Type I corresponds to the improvement of service carrying capacity and the remediation of deficiencies in environmental facilities; Type II corresponds to terrain risk verification and low-intervention improvement; Type III corresponds to the optimization of spatial connections and district-level service sharing; and Type IV corresponds to ecological control, ecological compensation, and bottom-line service provision. Specific implementation still needs to be further verified in combination with village boundaries, field investigations, residents’ needs, fiscal capacity, and local policy tools.
5.4. Research Limitations and Future Directions
Although this study systematically identifies the main discriminative variables, potential types, and nonlinear response characteristics of potential rural vulnerability in Hancheng City based on the three-dimensional framework of “natural ecological constraints–settlement spatial organization–public service support,” several limitations remain. In addition, the identification of “rural vulnerability” in this study is mainly based on proxy indicators and unsupervised clustering results, and does not directly observe or validate actual vulnerability outcomes such as disaster losses, environmental degradation, declines in residents’ well-being, or sustained population outflow. Therefore, the four types identified in this study should be more accurately understood as “potential vulnerability configurations” or “combinations of vulnerability-related conditions,” rather than vulnerability levels validated by external observational data. Future research should further incorporate field investigations, residents’ perceptions, village-level socioeconomic statistics, disaster records, ecological degradation monitoring, or governance performance data to cross-validate the real-world vulnerability manifestations of different types.
First, at the data and indicator levels, this study integrates multi-source data, including DEM, remote sensing imagery, road networks, POIs, population grids, and landslide traces. However, differences in acquisition time, spatial resolution, and update frequency among data sources may affect the spatial accuracy and temporal validity of some indicators. In particular, indicators related to public services and population mainly reflect the static conditions of a specific period, making it difficult to fully characterize the long-term evolution of potential rural vulnerability. Future research could further incorporate multi-period remote sensing data, dynamic population mobility data, facility update records, and higher-resolution disaster monitoring data to improve the correspondence between proxy indicators and actual vulnerability conditions and to enhance the dynamic representation and explanatory power of the results.
Second, at the spatial scale level, this study adopts a uniform grid as the evaluation unit. Although this approach facilitates multi-source data integration and model computation, the results may still be affected by scale sensitivity and the modifiable areal unit problem. The spatial pattern of potential rural vulnerability configurations is not only influenced by grid scale, but is also closely related to actual village boundaries, settlement organization units, and township-level connection networks. Therefore, vulnerability patterns and type boundaries may vary across different spatial scales. Future research could conduct multi-scale comparative analysis to further examine the similarities and differences in the identification results of potential rural vulnerability at the grid, village, and township scales, thereby enhancing the robustness and spatial explanatory power of the research findings.
At the methodological level, the analytical workflow of this study should be understood as an exploratory process of “unsupervised type identification–surrogate model reproduction–variable contribution interpretation,” rather than as a confirmatory prediction framework. Specifically, the KMeans clustering results are derived from the same set of proxy indicators, and the main role of the XGBoost surrogate model is to fit and reproduce the clustering labels and to provide a model basis for SHAP-based interpretive analysis. It is not intended to predict or validate externally observed real vulnerability levels. It should be further noted that the XGBoost surrogate model in this study adopts a random training–testing split, without explicitly controlling for spatial autocorrelation among the 100 m × 100 m grid samples. Since neighboring grids may show high similarity in terms of terrain, roads, facilities, population, and other indicators, random splitting may allow spatially adjacent samples to enter both the training and testing sets, thereby leading to inflated classification accuracy. Therefore, the model accuracy reported in this study only reflects the internal reproducibility of the KMeans clustering labels under the random split condition. It does not indicate the model’s generalization ability for spatially independent samples, nor does it prove the validity of real-world vulnerability types. Future research should further adopt spatial block cross-validation, spatially blocked sampling, township-level holdout validation, or geomorphic-zone holdout validation to conduct more rigorous spatial robustness tests of the surrogate model results. This is also consistent with recent studies on data-driven analysis of nonlinear spatial effects in complex terrain and rural settlement vulnerability under geological hazard constraints, which suggest that spatial heterogeneity, nonlinear responses, and differentiated planning verification should be jointly considered in vulnerability-related research [53,54]. Meanwhile, the current SHAP analysis mainly explains the overall contribution, class-specific differences, and nonlinear response characteristics of key variables in relation to different clustering type memberships. Its ability to characterize higher-order interactions among multiple discriminative variables, causal directions, and spatiotemporal dynamic processes remains relatively limited. Future research could further integrate SHAP interaction values, causal inference, or spatiotemporal statistical models to deepen the interpretation of variable interactions and dynamic processes. In addition, the determination of the number of KMeans clusters still involves a certain degree of subjectivity. Although this study ultimately selects = 4 by jointly considering the silhouette coefficient, elbow method, spatial continuity, and completeness of typological interpretation, = 3 performs better in terms of the silhouette coefficient, suggesting that type boundaries may vary under different numbers of clusters. Future studies could further combine the Gap Statistic, Calinski–Harabasz index, Davies–Bouldin index, clustering stability tests, and field sample verification to conduct more systematic robustness tests for cluster-number selection and type classification.
At the level of result validation, although this study has identified the spatial differentiation characteristics of potential rural vulnerability in Hancheng City and the main combinations of discriminative variables, the relevant judgments are mainly based on spatial quantification results, proxy-indicator inference, clustering classification, and surrogate-model interpretation. The integration of field investigations of typical villages, residents’ perceptions, and local governance experience remains relatively insufficient. Therefore, future research should strengthen the incorporation of localized data, field interviews, village archives, and residents’ perception data, so as to further examine the real-world correspondence of different vulnerability configuration types and improve the specificity and operability of classified governance recommendations.
At the application level, the zonal protection and governance strategies proposed in this study are mainly developed based on spatial identification results and model interpretation. They remain largely focused on theoretical classification guidance and have not yet been further embedded into local governance practices, policy instruments, or implementation mechanisms. Therefore, future research could integrate the identification results of potential rural vulnerability with policy tools such as territorial spatial planning, village classification, ecological restoration, and public service allocation. It could further explore differentiated implementation pathways for areas with different potential vulnerability types in terms of protection, remediation, and development, thereby promoting the transformation of research findings from “type identification” and “variable contribution interpretation” toward “policy translation” and “governance implementation.”
6. Conclusions
Taking rural Hancheng City as the research object, this study adopts a three-dimensional analytical framework of “natural ecological constraints–settlement spatial organization–public service support.” Based on 12 spatial indicators, it provides proxy representations of conditions related to potential rural vulnerability, and combines KMeans clustering, an XGBoost surrogate model, and SHAP-based interpretive analysis to exploratorily identify the configuration types, main discriminative variables, and nonlinear response characteristics of potential rural vulnerability in rural Hancheng City. It should be noted that the types identified in this study are not actual vulnerability levels, and XGBoost is not used for external prediction or validation. Instead, it is used to reproduce the KMeans clustering labels and assist in interpreting variable contributions. The main conclusions are as follows:
- (1)
- This study constructs a framework for identifying potential vulnerability configurations suitable for the rural case of Hancheng City. By integrating the three dimensions of natural ecological constraints, settlement spatial organization, and public service support, it develops a continuous analytical workflow of “multi-source proxy indicator construction–KMeans clustering identification–XGBoost surrogate model fitting–SHAP variable contribution interpretation.” This workflow helps identify potential vulnerability configurations and their discriminative features under combinations of multidimensional proxy indicators, but it does not constitute validation of actual vulnerability levels or causal mechanisms.
- (2)
- The potential rural vulnerability configurations in Hancheng City can be summarized into four types, showing a clear west–central–east spatial differentiation pattern. The service-concentrated settlement type is mainly distributed in point-like or patch-like forms in the south-central-eastern area. The complex terrain-constrained type is mainly distributed in the central, northeastern, and parts of the southwestern areas. The human–land coupling transitional type is mainly distributed in the eastern, southeastern, and southern areas. The natural ecological isolation type is mainly distributed in the western, northwestern, and parts of the southwestern peripheral areas. Overall, the typological differentiation is closely related to terrain gradients, transport corridors, town connections, and village agglomeration patterns.
- (3)
- The SHAP analysis shows that elevation, village core density, topographic wetness index, distance to town centers, accessibility of daily service facilities, distance to major roads, and normalized difference vegetation index are the seven core discriminative variables distinguishing different potential types. Different variables exhibit differentiated contribution directions and nonlinear response characteristics in type membership. Service accessibility, public service coverage, and population density are mainly used to identify the service-concentrated settlement type. Elevation and topographic wetness index mainly affect the complex terrain-constrained type and the human–land coupling transitional type. Distance to town centers, distance to major roads, and normalized difference vegetation index show strong positive discriminative effects for the natural ecological isolation type.
- (4)
- Based on the four potential vulnerability configurations, this study further summarizes differentiated planning verification directions for local decision-making. The service-concentrated settlement type may focus on verifying service carrying capacity, infrastructure deficiencies, and public space micro-renewal needs; the complex terrain-constrained type may focus on terrain risk review, construction suitability assessment, and low-intervention improvement feasibility; the human–land coupling transitional type may focus on spatial connection optimization, cross-village service sharing, and infrastructure coordinating allocation; the natural ecological isolation type may focus on ecological conservation, low-intensity land-use boundary control, ecological compensation, and bottom-line public service provision.
Overall, the results of this study reveal the spatial patterns, typological differences, core discriminative variables, and planning translation directions of potential rural vulnerability configurations in Hancheng City. Future research should further incorporate village boundaries, field investigations, residents’ perceptions, disaster records, and governance performance data to validate the real-world correspondence, policy applicability, and implementation effects of different potential vulnerability configurations.
Author Contributions
Conceptualization, S.Z. and W.Z.; methodology, S.Z., Y.L. and C.S.; software, S.Z. and Z.-K.-A.W.; validation, Y.L. and Z.-K.-A.W.; formal analysis, S.Z., Y.L. and Z.-K.-A.W.; investigation, S.Z., Y.L. and C.S.; resources, W.Z.; data curation, S.Z. and Z.-K.-A.W.; writing—original draft preparation, S.Z.; writing—review and editing, S.Z., Y.L., C.S. and W.Z.; visualization, S.Z., Y.L. and Z.-K.-A.W.; supervision, W.Z.; Funding acquisition, W.Z. All authors have read and agreed to the published version of the manuscript.
Funding
This research was funded by the 2026 “Double First-Class” Construction Funded Project of Xi’an Academy of Fine Arts, grant number XK202601. The project title is “Artistic Exchange and Cultural Integration along the Silk Road: Environmental System Regeneration and Dissemination of Local Heritage Remains”.
Data Availability Statement
Data will be made available on request.
Acknowledgments
We gratefully acknowledge the financial support that made this research possible. We sincerely thank those who provided assistance during data consultation and information collection.
Conflicts of Interest
The authors declare no conflicts of interest.
References
- Liu, Y.; Liu, Y.; Chen, Y.; Long, H. The process and driving forces of rural hollowing in China under rapid urbanization. J. Geogr. Sci. 2010, 20, 876–888. [Google Scholar] [CrossRef] [Scilit]
- Liu, Y.; Li, Y. Revitalize the world’s countryside. Nature 2017, 548, 275–277. [Google Scholar] [CrossRef] [Scilit] [PubMed]
- Li, Y.; Westlund, H.; Liu, Y. Why some rural areas decline while some others not: An overview of rural evolution in the world. J. Rural Stud. 2019, 68, 135–143. [Google Scholar] [CrossRef] [Scilit]
- Liu, Y.; Zang, Y.; Yang, Y. China’s rural revitalization and development: Theory, technology and management. J. Geogr. Sci. 2020, 30, 1923–1942. [Google Scholar] [CrossRef] [Scilit]
- Dai, X.; Zhang, J.; Sun, X.; Li, J.; Liu, B. Differentiation governance of rural human settlement environments in China: Knowledge mapping and visualization. Int. J. Environ. Res. Public Health 2023, 20, 4209. [Google Scholar] [CrossRef] [Scilit] [PubMed]
- Long, T.; Ișık, C.; Yan, J.; Zhong, Q. Promoting the sustainable development of traditional villages: Exploring the comprehensive assessment, spatial and temporal evolution, and internal and external impacts of traditional village human settlements in hunan province. Heliyon 2024, 10, e32439. [Google Scholar] [CrossRef] [Scilit] [PubMed]
- Song, R.; Li, X. Urban human settlement vulnerability evolution and mechanisms: The case of Anhui province, China. Land 2023, 12, 994. [Google Scholar] [CrossRef] [Scilit]
- Zhong, Q.; Dong, T. Exploring the spatiotemporal trends and influencing factors of human settlement suitability in Hunan province traditional villages. Sci. Rep. 2024, 14, 25319. [Google Scholar] [CrossRef] [Scilit] [PubMed]
- Guo, Z.; Sun, L. The planning, development and management of tourism: The case of Dangjia, an ancient village in China. Tour. Manag. 2016, 56, 52–62. [Google Scholar] [CrossRef] [Scilit]
- Gao, J.; Wu, B. Revitalizing traditional villages through rural tourism: A case study of Yuanjia Village, Shaanxi Province, China. Tour. Manag. 2017, 63, 223–233. [Google Scholar] [CrossRef] [Scilit]
- Li, K. A Morphological Interpretation of a Northern Chinese Traditional Village: Case Study of Zhangdaicun Village; Springer Nature: Berlin/Heidelberg, Germany, 2024. [Google Scholar]
- Zhao, J.; Xu, C.; Huang, X. Detailed landslide traces database of Hancheng County, China, based on high-resolution satellite images available on the Google Earth Platform. Data 2024, 9, 63. [Google Scholar] [CrossRef] [Scilit]
- Liu, P.; Zeng, C.; Liu, R. Environmental adaptation of traditional Chinese settlement patterns and its landscape gene mapping. Habitat Int. 2023, 135, 102808. [Google Scholar] [CrossRef] [Scilit]
- Yuan, C.; He, Y.; Feng, Y.; Wang, P. Fire hazards in heritage villages: A case study on Dangjia Village in China. Int. J. Disaster Risk Reduct. 2018, 28, 748–757. [Google Scholar] [CrossRef] [Scilit]
- Turner, B.L.; Kasperson, R.E.; Matson, P.A.; McCarthy, J.J.; Corell, R.W.; Christensen, L.; Eckley, N.; Kasperson, J.X.; Luers, A.; Martello, M.L. A framework for vulnerability analysis in sustainability science. Proc. Natl. Acad. Sci. USA 2003, 100, 8074–8079. [Google Scholar] [CrossRef] [Scilit] [PubMed]
- Hu, X.; Li, H.; Zhang, X.; Chen, X.; Yuan, Y. Multi-dimensionality and the totality of rural spatial restructuring from the perspective of the rural space system: A case study of traditional villages in the ancient Huizhou region, China. Habitat Int. 2019, 94, 102062. [Google Scholar] [CrossRef] [Scilit]
- Zhong, Q.; Xie, L.; Wu, J. Reimagining heritage villages’ sustainability: Machine learning-driven human settlement suitability in Hunan. Humanit. Soc. Sci. Commun. 2025, 12, 1–19. [Google Scholar] [CrossRef] [Scilit]
- Silverman, B.W. Density Estimation for Statistics and Data Analysis; Routledge: Oxfordshire, UK, 2018. [Google Scholar]
- Chen, M.; Shen, R. Rural settlement development in western China: Risk, vulnerability, and resilience. Sustainability 2023, 15, 1254. [Google Scholar] [CrossRef] [Scilit]
- Chen, W.; Yang, L.; Wu, J.; Wu, J.; Wang, G.; Bian, J.; Zeng, J.; Liu, Z. Spatio-temporal characteristics and influencing factors of traditional villages in the Yangtze River Basin: A Geodetector model. Herit. Sci. 2023, 11, 1–15. [Google Scholar] [CrossRef] [Scilit]
- Xu, Y.; Yang, X.; Feng, X.; Yan, P.; Shen, Y.; Li, X. Spatial distribution and site selection adaptation mechanism of traditional villages along the Yellow River in Shanxi and Shaanxi. River Res. Appl. 2023, 39, 1270–1282. [Google Scholar]
- Chen, T.; Guestrin, C. Xgboost: A scalable tree boosting system. In Proceedings of the 22nd Acm Sigkdd International Conference on Knowledge Discovery and Data Mining; ACM: New York, NY, USA, 2016. [Google Scholar]
- Lundberg, S.M.; Lee, S.-I. A unified approach to interpreting model predictions. In Advances in Neural Information Processing Systems; Curran Associates, Inc.: Red Hook, NY, USA, 2017; Volume 30. [Google Scholar]
- Lundberg, S.M.; Erion, G.; Chen, H.; DeGrave, A.; Prutkin, J.M.; Nair, B.; Katz, R.; Himmelfarb, J.; Bansal, N.; Lee, S.-I. From local explanations to global understanding with explainable AI for trees. Nat. Mach. Intell. 2020, 2, 56–67. [Google Scholar] [CrossRef] [Scilit] [PubMed]
- He, J.; Wang, X.; Qi, Y.; Jiang, J.; Zhou, D.; Ma, D.; Ying, J. AI-Driven Multi-Model Classification of Rural Settlements for Targeted Rural Revitalization: A Case Study of Gaoqing County, Shandong Province, China. Land 2025, 14, 2298. [Google Scholar] [CrossRef] [Scilit]
- Liu, S.; Ge, J.; Bai, M.; Yao, M.; He, L.; Chen, M. Toward classification-based sustainable revitalization: Assessing the vitality of traditional villages. Land Use Policy 2022, 116, 106060. [Google Scholar] [CrossRef] [Scilit]
- Cutter, S.L. The vulnerability of science and the science of vulnerability. Ann. Assoc. Am. Geogr. 2003, 93, 1–12. [Google Scholar] [CrossRef] [Scilit]
- Eakin, H.; Luers, A.L. Assessing the vulnerability of social-environmental systems. Annu. Rev. Environ. Resour. 2006, 31, 365–394. [Google Scholar] [CrossRef] [Scilit]
- Gallopín, G.C. Linkages between vulnerability, resilience, and adaptive capacity. Glob. Environ. Change 2006, 16, 293–303. [Google Scholar] [CrossRef] [Scilit]
- Smit, B.; Wandel, J. Adaptation, adaptive capacity and vulnerability. Glob. Environ. Change 2006, 16, 282–292. [Google Scholar] [CrossRef] [Scilit]
- Beven, K.J.; Kirkby, M.J. A physically based, variable contributing area model of basin hydrology/Un modèle à base physique de zone d’appel variable de l’hydrologie du bassin versant. Hydrol. Sci. J. 1979, 24, 43–69. [Google Scholar] [CrossRef] [Scilit]
- Moore, I.D.; Grayson, R.; Ladson, A. Digital terrain modelling: A review of hydrological, geomorphological, and biological applications. Hydrol. Process. 1991, 5, 3–30. [Google Scholar] [CrossRef] [Scilit]
- Luo, X.; Yang, J.; Sun, W.; He, B. Suitability of human settlements in mountainous areas from the perspective of ventilation: A case study of the main urban area of Chongqing. J. Clean. Prod. 2021, 310, 127467. [Google Scholar] [CrossRef] [Scilit]
- Cabell, J.F.; Oelofse, M. An indicator framework for assessing agroecosystem resilience. Ecol. Soc. 2012, 17, 18. [Google Scholar] [CrossRef] [Scilit]
- Liu, R.; Zhang, L.; Tang, Y.; Jiang, Y. Understanding and evaluating the resilience of rural human settlements with a social-ecological system framework: The case of Chongqing Municipality, China. Land Use Policy 2024, 136, 106966. [Google Scholar] [CrossRef] [Scilit]
- Liu, L.; Lyu, H.; Dai, J.; Tu, Y.; Gao, T. Data-Driven Spatial Optimization of Elderly Care Facilities: A Study on Nonlinear Threshold Effects Based on XGBoost and SHAP—A Case Study of Xi’an, China. ISPRS Int. J. Geo-Inf. 2025, 14, 371. [Google Scholar] [CrossRef] [Scilit]
- Wilson, J.P.; Gallant, J.C. Terrain Analysis: Principles and Applications; John Wiley & Sons: Hoboken, NJ, USA, 2000. [Google Scholar]
- Tang, L.; Huang, Y.; Jiang, Y.; Feng, D. The spatial association of rural human settlement system resilience with land use in Hunan Province, China, 2000–2020. Land 2023, 12, 1524. [Google Scholar] [CrossRef] [Scilit]
- Shangguan, Z. An Explainable Machine-Learning Framework Based on XGBoost–SHAP and Big Data for Revealing the Socioeconomic Drivers of Population Urbanization in China. Systems 2025, 13, 679. [Google Scholar] [CrossRef] [Scilit]
- Pettorelli, N.; Vik, J.O.; Mysterud, A.; Gaillard, J.-M.; Tucker, C.J.; Stenseth, N.C. Using the satellite-derived NDVI to assess ecological responses to environmental change. Trends Ecol. Evol. 2005, 20, 503–510. [Google Scholar] [CrossRef] [Scilit] [PubMed]
- Dobson, J.E.; Bright, E.A.; Coleman, P.R.; Durfee, R.C.; Worley, B.A. LandScan: A global population database for estimating populations at risk. Photogramm. Eng. Remote Sens. 2000, 66, 849–857. [Google Scholar]
- Tatem, A.J. WorldPop, open data for spatial demography. Sci. Data 2017, 4, 170004. [Google Scholar] [CrossRef] [Scilit] [PubMed]
- Shan, L. Projects in the Field of Cultural Tourism Made by “Shaanxi Cultural Industry Investment Group”; Shaanxi Cultural Industry Investment Group: Xi’an, China, 2024. [Google Scholar]
- GB 50010-2010; Code for Design of Concrete Structures. Ministry of Housing and Urban-Rural Development of the People’s Republic of China: Beijing, China, 2010.
- Silverman, H.; Blumenfield, T. Cultural heritage politics in China: An introduction. In Cultural Heritage politics in China; Springer: Berlin/Heidelberg, Germany, 2013; pp. 3–22. [Google Scholar]
- Lloyd, S. Least squares quantization in PCM. IEEE Trans. Inf. Theory 1982, 28, 129–137. [Google Scholar] [CrossRef] [Scilit]
- Rousseeuw, P.J. Silhouettes: A graphical aid to the interpretation and validation of cluster analysis. J. Comput. Appl. Math. 1987, 20, 53–65. [Google Scholar] [CrossRef] [Scilit]
- Pedregosa, F.; Varoquaux, G.; Gramfort, A.; Michel, V.; Thirion, B.; Grisel, O.; Blondel, M.; Prettenhofer, P.; Weiss, R.; Dubourg, V. Scikit-learn: Machine learning in Python. J. Mach. Learn. Res. 2011, 12, 2825–2830. [Google Scholar]
- Friedman, J.H. Greedy function approximation: A gradient boosting machine. Ann. Stat. 2001, 29, 1189–1232. [Google Scholar] [CrossRef] [Scilit]
- MacQueen, J. Multivariate observations. In Proceedings ofthe 5th Berkeley Symposium on Mathematical Statisticsand Probability; University of California Press: Berkeley, CA, USA, 1967. [Google Scholar]
- Grinsztajn, L.; Oyallon, E.; Varoquaux, G. Why do tree-based models still outperform deep learning on typical tabular data? Adv. Neural Inf. Process. Syst. 2022, 35, 507–520. [Google Scholar] [CrossRef] [Scilit]
- Shwartz-Ziv, R.; Armon, A. Tabular data: Deep learning is not all you need. Inf. Fusion 2022, 81, 84–90. [Google Scholar] [CrossRef] [Scilit]
- Lu, Q.; Liu, S.; Gu, J. Integrating LLMs and data-driven analytics to uncover nonlinear impacts of urban spatial patterns on noise complaints in complex terrain. Build. Environ. 2025, 285, 113546. [Google Scholar] [CrossRef] [Scilit]
- Xi, X.; Shi, X.; Wang, T.; Wang, X.; Huang, K. Vulnerability Assessment and Differentiated Regulation of Rural Settlement Systems in the Alpine Canyon Area of Western Sichuan Under Geological Hazard Coercion: Taking Maoxian County of Sichuan as an Example. Sustainability 2025, 17, 8629. [Google Scholar] [CrossRef] [Scilit]
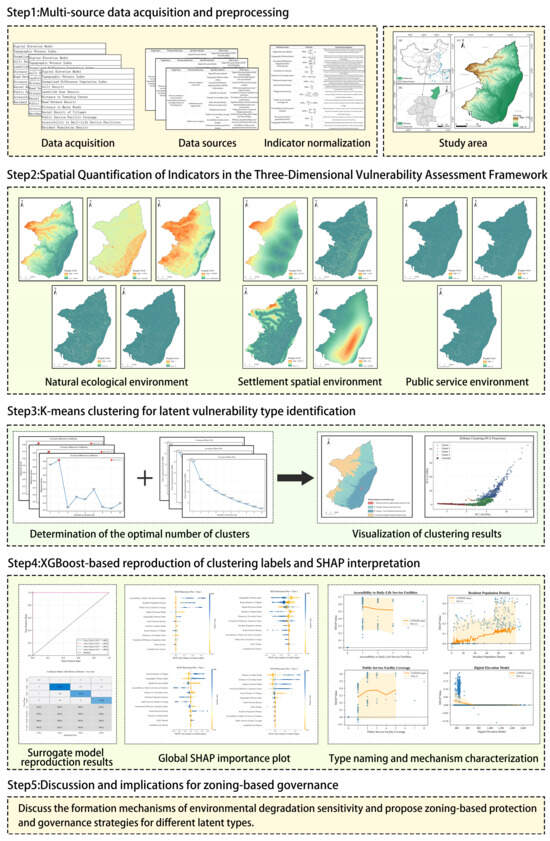
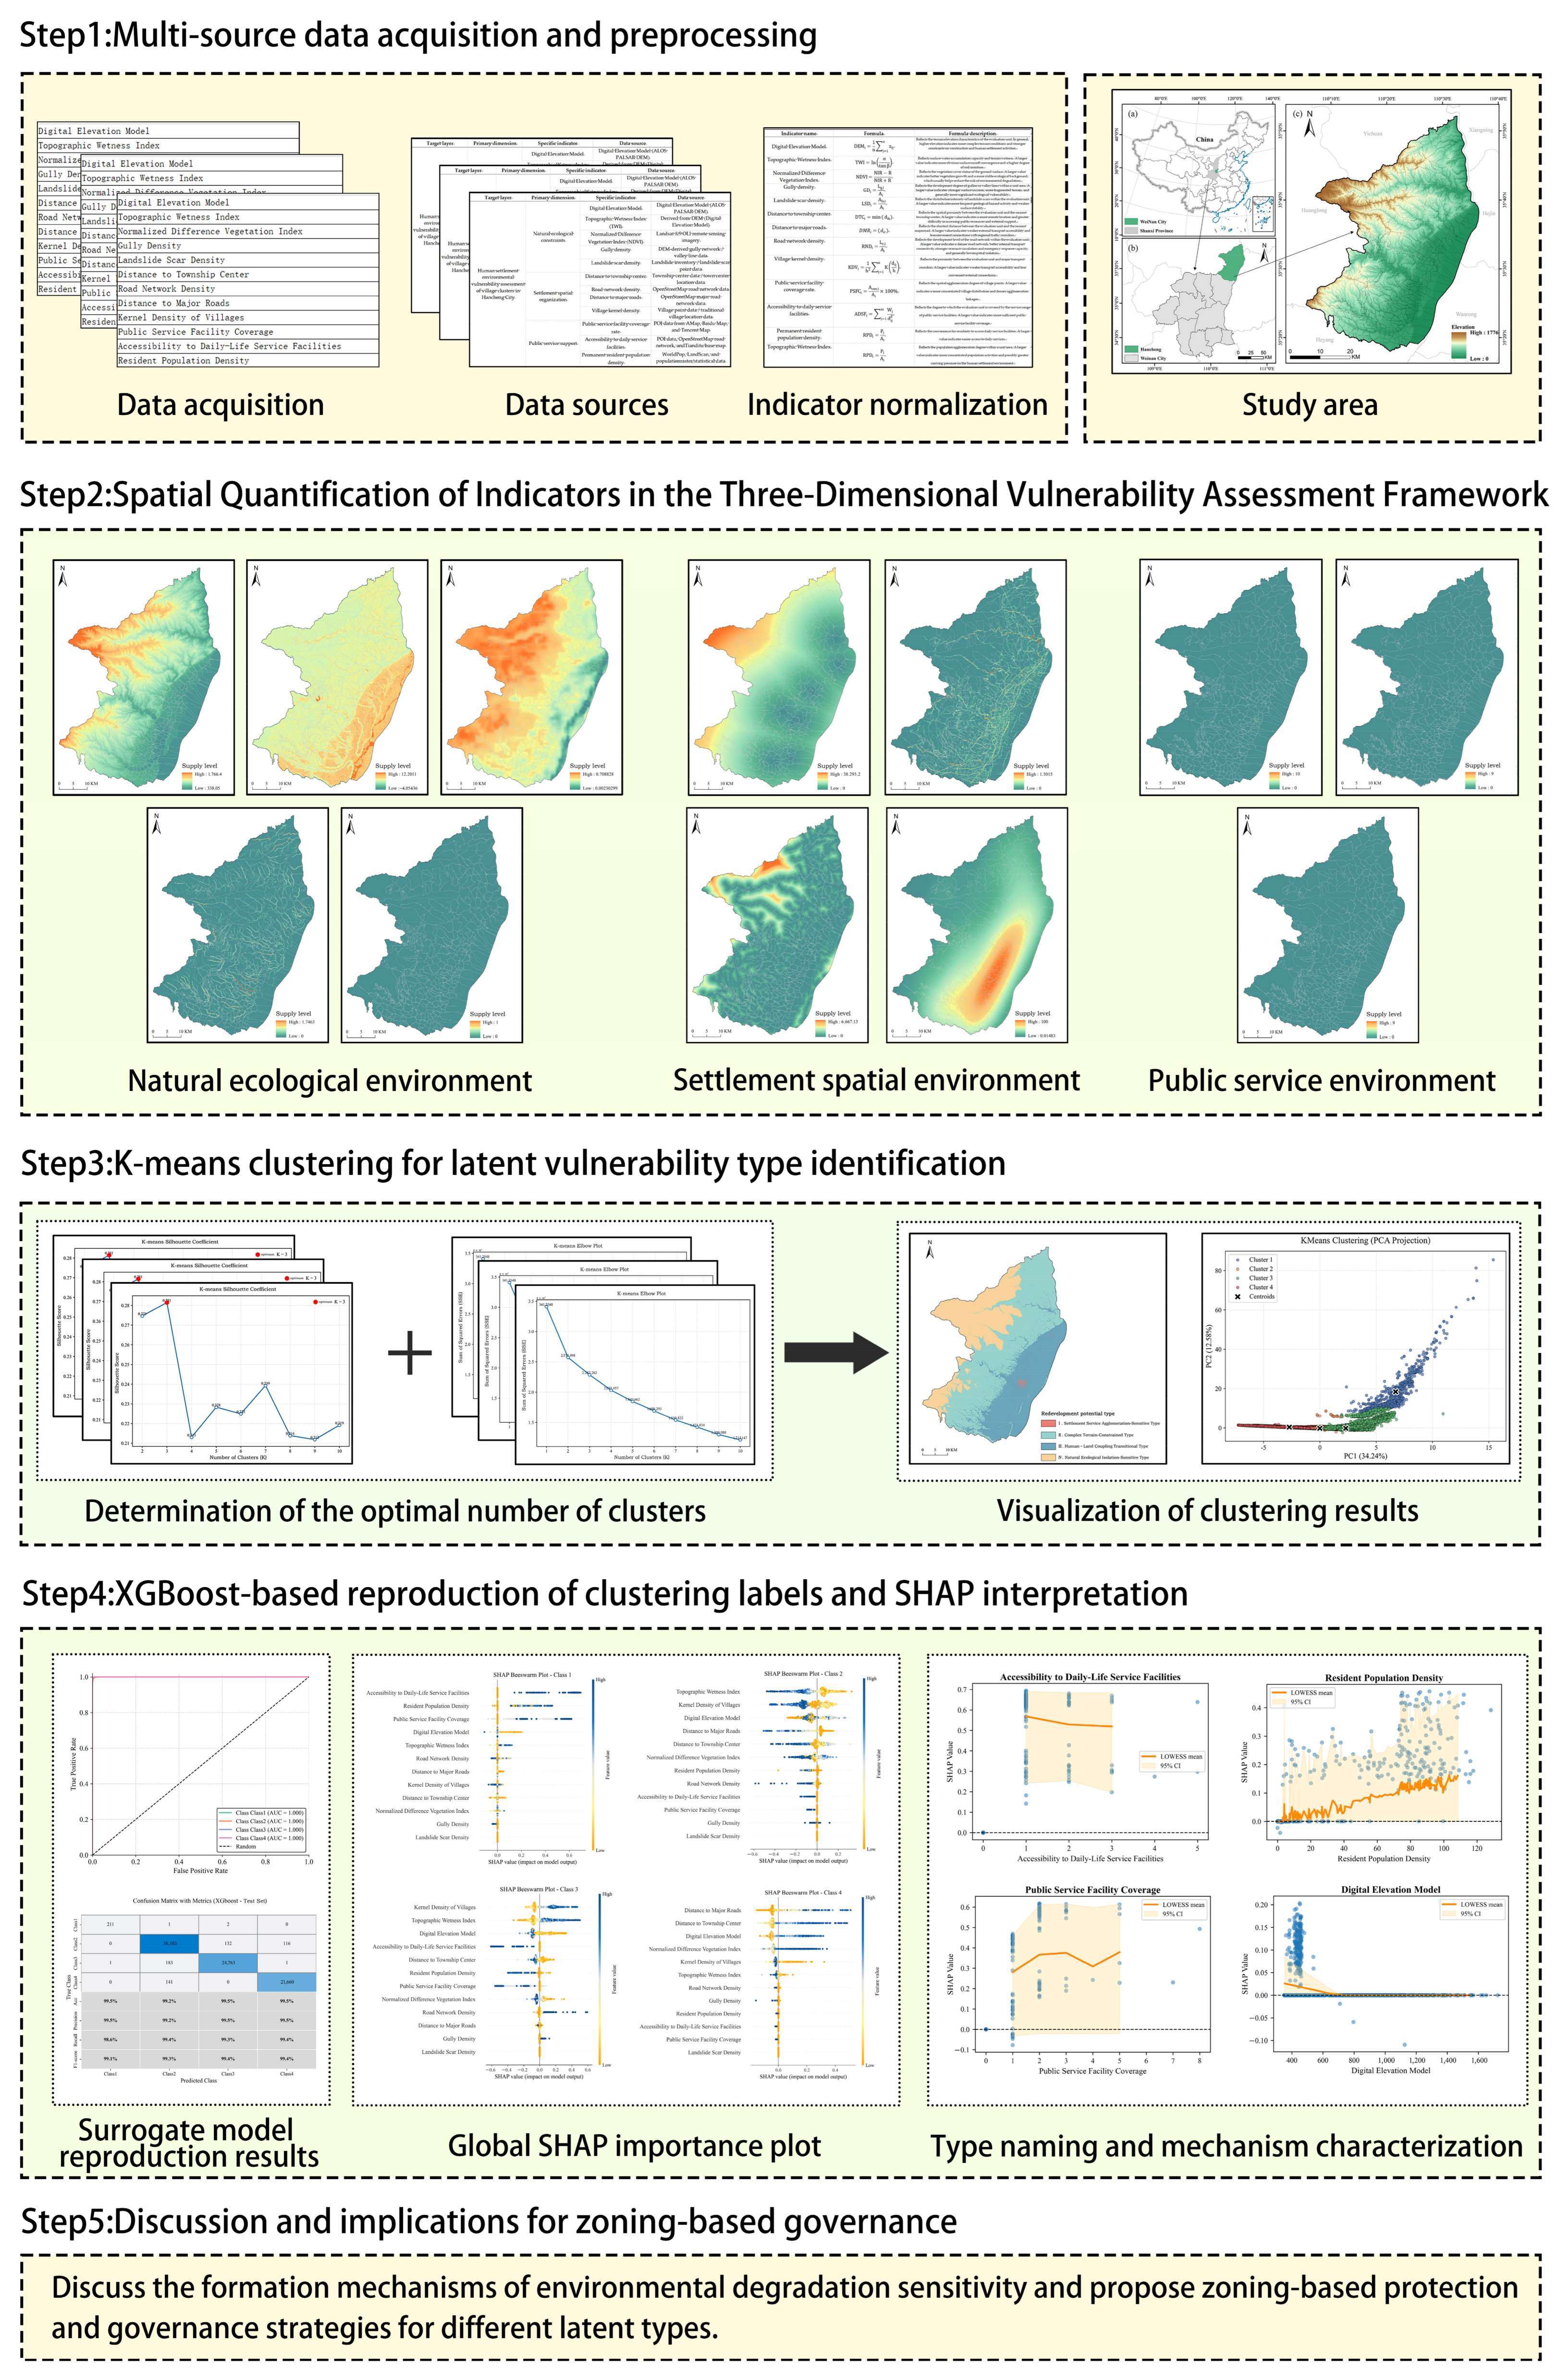
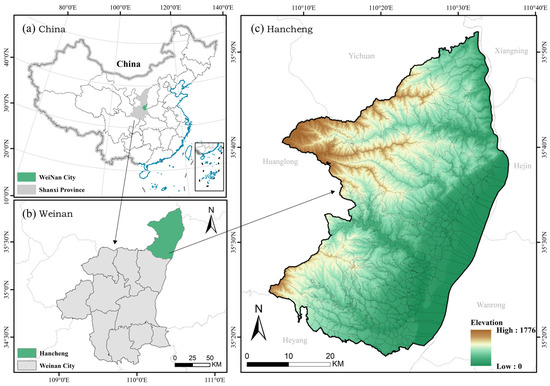
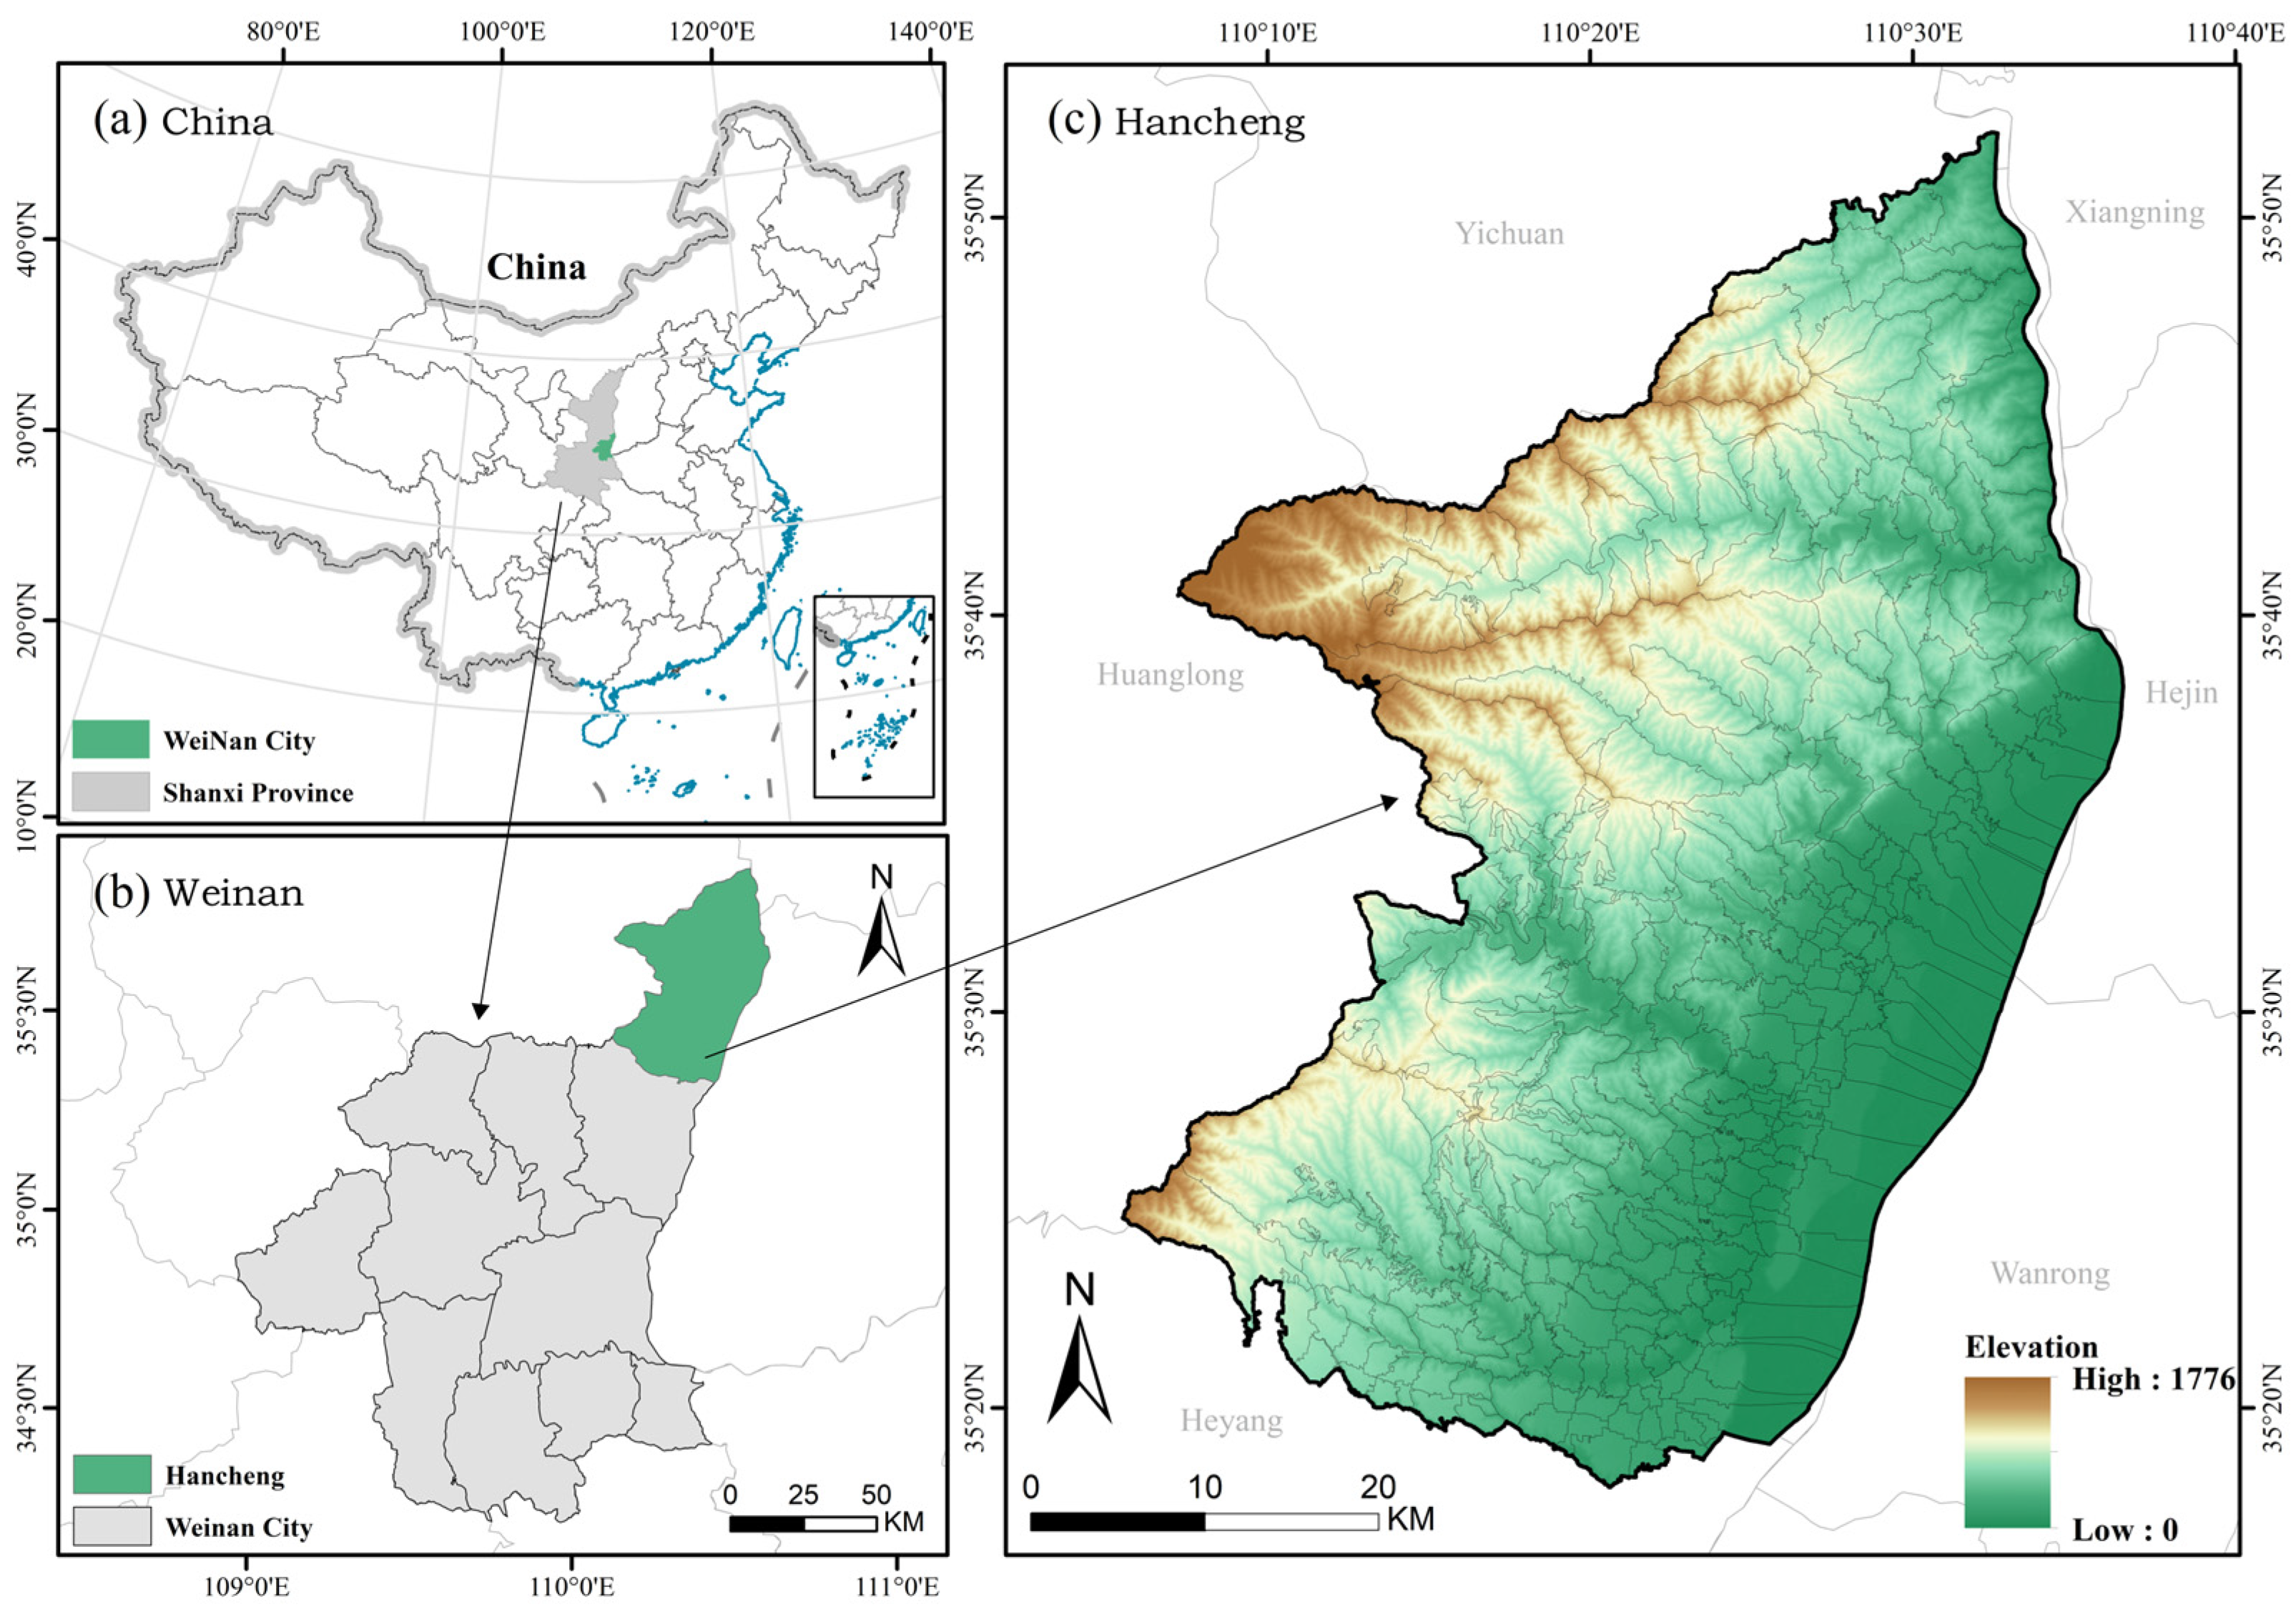
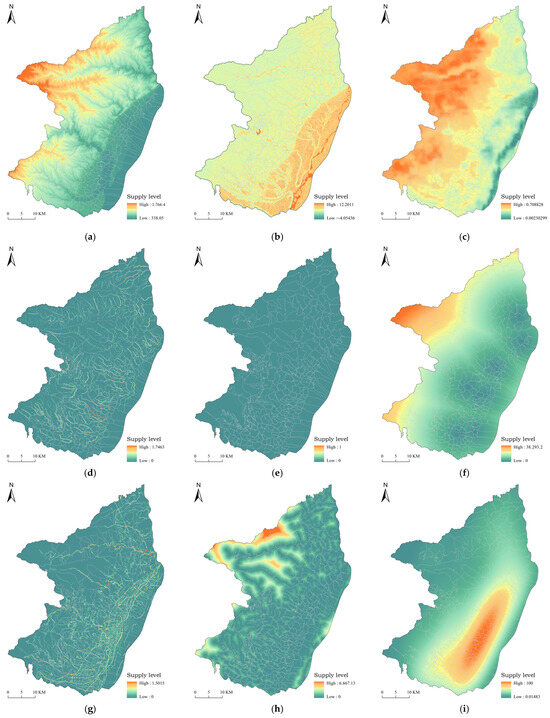
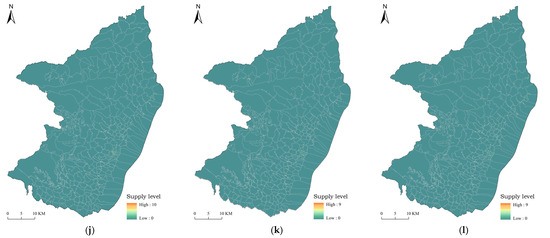
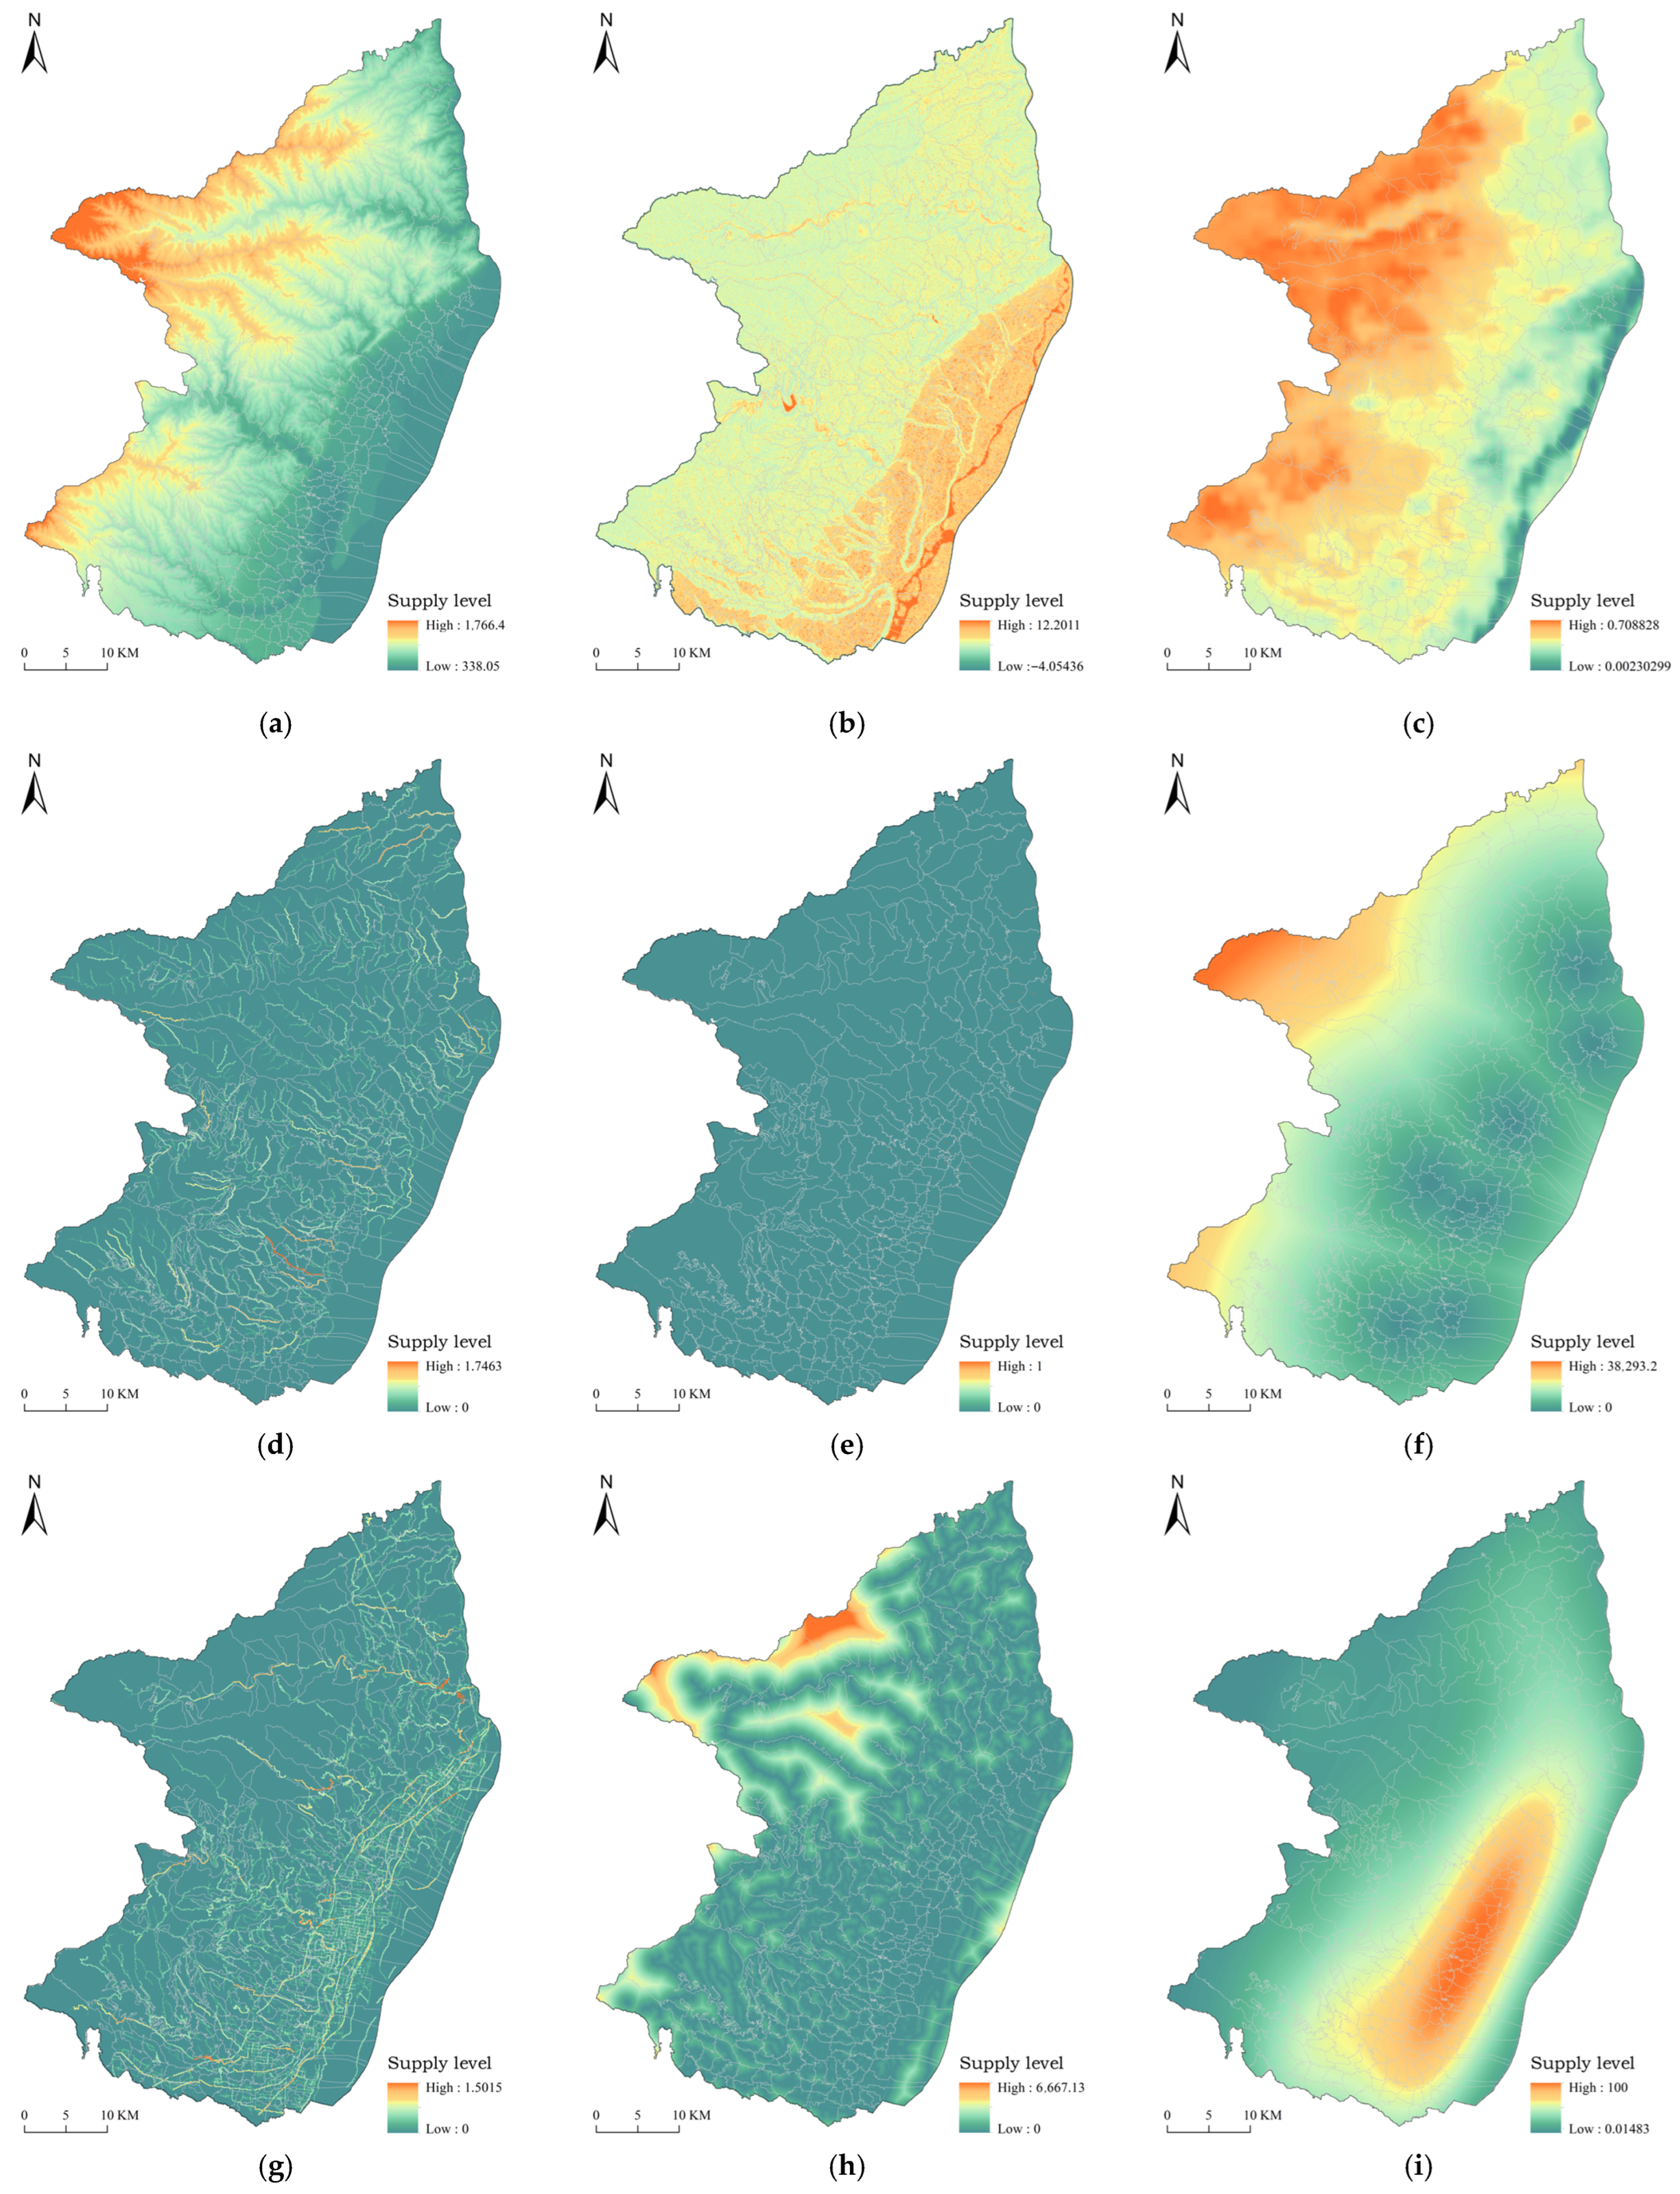
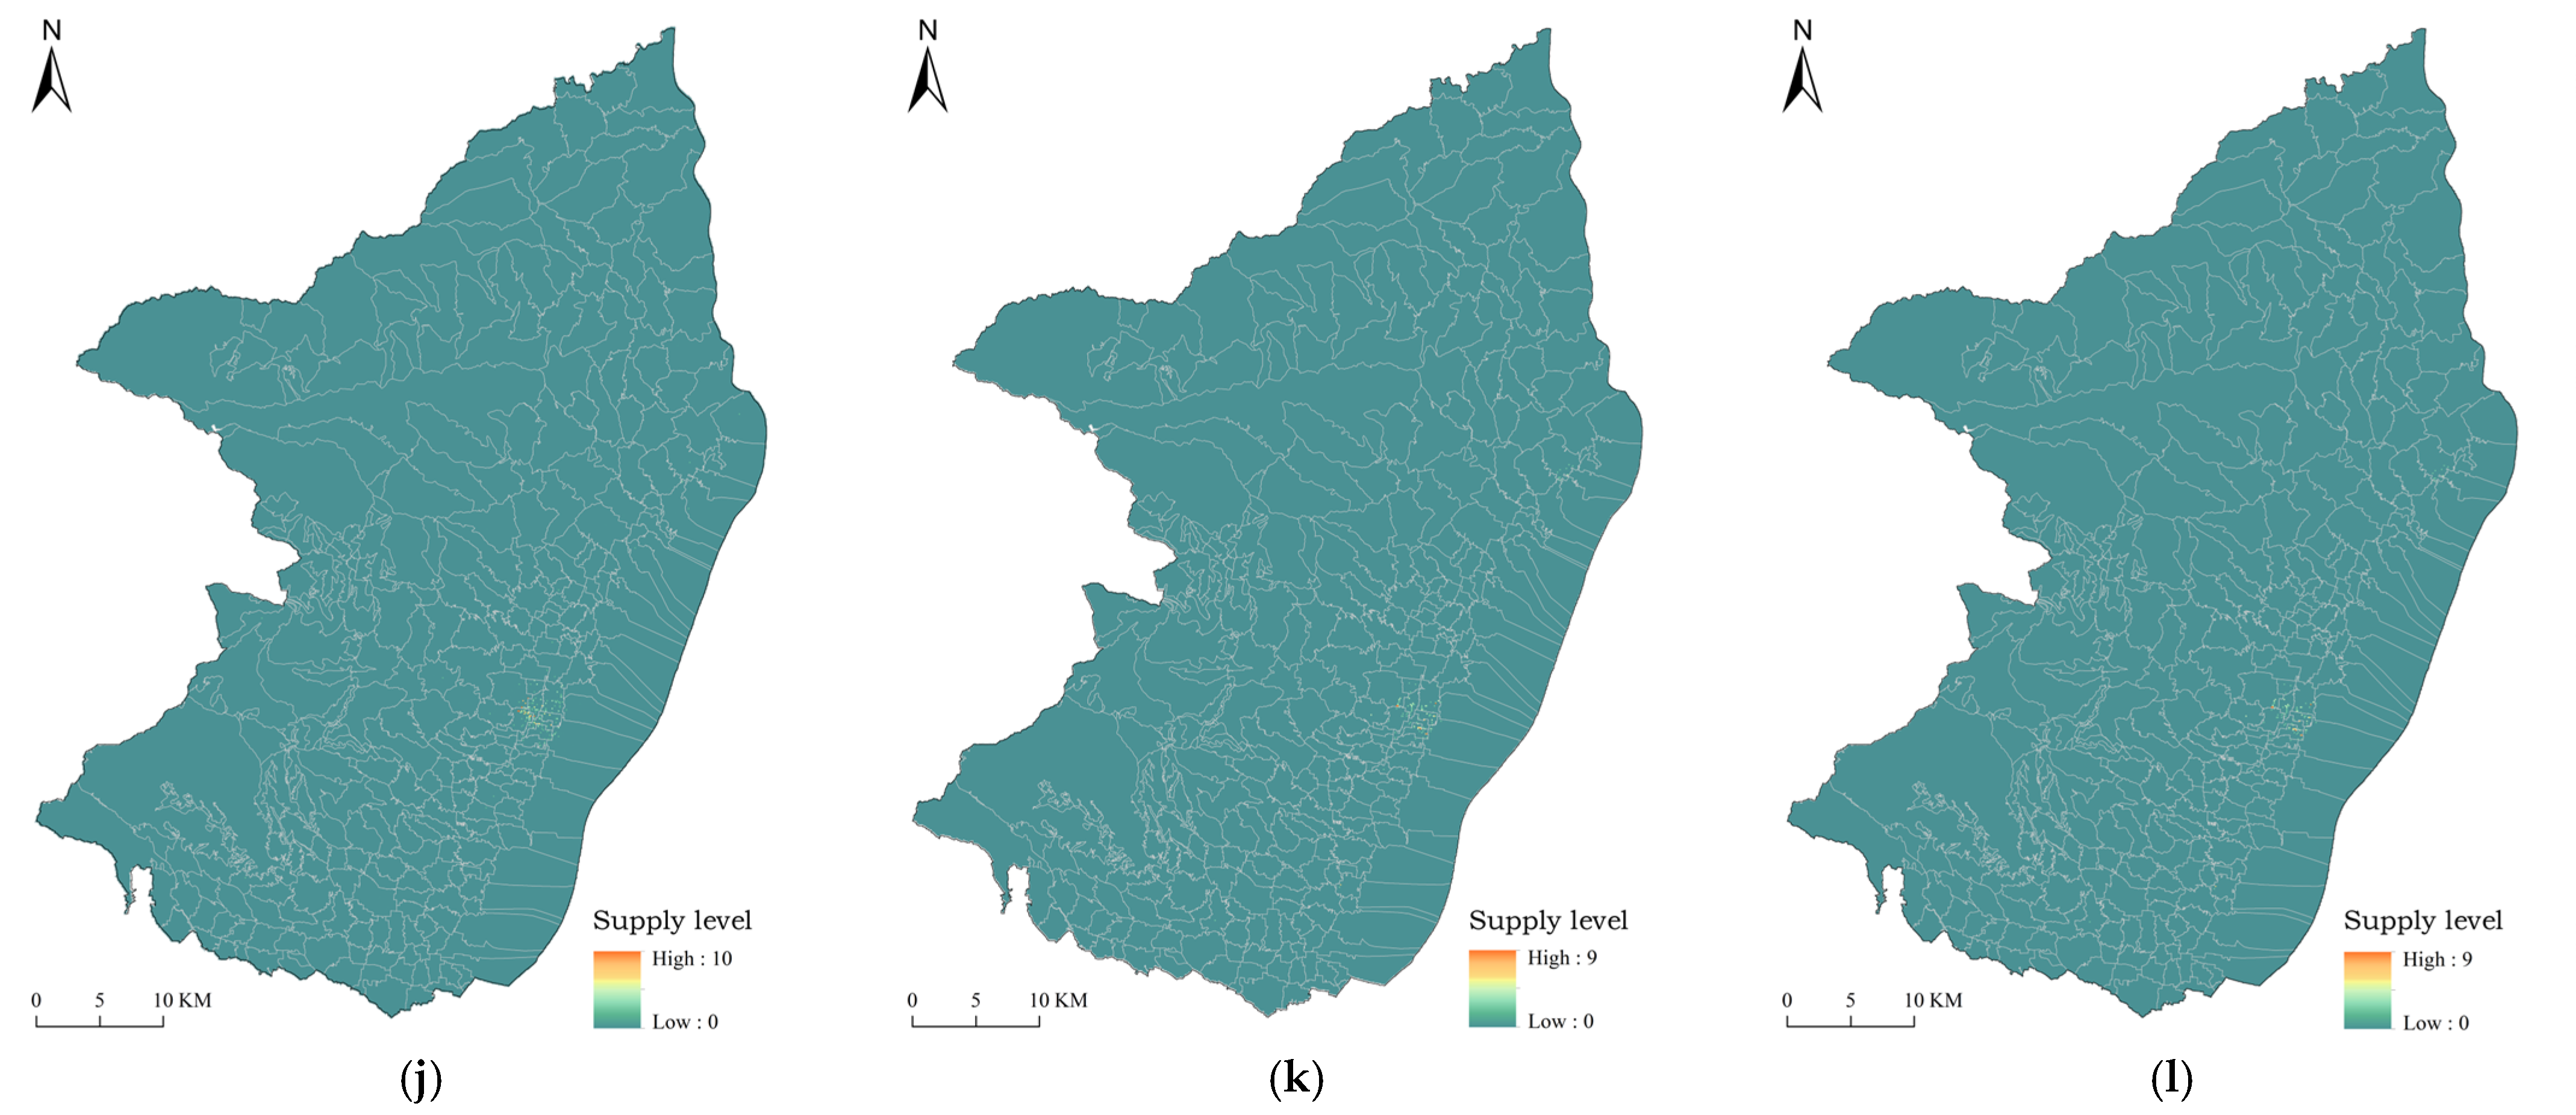
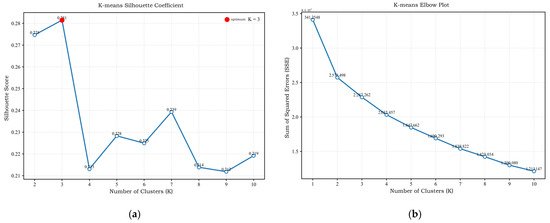
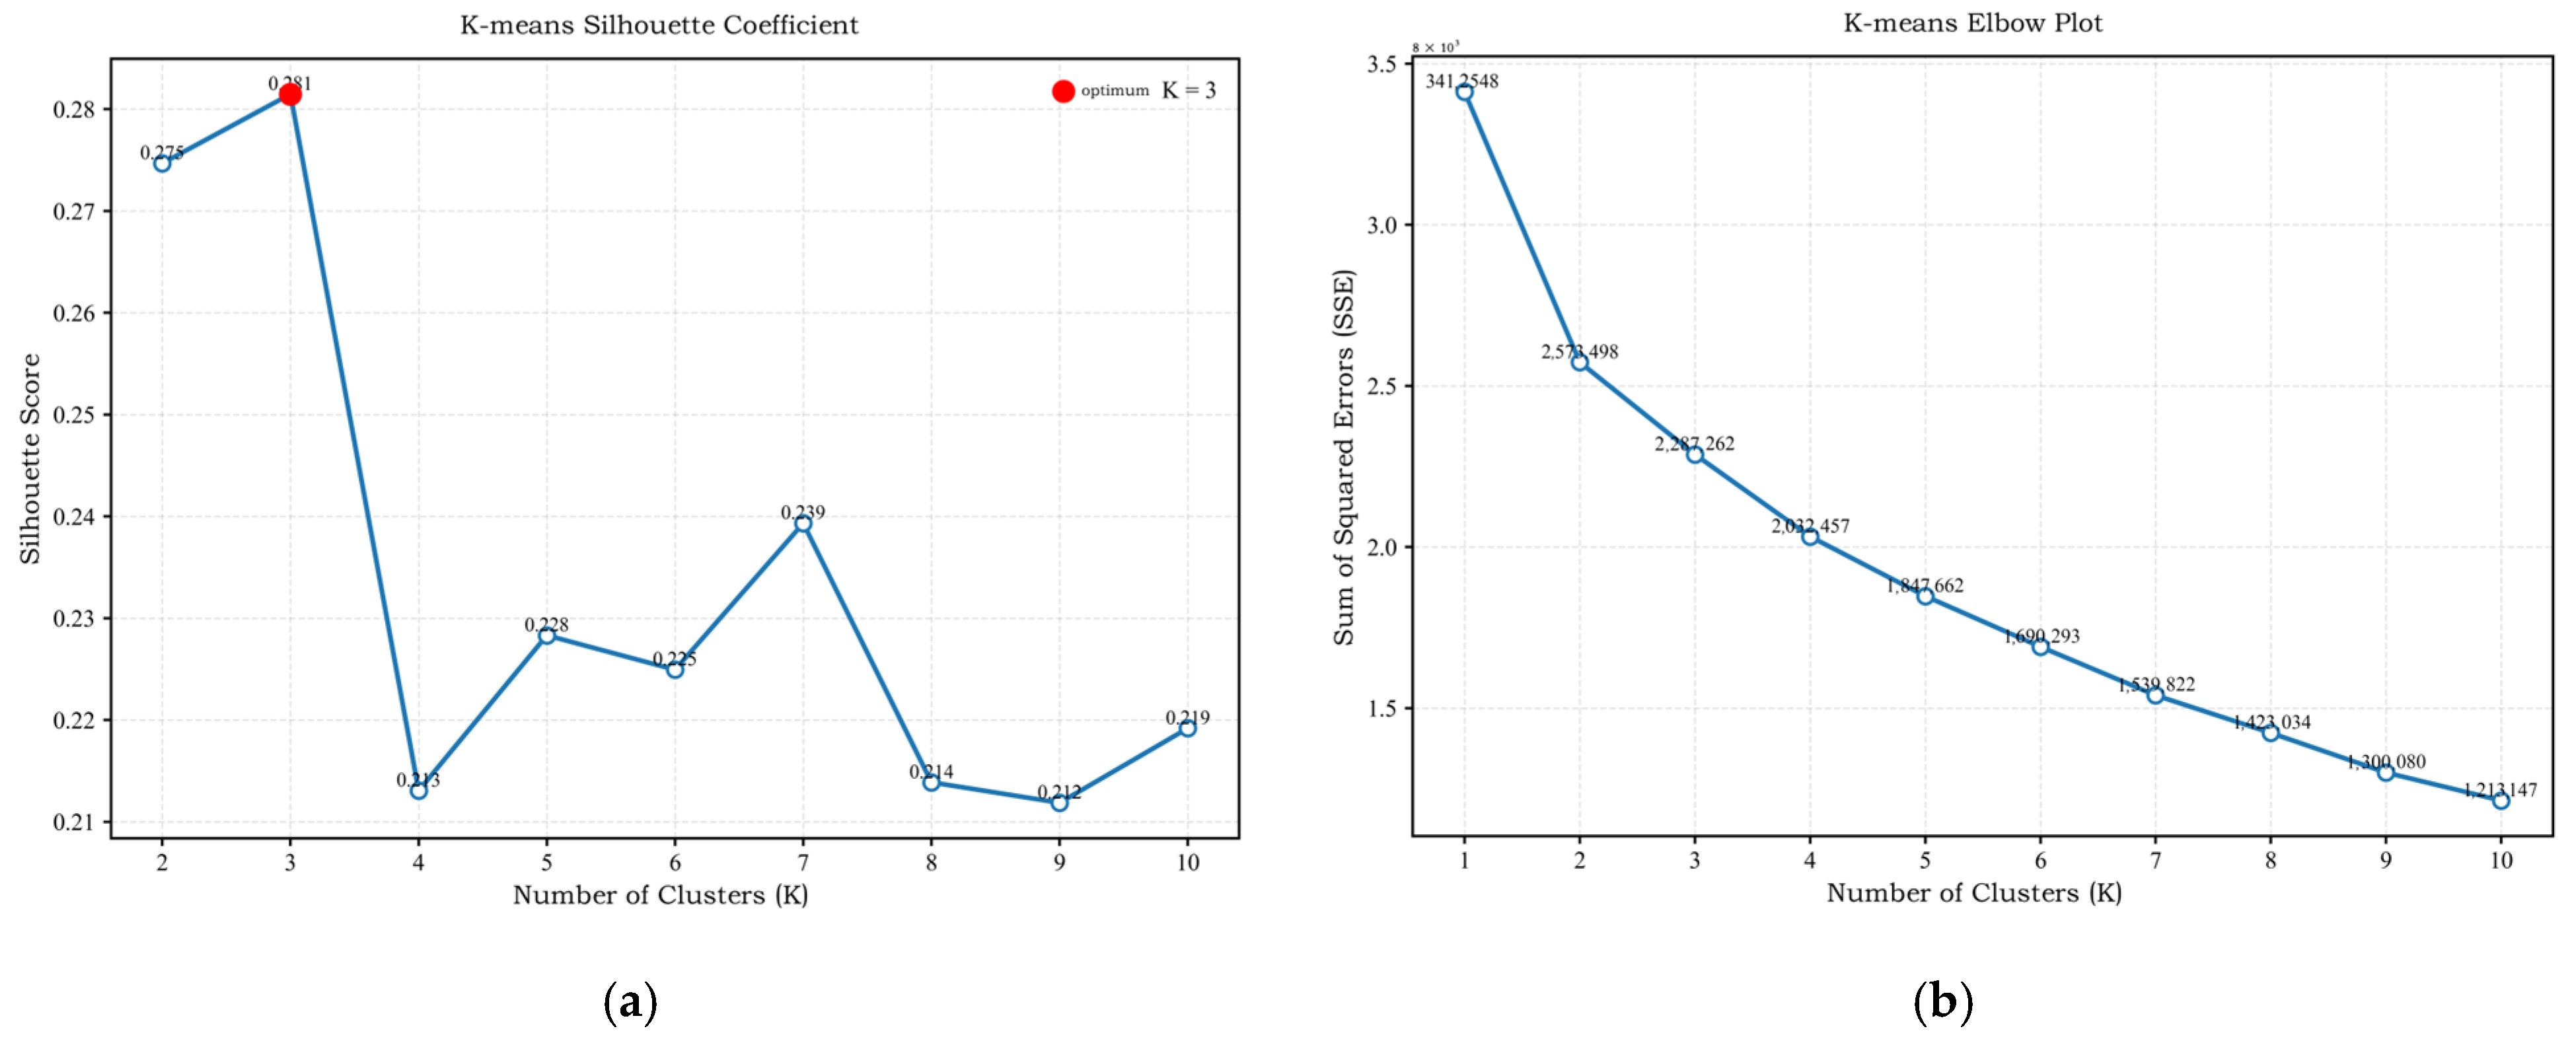
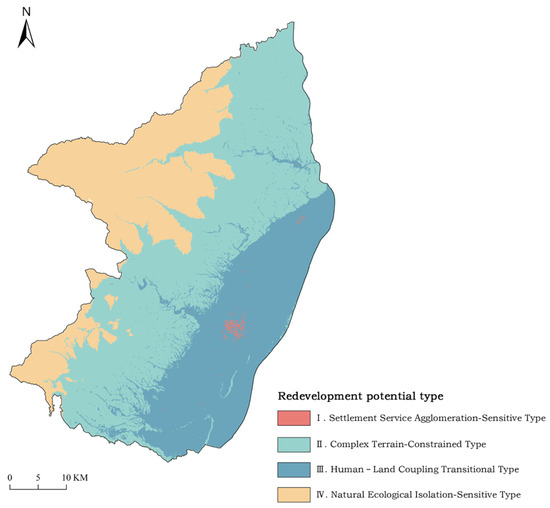
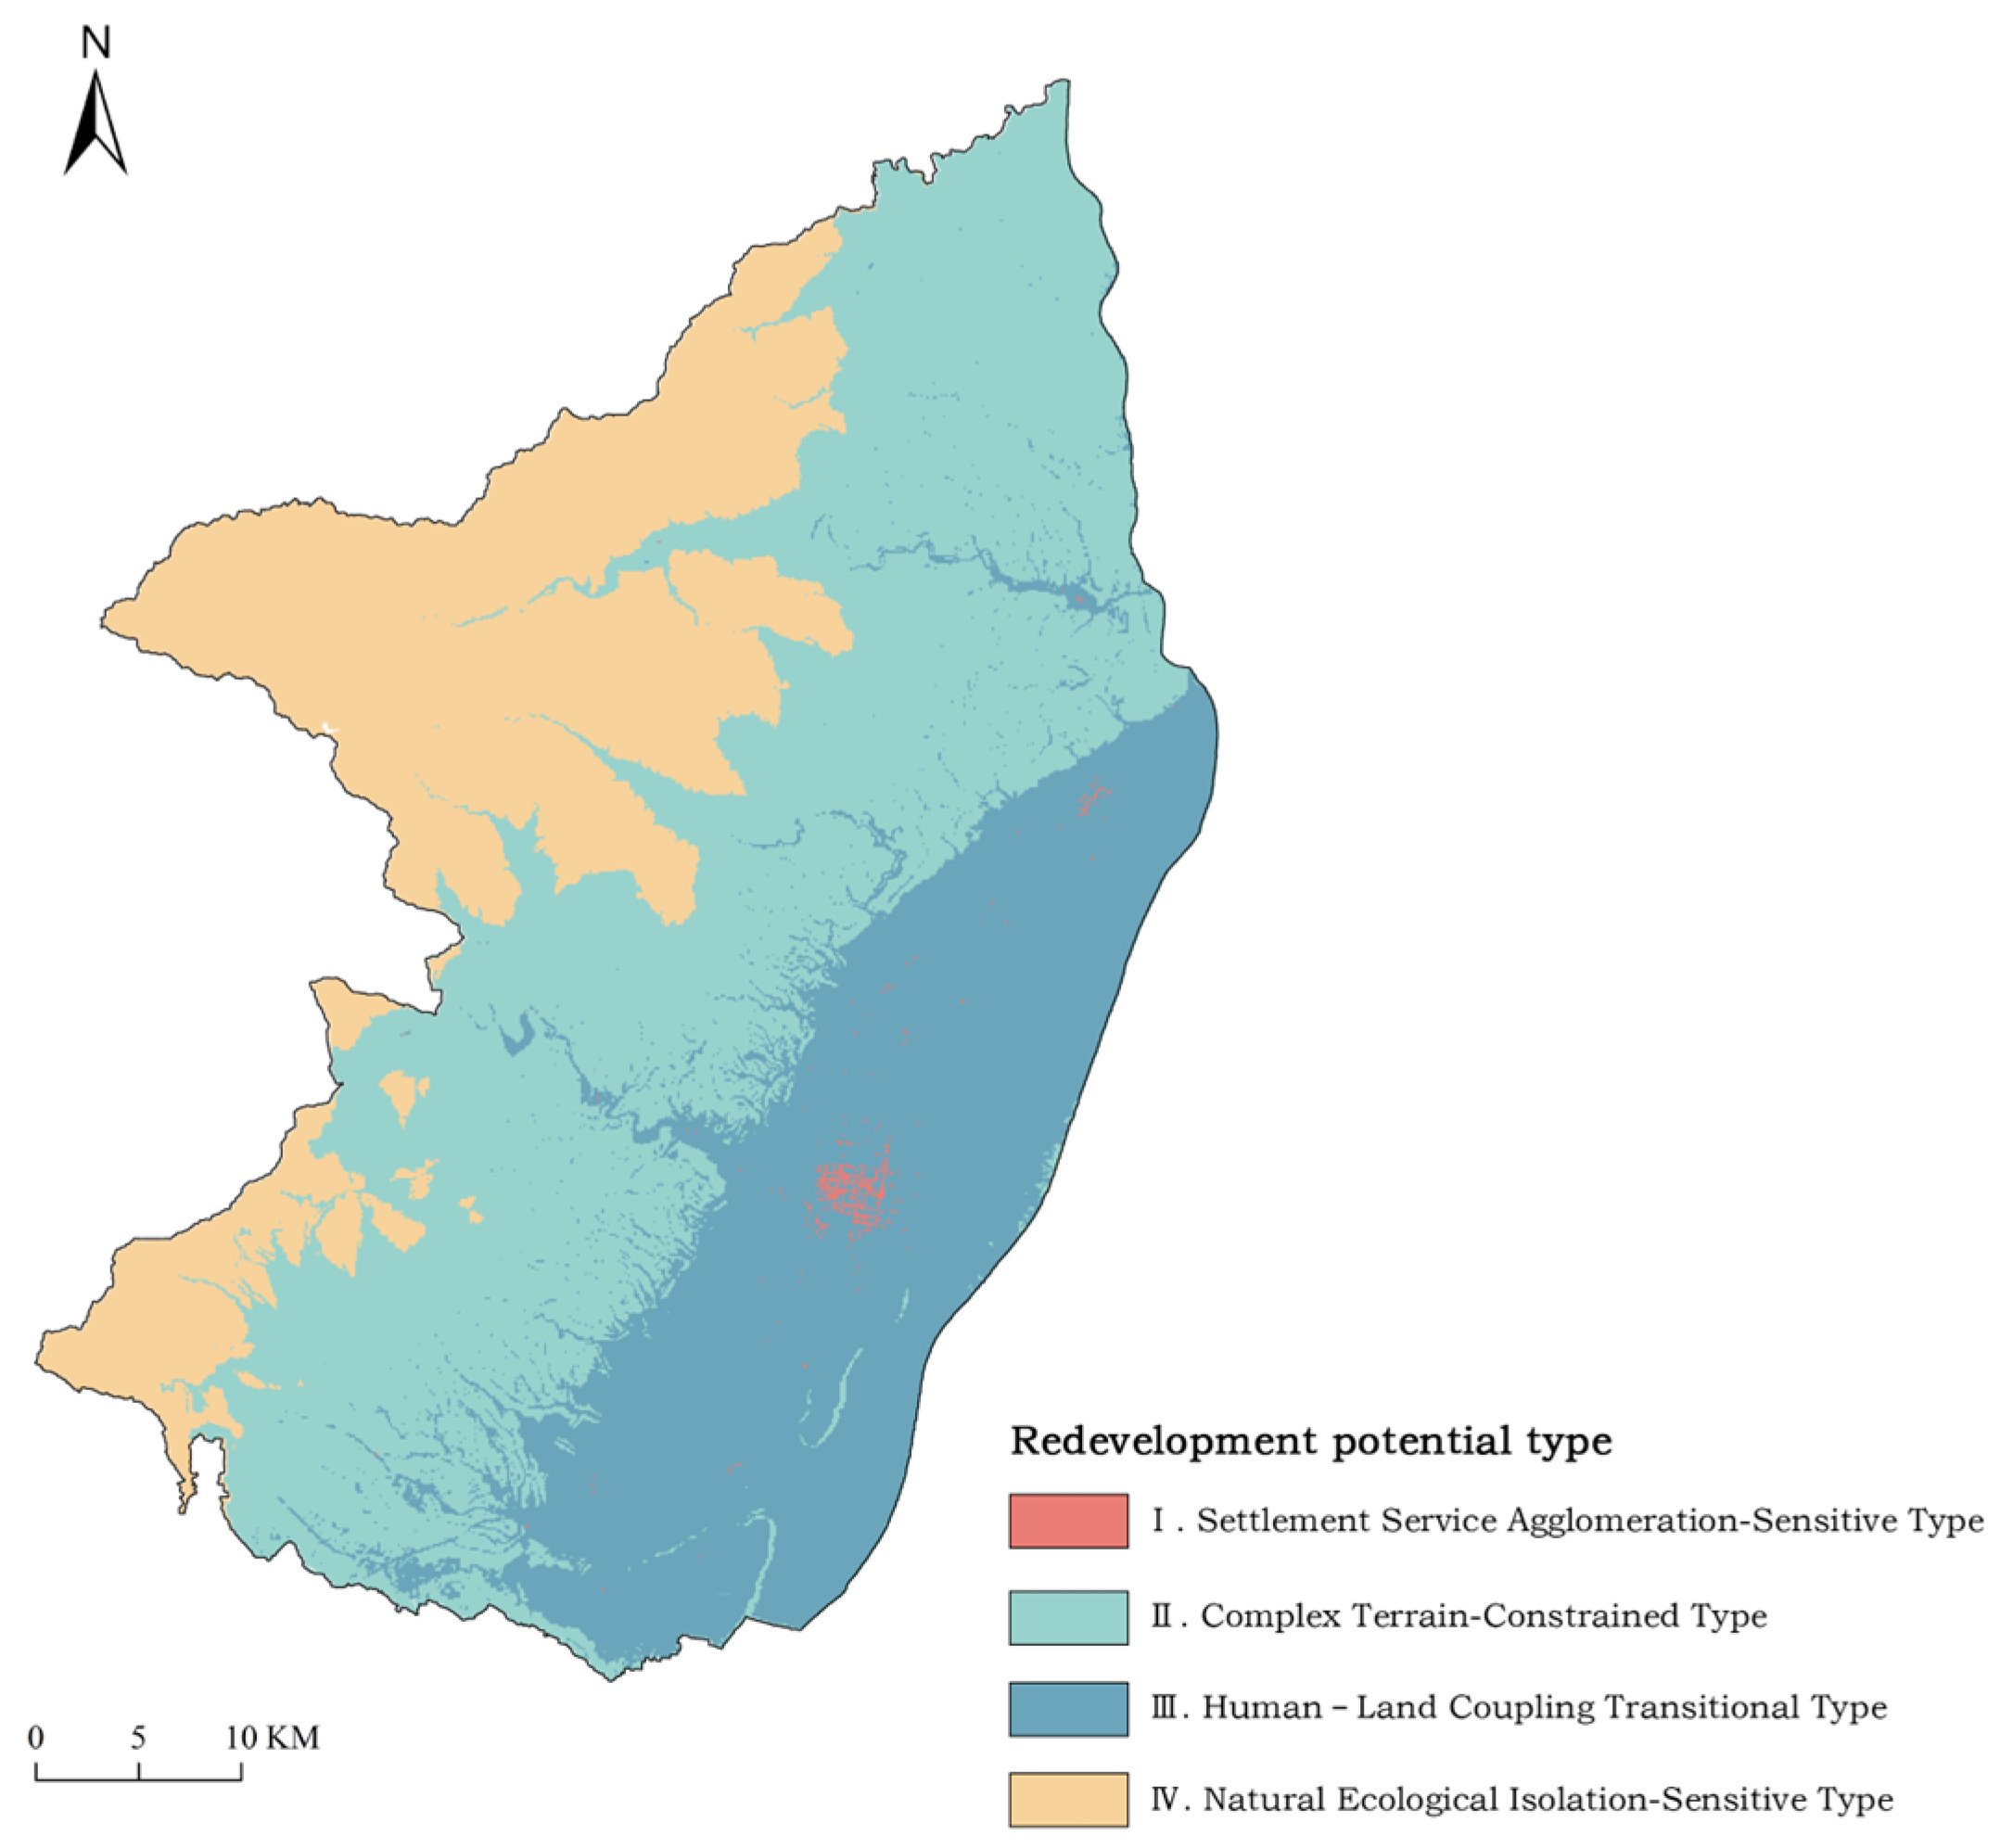
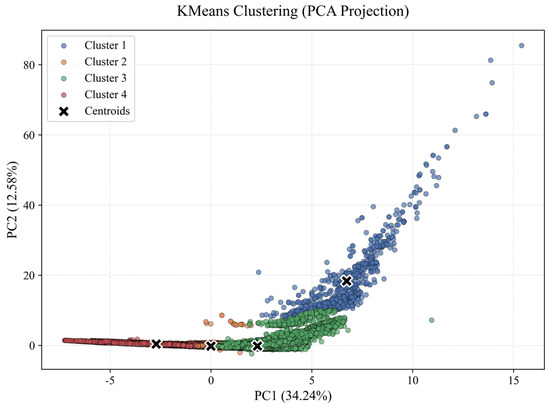
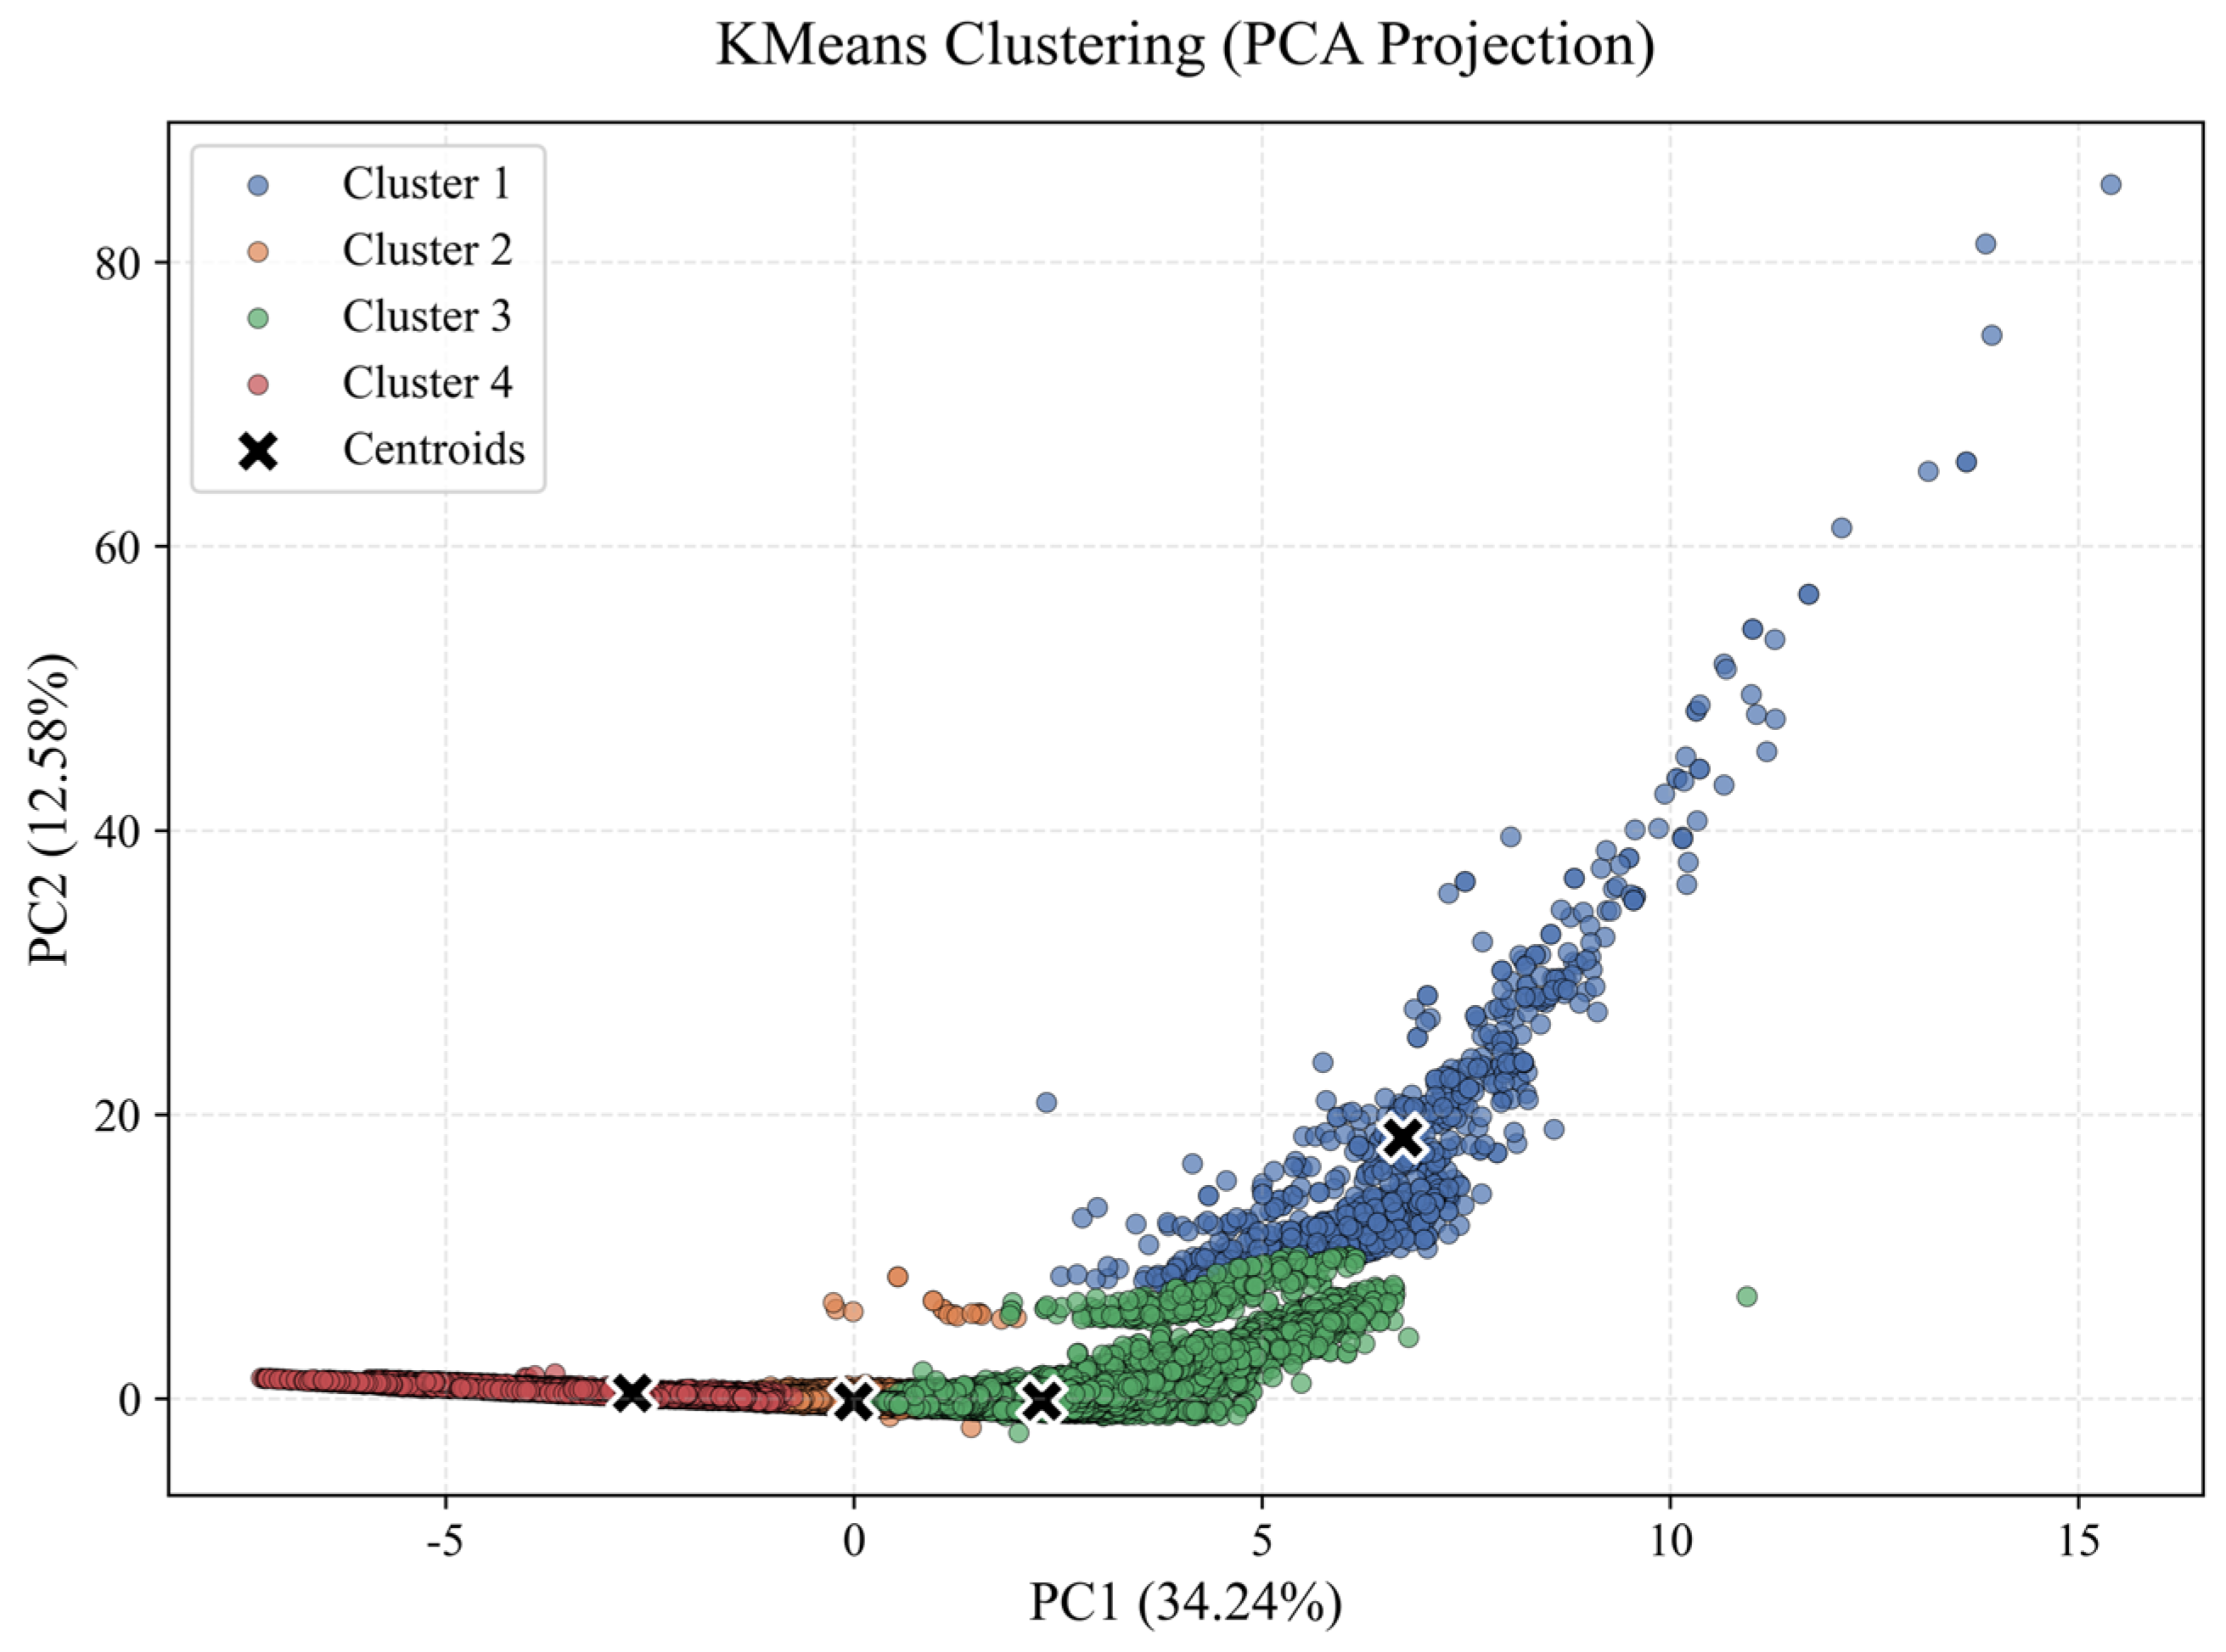
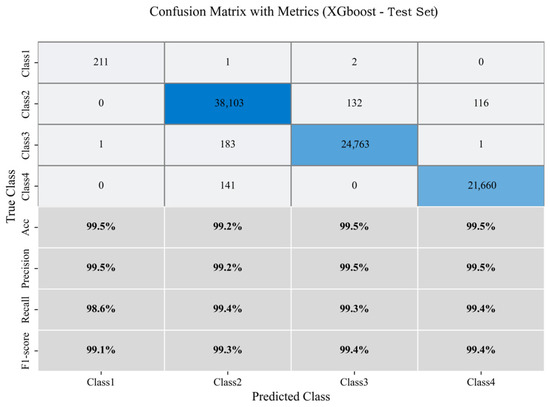
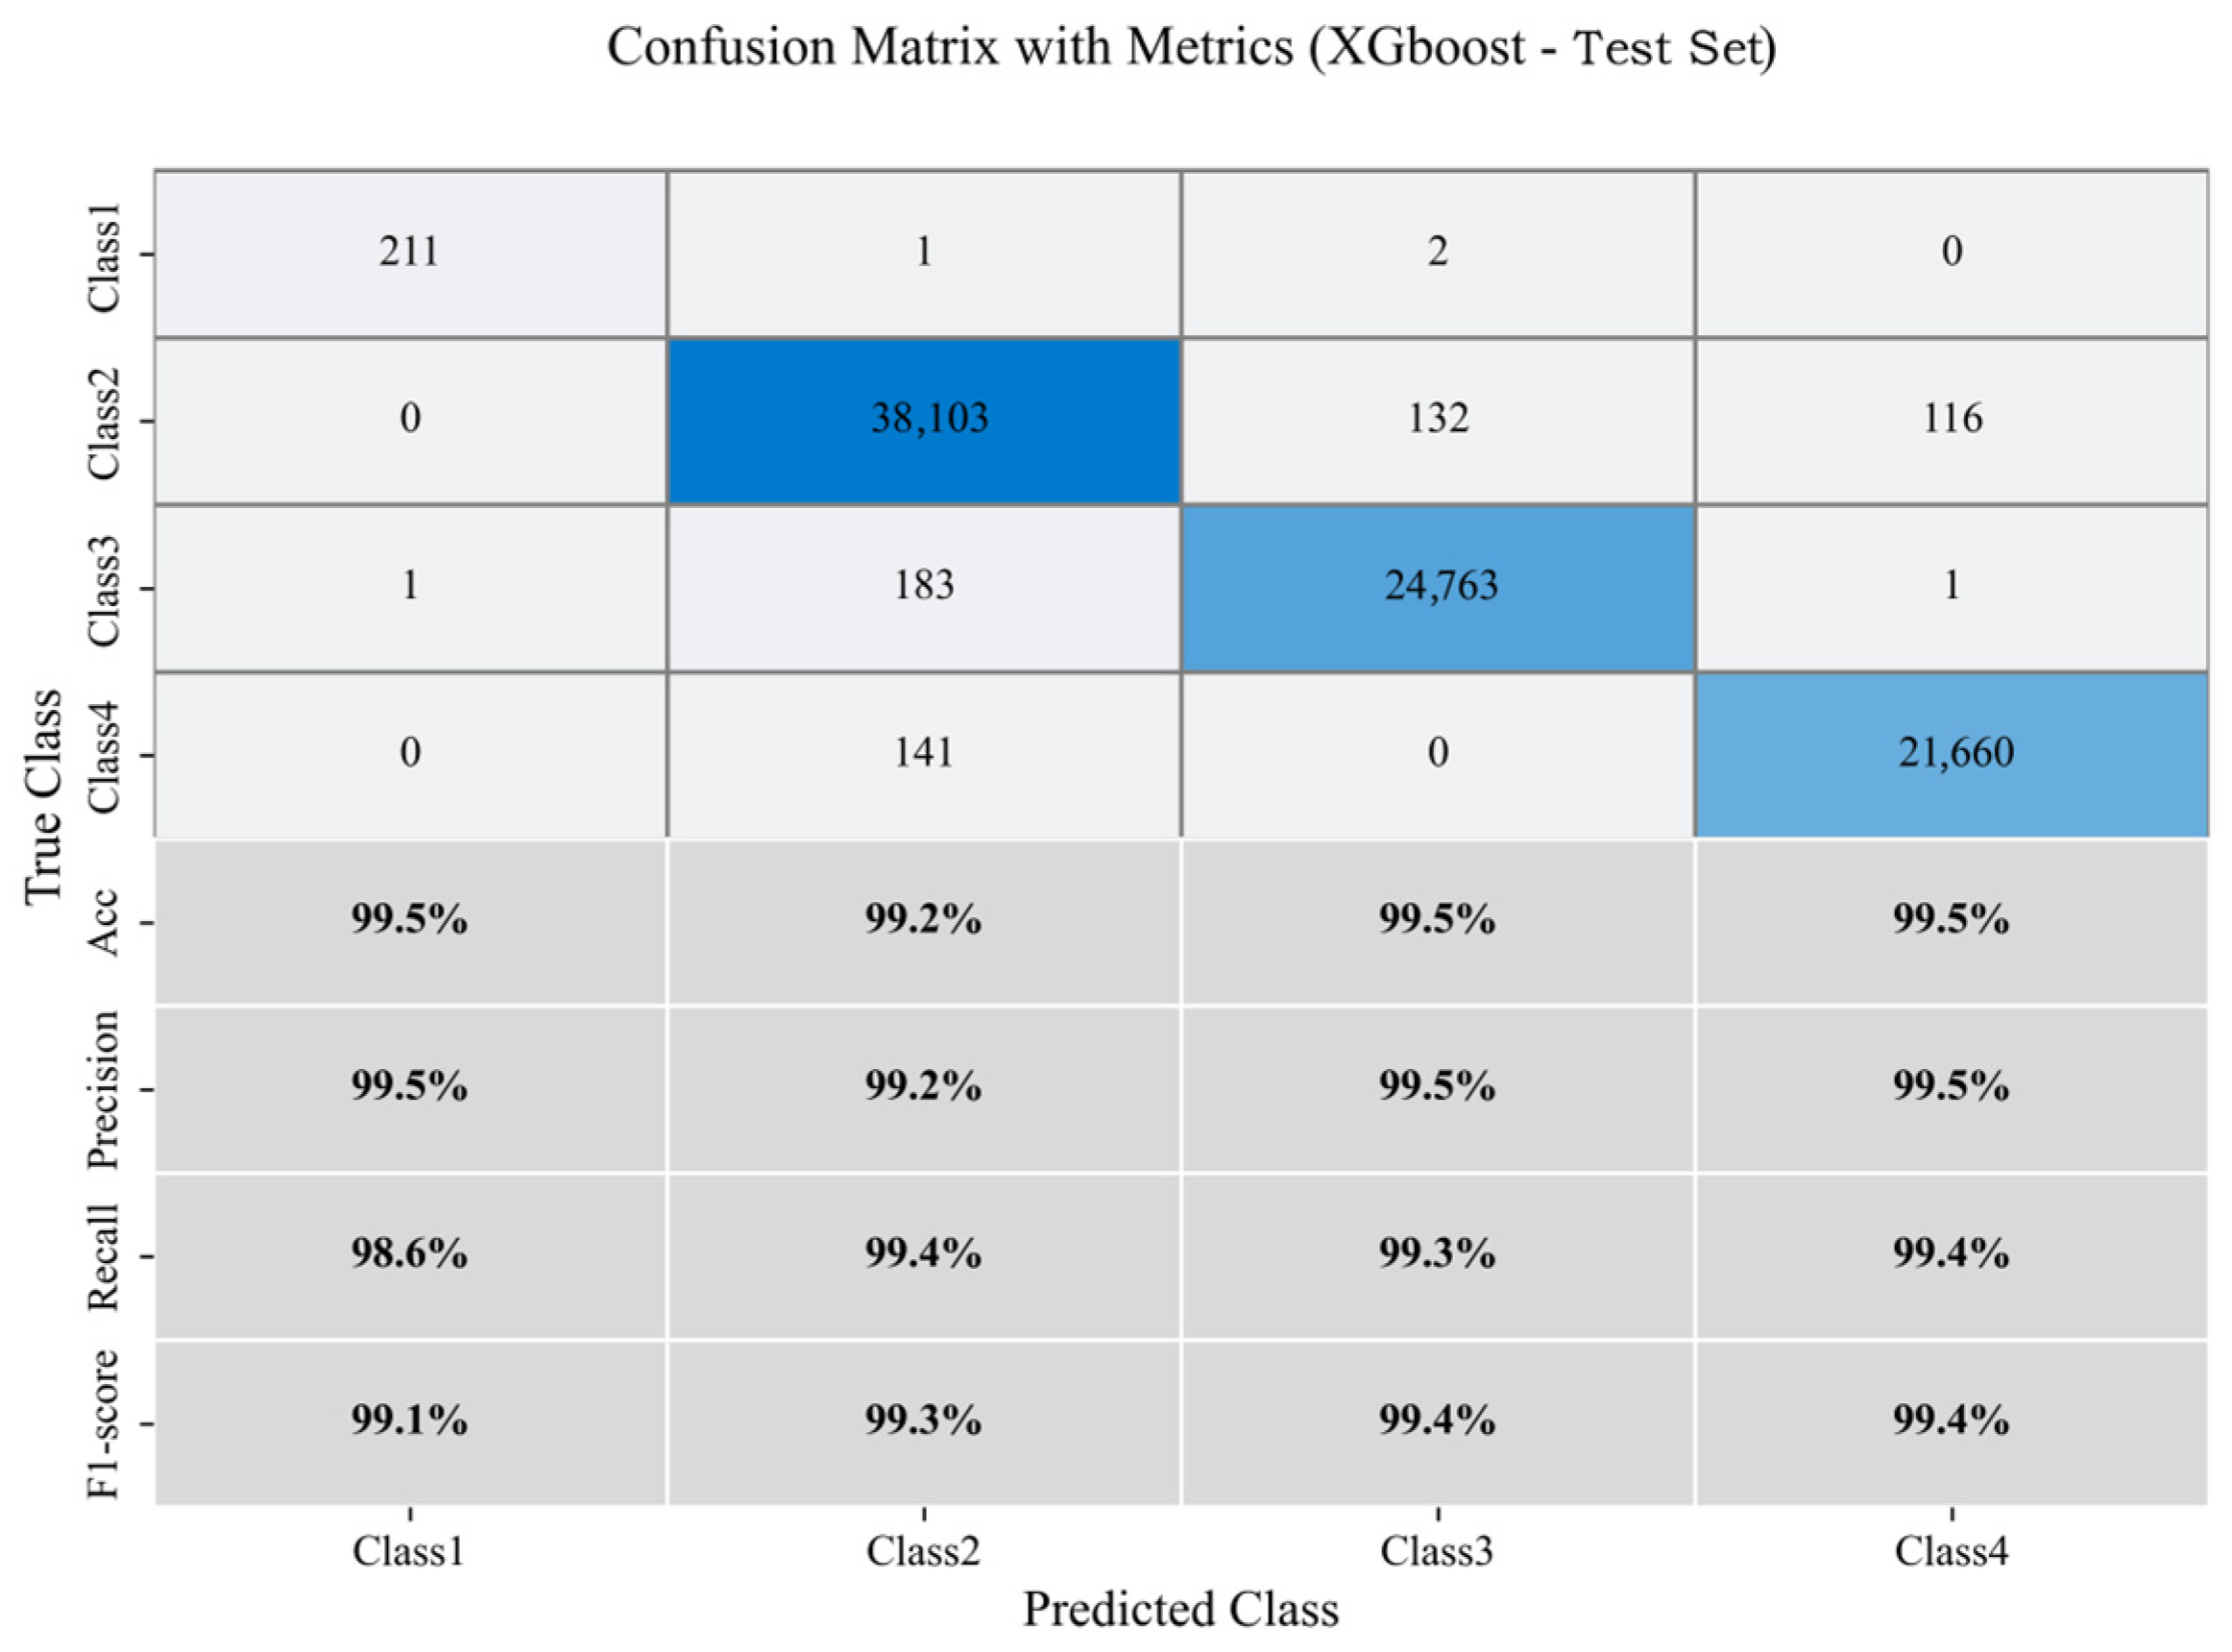
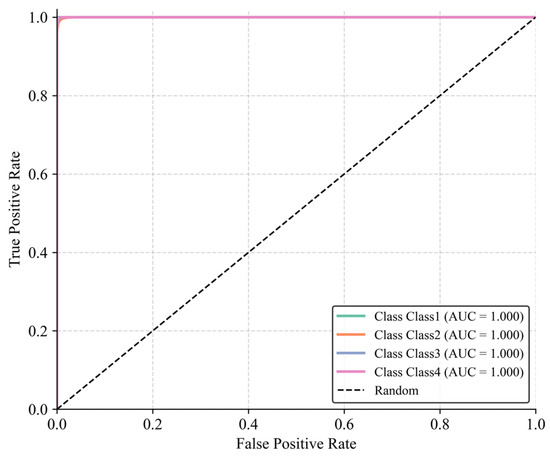
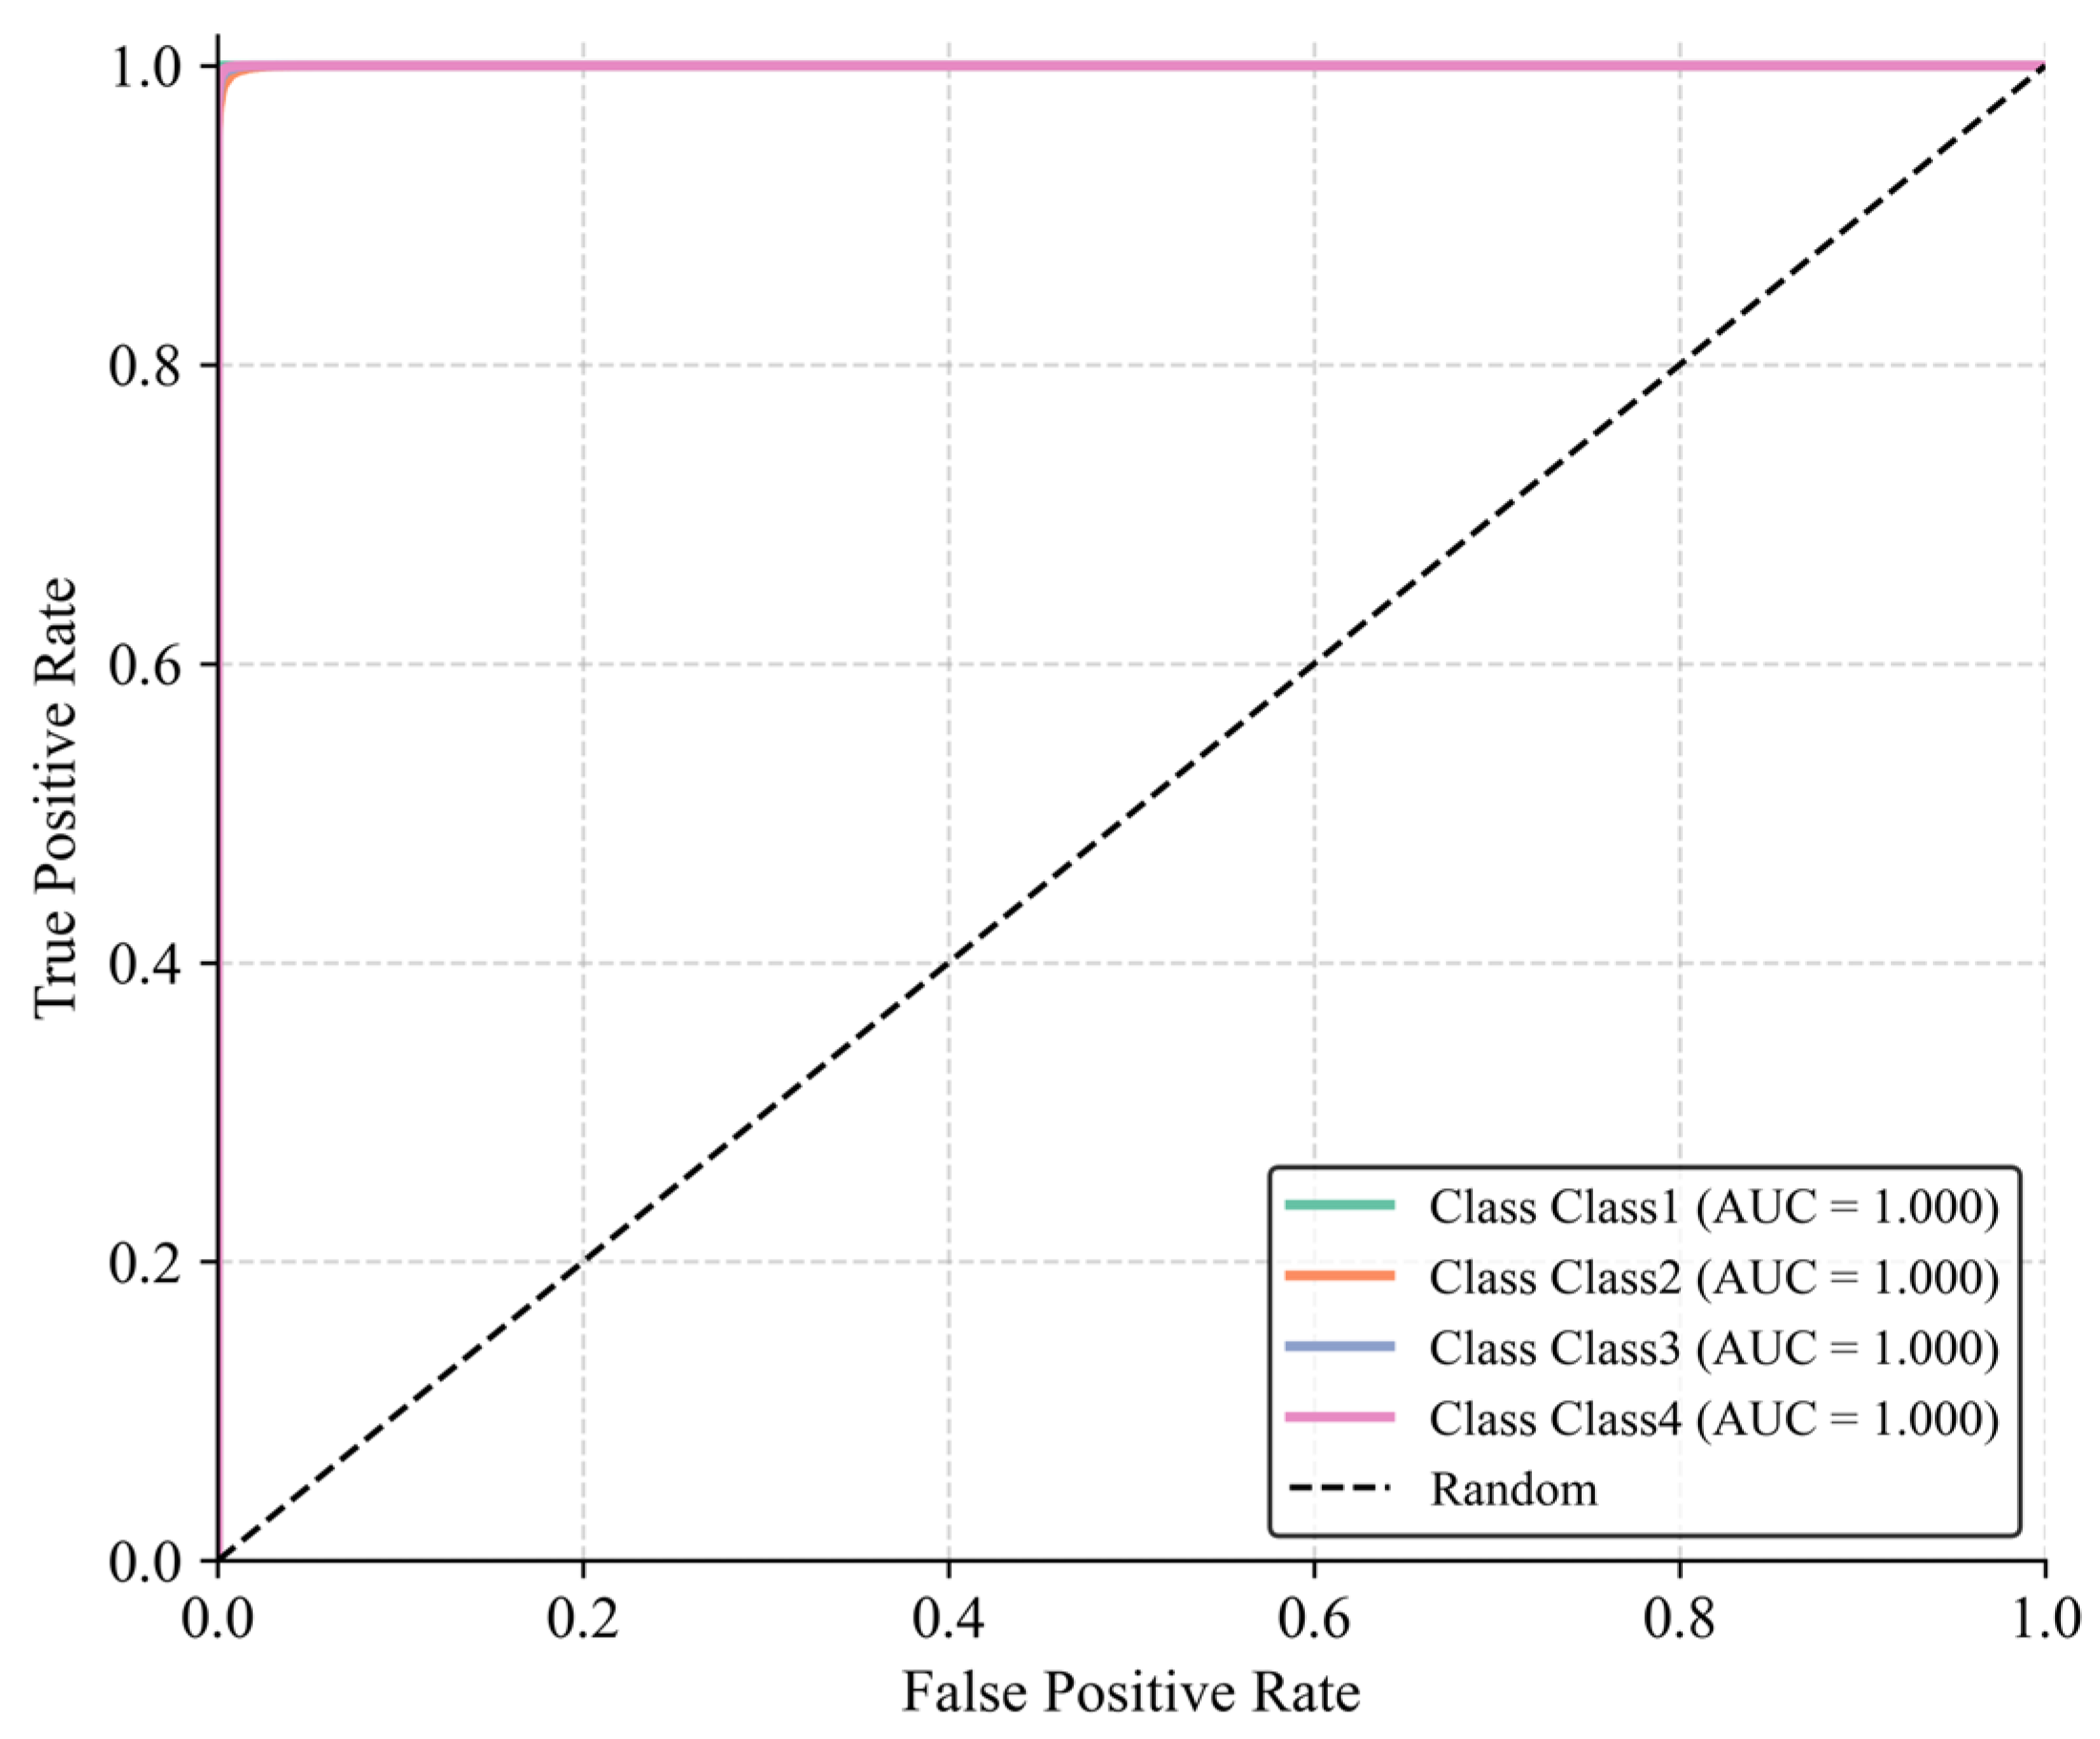
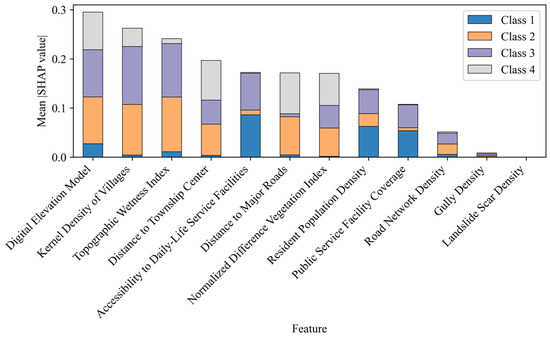
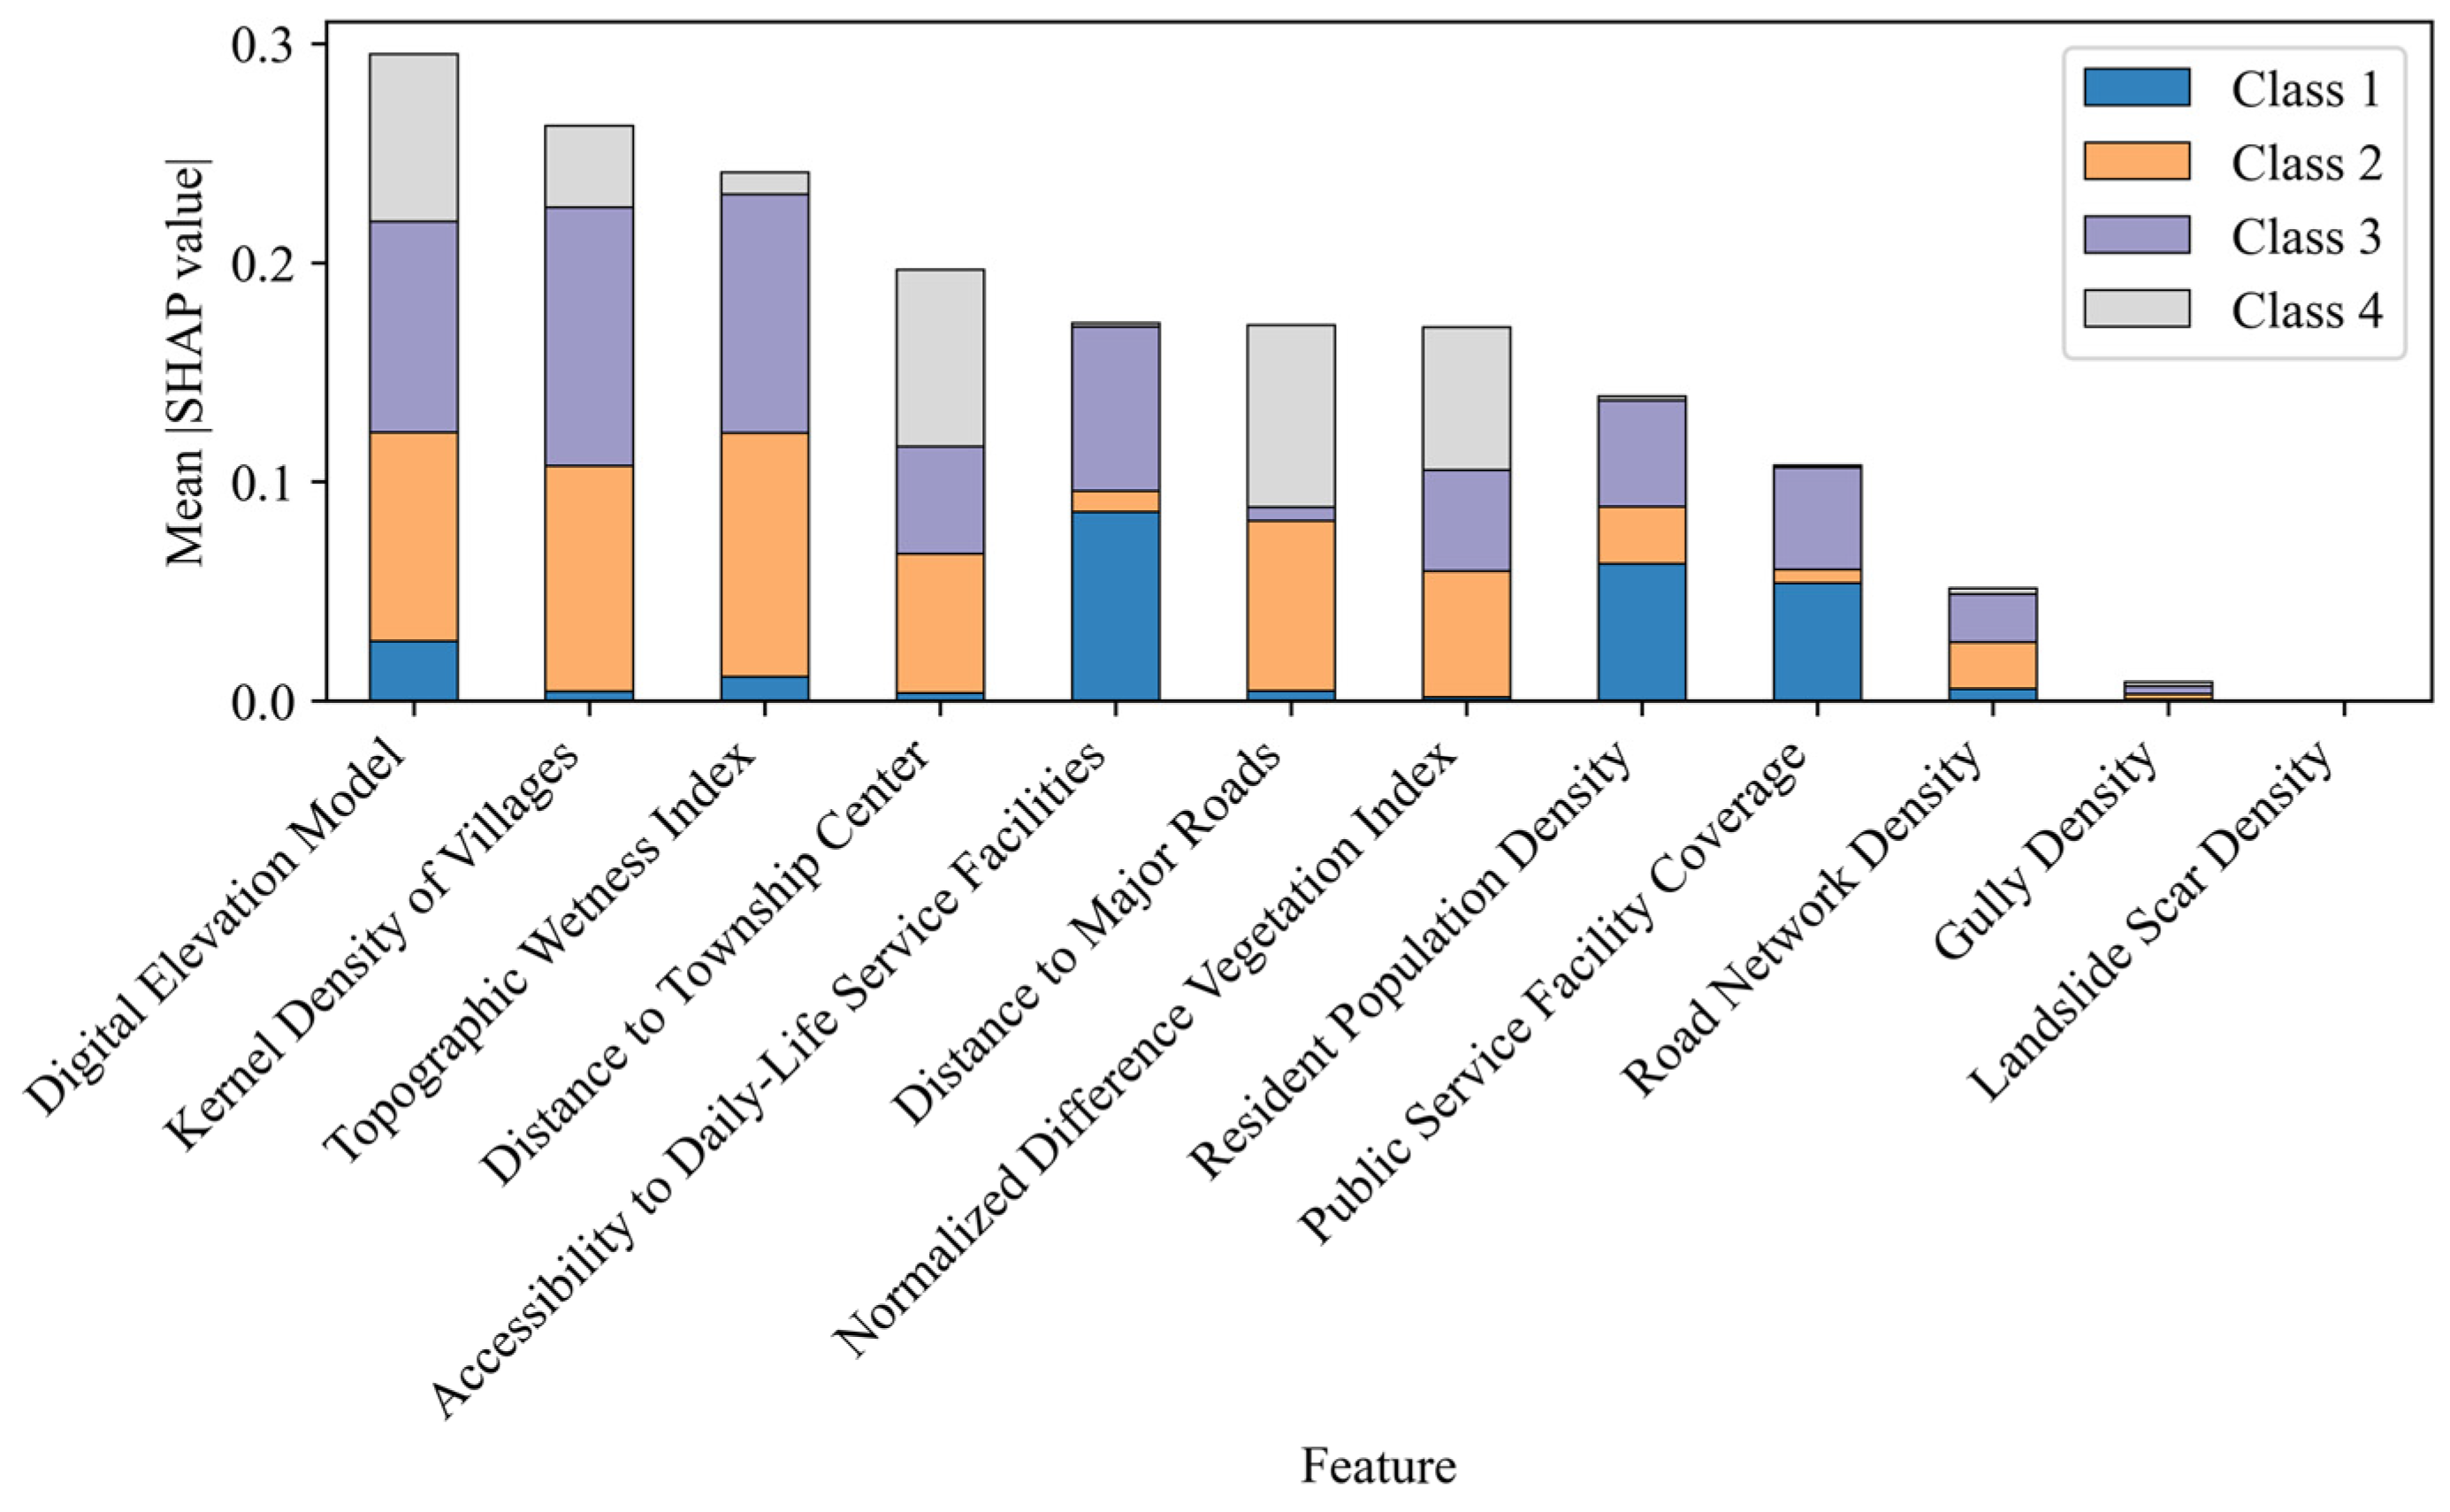
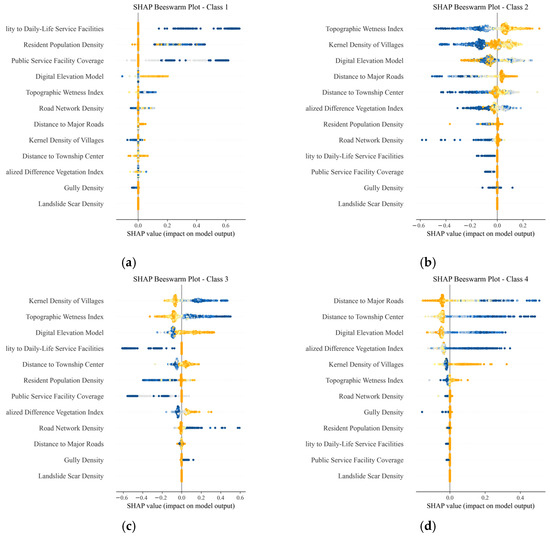
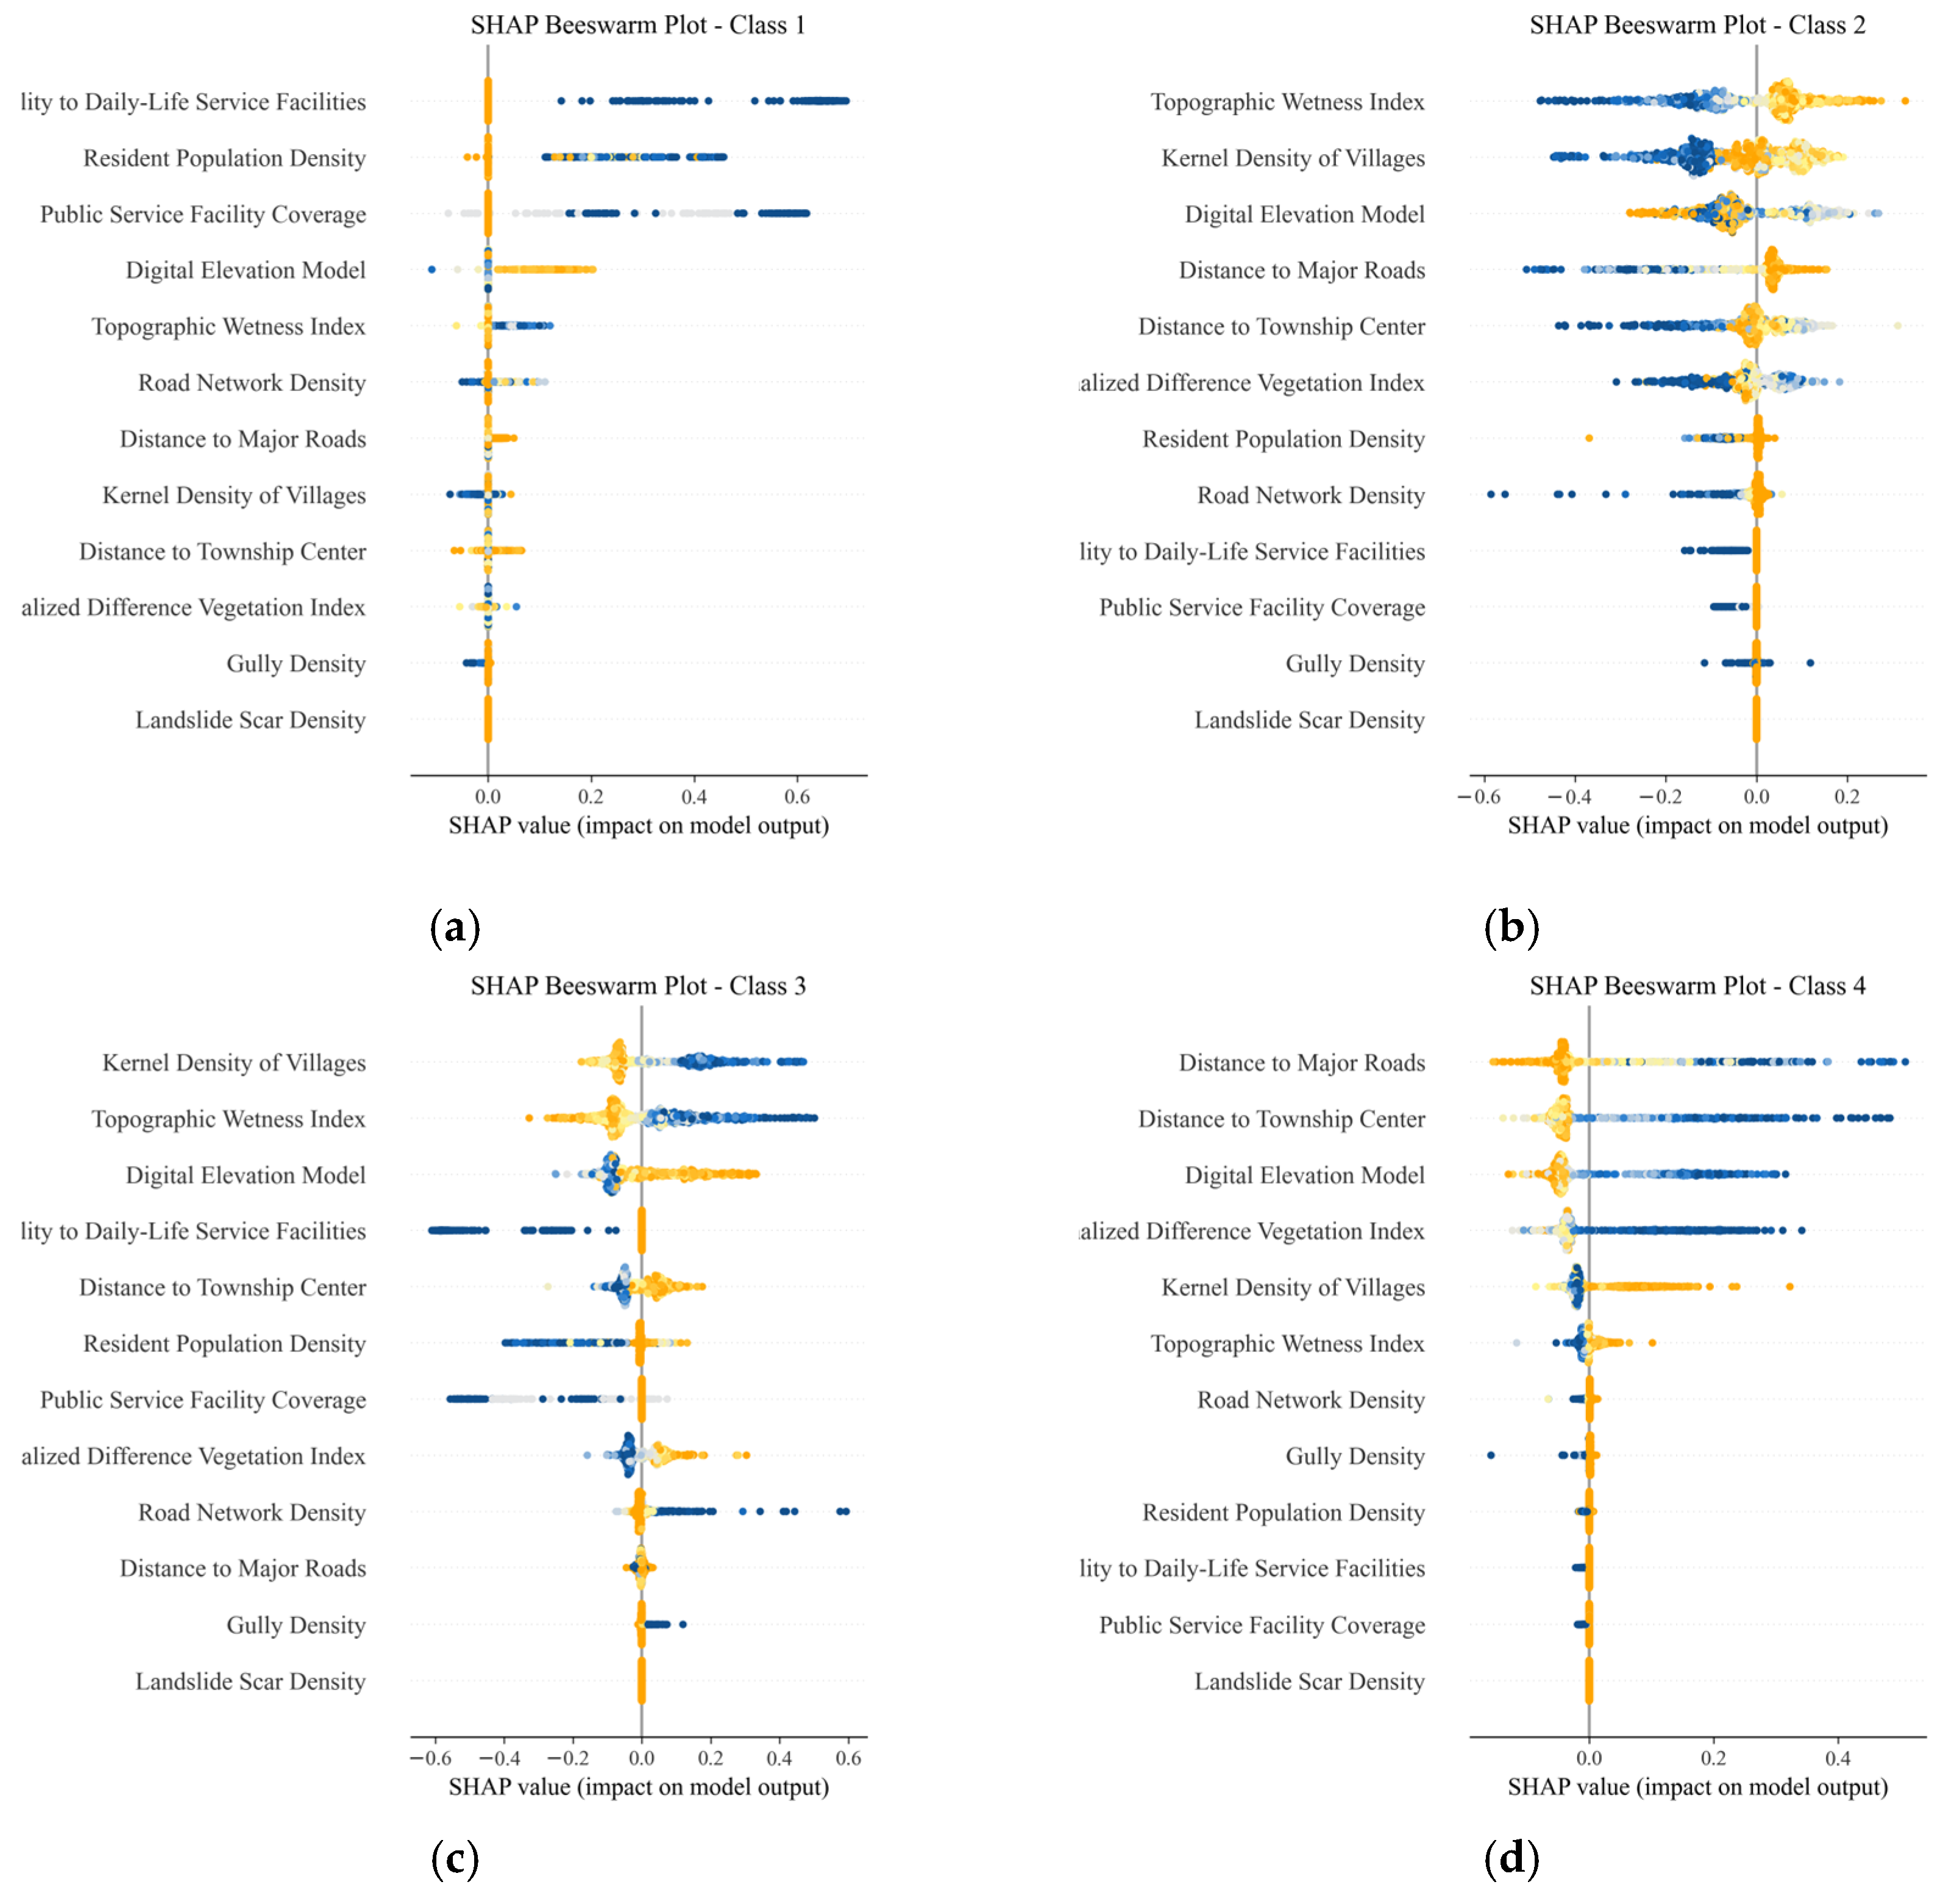
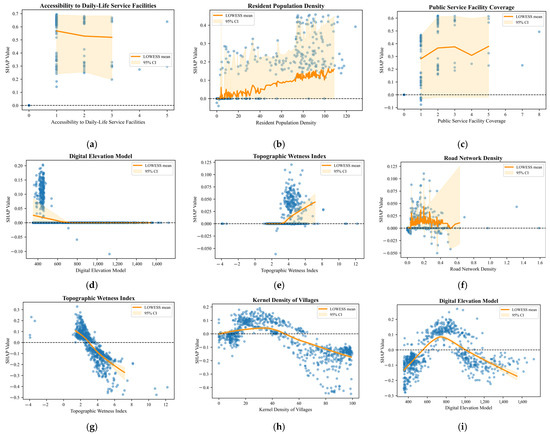
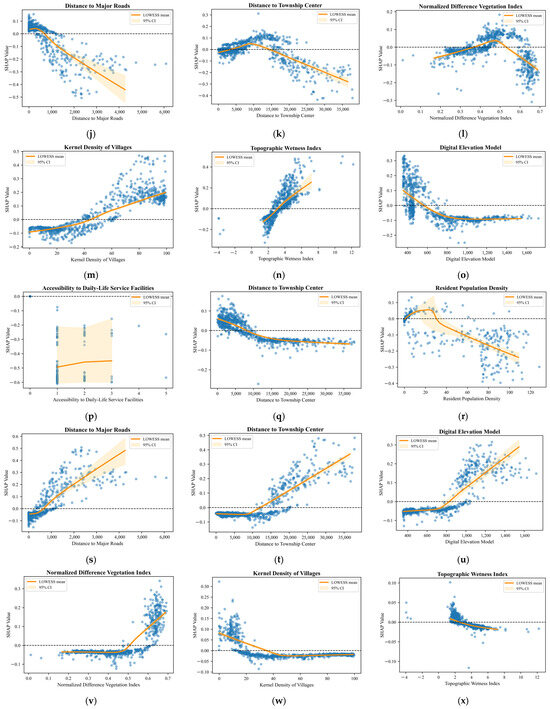
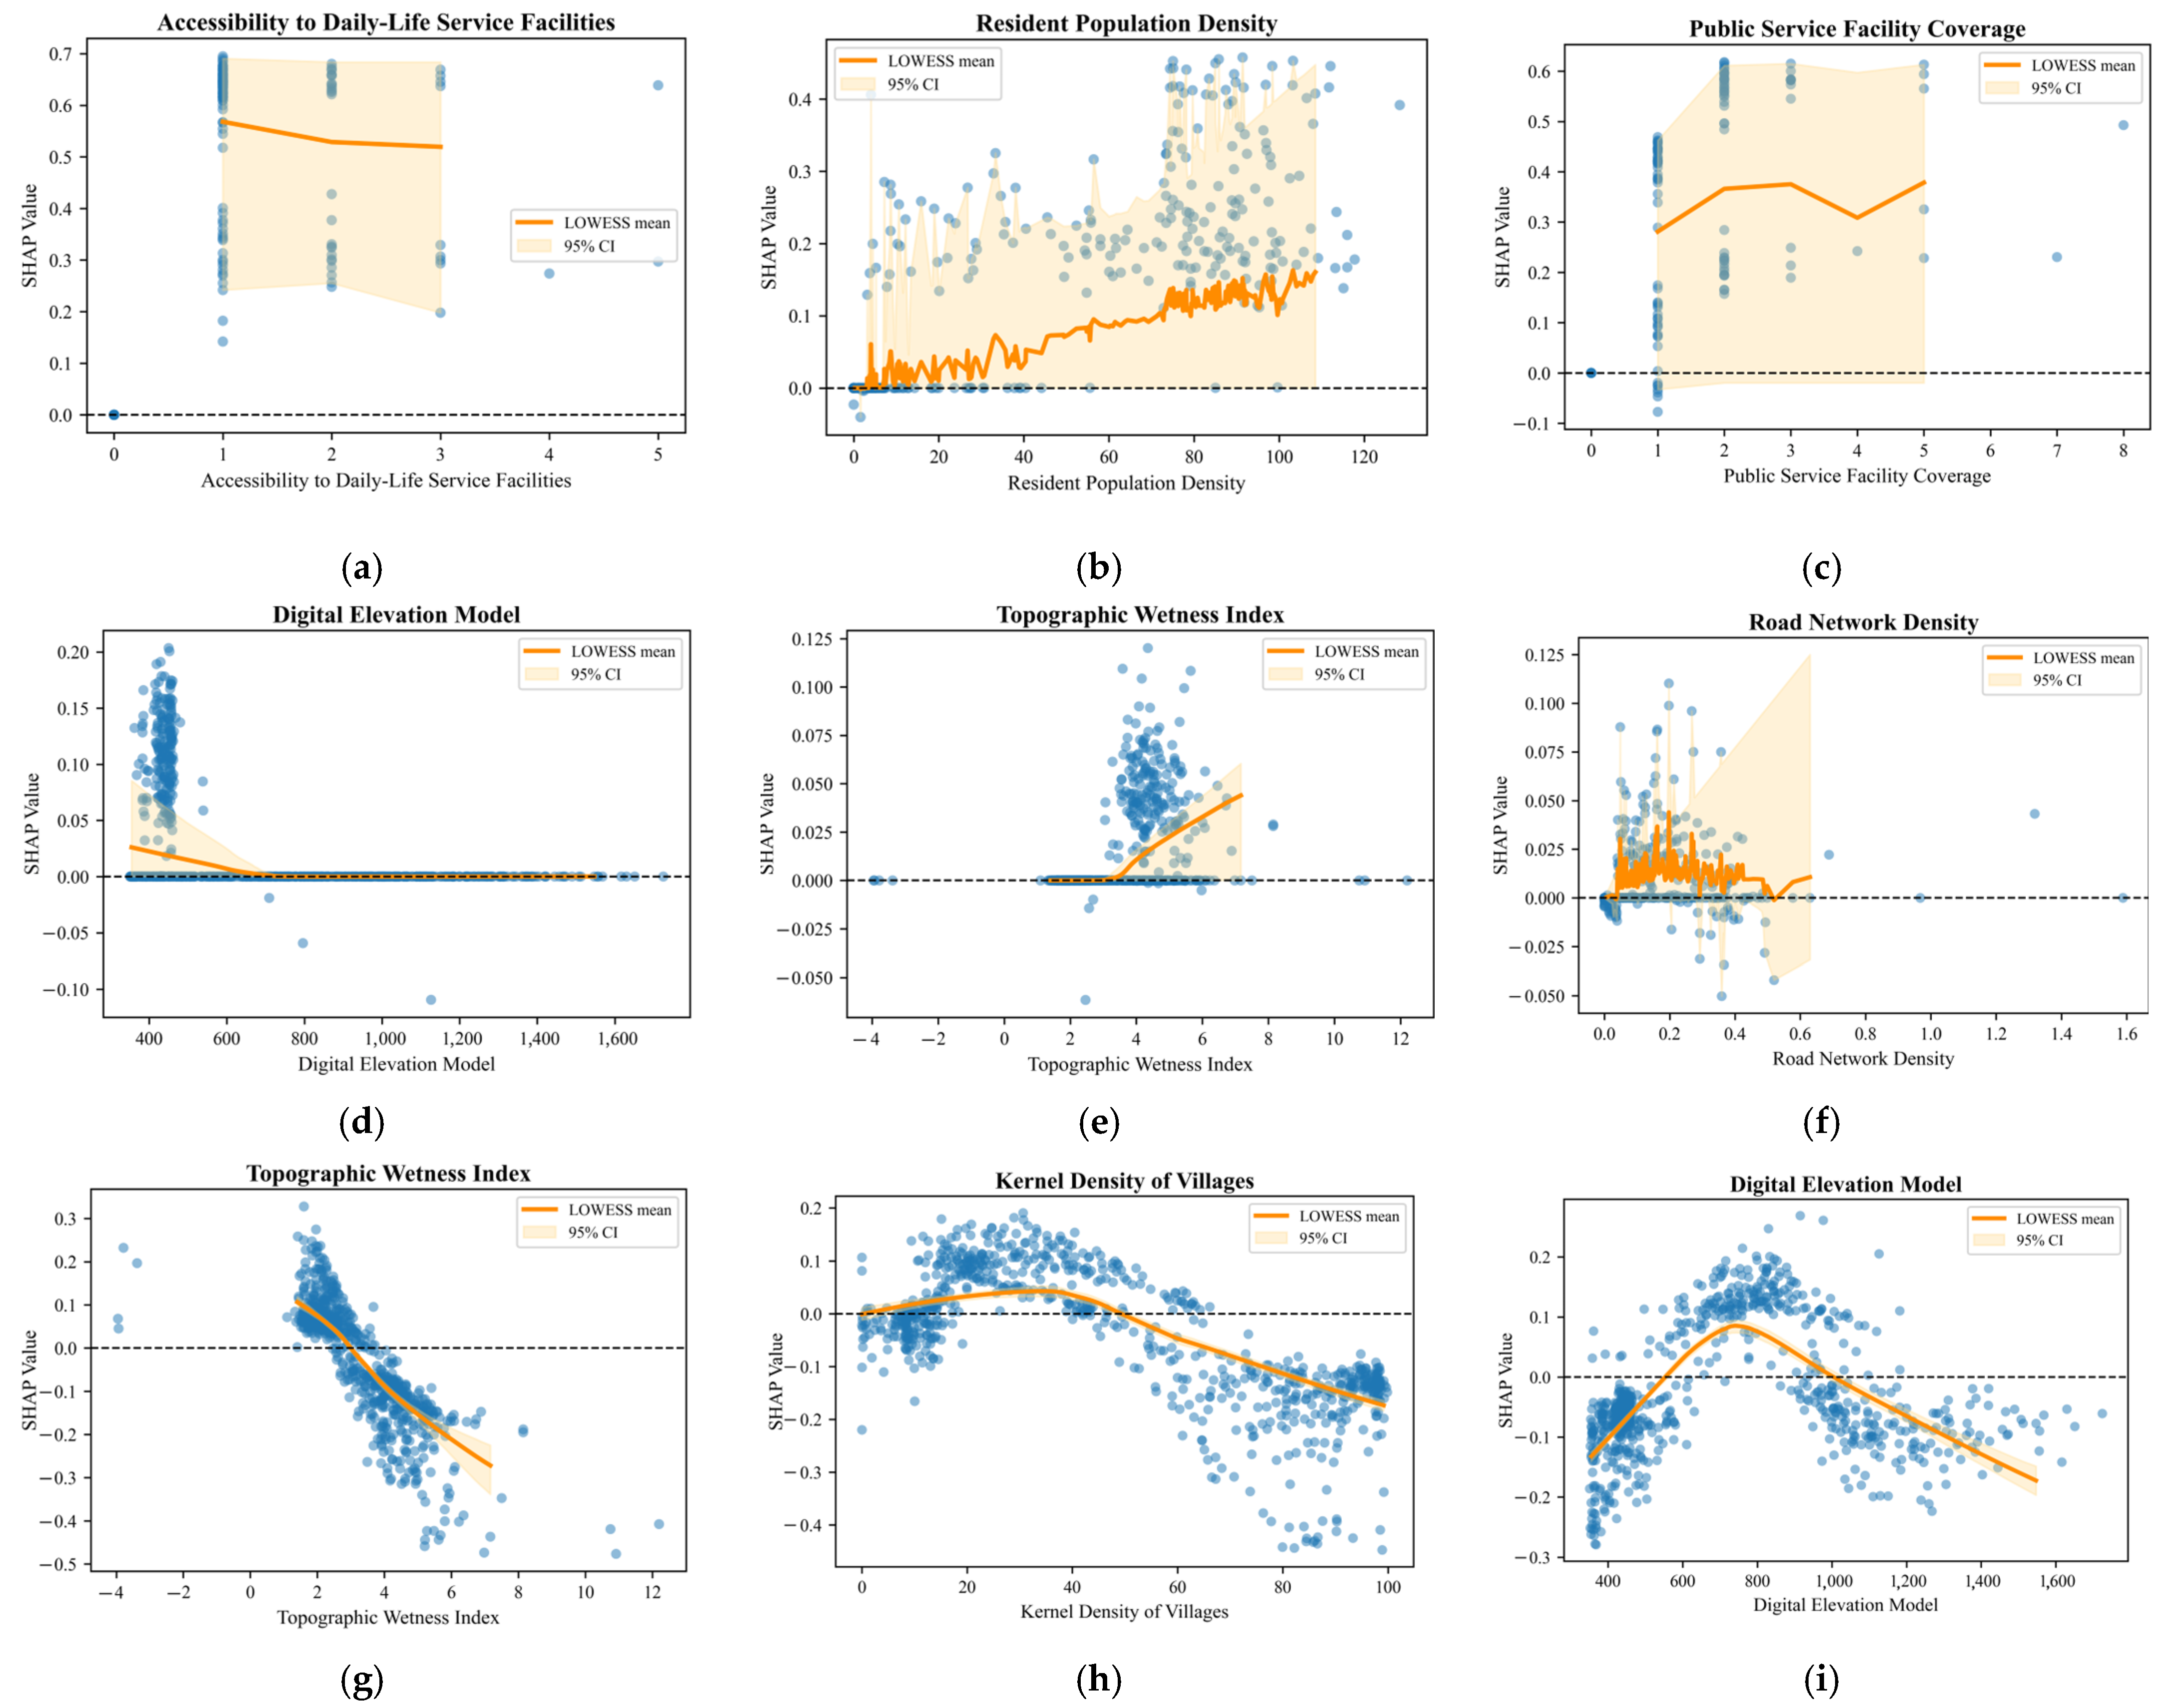
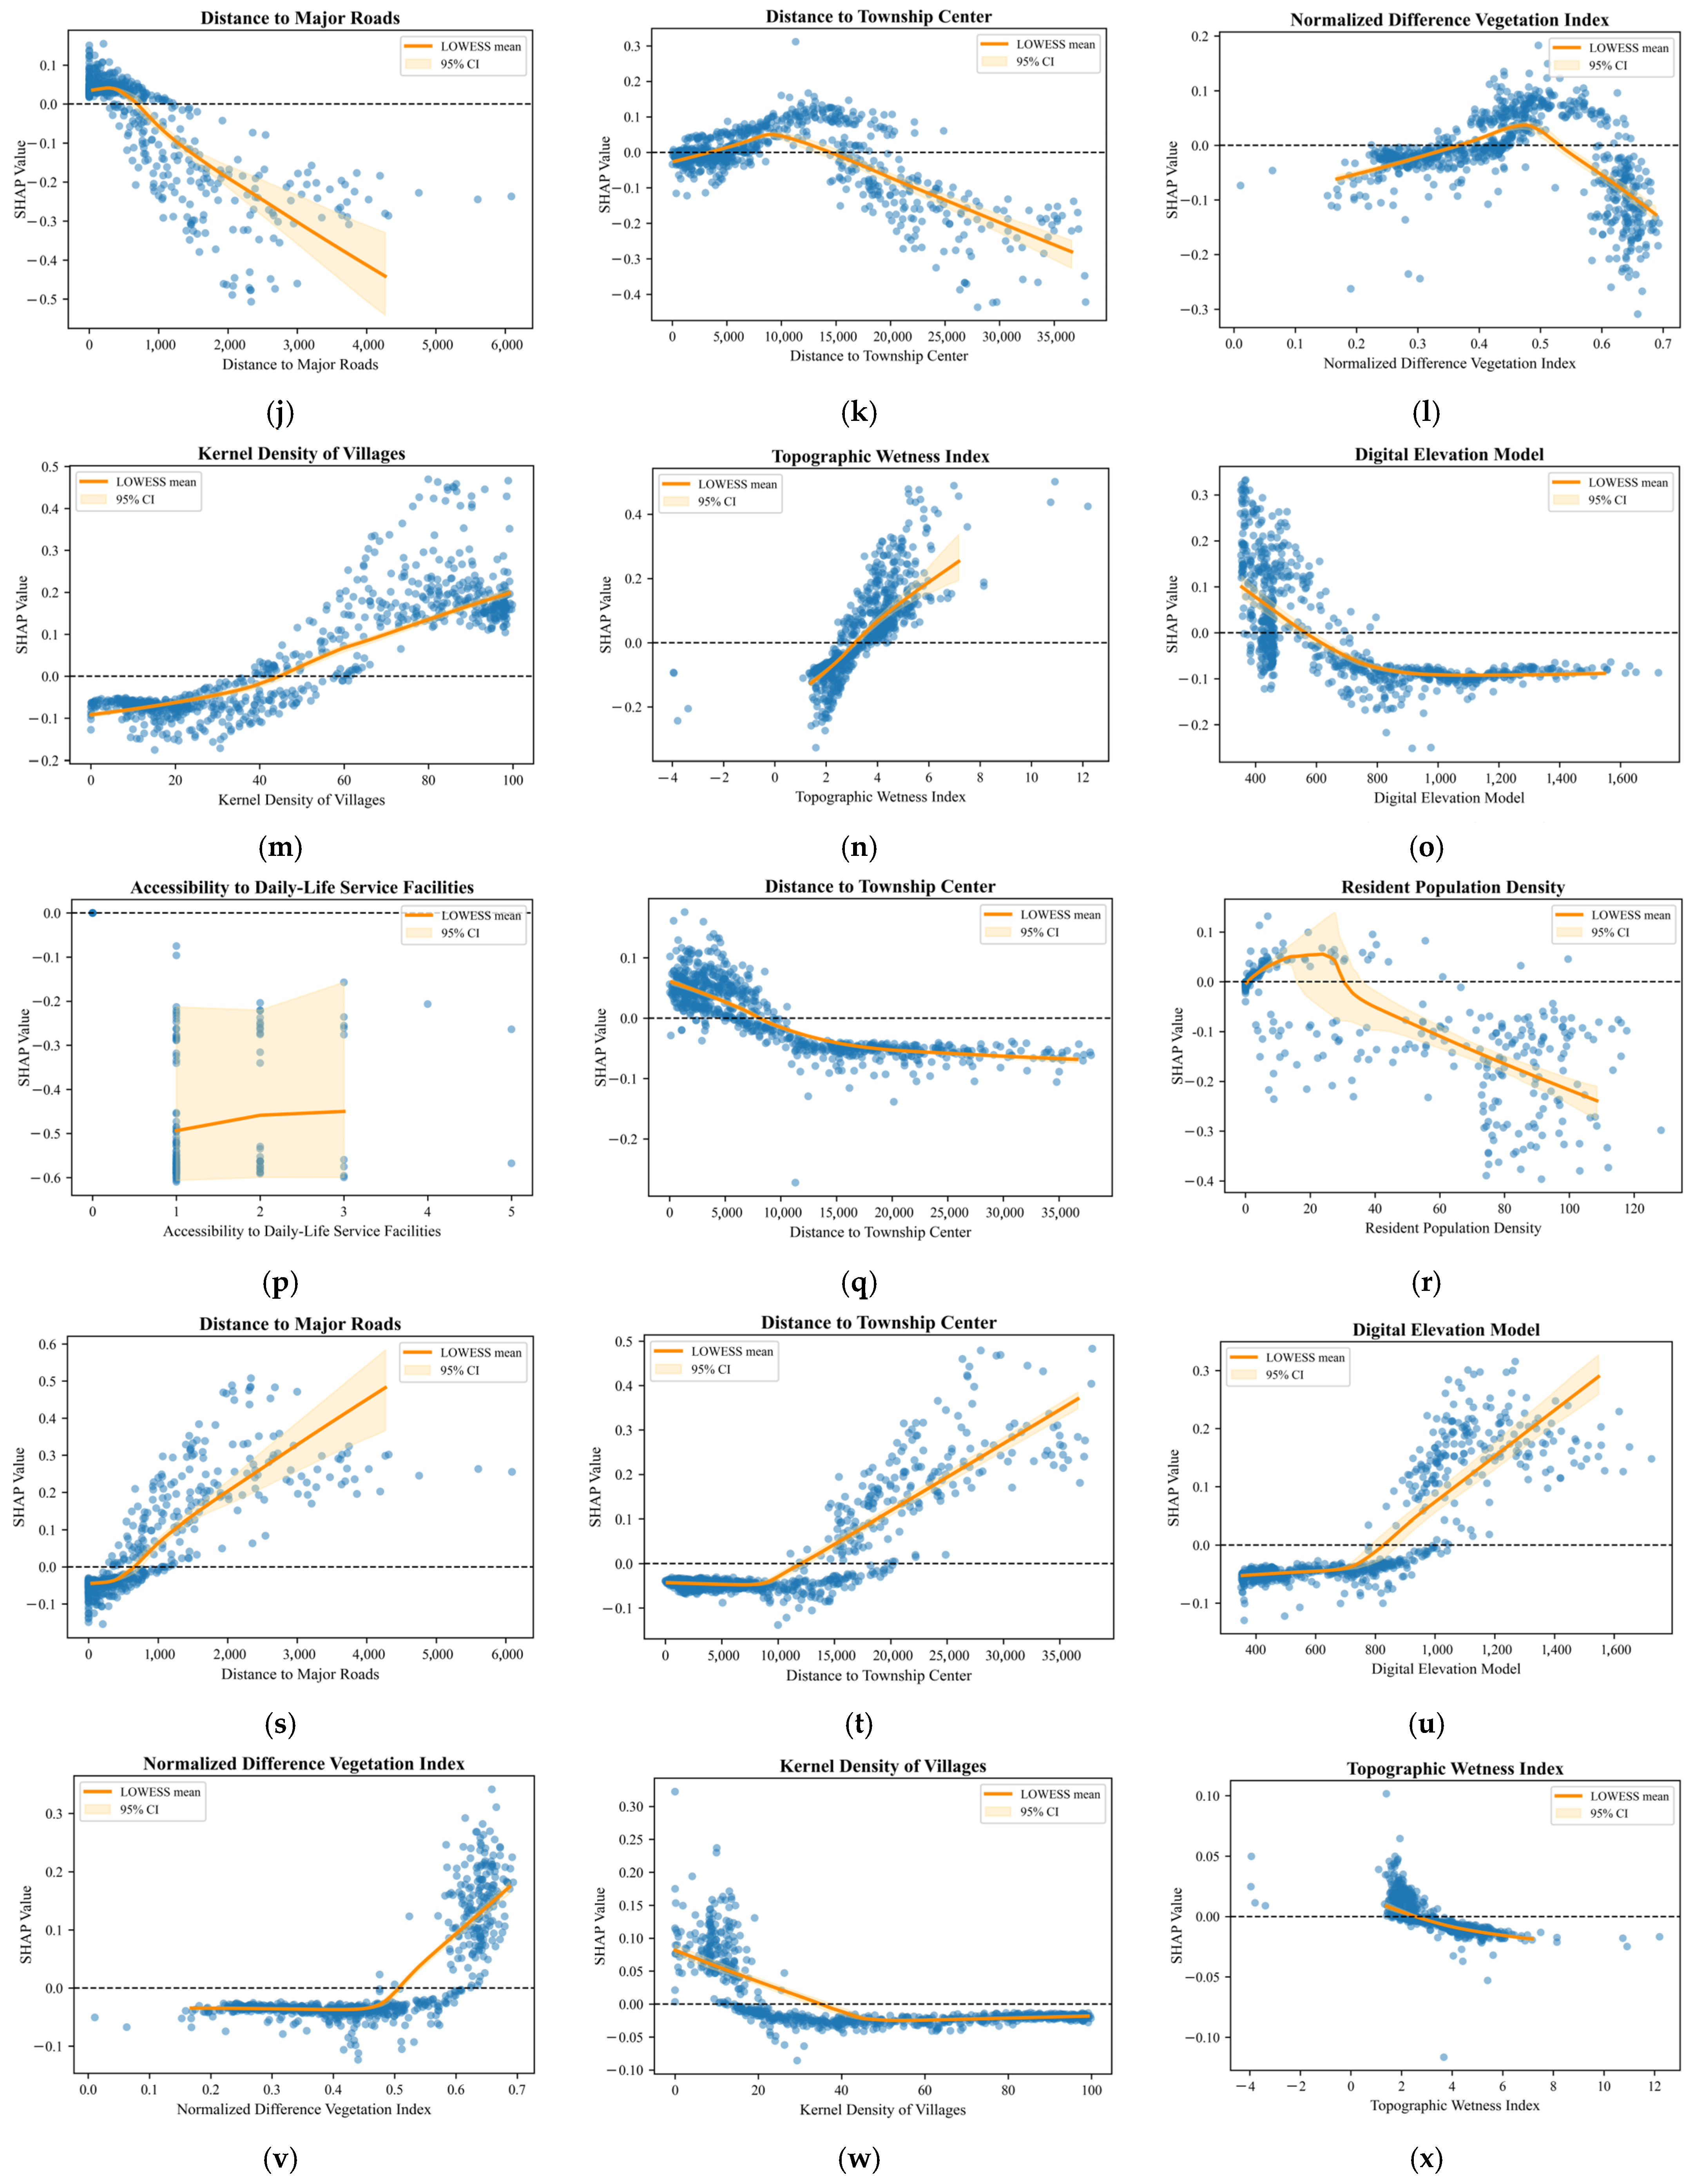

Disclaimer/Publisher’s Note: The statements, opinions and data contained in all publications are solely those of the individual author(s) and contributor(s) and not of MDPI and/or the editor(s). MDPI and/or the editor(s) disclaim responsibility for any injury to people or property resulting from any ideas, methods, instructions or products referred to in the content. |
© 2026 by the authors. Licensee MDPI, Basel, Switzerland. This article is an open access article distributed under the terms and conditions of the Creative Commons Attribution (CC BY) license.