


Abstract
The transition towards sustainable aluminum manufacturing is commonly assessed through recycling rates, energy savings, and resource efficiency, but its distributive effects across global value chains remain insufficiently examined. This study evaluates whether recycled aluminum value chains contribute to both circularity and north–south redistribution, or whether they reproduce unequal patterns of value capture, industrial upgrading, employment quality, and trade dependency. The analysis combines UN Comtrade trade data for HS 7601–7616, OECD ICIO 2025 value added indicators, ILOSTAT labor statistics, and UN SDG data for the 2018–2020 three-year average. Eighty economies are classified into four groups: advanced industrial economies, emerging industrial economies, lower-middle-income economies, and low-income economies. A composite indicator linked to SDGs 8, 9, 10, and 12, with SDG 17 incorporated only as a trade dependency context, is constructed from normalized industrial, circular material flow, distributive, and job-quality variables. The results show a clear north–south hierarchy: advanced economies concentrate a larger share of exports in aluminum manufactures, while low-income economies remain more dependent on scrap flows. Group A captures most chain value added, whereas Groups C and D retain only marginal shares. Labor productivity falls sharply from advanced to low-income economies, while working poverty increases substantially. By contrast, circularity scores vary less strongly across groups, suggesting that participation in circular material flows does not necessarily imply equitable industrial upgrading. This study shows that circularity in recycled aluminum value chains does not automatically generate redistribution and provides a replicable framework for distinguishing material circularity from distributive justice.
1. Introduction
The circular economy has become a central organizing principle of sustainable manufacturing policy worldwide. In aluminum manufacturing, circularity holds a privileged position: it is infinitely recyclable without loss of quality, its recycling requires approximately 95% less energy than primary production, and nearly 75% of all aluminum produced in history remains in circulation [1,2]. Global recycled aluminum production reached approximately 32 million tonnes in 2023, representing about one-third of the total supply, with projections indicating that secondary production will surpass primary production by 2030 [3]. These figures are frequently presented as evidence that the aluminum value chain is moving toward genuine circularity.
However, the distribution of economic benefits derived from this circular transformation has received remarkably scarce academic attention. The vast majority of research on circular economy in metals focuses on environmental life cycle assessment, energy savings, recycling technologies, and material flow analysis [4,5,6]. When the economic dimension is addressed, it is usually framed in terms of aggregate efficiency gains or cost savings, rather than distributive outcomes along the chain [7]. The question of who captures added value, who supplies scrap, who achieves industrial upgrading, and who retains technological capabilities remains largely unexplored.
This gap is particularly significant when examined through north–south relationships. There is growing evidence that circular economy strategies, when implemented without explicit attention to distributive consequences, can reproduce or even deepen existing patterns of asymmetric specialization in global value chains (GVCs) [8,9]. Developing countries that primarily serve as suppliers of raw materials and scrap may see their structural position unchanged or worsened in a circular economy, while industrialized economies capture the higher-value segments of recycling, remanufacturing, and advanced materials production [10,11]. This concern has been articulated in the literature on critical minerals [12] but has not been systematically examined in the context of recycled aluminum.
The Sustainable Development Goals (SDGs) provide an appropriate normative framework to address this gap. SDGs 8, 9, 10, 12, and 17 jointly define a multidimensional space in which both sustainability and equity can be simultaneously evaluated [13,14]. In this framework, SDG 17 is not treated as a directly measured outcome, but as a contextual dimension related to trade dependency, partnership asymmetry, and the means of implementation of circular industrial transitions. However, existing SDG monitoring frameworks rarely link these objectives with specific dynamics of industrial value chains [15,16].
This study addresses this gap by posing the following research question: Do circular strategies in recycled aluminum manufacturing simultaneously contribute to industrial sustainability and the reduction in north–south inequalities, or do they reinforce asymmetric patterns of value capture, employment, and productive specialization? This article makes three specific contributions. First, it characterizes the north–south structure of trade in aluminum scrap, semi-finished products, and manufactures using bilateral data from UN Comtrade. Second, it measures how value added, industrial employment, and trade centrality are distributed using OECD ICIO tables and ILOSTAT data. Third, it constructs a composite indicator linked to SDGs 8, 9, 10, 12, and 17 to identify synergies and trade-offs between circularity and equity.
2. Literature Review
2.1. Circular Economy and Aluminum Manufacturing
The circular economy paradigm has gained substantial traction in academic and political discourse since the early 2010s, driven by the work of the Ellen MacArthur Foundation and its adoption by the European Union as a cornerstone of the European Green Deal [17]. In aluminum manufacturing, circularity is primarily operationalized through recycling [5]. Hagelüken and Goldmann [6] argued that advanced recycling technologies are essential for a resource-efficient society, but significant technological and logistical barriers persist. Eisenreich et al. [7] examined how circular economy principles affect business value chain processes, finding that integration requires systemic changes. The Circularity Gap Report documented that the global circularity rate declined from 9.1% in 2018 to 7.2% in 2023 [18].
The distributive dimension of circularity in recycled aluminum remains insufficiently explored. Zisopoulos et al. [9] provided one of the few analyses explicitly linking inequity with circular economy outcomes in the metal waste trade, suggesting that structural inequities in the global trade network actively impede the path toward circular economies in developing countries.
2.2. Global Value Chains and North–South Inequality
Literature on global value chains has extensively documented that participation in international production networks does not automatically lead to equitable development outcomes [19,20]. Ponte, Bair, and Dallas [21] advanced the research agenda on power and inequality in GVCs, arguing that governance structures systematically favor firms in the Global North. Lang [22] developed a framework linking power dynamics to three dimensions of inequality: within chains, along chains, and across chains.
Roberts and Tran [23] analyzed panel data from 96 countries and found that integration into GVCs increases income inequality in both the Global North and the Global South. Recent research on functional positioning within GVCs has demonstrated that countries specializing in upstream activities systematically capture less value added than those in downstream activities [24,25]. The aluminum value chain exhibits particularly marked north–south asymmetries: developing countries rich in mineral resources frequently remain anchored in the export of raw materials, while higher-value segments are concentrated in industrialized economies [11,12].
2.3. SDGs, Composite Indicators, and Distributive Assessment
The SDG framework provides 231 official indicators [26]. Several authors have noted that these indicators do not always adequately capture structural inequalities within global production systems [15,27], and that progress in environmental objectives (such as SDG 12) can coexist with stagnation in equity objectives (such as SDG 10) [14,28].
Composite indicator methodologies have been widely applied to evaluate SDG performance at the country level. Ricciolini et al. [29] proposed multi-criteria methods based on multiple reference points to evaluate SDG implementation in European countries. Blancas and Contreras [30] developed a global composite SDG indicator that combines compensatory and non-compensatory aggregation rules. Kuc-Czarnecka, Markowicz and Sompolska-Rzechuła [31] applied sensitivity analysis to composite SDG indicators in EU countries. Kynčlová, Upadhyaya, and Nice [16] specifically developed an SDG-9 index focused on industrial objectives. However, none of these frameworks have been applied to evaluate the circularity–equity nexus in a specific industrial value chain.
2.4. Synthesis and Research Gap
The literature reveals three distinct bodies of work—on circular economy in metals, on inequality in GVCs, and on composite SDG indicators—that have largely evolved in isolation. This study integrates these three perspectives: (a) applying GVC analysis to the recycled aluminum chain; (b) linking trade and value added patterns with SDG performance; and (c) constructing a composite indicator framework that explicitly evaluates circularity and equity as potentially independent dimensions. The central hypothesis is that material circularity does not automatically imply distributive justice.
The previous review shows that the relevant literature for this study has developed along three relatively separate lines. The first, focused on circular economy and aluminum manufacturing, has detailed the energetic, environmental, and technological benefits of aluminum recycling, but tends to treat circularity as an aggregate system improvement, without disaggregating who captures the economic value generated by that circularity. The second, focused on global value chains (GVCs), has shown that participation in international production networks does not guarantee industrial upgrading or reduction in inequalities, but rarely applies this approach to recycled material chains. The third, focused on SDGs and composite indicators, provides useful tools for comparing national performance, although it normally operates at the country scale and does not directly link SDGs with functional positions within a specific industrial value chain.
The research gap, therefore, consists not only of the absence of studies on recycled aluminum; it consists of the lack of an empirical framework that connects, within a single value chain, three dimensions that are usually evaluated separately: material circularity, value added capture, and distributive outcomes associated with employment and industrial upgrading. This separation is problematic because a chain can improve its circularity indicators related to SDG 12 and, at the same time, maintain or reinforce inequalities related to SDGs 8, 9, 10, and 17. In other words, material circularity should not be automatically assumed to be equivalent to a just industrial transition.
From this gap, the study formulates the following research question: To what extent do circular strategies in recycled aluminum manufacturing simultaneously contribute to industrial sustainability and the reduction of north–south inequalities, or do they reinforce asymmetric patterns of value capture, employment, and productive specialization? To answer this, the article evaluates three working hypotheses:
H1.
Industrial capacity and value capture: Countries with higher industrial capacity export a higher proportion of semi-finished aluminum products and manufactures, retain a higher share of domestic value added, and depend less on scrap exports.
H2.
Circularity–equity divergence: Differences between country groups are expected to be smaller in material circularity indicators than in value capture, industrial upgrading, and employment quality indicators.
H3.
Circularity without redistribution: Some lower-middle- and low-income countries participate actively in circular scrap flows while capturing limited value added and exhibiting lower-quality employment.
This article’s contribution is threefold. First, it operationalizes the recycled aluminum chain using Harmonized System (HS) trade codes and ISIC/TiVA industrial sectors, allowing for comparison of upstream, midstream, and downstream positions. Second, it links trade, value added, employment, and SDG indicators within a common framework oriented toward simultaneously evaluating circularity and equity. Third, it proposes a replicable procedure to identify whether a circular manufacturing strategy is associated with inclusive industrial upgrading or with the reproduction of north–south asymmetries. This contribution is formulated as an applied assessment of sustainable industrial value chains, rather than an isolated environmental measurement of recycling.
3. Materials and Methods
3.1. Research Design and Analytical Logic
This study uses a quantitative comparative design based on open-access secondary data. The primary unit of analysis is the country-group, which is subsequently aggregated into four country groups to compare structural positions within the recycled aluminum chain. The base period for the analysis is the 2018–2020 three-year average, selected for two reasons: (i) it smooths annual variations in trade and employment; and (ii) it preserves comparability with the trade and employment tables used elsewhere in the paper. The 2025 OECD ICIO edition used for the value added analysis extends to 2022, but the 2021–2022 years are used only as a robustness check. Because the base period includes 2020, the analysis explicitly considers the potential distortion introduced by the COVID-19 shock. The 2018–2020 average is retained as the main period because it preserves full comparability across UN Comtrade, OECD ICIO, ILOSTAT, and SDG indicators, while smoothing annual volatility. To assess whether the pandemic year drives the results, two robustness checks were performed. First, trade and SDG-related indicators were compared with the pre-pandemic period 2016–2019 and, where data availability allowed, with the extended 2021–2024 period. Second, value added indicators were recalculated using the 2021–2022 observations available in the OECD ICIO 2025 edition. These checks did not alter the direction of the main north–south gradients in export composition, value added capture, labor conditions, or composite scores. Therefore, the 2018–2020 period is interpreted as a conservative baseline rather than as a pandemic-specific anomaly. A full extension of the integrated GVC analysis to 2024 was not possible because OECD ICIO value added data are not yet available for that year, and mixing ICIO and non-ICIO sources would undermine methodological consistency.
The empirical strategy is organized into four steps. First, the chain is delimited using HS codes corresponding to scrap, primary/secondary unprocessed aluminum, semi-finished products, and manufactures. Second, countries are classified into four groups based on income, institutional membership, and manufacturing capacity. Third, indicators of trade, value added capture, GVC participation, and industrial employment are calculated. Fourth, selected variables are normalized and aggregated into a composite indicator linked to SDGs 8, 9, 10, 12, and 17. The goal is not to estimate causality, but to identify consistent structural patterns between material circularity, industrial upgrading, and distributive inequality.
Accordingly, the results are interpreted as descriptive associations and structural patterns across country groups, not as causal estimates of the effects of circularity policies on inequality.
3.2. Delimitation of the Chain
The analysis focuses on the recycled aluminum value chain, selected for three reasons: (a) aluminum has one of the highest recycling rates among base metals; (b) the chain is globally integrated, with significant north–south trade in scrap, semi-finished products, and manufactures; and (c) data availability is robust. The chain is delimited using the Harmonized System (HS) classification at the 4-digit level. Three segments are distinguished, namely, scrap (upstream), semi-finished products (midstream), and manufactures (downstream), as detailed in Table 1.
Table 1.
HS codes used to delimit the recycled aluminum chain.
3.3. Classification of Countries
To avoid the reductionism of a binary north–south dichotomy, which masks substantial differences in industrial capacity within each block, countries are classified into four groups based on the World Bank income classification [32], institutional membership and manufacturing capacity indicators.
Group A includes advanced industrial economies with high income and consolidated manufacturing capabilities, such as the EU countries, the USA, Japan, and South Korea. Group B includes emerging industrial economies with upper-middle-income status and significant manufacturing capacity, such as China, India, Brazil, Turkey, and Mexico. Group C includes lower-middle-income economies, including countries in Southeast Asia, North Africa, and Central America. Group D includes low-income economies, particularly Sub-Saharan African countries and the least developed countries. This four-group classification allows the analysis to capture the heterogeneity of industrial positioning within the recycled aluminum chain, distinguishing, for example, between emerging economies with secondary smelting and manufacturing capacity and countries that participate mainly as scrap suppliers. China is retained in Group B because of its industrial capacity and its central role in aluminum processing and manufacturing; however, its 2018 restrictions on solid waste imports represent a major policy shift affecting global scrap flows. For this reason, China is also considered as a specific contextual case in the trade analysis, and sensitivity checks are performed using OECD/non-OECD membership as an alternative classification. The final classification includes 80 economies: 41 in Group A, 21 in Group B, 10 in Group C, and 8 in Group D. The full country assignment is reported in Supplementary Table S1.
3.4. Data Sources
The empirical strategy integrates four open-access data sources, summarized in Table 2. Python 3.13 scripts for downloading and analyzing the open-access datasets are available in the Supplementary Materials.
Table 2.
Data sources, dimensions, and coverage.
3.5. Trade Analysis
The trade analysis seeks to characterize the north–south structure of the chain. From Comtrade data, the following are calculated for each country and block: (a) export composition by chain segment; (b) trade balance by segment; (c) the Herfindahl–Hirschman Index (HHI), calculated as the sum of squared trade-partner shares and normalized on a 0–1 scale, where higher values indicate greater concentration of trade relationships and stronger dependence on a smaller number of partners; and (d) the scrap/manufactures ratio, providing a synthetic measure of asymmetric positioning.
3.6. Global Value Chain Analysis
The GVC analysis uses the 2025 OECD ICIO edition. Following the decomposition framework of Borin and Mancini [38], systematized by Feás [39], gross exports of the non-ferrous metals sector (ISIC 242/243, C24B) and of fabricated metal products (ISIC 25) are decomposed into domestic value added (DVA), foreign value added (FVA), and forward and backward GVC participation. The 2025 edition separates non-ferrous metals from iron and steel, which the 2023 edition did not, allowing a closer approximation to aluminum. Indicators are computed for each country through the global Leontief inverse and aggregated by group. The base period is the 2018–2020 three-year average, for comparability with the rest of the paper. The 2025 edition extends coverage to 2022, used as a robustness check.
An inherent limitation of inter-country input–output data is sectoral aggregation. In the 2023 ICIO edition, all basic metals are combined in ISIC Division 24, so aluminum cannot be isolated. This analysis uses the 2025 ICIO edition, which splits basic metals into iron and steel (C24A) and basic precious and other non-ferrous metals (C24B); aluminum falls within the latter, which Eurostat structural business statistics (NACE 24.42 within 24.4) show to represent, on average, about two thirds of non-ferrous value added in the EU. This Eurostat-based share is used only to justify C24B as a closer sectoral approximation than full ISIC 24; it is not assumed to hold uniformly across all country groups. Non-ferrous metals (C24B) are therefore reported as the base scenario, providing a closer sectoral approximation to aluminum than the full basic-metals sector. Because the non-ferrous aggregate is still wider than aluminum alone, every estimate is reported with a lower and an upper bound spanning (i) the sectoral-aggregation uncertainty, from the non-ferrous estimate (C24B) to the full basic-metals estimate (C24A + C24B), and (ii) the within-group cross-country dispersion (export-weighted interquartile range). Value added in gross exports is decomposed following Borin and Mancini, allocating value added by source country via the global Leontief inverse; value capture is measured as the share of total chain value added retained by each group. Because aluminum cannot be isolated within the non-ferrous sector, each estimate is reported as a bounded range rather than a single point value.
The ICIO SML file used in this study includes 80 individually represented economies plus a Rest of the World (ROW) aggregate. All 80 economies assigned to Groups A–D are individually represented in ICIO. ROW is retained in the global input–output structure but is not treated as a country-level observation and is not included in group averages or country-level figures.
3.7. SDG Composite Indicator Framework
A composite indicator is constructed with four dimensions, each linked to specific SDGs, as detailed in Table 3.
Table 3.
Composite indicator framework: dimensions, SDGs, and variables.
The Gini coefficient of value added distribution measures the inequality in value added capture across countries within each country group. The unit of observation is the country, and the variable used is each country’s domestic value added embodied in gross exports of the non-ferrous metals and fabricated metal products sectors, calculated as the 2018–2020 average. For each group, the Gini coefficient is computed across the countries assigned to that group, excluding the Rest of the World aggregate. A value close to 0 indicates a relatively even distribution of value added among countries in the group, whereas a value close to 1 indicates that value added is concentrated in a small number of countries.
The scrap-share variable is not interpreted as evidence of domestic recycling capacity or domestic value retention. It is used more narrowly as an indicator of participation in global circular material flows because aluminum scrap re-enters the global recycling chain even when it is processed outside the exporting country. This distinction is important: a high scrap export share may indicate active participation in circular material flows while simultaneously reflecting a low-value upstream position. For this reason, the circular dimension is interpreted as circular material flow participation, whereas distributive equity and value capture are evaluated separately.
The HHI of trade-partner concentration is not used as an official SDG 17 indicator. Rather, it is included as a structural trade dependency variable that captures the extent to which a country’s position in the recycled aluminum chain depends on a small number of external partners. This is relevant to the SDG 17-related dimension of means of implementation because highly concentrated trade relationships may reduce bargaining capacity, limit diversification of industrial partnerships, and increase vulnerability within circular value chains. For this reason, the HHI is interpreted as a contextual indicator of asymmetric trade dependency, not as a direct measure of SDG 17 performance.
For each variable, a min–max normalization is applied to the [0, 1] interval, where 1 represents the best performance. For variables where higher values indicate worse results (e.g., Gini coefficient), the direction is reversed. Aggregation within each dimension is performed via arithmetic mean with equal weighting; aggregation between dimensions uses the geometric mean, following OECD/JRC [40] recommendations for composite indicators where total compensation between dimensions is undesirable. In this analysis, the circular material flow participation dimension is computed directly from country-level data (UN Comtrade and the UN SDG database, 2018–2020 average) using two variables: the share of scrap in total aluminum trade and the secondary-to-primary ratio. The first variable captures participation in global scrap flows, while the second provides a closer indication of secondary aluminum transformation relative to primary aluminum. The consumption-inclusive version is retained only as a robustness check, and the interpretation explicitly distinguishes participation in circular material flows from domestic value retention or domestic recycling capacity.
Robustness is checked through: (i) aggregation with arithmetic mean (to evaluate the effect of allowing compensation); (ii) weightings derived from PCA instead of equal weighting; and (iii) the TOPSIS method as an alternative ranking technique [29,30,31].
4. Results
4.1. Trade Structure of the Recycled Aluminum Chain
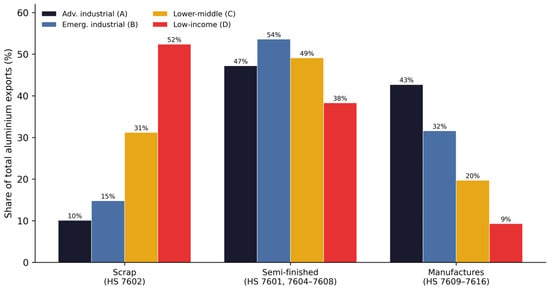
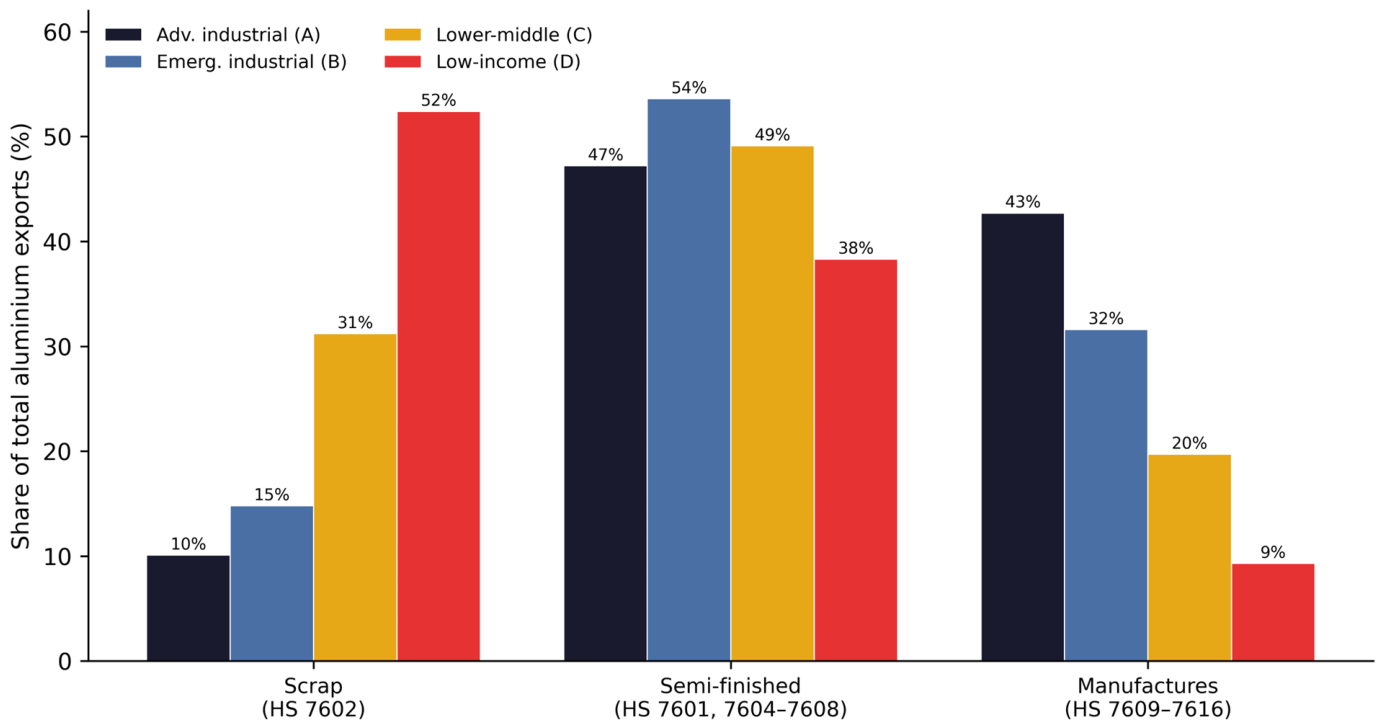
The analysis of bilateral trade flows from UN Comtrade for HS codes 7601–7616, calculated as a three-year average for 2018–2020, reveals a clear north–south asymmetry in the chain structure. Table 4 shows export composition by segment and block, while Figure 1 visualizes these patterns.
Table 4.
Export composition by chain segment and block (2018–2020 average); percentage of total aluminum exports.
Figure 1.
Export composition by chain segment and country group (average 2018–2020).
As observed in Table 4 and Figure 1, export composition shows a gradual pattern across the four groups. Group A economies concentrate a larger share of their aluminum exports in semi-finished products and manufactures, including 42.7% in manufactures, whereas Group D economies show a much higher relative concentration in scrap exports, reaching 52.4%. Group B occupies an intermediate position, with a particularly relevant share of semi-finished products (53.6%), which is consistent with its role as a processing and transformation group. However, its share of manufactures remains lower than that of Group A, suggesting that emerging industrial economies have not fully converged with advanced economies in downstream aluminum manufacturing. This gradation would be largely invisible in a binary north–south classification and constitutes one of the analytical advantages of the four-group categorization.
The intermediate position of Group B should also be interpreted in light of China’s 2018 restrictions on solid waste imports, including metal scrap. Since China is included in Group B because of its large aluminum processing and manufacturing capacity, this regulatory shift is particularly relevant for interpreting the 2018–2020 average. Rather than treating Group B as a homogeneous category, the trade results suggest that China represents a specific case within the group: it combines strong downstream and processing capacity with a policy-driven reconfiguration of scrap inflows. Accordingly, the observed Group B pattern reflects both the industrial upgrading capacity of emerging economies and the effect of national policies that can redirect circular material flows away from traditional waste-importing destinations.
Table 5 reveals that the asymmetry is not simply binary but stepped. Groups A and B are net importers of scrap and net exporters of manufactures, but with very different magnitudes: Group A captures the bulk of the manufacturing surplus. Groups C and D are net exporters of scrap and net importers of manufactures, but Group D presents a proportionally much higher dependence. The normalized HHI of trade-partner concentration increases from Group A (0.12) to Group D (0.38), suggesting that lower industrial capacity is associated with greater dependence on a narrower set of external trade partners. In the composite indicator, this variable is therefore interpreted as a contextual measure of trade dependency asymmetry, rather than as a direct SDG 17 indicator.
Table 5.
Net trade balance by segment and group (2018–2020 average, billions USD).
4.2. Distribution of Value Added in the Chain
The value added analysis uses the 2025 OECD ICIO edition, which, for the first time, separates non-ferrous metals (ISIC 242/243, where aluminum is the dominant component) from iron and steel. Table 6 reports, by group, the share of chain value added captured, the domestic value added (DVA) share of gross exports, and forward and backward GVC participation, each with lower and upper bounds. A methodological clarification is warranted: the DVA share of gross exports, taken in isolation, is mechanically high for economies that export raw or barely processed materials and import few intermediate inputs, and is therefore not a valid measure of value capture. Value capture is instead measured by the share of total chain value added retained by each group. Group averages in the value added analysis are calculated from the 80 individually represented economies classified in Supplementary Table S1. The distribution by group is A = 41, B = 21, C = 10, and D = 8. The ROW aggregate is excluded from group averages and from country-level plots. Because ICIO does not isolate aluminum-specific value added, the non-ferrous metals estimates should be interpreted as a sectoral approximation rather than as direct aluminum-only estimates. This qualification is particularly relevant for Groups C and D, where the composition of the non-ferrous sector may differ from the Eurostat pattern and may include a larger contribution from copper or other non-ferrous metals. For this reason, the results for these groups are interpreted as evidence of non-ferrous metal-related value capture within the recycled aluminum trade framework, rather than as precise aluminum-specific value added estimates. Consequently, the interpretation of value capture in this section is based primarily on the “share of chain value added captured” rows in Table 6, while the DVA share of gross exports is reported only as a domestic content indicator and is not interpreted as evidence of higher value capture.
Table 6.
Distribution of value added in non-ferrous and fabricated metal sectors by country group (2018–2020 average): base estimate and lower/upper bounds.
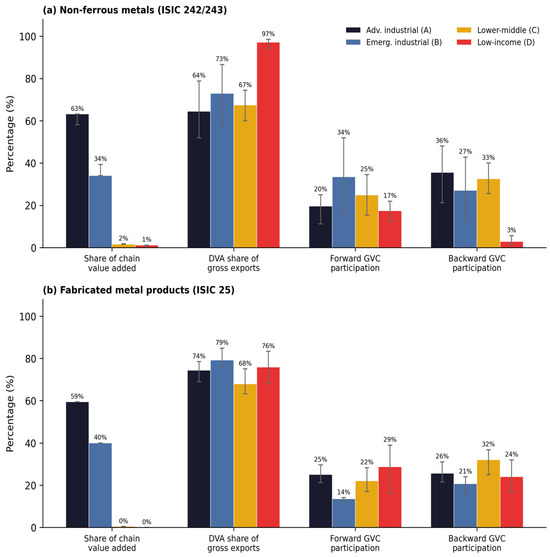
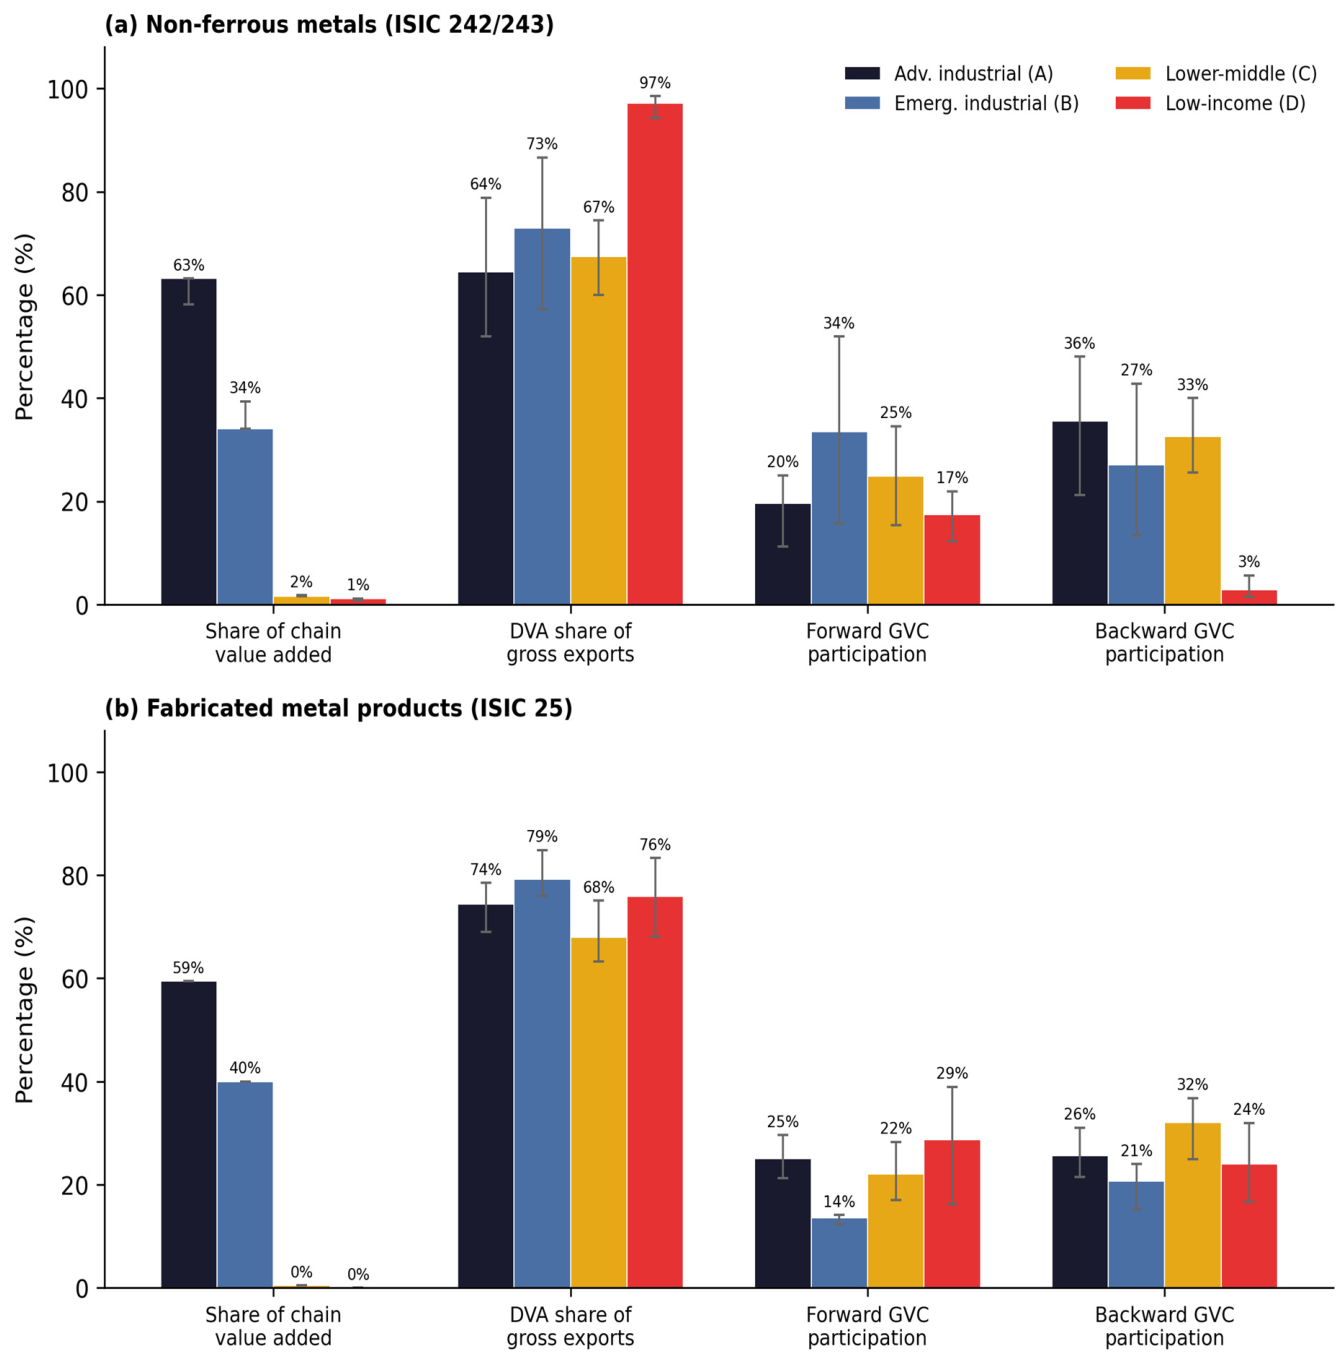
As shown in Table 6 and Figure 2, value capture is highly concentrated, and Group B occupies an intermediate position that is not merely transitional or residual. In non-ferrous metals, Group B captures 34.0% of chain value added, second only to Group A (63.1%) and far above Groups C (1.6%) and D (1.2%); in fabricated metal products, it captures 40.0%, against 59.5% in Group A and below 1% in Groups C and D combined. By contrast, the DVA share of gross exports does not decrease stepwise from north to south: it is highest in Group D (97.1% in non-ferrous metals) precisely because these economies export unprocessed materials with little imported content, which is why value capture is measured by the share of chain value added rather than by the DVA ratio. GVC participation completes this intermediate profile: in non-ferrous metals, Group B records the highest forward participation (33.5%), while its backward participation (27.1%) lies below Group A (35.6%); in fabricated metal products, its GVC linkages are weaker (forward, 13.6%; backward, 20.7%). These results confirm that emerging industrial economies have developed relevant processing and manufacturing capacity and have upgraded beyond the role of scrap supplier, while still capturing less domestic value than advanced economies.
Figure 2.
Chain value added capture, DVA share of gross exports, and GVC participation in non-ferrous and fabricated metal sectors by country group, 2018–2020 average. Whiskers indicate lower and upper bounds.
4.3. Employment and Labor Indicators
ILOSTAT data for employment in metal manufacturing (ISIC Divisions 24–25) reveal substantial differences between the four groups, as shown in Table 7. The four indicators are computed directly from open data for the 2018–2020 average: metal sector employment and value added per worker combine the ILOSTAT employment at the ISIC 2-digit level (divisions 24–25) with the OECD ICIO 2025 value added of the same sectors; vulnerable employment is derived from the ILOSTAT status-in-employment statistics for manufacturing; and working poverty comes from the ILO modeled estimates of employment by economic class.
Table 7.
Selected employment indicators in metal manufacturing by group (2018–2020 average).
Table 7 is computed from ILOSTAT and OECD ICIO 2025 (2018–2020 average; Python 3.13 scripts in the Supplementary Materials). ILOSTAT publishes 2-digit employment for 62 of the 80 sample economies; the gaps affect developing economies (China, Indonesia, Russia, South Africa, Bangladesh and DR Congo, among others) and high-income economies (Canada, New Zealand, Singapore, Taiwan and Hong Kong) alike, and employment shares refer to the covered sample. Status in employment is not published below section level, so vulnerable employment refers to total manufacturing (ISIC section C); group values are unweighted country means. Working poverty is economy-wide; the ILO does not publish economic-class estimates for high-income economies, so Group A is reported as below 1% rather than as a computed value.
The labor indicators reinforce the intermediate position of Group B. Its productivity level, USD 16,600 of value added per worker, is roughly twice that of Groups C (USD 9200) and D (USD 9100), but barely one fifth of Group A (USD 85,500). A similar pattern is observed in employment quality: vulnerable employment in manufacturing in Group B (19.1%) is lower than in Groups C (21.4%) and D (36.2%), but more than three times higher than in Group A (6.0%). Working poverty follows the same gradient, with Group B (7.6%) positioned between the negligible levels of Group A (below 1%) and the much higher levels observed in Groups C (20.5%) and D (44.0%). These results suggest that Group B has achieved partial industrial upgrading, but this upgrading has not yet translated into labor productivity and employment quality comparable to those of advanced industrial economies.
4.4. SDG Composite Indicator Results
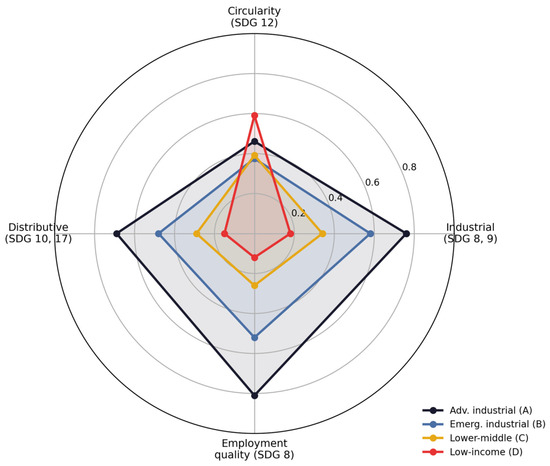
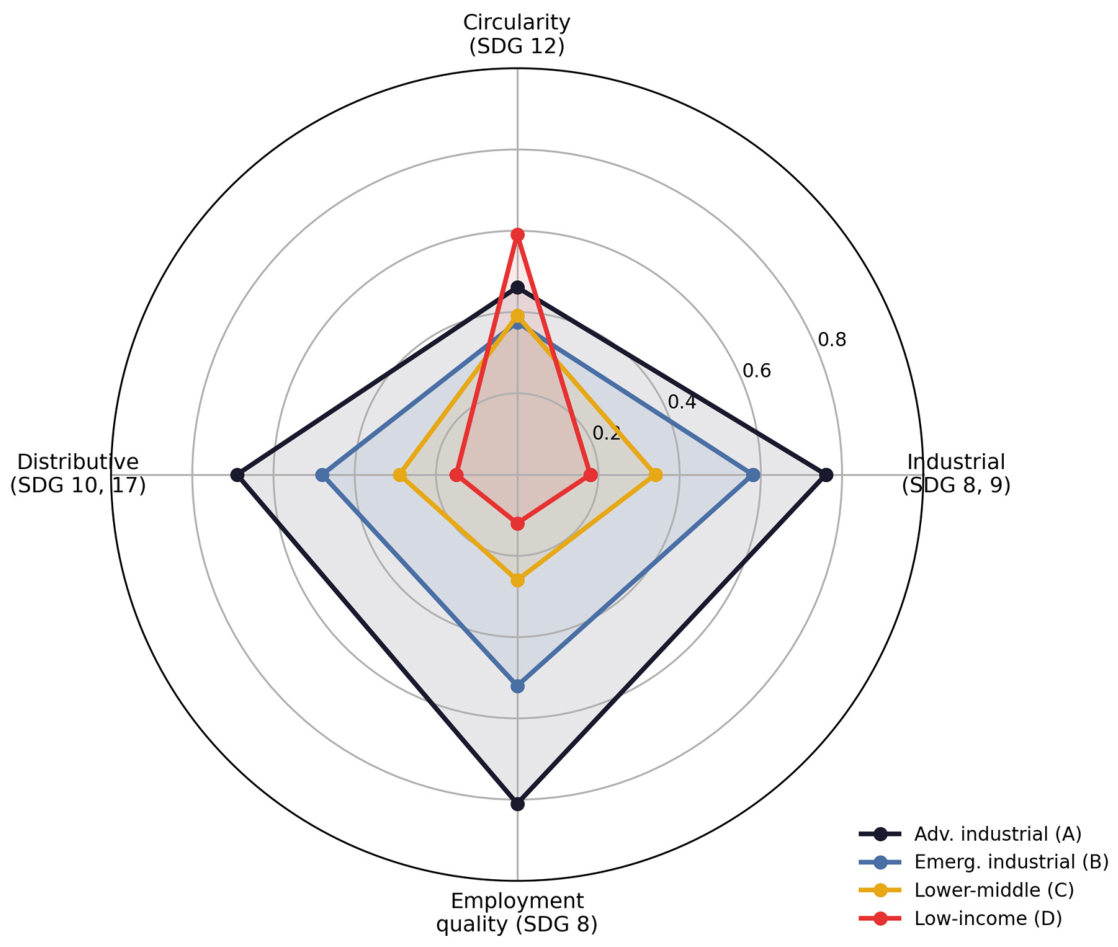
The composite indicator, constructed according to the methodology described in Section 3.6, produces scores for each dimension and a global score for each block. The results are summarized in Table 8 and illustrated in Figure 3.
Table 8.
Composite indicator scores by dimension and group (scale 0–1; 1 = best).
Figure 3.
SDG composite indicator by dimension and country group (0–1 scale). The circularity dimension is recomputed from circular variables (see Section 4.4).
The most revealing finding in Table 8, interpreted through the indicator framework presented in Table 3, is the contrast between the circular material flow participation dimension and the remaining industrial, distributive, and job-quality dimensions. Table 3 distinguishes between a strict circularity indicator, based only on circular variables—the share of scrap in total aluminum trade and the secondary-to-primary ratio—and an extended circularity indicator that also incorporates broader economic criteria, namely, domestic material consumption per unit of GDP and material footprint per capita. This distinction is important because Table 8 shows that circularity behaves very differently from the other dimensions. Under the strict circular material flow participation indicator, scores range from 0.38 in Group B to 0.59 in Group D. This does not mean that Group D has the strongest domestic recycling capacity or the highest level of domestic circular upgrading. Rather, it indicates that low-income economies are strongly embedded in global circular material flows, especially through scrap-related trade. The result therefore supports the article’s central distinction between participation in circular flows and retention of economic value: the countries most involved in scrap flows are not necessarily those capturing the highest value added or achieving stronger industrial upgrading.
The result is even more revealing when the two circularity specifications are compared. In the strict circularity indicator, Group D records the highest score, 0.59 [0.48–0.71], while Group A reaches only 0.46 [0.41–0.51]. This suggests that low-income economies participate intensively in circular material flows, particularly through scrap-related trade. However, when circularity is combined with broader economic criteria, Group A slightly exceeds Group D, with scores of 0.60 and 0.58, respectively, while Groups B and C both stand at 0.49. Therefore, the central finding is not that circularity eliminates structural inequality, but rather that circular material participation is much less unevenly distributed than industrial capacity, value added capture and job quality. This is also reflected in the global geometric mean, where Group A remains clearly ahead at 0.67 and Group D falls to 0.21. In other words, the poorest countries may be strongly embedded in circular aluminum flows while still capturing the least economic and social value from the global value chain.
4.5. Country Profiles
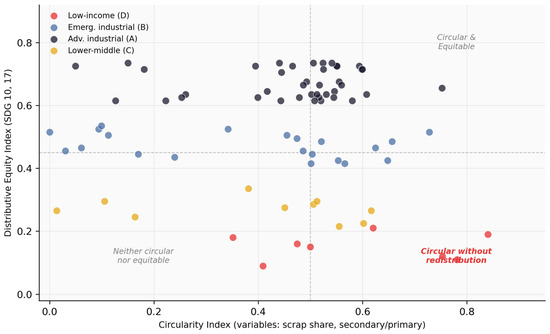
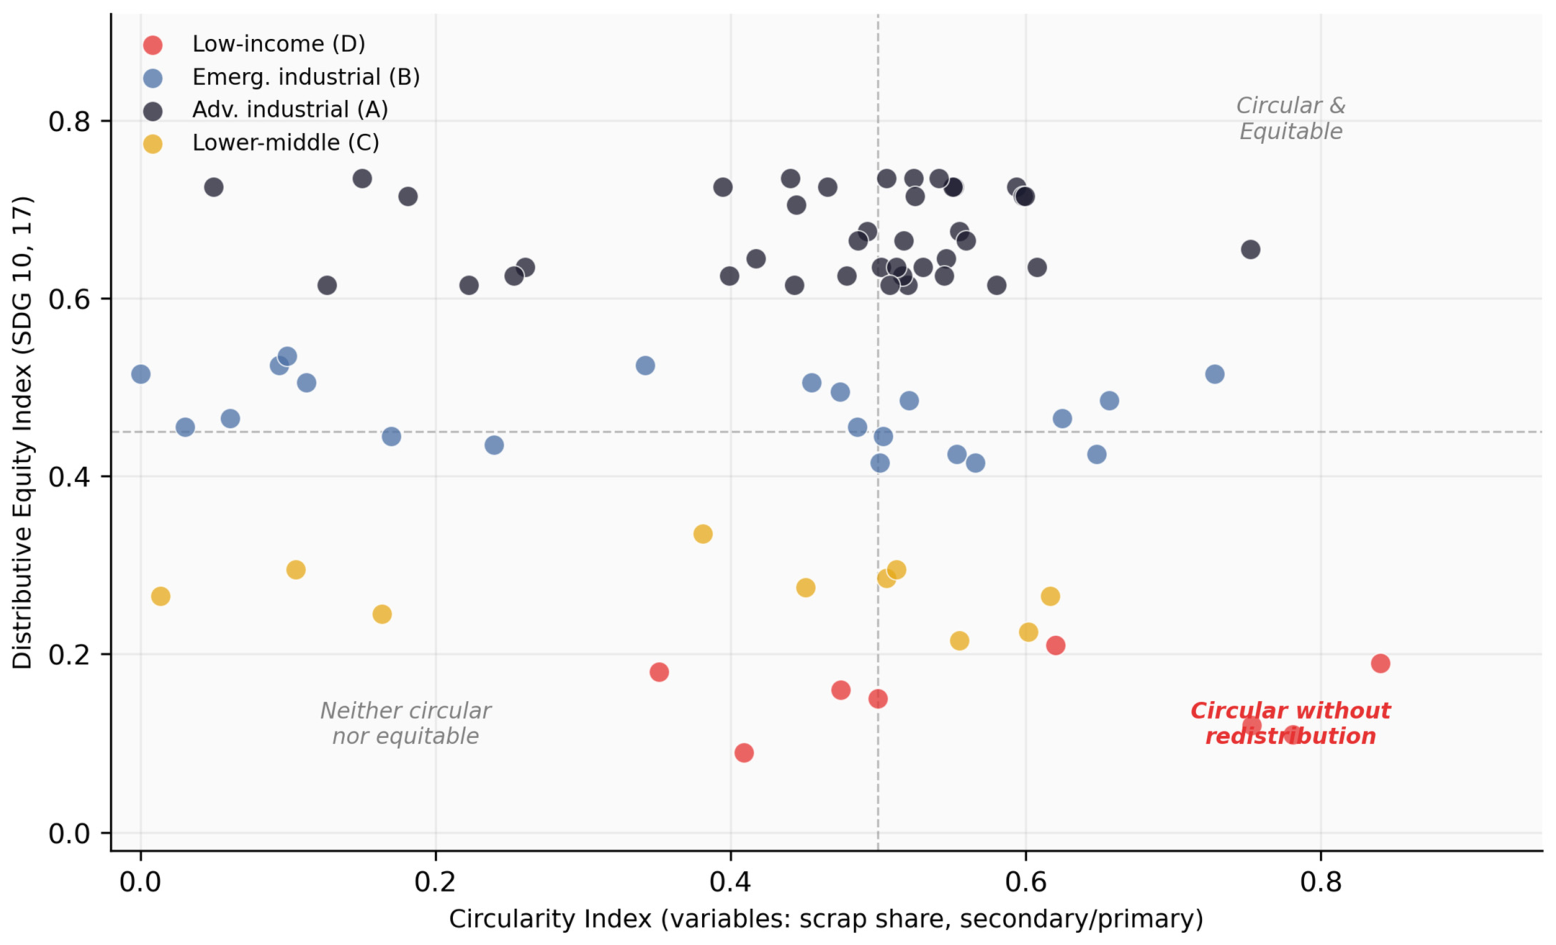
The analysis identifies four country profiles within the chain, which correspond largely to the defined groups. Table 9 summarizes these profiles and Figure 4 positions them in the circularity–equity space.
Table 9.
Country profiles according to chain position and typical group.
Figure 4.
Circular material flow participation index (scrap share and secondary-to-primary ratio) vs. distributive equity index by country and group. Scrap share is interpreted as participation in global circular flows, not as domestic recycling capacity. Only economies in the A–D classification are plotted; ROW is excluded.
Figure 4 positions countries in the two-dimensional circularity–equity space, with the four groups differentiated by color. With circularity now measured by circular variables, Group A economies are equitable but no longer the most circular; many low-income (D) and lower-middle (C) economies populate the lower-right “circularity without redistribution” quadrant, combining high scrap-based circularity with low distributive equity. This quadrant illustrates the central pattern examined in this article: active participation in circular material flows without proportional value capture.
5. Discussion
5.1. Circularity Without Redistribution: Empirical Evidence
The results presented in Section 4 provide descriptive evidence that circularity and distributive equity are partially independent dimensions in the recycled aluminum value chain. The active participation of the Global South in the collection, sorting, and export of scrap contributes to global circular material flows, but this should not be confused with domestic recycling capacity or domestic value retention. However, this participation does not appear to translate into proportional gains in value added, industrial capacity, or employment quality. The observed pattern suggests increasing material circularity without comparable evidence of greater equity. The value added evidence should be read as sectoral evidence from non-ferrous and fabricated metal activities, not as aluminum-only value added, especially for lower-income groups.
This finding aligns with and extends the theoretical arguments of Zisopoulos et al. [9], who identified structural inequities in the global metal waste trade network, and Ponte, Bair, and Dallas [21], who documented how power asymmetries in GVCs generate persistent inequality. Our contribution is to document these patterns empirically in the recycled aluminum chain and provide a quantitative framework—the SDG-linked composite indicator—to measure the gap between circularity and equity.
The finding is also consistent with the “smile curve” documented in GVC research [41], according to which higher value added tends to concentrate in upstream activities such as R&D, design, process engineering, and standard-setting, and in downstream activities such as branding, certification, distribution, and access to final markets, while lower-value processing functions occupy a weaker position. In the recycled aluminum chain, scrap collection and export can be interpreted as a low-value upstream position, whereas advanced secondary smelting, alloy design, quality control, certified recycled content, and high-specification manufactured products are more closely associated with higher-value functions. This pattern is consistent with the interpretation that advanced economies may reinforce asymmetric value structures through their stronger position in technology-intensive recycling stages, environmental and quality standards, product certification systems, logistics networks, and downstream market access. Therefore, the evidence should be read as showing a structural association between functional position and value capture, not as a causal test of the mechanisms through which those asymmetries are maintained.
5.2. Implications for Industrial Policy and Sustainable Manufacturing
For developing countries, the results suggest that participating in circular material flows is a necessary but insufficient condition for industrial upgrading. Scrap collection and export can generate employment and foreign exchange in the short term, but they may not, without complementary industrial capabilities, build the capacities needed for long-term development. UNCTAD [12] has argued that resource-rich developing countries must urgently advance within value chains, and our findings extend this argument to the recycled materials economy.
The position of Group B suggests that differences in industrial upgrading are associated not only with participation in circular aluminum chains, but also with the type of participation achieved. Emerging industrial economies have developed relevant processing and secondary transformation capacity, but their convergence with advanced economies appears to be associated with several structural constraints: lower labor productivity, stronger dependence on imported inputs, weaker control over high-value downstream segments, limited technological ownership in advanced sorting and secondary smelting systems, lower capacity to define product standards, and reduced access to final markets where branding, certification, design, and high-specification aluminum components capture greater margins. In this sense, Group B represents a form of partial upgrading: it has moved beyond scrap supply and basic transformation, but remains below Group A in the functions where the largest shares of value added and employment quality are generated.
For industrialized countries, the results call for a more nuanced interpretation of circular economy regulation. The EU Waste Shipment Regulation [42] should not be read only as a protectionist restriction on secondary raw materials. It also responds to legitimate policy concerns: increasing domestic resource scarcity, the need to retain strategic secondary materials within European production systems, stronger traceability of waste flows, prevention of illegal shipments, and the objective of avoiding the externalization of waste-management burdens to third countries. In this sense, European circularity policies can be interpreted as part of a broader geopolitical shift in which countries increasingly seek to close domestic resource loops and reduce dependence on uncertain external flows. However, these policies may also generate distributive trade-offs if they improve circularity and resource security in advanced economies while limiting access to high-quality secondary raw materials in countries that need them for their own industrial upgrading. Policy coherence between circular economy strategies and development cooperation objectives would therefore benefit from explicit attention to both environmental safeguards and distributive consequences.
From this perspective, the results suggest that circular aluminum strategies should not be evaluated only through domestic recycling rates or material retention indicators. If the higher-value functions of the recycled aluminum chain remain concentrated in the north, circular economy policies may improve domestic resource security while leaving existing value-capture asymmetries largely unchanged. A more equitable circular transition is therefore likely to require complementary mechanisms that facilitate technological upgrading, access to certified recycling technologies, transparent quality standards, industrial partnerships, and investment in secondary processing capacity in lower-income economies. Without these complementary measures, the smile-curve structure of the chain may be reproduced under a circular economy narrative.
China’s 2018 restrictions on solid waste imports are consistent with this interpretation. They illustrate how large industrial economies may seek to avoid operating as global waste sinks and may redirect circular material flows according to domestic environmental, industrial, and resource-security priorities. This shift is especially relevant for the recycled aluminum chain because it alters the geography of scrap availability and processing opportunities. The implication is that circularity cannot be understood only as a technical question of recycling rates; it is also shaped by national strategies regarding resource control, industrial capacity, and the location of environmental burdens [43].
The question of whether developing countries can establish domestic resource loops can be further interpreted through the Environmental Kuznets Curve (EKC) literature [44,45]. In its conventional formulation, the EKC suggests that environmental pressure may initially increase with economic growth and later decline once income, regulation, technology, and institutional capacity reach sufficient levels. Applied to circular aluminum chains, this does not imply that economic growth automatically produces circularity. Rather, it suggests that the ability to close domestic resource loops depends on the stage of development and on complementary capabilities: investment in sorting and collection systems, secondary smelting capacity, environmental enforcement, access to cleaner technologies, technical standards, and stable demand for recycled-content products [45,46]. From this perspective, Groups C and D may participate in global circular flows through scrap collection and export without yet having the industrial and institutional conditions required to retain, process, and upgrade these materials domestically. Therefore, circular economy policies aimed at equity should combine restrictions on harmful waste displacement with support for technological upgrading and domestic loop formation in lower-income economies.
At a multilateral level, these findings point to the relevance of integrating distributive assessments and domestic-loop capacity indicators into circular economy monitoring frameworks. Current monitoring tends to focus on material flow indicators (recycling rates, material footprint) without considering who benefits from the resulting economic activity. The composite indicator framework proposed in this article offers a practical tool for this assessment.
In this sense, circular economy monitoring should evaluate not only whether materials remain in circulation, but also whether countries acquire the technological, regulatory, and industrial capacity to retain value from those materials.
5.3. Comparison with Existing Literature
The findings are consistent with documentation regarding north–south asymmetries in GVC participation [19,21,23,24]. The specific pattern of scrap-for-manufactures exchange reflects dynamics described in other commodity chains [9,12,47]. The partial decoupling between circularity and equity coincides with findings in SDG literature on trade-offs between environmental and social objectives [14,28,31,48].
5.4. Limitations
Several limitations must be acknowledged. First, the OECD ICIO/TiVA data still do not isolate aluminum-specific value added. The 2025 edition separates non-ferrous metals (ISIC 242/243) from iron and steel but not aluminum specifically. Non-ferrous metals are therefore used as an aluminum-dominant sectoral approximation, and all value added estimates are reported as bounded ranges. However, the Eurostat evidence that aluminum accounts for a large share of non-ferrous value added refers mainly to European economies and is not assumed to apply uniformly across all groups. For Groups C and D, the C24B aggregate may include a larger relative contribution from copper or other non-ferrous metals; consequently, their value added results are interpreted as non-ferrous metal-related estimates within the recycled aluminum trade framework, rather than as precise aluminum-only estimates. Second, the circularity dimension relies on trade-based proxies: the secondary-to-primary ratio is approximated by the share of aluminum alloys (HS 760120) in unwrought aluminum exports, and for a few small low-income exporters this ratio rests on very low trade volumes. Material footprint per capita, one of the four variables originally listed, is published by the UN only at regional aggregation and could not be used at country level. In particular, the scrap-share variable captures participation in global circular flows rather than domestic recycling or domestic value retention. Therefore, countries with high scrap export shares may score highly in circular material flow participation while still occupying low-value positions in the chain. Third, group sizes are small and uneven (Group D, n = 8), so group means are reported with bootstrap confidence intervals (Table 10) and should be read as descriptive structural patterns rather than precise point estimates. Fourth, the composite framework involves normative choices (equal weighting) that affect results, although sensitivity analysis demonstrates robustness. Fifth, the analysis is cross-sectional. Future research could improve these estimates with firm-level data and more detailed national supply-use tables.
Table 10.
Within-group dispersion and bootstrap 95% confidence intervals of the circular material flow participation index (country-level data, 2018–2020). CIs overlap across groups, consistent with the narrow circularity gap. The index measures participation in circular material flows, not domestic recycling capacity or domestic value retention.
6. Conclusions
This article has examined whether circular strategies in recycled aluminum manufacturing contribute to a more equitable distribution of value, employment, and development opportunities across north–south supply chains. The evidence presented suggests that they do not do so automatically.
The recycled aluminum chain shows a clear pattern of structural asymmetry: the Global South participates actively in material circularity through the collection and export of scrap, but Groups C and D capture only a marginal share of total chain value added in the ICIO sectors analyzed. As revealed by Table 8 and Figure 3, the circularity dimension is where north–south performance is most similar, while industrial, distributive, and employment quality dimensions show persistent and wide gaps. In summary, the results suggest circularity without proportional improvements in equity.
This finding has three main implications. First, it challenges the implicit assumption in much of the circular economy discourse that environmental sustainability and social equity advance in tandem. Policymakers should not treat circularity metrics as proxies for equitable development outcomes. Second, it provides a replicable framework—based on open-access data from UN Comtrade, OECD ICIO, ILOSTAT, and the UN Global SDG Database—to evaluate the circularity–equity nexus in other industrial value chains (steel, copper, critical minerals). Third, it contributes to growing evidence that GVC participation may need to be accompanied by deliberate industrial policy if circular transitions are to avoid deepening existing north–south inequalities.
Future research should extend this analysis in several directions: longitudinal evaluation of changes in the circularity–equity relationship; firm-level analysis to capture intra-sectoral heterogeneity; and comparative application of the framework to other metal chains. Integrating environmental life cycle indicators with the distributive framework developed here would provide a more complete picture of the sustainability–equity nexus in aluminum manufacturing.
Supplementary Materials
The following supporting information can be downloaded at https://www.mdpi.com/article/10.3390/su18136909/s1: Table S1: Classification of the 80 analyzed economies by group (A–D); Code: Python scripts to download and analyze datasets.
Author Contributions
Conceptualization, J.A.-R. and Ó.M.-L.; methodology, J.A.-R. and Ó.M.-L.; software, Ó.M.-L.; validation, J.A.-R., Ó.M.-L., F.-J.F.-M. and J.B.-F.; formal analysis, J.A.-R. and Ó.M.-L.; investigation, J.A.-R., Ó.M.-L. and E.M.-C.; resources, E.M.-C. and J.B.-F.; data curation, J.A.-R. and E.M.-C.; writing—original draft preparation, J.A.-R. and Ó.M.-L.; writing—review and editing, E.M.-C., F.-J.F.-M. and J.B.-F.; visualization, Ó.M.-L. and J.A.-R.; supervision, F.-J.F.-M. and J.B.-F.; project administration, J.B.-F. All authors have read and agreed to the published version of the manuscript.
Funding
This research received no external funding.
Institutional Review Board Statement
Not applicable.
Informed Consent Statement
Not applicable.
Data Availability Statement
The data presented in this study are available on request from the corresponding author.
Conflicts of Interest
The authors declare no conflicts of interest.
References
- Capuzzi, S.; Timelli, G. Preparation and Melting of Scrap in Aluminum Recycling: A Review. Metals 2018, 8, 249. [Google Scholar] [CrossRef] [Scilit]
- Liu, G.; Müller, D.B. Centennial Evolution of Aluminum In-Use Stocks on Our Aluminized Planet. Environ. Sci. Technol. 2013, 47, 4882–4888. [Google Scholar] [CrossRef] [Scilit] [PubMed]
- Ma, Z.; Calzadilla, A.; Winning, M. Supply-Side Transformation Pathways for Decarbonizing the Global Aluminum Industry. Cell Rep. Sustain. 2026, 3, 100713. [Google Scholar] [CrossRef] [Scilit]
- Paraskevas, D.; Kellens, K.; Dewulf, W.; Duflou, J.R. Environmental Modelling of Aluminium Recycling: A Life Cycle Assessment Tool for Sustainable Metal Management. J. Clean. Prod. 2015, 105, 357–370. [Google Scholar] [CrossRef] [Scilit]
- Kirchherr, J.; Reike, D.; Hekkert, M. Conceptualizing the Circular Economy: An Analysis of 114 Definitions. Resour. Conserv. Recycl. 2017, 127, 221–232. [Google Scholar] [CrossRef] [Scilit]
- Hagelüken, C.; Goldmann, D. Recycling and Circular Economy—Towards a Closed Loop for Metals in Emerging Clean Technologies. Miner. Econ. 2022, 35, 539–562. [Google Scholar] [CrossRef] [Scilit]
- Eisenreich, A.; Füller, J.; Stuchtey, M.; Gimenez-Jimenez, D. Toward a Circular Value Chain: Impact of the Circular Economy on a Company’s Value Chain Processes. J. Clean. Prod. 2022, 378, 134375. [Google Scholar] [CrossRef] [Scilit]
- Barrie, J.; Schröder, P.; Schneider-Petsinger, M.; King, R.; Benton, T. The Role of International Trade in Realizing an Inclusive Circular Economy; Chatham House: London, UK, 2022. [Google Scholar]
- Zisopoulos, F.K.; Fath, B.D.; Toboso-Chavero, S.; Huang, H.; Schraven, D.; Steuer, B.; Stefanakis, A.; Clark, O.G.; Scrieciu, S.; Singh, S.; et al. Inequities Blocking the Path to Circular Economies: A Bio-Inspired Network-Based Approach for Assessing the Sustainability of the Global Trade of Waste Metals. Resour. Conserv. Recycl. 2025, 212, 107958. [Google Scholar] [CrossRef] [Scilit]
- Cimprich, A.; Young, S.B.; Schrijvers, D.; Ku, A.Y.; Hagelüken, C.; Christmann, P.; Eggert, R.; Habib, K.; Hirohata, A.; Hurd, A.J.; et al. The Role of Industrial Actors in the Circular Economy for Critical Raw Materials: A Framework with Case Studies across a Range of Industries. Miner. Econ. 2023, 36, 301–319. [Google Scholar] [CrossRef] [Scilit]
- Nkurunziza, J.D.; Csordas, S.; Domínguez, S.; Freire, C. Commodities and Development Report 2023: Inclusive Diversification and Energy Transition; Commodities and Development Report; United Nations Environment Programme: Geneva, Switzerland, 2023.
- Grynspan, R. How Critical Energy Transition Minerals Can Pave the Way for Shared Prosperity|UN Trade and Development (UNCTAD). Available online: https://unctad.org/news/blog-how-critical-energy-transition-minerals-can-pave-way-shared-prosperity (accessed on 1 April 2026).
- Sachs, J.D.; Lafortune, G.; Fuller, G.; Drumm, E. Implementing the SDG Stimulus: Sustainable Development Report 2023; Dublin University Press: Dublin, Ireland, 2023. [Google Scholar]
- Sachs, J.; Kroll, C.; Lafortune, G.; Fuller, G.; Woelm, F. Sustainable Development Report 2022. From Crisis to Sustainable Development: The SDGs as Roadmap to 2030 and Beyond; Cambridge University Press: Cambridge, UK, 2022. [Google Scholar]
- Biermann, F.; Hickmann, T.; Sénit, C.-A.; Beisheim, M.; Bernstein, S.; Chasek, P.; Grob, L.; Kim, R.E.; Kotzé, L.J.; Nilsson, M.; et al. Scientific Evidence on the Political Impact of the Sustainable Development Goals. Nat. Sustain. 2022, 5, 795–800. [Google Scholar] [CrossRef] [Scilit]
- Kynčlová, P.; Upadhyaya, S.; Nice, T. Composite Index as a Measure on Achieving Sustainable Development Goal 9 (SDG-9) Industry-Related Targets: The SDG-9 Index. Appl. Energy 2020, 265, 114755. [Google Scholar] [CrossRef] [Scilit]
- European Commission. A New Circular Economy Action Plan: For a Cleaner and More Competitive Europe; European Commission: Brussels, Belgium, 2020. [Google Scholar]
- Fraser, M.; Conde, Á.; Haigh, L. Circularity Gap Report 2024; Circle Economy Foundation: Amsterdam, The Netherlands, 2024. [Google Scholar]
- Gereffi, G.; Fernandez-Stark, K. Global Value Chain Analysis: A Primer, 2nd ed.; Duke University Center on Globalization, Governance & Competitiveness: Durham, NC, USA, 2016. [Google Scholar]
- Milberg, W.; Winkler, D. Outsourcing Economics; Cambridge University Press: Cambridge, UK, 2013. [Google Scholar]
- Ponte, S.; Bair, J.; Dallas, M. Power and Inequality in Global Value Chains: Advancing the Research Agenda. Glob. Netw. 2023, 23, 679–686. [Google Scholar] [CrossRef] [Scilit]
- Lang, J.; Ponte, S.; Vilakazi, T. Linking Power and Inequality in Global Value Chains. Glob. Netw. 2023, 23, 755–771. [Google Scholar] [CrossRef] [Scilit]
- Roberts, A.; Tran, T.B. The Globalization of Production, National Labour Regulations and Income Inequality in the Global North and South, 1980–2013. Glob. Netw. 2023, 23, 687–714. [Google Scholar] [CrossRef] [Scilit]
- Carpa, N.; Martínez-Zarzoso, I. The Impact of Global Value Chain Participation on Income Inequality. Int. Econ. 2022, 169, 269–290. [Google Scholar] [CrossRef] [Scilit]
- Pandian, R.K. Globalization of Production, Manufacturing Employment, and Income Inequality in Developing Nations. Soc. Sci. Res. 2024, 118, 102975. [Google Scholar] [CrossRef] [Scilit] [PubMed]
- United Nations. Global Indicator Framework for the Sustainable Development Goals and Targets of the 2030 Agenda; United Nations: New York, NY, USA, 2017.
- Kostetckaia, M.; Hametner, M. How Sustainable Development Goals Interlinkages Influence European Union Countries’ Progress towards the 2030 Agenda. Sustain. Dev. 2022, 30, 916–926. [Google Scholar] [CrossRef] [Scilit]
- Pradhan, P.; Costa, L.; Rybski, D.; Lucht, W.; Kropp, J.P. A Systematic Study of Sustainable Development Goal (SDG) Interactions. Earths Future 2017, 5, 1169–1179. [Google Scholar] [CrossRef] [Scilit]
- Ricciolini, E.; Rocchi, L.; Cardinali, M.; Paolotti, L.; Ruiz, F.; Cabello, J.M.; Boggia, A. Assessing Progress Towards SDGs Implementation Using Multiple Reference Point Based Multicriteria Methods: The Case Study of the European Countries. Soc. Indic. Res. 2022, 162, 1233–1260. [Google Scholar] [CrossRef] [Scilit] [PubMed]
- Blancas, F.J.; Contreras, I. Global SDG Composite Indicator: A New Methodological Proposal That Combines Compensatory and Non-compensatory Aggregations. Sustain. Dev. 2025, 33, 158–176. [Google Scholar] [CrossRef] [Scilit]
- Kuc-Czarnecka, M.; Markowicz, I.; Sompolska-Rzechuła, A. SDGs Implementation, Their Synergies, and Trade-Offs in EU Countries—Sensitivity Analysis-Based Approach. Ecol. Indic. 2023, 146, 109888. [Google Scholar] [CrossRef] [Scilit]
- World Bank Country and Lending Groups—World Bank Data Help Desk. Available online: https://datahelpdesk.worldbank.org/knowledgebase/articles/906519-world-bank-country-and-lending-groups (accessed on 1 April 2026).
- United Nations Statistics Division. UN Comtrade Database. Available online: https://comtrade.un.org (accessed on 1 April 2026).
- OECD. Guide to OECD Trade in Value Added (TiVA) Indicators, 2025 ed.; OECD: Paris, France, 2025. [Google Scholar]
- OECD. Inter-Country Input-Output Tables. Available online: https://www.oecd.org/en/data/datasets/inter-country-input-output-tables.html (accessed on 1 April 2026).
- International Labour Organization. ILOSTAT Database. Available online: https://ilostat.ilo.org/data/?cat_mode=subject (accessed on 1 April 2026).
- United Nations Statistics Division. SDG Global Database. Available online: https://unstats.un.org/sdgs/dataportal (accessed on 1 April 2026).
- Borin, A.; Mancini, M. Measuring What Matters in Value-Added Trade. Econ. Syst. Res. 2023, 35, 586–613. [Google Scholar] [CrossRef] [Scilit]
- Feás, E. Decomposition of Value Added in Gross Exports: A Critical Review. Appl. Econ. Anal. 2023, 31, 182–198. [Google Scholar] [CrossRef] [Scilit]
- OECD/JRC. Handbook on Constructing Composite Indicators: Methodology and User Guide; OECD: Paris, France, 2008. [Google Scholar]
- Mudambi, R. Location, Control and Innovation in Knowledge-Intensive Industries. J. Econ. Geogr. 2008, 8, 699–725. [Google Scholar] [CrossRef] [Scilit]
- European Parliament and Council. Regulation (EU) 2024/1157 of the European Parliament and of the Council of 11 April 2024 on Shipments of Waste, Amending Regulations (EU) No. 1257/2013 and (EU) 2020/1056 and Repealing Regulation (EC) No. 1013/2006. Available online: https://eur-lex.europa.eu/eli/reg/2024/1157/oj/eng (accessed on 1 April 2026).
- Ryter, J.; Fu, X.; Bhuwalka, K.; Roth, R.; Olivetti, E.A. Emission Impacts of China’s Solid Waste Import Ban and COVID-19 in the Copper Supply Chain. Nat. Commun. 2021, 12, 3753. [Google Scholar] [CrossRef] [Scilit] [PubMed]
- Grossman, G.M.; Krueger, A.B. Economic Growth and the Environment. Q. J. Econ. 1995, 110, 353–377. [Google Scholar] [CrossRef] [Scilit]
- Stern, D.I. The Rise and Fall of the Environmental Kuznets Curve. World Dev. 2004, 32, 1419–1439. [Google Scholar] [CrossRef] [Scilit]
- Kasioumi, M.; Stengos, T. The Environmental Kuznets Curve with Recycling: A Partially Linear Semiparametric Approach. J. Risk Financ. Manag. 2020, 13, 274. [Google Scholar] [CrossRef] [Scilit]
- Wiedmann, T.; Lenzen, M. Environmental and Social Footprints of International Trade. Nat. Geosci. 2018, 11, 314–321. [Google Scholar] [CrossRef] [Scilit]
- Prell, C.; Feng, K.; Sun, L.; Geores, M.; Hubacek, K. The Economic Gains and Environmental Losses of US Consumption: A World-Systems and Input-Output Approach. Soc. Forces 2014, 93, 405–428. [Google Scholar] [CrossRef] [Scilit]

Disclaimer/Publisher’s Note: The statements, opinions and data contained in all publications are solely those of the individual author(s) and contributor(s) and not of MDPI and/or the editor(s). MDPI and/or the editor(s) disclaim responsibility for any injury to people or property resulting from any ideas, methods, instructions or products referred to in the content. |
© 2026 by the authors. Licensee MDPI, Basel, Switzerland. This article is an open access article distributed under the terms and conditions of the Creative Commons Attribution (CC BY) license.