


Abstract
Flood risk is increasingly shaped by the combined effects of climate change and the vulnerability of built environments, while building-level flood damage severity analysis is often constrained by limited data availability. This study develops a transparent and reproducible framework for analyzing building-level flood damage severity under climate-adjusted hazard conditions in data-constrained environments. The framework integrates administrative post-event damage records, GIS-based terrain information, a terrain-based proxy flood-depth reconstruction procedure, and a standardized Rhine Atlas/ICPR depth–damage relationship. Representative terrain-based proxy flood depths are reconstructed using building locations, terrain elevation, and settlement-level exposure assumptions. Observed damage categories are not used to assign proxy flood depths directly, but serve exclusively as empirical ordinal reference information for ordinal consistency assessment of model-derived damage severity. Climate effects are incorporated through a simplified hazard adjustment based on projected changes in extreme precipitation intensity. The framework is applied to 413 residential buildings affected by flood events in Serbia during the period 2016–2021. Results show a consistent nonlinear relationship between terrain-based proxy flood depth and ICPR-derived structural damage severity, as well as a strong influence of terrain elevation on relative hazard intensity. Climate-adjusted sensitivity scenarios indicate that even moderate increases in extreme precipitation lead to measurable increases in structural damage severity and an upward shift in model-derived damage levels. The proposed framework provides a practical approach for flood damage severity analysis in data-constrained environments, supporting improved decision-making in sustainable flood risk management and climate adaptation planning.
1. Introduction
Flood risk is increasingly recognized not only as a hazard-driven problem, but as a complex interaction between changing climate conditions and the vulnerability of built environments. In this context, understanding how flood hazard intensification translates into structural damage at the building level represents a critical challenge for sustainable urban risk management. Despite significant advances in flood modelling, the relationship between climate-driven hazard changes and the redistribution of damage severity across individual buildings remains insufficiently explored.
Climate change significantly affects the intensity, frequency, and variability of extreme precipitation, thereby increasing the risk of flood-related hazards, including pluvial, fluvial, and flash floods. Recent studies emphasize the role of climate-driven increases in heavy rainfall as an important trigger of flood occurrence [1]. According to the Intergovernmental Panel on Climate Change, warming of the climate system intensifies the hydrological cycle, contributing to increases in the frequency and intensity of extreme precipitation events [2,3]. The physical basis of this process is commonly explained through the Clausius–Clapeyron relationship, according to which atmospheric water vapor increases by approximately 7% per degree Celsius of warming, thereby contributing to more intense precipitation and the amplification of extreme rainfall events [4,5]. Recent studies further indicate that even low-probability precipitation events are becoming more frequent and more intense under changing climate conditions [6,7].
In addition to increasing intensity, climate change also alters the temporal and spatial variability of precipitation patterns, including changes in precipitation distribution and scaling behavior. These changes introduce additional uncertainty into the estimation and interpretation of precipitation scaling relationships, which may further complicate climate-related hazard assessment [8]. Empirical evidence further demonstrates that climate change can intensify extreme precipitation and increase variability across different regional settings [4,6,7]. When combined with ongoing urbanization processes, these climatic changes further exacerbate flood risk. Currently, more than half of the global population resides in urban areas, with projections indicating a continued increase in urban population share, thereby intensifying exposure to flood hazards [9,10,11].
In such conditions, flood damage assessment becomes a critical component of both ex-ante and ex-post risk management processes. It supports decision-making related to infrastructure design, spatial planning, risk reduction, and post-disaster recovery [12]. While traditional flood risk analyses have predominantly focused on hazard characterization, such as rainfall intensity, river discharge, and flood extent, recent research increasingly emphasizes the importance of understanding how variations in hazard intensity translate into differences in structural damage outcomes [12,13]. In particular, not only the occurrence of flooding, but also the redistribution of damage severity across exposed assets, represents a key dimension of flood risk under changing climatic conditions.
This shift in perspective naturally leads to the need for analyses at the building level. Unlike aggregated approaches, building-level assessments enable a more detailed understanding of exposure and vulnerability, allowing for the identification of localized damage patterns and supporting the development of targeted adaptation strategies [14,15,16]. Such analyses provide a direct link between technical risk assessment and practical decision-making, which is essential for sustainable urban planning and resilience building.
A variety of modelling approaches has been developed to estimate flood damage. Among these, deterministic depth–damage functions remain one of the most widely used methods. These models establish a functional relationship between inundation depth and structural damage severity, while recent empirical studies further emphasize the substantial variability of damage outcomes across exposed assets under similar flood conditions [12,13]. Well-known examples include the FLEMO model [17] and the Rhine Atlas approach [18]. The main advantage of these models lies in their transparency, interpretability, and relatively low data requirements, which makes them particularly suitable for applications in data-constrained environments.
Building on these advantages, recent studies have further explored simplified and interpretable modelling frameworks for flood damage severity analysis under data-scarce conditions, emphasizing the importance of maintaining physical consistency and reduced data requirements [19].
Previous studies have also explored simplified terrain-based approaches for flood hazard characterization where detailed hydraulic observations or high-resolution inundation models are unavailable. DEM-derived and terrain-based proxy indicators have increasingly been adopted to support flood hazard characterization and subsequent building-level damage assessment under data-constrained conditions, providing transparent and computationally efficient alternatives while acknowledging the uncertainties associated with simplified hazard representation [20,21]. In such contexts, model evaluation often focuses on preserving physically plausible and internally consistent damage patterns rather than on direct numerical calibration against observed hydraulic variables or quantitative loss measurements alone [12,22].
However, depth–damage models also have important limitations. Their reliance on water depth as the primary explanatory variable means that they cannot fully capture the influence of building characteristics, construction typology, or local contextual factors. As a result, similar inundation depths may lead to significantly different damage outcomes depending on structural and environmental conditions [12,22]. Despite these limitations, standardized depth–damage relationships continue to be widely applied due to their robustness, transferability, and suitability for comparative analyses.
In response to these limitations, more advanced modelling approaches have been developed. Multi-parameter statistical models, including regression-based and machine learning methods, incorporate additional explanatory variables such as building attributes, flood duration, and socio-economic characteristics [23,24]. While these approaches can improve predictive performance, they typically require large, detailed datasets and extensive calibration, which limits their applicability in many regional contexts.
At the same time, climate change considerations are increasingly integrated into flood risk assessment through the modification of hazard components. Hydrological and hydraulic simulations driven by climate projections are commonly used, as well as simplified delta-change approaches that adjust historical observations based on projected changes in extreme precipitation [25,26]. While these approaches provide valuable insights into future flood hazards, most studies focus on aggregated indicators such as total damage or expected annual losses.
In many real-world contexts, particularly at the local scale, building-level flood damage severity analyses are constrained by limited availability of detailed hydraulic and building-specific data, which necessitates the use of simplified yet robust analytical approaches. In such contexts, the development of full hydrological or hydraulic models is often not feasible, highlighting the need for transparent and reproducible analytical frameworks that rely on limited but commonly available data.
Despite their practical value, administrative post-event damage records present several important limitations when used for building-level flood damage modelling. Such datasets are primarily collected to support post-disaster compensation and recovery procedures rather than scientific modelling purposes and therefore rarely include detailed hydraulic observations, building-specific vulnerability characteristics, or consistent measurements of inundation depth. As a result, many existing building-level flood damage studies either rely on aggregated damage information, require additional field surveys or hydraulic modelling, or depend on detailed local datasets that are not generally available in data-constrained environments. These limitations may reduce the applicability of many existing approaches in regions where only administrative damage records and openly available spatial data are accessible.
Nevertheless, relatively limited attention has been given to how climate-induced changes in hazard intensity influence the distribution of damage severity across individual buildings, particularly when using observed post-event damage datasets. These limitations highlight the need for transparent and reproducible frameworks that can link post-event building-level damage data, terrain-based hazard indicators, standardized vulnerability functions, and climate-adjusted hazard assumptions under data-constrained conditions. Recent studies emphasize the importance of accounting for spatial heterogeneity and local variability in flood response [27,28].
Against this background, this study develops a transparent and reproducible framework for analyzing building-level flood damage severity under climate-adjusted hazard conditions. The analysis is based on an event-based dataset of residential buildings affected by flood events in Kraljevo, Serbia, located within the river systems of the Ibar and Zapadna Morava rivers, during the period 2016–2021. The proposed approach integrates administrative post-event damage records, GIS-based terrain information, a terrain-based proxy hazard indicator, and a standardized depth–damage relationship derived from the Rhine Atlas framework.
Rather than developing a new vulnerability model, the study uses a standardized depth–damage function as a structural reference and focuses on evaluating how changes in hazard intensity influence spatial variability in structural damage severity across buildings. In addition, a climate hazard scaling approach based on projected changes in extreme precipitation is incorporated to assess potential climate-adjusted changes in damage severity patterns.
The main contributions of this study are threefold: (i) the development of a transparent terrain-based proxy flood-depth reconstruction procedure that enables building-level flood damage assessment without hydraulic simulations or observed inundation depths; (ii) the integration of openly available administrative damage records, GIS-derived terrain information, and a standardized ICPR/Rhine Atlas depth–damage function into a reproducible framework suitable for data-constrained environments; and (iii) the extension of this framework through climate-adjusted hazard scaling and ordinal consistency assessment, enabling comparative evaluation of future changes in building-level damage severity while avoiding the need for locally calibrated vulnerability functions or detailed hydrological modelling.
2. Materials and Methods
2.1. Study Area
The study focuses on the wider Kraljevo area in central Serbia, encompassing flood-prone urban and peri-urban settlements within the municipality. The area is situated within the river systems of the Ibar River and the Zapadna Morava River, including a dense network of smaller tributaries and local watercourses.
The study area is characterized by a combination of low-gradient floodplain zones and surrounding hilly terrain. In the lowland areas, particularly along river corridors and local drainage paths, relatively small variations in terrain elevation significantly influence flood propagation and inundation patterns. At the same time, the presence of numerous smaller tributaries contributes to localized flooding processes driven by surface runoff and water accumulation.
The terrain elevation within the analyzed flood-prone settlements located in the lowland part of the study area ranges approximately between 188 m and 228 m above sea level. In these environments, even minor elevation differences can result in substantial variations in relative flood exposure at the building level. Consequently, building-level analysis is particularly relevant for understanding flood damage patterns.
The analysis is based on multiple flood episodes recorded between 2016 and 2021, affecting several settlements within the municipality. These events provide an empirical basis for analyzing the relationship between flood hazard intensity and structural damage under real-world conditions.
2.2. Flood Damage Dataset
The empirical dataset used in this study consists of 413 residential buildings affected by multiple flood events that occurred in the Kraljevo area during the period 2016–2021. These events were primarily associated with episodes of extreme precipitation resulting in combinations of fluvial and pluvial flooding within the Ibar and Zapadna Morava river systems. Although the meteorological conditions and the severity of the individual flood events varied over the study period, the objective of the present study was not to perform event-specific hydrological or hydraulic reconstruction. Instead, the study develops a generalized framework for building-level flood damage severity assessment using administrative post-event records collected under real-world data-constrained conditions.
The available administrative records indicate that the analysed flood events varied in spatial extent and documented impact while being generally associated with precipitation-driven flooding, including combinations of fluvial and pluvial flooding within the wider Ibar and Zapadna Morava river systems. However, event-level hydrometeorological information is not uniformly available across all years and settlements. Consequently, the available event information is used solely to contextualize the administrative damage records and is not used as input for event-specific hydrological or hydraulic reconstruction.
The analysed dataset reflects officially documented flood-damaged residential buildings recorded through municipal post-event damage assessment procedures rather than a predefined sampling strategy or a uniform event-based survey design. Consequently, the contribution of individual flood events to the final dataset is heterogeneous and should be interpreted as an inherent characteristic of administrative post-event records collected under real-world conditions rather than as a direct indicator of the magnitude of individual flood events. The available administrative records therefore serve as an empirical ordinal reference for evaluating whether the proposed terrain-based proxy hazard indicator and the standardized ICPR depth–damage function preserve the expected ordering of building-level damage severity.
The dataset was obtained through official post-event damage assessment procedures conducted by officially appointed municipal damage assessment commissions in accordance with the national methodology prescribed by the Government of the Republic of Serbia [29]. The primary purpose of these assessments was to support post-disaster recovery and compensation procedures at the municipal level, while the standardized administrative methodology provided a consistent classification framework across the analysed flood events.
Structural damage was classified according to the national methodology defined in the Instruction on the Unified Methodology for Damage Assessment from Natural Disasters [29]. This methodology provides a standardized framework for post-disaster damage assessment and has been widely applied in practice.
The classification distinguishes six categories of structural damage severity, ranging from minor non-structural damage (Category 1) to complete structural failure or destruction (Category 6). Intermediate categories represent increasing levels of damage affecting building elements, installations, and structural integrity. A detailed description of the damage categories is provided in Appendix A.
These categories provide an ordinal representation of structural damage severity and serve as the primary empirical reference variable in the analysis. Importantly, the observed damage categories were not used to assign, reconstruct, or calibrate proxy flood-depth values for individual buildings. Compared with monetary damage estimates, which require detailed valuation data and are often unavailable or inconsistent, categorical damage assessments are more widely recorded and systematically documented through post-event administrative procedures. This makes them particularly suitable for empirical analysis under data-constrained conditions.
Although moderate in size, the dataset represents a relatively large and internally consistent sample for event-based, building-level flood damage severity analysis. Datasets of this type remain relatively scarce in the literature, particularly in regional contexts where detailed hydraulic observations and economic loss data are unavailable. Consequently, the dataset provides a valuable basis for analysing relationships between flood hazard intensity and structural damage severity under real-world conditions.
It should be emphasized that the recorded damage categories reflect observed post-event outcomes rather than direct measurements of flood characteristics. In this study, they are retained as empirical ordinal reference information for assessing whether the terrain-based proxy hazard indicator and the ICPR-derived structural damage estimates preserve the expected ordering of damage severity. They are not used as direct inputs for assigning or calibrating proxy flood depths for individual buildings.
2.3. Spatial Data and GIS Processing
Spatial data integration was performed using a Geographic Information System (GIS) framework implemented in QGIS. The GIS component of the study was used for spatial integration, visualization, and analysis of flood damage patterns, without performing hydrodynamic flood simulation.
The spatial database included administrative boundaries, settlement boundaries, the river network, georeferenced locations of flood-affected buildings, and digital elevation model (DEM) data, derived from a publicly available dataset with a spatial resolution of 30 m [30]. Administrative and settlement layers were used to define the spatial extent of the study area, while the river network provides a contextual representation of the local hydrological system.
Flood-affected buildings were geocoded based on address information and associated with individual flood events identified by year and month of occurrence. Vector spatial data were processed in the WGS 84/UTM zone 34N coordinate system (EPSG:32634), while the DEM dataset was provided in the WGS 84 geographic coordinate system (EPSG:4326). Coordinate transformations and spatial alignment procedures were applied where necessary to ensure consistency across datasets. Base spatial layers were obtained from OpenStreetMap [31] using the QuickOSM plugin (version 2.4.1) in QGIS (version 3.30.2).
Terrain elevation values for individual buildings were extracted from the DEM and used as a key input for proxy flood depth reconstruction. The resulting geospatial database enables consistent spatial representation of flood-affected buildings and supports the integration of terrain-based hazard indicators with observed ordinal damage information at the building level.
The GIS framework is therefore used as a supporting analytical tool, enabling the identification of spatial patterns and relationships between terrain elevation, hazard intensity, and structural damage, rather than as a predictive modelling component.
2.4. Reconstruction of Representative Proxy Flood Depths
2.4.1. Conceptual Approach
Direct measurements of flood depth and water levels were not available for the analyzed flood events. River gauge data were not used for proxy flood-depth reconstruction, as flooding in the study area was primarily driven by local water accumulation and small tributaries rather than large-scale river overflow, making such data non-representative. The reconstruction procedure is therefore based on terrain elevation, affected-building locations, and settlement/event-level reference surfaces. Observed damage categories are not used as direct inputs for assigning proxy flood-depth values to individual buildings.
Therefore, the flood-depth variable used in this study is treated as a terrain-based proxy indicator of hazard intensity, rather than an exact physical measurement. The objective is not to reproduce hydraulic conditions, but to derive a consistent representation of relative flood intensity at the building level.
The reconstruction is designed to provide a consistent representation of relative flood intensity, which is subsequently evaluated through a standardized vulnerability-based damage model.
2.4.2. Terrain Elevation and Relative Exposure
For each building, terrain elevation was extracted from the digital elevation model. Relative differences in terrain elevation are used as the primary spatial determinant of flood exposure, reflecting the strong influence of micro-topography in low-gradient floodplain environments.
The elevation of the ground floor above terrain is represented by a parameter , which was assumed to be constant due to the absence of building-specific information. In this study, was set to 0.20 m as a simplified methodological assumption applied uniformly to all buildings. Its purpose is to provide a common reference for comparative proxy flood-depth estimation rather than to reproduce the actual ground-floor elevation of individual buildings. The use of a constant value enables consistent comparison of relative exposure across buildings while avoiding the introduction of additional uncertainty associated with unknown building-specific parameters. Consequently, relative differences in terrain elevation remain the dominant factor controlling variations in reconstructed proxy flood depth and, therefore, in the estimated hazard intensity at the building level.
2.4.3. Relative Water Level Approximation
Given the absence of directly observed water levels, a representative settlement-level reference surface is approximated as the basis for estimating relative proxy flood depths. The administrative damage dataset is used to identify the set of flood-affected buildings associated with each settlement and event, but the recorded damage categories are not translated into water depths. A preliminary local reference level is defined for each building as:
where represents the local reference level for building , is the terrain elevation at the building location extracted from the digital elevation model, and is the assumed elevation of the ground floor above terrain. The parameter is assumed to be constant due to the absence of building-specific data, enabling consistent comparison of relative exposure across buildings.
A settlement-level reference surface is then estimated as:
where represents the settlement-level reference surface for settlement .
The settlement-level reference surface is not intended to reconstruct the hydraulic water surface of an individual flood event. Rather, it provides a robust local reference from which relative proxy flood depths can be consistently estimated across buildings within the same settlement. The median was selected because it is less sensitive than the mean to localized elevation anomalies and potential DEM-related outliers, while avoiding the systematic overestimation that could result from using maximum reference elevations. Since the objective of the proposed framework is comparative building-level damage severity assessment under data-constrained conditions rather than event-specific hydraulic reconstruction, the settlement-level reference surface is interpreted as a relative basis for hazard ordering rather than a physically reconstructed inundation surface.
The administrative damage dataset is therefore used to define the affected-building set and the settlement/event grouping. However, the recorded damage categories are not used in the calculation of the settlement-level reference surface; the reference surface is derived from terrain-based elevation relationships within the affected-building set.
This representation does not correspond to a measured hydraulic water level but serves as a relative reference surface for estimating proxy flood depths and comparing hazard intensity across buildings within the affected area. It is intended to capture the relative spatial variability of flood hazard driven by local topographic controls rather than to reconstruct a physically observed inundation surface.
Accordingly, the reference surface should be interpreted as a relative benchmark for comparing hazard intensity across buildings rather than as an absolute representation of flood water level.
2.4.4. Proxy Flood Depth Calculation
Proxy flood depth is defined relative to the settlement-level reference surface introduced in Section 2.4.3 as:
and
where represents the proxy flood depth above terrain at building ; represents the proxy flood depth above the ground-floor level at building ; is the settlement-level reference surface for flood event ; is the terrain elevation at the location of building ; is the assumed elevation of the ground floor above terrain; and max (0, ⋅) ensures that only positive inundation depths are considered.
These values represent proxy flood depths, which capture relative differences in hazard intensity between buildings rather than absolute inundation levels.
To ensure physical plausibility under shallow inundation conditions characteristic of the observed flood events, proxy flood depths were constrained to the interval 0.10–1.00 m. The lower bound reflects a minimum effective inundation depth consistent with physically plausible shallow inundation conditions, while the upper bound prevents unrealistically large values that may arise from the simplified terrain-based hazard reconstruction approach.
Accordingly, the final proxy flood depth is defined as:
The constrained proxy flood depth is hereafter referred to as proxy flood depth.
This constraint preserves relative differences in exposure across buildings while preventing physically implausible values. Consequently, the reconstructed proxy flood depths should be interpreted as indicators of relative exposure suitable for vulnerability-based analysis and ordinal comparison with observed damage categories, rather than exact measures of physical inundation depth.
2.4.5. Consistency with the Depth–Damage Relationship
The reconstructed proxy flood depths are used as inputs to the depth-damage relationship defined by the ICPR depth–damage function (Section 2.5). The reconstruction is guided by terrain-based exposure relationships and physical plausibility, not by direct conversion of damage classes into depths.
In this framework, proxy flood depth is not directly inferred from damage categories and is not calibrated to individual category labels. Instead, it is constructed as a physically interpretable proxy variable that is subsequently linked to damage through the vulnerability model. This avoids circular reasoning and ensures methodological coherence.
The observed damage categories were not converted directly into fixed flood-depth classes and were not used to calibrate individual proxy depths. Instead, they were retained as independent ordinal reference information for assessing whether the terrain-based proxy hazard indicator and the ICPR-derived structural damage estimates follow the expected ordering of damage severity.
2.4.6. Methodological Considerations and Uncertainty
The reconstructed terrain-based proxy flood depths are not intended to represent exact hydraulic measurements, but rather consistent proxy indicators of flood intensity suitable for comparative and vulnerability-based analysis. This approach prioritizes internal consistency and relative comparability over absolute accuracy, which is particularly appropriate in data-constrained environments where direct observations are unavailable.
The main sources of uncertainty include the simplified representation of the flood intensity surface, the assumption of a uniform ground-floor elevation, the spatial resolution of the DEM, and the absence of direct hydraulic observations. Despite these limitations, the method provides a coherent and physically interpretable framework for linking relative flood hazard intensity with structural damage.
2.5. Structural Damage Estimation Using the ICPR Depth–Damage Function
Structural damage at the building level was estimated using a standardized depth–damage relationship derived from the Rhine Atlas framework [18]. Depth–damage functions represent a widely used approach for linking flood hazard intensity to structural damage, as they provide a direct and physically interpretable relationship between inundation depth and relative structural damage severity [12].
Although the ICPR/Rhine Atlas depth–damage function was originally developed using residential building data from the Rhine River basin, it is used in this study as a standardized vulnerability reference rather than as a locally calibrated predictive model. Standardized depth–damage functions remain widely used for comparative flood damage assessment, particularly where the objective is to evaluate relative damage patterns rather than estimate absolute losses [12,22]. The objective of the proposed framework is not to develop a region-specific depth–damage relationship or estimate absolute economic losses, but to provide a transparent and reproducible assessment of relative building-level damage severity under data-constrained conditions using a limited set of openly available spatial and administrative data.
Alternative empirical approaches, such as FLEMO, incorporate additional explanatory variables related to building characteristics, precautionary measures, contamination, and other vulnerability factors. While such models may provide improved predictive performance when comprehensive local datasets are available, they require building-specific information that was not available in the administrative damage records used in this study. Consequently, the ICPR/Rhine Atlas function was considered more suitable for the objectives and data availability of the present study. Future studies incorporating detailed building inventories and observed damage data could evaluate whether regional calibration, parameter adjustment, or sensitivity analyses would further improve the applicability of the adopted vulnerability function.
In this study, structural damage is expressed as a nonlinear function of proxy flood depth above the ground-floor level:
where denotes the reconstructed proxy flood depth above the ground-floor level for building , while represents relative structural damage expressed as a percentage. The nonlinear form of the function reflects the progressive nature of flood damage, where shallow depths primarily affect finishing elements, while increasing depths lead to structural damage, resulting in disproportionately higher total losses.
The ICPR depth–damage function was implemented using digitized support points derived from the graphical representation provided within the ICPR Rhine Atlas framework for residential buildings [18] (see Appendix B, Table A1 for full implementation details). Damage values for intermediate depths were obtained through linear interpolation between adjacent support points.
The function was applied at the building level using reconstructed proxy flood depths as input, providing a consistent and physically interpretable mapping between relative hazard intensity and structural damage severity.
2.6. Climate Hazard Adjustment
To evaluate potential future changes in flood damage severity, hazard intensity was adjusted using projected changes in extreme precipitation, represented by the index. The index describes the change in maximum consecutive five-day precipitation and is widely used as an indicator of shifts in extreme rainfall intensity.
In the context of this study, hazard intensity is represented by the proxy flood depth derived in Section 2.4. Rather than modelling physical water levels, climate change impacts are incorporated through a proportional scaling of this proxy hazard indicator.
The climate-adjusted proxy flood depth is defined as:
where is the baseline proxy flood depth for building , represents the projected relative change in extreme precipitation, is an illustrative sensitivity parameter describing the assumed responsiveness of the proxy flood hazard intensity to projected changes in extreme precipitation.
The values of the index were obtained from the Digital Climate Atlas of Serbia [32], a web-based platform developed under the National Adaptation Plan (NAP) project, which provides spatially explicit projections of changes in extreme precipitation under different climate scenarios. The data correspond to the territory of the Kraljevo municipality and are based on projections for the period 2011–2040 relative to the reference period 1971–2000 under the RCP4.5 scenario.
In this study, values of 5%, 7%, and 10% were considered, corresponding to relative changes of 0.05, 0.07, and 0.10 in the scaling equation. These values were selected from within the range of projected changes reported in the Digital Climate Atlas of Serbia [32] and are used to represent plausible climate-adjusted hazard sensitivity scenarios. The selected values enable a structured sensitivity analysis across low, moderate, and higher-end conditions.
To account for uncertainty in the relationship between precipitation extremes and flood hazard intensity, three values of the sensitivity parameter were considered:
These values represent illustrative sub-linear, linear, and amplified system responses, respectively, and are intended solely for exploratory sensitivity analysis rather than empirical or physically based calibration. They were selected to span an illustrative range of system elasticity under changing precipitation conditions, allowing the robustness of the proposed framework to be examined across alternative climate response assumptions. Although the adopted values are not derived from local hydrological calibration, the selected range is conceptually consistent with the nonlinear and spatially variable relationship between extreme precipitation and flood generation reported in previous hydrological and climate-impact studies [25,26]. In this context, μ should be interpreted as an illustrative elasticity parameter linking projected changes in extreme precipitation to relative variations in flood hazard intensity, analogous to elasticity-based sensitivity analyses commonly used in hydrological studies [33].
The climate-adjusted proxy flood depths are subsequently constrained to the same bounds (0.10–1.00 m) as the baseline proxy depths. This maintains comparability between the baseline and climate-adjusted hazard representations and prevents the simplified scaling procedure from producing physically implausible values for the observed shallow flood regime.
Rather than relying on multiple full climate-model projections, uncertainty is addressed through sensitivity analysis of the parameter, which allows the exploration of alternative future hazard conditions. This approach provides a transparent representation of climate-related uncertainty without introducing additional complexity associated with physically based hydrological or hydraulic modelling. The adopted proportional scaling approach is therefore intended as a simplified exploratory sensitivity analysis rather than a substitute for physically based rainfall–runoff or hydraulic modelling.
The climate-adjusted proxy flood depths are subsequently used as inputs to the ICPR depth–damage function:
where represents the estimated structural damage under climate-adjusted conditions.
This formulation enables direct comparison between baseline and climate-adjusted patterns of model-derived damage severity, supporting the assessment of potential changes in damage severity under changing climatic conditions.
2.7. Ordinal Consistency Assessment
Because the observed administrative damage categories are ordinal and were not used to assign or calibrate proxy flood depths, model evaluation was framed as an ordinal consistency assessment rather than as statistical calibration or predictive validation. Model-derived structural damage values were compared with the observed damage categories to evaluate whether the proposed framework preserves the expected ordinal ordering of damage severity.
Consistent with the objective of evaluating behavioral consistency rather than statistical calibration, the assessment focused on:
- Monotonic consistency between terrain-based proxy flood depth and ICPR-derived structural damage;
- Alignment between ICPR-derived damage distributions and observed ordinal damage categories;
- Ability of the framework to preserve the expected ordering of damage severity without using the observed categories as depth-calibration targets.
More specifically, the assessment evaluates whether higher terrain-based proxy hazard intensities consistently correspond to higher ICPR-derived structural damage values and higher observed administrative damage categories.
This evaluation approach is appropriate because the available administrative records do not provide quantitative loss estimates, observed inundation depths, or building-specific vulnerability information required for fully calibrated statistical validation. Instead, the assessment examines whether the proposed framework reproduces the expected increase in damage severity with increasing relative hazard intensity while preserving the ordinal structure of the observed damage classification.
Rank-based correlation measures, such as Spearman’s rank correlation coefficient or Kendall’s tau, could provide complementary quantitative evidence of monotonic association. However, they were not adopted as the primary validation metrics because the objective of this study was not to statistically calibrate or predict the observed damage categories, but to evaluate whether the proposed data-constrained framework preserves the expected ordinal structure of damage severity. The observed administrative categories therefore serve as an ordinal reference for consistency assessment rather than as calibration targets, avoiding the implication of a stronger level of empirical validation than is supported by the available data.
Accordingly, the ordinal consistency assessment is based on the comparison of category-wise model-derived damage distributions, including mean values, median values, variability, and monotonic trends across the observed damage categories. This provides a transparent and interpretable evaluation of whether the proposed framework produces damage severity patterns that are behaviorally consistent with the administrative damage classification under data-constrained conditions. This form of behavioral consistency assessment is consistent with approaches commonly adopted in flood damage assessment where simplified vulnerability representations and comparative interpretation of damage patterns are necessary because direct empirical calibration is not feasible [12,19,22].
2.8. Analytical Workflow
The overall methodological framework used in this study is illustrated in Figure 1. The workflow integrates building-level damage records, spatial terrain information, reconstruction of proxy flood depths, application of a standardized vulnerability function, climate-adjusted hazard scaling, and ordinal consistency assessment.
Figure 1.
Analytical workflow of the proposed framework for building-level flood damage severity analysis under observed and climate-adjusted hazard conditions.
The analysis consists of the following sequential steps (Figure 1, Panels 1–5):
- Integration and preprocessing of building-level damage data and spatial information within a GIS framework;
- Reconstruction of proxy flood depths based on terrain elevation and relative exposure conditions;
- Estimation of structural damage using the ICPR depth–damage function;
- Adjustment of hazard intensity using climate-adjusted sensitivity scenarios based on projected changes in extreme precipitation;
- Comparison of baseline and climate-adjusted damage distributions and ordinal consistency assessment against observed damage categories.
This stepwise framework ensures a systematic linkage between empirical data, proxy hazard reconstruction, vulnerability modelling, and climate-related sensitivity analysis. It enables a transparent and reproducible analysis of building-level flood damage under both observed and climate-adjusted hazard conditions, while remaining consistent with the data-constrained nature of the study.
3. Results
3.1. Dataset Characteristics and Spatial Distribution
The final dataset consists of 413 residential buildings affected by flood events in the Kraljevo area during the period 2016–2021. Terrain elevation ranges between approximately 188 m and 228 m above sea level, with a median value of approximately 197 m, confirming the low-gradient floodplain characteristics of the study area.
Although the national damage classification includes six categories, the analyzed empirical dataset contains only Categories 1–3, reflecting the predominance of shallow to moderate flood impacts during the observed events.
The distribution of damage categories indicates a clear dominance of lower damage levels, with Category 1 accounting for the majority of buildings (226), followed by Category 3 (124) and Category 2 (63). This distribution reflects the prevalence of shallow inundation conditions and is consistent with flood events driven by localized water accumulation and micro-topographic variability.
The spatial distribution of flood-affected buildings is shown in Figure 2, where individual objects are classified according to observed damage categories and presented in relation to the administrative boundary and the local river network.
Figure 2.
Spatial distribution of flood-affected residential buildings classified by observed damage categories within the Kraljevo municipality.
As illustrated in Figure 2, higher damage levels tend to be concentrated in areas influenced by the river network, including smaller tributaries, while lower damage categories are more broadly distributed across the study area. This pattern reflects the hydrological characteristics of the region, where localized flooding driven by smaller watercourses and terrain depressions plays a significant role in shaping flood impacts.
The dataset exhibits considerable variability across flood events, with a pronounced peak in 2019, when the largest number of affected buildings was recorded. In contrast, several years are characterized by significantly lower numbers of observed damage cases, reflecting the episodic nature of flood events in the study area.
Spatially, damage is concentrated in a limited number of settlements, including Kraljevo, Grdica, and Ribnica, indicating the influence of localized hydrological and topographic conditions. Across the entire observation period, lower damage categories dominate, suggesting that most buildings experienced relatively minor structural impacts.
Terrain-based proxy flood depths were constrained to the interval 0.10–1.00 m, reflecting the fact that all buildings included in the dataset were recorded as flood-affected. The lower bound represents a minimum effective inundation depth consistent with physically plausible shallow flood impacts, while the upper bound ensures physical plausibility.
The resulting distribution is characterized by a strong concentration of values near the lower bound, with a gradual decrease toward higher depths. This pattern is consistent with shallow inundation conditions typical of low-relief floodplain environments, where small variations in terrain elevation lead to significant differences in exposure while still resulting in predominantly low to moderate damage levels.
3.2. Structural Damage Across Categories
The relationship between model-derived structural damage and the observed administrative damage categories is illustrated in Figure 3, while the corresponding descriptive statistics are presented in Table 1. Because the observed damage categories were not used to assign or calibrate proxy flood depths, the comparison serves as an ordinal consistency assessment rather than as statistical calibration.
Figure 3.
Mean ± standard deviation of ICPR-derived structural damage severity across observed ordinal damage categories.
Table 1.
Descriptive statistics of ICPR-derived structural damage (%) across observed damage categories.
As shown in Table 1, the mean model-derived structural damage increases monotonically across the observed administrative damage categories, from 13.05% for Category 1 to 15.78% for Category 2 and 21.53% for Category 3. Median values are non-decreasing across categories, remaining at 10.00% for Categories 1 and 2 and increasing to 23.00% for Category 3. This pattern supports the expected ordinal ordering of damage severity and indicates that higher reconstructed proxy hazard intensities are generally associated with higher observed administrative damage categories.
The within-category variability, reflected by the standard deviation values, indicates that model-derived damage values are not identical within each category, which is expected under real-world data-constrained conditions. This variability reflects both the simplified proxy-depth reconstruction adopted in this study and the influence of unobserved building-specific characteristics and local exposure conditions that are not explicitly represented in the framework.
Since the observed administrative categories were not used to assign or calibrate proxy flood depths, the observed category-wise increase in model-derived damage provides evidence of internal ordinal consistency rather than calibrated statistical prediction. These results therefore support the conclusion that the terrain-based proxy hazard reconstruction and the ICPR-derived damage estimates preserve the expected ordinal structure of damage severity under data-constrained conditions.
3.3. Climate Change Impact on Damage Severity
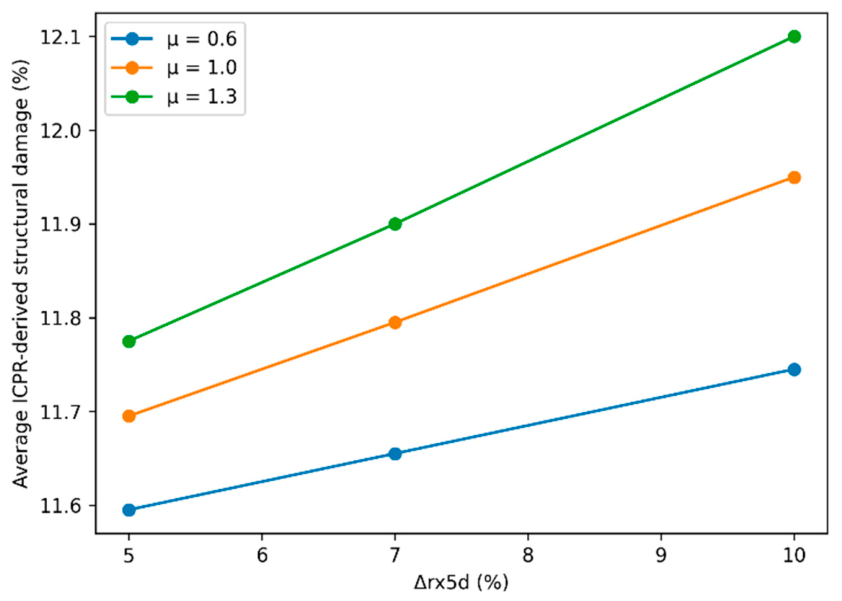
The analysis is further extended to account for potential climate-adjusted changes in hazard intensity. The impact of climate-adjusted sensitivity scenarios on structural damage is illustrated in Figure 4.
Figure 4.
Climate-adjusted sensitivity of average structural damage severity (%) to projected changes in extreme precipitation () for different values of the sensitivity parameter .
The results indicate a moderate but consistent increase in structural damage across all climate-adjusted sensitivity scenarios. Damage increases with higher values of , while larger values of produce slightly stronger sensitivity responses, reflecting the combined influence of precipitation change and system sensitivity.
However, due to the imposed bounds on proxy flood depth (0.10–1.00 m), the system exhibits a saturation effect, whereby increases in hazard intensity do not translate into unlimited growth of damage. Consequently, differences between individual climate-adjusted sensitivity scenarios remain relatively small.
This behavior reflects the physical limitation of flood impacts under shallow inundation conditions characteristic of the study area. The graphical representation in Figure 4 captures the observed trends without overemphasizing minor numerical differences.
To illustrate the broader applicability of the proposed framework, an extended analysis without depth limitation is presented in Appendix C (Figure A1).
Despite the limited magnitude of change, the results consistently indicate a systematic upward trend in damage levels, supporting the conclusion that even moderate increases in extreme precipitation can contribute to higher model-derived damage severity.
3.4. Proxy Flood Depth–Damage Relationship and Ordinal Consistency Assessment
To further interpret the obtained results, the relationship between proxy flood depth and structural damage is examined using the ICPR/Rhine Atlas depth–damage function.
As proxy flood depth increases, the corresponding structural damage also increases, supporting a physically interpretable monotonic relationship between relative hazard intensity and structural damage severity. This behavior is consistent with established depth–damage relationships, where damage increases gradually at lower depths and more markedly at higher levels.
Due to the imposed lower bound on proxy flood depth (0.10 m), a concentration of values occurs near the minimum depth. This reflects the characteristics of the dataset, in which all buildings are considered flood-affected and shallow inundation dominates.
The introduction of a lower bound on proxy flood depth reduces the influence of very low damage values, which results in a slight increase in average damage compared to the uncapped scenario.
At the same time, the results indicate that proxy flood depth alone does not fully explain the variability in observed damage categories. Similar proxy-depth values may correspond to different damage outcomes, suggesting the influence of additional factors such as building characteristics, construction quality, and local exposure conditions.
From an ordinal consistency perspective, the framework shows that higher terrain-based proxy flood depths correspond to higher ICPR-derived damage values and are generally associated with higher observed damage categories. Since observed categories were not used to assign proxy depths, this result supports the behavioral plausibility of the proposed framework.
The imposed depth constraints ensure that all reconstructed values remain physically meaningful while preventing unrealistic extremes. These constraints improve the stability and interpretability of the model without distorting the underlying hazard–damage relationship.
Overall, the combination of the proxy hazard representation and the ICPR depth–damage function provides a physically consistent, stable, and interpretable mapping between relative flood hazard intensity and structural damage under data-constrained conditions.
3.5. Key Findings
The analysis leads to the following key findings:
- Constraining terrain-based proxy flood depths to the interval 0.10–1.00 m provides a physically plausible representation of relative hazard intensity under shallow inundation conditions;
- The ICPR/Rhine Atlas depth–damage function provides a standardized nonlinear representation of the relationship between proxy flood depth and structural damage;
- The model preserves ordinal consistency with observed damage categories; supporting the methodological plausibility of the proposed framework under data-constrained conditions;
- Climate-adjusted increases in extreme precipitation produce moderate but systematic increases in model-derived structural damage severity, constrained by the shallow flood regime and the imposed depth limits.
4. Discussion
4.1. Interpretation of Results and Ordinal Consistency
The results indicate a physically interpretable relationship between terrain elevation, terrain-based proxy flood depth, and structural damage severity (see Section 3.2, Figure 3 and Table 1). This relationship should be interpreted in terms of relative hazard ordering rather than exact hydraulic reconstruction. The observed spatial patterns of damage, characterized by higher damage categories in lower elevation zones and near river channels, are consistent with fundamental floodplain dynamics. These findings support the assumption that terrain elevation represents a primary controlling factor of flood hazard intensity in low-gradient environments.
The reconstructed proxy flood depths exhibit a clear monotonic relationship with terrain elevation, indicating that the applied reconstruction procedure provides a physically consistent representation of relative flood hazard conditions. This consistency is further reflected in the correspondence between proxy flood depth and structural damage estimated using the ICPR vulnerability function. The nonlinear increase in damage with increasing proxy flood depth aligns with established findings indicating that flood damage severity generally increases with hazard intensity, while remaining influenced by substantial variability in vulnerability and exposure conditions [12,13].
The ability of the model to preserve the ordinal structure of observed damage categories is particularly important. Although exact numerical agreement between model outputs and observed categories is not expected due to inherent variability, the preservation of damage ordering supports the interpretation that the reconstructed proxy hazard indicator captures the dominant drivers of structural damage. This suggests that the combination of terrain-based proxy flood-depth reconstruction and standardized vulnerability modelling provides a robust framework for analyzing building-level flood damage severity.
Due to the imposed lower bound on proxy flood depth (0.10 m), a concentration of values occurs near the minimum depth. This reflects the characteristics of the dataset, in which all buildings are considered flood-affected and shallow inundation dominates. The introduction of a lower bound on proxy flood depth reduces the influence of very low damage values, which results in a slight increase in average damage compared to the uncapped scenario. This effect highlights the importance of applying physically meaningful constraints when reconstructing hazard intensity from proxy indicators.
Overall, these results support the view that the proposed framework provides a physically interpretable and internally consistent representation of flood damage processes at the building level.
4.2. Comparison with Existing Approaches
Unlike hydrodynamic flood models or locally calibrated damage models, the proposed framework does not aim to reproduce exact inundation depths or monetary losses. Its main contribution is the transparent integration of terrain-based proxy hazard indicators, standardized vulnerability functions, and ordinal damage information.
The results of this study are consistent with established findings in flood damage modelling, particularly regarding the dominant role of inundation depth as a predictor of structural damage. Depth–damage models such as FLEMO and the Rhine Atlas have long emphasized the importance of water depth as the primary explanatory variable [12,18].
However, unlike many existing studies that focus on the estimation of absolute economic losses, the present study emphasizes relative differences in damage severity across buildings. This perspective provides additional insights into flood impacts, particularly in contexts where monetary damage data are not available or are unreliable. The findings indicate that meaningful analysis of flood impacts can be conducted using categorical damage data, which are more commonly available in post-event assessments.
Compared to multivariate and machine learning approaches, which require detailed building attributes and extensive calibration datasets [23,24], the proposed framework offers a simpler and more transparent alternative. Rather than aiming to maximize predictive accuracy, the proposed framework prioritizes interpretability and reproducibility, making it particularly suitable for data-constrained environments.
The use of the ICPR depth–damage function as a standardized vulnerability reference is also consistent with previous studies emphasizing the applicability of generalized flood damage relationships for comparative analyses across different regional contexts when the focus is placed on relative damage patterns rather than precise absolute loss estimation [12,22]. In this context, the function serves as a physically grounded mapping between hazard intensity and structural damage, enabling ordinal comparison with observed damage categories.
The simplicity of the proposed framework represents a key strength, as it enables consistent and interpretable analysis under data-constrained conditions, where more complex modelling approaches are not feasible. This makes the approach particularly suitable for practical applications in regions with limited data availability.
The methodological contribution of the proposed framework lies in the transparent integration of administrative post-event damage records, openly available GIS-derived terrain information, standardized vulnerability relationships, climate-adjusted hazard scaling, and ordinal consistency assessment into a single transparent and reproducible workflow. Unlike conventional building-level flood damage assessments that typically rely on hydraulic simulations, locally calibrated vulnerability functions, or extensive building inventories, the proposed framework does not introduce a new vulnerability function or hydraulic model. Instead, it demonstrates how these complementary components can be systematically integrated to support comparative building-level flood damage assessment under data-constrained conditions. This integrated workflow extends the applicability of building-level flood damage assessment to data-constrained regions where detailed hydraulic observations, locally calibrated vulnerability models, or comprehensive building inventories are unavailable.
4.3. Climate Change Implications
The integration of climate-adjusted sensitivity scenarios provides important insights into potential changes in flood damage severity under plausible increases in extreme precipitation intensity. The results indicate that even moderate increases in extreme precipitation intensity can lead to increased model-derived structural damage severity at the building level (see Figure 4).
A key aspect of the results is the nonlinear relationship between hazard intensity and damage, meaning that small increases in proxy flood depth can result in disproportionately large increases in damage. This nonlinear behavior amplifies the effects of climate-induced hazard changes, particularly in areas that are already vulnerable.
However, the magnitude of change remains constrained due to the imposed bounds on proxy flood depth, which introduce a saturation effect. Under shallow inundation conditions, increases in hazard intensity do not translate into unlimited growth of damage. As a result, differences between individual climate-adjusted sensitivity scenarios remain moderate (Figure 4).
Despite this constraint, a systematic upward trend in damage levels is observed. This suggests that even relatively small increases in extreme precipitation may contribute to measurable changes in flood damage severity.
In addition to increasing overall damage levels, climate change also influences spatial variability in model-derived damage severity across buildings. The observed upward shift in damage severity suggests increasing impacts in already exposed areas, highlighting the importance of considering spatial variability and distributional effects in climate risk assessment [27,28]. These findings further underscore the need for adaptation strategies that go beyond aggregate risk metrics and explicitly address building-level vulnerability.
These findings are consistent with recent assessments indicating that climate change is expected to increase both the intensity of extreme precipitation and the magnitude of flood-related impacts, thereby reinforcing the need for integrated adaptation strategies [3].
4.4. Methodological Considerations and Limitations
Several methodological limitations should be acknowledged. First, the reconstruction of terrain-based proxy flood depths is based on terrain elevation and proxy assumptions rather than direct measurements of inundation depth. While this provides a practical solution in data-constrained environments, it introduces uncertainty due to the indirect nature of the estimation. The reconstructed proxy depths should therefore be understood as representative hazard indicators rather than exact hydraulic values. Observed damage categories are ordinal and do not provide quantitative loss estimates, which further limits the possibility of direct numerical evaluation.
An additional source of uncertainty arises from the spatial resolution of the digital elevation model. The analysis relies on the freely available Copernicus GLO-30 dataset (~30 m horizontal resolution), in which each grid cell corresponds to approximately 900 m2 and therefore cannot resolve fine-scale topographic features such as narrow drainage pathways, ditches, minor embankments, or plot-scale elevation differences. Consequently, buildings located within the same or adjacent grid cells may be assigned similar terrain elevations and reconstructed proxy flood depths, limiting the representation of localized flood variability. The reconstructed proxy flood depth should therefore be interpreted as a relative indicator of hazard intensity rather than a reconstruction of actual hydraulic water levels. Nevertheless, the methodology relies on relative elevation differences and settlement-level reference conditions to characterize the relative spatial ordering of hazard intensity. Higher-resolution LiDAR-derived terrain data would improve the representation of local terrain variability; however, such datasets are not openly available for the study area and therefore were beyond the scope of the present data-constrained study.
Second, the analysis assumes a uniform elevation of the ground floor above terrain for all buildings. In reality, this parameter may vary depending on building design and construction practices. However, given the lack of detailed building-level data, this simplification is necessary and is not expected to substantially affect the relative comparison of proxy flood depths across buildings.
Third, the ICPR vulnerability function is not locally calibrated to the study area. Although it provides a standardized and physically interpretable relationship between proxy flood depth and structural damage, its applicability may be influenced by regional differences in building stock characteristics. The function is therefore interpreted as a standardized vulnerability reference rather than a locally calibrated predictive model. Future studies incorporating detailed building-specific information and observed damage data could evaluate whether regional calibration, parameter adjustment, or sensitivity analyses would further improve the applicability of the adopted vulnerability function.
Fourth, the proposed framework does not explicitly account for differences in building resilience arising from building-specific characteristics. The administrative damage records used in this study did not contain information on construction material, structural type, building age, maintenance condition, renovation history, ground-floor elevation, or flood protection measures. Consequently, buildings exposed to similar proxy flood depths may experience different levels of damage due to unobserved differences in structural vulnerability. While this limitation does not affect the transparency or reproducibility of the proposed framework, it may contribute to unexplained variability in damage estimates at the individual-building level. Future research could improve the representation of building resilience through the integration of field surveys, high-resolution remote sensing, or locally available building inventory data.
Fifth, the climate hazard adjustment is based on a simplified scaling approach using projected changes in extreme precipitation. While this method captures the general direction of climate impacts, it does not explicitly account for complex hydrological processes or potential changes in flood dynamics under future conditions. Furthermore, the adopted approach assumes a uniform proportional adjustment of hazard intensity and therefore does not explicitly represent spatial differences in catchment response, runoff generation, or flood routing processes.
Despite these limitations, the proposed framework provides a transparent and reproducible approach for analyzing flood damage severity in contexts where detailed data are not available. The methodological simplicity and interpretability of the framework represent important advantages for practical applications.
Overall, the proposed reconstruction approach prioritizes internal consistency and relative comparability over absolute accuracy, which is appropriate given the objectives of this study. In this context, the reconstructed depths are best interpreted as relative indicators of hazard intensity rather than precise physical measurements.
4.5. Implications for Flood Risk Management
The findings of this study provide several important implications for flood risk management and climate adaptation planning. First, the strong relationship between terrain elevation and flood damage highlights the importance of incorporating high-resolution topographic data into spatial planning and risk assessment.
Second, the observed sensitivity of structural damage to changes in proxy flood depth indicates that even modest increases in hazard intensity can have significant consequences, as demonstrated in the climate-adjusted sensitivity scenarios. This emphasizes the need for proactive adaptation measures, particularly in low-lying urban areas.
Third, the use of administrative post-event damage records in combination with simplified modelling approaches provides a practical framework for risk assessment in data-constrained environments. This is particularly relevant for regions where detailed hydraulic modelling and building-level datasets are not available.
Finally, the analysis of spatial variability in damage severity offers a valuable perspective for prioritizing risk reduction measures. By identifying areas where model-derived damage severity may increase under climate-adjusted hazard conditions, decision-makers can better target investments in flood protection, urban planning, and resilience-building strategies. This approach supports the development of targeted, spatially informed adaptation strategies, particularly in regions characterized by limited data availability.
5. Conclusions
This study presents a transparent and reproducible framework for analyzing building-level flood damage severity by integrating administrative post-event damage records, GIS-based terrain information, and a standardized depth–damage relationship under both observed and climate-adjusted hazard conditions.
The results indicate that terrain-based proxy flood depth, strongly controlled by terrain elevation in low-gradient floodplain environments, represents an interpretable relative hazard indicator for structural damage severity. The application of the ICPR vulnerability function demonstrates a consistent nonlinear relationship between proxy inundation depth and structural damage severity, enabling ordinal comparison with observed damage categories. The findings further show that terrain-based reconstruction of representative proxy flood depths, evaluated against observed ordinal damage categories, provides a physically consistent and methodologically robust indicator of relative hazard intensity in data-constrained contexts.
Observed damage categories are not used to assign proxy flood depths directly, but serve as empirical ordinal reference information for evaluating the ordinal consistency of the proposed framework.
The incorporation of climate-adjusted hazard scenarios indicates that even moderate increases in extreme precipitation can lead to measurable increases in model-derived structural damage severity. Importantly, climate-adjusted hazard scenarios affect not only the magnitude of model-derived damage severity, but also its spatial distribution across buildings, indicating a potential concentration of increased impacts in already exposed areas.
From a methodological perspective, the study demonstrates that meaningful insights into flood damage dynamics can be obtained without relying on data-intensive hydraulic modelling. By prioritizing interpretability and internal consistency, the proposed framework provides a practical and scalable approach for analyzing flood damage severity in regions with limited data availability.
The findings have direct implications for sustainable flood risk management and climate adaptation planning. By highlighting the relationship between terrain, hazard intensity, and damage severity, the study supports the development of targeted risk reduction measures and spatially informed planning strategies.
Future research should focus on incorporating building-specific characteristics, improving flood-depth estimation through hydraulic modelling where data are available, and extending the analysis to longer time series and additional climate-adjusted sensitivity scenarios or fully developed climate-driven hydrological scenarios in order to further enhance the robustness and applicability of building-level flood damage severity analyses.
Author Contributions
Conceptualization, T.V. and S.N.; methodology, T.V. and S.N.; formal analysis, S.N., T.V., C.L. and V.P.; investigation, S.N. and C.L.; data curation, S.N., C.L. and V.P.; GIS processing and spatial analysis, V.P. and C.L.; visualization, C.L. and V.P.; climate-adjusted sensitivity analysis, S.N. and T.V.; writing—original draft preparation, S.N. and T.V.; writing—review and editing, T.V., S.N., C.L., V.P., M.L. and B.Z.; project administration, M.L.; English language editing, B.Z. All authors have read and agreed to the published version of the manuscript.
Funding
This research received no external funding.
Institutional Review Board Statement
Not applicable.
Informed Consent Statement
Not applicable.
Data Availability Statement
The raw data supporting the conclusions of this article will be made available by the authors on request.
Acknowledgments
The authors gratefully acknowledge Srđan Popov for his strategic guidance, valuable methodological advice, and internal review during the development of this manuscript. The authors also thank Stevan Cvetićanin for his assistance with reference checking and citation verification during manuscript preparation. The authors further acknowledge the support of the Ministry of Science, Technological Development and Innovation of the Republic of Serbia (Contract No. 451-03-34/2026-03/200156) and the Faculty of Technical Sciences, University of Novi Sad, through the project “Scientific and Artistic Research Work of Researchers in Teaching and Associate Positions at the Faculty of Technical Sciences, University of Novi Sad 2026” (No. 01-3609/1).
Conflicts of Interest
The authors declare no conflicts of interest.
Abbreviations
The following abbreviations are used in this manuscript:
| ICPR | International Commission for the Protection of the Rhine |
| GIS | Geographic Information System |
| DEM | Digital Elevation Model |
| OSM | OpenStreetMap |
| UTM | Universal Transverse Mercator |
| WGS 84 | World Geodetic System 1984 |
| rx5d | Maximum consecutive 5-day precipitation amount |
Appendix A. Damage Classification System
The classification of structural damage used in this study is based on the Instruction on the Unified Methodology for Damage Assessment from Natural Disasters [29], which defines a standardized six-level categorization of building damage following natural hazard events.
In the present analysis, the observed empirical dataset includes Categories 1–3 only. Categories 4–6 are retained in the classification description for methodological completeness.
The categories are defined as follows:
- Category 1—Minor damage: Damage limited to non-structural elements such as plaster, roofing, glazing, and minor deterioration of interior finishes. In flood conditions, this typically includes superficial damage to walls, flooring, and joinery resulting from short-term water exposure;
- Category 2—Moderate damage: More extensive damage to roofing, plaster, and non-structural components, including cracking of walls and partial deterioration of building elements. Minor damage to structural components may occur, but overall stability is not compromised;
- Category 3—Significant damage: Damage affecting both structural and non-structural elements, including deformation of roof structures, cracking of load-bearing and partition walls, partial failure of internal elements, and damage to installations;
- Category 4—Extensive damage: Severe damage to structural elements, including load-bearing walls, columns, and roof structures. Partial collapse, major deformations, and significant damage to installations may occur, leading to loss of functionality;
- Category 5—Very severe damage: Major structural damage involving deformation or failure of key load-bearing elements, including structural instability. Buildings in this category require extensive repair and may be close to collapse;
- Category 6—Destruction: Complete structural failure or collapse of the building, or damage beyond repair.
Appendix B. Implementation of the Rhine Atlas Depth–Damage Function
Damage values for intermediate depths were obtained by linear interpolation between adjacent support points. Values were bounded to the interval [0, 100].
The support points were digitized from the graphical representation provided within the ICPR/Rhine Atlas framework for residential buildings [18]. Minor numerical deviations associated with graphical digitization are not expected to affect the results, as the interpolation procedure preserves the monotonic structure of the original function.
The function is used as a standardized vulnerability reference, rather than a locally calibrated predictive model.
Table A1.
Support points for the ICPR/Rhine Atlas residential depth–damage function used for interpolation.
Appendix C. Supplementary Climate Sensitivity Analysis
To illustrate the broader applicability of the proposed framework, a supplementary sensitivity analysis was conducted without imposing an upper bound on proxy flood depth. While the main analysis (Section 3) is based on constrained depths (), reflecting physically plausible conditions for the observed shallow-inundation regime, this supplementary analysis explores model behavior under higher hazard intensities associated with climate-adjusted sensitivity scenarios.
In this case, proxy flood depths were allowed to exceed 1.0 m, and structural damage was estimated using the full range of the ICPR/Rhine Atlas depth–damage function. This enables the assessment of model response under more extreme flood conditions beyond the primary shallow-inundation framework.
The results are shown in Figure A1, which presents the variation of average structural damage severity as a function of projected changes in extreme precipitation () and the sensitivity parameter .
Compared to the capped analysis, the supplementary sensitivity analysis exhibits a stronger sensitivity response to changes in . This behavior reflects the nonlinear nature of the depth–damage relationship, where damage increases more rapidly at higher water depths.
These results indicate that the proposed framework is not limited to shallow flood conditions, but can represent a wider range of hazard intensities. At the same time, the comparison highlights the importance of depth constraints when analyzing specific real-world events within the shallow-inundation regime.
Figure A1.
Climate-adjusted sensitivity response under extended proxy-depth conditions. The figure shows average ICPR-derived structural damage severity as a function of projected changes in extreme precipitation () for different values of the sensitivity parameter , without applying the upper proxy-depth constraint.
References
- Tomczyk, P.; Wiatkowski, M.; Kasperek, R.; Gruss, Ł.; Pokładek, R. Floods as a Consequence of Climate Change: Comprehensive Meteorological and Hydrological Analysis of the 2024 Flood Course in the Bóbr River Basin (Southwestern Poland). Sustainability 2025, 17, 10640. [Google Scholar] [CrossRef] [Scilit]
- IPCC. Climate Change 2021: The Physical Science Basis; Cambridge University Press: Cambridge, UK, 2021; Available online: https://www.ipcc.ch/report/ar6/wg1/ (accessed on 30 April 2026).
- IPCC. Climate Change 2023: Synthesis Report; IPCC: Geneva, Switzerland, 2023; Available online: https://www.ipcc.ch/report/ar6/syr/ (accessed on 30 April 2026).
- Da Silva, N.A.; Haerter, J.O. Super-Clausius–Clapeyron Scaling of Extreme Precipitation Explained by Shift from Stratiform to Convective Rain Type. Nat. Geosci. 2025, 18, 382–388. [Google Scholar] [CrossRef] [Scilit] [PubMed]
- Cai, Y.; Chen, Z.; Sun, Q.; Du, Y. Global water cycle changes in a warming climate: Projection from CMIP6 multi-model ensemble mean. Atmos. Res. 2026, 336, 108864. [Google Scholar] [CrossRef] [Scilit]
- Zhou, A.; Yuan, C. Global Warming Intensifies Once-in-a-Decade Extreme Precipitation in Summer in China. Atmos. Ocean. Sci. Lett. 2025, 18, 100561. [Google Scholar] [CrossRef] [Scilit]
- Xu, M.; Bravo de Guenni, L.; Córdova, J.R. Climate Change Impacts on Rainfall Intensity–Duration–Frequency Curves in Local Scale Catchments. Environ. Monit. Assess. 2024, 196, 372. [Google Scholar] [CrossRef] [Scilit] [PubMed]
- Switanek, M.; Abermann, J.; Schöner, W.; Anderson, M.L. Leveraging Normalized Data to Improve Point-Scale Estimates of Precipitation–Temperature Scaling Rates. Hydrol. Earth Syst. Sci. 2026, 30, 1719–1734. [Google Scholar] [CrossRef] [Scilit]
- United Nations Department of Economic and Social Affairs (UN DESA). World Urbanization Prospects 2025; United Nations: New York, NY, USA, 2025; Available online: https://www.un.org/development/desa/pd/world-urbanization-prospects-2025 (accessed on 30 April 2026).
- World Bank. Urban Population (% of Total Population). 2024. Available online: https://data.worldbank.org/indicator/SP.URB.TOTL.IN.ZS (accessed on 30 April 2026).
- UN-Habitat. World Cities Report 2024: Cities and Climate Action; UN-Habitat: Nairobi, Kenya, 2024; Available online: https://unhabitat.org/world-cities-report-2024-cities-and-climate-action (accessed on 30 April 2026).
- Merz, B.; Kreibich, H.; Schwarze, R.; Thieken, A. Assessment of Economic Flood Damage. Nat. Hazards Earth Syst. Sci. 2010, 10, 1697–1724. [Google Scholar] [CrossRef] [Scilit]
- Wing, O.E.J.; Pinter, N.; Bates, P.D.; Kousky, C. New Insights into US Flood Vulnerability Revealed from Flood Insurance Big Data. Nat. Commun. 2020, 11, 1444. [Google Scholar] [CrossRef] [Scilit] [PubMed]
- Bertsch, R.; Glenis, V.; Kilsby, C. Building-Level Flood Exposure Analysis Using Hydrodynamic Modelling. Environ. Model. Softw. 2022, 156, 105490. [Google Scholar] [CrossRef] [Scilit]
- Yu, I.; Park, K.; Lee, E.H. Flood Risk Analysis by Building Use in Urban Planning for Disaster Risk Reduction and Climate Change Adaptation. Sustainability 2021, 13, 13006. [Google Scholar] [CrossRef] [Scilit]
- Tabasi, N.; Fereshtehpour, M.; Roghani, B. A Review of Flood Risk Assessment Frameworks and the Development of Hierarchical Structures for Risk Components. Discov. Water 2025, 5, 10. [Google Scholar] [CrossRef] [Scilit]
- GFZ German Research Centre for Geosciences. Flood Loss Model FLEMO for Residential and Commercial Sectors; GFZ German Research Centre for Geosciences: Potsdam, Germany, 2020; Available online: https://www.gfz-potsdam.de (accessed on 30 April 2026).
- International Commission for the Protection of the Rhine (ICPR). Tool and Assessment Method for Determining Flood Risk Evolution or Reduction—Technical Report No. 237; ICPR: Koblenz, Germany, 2016; Available online: https://www.iksr.org (accessed on 30 April 2026).
- Vranić, T.; Popov, S.; Simić, J.; Ralević, N.; Krstanović, L. A Similarity-Based Fuzzy Framework for Flood Damage Assessment Under Data-Scarce Conditions. Mathematics 2026, 14, 760. [Google Scholar] [CrossRef] [Scilit]
- Manfreda, S.; Samela, C. A digital elevation model based method for a rapid estimation of flood inundation depth. J. Flood Risk. Manag. 2019, 12, e12541. [Google Scholar] [CrossRef] [Scilit]
- de Moel, H.; Aerts, J.C.J.H. Effect of uncertainty in land use, damage models and inundation depth on flood damage estimates. Nat. Hazards 2011, 58, 407–425. [Google Scholar] [CrossRef] [Scilit]
- Paprotny, D.; Sebastian, A.; Morales-Nápoles, O.; Jonkman, S.N. Trends in Flood Losses in Europe over the Past 150 Years. Nat. Commun. 2018, 9, 1985. [Google Scholar] [CrossRef] [Scilit] [PubMed]
- Mosavi, A.; Ozturk, P.; Chau, K.-W. Flood Prediction Using Machine Learning Models: Literature Review. Water 2018, 10, 1536. [Google Scholar] [CrossRef] [Scilit]
- Karim, F.; Armin, M.A.; Ahmedt-Aristizabal, D.; Tychsen-Smith, L.; Petersson, L. A Review of Hydrodynamic and Machine Learning Approaches for Flood Inundation Modeling. Water 2023, 15, 566. [Google Scholar] [CrossRef] [Scilit]
- Alfieri, L.; Bisselink, B.; Dottori, F.; Naumann, G.; de Roo, A.; Salamon, P.; Wyser, K.; Feyen, L. Global Projections of River Flood Risk in a Warmer World. Earth’s Future 2017, 5, 171–182. [Google Scholar] [CrossRef] [Scilit]
- Räty, O.; Räisänen, J.; Ylhäisi, J. Evaluation of Delta Change and Bias Correction Methods for Future Daily Precipitation: Intermodel Cross-Validation Using ENSEMBLES Simulations. Clim. Dyn. 2014, 42, 2287–2303. [Google Scholar] [CrossRef] [Scilit]
- Slater, L.; Coxon, G.; Brunner, M.; McMillan, H.; Yu, L.; Zheng, Y.; Khouakhi, A.; Moulds, S.; Berghuijs, W. Spatial Sensitivity of River Flooding to Changes in Climate and Land Cover through Explainable AI. Earth’s Future 2024, 12, e2023EF004035. [Google Scholar] [CrossRef] [Scilit]
- Bates, P.D.; Savage, J.; Wing, O.; Quinn, N.; Sampson, C.; Neal, J.; Smith, A. A Climate-Conditioned Catastrophe Risk Model for UK Flooding. Nat. Hazards Earth Syst. Sci. 2023, 23, 891–908. [Google Scholar] [CrossRef] [Scilit]
- Government of the Socialist Federal Republic of Yugoslavia. Instruction on the Unified Methodology for Damage Assessment from Natural Disasters; Official Gazette of the SFRY, No. 27/87: Belgrade, Yugoslavia, 1987.
- European Space Agency. Copernicus Global Digital Elevation Model. Distributed by OpenTopography. 2024. Available online: https://portal.opentopography.org (accessed on 30 April 2026).
- OpenStreetMap Contributors. OpenStreetMap; OpenStreetMap Foundation: Cambridge, UK, 2024; Available online: https://www.openstreetmap.org (accessed on 30 April 2026).
- Ministry of Environmental Protection of the Republic of Serbia; United Nations Development Programme (UNDP). Digital Climate Atlas of Serbia. Available online: https://atlas-klime.eko.gov.rs (accessed on 30 April 2026).
- Anderson, B.J.; Brunner, M.I.; Slater, L.J.; Dadson, S.J. Elasticity Curves Describe Streamflow Sensitivity to Precipitation across the Entire Flow Distribution. Hydrol. Earth Syst. Sci. 2024, 28, 1567–1583. [Google Scholar] [CrossRef] [Scilit]
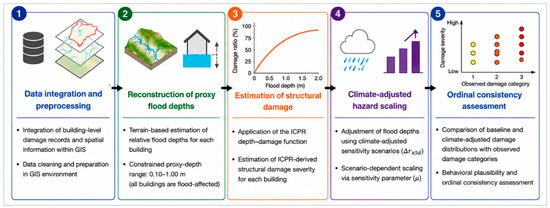
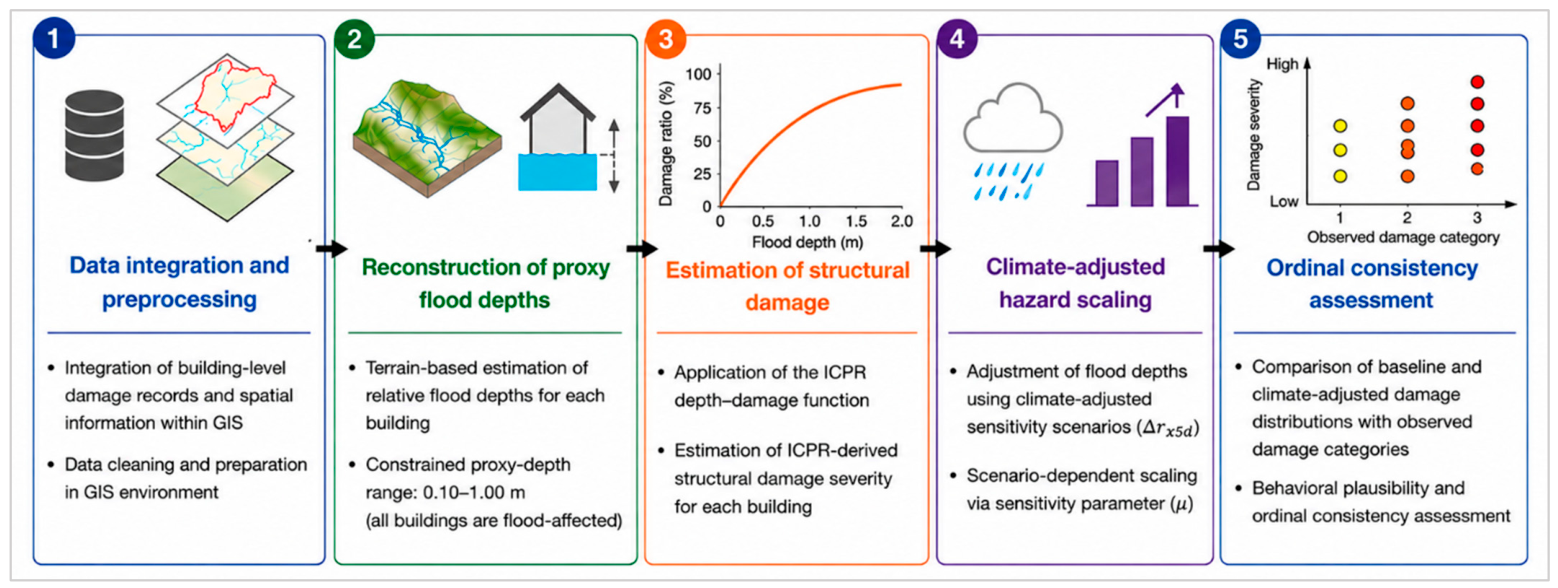
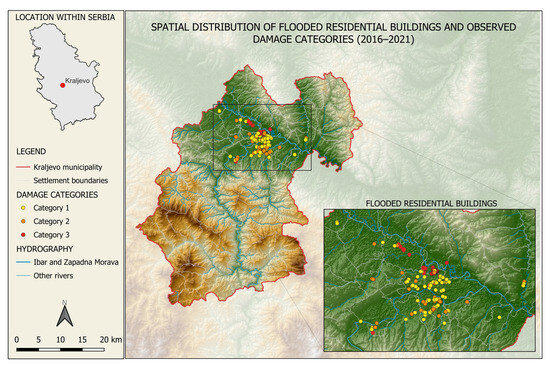
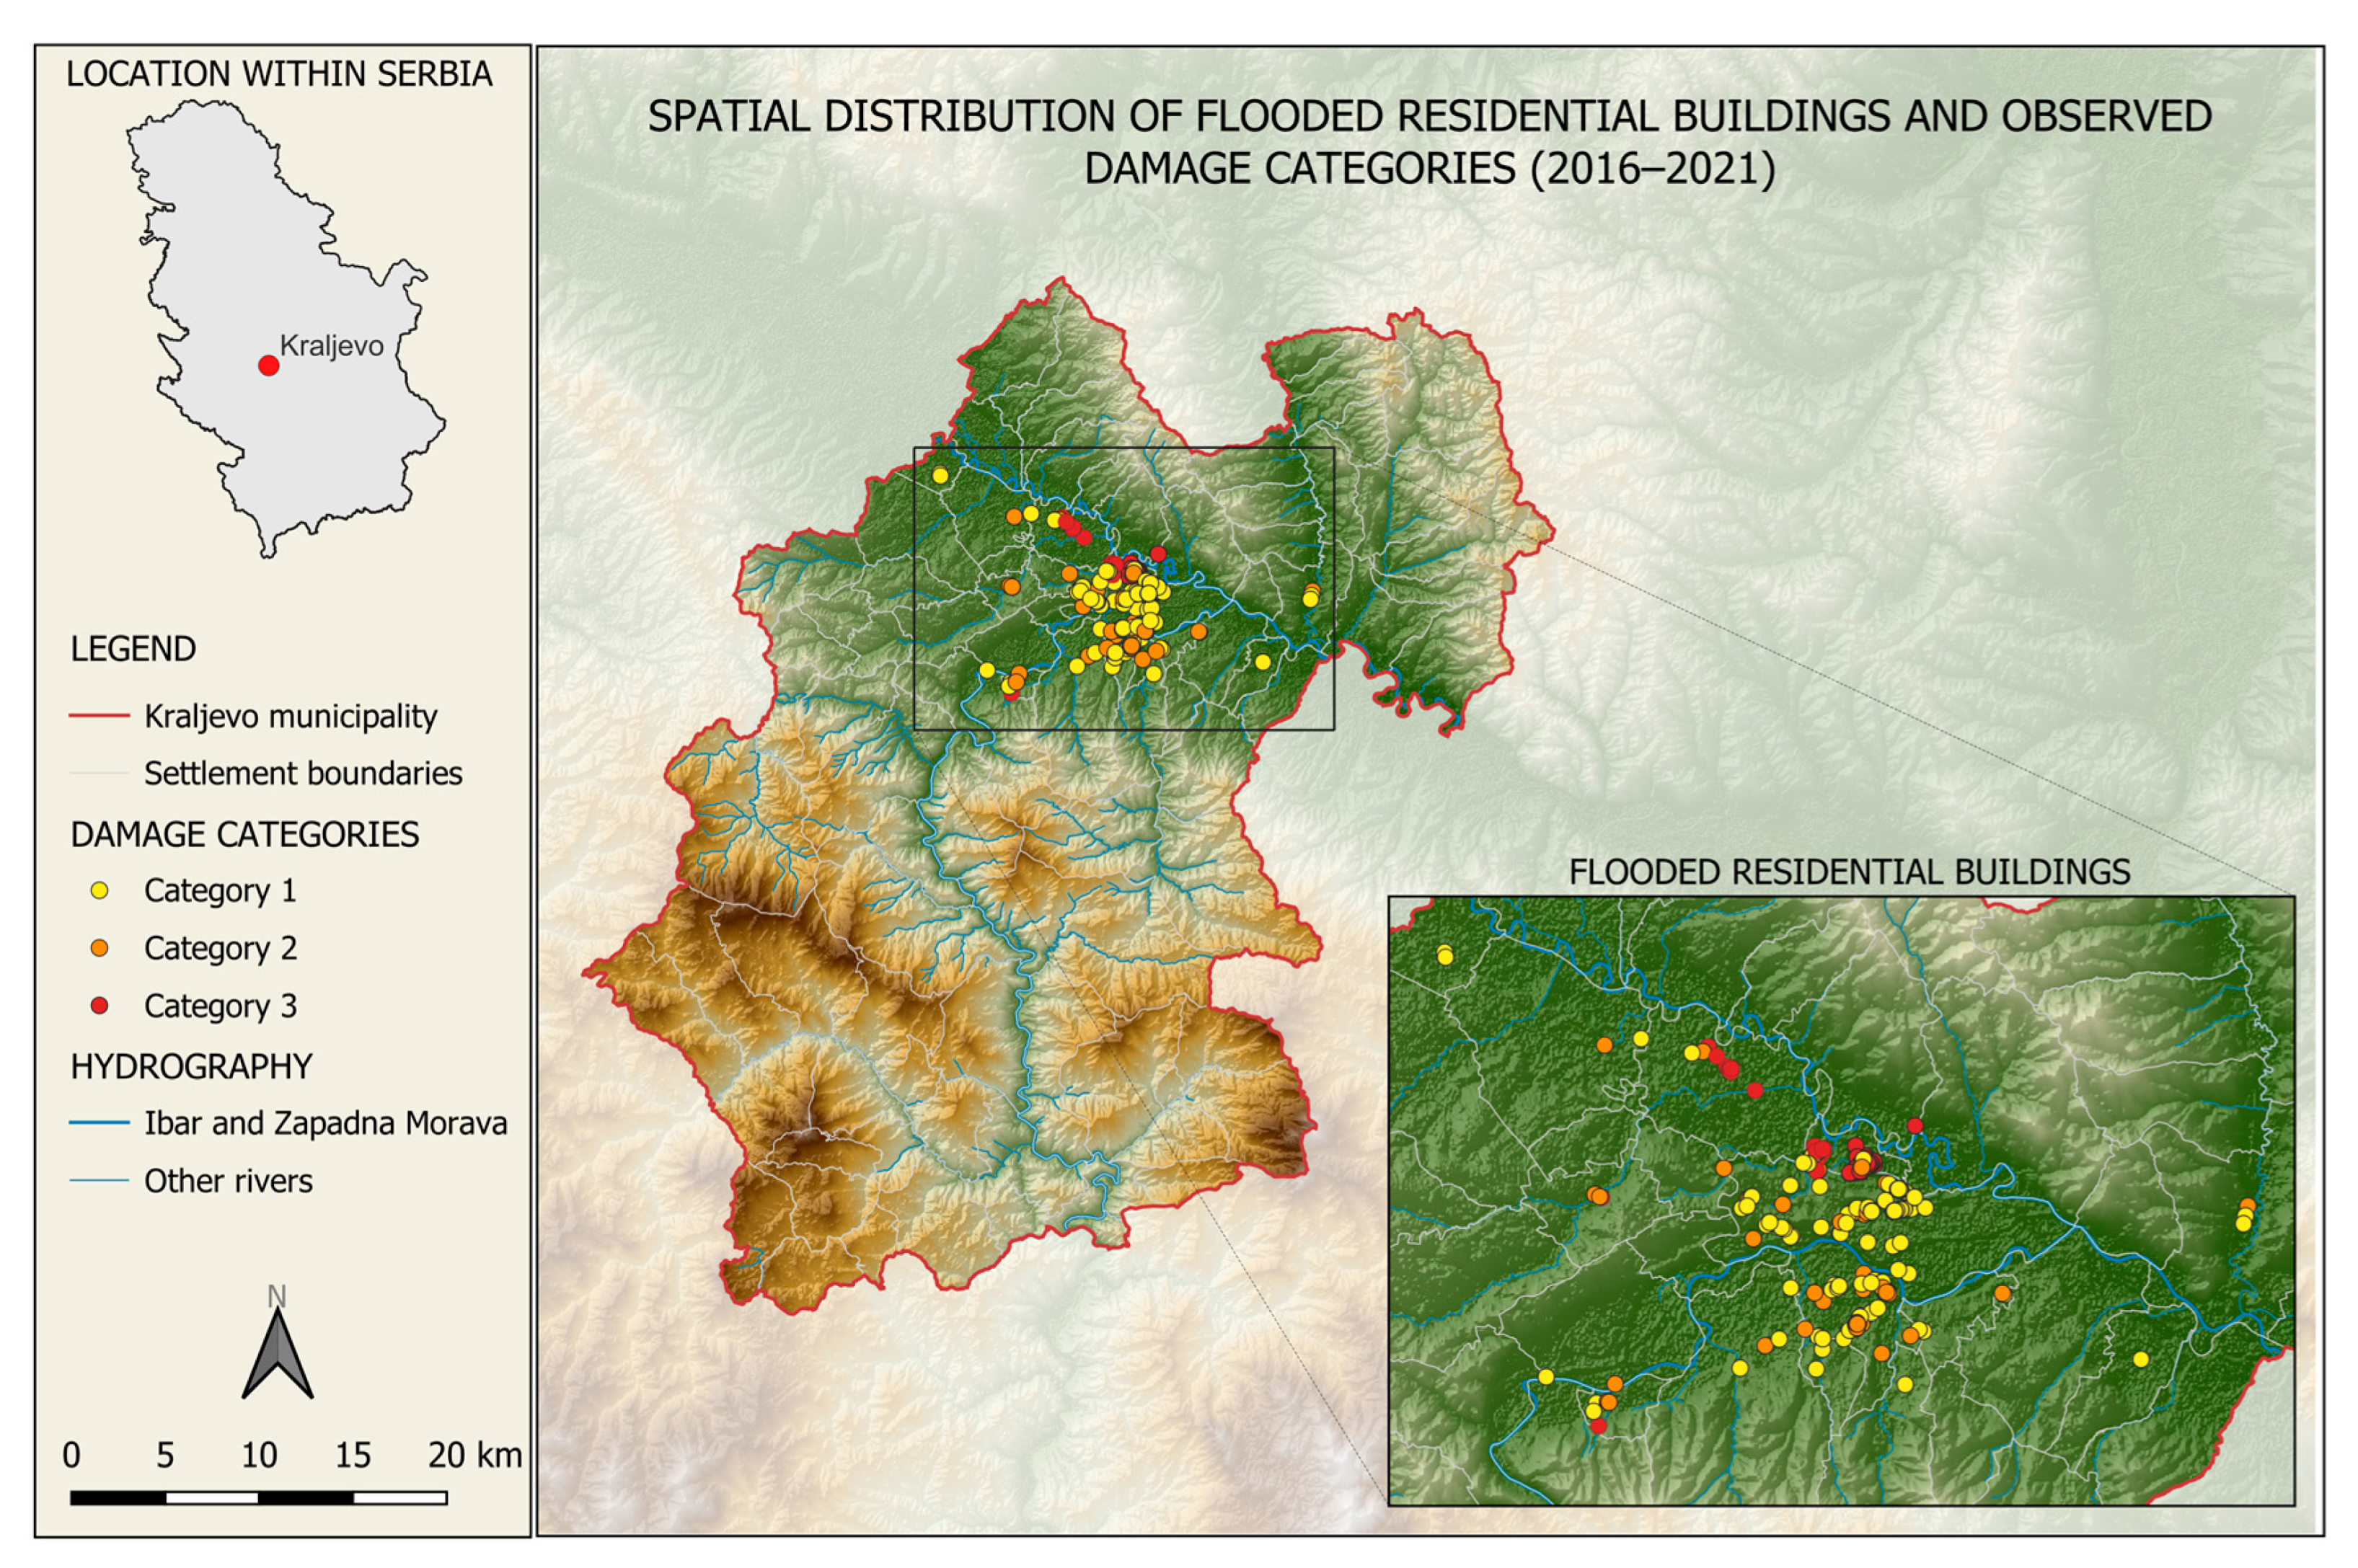
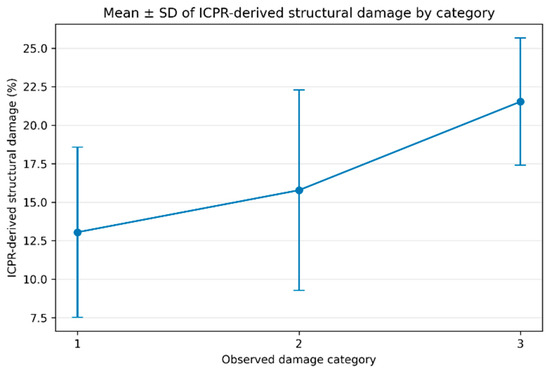
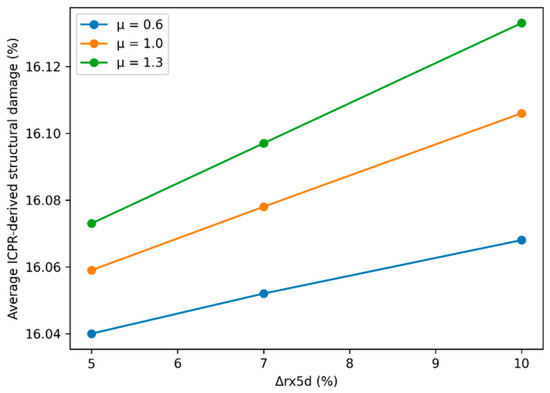
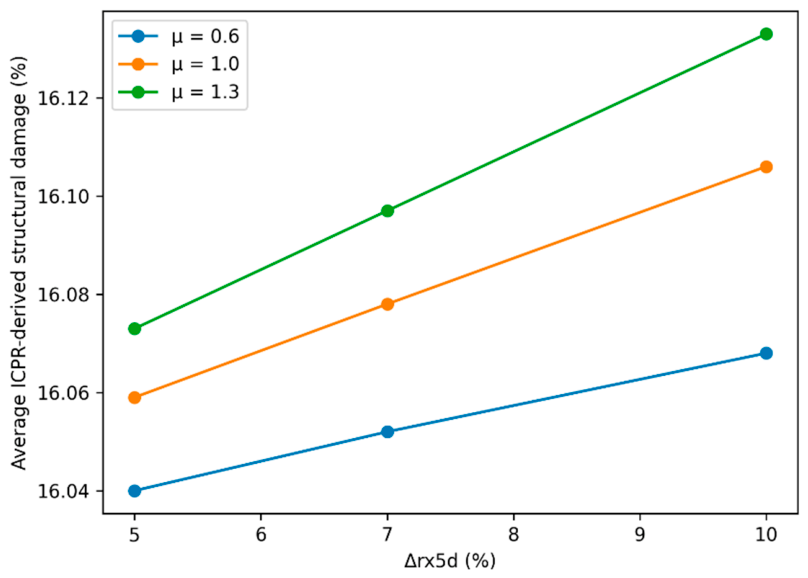

Disclaimer/Publisher’s Note: The statements, opinions and data contained in all publications are solely those of the individual author(s) and contributor(s) and not of MDPI and/or the editor(s). MDPI and/or the editor(s) disclaim responsibility for any injury to people or property resulting from any ideas, methods, instructions or products referred to in the content. |
© 2026 by the authors. Licensee MDPI, Basel, Switzerland. This article is an open access article distributed under the terms and conditions of the Creative Commons Attribution (CC BY) license.