


Abstract
Extreme heatwaves threaten public health and economies. Using multi-source data from 1964–2023 and the Excess Heat Factor (EHF), we identified heatwaves and, with a generalized linear mixed model and Hurst-based intensity forecasting, assessed drivers and future trends across Belt and Road Initiative (BRI) regions. (1) Duration, frequency, and the number of events increased by 18.7 days, 21.2 days, and 5.5 events, respectively. During the 2004–2023 period, HWD, HWF, and HWN accelerated, expanding from South Asia/Middle East to Central Asia, the Caucasus, and North Asia. In 1994–2023, centroids shifted west/south: frequency 2.54° W, 1.83° S; and intensity 1.17° W, 2.79° S. (2) Between 2000 and 2019, interaction effects exceeded single effects; dominant drivers shifted from SPEI and wind speed to shortwave radiation and NDVI. (3) Future intensification peaks in East Asia, the Iranian Plateau, and China’s east coast; with H ≥ 0.7, enhanced areas exceed 33% (max 37%), concentrated in Central and western West Asia.
1. Introduction
According to the “State of the Global Climate 2021” released by the World Meteorological Organization (WMO), the global average surface temperature in 2021 was 1.11 °C higher than the pre-industrial level (the average from 1850 to 1900). Over the past 20 years (2002–2021), the global average surface temperature was 1.01 °C higher than the pre-industrial level. Current policies indicate that global warming will reach approximately 2 °C by 2050 and nearly 3 °C by the end of this century [1]. The severity of global land droughts is on the rise [2], and due to global warming, the annual number of days with extreme surface heat conditions over the oceans has increased threefold [3]. Climate change has increased the probability and magnitude of heatwaves [4]. Against the backdrop of increasingly severe climate warming, the intensity, frequency and duration of heatwaves are all on the rise, and this trend is expected to worsen further [5]. In addition to intensifying droughts, affecting food production and triggering natural disasters [6,7], it also poses a threat to human health, increasing the incidence of cardiovascular and cerebrovascular diseases as well as respiratory diseases, while adding to psychological burdens and anxiety [8]. Furthermore, it induces negative emotions and raises the suicide rate [9,10]. Climate warming has made extreme hot and humid events more frequent, and the harm of humid heatwaves to human and animal health is increasing day by day [11]. Under the combined effects of future temperature and humidity changes, the intensity and frequency of heatwaves in most regions along the Belt and Road are expected to increase to varying degrees [12]. Continuous climate change will also depress total factor productivity in tropical regions, thereby triggering a decline in exports and an increase in food prices [13]. Meanwhile, climate change caused by human activities is increasing the probability of extreme climate-driven fire years in global forest areas [14]. Under the combined effect of climate change and extreme events, the contradiction between supply and demand in the power system has become more prominent, electricity costs have risen, and residents’ energy use and daily life have been impacted [15], The losses caused by extreme weather events due to climate change amount to 143 billion US dollars every year [16]. Overall, this situation poses a threat to human survival, social and economic development, water resource security and the ecological environment, and is a severe meteorological disaster [17,18]. Therefore, heatwaves have become one of the hot issues in the research of climate change and meteorological disasters. Based on the above scientific understanding and impact assessment, systematic responses at the policy and governance levels are particularly crucial. Countries along the routes should adopt heat-health action plans as a regular practice, establish a closed loop of “graded early warning-medical response-public communication”, and connect with the “Early Warnings for All” (EW4All) initiative to enhance the coverage and operability of high-temperature early warnings.
Multiple studies have revealed the spatiotemporal variation trends of heatwave events at global and regional scales. Global-scale research shows that over the past century, the frequency, duration and intensity of global heatwaves have all significantly increased [19], From 1981 to 2021, extreme heatwaves worldwide have generally intensified in a fluctuating manner. Between 2002 and 2021, the number of extreme heatwave events, their frequency and duration were most prominent in Europe, northern and southern Africa, southern North America, eastern South America and eastern Australia, while the high-value areas of their average cumulative intensity were mainly located in the mid-latitudes [20]. The areas prone to heatwaves based on LST-UHW are mostly located in the warm temperate zone, while those based on NSAT-UHW are mainly distributed in the subtropical zone [21]. In addition, with the increase in greenhouse gas concentrations, the frequency of cross-border migration of heatwaves in tropical regions has significantly increased over the past four decades. Moreover, under a high-emission scenario, it is projected that this process will further accelerate in the 21st century [22]. Meanwhile, there is a clear westward shift in the hotspots [23], and the average latitude position where heatwaves occur shows a consistent and significant migration towards the equator [18]. Most existing studies tend to conduct trend assessments on an annual basis or over multiple years, while few systematically examine the phased evolution patterns throughout history. Conducting analysis on an interannual scale is conducive to revealing the intra-annual fluctuation characteristics of heatwaves, which is of great significance for understanding the evolution mechanism of high-temperature heatwaves and conducting dynamic risk assessment.
The contribution of driving factors varies spatially across different regions. In arid areas, the contribution of PDSI is higher, while in humid areas, the proportion of solar radiation (Srad) is greater. In contrast, relative humidity, wind speed, soil moisture and the Normalized Difference Vegetation Index (NDVI) play relatively weaker roles in arid regions [19]. Research in the Chinese mainland has shown that in Northeast China, the eastern region and the Qinghai–Tibet Plateau, the frequency of heatwaves is mainly driven by urbanization, with its contribution rate reaching 38.9%; while in the central, northern and southern regions, the dominant factor is long-term climate change [24]. Similarly, urbanization has intensified heatwaves in European cities, especially in those with cooler climates and a higher proportion of green spaces, which bear a greater heat load during heatwaves [25]. Furthermore, the atmospheric dynamic mechanism is the main driving factor for the changes in extreme summer heat in Europe in past and future climates [26]. The existing achievements provide crucial support for understanding the driving mechanisms of heatwaves and their regional differences, and also indicate the necessity to systematically identify the interactions among various driving factors. At present, research on the alternation of dominant factors at different time scales and the interaction among multiple factors is still insufficient. By deeply characterizing the temporal features and phased transitions of driving factors based on long-term sequences and quantifying the interaction effects, it is expected to construct a more dynamic and mechanism-based attribution system for heatwaves.
Global and regional predictions generally rely on the output results of climate models such as CMIP6. By constructing heatwave indices, causal analysis methods, and bias correction algorithms, spatial risk assessment and scenario prediction of heatwave events under multiple scenarios have been achieved. The spatial risk level classification and future temperature changes were explored under multiple scenario comparisons [12,27]. Further research has adopted bivariate correction methods and the Copula framework to enhance the simulation accuracy of compound extreme events and explored the changing trends of extreme events driven by future temperature rises [28]. However, there are few reports on the spatial distribution predictions of heatwaves in such predictions, especially no discussions on systematically revealing the spatial migration, intensity evolution, and pattern reconstruction processes of future heatwaves in different regions. If the spatial distribution of heatwaves is further predicted, it will not only help identify future high-risk areas but also provide scientific support for regional differentiated disaster prevention and mitigation strategies.
Therefore, in response to the above issues, this study, based on multi-source meteorological and remote sensing data such as NASA NEX-DCP30, global SPEI, MERRA-2, MOD13A1 V6.1, and ERA5-Land, and using the Google Earth Engine (GEE) platform, adopts the Hurst exponent method to reveal the following objectives: (a) to explore the spatio-temporal distribution characteristics of regional heatwaves and the changes in the spatial center of gravity of the countries along the “Belt and Road” from 1964 to 2023 in ten-year intervals; (b) to evaluate, based on the generalized linear mixed model (GLMM) analysis method, the contributions of multiple driving factors to the risk of heatwaves, and to explore the temporal evolution characteristics of different driving factors, the transformation of single driving factors in different stages, and the interaction effects of multiple factors during the period from 2000 to 2019; (c) to evaluate, based on the Hurst index, the trend characteristics of the regional heatwave time series to determine the possibility of the persistence or reversal of its future changes, to predict the spatial evolution pattern of heatwaves, and to identify potential high-risk areas and their distribution dynamics. The results of this study can provide spatially explicit scientific support for identifying priority heatwave-risk areas, improving heat-health action plans, optimizing graded early-warning systems, and coordinating medical response, public communication, and vulnerable-population protection in BRI countries, thereby supporting a transition from general disaster prevention to more targeted, anticipatory, and region-specific climate adaptation governance.
2. Methods
2.1. Study Area
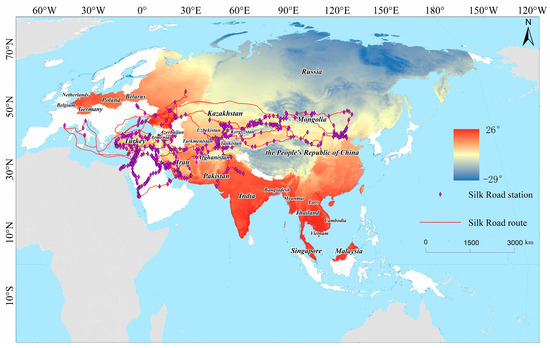
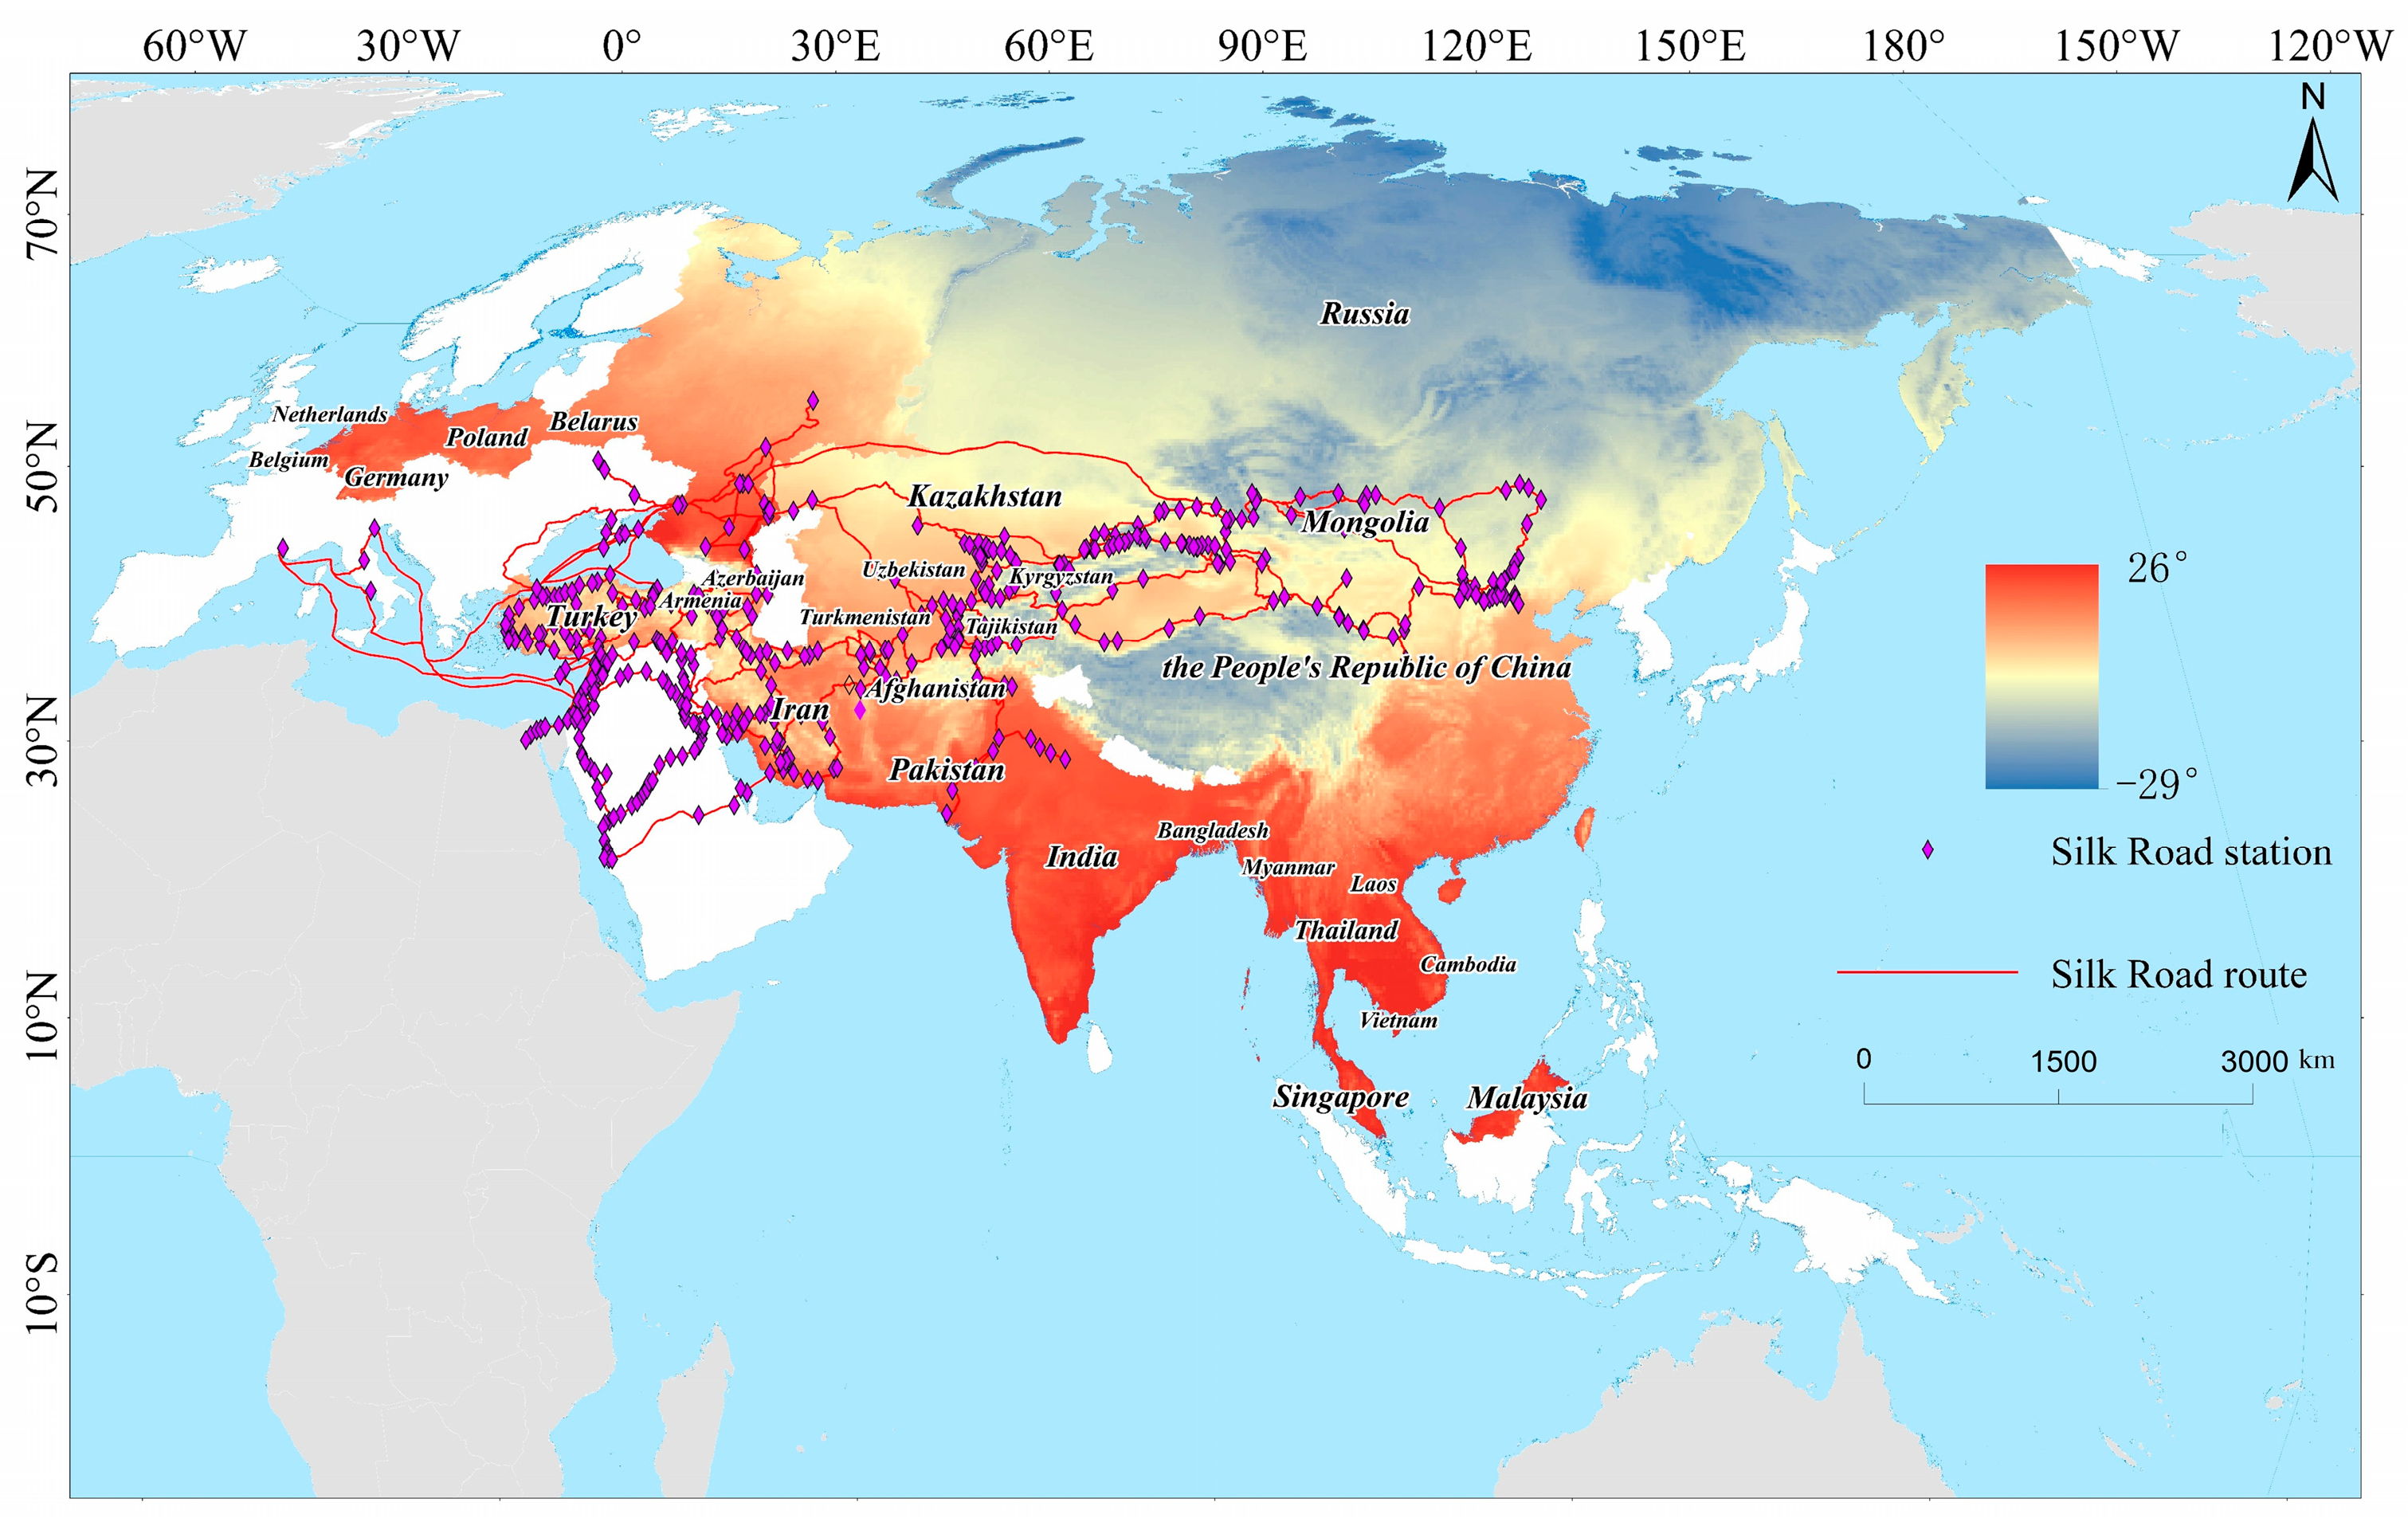
The study area is the land territory of 28 countries along the “Belt and Road” (6° S–56° N, 4° E–121° E), covering East Asia, Southeast Asia, South Asia, Central Asia, West Asia, Northeast Africa and parts of Southern Europe (Figure 1). The region accounts for more than one-third of the global land area and over 60% of the world’s population. The natural geographical conditions in this area are complex and diverse, encompassing various landforms such as plateaus, mountains, plains, and basins. Rivers crisscross the region, but water resources are unevenly distributed. Some areas are confronted with severe seasonal risks of both drought and flood. Overall, the region presents the climatic features of temperate, subtropical and tropical zones. The spatial distribution of precipitation varies significantly, ranging from the monsoon-induced torrential rains in South Asia to the arid and rain-scarce conditions in West Asia and North Africa, with the annual average precipitation ranging from less than 200 mm to over 2000 mm. The surface cover types range from sparse grassland and desert to coexisting forests and farmlands. Biodiversity is particularly rich in some countries in Southeast Asia and Africa, but the ecosystems are sensitive to extreme climate events. In recent years, the temperature in this region has been continuously rising, and climate variability has significantly increased. The frequency and intensity of extreme heatwaves have both been on the rise, especially in countries such as India, Pakistan, Bangladesh, Vietnam and Iran, where climate vulnerability and exposure to health risks are generally high. The region’s intercontinental corridor attribute has shaped the high concentration of population and infrastructure along the route and cross-border connections. Coupled with significant differences in governance baselines and adaptive capacities, this makes it an appropriate subject for conducting comparable assessments and proposing zonal governance suggestions under a unified framework. At the same time, due to the weak economic foundation and limited disaster resistance capacity of urban and rural infrastructure in some countries, this region will face more severe risks of extreme high temperatures and challenges in disaster response under the background of future climate warming.
Figure 1.
Location of the study area.
2.2. Data Sources and Processing
This study comprehensively employs multi-source remote sensing products and meteorological reanalysis data. The basic information of each dataset is presented in Table 1.
Table 1.
Data sources.
Due to the differences in spatial resolution and coordinate systems among various data sources, in this study, all raster data were resampled to a uniform resolution of 5 km × 5 km and spatially aligned using the WGS 84 coordinate system.
2.3. Identifying Heatwaves
Research on heatwaves around the world is becoming increasingly in-depth. The definition standards for heatwaves vary significantly among different countries and regions due to the use of different research methods [33]. To accurately identify and quantify heatwave events, this study adopts the Excess Heat Factor (EHF) as the core indicator, defining a heatwave as a period of at least three consecutive days during which the EHF exceeds zero. Compared with the traditional TX90 and TN90 methods, this indicator can more accurately identify heatwaves with strong persistence, large heat accumulation and higher health risks, and maintains good comparability and robustness in the “Belt and Road” regions with significant climate differences.
This study is based on the daily 2 m air temperature data of ERA5-Land, which is first converted to Celsius as the basic input variable. Based on this, the daily excess heat factor (EHF) was calculated using the sliding time window method (3-day short-term anomaly and 33-day adaptive climate baseline). Further, based on the EHF, heatwave events are identified, and heatwave-related characteristic indicators are calculated at the pixel scale.
First, calculate the average temperature of the current three consecutive days. Then subtract the 95th percentile temperature of the historical period (1964–1993) from the obtained average to get [34]. Next, subtract the average temperature of the previous 30 days from the average temperature of the recent three days to calculate [35]. Finally, multiply by max (1, ) to obtain the value of EHF.
Among them, is the significant component, representing the abnormal heat intensity relative to the local multi-year climate background, and refers to the multi-year climate 95th percentile high-temperature threshold. is the adaptive component, representing the sudden increase in amplitude relative to the recent adaptive baseline of the population.
This calculation method takes into account both the severity of the climatic background of high-temperature events and the stress challenges brought about by short-term temperature fluctuations. It is one of the widely adopted evaluation methods in current heatwave identification. Based on this, this study conducted a statistical analysis of annual heatwave events and extracted four types of heatwave indicators, as shown in Table 2.
Table 2.
Attributes of heatwaves in this research.
In the formula for calculating HWN, N represents the number of independent heatwave events within a year. The criteria for an independent heatwave event are defined as consecutive days of high temperatures lasting for at least 3 days, with an interval of at least 1 day between two events. In the formula for calculating HWD, represents the duration in days of the i-th heatwave event. In the formula for calculating HWF, N represents the total number of days in the study period (365 days), and is a binary variable that takes the value of 1 on the i-th day if the heatwave criteria are met, and 0 otherwise. In the formula for calculating HWM, D represents the duration of a single heatwave in days, indicates the temperature on the d-th day, and is the temperature threshold (EHF).
2.4. Method for Analyzing the Spatial Shift of Heatwave Centers
To reveal the dynamic evolutionary process of the spatio-temporal changes in four types of heatwave indicators along the Belt and Road Initiative regions, the annual spatial gravity center position (geographic centroid) of each indicator was calculated using the weighted average method based on year-by-year heatwave indicator data. This was done to depict the spatial migration direction and trend of the heatwave-affected areas. The formulas are as follows:
Among these, represents the raster pixel value, and () represents the pixel coordinates.
2.5. Attribution Analysis
Shortwave radiation, as the direct energy source for heating the Earth’s surface, is the fundamental condition driving extreme high temperatures. Wind speed directly affects the transmission and diffusion of atmospheric heat and influences the duration of heatwaves. Land-atmosphere coupling is conducive to the intensification of heatwaves and leads to super heatwaves. Therefore, SPEI is a key driving factor for the frequency, duration and onset time of heatwaves [36]. NDVI represents the status of vegetation coverage. Vegetation regulates local temperature through shading and transpiration, serving as an important ecological barrier for land systems to mitigate high temperatures. In arid regions, the combined contribution of six factors (wind speed, solar radiation, PDSI, relative humidity, soil moisture, and NDVI) to heatwave risk is 0.33; the global average is 0.43, while in humid regions, it is as high as 0.85 [19]. Therefore, based on the ecological mechanisms represented in the formation and evolution of heatwaves, SSR, WS, SPEI and NDVI are selected as the main environmental driving factors of heatwaves.
To ensure consistency of the explanatory variables required for attribution analysis across time, this study adopted the period from 2000 to 2019 as a unified analysis timeframe when constructing the GLMM. Therefore, the GLMM attribution results primarily reflect the statistical relationships between vegetation, moisture conditions, meteorological factors, and heatwave changes during 2000–2019. Four types of heatwave indicators were set as response variables, while environmental and climatic factors such as SSR, NDVI, SPEI and WS were selected as covariates. A regression analysis framework was constructed, and the generalized linear mixed model (GLMM) was adopted for fitting and modeling. Its mathematical expression is as follows:
Here, represents the random effect for the j-th spatial sample point id and is the residual.
The explanatory variables were standardized using z-score standardization to eliminate the differences in dimensions. The data format is a spreadsheet file, which includes the year, different points (id), four indicators of heatwaves and four covariates, and the contribution degree of each factor was calculated using the following formula:
2.6. Research Method of the Hurst Exponent
The climate system is highly complex, featuring inherent variability and long-range correlations. The Hurst exponent was specifically designed to analyze sequences of such processes with potential long-term memory, to predict whether there is persistence in the long-term trends of heatwave indicators. The Hurst exponent was calculated for each pixel based on the complete 60-year annual heatwave index sequence from 1964 to 2023, using the R/S analysis with the full annual time series for each pixel. Given that a 60-year record is relatively limited for obtaining highly stable Hurst estimates, this study primarily treats the Hurst exponent as a qualitative indicator characterizing the persistence or anti-persistence trends in heatwave changes. The Hurst exponent uses 0.5 as a critical threshold because when H = 0.5, the sequence approximates a random walk, indicating that past changes have no significant persistent influence on future changes. When H is below 0.5, the sequence shows anti-persistence, indicating that the trend is about to reverse; when H exceeds 0.5, the sequence exhibits persistence, and the trend will continue. However, a Hurst exponent greater than 1 does not indicate an extremely strong trend; instead, it suggests that the data has a non-stationary trend, an insufficient sample size, or an abnormal algorithm fit. This paper represents Hurst exponent values greater than 1 as a separate category in the image. The following are the specific formulas:
where is the mean of the time series. represents the cumulative sum of deviations from the mean of the first k data points. is defined as the maximum fluctuation range of the cumulative deviation sequence. is the standard deviation of the time series. For multiple time window lengths N, repeat the above steps once again to obtain the R/S values corresponding to different N. The so-called slope H is the Hurst exponent.
3. Result
3.1. The Spatio-Temporal Evolution Characteristics of Heatwaves
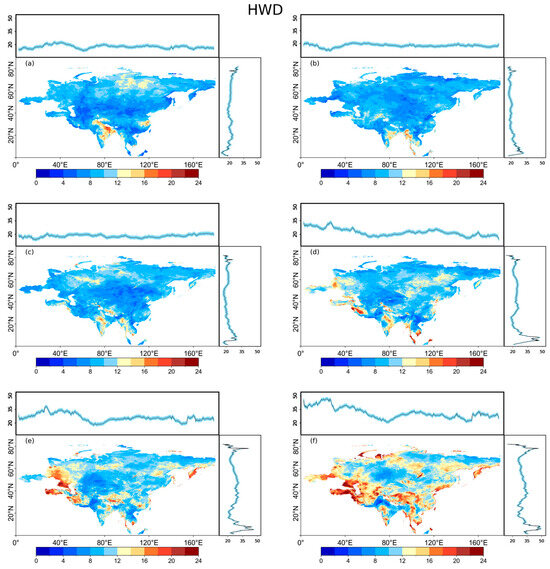
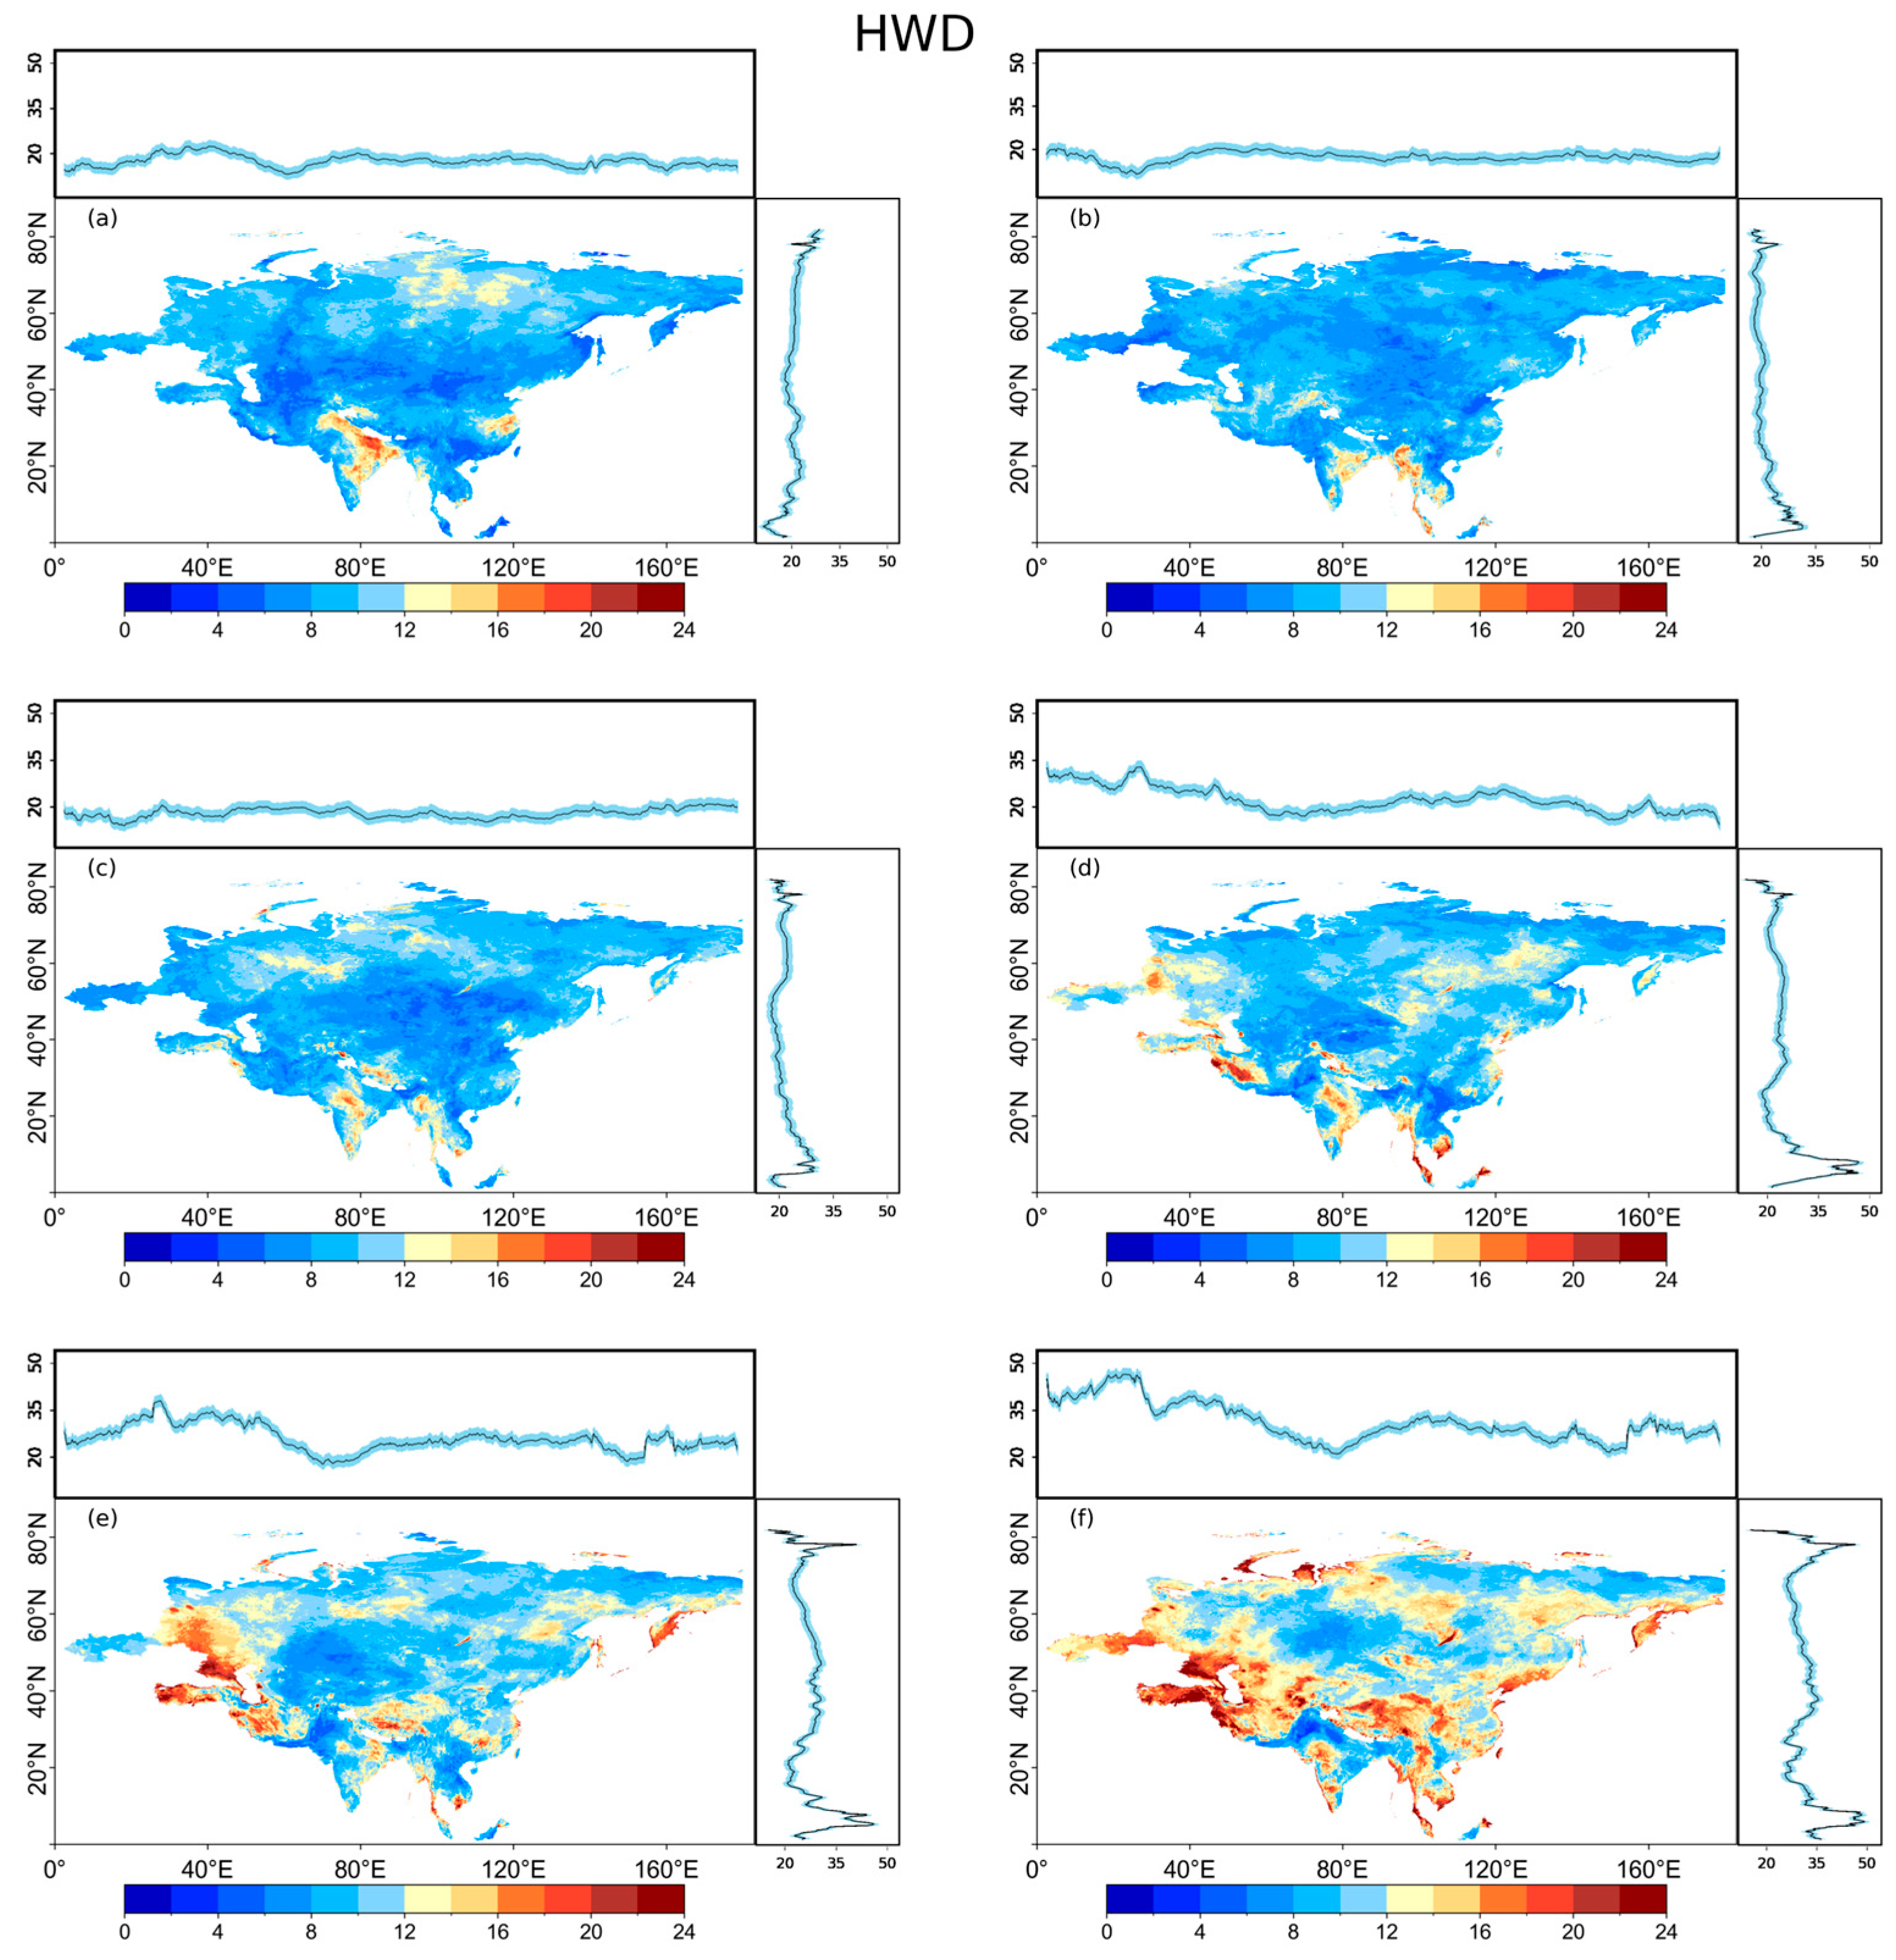
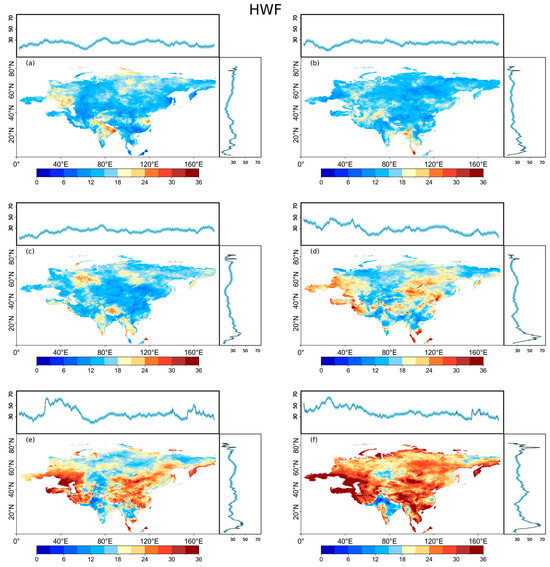
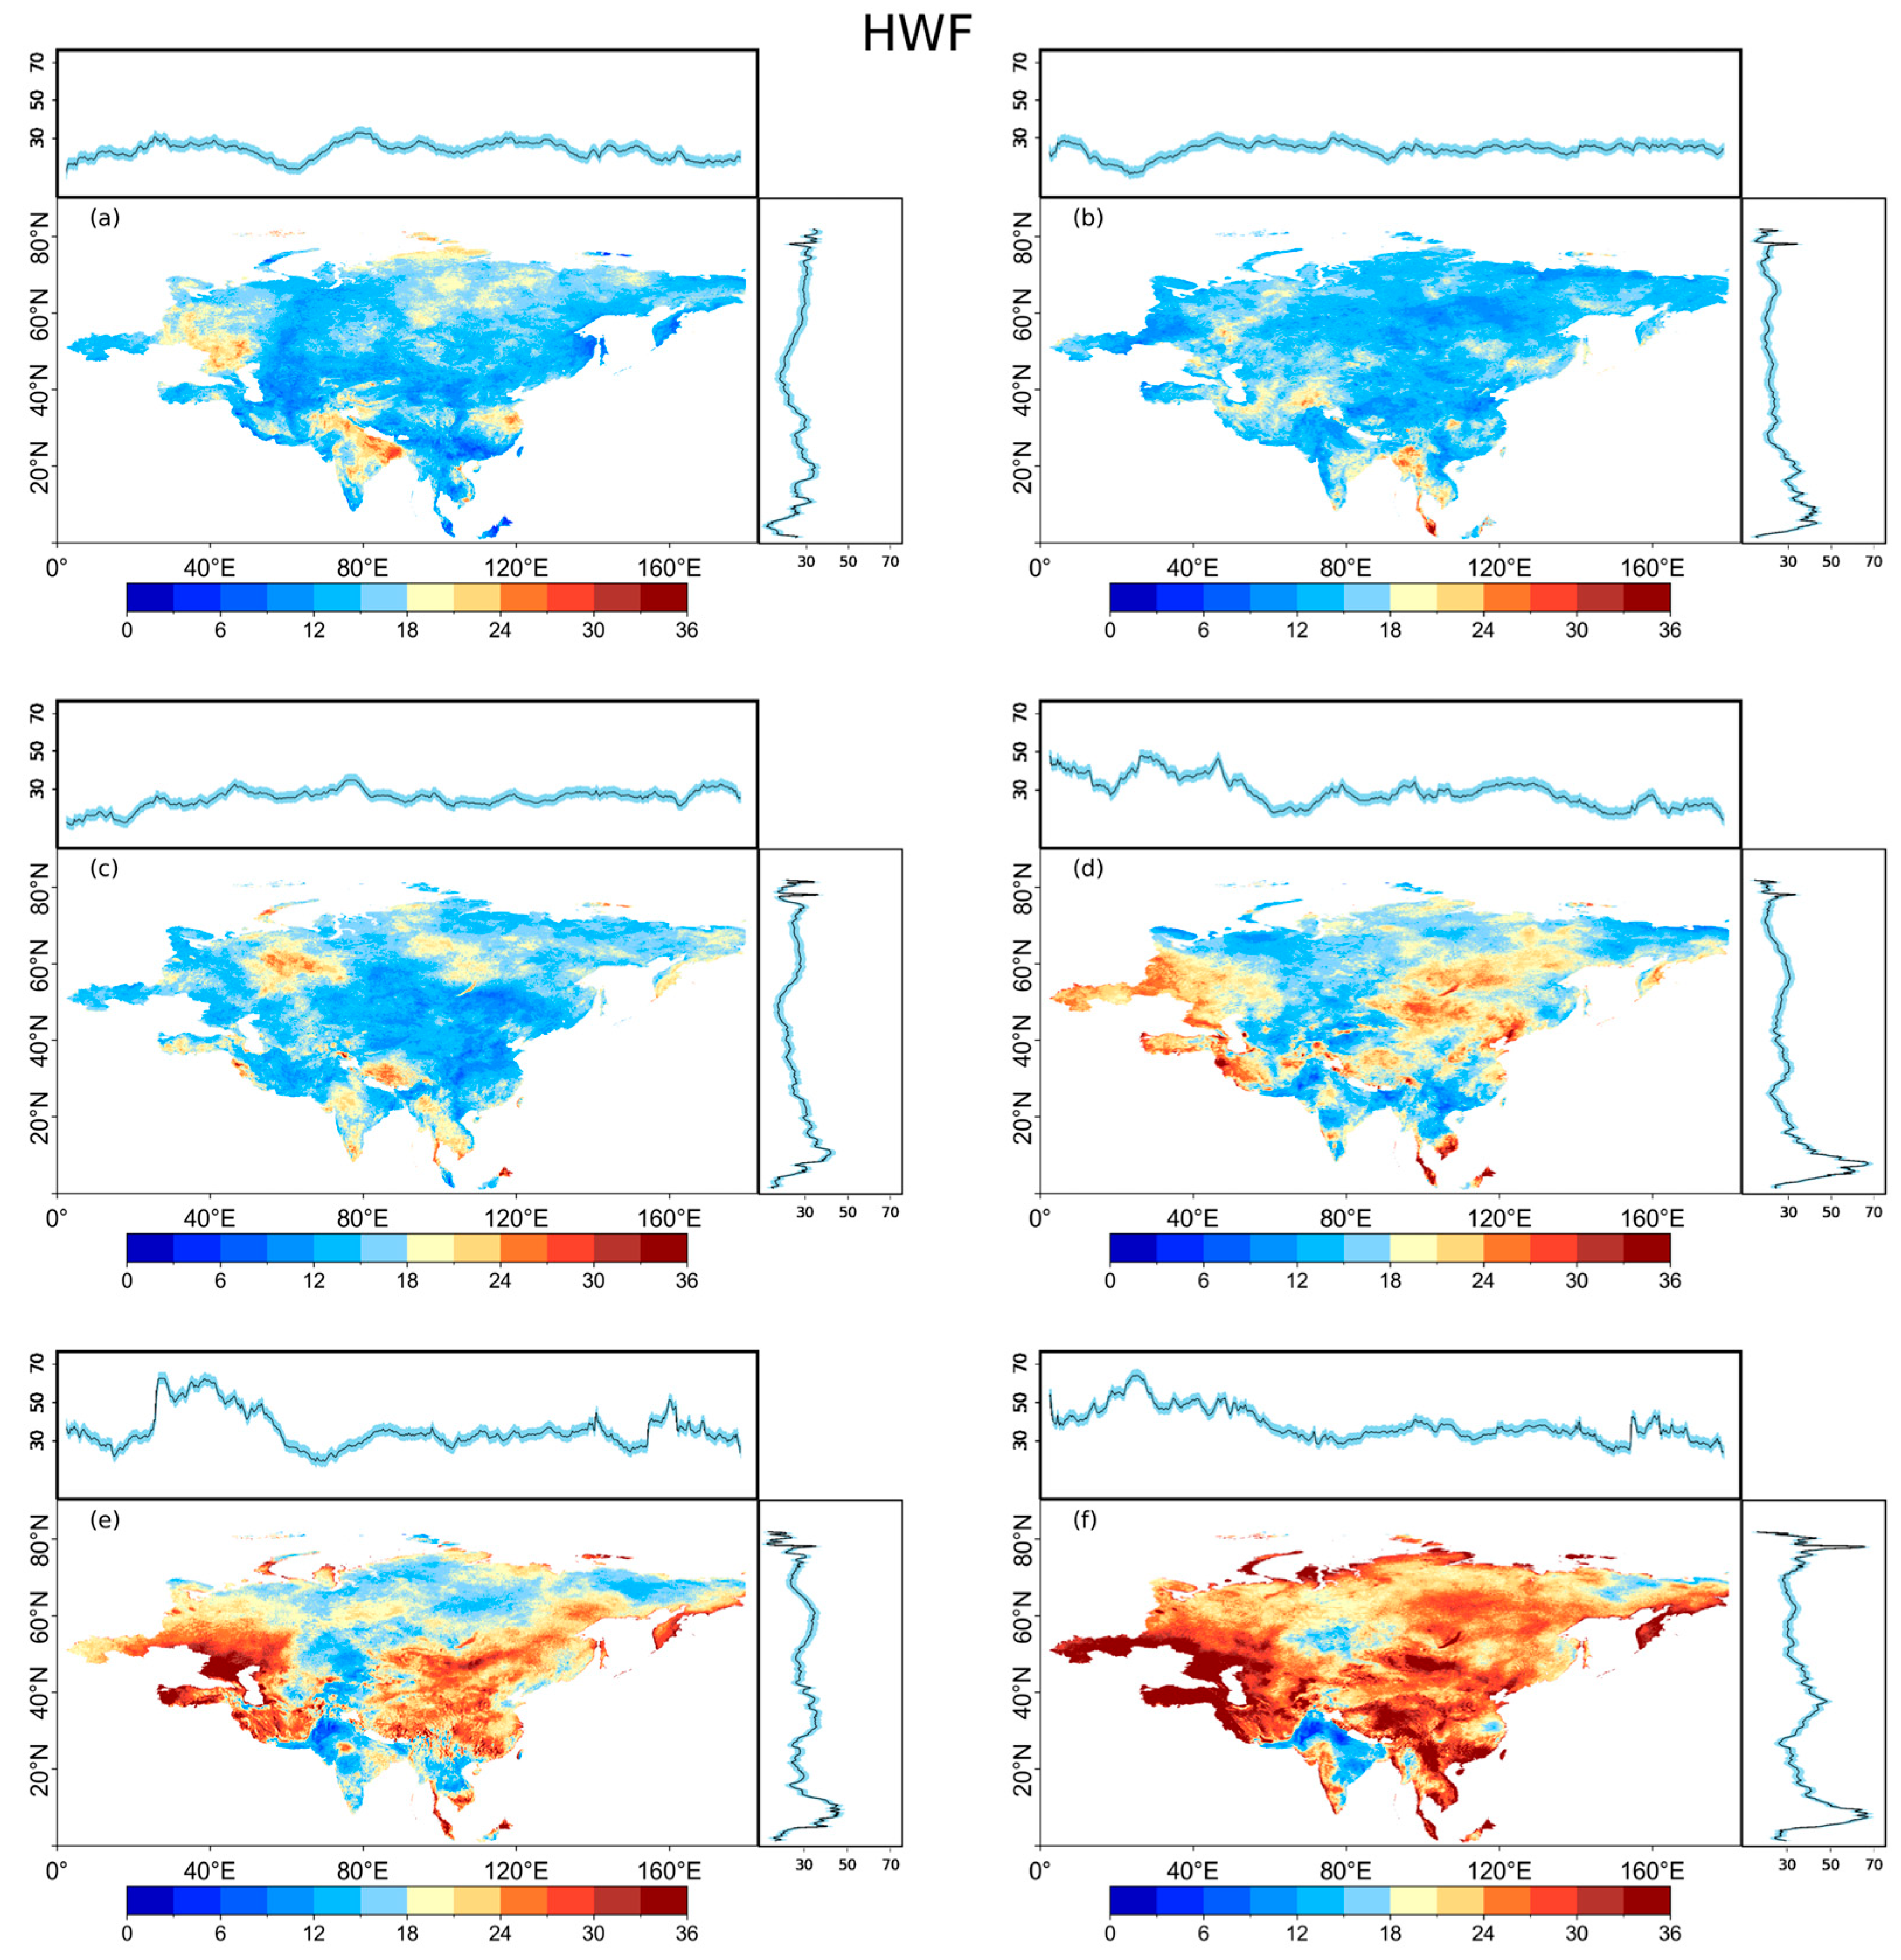
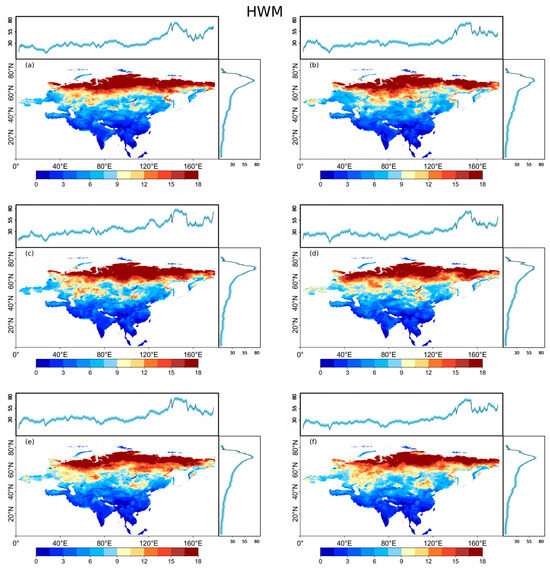
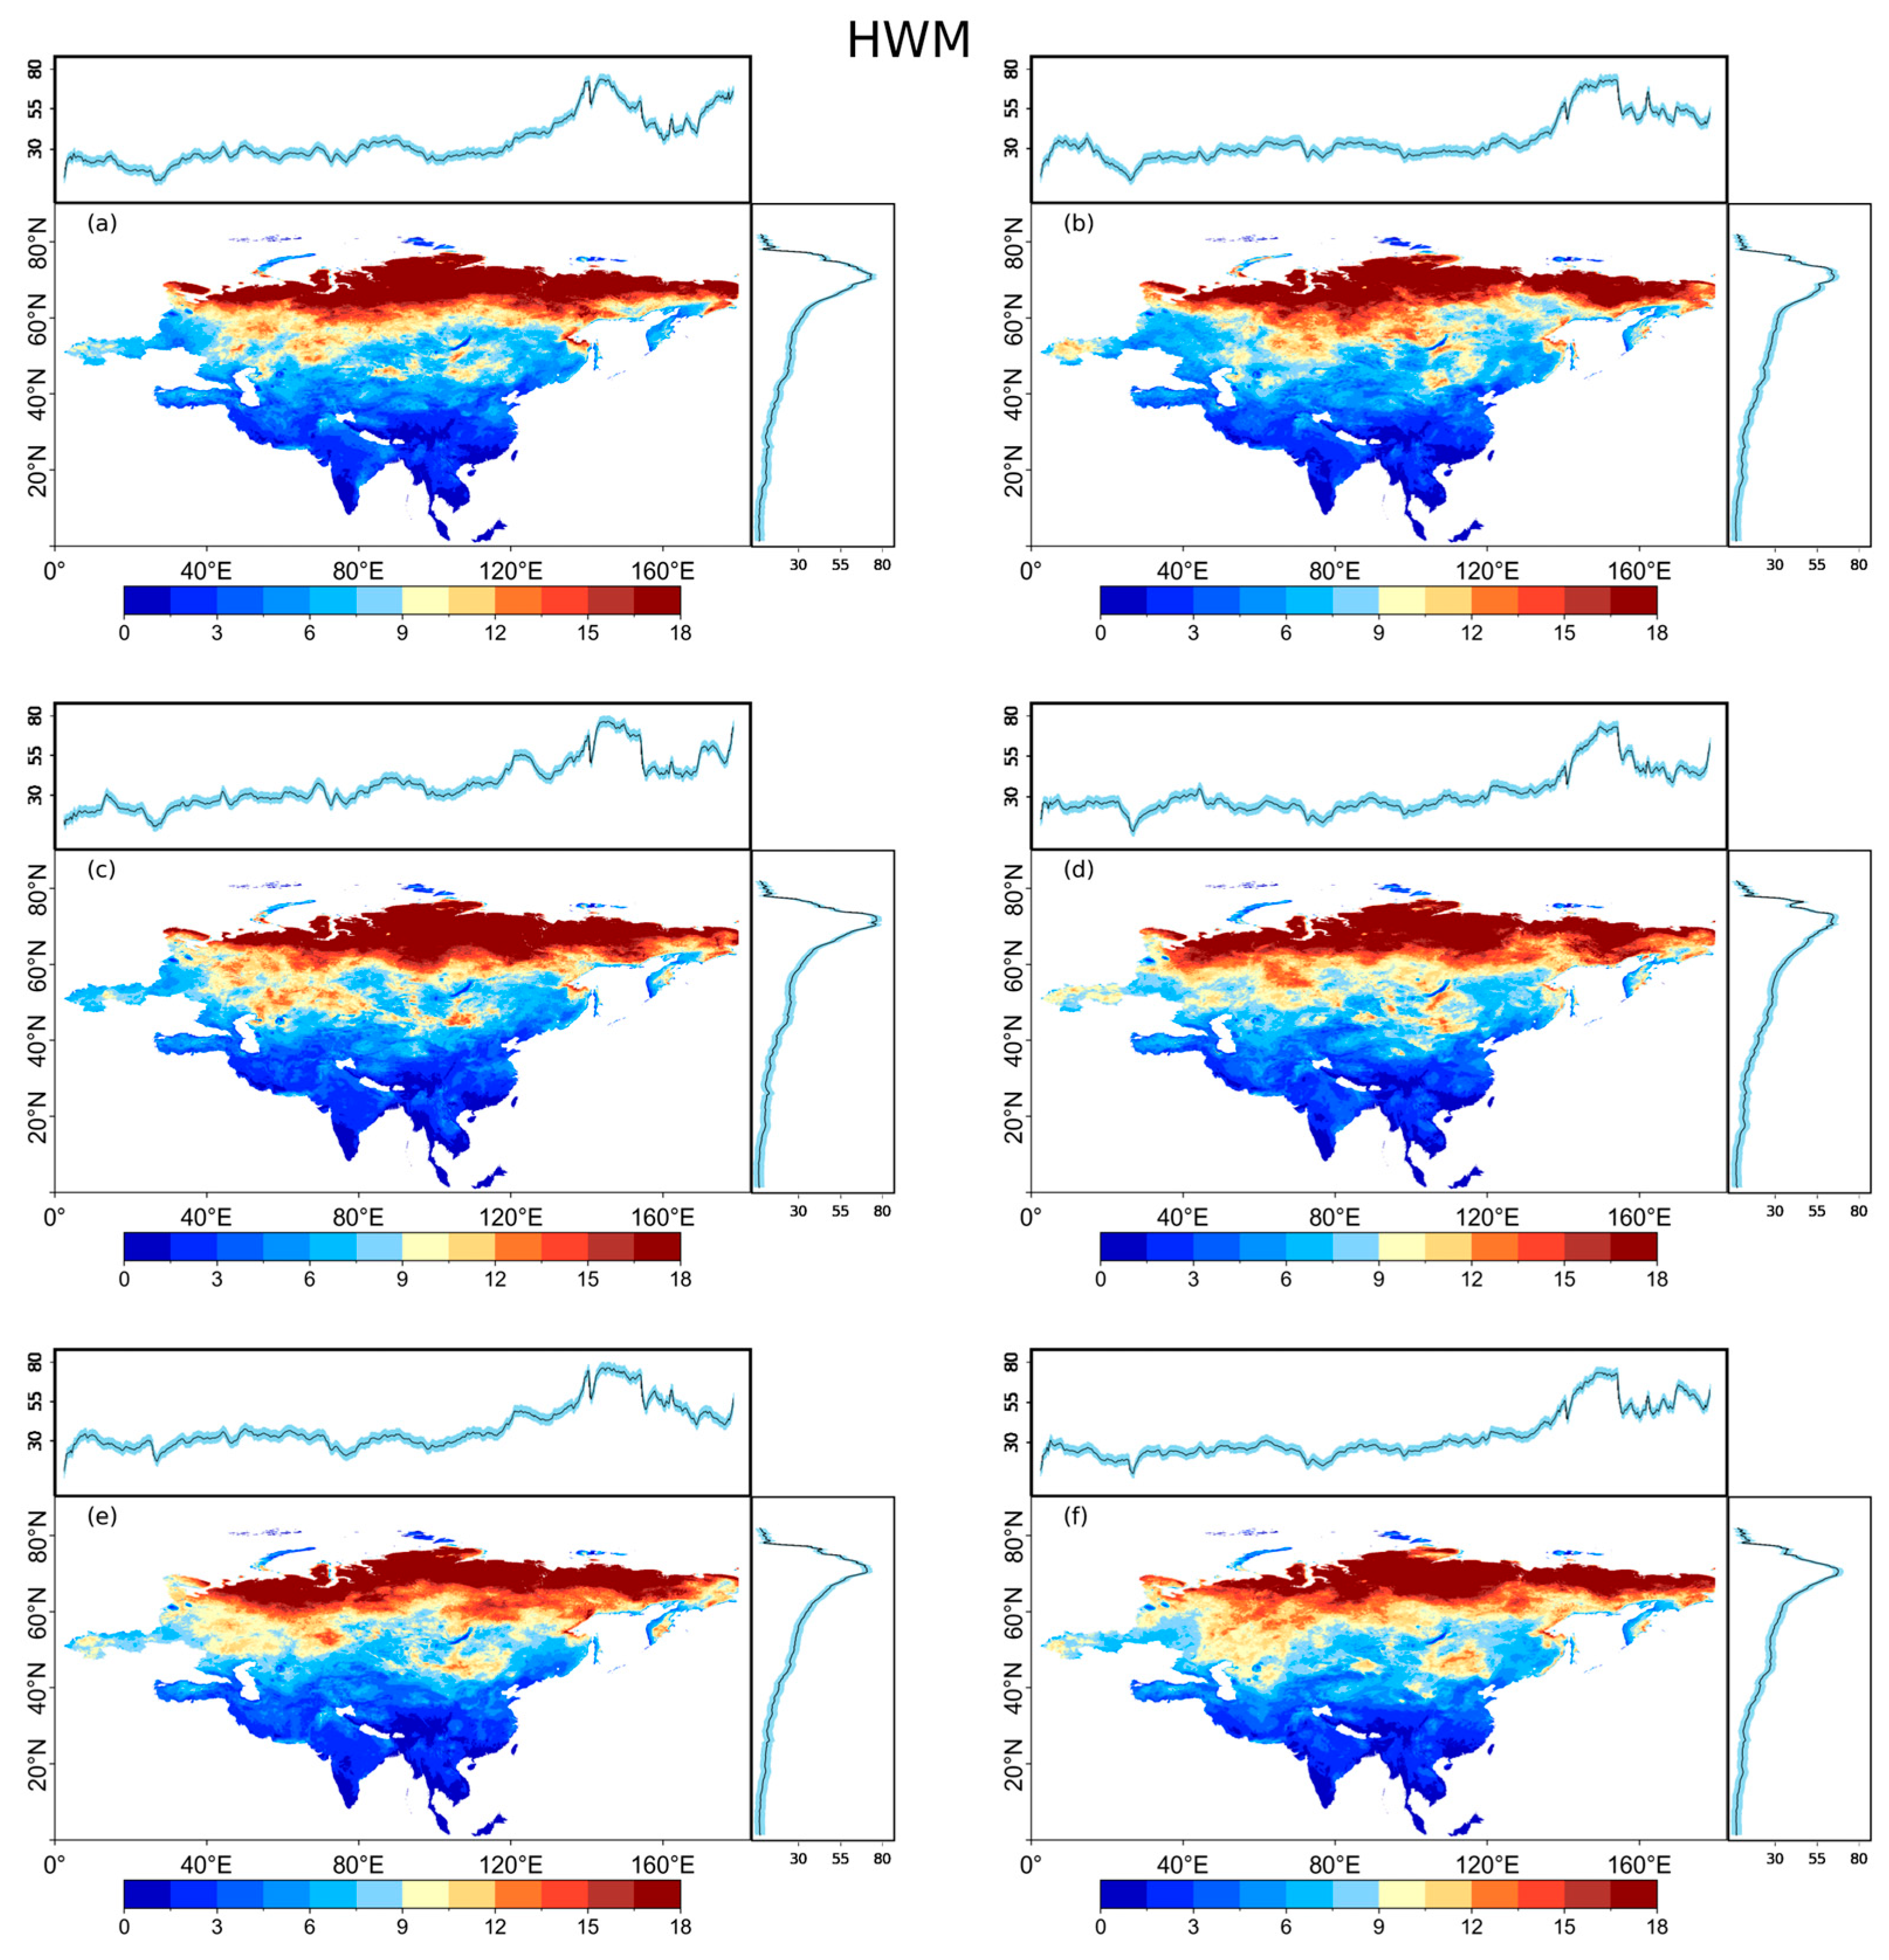
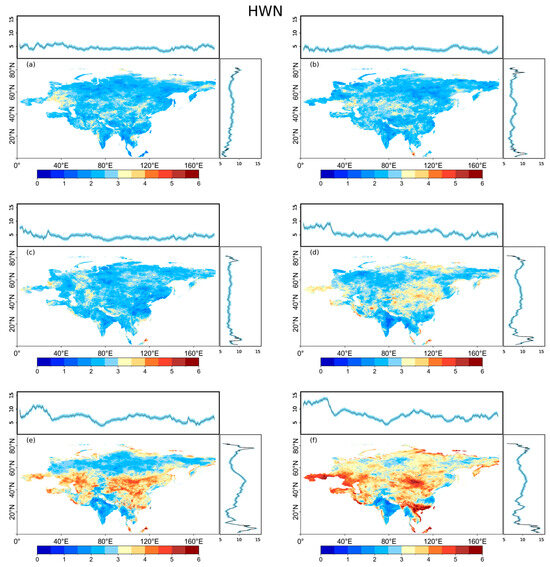
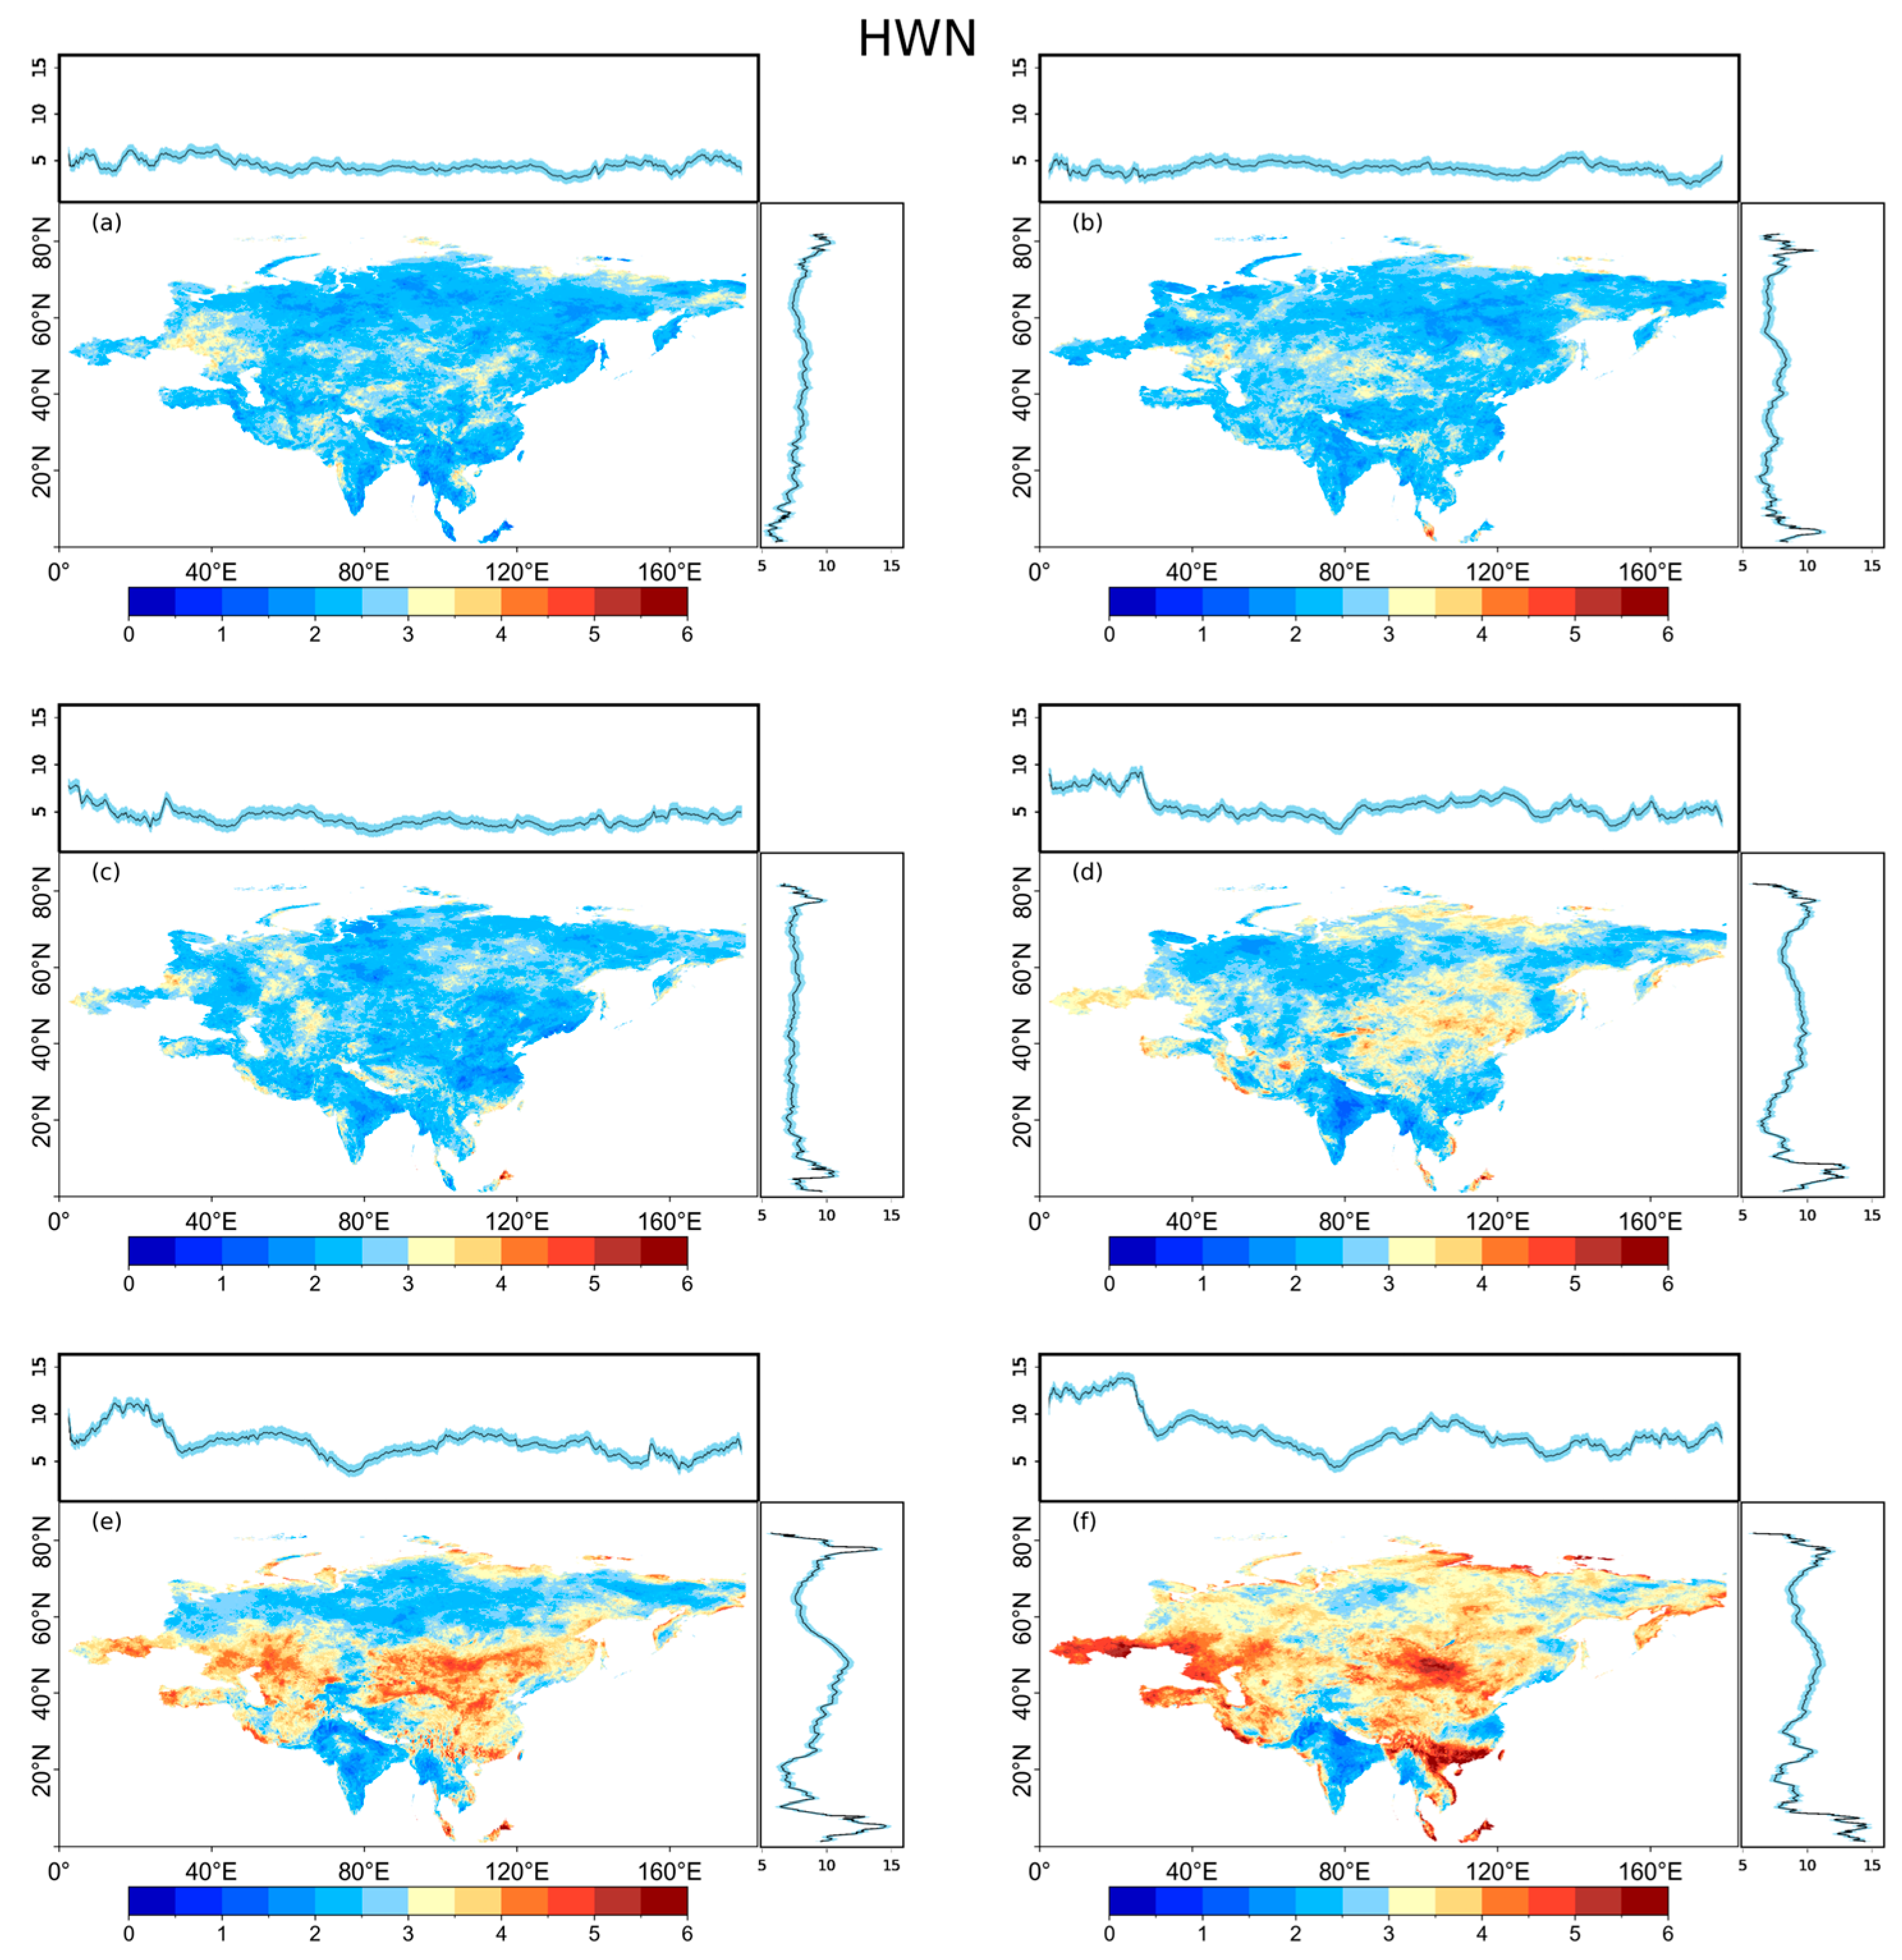
Over the past 60 years, heatwave events in the study area have shown a significant overall intensification and spatial expansion trend. The HWD, HWF and HWN all showed a continuous upward trend and spatially evolved from scattered high-value areas in the early stage to continuous high-value belts (Figure 2 and Figure 3). In contrast, the spatial pattern of HWM has always maintained a relatively stable zonal band structure, with its high values mainly concentrated in the mid-to-high latitudes of 55–75° N, without any obvious spatial migration (Figure 4).
Figure 2.
Decadal spatiotemporal distribution of HWD (days) ((a–f) represent the spatiotemporal distribution of heatwaves during six decades from 1964 to 2023). The line plots on the top and right sides are data statistics, representing the mean values of grid points in the longitudinal and latitudinal directions, respectively.
Figure 3.
Decadal spatiotemporal distribution of HWF (days) ((a–f) represent the spatiotemporal distribution of heatwaves during six decades from 1964 to 2023). The line plots on the top and right sides are data statistics, representing the mean values of grid points in the longitudinal and latitudinal directions, respectively.
Figure 4.
Decadal spatiotemporal distribution of HWM (°C2) ((a–f) represent the spatiotemporal distribution of heatwaves during six decades from 1964 to 2023). The line plots on the top and right sides are data statistics, representing the mean values of grid points in the longitudinal and latitudinal directions, respectively.
At the regional scale, there are significant differences in the changes in heatwave indicators among different regions. The most significant strengthening trend is observed in the region from West Asia to Central Asia (such as the Iranian Plateau and southern Kazakhstan), where the HWF has increased by 13.6 days and the HWD has increased by 6.5 days. In Ukraine and the southwestern regions of Russia, there is a characteristic of simultaneous growth in all three indicators: HWF increased by 19.1 days, HWD increased by 7.4 days, and HWN increased by 1.7 times. In contrast, in the northern part of Siberia and the high-latitude coastal areas of Eurasia located between 65° N and 80° N, the intensity of heatwaves slightly decreased by 2.9 °C2. Below 40 degrees north latitude in the Qinghai–Xizang Plateau and Southeast Asia of China, the upward trend of HWD is almost the same, reaching 0.31 days and 0.40 days per year, respectively. However, in the same location, the upward trend of heatwave frequency is even higher, reaching 0.48 days per year. On this basis, the spatial trends of the frequency and duration of heatwaves are similar, but the increase is more pronounced in the northern part of China and the Mongolian Plateau (Figure 5).
Figure 5.
Decadal spatiotemporal distribution of HWN (Events) ((a–f) represent the spatiotemporal distribution of heatwaves during six decades from 1964 to 2023). The line plots on the top and right sides are data statistics, representing the mean values of grid points in the longitudinal and latitudinal directions, respectively.
In terms of zonal distribution, the increases in HWF and HWD are most significant in the 30–45° N latitude band (HWF increases by 14.3 days and HWD by 6.8 days), while HWM remains consistently in the high-value zone of 55–75° N, demonstrating obvious zonal stability. In terms of zonal distribution, the largest increases in HWF and HWD occur in the 0–50° E region (HWF increases by 17.3 days and HWD by 7.1 days), while the zonal peak of HWM remains stable at 150–180° E, but its increase is relatively small, approximately 1.5 °C2.
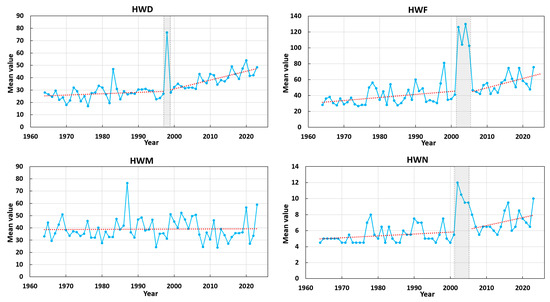
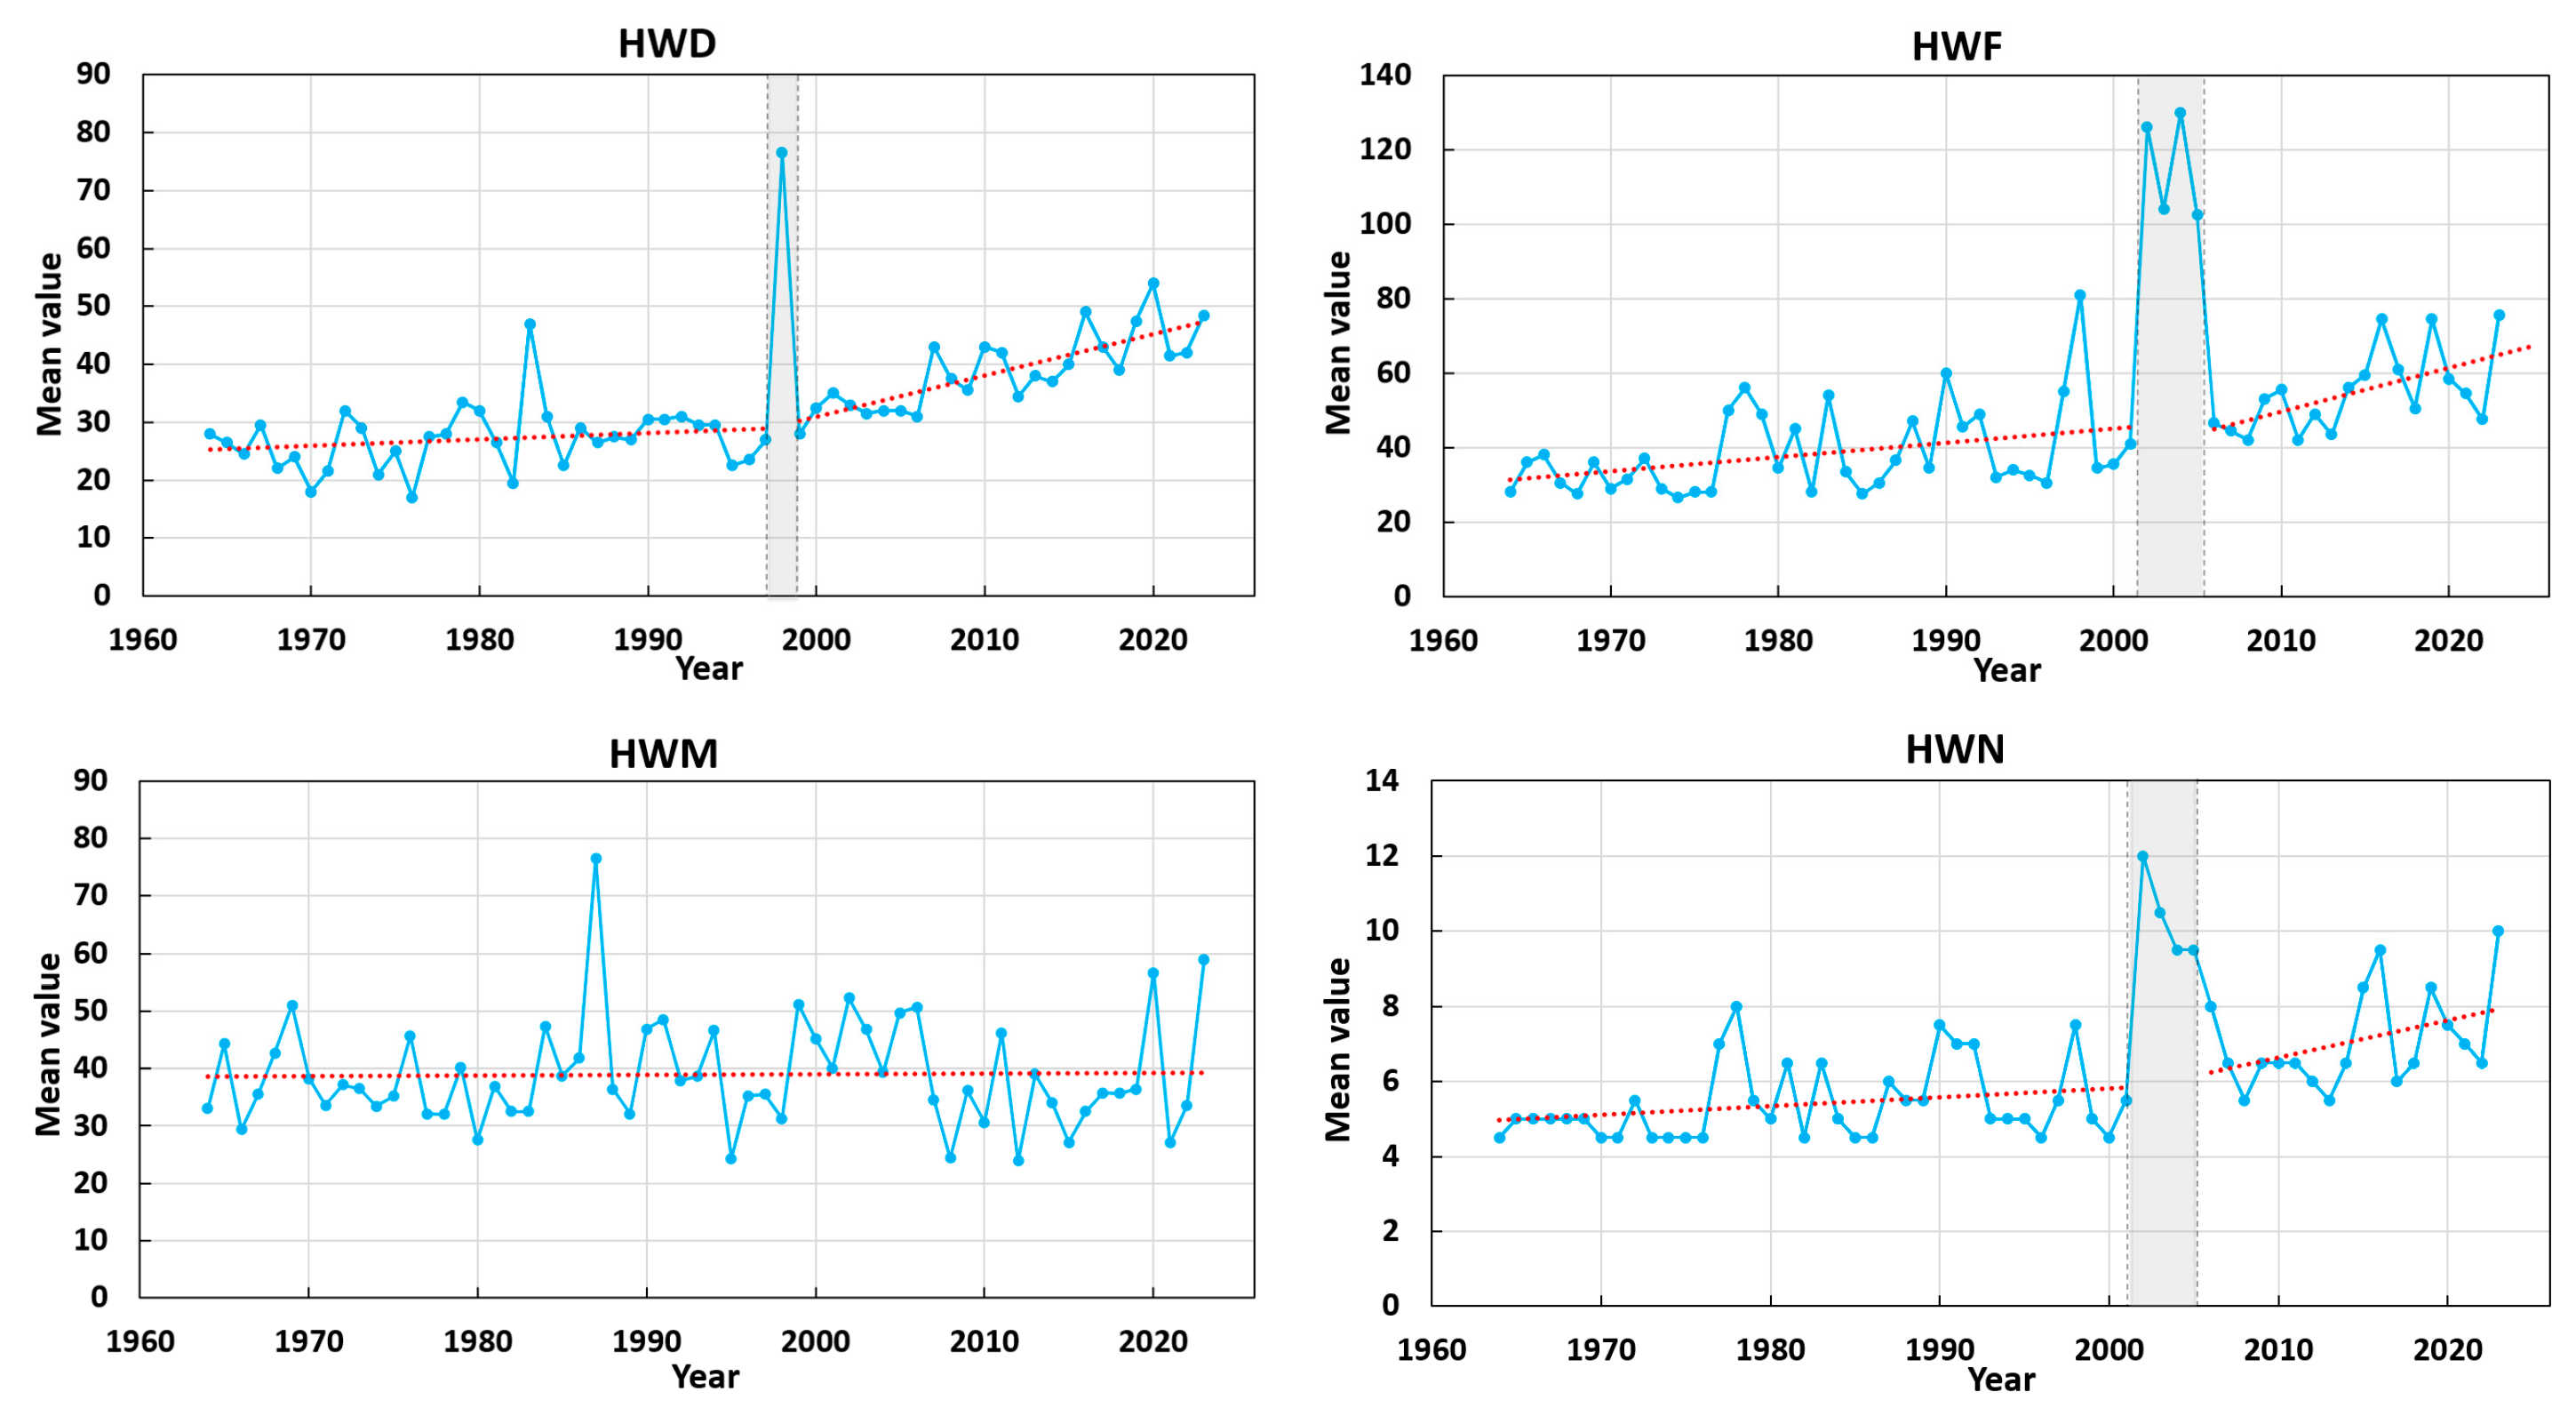
Over the past 20 years (2004–2023), the growth rates of HWD, HWF and HWN have significantly accelerated. The average annual values of the three have entered a steeper upward trajectory since 2004, with growth rates that are 6.4 times, 3.1 times and 4.3 times those of the previous period, respectively. In contrast, HWM has shown no obvious trend of change over the past 60 years and has remained basically stable (Figure 6).
Figure 6.
Interannual line plots of four heatwave indicators (1964–2023). The x-axis represents the year, and the y-axis represents the average value of raster points across the entire study area for the corresponding year. The blue lines with markers indicate the annual mean values, and the red dashed lines represent the corresponding linear fitted trend lines.
3.2. Analysis of the Shift in the Center of Gravity of Heatwaves
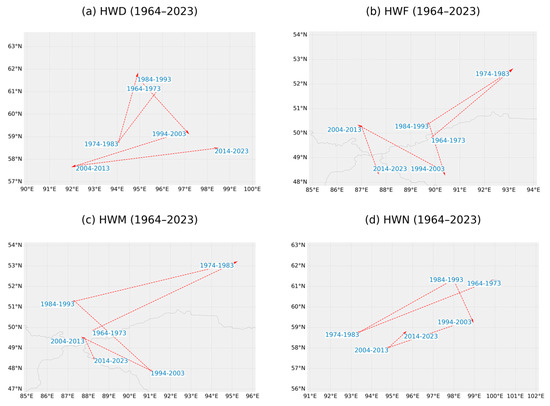
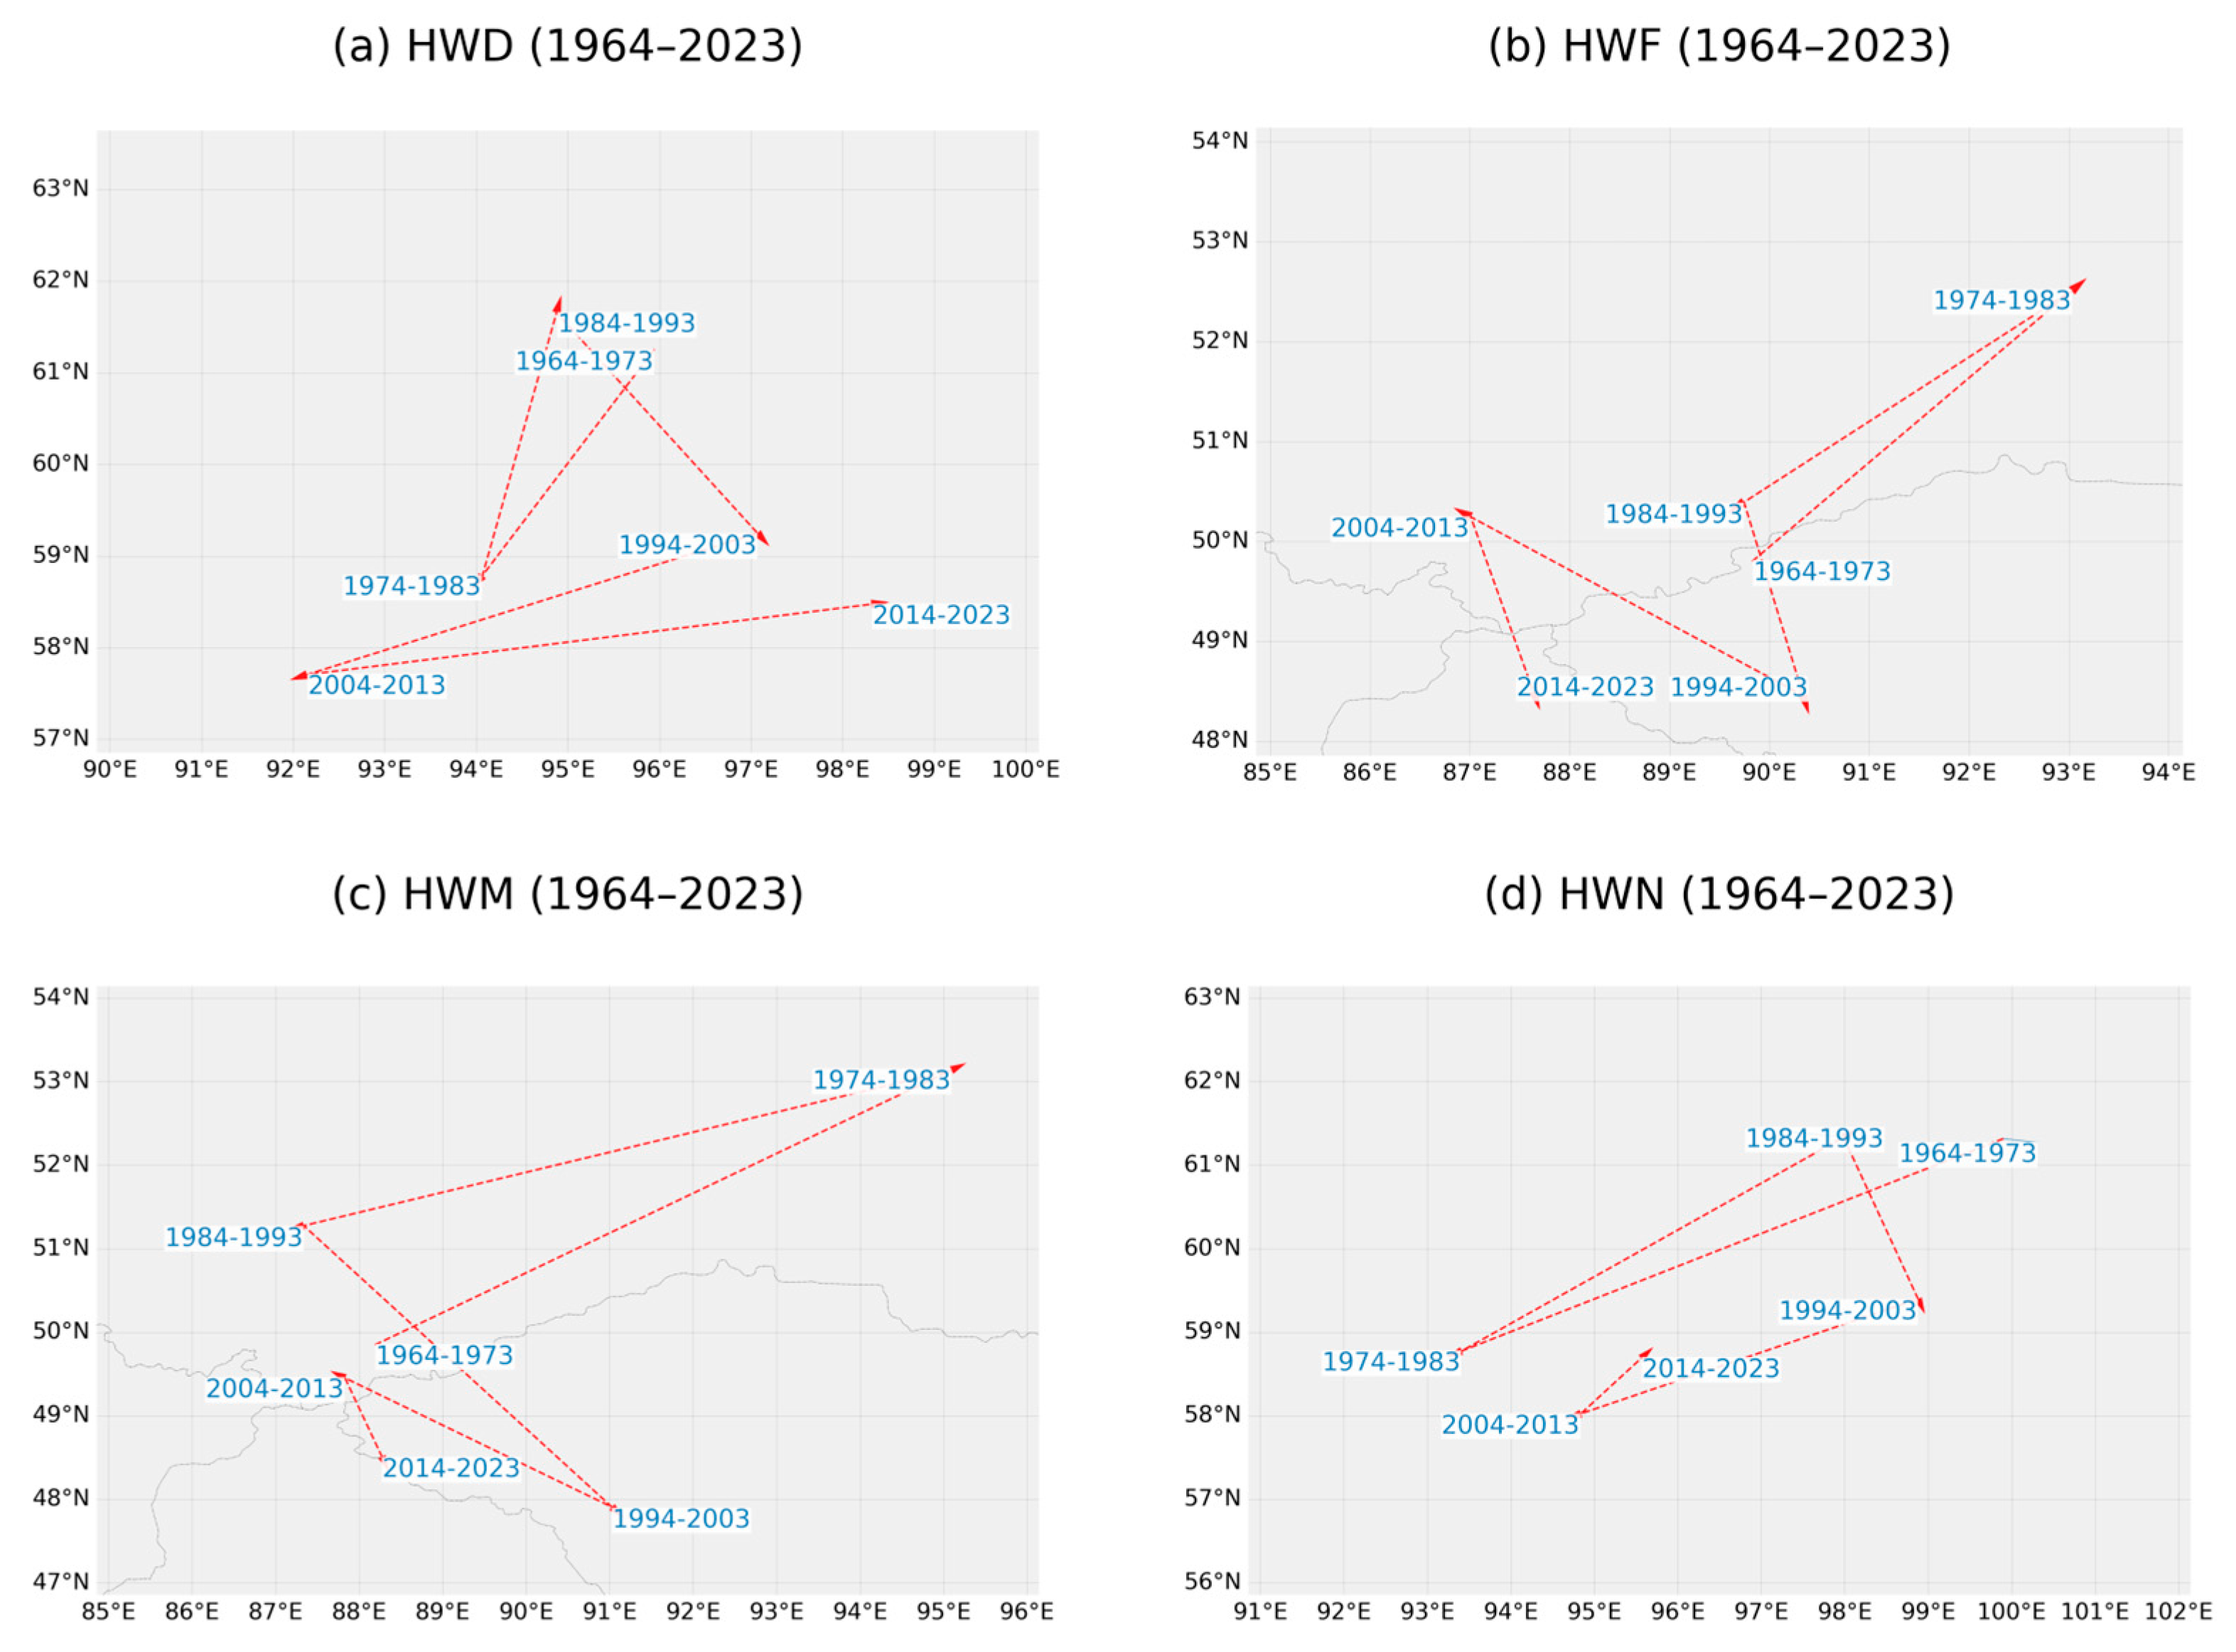
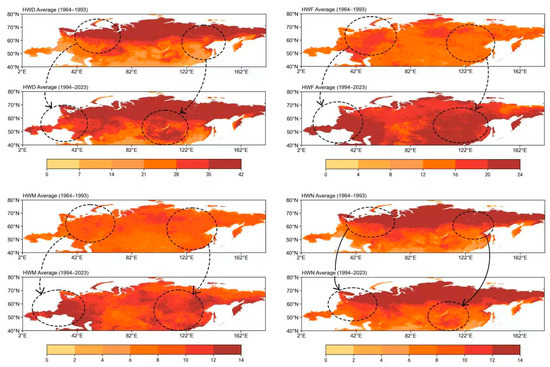
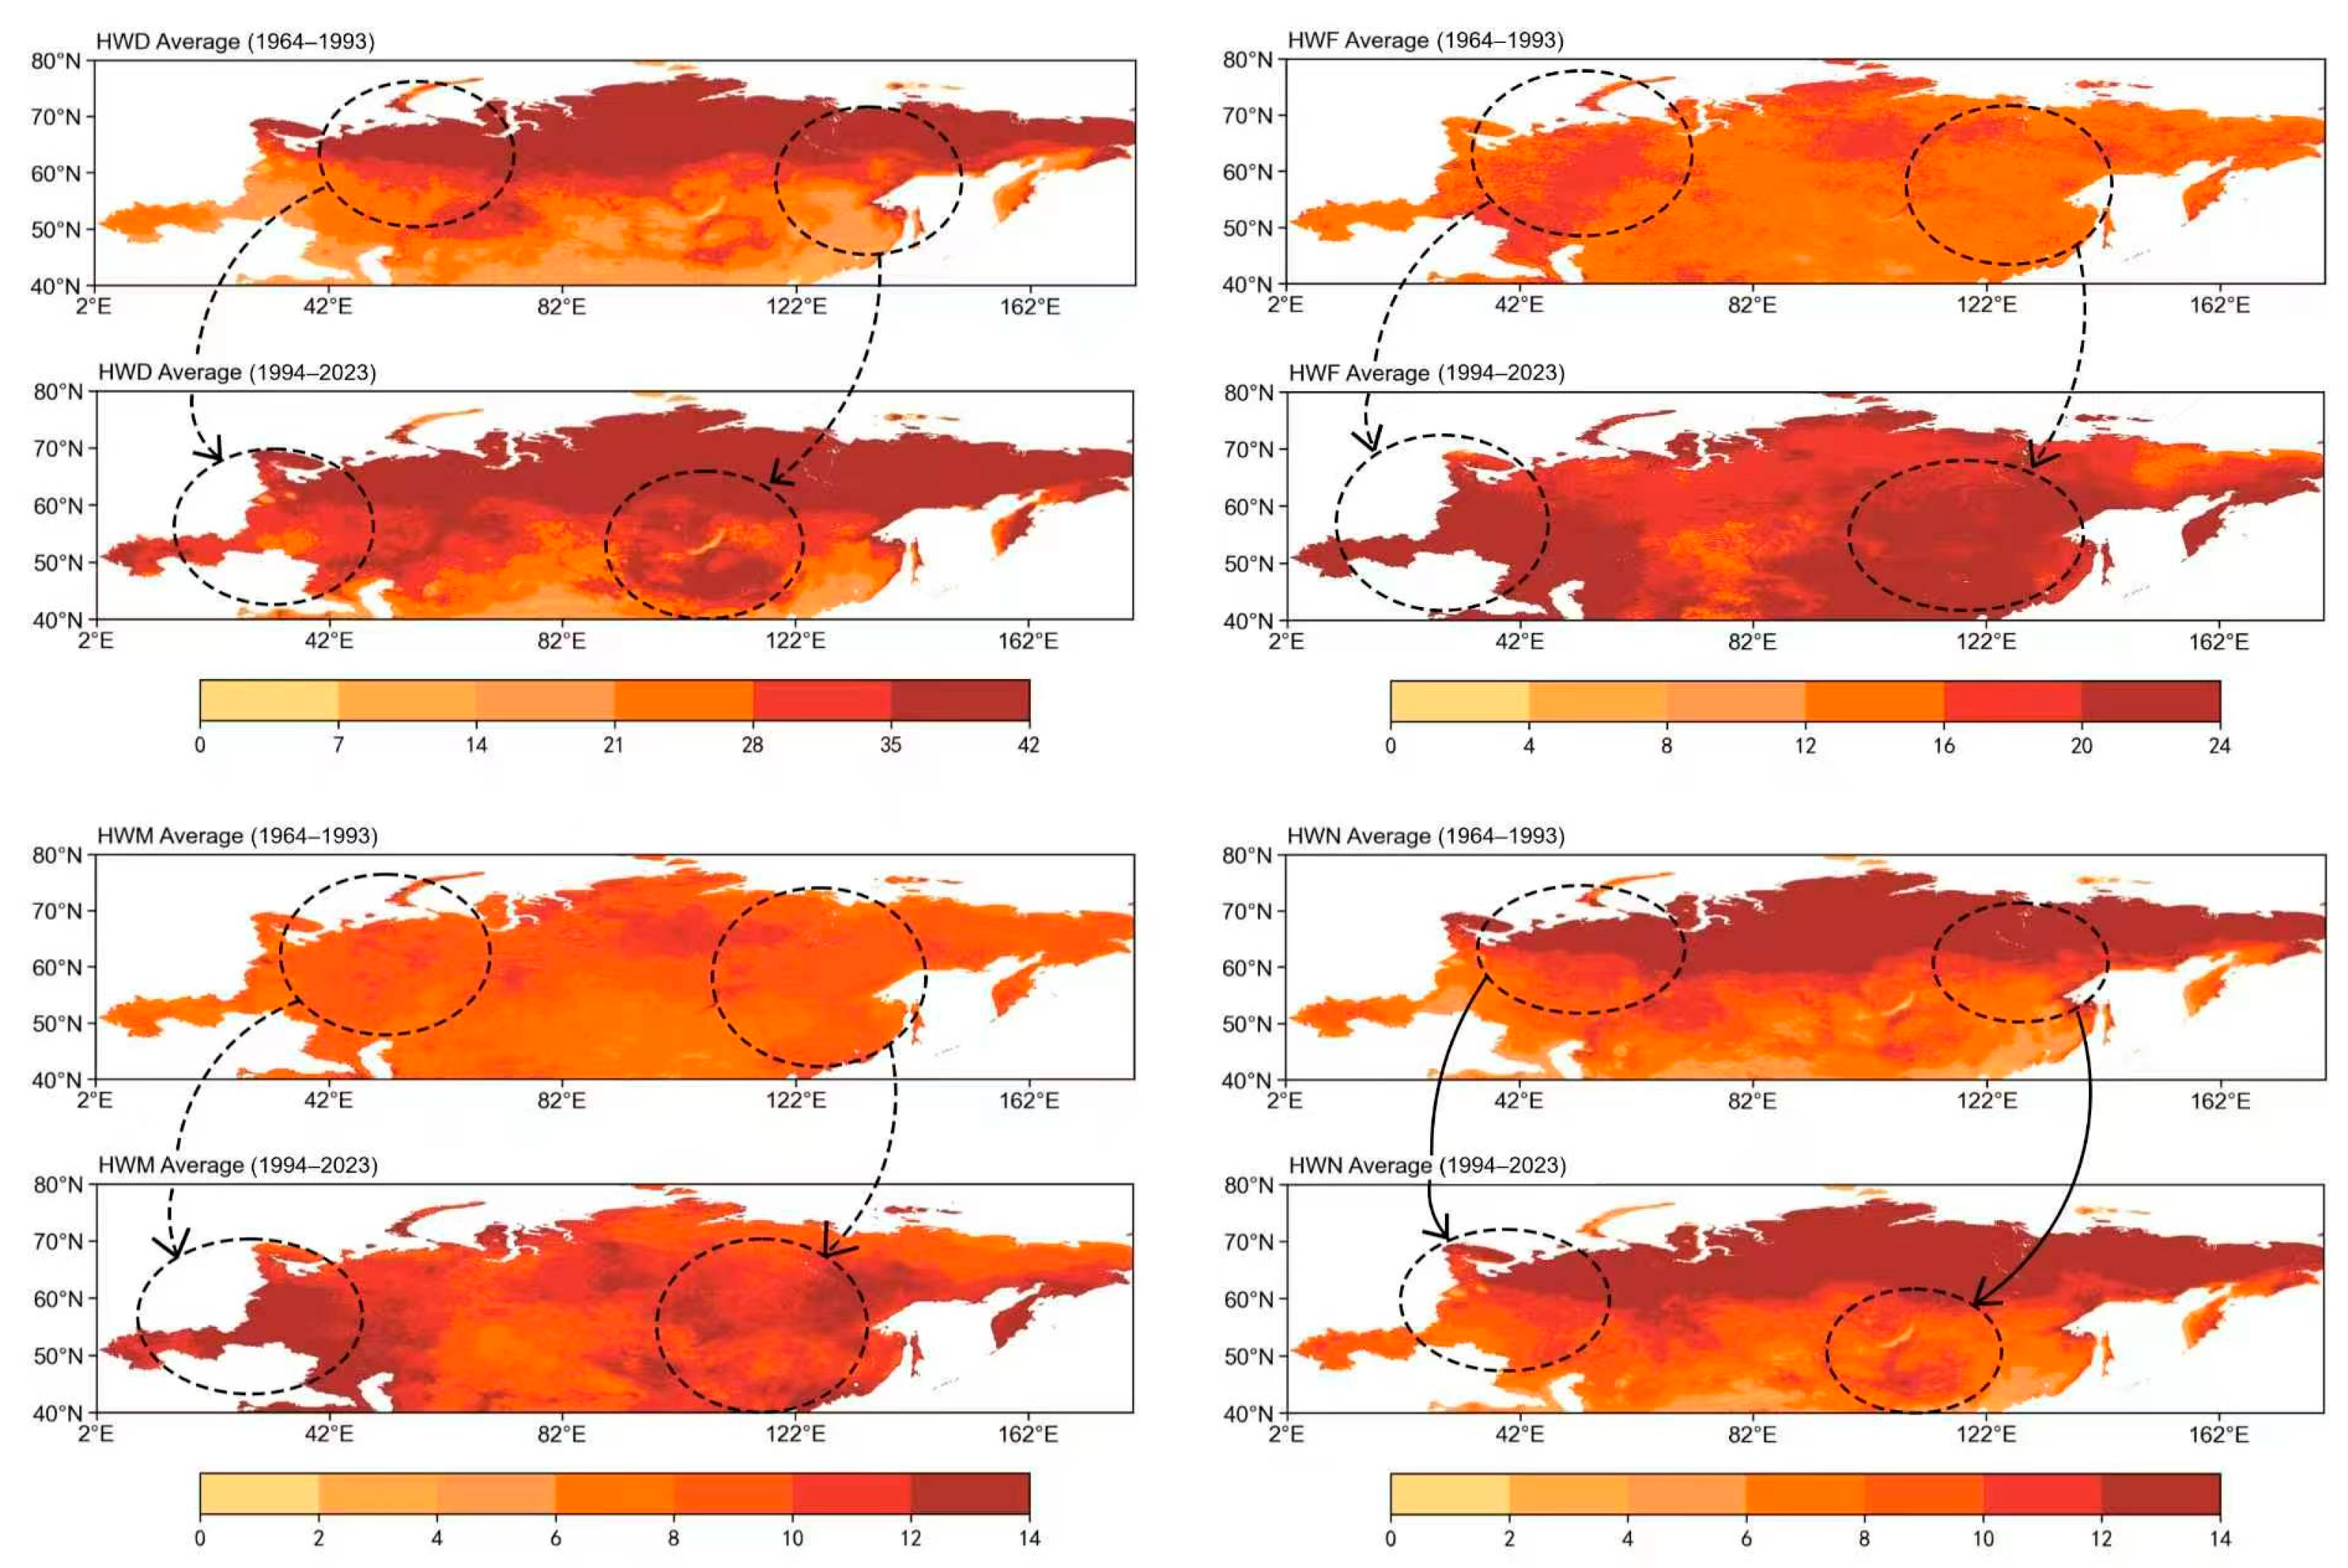
Based on meteorological data from 1964 to 2023, this study has mapped the spatial distribution of four types of heatwave indicators over a 30-year period and the spatial center of gravity migration over a 10-year period in order to further reveal the spatiotemporal evolution characteristics of heatwaves (Figure 7 and Figure 8). The results show that over the past 60 years, heatwaves in the study area have exhibited a certain spatial expansion trend. The spatial centroids of each indicator all show a distinct dynamic change process, and the migration paths exhibit uncertainty and regional differences (Figure 7).
Figure 7.
Route of spatial centroid migration for heatwave metrics.
Figure 8.
Spatial distribution of heatwave indices over a 30-year period.
Between 1964 and 1993, the high-value areas of HWN were mainly distributed in the mid- to high-latitude regions within the longitude band of 62–162° E, such as Eastern Siberia and the Far East (Figure 7). During the period from 1994 to 2023, the high-value area expanded towards the eastern part of Europe and Western Siberia. Its spatial center of gravity changed significantly at different stages, showing multiple large-scale displacements, and moved generally westward and southward (Figure 7), shifting approximately 0.67° westward and 1.77° southward compared to the previous 30 years.
The spatial center of gravity of the HWD was initially located around 96° E and 61° N, and it moved southward as a whole. The trajectory is shaped like the character “zigzag”. (Figure 6). Over the past 60 years, the growing season in Western Siberia has generally lengthened by 7 to 14 days, and in Central Siberia, it has even exceeded 21 days. Meanwhile, the frequency and HWM have shown a marked regional increase. Over the past 30 years, HWF in the Lena River Basin and the East Siberian Plateau region has increased by 4 to 12 days, and HWM in the same area has risen by 2 to 6 °C2. The spatial centers of both have mainly shifted from northeast to southwest (Figure 6), moving westward by approximately 2.54° and 1.17°, and southward by about 1.83° and 2.79° respectively.
3.3. Analysis of the Spatiotemporal Evolution Mechanism of Heatwaves
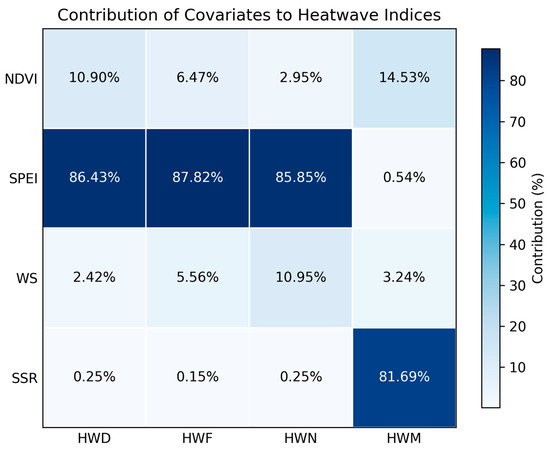
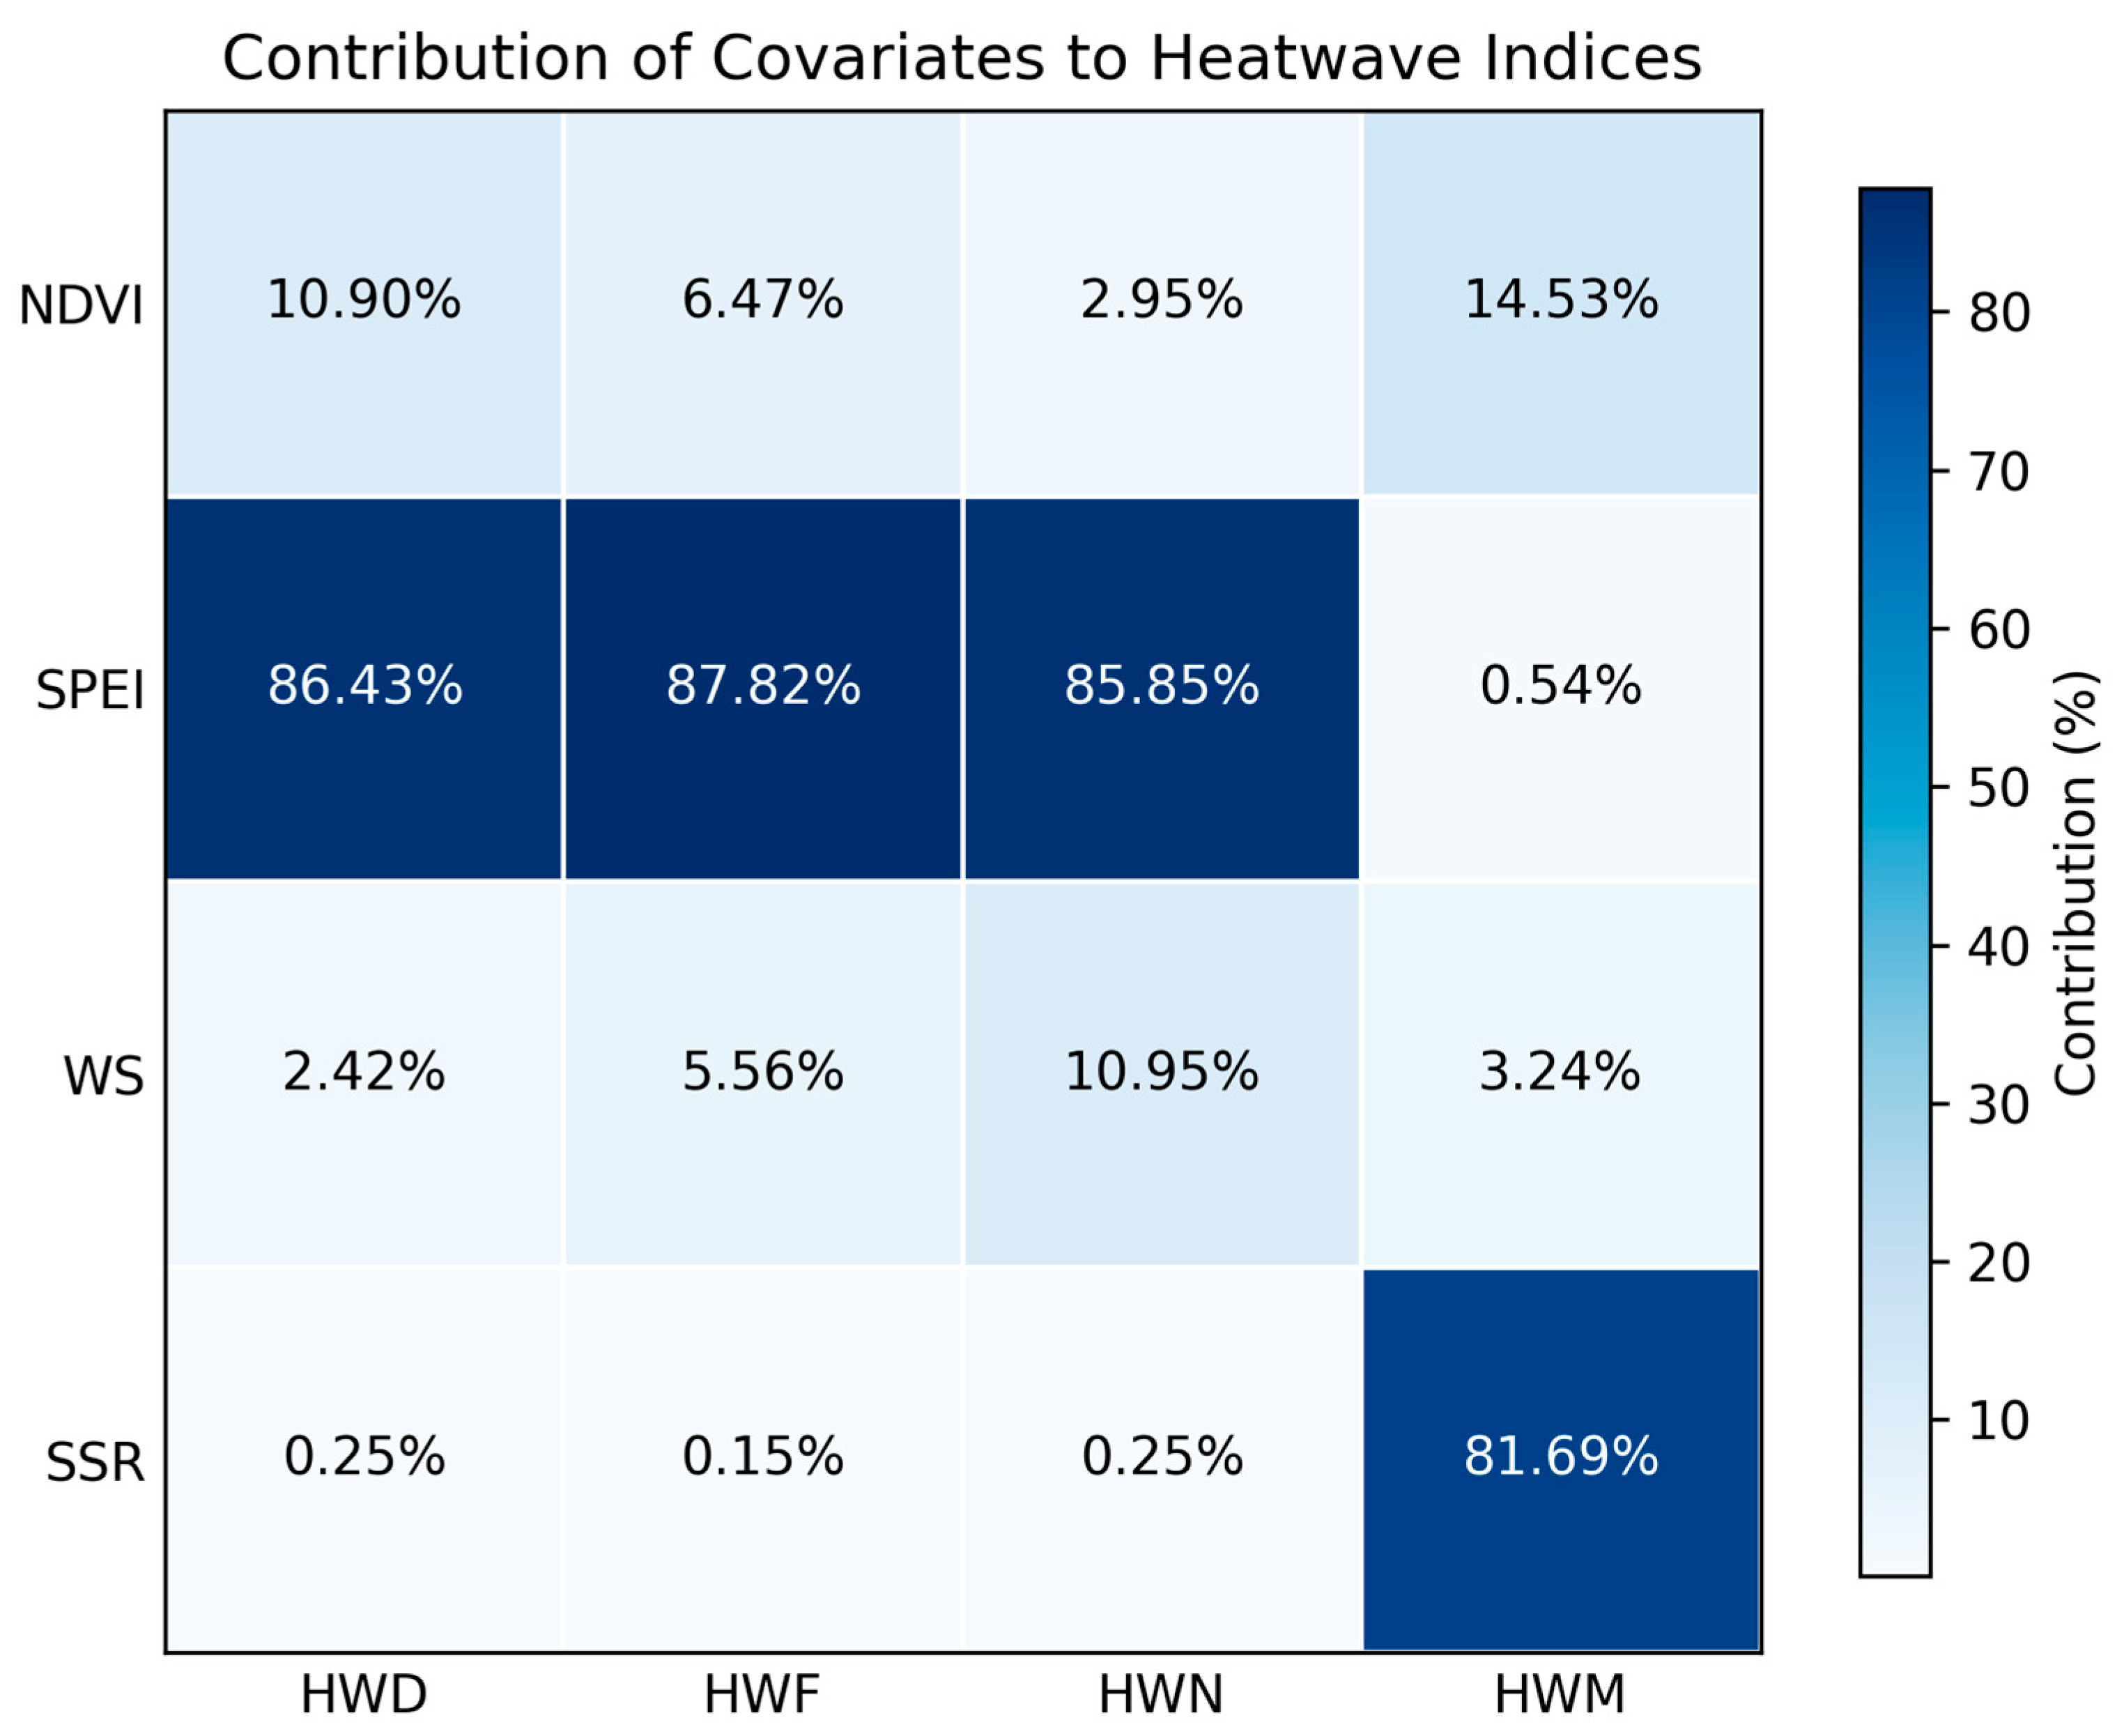
This study utilized the generalized linear mixed model (GLMM) to conduct standardized coefficient decomposition. The contribution rates of NDVI, SPEI, WS, and SSR to the four types of heatwave indicators showed significant differences (Figure 9). The model quantifies the independent impacts of natural elements and surface processes on heatwaves through variance decomposition, revealing the indicator specificity and regional heterogeneity of the driving mechanisms. Furthermore, the research systematically revealed the dynamic change patterns of the influences of the four driving factors, namely, NDVI, SPEI, WS and SSR, on the four types of heatwave indicators within different time ranges.
Figure 9.
Contribution rates of individual driving factors to heatwave characteristics during 2000–2019.
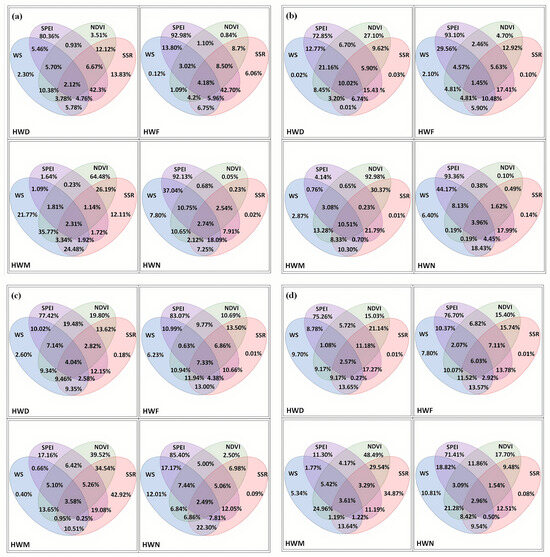
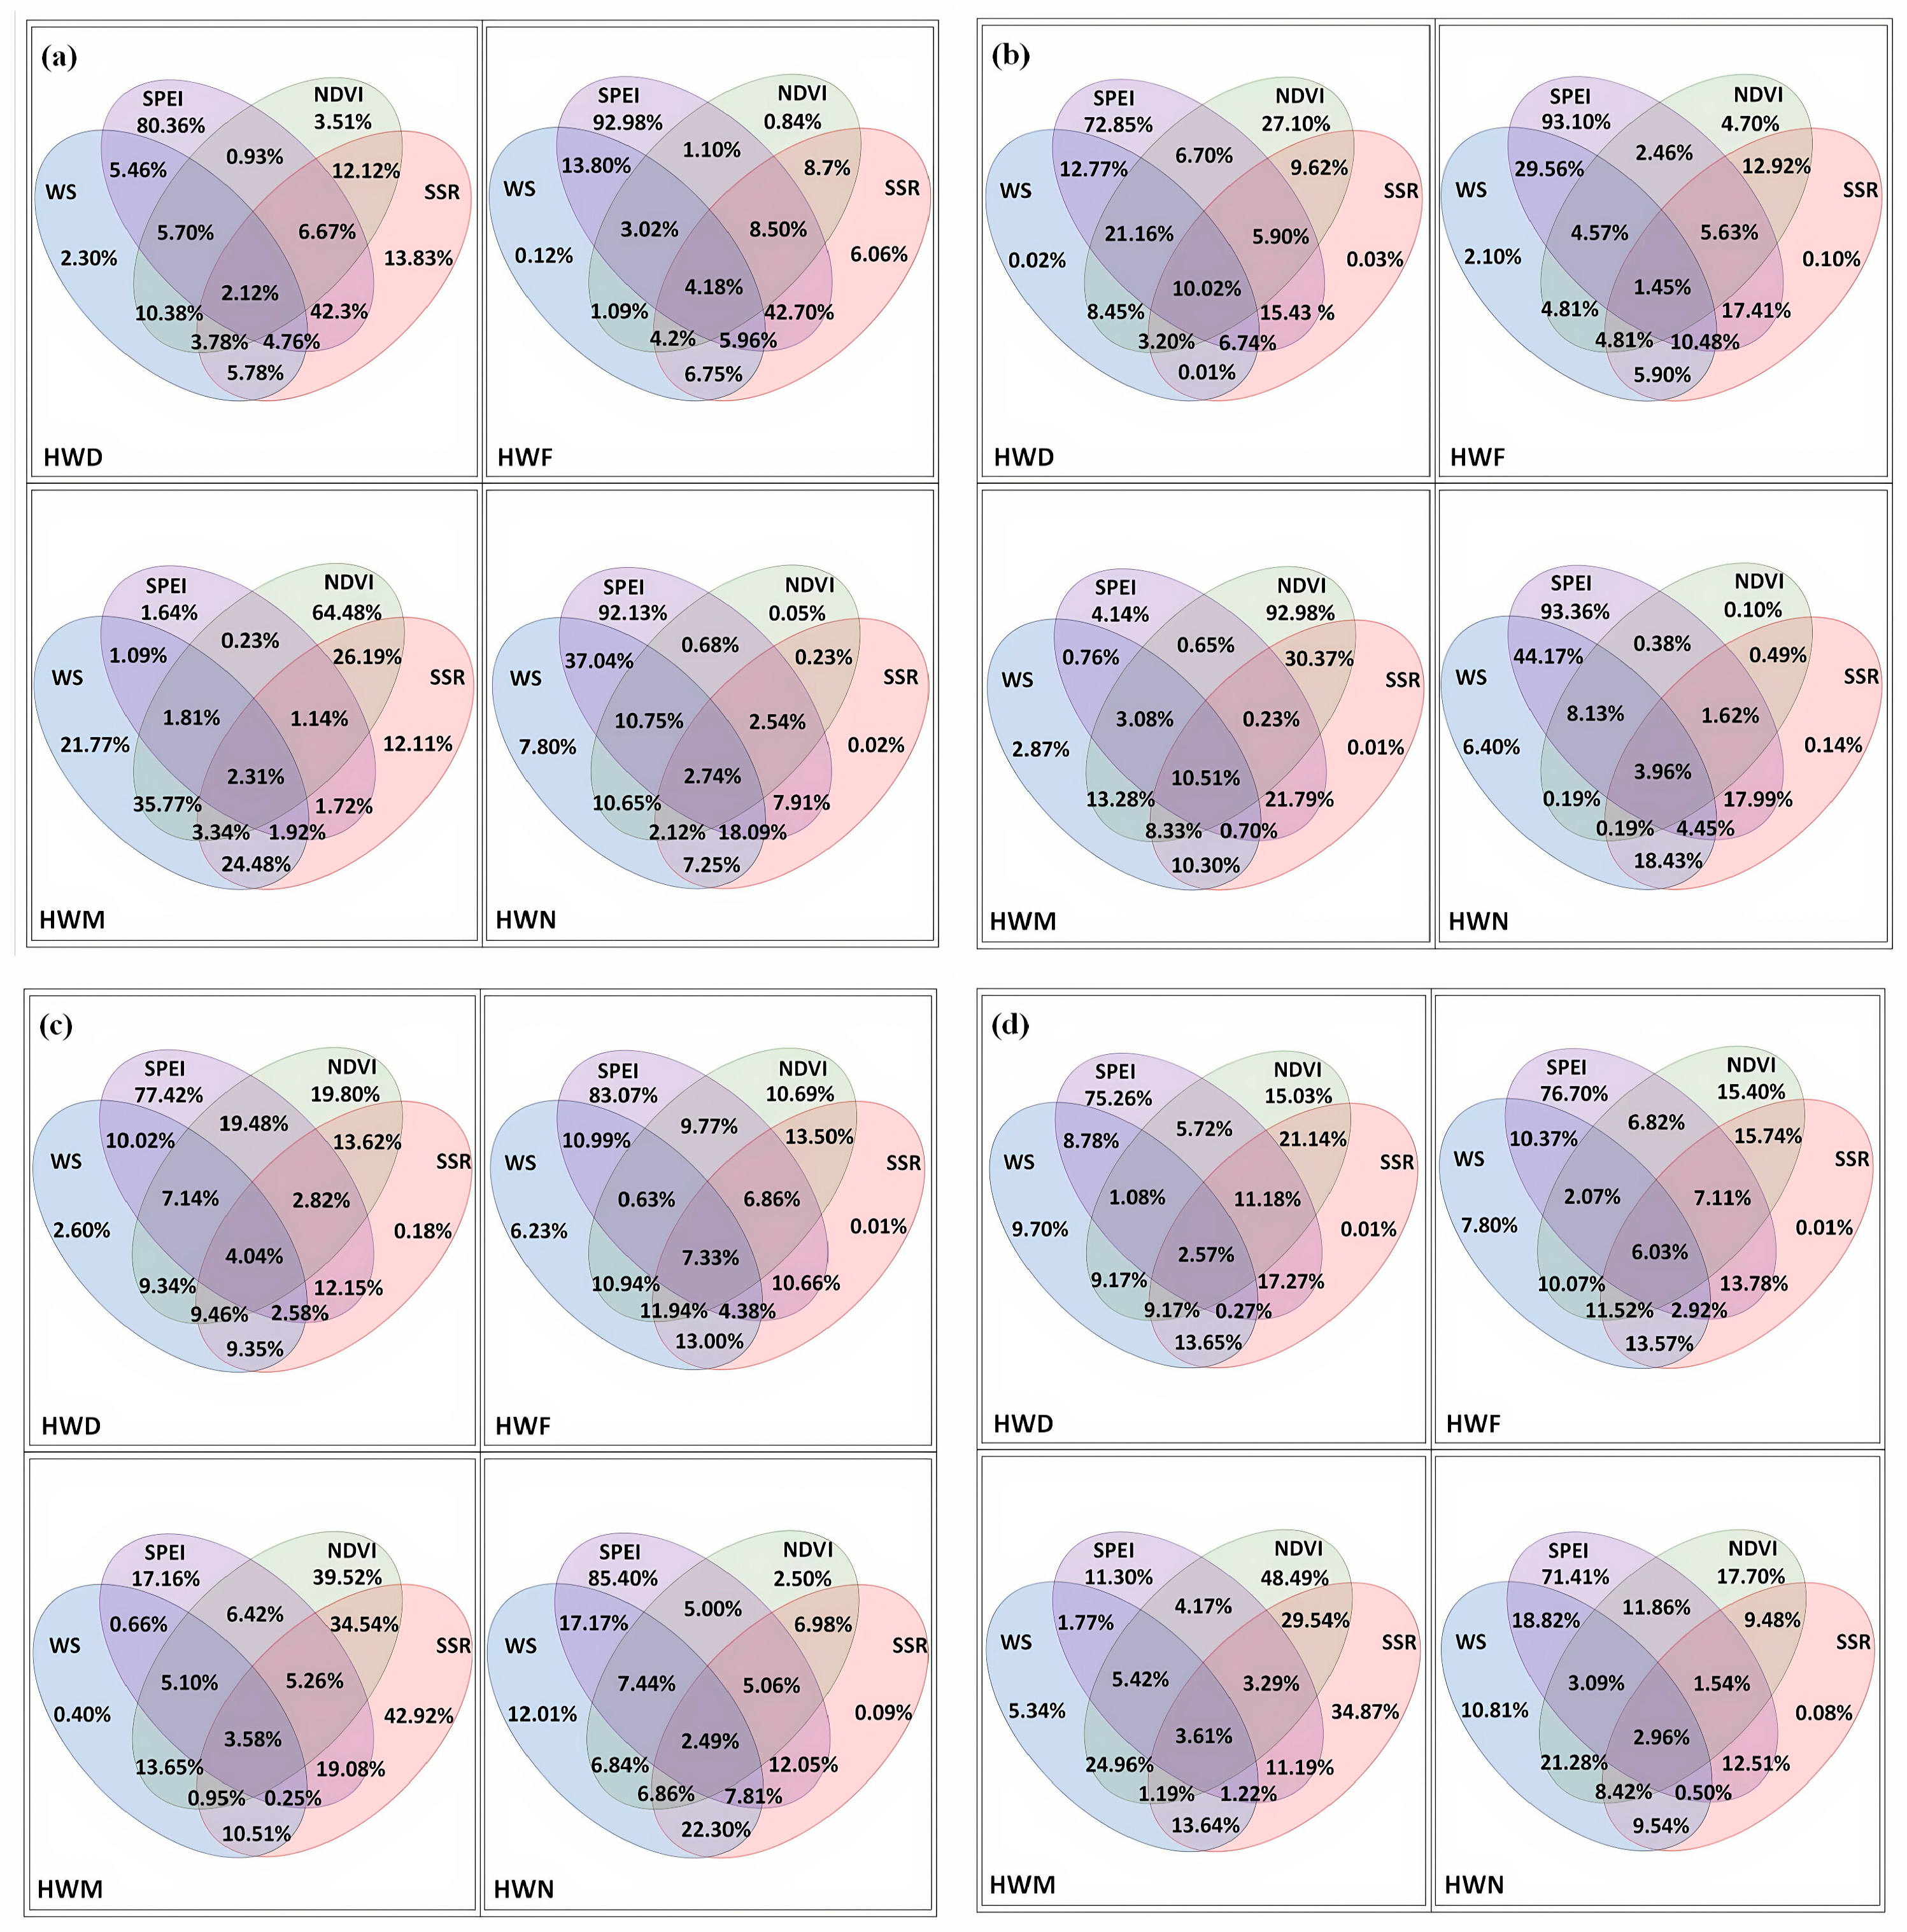
The main driving factors of the four types of heatwave indicators show a clear phased alternation (Figure 10a–d). Over the past 20 years, the main single driving factors have gradually shifted from the early SPEI and WS to the later SSR and NDVI. Although individual factors had extremely high contribution rates to a certain heatwave index during the entire period, overall, the contribution of factor interactions was mostly stronger than that of individual factors.
Figure 10.
Attribution analysis of four types of heatwave indicators. (a–d) correspond to 2000–2004, 2004–2009, 2010–2014, and 2015–2019, respectively. In the Venn diagrams, the overlapping regions indicate the proportion jointly explained by multiple factors, whereas the non-overlapping regions represent the unique contribution of each individual factor during that period.
Between 2000 and 2004, the most significant influences on HWD and HWF were SPEI and SSR, with an interactive contribution of approximately 42%, followed by NDVI and SSR. The combination of NDVI and WS had the greatest impact on HWM, with an interaction contribution of approximately 35% (Figure 10a). From 2005 to 2009, the interactive contribution of SSR and NDVI increased significantly, accounting for 30.37% of the impact on HWM. Meanwhile, the contribution rate of the combined effect of SPEI and WS to HWF increased from 13.8% to 29.56%, doubling. The interaction contribution of the three factors NDVI, SPEI, and WS reached the highest level in history, approximately 21% (Figure 10b). During the period from 2010 to 2019, the interaction between SSR and NDVI became the primary influencing factor for most indicators, with its contribution rate to the influence on each indicator remaining at a relatively high level (Figure 10c). It should be emphasized that throughout the entire research period, the influence of the SPEI factor on all heatwave indicators except HWM was at an extremely high level, with a contribution rate ranging from 70% to 93%. Conversely, the extremely high contribution of NDVI is only for HWM, with a contribution rate ranging from 40% to 92%.
3.4. Trend Analysis of Heat Waves Based on the Hurst Exponent
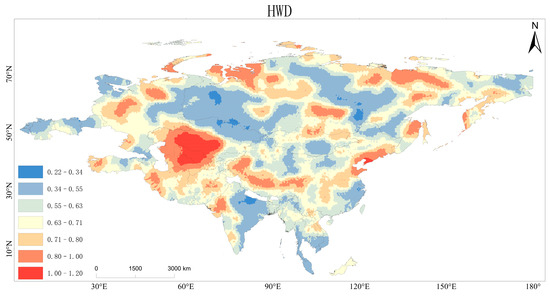
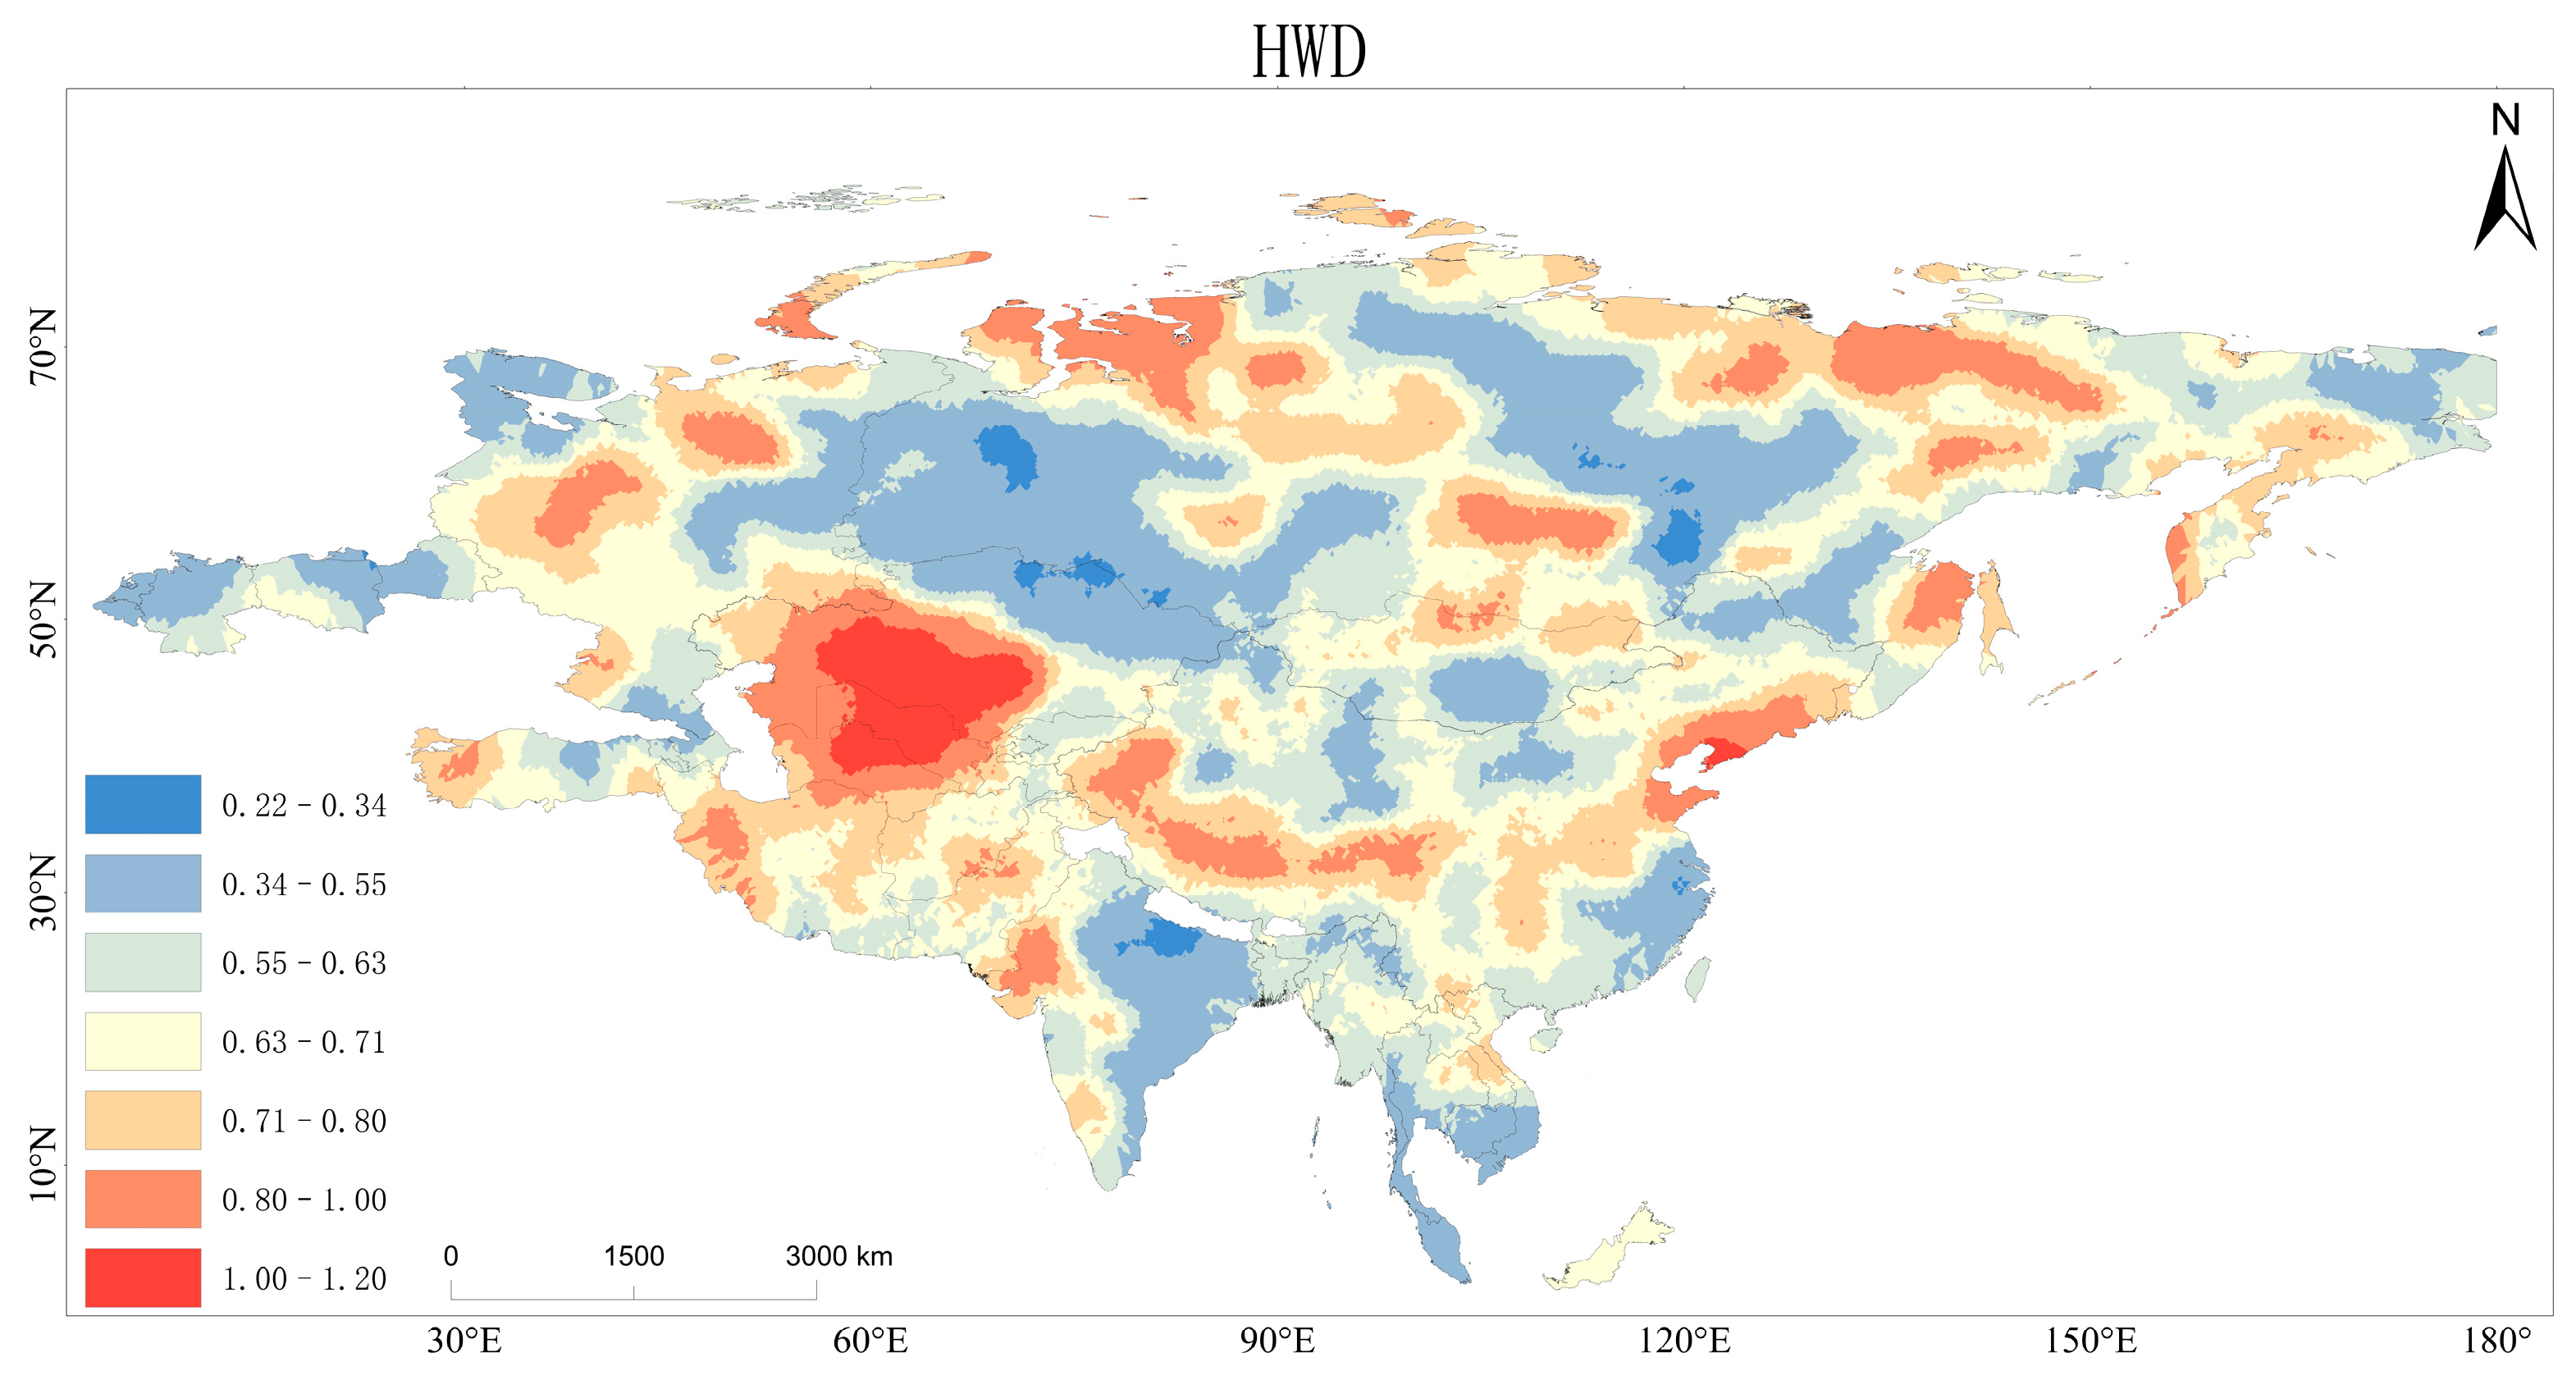
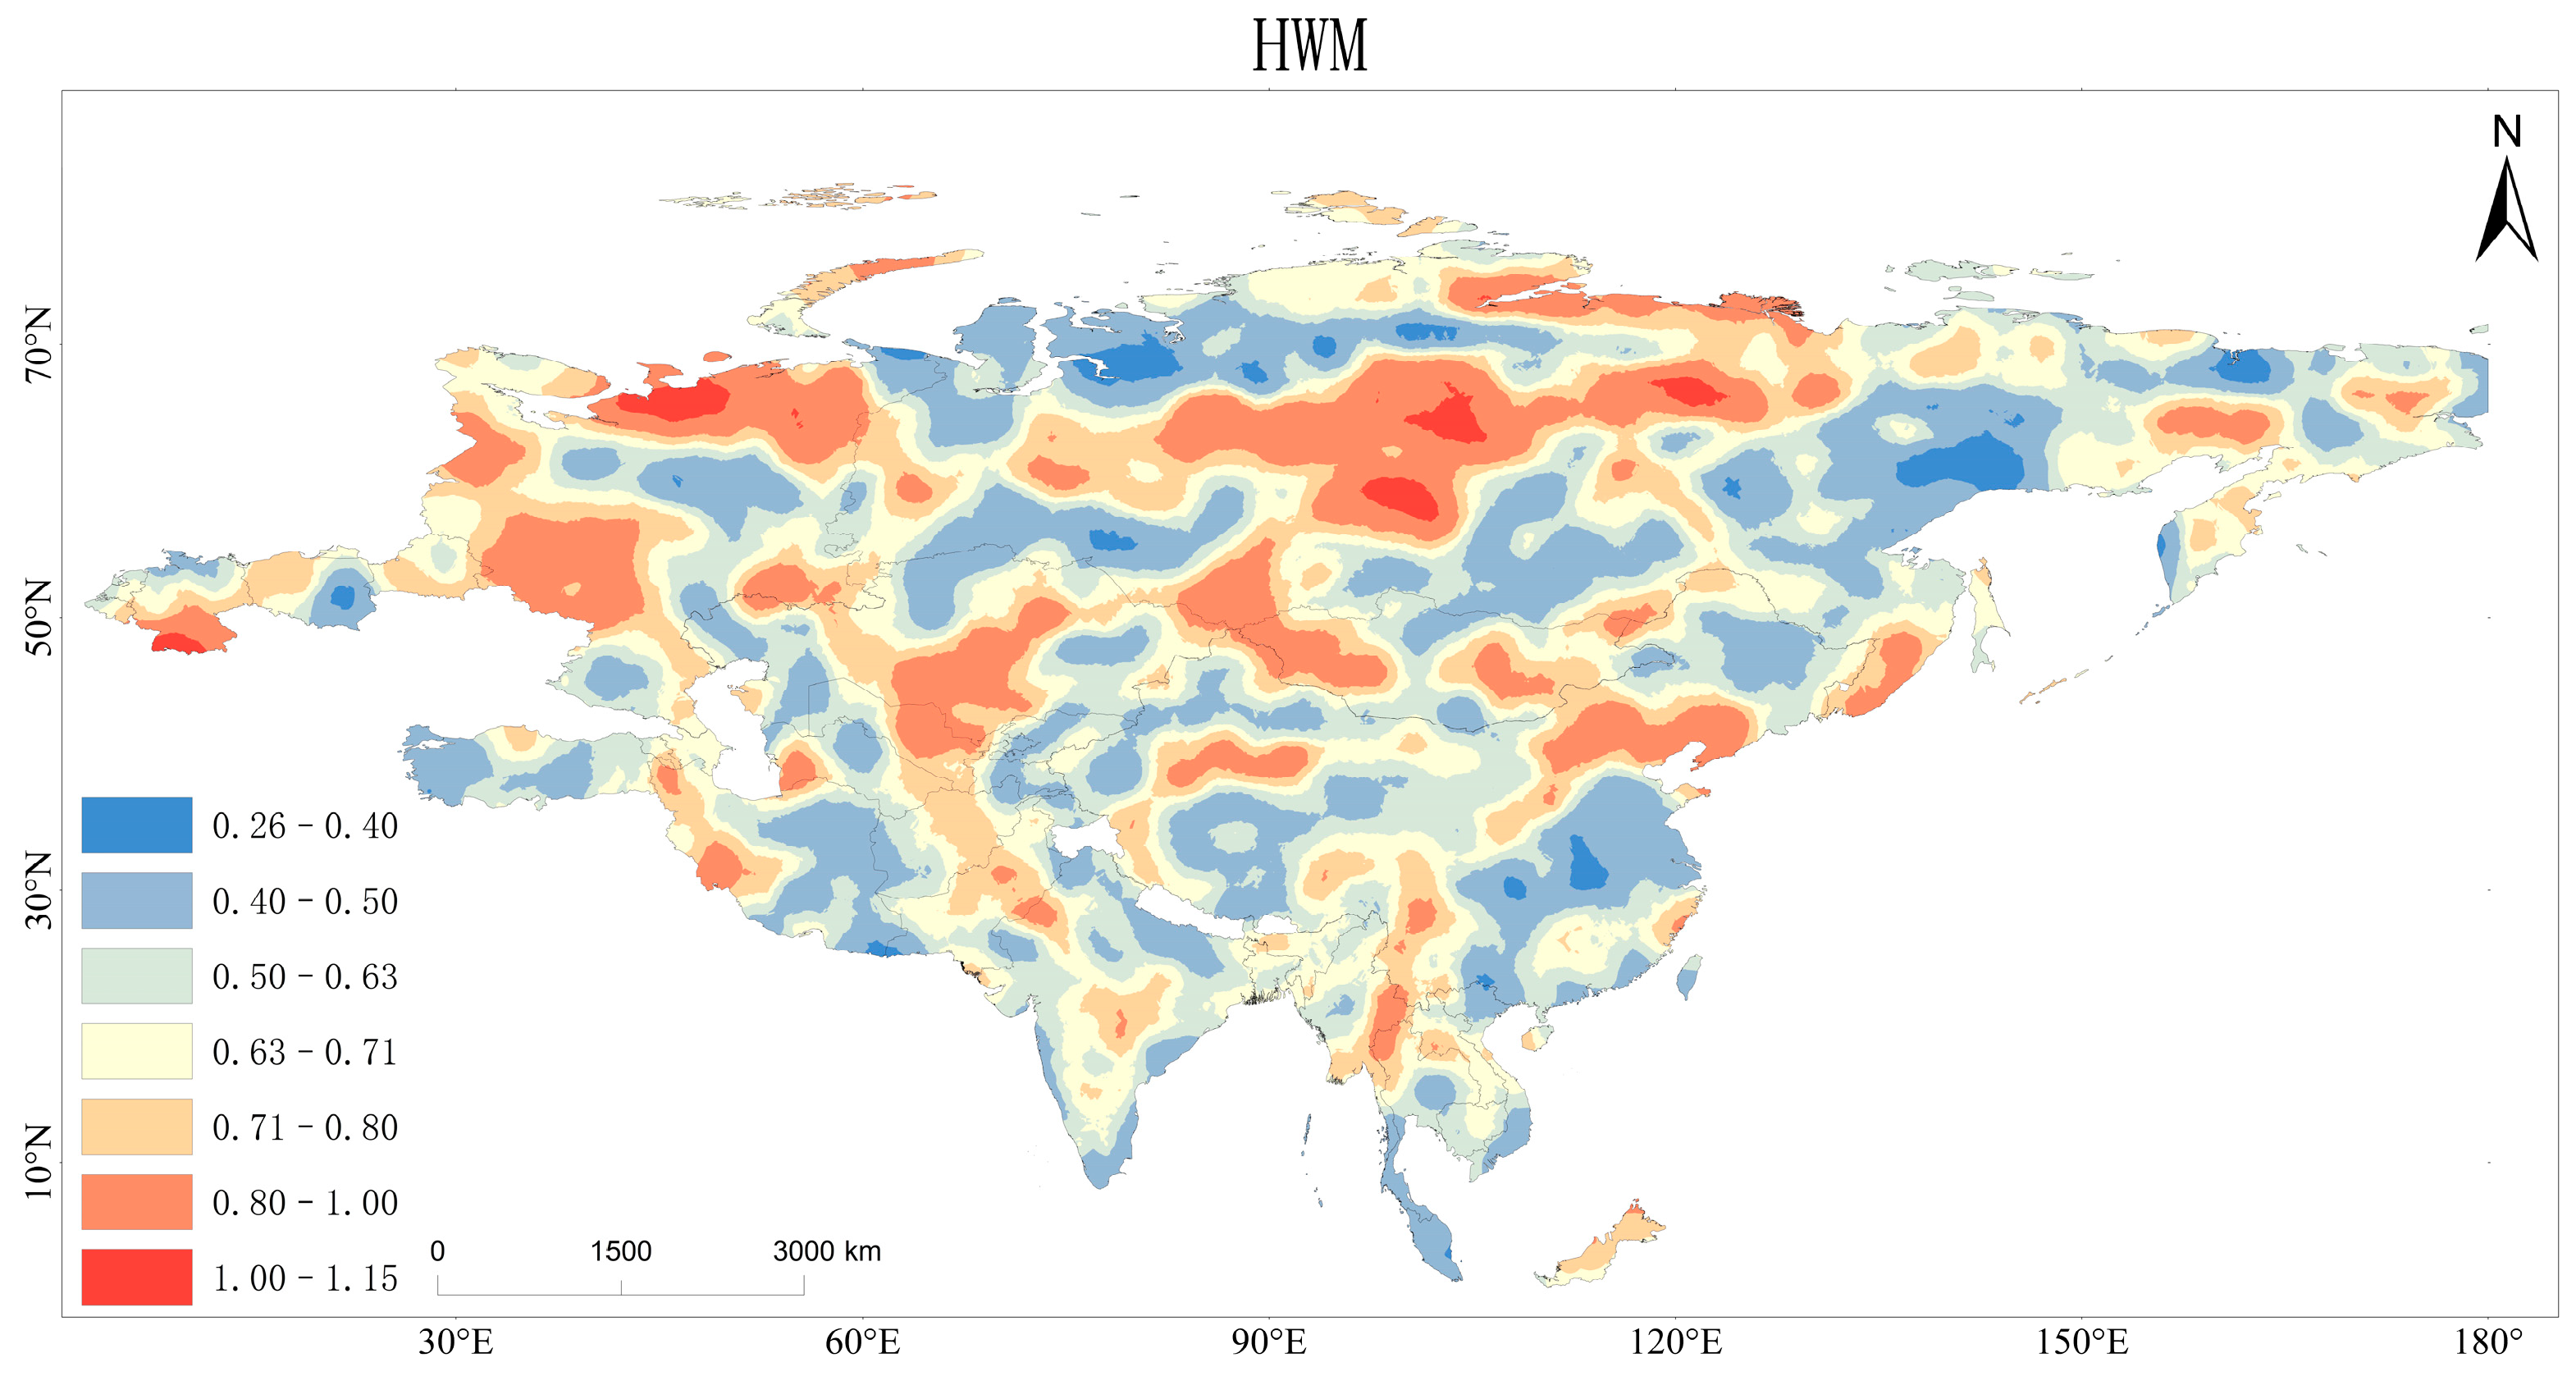
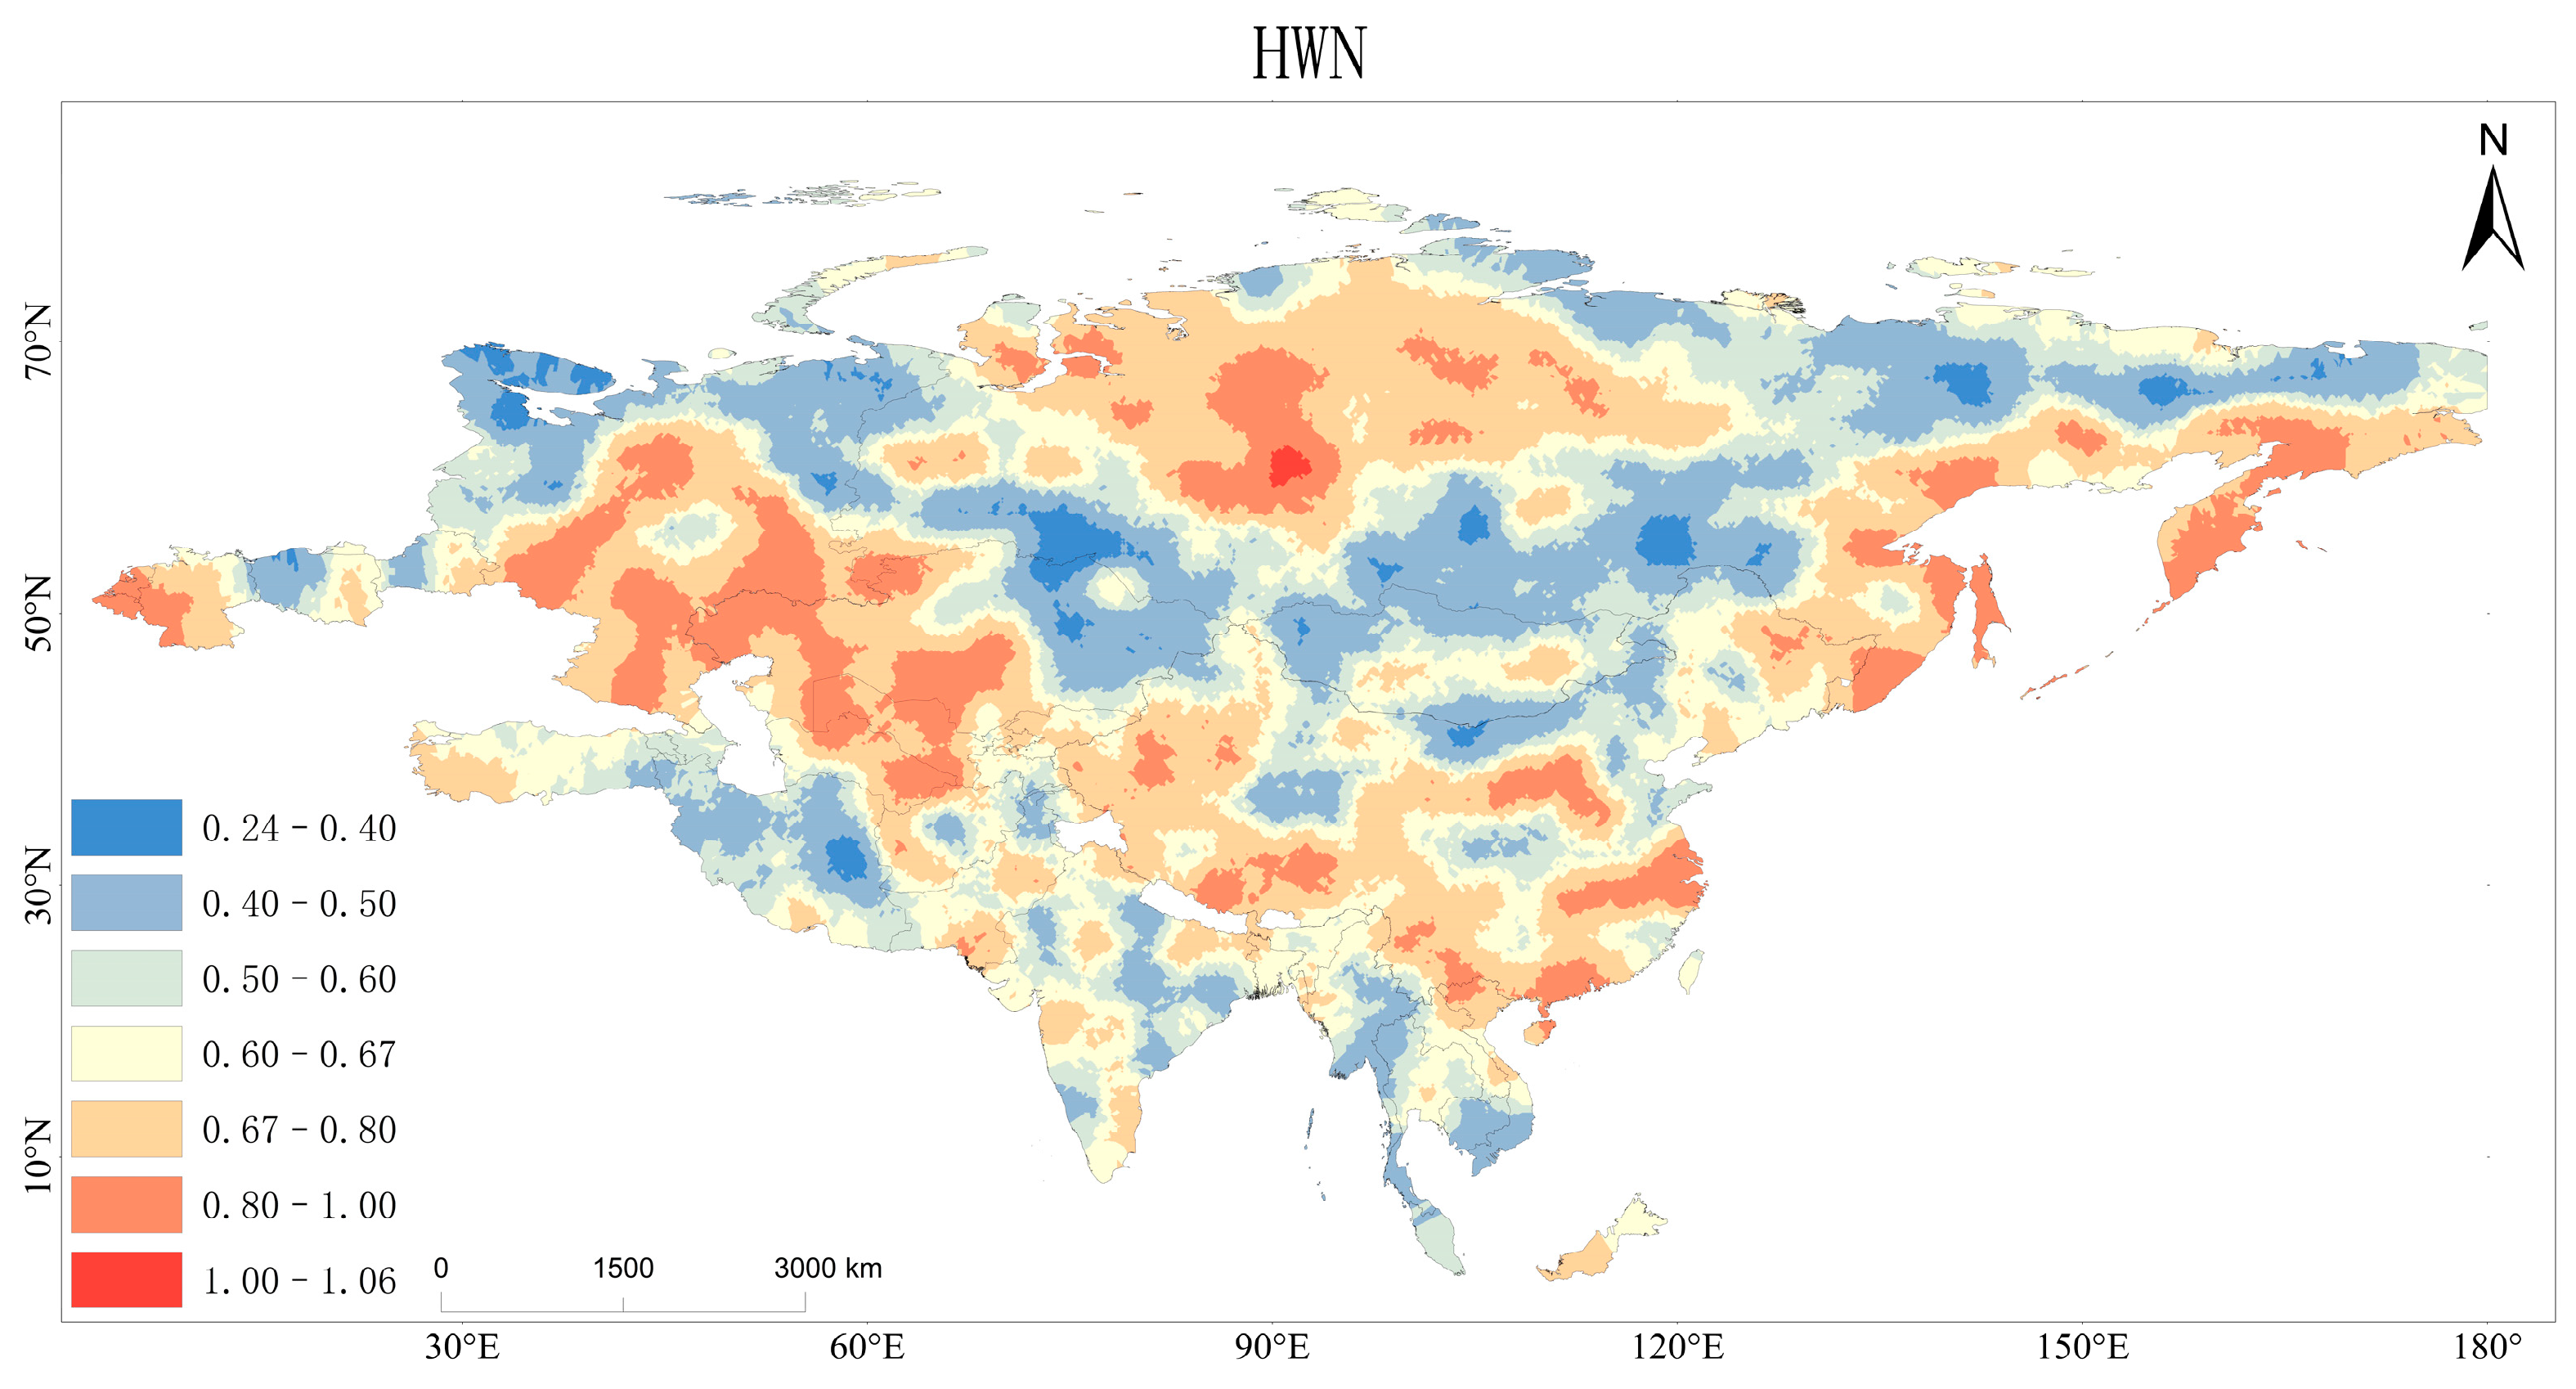
Most areas along the Belt and Road Initiative have witnessed an increasing trend in all heatwave indicators, with risks of a longer duration, more frequent occurrence, and greater intensity. Although in a small number of areas the Hurst exponent H is less than 0.5, indicating the possibility of a decline or reversal in the risk of heatwaves, from the overall distribution, the proportion of areas showing a sustained strengthening trend is significant. Additionally, the proportions of pixels with H > 1 for each heatwave indicator were 2.0% for HWD, 0.6% for HWF, 0.9% for HWM, and 0.1% for HWN. In the future, countries along the “Belt and Road” will face varying degrees of increased risks in terms of the duration, frequency, intensity and number of heatwaves.
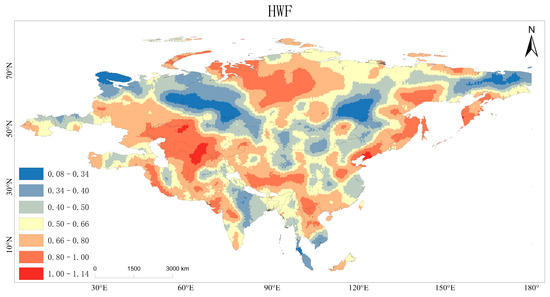
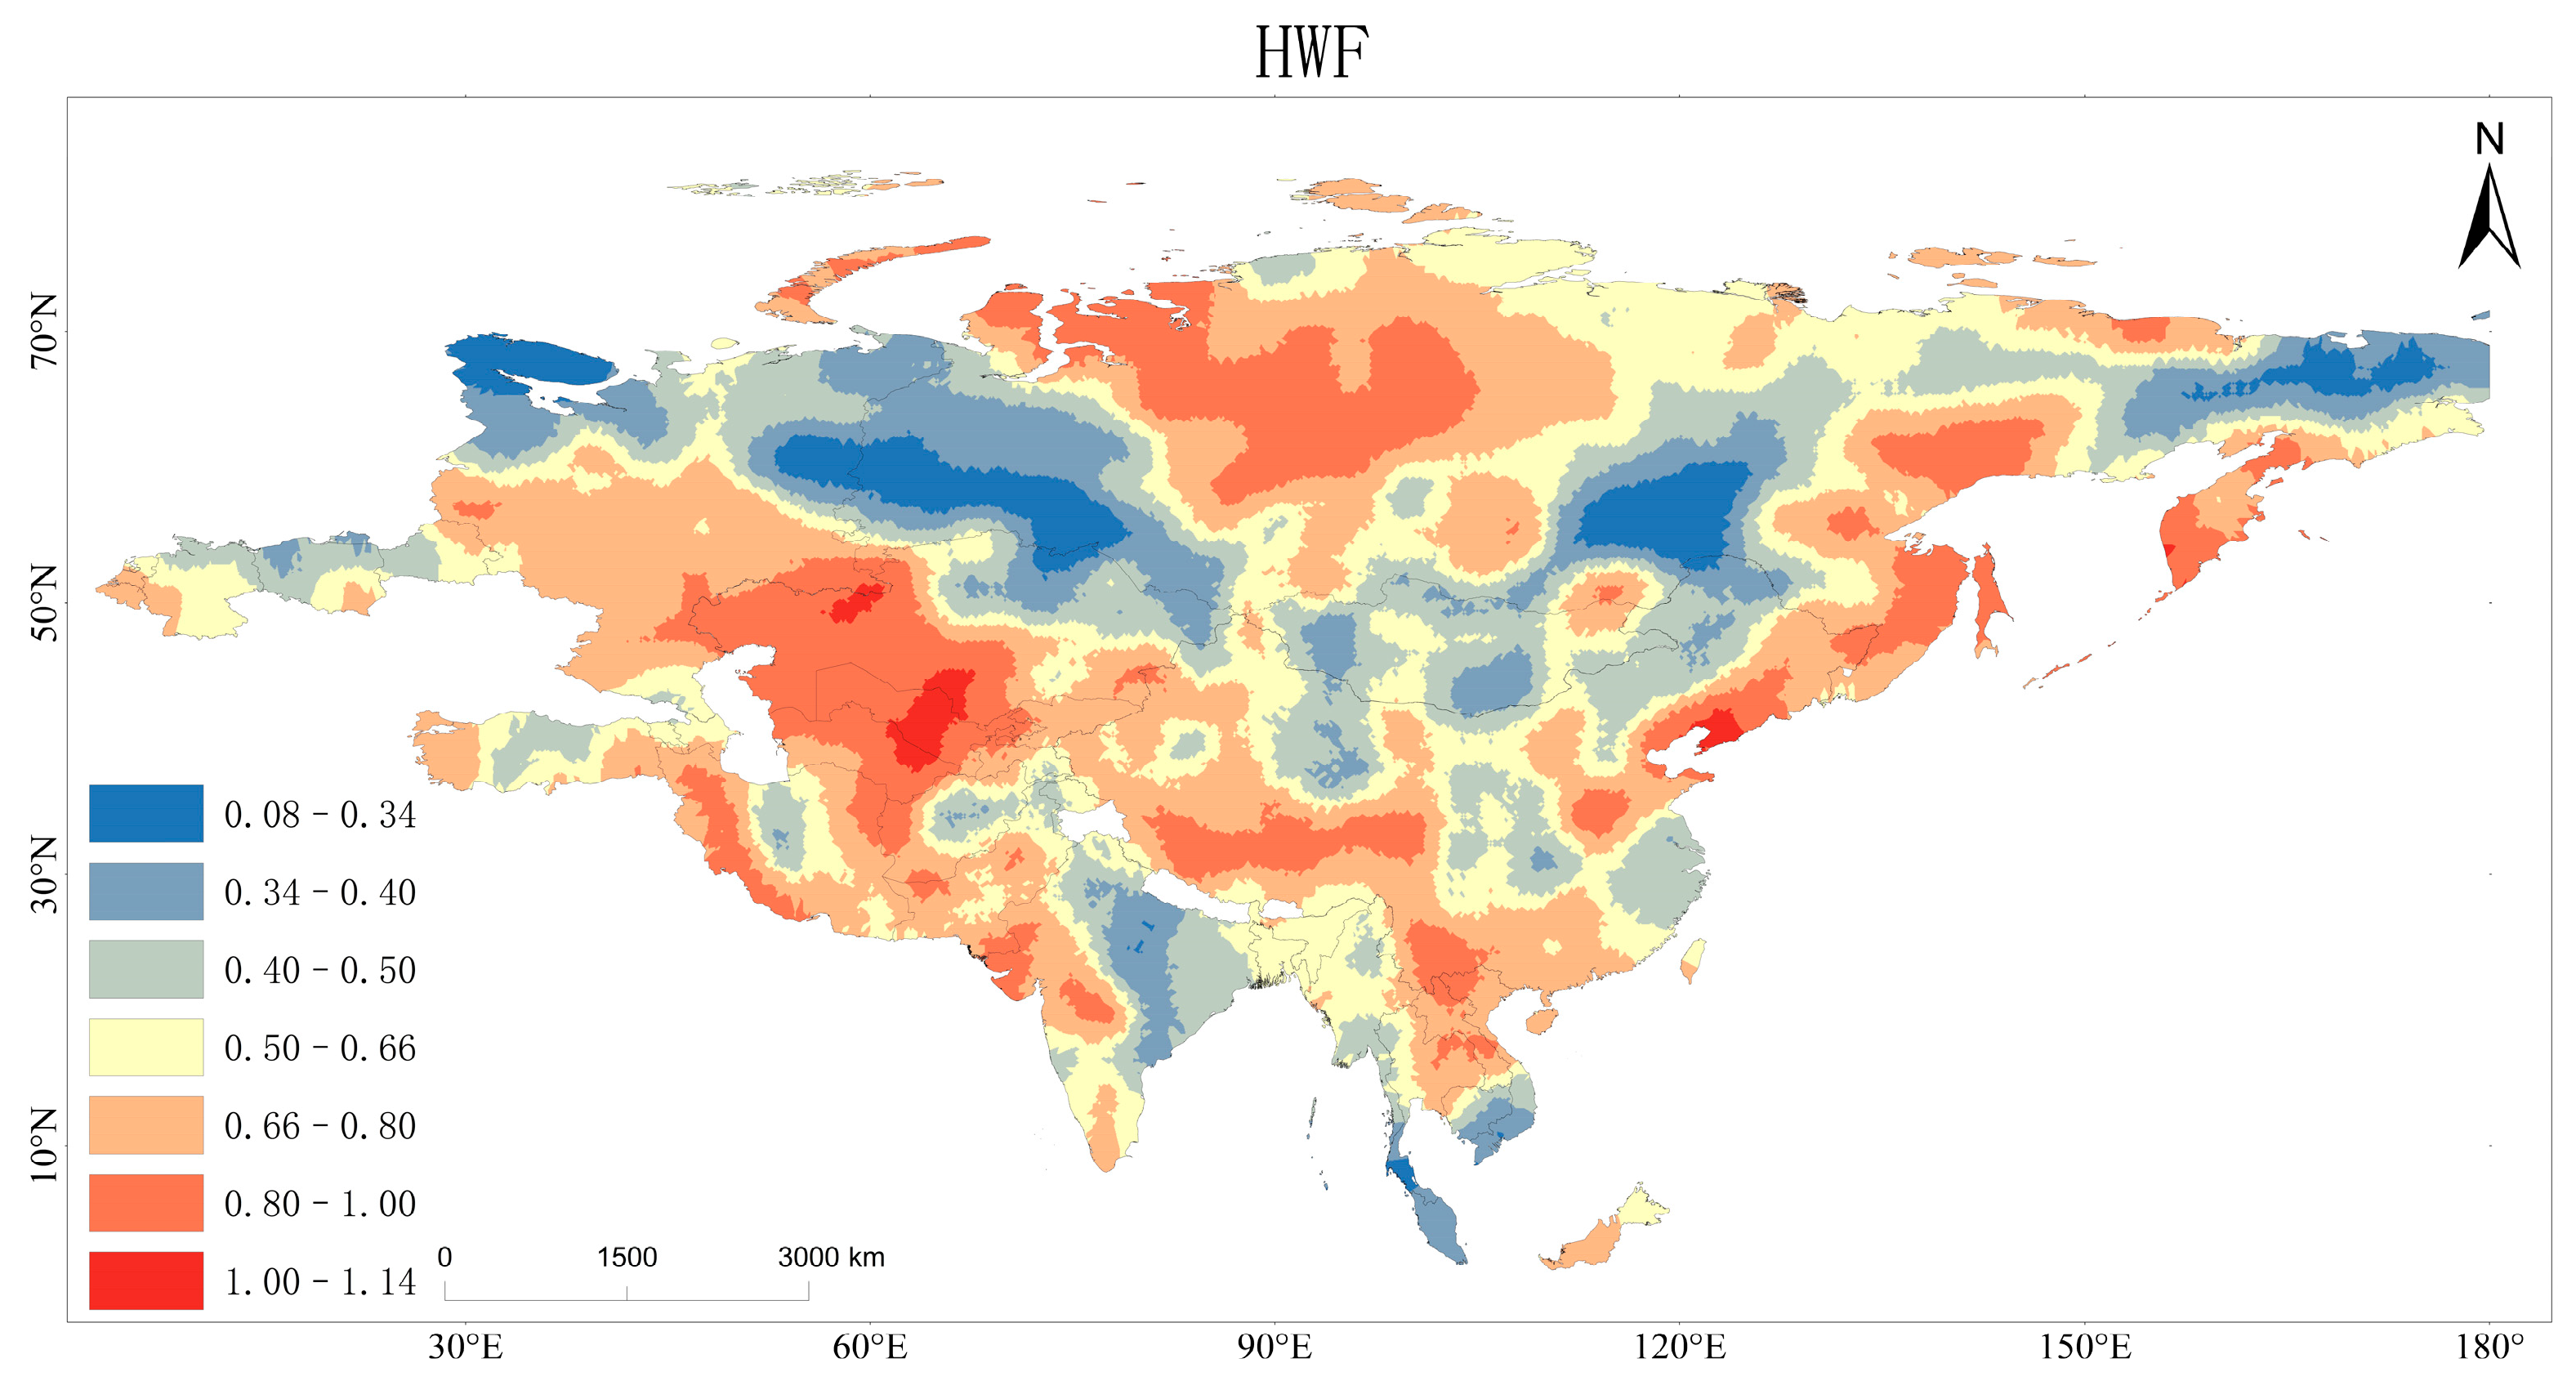
Heatwaves are expected to continue to intensify in the future. The area proportions of the strong and sustained enhancement (H ≥ 0.70–0.90) of the four types of heatwave indicators were 28.93%, 33.67%, 30.22%, and 33.01%, respectively. The Central Asia–West Asia region is the most stable area where heatwaves are continuously intensifying. From the eastern coast of the Caspian Sea to the central and southern parts of Kazakhstan and the Iranian Plateau, there is a large area where both HWN and HWD simultaneously show continuous high values with H ≥ 0.75, and both HWF and HWM are at relatively high levels (Figure 11, Figure 12, Figure 13 and Figure 14). The East China coastal area to the North China Plain shows a high-frequency rising zone, with HWF continuously above average along the eastern coast (H ≥ 0.60–0.65) (Figure 12). Meanwhile, both HWM and HWD are at a moderately high level (Figure 13), indicating that heatwaves will become more frequent in the future, with greater intensity and longer duration. The northern part of South Asia and the eastern part of Eastern Europe are high-risk areas for heatwaves. Most of the medium and high-value areas of HWF occur here, but the duration of heatwaves in some parts of South Asia has not correspondingly increased.
Figure 11.
Prediction of future trends in HWD.
Figure 12.
Prediction of future trends in HWF.
Figure 13.
Prediction of future trends in HWM.
Figure 14.
Prediction of future trends in HWN.
Overall, Central Asia and West Asia are the two centers where heatwaves have intensified most significantly. The heatwaves from northeastern East Asia to the Russian Far East have shown a generally increasing trend, while the heatwaves along the eastern coast of China occur more frequently. Among them, HWF has a greater increase in the eastern coastal areas, the number of heatwaves in Central Asia–West Asia is the highest, and the duration is also the longest. HWM shows a band-like enhancement in the 60–70° N zone.
4. Discussion
4.1. The Evolution Law of Interannual Scale Heatwave Distribution
Over the past 60 years, HWF, HWD and HWN have continuously risen on a regional scale, while HWM has shown a stronger latitudinal zonality and a relatively stable distribution. The long-term stable high values are mainly located between 60 and 70° N. This aligns with the dynamic-radiative background where blocking highs in the mid- and high latitudes are more likely to form and persist, resulting in near-surface subsidence warming and the enhancement of net radiation [37]. Perkins et al. (2013), Erlat et al. (2021), and Oliveira et al. (2022) all pointed out that the overall HWM remained stable in regions such as Australia, Europe, and Turkey, with no significant long-term changes [34,38,39]. Correspondingly, this study has observed in the “Belt and Road” region that the number of days with temperatures exceeding the heatwave threshold has significantly increased over the past few decades, leading to heatwave events being more frequent and lasting longer on the whole. However, most of these newly added hot days are in the temperature range close to the threshold. Moreover, the upper limit constraints of the energy in the mid-high latitudes and the boundary layer result in limited changes in the HWM. Eventually, this presents more and longer rather than stronger interannual evolution characteristics. Recent studies indicate that land heatwaves may propagate or stall along preferred pathways modulated by Rossby wave activity, suggesting that heatwave risks exhibit significant spatial connectivity and predictability [40]. Unlike previous studies that focus on the propagation dynamics of individual or phased heatwave events, this study, based on a 60-year long-term dataset, further reveals the spatial reconfiguration process in which high-value zones of HWF, HWD, and HWN across the Belt and Road region have expanded from scattered distributions into continuous high-risk belts. This indicates that heatwave risk manifests not only through event-scale spread but also through the stabilization of long-term high-risk patterns.
The spatial clustering and evolution characteristics of urbanization in East Asia and other rapidly urbanizing regions indicate that the structural intensification of heatwaves is not only reflected in the increase in values but also in the contiguous expansion of high-risk zones and their adhesion to existing urban development axes [41]. This study indicates that over the past 60 years, the coverage area of heatwave events has been continuously expanding, and the spatial pattern of heatwave indicators (HWF, HWD, HWN) has gradually evolved from scattered high-value areas to continuous high-value belts. Consistent with this trend, relevant studies have found that the coverage area of heatwave events on land worldwide has increased from 1979 to 2020,moreover, during 1980–2019, many regions around the world experienced more extensive and continuous heatwave events that exceeded their climatological temperature thresholds [42].
4.2. Multi-Factor Coupling Drive and the Phased Replacement of Major Driving Factors
In recent years, the interaction between SSR and NDVI has become the primary influencing factor for most indicators, with its contribution rate to the influence on each indicator remaining at a relatively high level. Furthermore, numerous long-term global-scale studies have further emphasized the dominant role of land-atmosphere coupling and circulation-water vapor processes in controlling heatwaves [43,44]. This is because a longer time period can smooth out interannual anomalies and short-term disturbances, capturing the stable influence of decadal changes and circulation background on heatwaves. A larger spatial scale can weaken the particularity of individual regions and enhance the applicability of the conclusion in different areas, thereby more clearly presenting the role of land-atmosphere coupling and circulation-water vapor.
The main single driving factor gradually transitioned from the early SPEI and WS to the later SSR and NDVI. Early soil moisture limitation leads to the conversion of latent heat to sensible heat and triggers a positive land–atmosphere feedback, making heatwaves more likely to be triggered and sustained [45]. Meanwhile, the wind speed near the ground decreases, reducing ventilation and the supply of cold air, and prolonging the duration of high temperatures [46]. Therefore, in the early stage, SPEI and WS were the main single driving factors. Over the past decade, a significant reduction in aerosols and changes in cloud cover across Europe have jointly led to an increase in surface shortwave radiation. The increased energy input to the surface during the day has directly pushed up the upper limit of extreme temperatures [47]. For countries along the Belt and Road, changes in aerosols and cloud cover may also affect heatwave intensity by modulating surface shortwave radiation. Moreover, NDVI regulates peak temperature through evapotranspiration and energy distribution. When water is abundant, evapotranspiration cools the temperature; when it is limited, sensible heat increases, amplifying the intensity of extreme conditions [48]. Therefore, SSR and NDVI are the main single driving factors in the later stage.
4.3. The Spatial Distribution of Future Heatwaves
In the future, HWD and HWN will respectively exhibit a continuous upward trend along the northeastern coast of East Asia and the Russian Far East, and a high-frequency rising feature along the eastern coast of China. This overlaps to some extent with the high-increase regions such as Central Asia–West Asia and the Indian Peninsula in studies on population exposure and risk levels driven by General Circulation Model (GCM) scenarios, reflecting a consistent trend of more frequent and longer-lasting heatwaves in the future [28]. It is worth noting that Hurst analysis primarily relies on statistical inference based on historical sequence persistence, whereas GCM scenario projections depend more heavily on future emission scenarios and simulations of physical climate processes. This study only uses these related studies as references for spatial risk patterns, indicating that different methods show certain similarities in identifying some potentially high-risk areas.
Research indicates that Central Asia will experience significant warming in the future [49]. This study shows that Central Asia–West Asia is the most stable and continuously strengthening center. Some scenario studies identify the Indian Peninsula, the Indochinese Peninsula and the southern part of the Arabian Peninsula as the regions with the most significant increase in the future [50]. Such studies often measure heat risks by using actual human thermal sensation indicators that integrate the influence of humidity and the degree of population exposure. They are more sensitive to the nonlinear amplification of perceived heat caused by rising humidity. This study characterizes the long-term memory of frequency and persistence with the Hurst exponent, without magnifying humidity and population, and it further highlights the continuous intensification of the dry and hot type in Central Asia–West Asia under the land–atmosphere positive feedback.
Although this study has endeavored to integrate multiple data sources and methods as much as possible, there are still certain uncertainties and limitations: Different datasets vary in spatial resolution, data sources, and error characteristics, and data resampling and spatial registration may introduce certain uncertainties. The unified threshold definition of heatwaves may have adaptive deviations in different climate zones. The attribution model has not fully incorporated socio-economic factors such as urbanization and anthropogenic emissions. Due to issues like the computational power of GEE, natural factors such as surface soil moisture, which can also have significant impacts on heatwaves, have not been taken into account [51]. Furthermore, due to limitations in meteorological data resolution, small-scale heatwave processes in complex terrain areas may not be fully captured. Although all datasets were resampled to a uniform 5 km grid, this process does not increase the inherent spatial information contained in the original low-resolution products. Therefore, the resampled wind speed data should be regarded as a spatially consistent representation rather than a truly high-resolution meteorological field. Due to differences in the original spatial resolution among various driving factors, GLMM estimates of their contributions may involve some uncertainty. In particular, wind speed data with coarser original resolution might smooth out local wind fields and topographic ventilation variations, thereby affecting the quantification of their relative contributions. Future studies should incorporate higher-resolution meteorological datasets or downscaled wind field products to more accurately quantify the roles of atmospheric circulation and local ventilation conditions in heatwave formation. Additionally, since each pixel contains only 60 annual observations from 1964 to 2023, the sample length is relatively limited, and the climate system may be influenced by abrupt changes, non-stationary trends, and human-induced forcing. Therefore, Hurst results are more suitable as a reference for identifying potential future risk zones and prioritizing early warnings, rather than being interpreted as deterministic future predictions. Moreover, it is necessary to integrate multimodal data such as land use and land cover change (LUCC) and emission inventories to build a multi-source driving model for climate–ecology–society interactions. Meanwhile, incorporating soil moisture as a factor influencing heatwaves will enhance the precision of heatwave risk identification and dynamic early warning capabilities, while expanding research on vulnerable systems such as health and agriculture. Through high-resolution remote sensing and multi-scenario simulations, this approach provides scientific support for sustainable development in the Belt and Road regions.
5. Conclusions
Unlike previous regional studies on the Belt and Road Initiative, which have primarily focused on historical changes in heatwaves, exposure risks, or scenario simulations, this study, based on a long-term dataset from 1964 to 2023, integrates EHF-based heatwave identification, spatial centroid migration, GLMM attribution analysis, and the Hurst exponent to further reveal the evolution of heatwave patterns, the phased transition of driving factors, and future persistent high-risk areas. The results show that heatwave events in the study area are becoming increasingly frequent and prolonged. Over the past 60 years, the spatial centers of gravity of various heatwave characteristic indicators have all shown a migration phenomenon. The four characteristic indicators generally show a trend of moving southward and westward. Among them, HWD and HWN first moved from north to south and then westward. The dominant single driving factor changed over time. In the early stage, SPEI and wind speed were the main factors, but recently, SSR and NDVI have taken over. The multi-factor interaction did not show a phased alternating pattern, indicating that the single driving factor in the heatwave driving mechanism has a certain time scale dependence. The Hurst index results indicate that Central Asia, the Iranian Plateau, northwest China, and northern South Asia will remain in a high-risk state for a long time (H > 0.6). Extreme intensity events in the southern part of Russia, the Mongolian Plateau and other high-latitude regions pose a long-term threat. These findings provide spatially explicit scientific support for improving heat-health action plans and the “graded early warning–medical response–public communication” mechanism in BRI countries, thereby promoting more targeted heatwave risk prevention and climate adaptation.
Author Contributions
Conceptualization, T.Y.; methodology, J.H. and Y.L.; software, Y.W.; validation, Q.Y.; formal analysis, W.Z.; investigation, J.H.; resources, D.Z.; data curation, J.H., D.Z., Q.Y., Y.L. and Y.W.; writing—original draft preparation, X.W.; writing—review and editing, T.Y. and W.Z.; visualization, X.W.; supervision, Q.Y. and Y.W.; project administration, D.Z.; funding acquisition, T.Y., W.Z. and J.H. All authors have read and agreed to the published version of the manuscript.
Funding
This research was funded by the National Natural Science Foundation of China (Grant No. 42401240) and the Natural Science Foundation of Shandong Province (Grant Nos. ZR2023QD030, ZR2023QD017, and ZR2025MS618).
Institutional Review Board Statement
Not applicable.
Informed Consent Statement
Not applicable.
Data Availability Statement
All the data used in this study are publicly available: climate data are from NASA NEX-DCP30 (1950–2099, 1 km), see doi:10.1002/2013EO370002; shortwave radiation data are from ERA5-Land (1950–2025, approximately 11 km), see doi:10.24381/cds.68d2bb30; vegetation index data are from MODIS MOD13A1 V6.1 (2000–2025, 500 m), see https://doi.org/10.5067/MODIS/MOD13A1.061; wind speed data are from MERRA-2 (1980–2025, 70 km), source NASA/MERRA; the standardized precipitation evapotranspiration index (SPEI) is from SPEI base (1901–2023, 55 km), see doi:10.20350/digitalCSIC/15470. All the above data are open access and can be downloaded from the corresponding repositories and DOIs for scientific reproduction and verification. The code for this investigation was made freely accessible on GitHub at commit 576091b: https://github.com/zhouyunzhouyun/EHF-heatwave, accessed on 24 May 2026.
Conflicts of Interest
Authors Danhong Zhu was employed by China IPPR International Engineering Co., Ltd. All authors except Danhong Zhu were involved in this study without any commercial or financial relationships that could be perceived as potential conflicts of interest.
References
- Rogelj, J.; Rajamani, L. The pursuit of 1.5 °C endures as a legal and ethical imperative in a changing world. Science 2025, 389, 238–240. [Google Scholar] [PubMed]
- Gebrechorkos, S.H.; Sheffield, J.; Vicente-Serrano, S.M.; Funk, C.; Miralles, D.G.; Peng, J.; Dyer, E.; Talib, J.; Beck, H.E.; Singer, M.B.; et al. Warming accelerates global drought severity. Nature 2025, 642, 628–635. [Google Scholar] [CrossRef] [Scilit] [PubMed]
- Marcos, M.; Amores, A.; Agulles, M.; Robson, J.; Feng, X. Global warming drives a threefold increase in persistence and 1 °C rise in intensity of marine heatwaves. Proc. Natl. Acad. Sci. USA 2025, 122, e2413505122. [Google Scholar] [CrossRef] [Scilit] [PubMed]
- Quilcaille, Y.; Gudmundsson, L.; Schumacher, D.L.; Gasser, T.; Heede, R.; Heri, C.; Lejeune, Q.; Nath, S.; Naveau, P.; Thiery, W.; et al. Systematic attribution of heatwaves to the emissions of carbon majors. Nature 2025, 645, 392–398. [Google Scholar] [CrossRef] [Scilit] [PubMed]
- Perkins-Kirkpatrick, S.E.; Lewis, S.C. Increasing trends in regional heatwaves. Nat. Commun. 2020, 11, 3357. [Google Scholar] [CrossRef] [Scilit] [PubMed]
- Bastos, A.; Ciais, P.; Friedlingstein, P.; Sitch, S.; Pongratz, J.; Fan, L.; Wigneron, J.P.; Weber, U.; Reichstein, M.; Fu, Z.; et al. Direct and seasonal legacy effects of the 2018 heat wave and drought on European ecosystem productivity. Sci. Adv. 2020, 6, eaba2724. [Google Scholar] [CrossRef] [Scilit] [PubMed]
- Voosen, P. Glacial melt due to global warming is triggering earthquakes. Sci. Adv. 2025, 389. [Google Scholar] [CrossRef] [Scilit]
- Zhang, X.; Chen, F.; Chen, Z. Heatwave and mental health. J. Environ. Manag. 2023, 332, 117385. [Google Scholar] [CrossRef] [Scilit] [PubMed]
- Baylis, P. Temperature and Temperament: Evidence from a Billion Tweets. J. Public. Econ. 2020, 184, 104161. [Google Scholar]
- Burke, M.; González, F.; Baylis, P.; Heft-Neal, S.; Baysan, C.; Basu, S.; Hsiang, S. Higher temperatures increase suicide rates in the United States and Mexico. Nat. Clim. Change 2018, 8, 723–729. [Google Scholar] [CrossRef] [Scilit]
- Jackson, L.S.; Birch, C.E.; Chagnaud, G.; Marsham, J.H.; Taylor, C.M. Daily rainfall variability controls humid heatwaves in the global tropics and subtropics. Nat. Commun. 2025, 16, 3461. [Google Scholar] [CrossRef] [Scilit] [PubMed]
- Wang, F.; Zhang, J.; Ge, Q.; Hao, Z. Projected changes in risk of heat waves throughout Belt and Road Region in the 21st century. Chin. Sci. Bull. 2021, 66, 3045–3058. [Google Scholar] [CrossRef] [Scilit]
- You, N.; Till, J.; Lobell, D.B.; Zhu, P.; West, P.C.; Kong, H.; Li, W.; Sprenger, M.; Villoria, N.B.; Li, P. Climate-driven global cropland changes and consequent feedbacks. Nat. Geosci. 2025, 18, 639–645. [Google Scholar] [CrossRef] [Scilit]
- Abatzoglou, J.T.; Kolden, C.A.; Cullen, A.C.; Sadegh, M.; Williams, E.L.; Turco, M.; Jones, M.W. Climate change has increased the odds of extreme regional forest fire years globally. Nat. Commun. 2025, 16, 6390. [Google Scholar] [CrossRef] [Scilit] [PubMed]
- Zheng, D.; Yan, X.; Tong, D.; Davis, S.J.; Caldeira, K.; Lin, Y.; Guo, Y.; Li, J.; Wang, P.; Ping, L.; et al. Strategies for climate-resilient global wind and solar power systems. Nature 2025, 643, 1263–1270. [Google Scholar] [CrossRef] [Scilit] [PubMed]
- Cologna, V.; Meiler, S.; Kropf, C.M.; Luthi, S.; Mede, N.G.; Bresch, D.N.; Lecuona, O.; Berger, S.; Besley, J.; Brick, C.; et al. Extreme weather event attribution predicts climate policy support across the world. Nat. Clim. Change 2025, 15, 725–735. [Google Scholar] [CrossRef] [Scilit] [PubMed]
- Xiao, A.; Zhou, C. Characteristic Analysis of the Heat Wave Events over China Based on Excess Heat Factor. Meteorol. Mon. 2017, 43, 943–952. [Google Scholar]
- Feng, J.; Li, J.; Jin, F.F.; Zhao, S.; Li, J. Anthropogenic forcing drives equatorward migration of heatwave locations across continents. Nat. Commun. 2025, 16, 8197. [Google Scholar] [CrossRef] [Scilit] [PubMed]
- Wang, C.; Li, Z.; Chen, Y.; Li, Y.; Ouyang, L.; Zhu, J.; Sun, F.; Song, S.; Li, H. Changes in Global Heatwave Risk and Its Drivers Over One Century. Earth’s Future 2024, 12, e2024EF004430. [Google Scholar] [CrossRef] [Scilit]
- Wei, J.; Deng, C. Evolution of Global Heatwave Characteristics Based on the Excess Heat Factor. China Rural. Water Hydropower 2024, 145–149. [Google Scholar]
- Wei, C.; Wan, Y.; Huang, G.; Zhou, L.; Chang, Y. Spatial and temporal characteristics and population exposure of heat waves in China’s Coastal Regions. Remote Sens. Technol. Appl. 2024, 3, 679–689. [Google Scholar]
- Gu, X.; Jiang, Z.; Guan, Y.; Luo, M.; Li, J.; Wang, L.; Zhang, X.; Kong, D.; Wang, L. Frequent land-ocean transboundary migration of tropical heatwaves under climate change. Nat. Commun. 2025, 16, 3400. [Google Scholar] [CrossRef] [Scilit] [PubMed]
- Zhang, K.; Zuo, Z.; Mei, W.; Zhang, R.; Dai, A. A westward shift of heatwave hotspots caused by warming-enhanced land–air coupling. Nat. Clim. Change 2025, 15, 546–553. [Google Scholar]
- Liang, L.; Yu, L.; Wang, Z. Identifying the dominant impact factors and their contributions to heatwave events over mainland China. Sci. Total Environ. 2022, 848, 157527. [Google Scholar] [CrossRef] [Scilit] [PubMed]
- Ward, K.; Lauf, S.; Kleinschmit, B.; Endlicher, W. Heat waves and urban heat islands in Europe: A review of relevant drivers. Sci. Total Environ. 2016, 569–570, 527–539. [Google Scholar] [CrossRef] [Scilit] [PubMed]
- Suarez-Gutierrez, L.; Müller, W.A.; Li, C.; Marotzke, J. Dynamical and thermodynamical drivers of variability in European summer heat extremes. Clim. Dyn. 2020, 54, 4351–4366. [Google Scholar] [CrossRef] [Scilit]
- Kumar, R.; Kuttippurath, J.; Gopikrishnan, G.S.; Kumar, P.; Varikoden, H. Enhanced surface temperature over India during 1980–2020 and future projections: Causal links of the drivers and trends. npj Clim. Atmos. Sci. 2023, 6, 164. [Google Scholar] [CrossRef] [Scilit]
- Fang, P.; Wang, T.; Yang, D.; Tang, L.; Yang, Y. Substantial increases in compound climate extremes and associated socio-economic exposure across China under future climate change. npj Clim. Atmos. Sci. 2025, 8, 17. [Google Scholar] [CrossRef] [Scilit]
- Muñoz Sabater, J. ERA5-Land Monthly Averaged Data from 1950 to Present. 2019. Available online: https://cds.climate.copernicus.eu/datasets/reanalysis-era5-land-monthly-means?tab=overview (accessed on 24 May 2026).
- Didan, K. MODIS/Terra Vegetation Indices 16-Day L3 Global 500 m SIN Grid V061. 2021. Available online: https://www.earthdata.nasa.gov/data/catalog/lpcloud-mod13a1-061 (accessed on 24 May 2026).
- MERRA-2 M2T1NXFLX: Surface Flux Diagnostics V5.12.4. 2015. Available online: https://disc.gsfc.nasa.gov/datasets/M2T1NXFLX_5.12.4/summary (accessed on 24 May 2026).
- Beguería, S.; Vicente Serrano, S.M.; Reig-Gracia, F.; Latorre Garcés, B. SPEIbase v.2.9. 2023. Available online: https://digital.csic.es/handle/10261/332007 (accessed on 24 May 2026).
- Huang, Z.; Chen, H.; Tian, H. Research on the Heat Wave Index. Meteorol. Mon. 2011, 37, 345–351. [Google Scholar]
- Oliveira, A.; Lopes, A.; Soares, A. Excess Heat Factor climatology, trends, and exposure across European Functional Urban Areas. Weather Clim. Extrem. 2022, 36, 100455. [Google Scholar] [CrossRef] [Scilit]
- Nairn, J.R.; Fawcett, R.J. The excess heat factor: A metric for heatwave intensity and its use in classifying heatwave severity. Int. J. Environ. Res. Public. Health 2014, 12, 227–253. [Google Scholar] [CrossRef] [Scilit] [PubMed]
- Geirinhas, J.L.; Russo, A.; Libonati, R.; Sousa, P.M.; Miralles, D.G.; Trigo, R.M. Recent increasing frequency of compound summer drought and heatwaves in Southeast Brazil. Environ. Res. Lett. 2021, 16, 034036. [Google Scholar] [CrossRef] [Scilit]
- Chapman, S.C.; Watkins, N.W.; Stainforth, D.A. Warming Trends in Summer Heatwaves. Geophys. Res. Lett. 2019, 46, 1634–1640. [Google Scholar] [CrossRef] [Scilit]
- Alexander, L.V.; Perkins, S.E. On the Measurement of Heat Waves. J. Clim. 2013, 26, 4500–4517. [Google Scholar] [CrossRef] [Scilit]
- Erlat, E.; Türkeş, M.; Aydin-Kandemir, F. Observed changes and trends in heatwave characteristics in Turkey since 1950. Theor. Appl. Climatol. 2021, 145, 137–157. [Google Scholar] [CrossRef] [Scilit]
- Wang, M.; Huang, Y.; Franzke, C.L.E.; Yuan, N.; Fu, Z.; Boers, N. Evidence for preferred propagating terrestrial heatwave pathways due to Rossby wave activity. Nat. Commun. 2025, 16, 4742. [Google Scholar] [CrossRef] [Scilit] [PubMed]
- Jeong, S.; Kang, H.; Cho, M.; Lim, U. Heatwaves at work: Typology and spatial distributions of occupations exposed to heatwaves in Korea. Sustain. Cities Soc. 2024, 116, 17. [Google Scholar] [CrossRef] [Scilit]
- Skinner, C.B.; Touma, D.; Barlow, M.; Singh, D.; King, T. The spatial extent of heat waves has changed over the past four decades. Commun. Earth Environ. 2025, 6, 662. [Google Scholar] [CrossRef] [Scilit]
- Adeyeri, O.E.; Zhou, W.; Ndehedehe, C.E.; Ishola, K.A.; Laux, P.; Akinsanola, A.A.; Dieng, M.D.B.; Wang, X. Global Heatwaves Dynamics Under Climate Change Scenarios: Multidimensional Drivers and Cascading Impacts. Earth’s Future 2025, 13, e2025EF006486. [Google Scholar] [CrossRef] [Scilit]
- Qiao, L.; Zuo, Z.; Zhang, R.; Piao, S.; Xiao, D.; Zhang, K. Soil moisture–Atmosphere coupling accelerates global warming. Nat. Commun. 2023, 14, 4908. [Google Scholar] [CrossRef] [Scilit] [PubMed]
- Li, J.; Zhang, Y.; Bevacqua, E.; Zscheischler, J.; Keenan, T.F.; Lian, X.; Zhou, S.; Zhang, H.; He, M.; Piao, S. Future increase in compound soil drought-heat extremes exacerbated by vegetation greening. Nat. Commun. 2024, 15, 10875. [Google Scholar] [CrossRef] [Scilit] [PubMed]
- Lopez, H.; Lee, S.-K.; West, R.; Kim, D.; Jia, L. The longest-lasting 2023 western North American heat wave was fueled by the record-warm Atlantic Ocean. Nat. Commun. 2025, 16, 6544. [Google Scholar] [CrossRef] [Scilit] [PubMed]
- Schumacher, D.L.; Singh, J.; Hauser, M.; Fischer, E.M.; Wild, M.; Seneviratne, S.I. Exacerbated summer European warming not captured by climate models neglecting long-term aerosol changes. Commun. Earth Environ. 2024, 5, 182. [Google Scholar] [CrossRef] [Scilit]
- Yan, W.; Zhou, J.; Wang, X.; Luo, J.; Yang, F.; Wu, R. Vegetation resistance to compound drought and heatwave events buffers the spatial shift velocities of vegetation vulnerability. Commun. Earth Environ. 2025, 6, 320. [Google Scholar] [CrossRef] [Scilit]
- Hua, L.; Zhao, T.; Zhong, L. Future changes in drought over Central Asia under CMIP6 forcing scenarios. J. Hydrol. Reg. Stud. 2022, 43, 101191. [Google Scholar] [CrossRef] [Scilit]
- Wang, Y.; Zhao, N.; Yin, X.; Wu, C.; Chen, M.; Jiao, Y.; Yue, T. Global future population exposure to heatwaves. Environ. Int. 2023, 178, 108049. [Google Scholar] [CrossRef] [Scilit] [PubMed]
- Zhou, J.; Teuling, A.J.; Seneviratne, S.I.; Hirsch, A.L. Soil Moisture—Temperature Coupling Increases Population Exposure to Future Heatwaves. Earth’s Future 2024, 12, e2024EF004697. [Google Scholar] [CrossRef] [Scilit]

Disclaimer/Publisher’s Note: The statements, opinions and data contained in all publications are solely those of the individual author(s) and contributor(s) and not of MDPI and/or the editor(s). MDPI and/or the editor(s) disclaim responsibility for any injury to people or property resulting from any ideas, methods, instructions or products referred to in the content. |
© 2026 by the authors. Licensee MDPI, Basel, Switzerland. This article is an open access article distributed under the terms and conditions of the Creative Commons Attribution (CC BY) license.